1. Introduction
Accurate building performance simulation plays a pivotal role in the design, optimization, and operation of energy-efficient, comfortable, and sustainable buildings. Through these simulations, architects, engineers, and building owners can gain critical insights into a building’s energy consumption, thermal behavior, indoor air quality, and overall environmental impact [
1]. This information is essential for making informed design decisions, optimizing building systems for maximum efficiency, ensuring occupant comfort and health, and achieving sustainability goals. Furthermore, with increasing emphasis on energy codes, green building certifications, and net-zero energy targets, the need for reliable and comprehensive building performance simulation tools has become more pronounced than ever [
2,
3].
However, traditional building performance simulation tools often face limitations when dealing with the complex, multi-domain nature of modern buildings. Contemporary building designs increasingly incorporate integrated renewable energy systems, advanced building automation and control strategies [
4], and sophisticated heating, ventilation, and air-conditioning (HVAC) technologies [
5,
6,
7,
8]. These systems involve intricate interactions across different physical domains, including thermal (heat transfer), electrical (power generation and consumption), mechanical (motion and forces), and fluid (air and water flow) dynamics. Many conventional simulation tools are not inherently designed to handle these cross-domain couplings seamlessly, often requiring complex interfaces or separate simulations for different aspects of building performance.
In response to these challenges, the bond graph formalism, among others, has emerged as a powerful and versatile approach for modeling dynamic physical systems. Originating in engineering disciplines, the bond graph technique offers a unified framework for representing energy flow and transformations across diverse physical domains using a consistent graphical language and a set of fundamental principles. This energy-based approach provides a holistic perspective on system behavior, making it particularly well-suited for analyzing the integrated performance of complex building systems [
9,
10,
11,
12,
13].
The application of bond graph methodology to model the thermal behavior of buildings has been explored in numerous studies [
14,
15,
16,
17]. Researchers have successfully utilized bond graphs to simulate transient heat conduction through fundamental building envelope components such as walls, roofs, and slabs [
17]. These models have been validated by comparing their predictions with analytical solutions derived from heat transfer equations and experimental data obtained from laboratory measurements or field studies, generally demonstrating a high degree of accuracy. Beyond individual components, bond graphs have been employed to develop comprehensive thermal models of both single-zone and multi-zone buildings. These whole-building models often utilize thermoelectric analogies, where thermal phenomena are represented using analogous electrical components like resistors and capacitors [
17]. The parameters of these models are typically identified and validated using experimental data collected from instrumented buildings, showcasing the methodology’s capability to capture the overall thermal dynamics of complex building structures. Furthermore, the performance of bond-graph-based building thermal models has been compared with that of established building simulation software tools like TRNSYS, with the results indicating good agreement, thereby reinforcing the credibility of bond graph methodology in this domain [
18]. While the results of this study demonstrate the effectiveness of bond graph modeling in simulating building thermal behavior, a more explicit comparison with established tools such as TRNSYS is essential to contextualize its advantages. TRNSYS is widely used for transient system simulation and offers a modular approach with predefined components for HVAC and renewable energy systems. However, it often requires separate modules or co-simulation techniques to handle multi-domain interactions, which can introduce complexity and reduce transparency in energy flow representation. In contrast, bond graph modeling provides a unified framework that inherently supports multi-physics coupling, enabling a more holistic and physically consistent representation of energy exchange across thermal, hydraulic, and control domains. Moreover, while TRNSYS excels in user accessibility and has a large component library, bond graphs offer greater flexibility for custom system modeling and control integration, particularly in research contexts where novel configurations or control strategies are explored. Casto et al. [
19] highlight the use of eco-bond graphs for sustainability analysis, emphasizing their ability to trace embodied energy flows—an aspect not natively supported in TRNSYS. This capability further underscores the potential of bond graphs to complement or even surpass traditional tools in specific applications [
18,
20].
Bond graph methodology has found significant application in the design and simulation of HVAC systems, encompassing the modeling of various components involved in heating, ventilation, and air-conditioning processes [
21]. Studies have focused on developing bond graph models for individual HVAC components such as heat exchangers, which facilitate thermal energy transfer between air or water streams, and integrating these component models into system-level representations of complete HVAC systems [
22]. These system models allow for the simulation of the dynamic behavior of HVAC systems under different operating conditions and in response to varying building loads and environmental factors. Moreover, bond graphs have proven to be a valuable tool for addressing operational aspects of HVAC systems, including fault detection and isolation [
22]. By creating a bond graph model of the HVAC system and comparing its simulated behavior with real-time operational data, deviations indicative of potential faults in components like sensors, actuators, or heat exchangers can be identified and diagnosed, contributing to improved system maintenance and energy efficiency [
23].
The integration of renewable energy sources into buildings, a key strategy for achieving energy-efficient and sustainable buildings, has been effectively addressed using bond graph modeling [
24]. Researchers have explored the application of bond graphs for modeling solar photovoltaic (PV) systems and their seamless integration with a building’s electrical network [
25]. This includes the development of bond graph models that accurately represent the energy generation characteristics of PV arrays as a function of solar irradiance and temperature, as well as their electrical behavior under varying load conditions. Furthermore, bond graphs have been utilized to model wind energy systems intended for building-integrated applications [
26]. This includes the creation of dynamic models for wind turbines that capture the conversion of wind energy into mechanical and then electrical energy, considering the performance characteristics of the rotor, generator, and power electronics involved. The bond graph framework also facilitates the analysis of energy management strategies for buildings equipped with hybrid renewable energy systems, where a combination of solar, wind, and potentially other renewable sources, along with energy storage systems, are coordinated to optimize energy supply and demand within the building [
27].
Ongoing research continues to explore the application of bond graph methodology in modeling and analyzing advanced energy systems that are relevant to the building sector. This includes the use of bond graphs for modeling integrated energy distillation columns, which aim to reduce significant energy consumption in industrial processes [
28]. Researchers are also employing bond graphs to model and simulate novel actuator technologies, such as hybrid piezo-flexural–hydraulic actuators, which could find applications in advanced building automation and control systems [
29]. Furthermore, bond graph modeling is being applied to the analysis of energy-harvesting wireless sensor networks, which are increasingly being deployed in smart buildings for monitoring environmental conditions and energy usage, providing valuable data for optimizing building energy performance [
27]. These applications in advanced energy systems highlight the versatility of bond graph methodology in tackling complex engineering problems related to energy generation, distribution, and consumption in the context of buildings.
Despite the growing body of research applying bond graph methodology to various aspects of building performance, a comprehensive and integrative analysis that bridges theoretical foundations, practical applications, and comparative evaluation with traditional simulation tools remains limited [
30,
31,
32].
Table 1 compares the bond graph approach with well-known established 0-D modeling formalisms for building performance simulation. The selection of comparison features in
Table 1 is grounded in the core requirements for evaluating building performance simulation tools in both research and practical applications. Modeling paradigm and multi-physics integration are fundamental to understanding how each tool conceptualizes and handles complex systems, especially in the context of coupled thermal, hydraulic, and control domains. Energy flow transparency and custom model flexibility are critical for researchers and engineers who need to trace energy interactions and adapt models to novel configurations. Control system integration is increasingly important in smart building applications, where dynamic regulation and feedback mechanisms are essential. Computational efficiency and ease of use reflect the practical trade-offs between model fidelity and usability, particularly for large-scale simulations. Validation and standardization ensure credibility and comparability of results, while real-time simulation and fault detection capabilities are vital for operational diagnostics and predictive maintenance. Finally, scalability and support for embodied energy or sustainability metrics address the growing demand for tools that can handle complex, large-scale systems and contribute to environmental performance assessments. Together, these features provide a comprehensive and balanced framework for evaluating the strengths and limitations of each simulation approach.
This study distinguishes itself by systematically synthesizing existing work while identifying critical gaps in current modeling practices. It introduces a unified framework that not only captures the multi-domain dynamics of building systems but also evaluates the scalability, interoperability, and real-time applicability of bond graph models in modern simulation environments. Furthermore, this research explores underrepresented domains such as energy-harvesting sensor networks and hybrid actuator technologies within the context of smart buildings—areas that have received minimal attention in the prior literature. By doing so, this study advances the state of the art and lays the groundwork for future development of holistic, energy-aware, and adaptive building simulation platforms.
This study aims to provide a comprehensive analysis of the bond graph methodology in the context of building performance simulation. It will explore the core principles underpinning this approach, examine its applications in modeling various aspects of building performance, analyze its advantages and disadvantages in comparison to traditional methods, survey the software tools available for its implementation, investigate recent advancements in the field, and discuss its potential role in addressing contemporary challenges such as urban heat island effects.
2. Bond Graph Methodology
2.1. Concept
The Bond Graph methodology is founded on the concept of energy domains, which represent the different forms in which energy can exist and interact within a physical system [
10]. In the context of building performance, relevant energy domains include the thermal domain (energy as heat), the electrical domain (energy as electric potential and current), the mechanical domain (energy as force and motion), and the hydraulic or pneumatic domain (energy as pressure and flow of fluids or gases) [
10,
11,
12,
13]. Physical systems are viewed as interconnected networks of components that exchange energy through these domains.
The fundamental principle of energy exchange in bond graphs is captured by the concept of power variables: effort and flow [
11]. Power, which is the rate of energy transfer, is defined as the product of effort and flow. The specific effort and flow variables depend on the energy domain being considered. For example, in the thermal domain, temperature is the effort variable, and entropy flow or heat flow is the flow variable. In the electrical domain, voltage is the effort, and current is the flow. In the mechanical domain (translation), force is the effort, and velocity is the flow. In the hydraulic domain, pressure is the effort, and volume flow rate is the flow.
Building systems and their components are modeled using a set of basic bond graph elements, each representing an idealized physical process. These elements include the following [
33]:
Sources: Effort sources (SE) represent ideal sources that maintain a constant effort (e.g., a constant temperature source or a constant voltage source), while flow sources (SF) represent ideal sources that maintain a constant flow (e.g., a constant heat flow or a constant airflow rate).
Storage elements: Capacitors (C) represent elements that store energy in a potential form (e.g., thermal mass storing heat or electrical capacitance storing charge), and inductors (I) represent elements that store energy in a kinetic form (e.g., inertia storing mechanical energy).
Dissipative element: Resistors (R) represent elements that dissipate energy (e.g., thermal resistance to heat flow, electrical resistance to current flow, or damping in mechanical systems).
Transformers (TF) and gyrators (GY): These two-port elements represent the transduction or conversion of energy between different forms or domains. Transformers maintain the product of effort and flow (power) while scaling the effort and flow variables (e.g., a mechanical lever converting force and displacement). Gyrators also conserve power but relate effort on one port to flow on the other and vice versa (e.g., an electromechanical motor converting electrical energy to mechanical motion).
Junctions: These elements represent points of interconnection between different components. A 0-junction (common effort junction) indicates that all connected bonds share the same effort variable, and the flows sum to zero (Kirchhoff’s current law analogy). A 1-junction (common flow junction) indicates that all connected bonds share the same flow variable, and the efforts sum to zero (Kirchhoff’s voltage law analogy).
The exchange of energy between these elements is represented by power bonds, which are directed lines with a half-arrow indicating the positive direction of energy flow. Each bond carries the effort and flow variables associated with the power exchange. An important concept in bond graphs is causality, which defines the cause-and-effect relationship between the effort and flow variables for each element. Causality is indicated by a causal stroke, a short perpendicular line placed at one end of the bond, specifying whether the effort or flow is the input to that element. Proper assignment of causality is crucial for deriving the mathematical model from the bond graph.
Creating a bond graph model of a building generally involves a systematic process of decomposing the complex building system into smaller, more manageable subsystems and individual components. This decomposition allows for a modular approach where each part of the building, such as walls, windows, HVAC units, and even occupants, can be represented by a specific set of interconnected bond graph elements. The next step involves identifying all the relevant energy interactions between these components. For instance, heat flows through walls, air is exchanged between zones, and electrical power is consumed by lighting and equipment. Each of these interactions is then represented by a power bond connecting the corresponding bond graph elements.
Each identified building component is modeled using the appropriate basic bond graph elements that capture its physical behavior. A wall, for example, might be represented by a combination of resistive elements for thermal resistance and capacitive elements for thermal storage. An HVAC fan could be modeled as a flow source in the fluid domain coupled with an effort source in the electrical domain through a transformer representing the motor. These individual element representations are then interconnected using bonds and junctions according to the building’s physical topology and the pathways of energy exchange. Finally, causality is assigned to each bond in the system, which is a critical step in preparing the model for simulation and analysis [
34].
A significant strength of the bond graph methodology is its ability to model the dynamic behavior of building systems and capture transient phenomena. Unlike steady-state analysis, which provides a snapshot of system performance under a particular condition, bond graphs can simulate how energy flows and variables change over time in response to varying inputs such as weather patterns, occupancy schedules, and control system actions [
23]. This dynamic modeling capability is essential for accurately predicting building energy consumption, thermal comfort levels, and the performance of control strategies under real-world operating conditions.
Furthermore, the hierarchical and modular nature of bond graph modeling makes it well-suited for handling the complexity of modern building systems. Complex building models can be constructed by interconnecting simpler, reusable bond graph sub-models. For example, a multi-zone building can be represented by creating individual bond graph models for each thermal zone and then connecting them through bonds representing heat transfer and airflow between the zones. This modularity not only simplifies the modeling process but also promotes model reuse and facilitates the analysis of large and intricate building systems.
2.2. Modeling of the Building Envelope
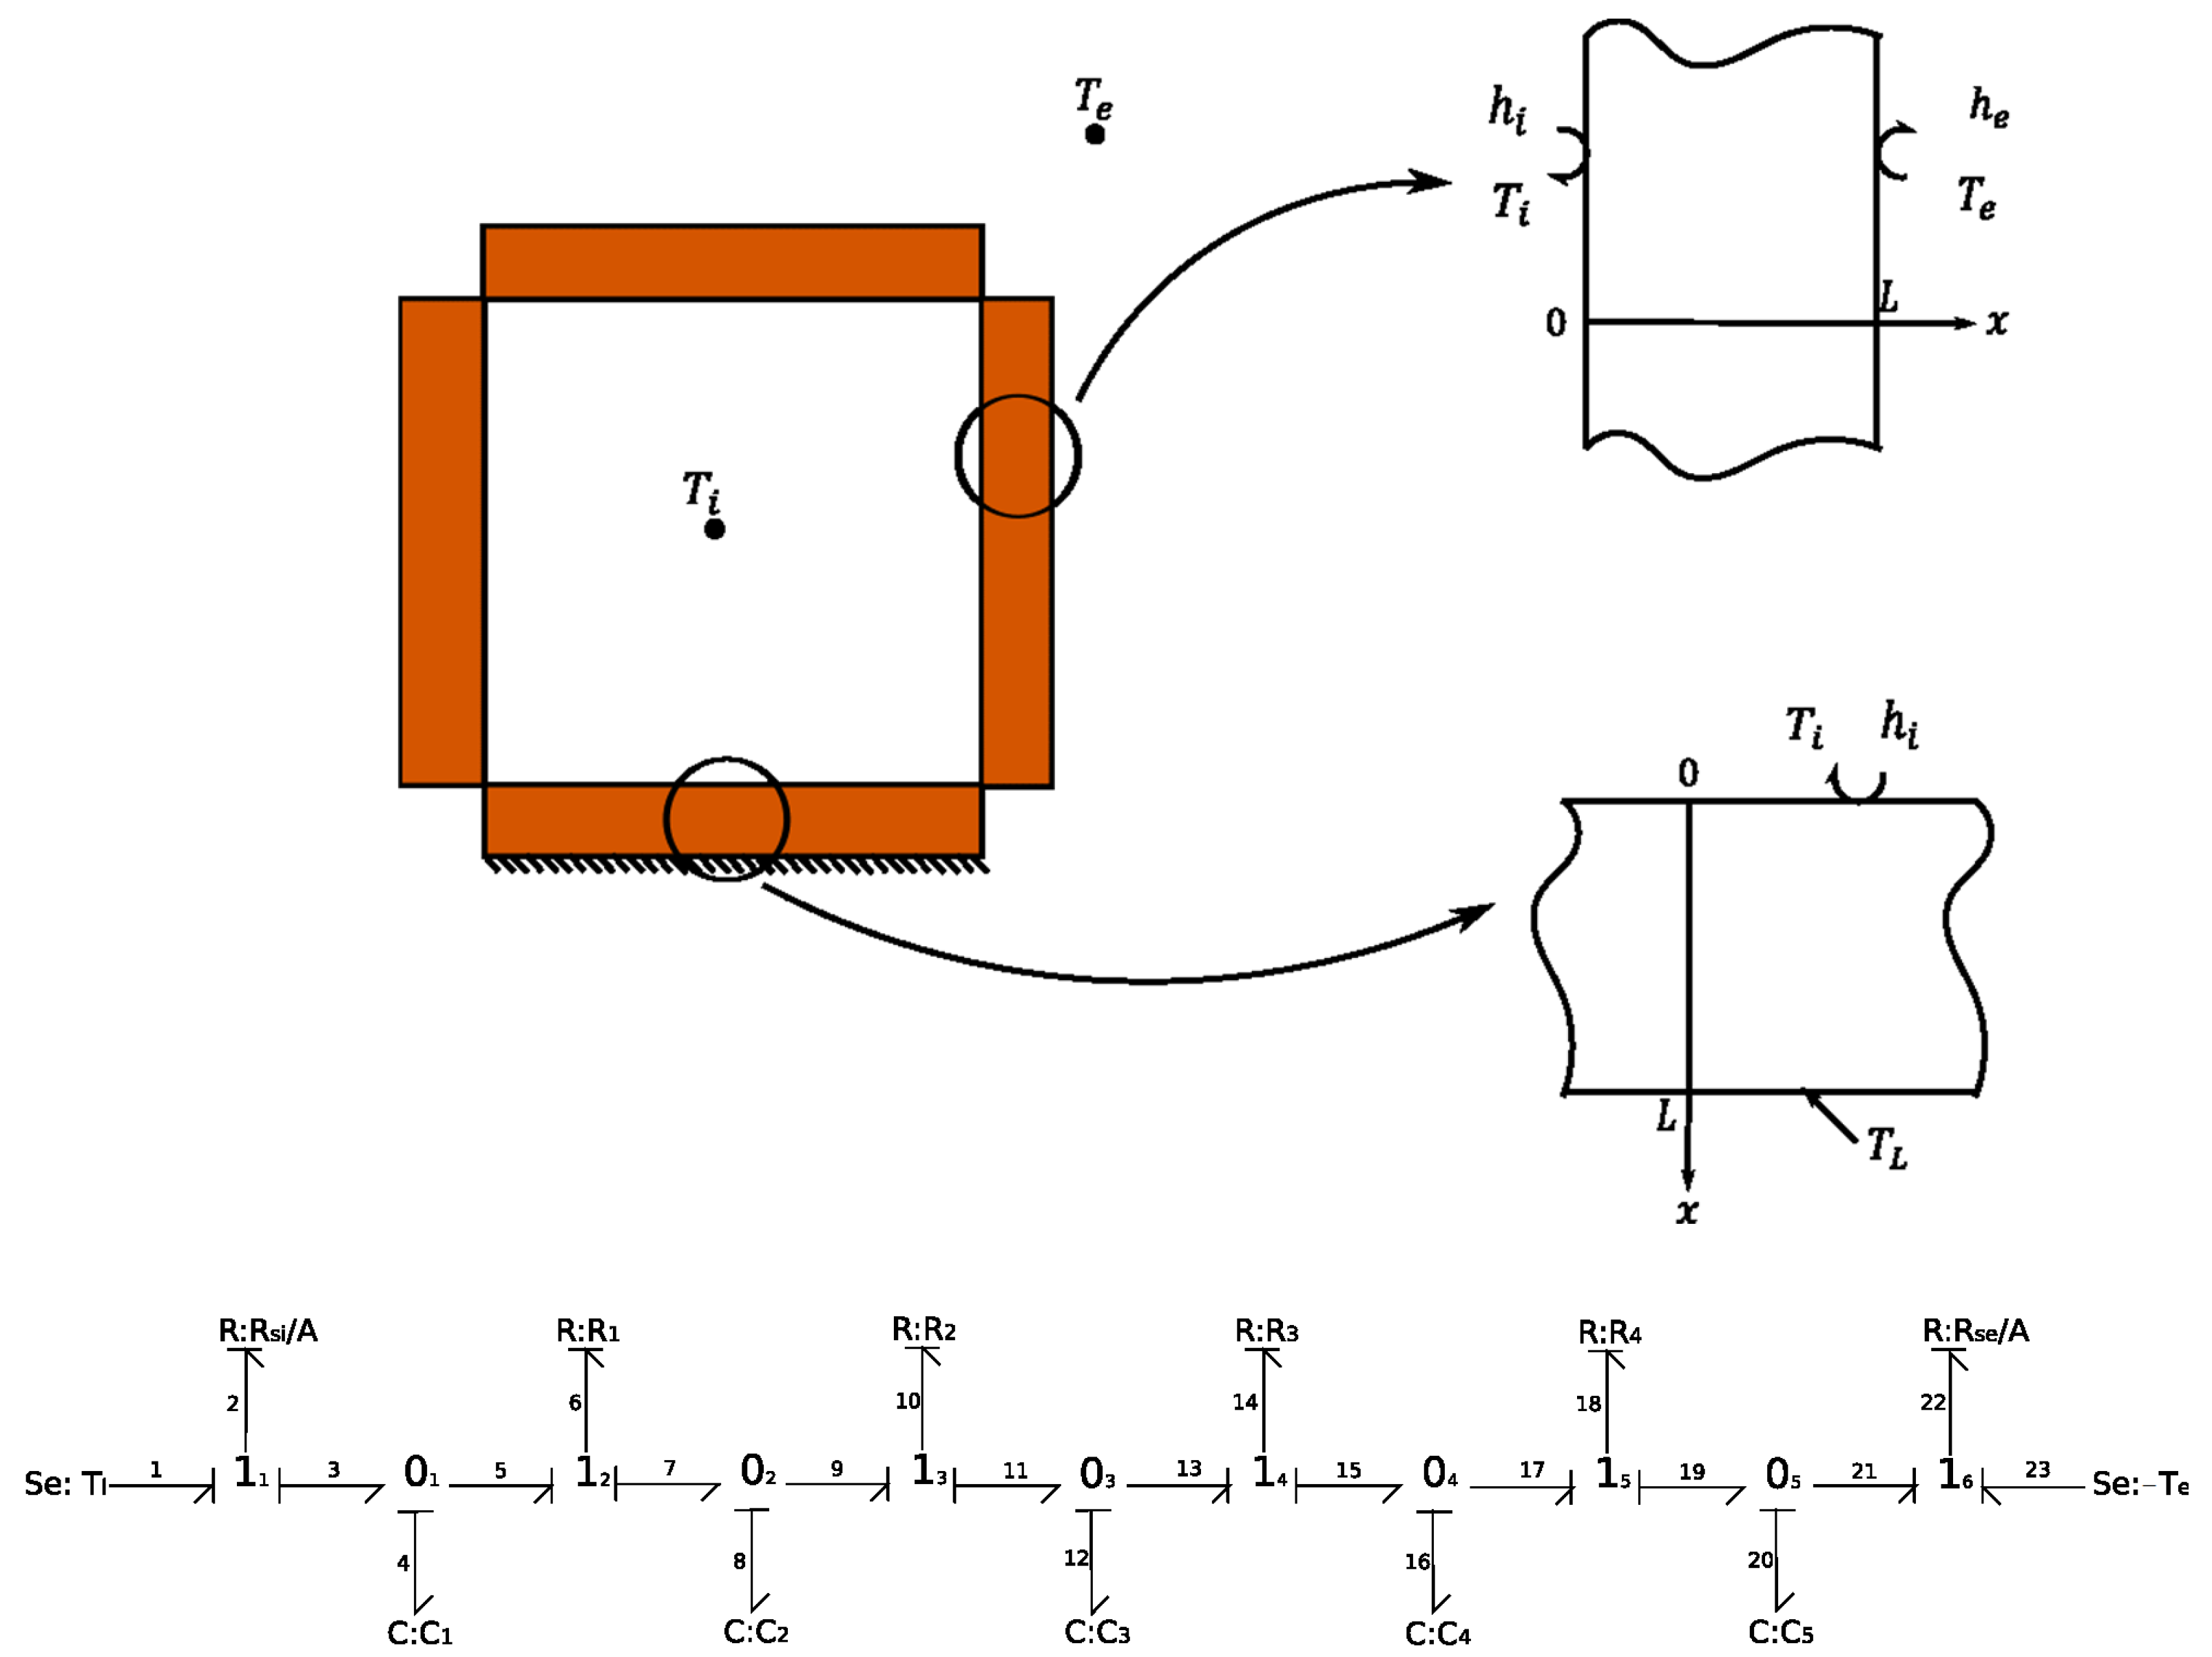
The aim is to model the element forming the envelope of each thermal zone with a minimum number of input parameters. The basic sub-model is therefore the wall, which is subject to transient and one-dimensional heat transfer between indoor and outdoor environments. In terms of boundary conditions, two types of walls that essentially constitute the envelope of a simple building can be considered. The first case is a wall with Fourier conditions on both sides. The second case is a slab with Fourier conditions on the inside and Dirichlet conditions imposed on the outside [
19] (
Figure 1).
In the first step, the wall is divided into layers. The temperature and thermophysical properties are considered homogeneous. Each layer is assigned a thermal resistance with an average conductivity R
i and an average thermal capacity
, which are calculated as follows:
where (n) is the number of layers.
The second step involves introducing the bond graph elements of our system. The indoor and outdoor temperatures are modeled as effort sources
and
. The boundary conditions are represented by two 1-junctions,
and
, which are connected to resistances
and
representing the thermal convection resistance on either side of the wall. Consequently, the following relationships are derived:
In the bond graph approach, effort and flow are inter-related by .
Thus, we can write the following:
with
and
.
Through the walls, the incoming and outgoing flows are represented by two 0-junctions:
. Thus, the following relationships can be established:
Similarly, the same conservation principle is applied in all the 0- and 1-junctions (from to ). This leads to a system of differential equations that are solved numerically. In this way, the temperature and heat flux can be determined for each layer of the studied wall.
In the case of a slab on grade, the same approach is used, except that the condition at x = is a prescribed temperature TL, and is thus considered equal to 0.
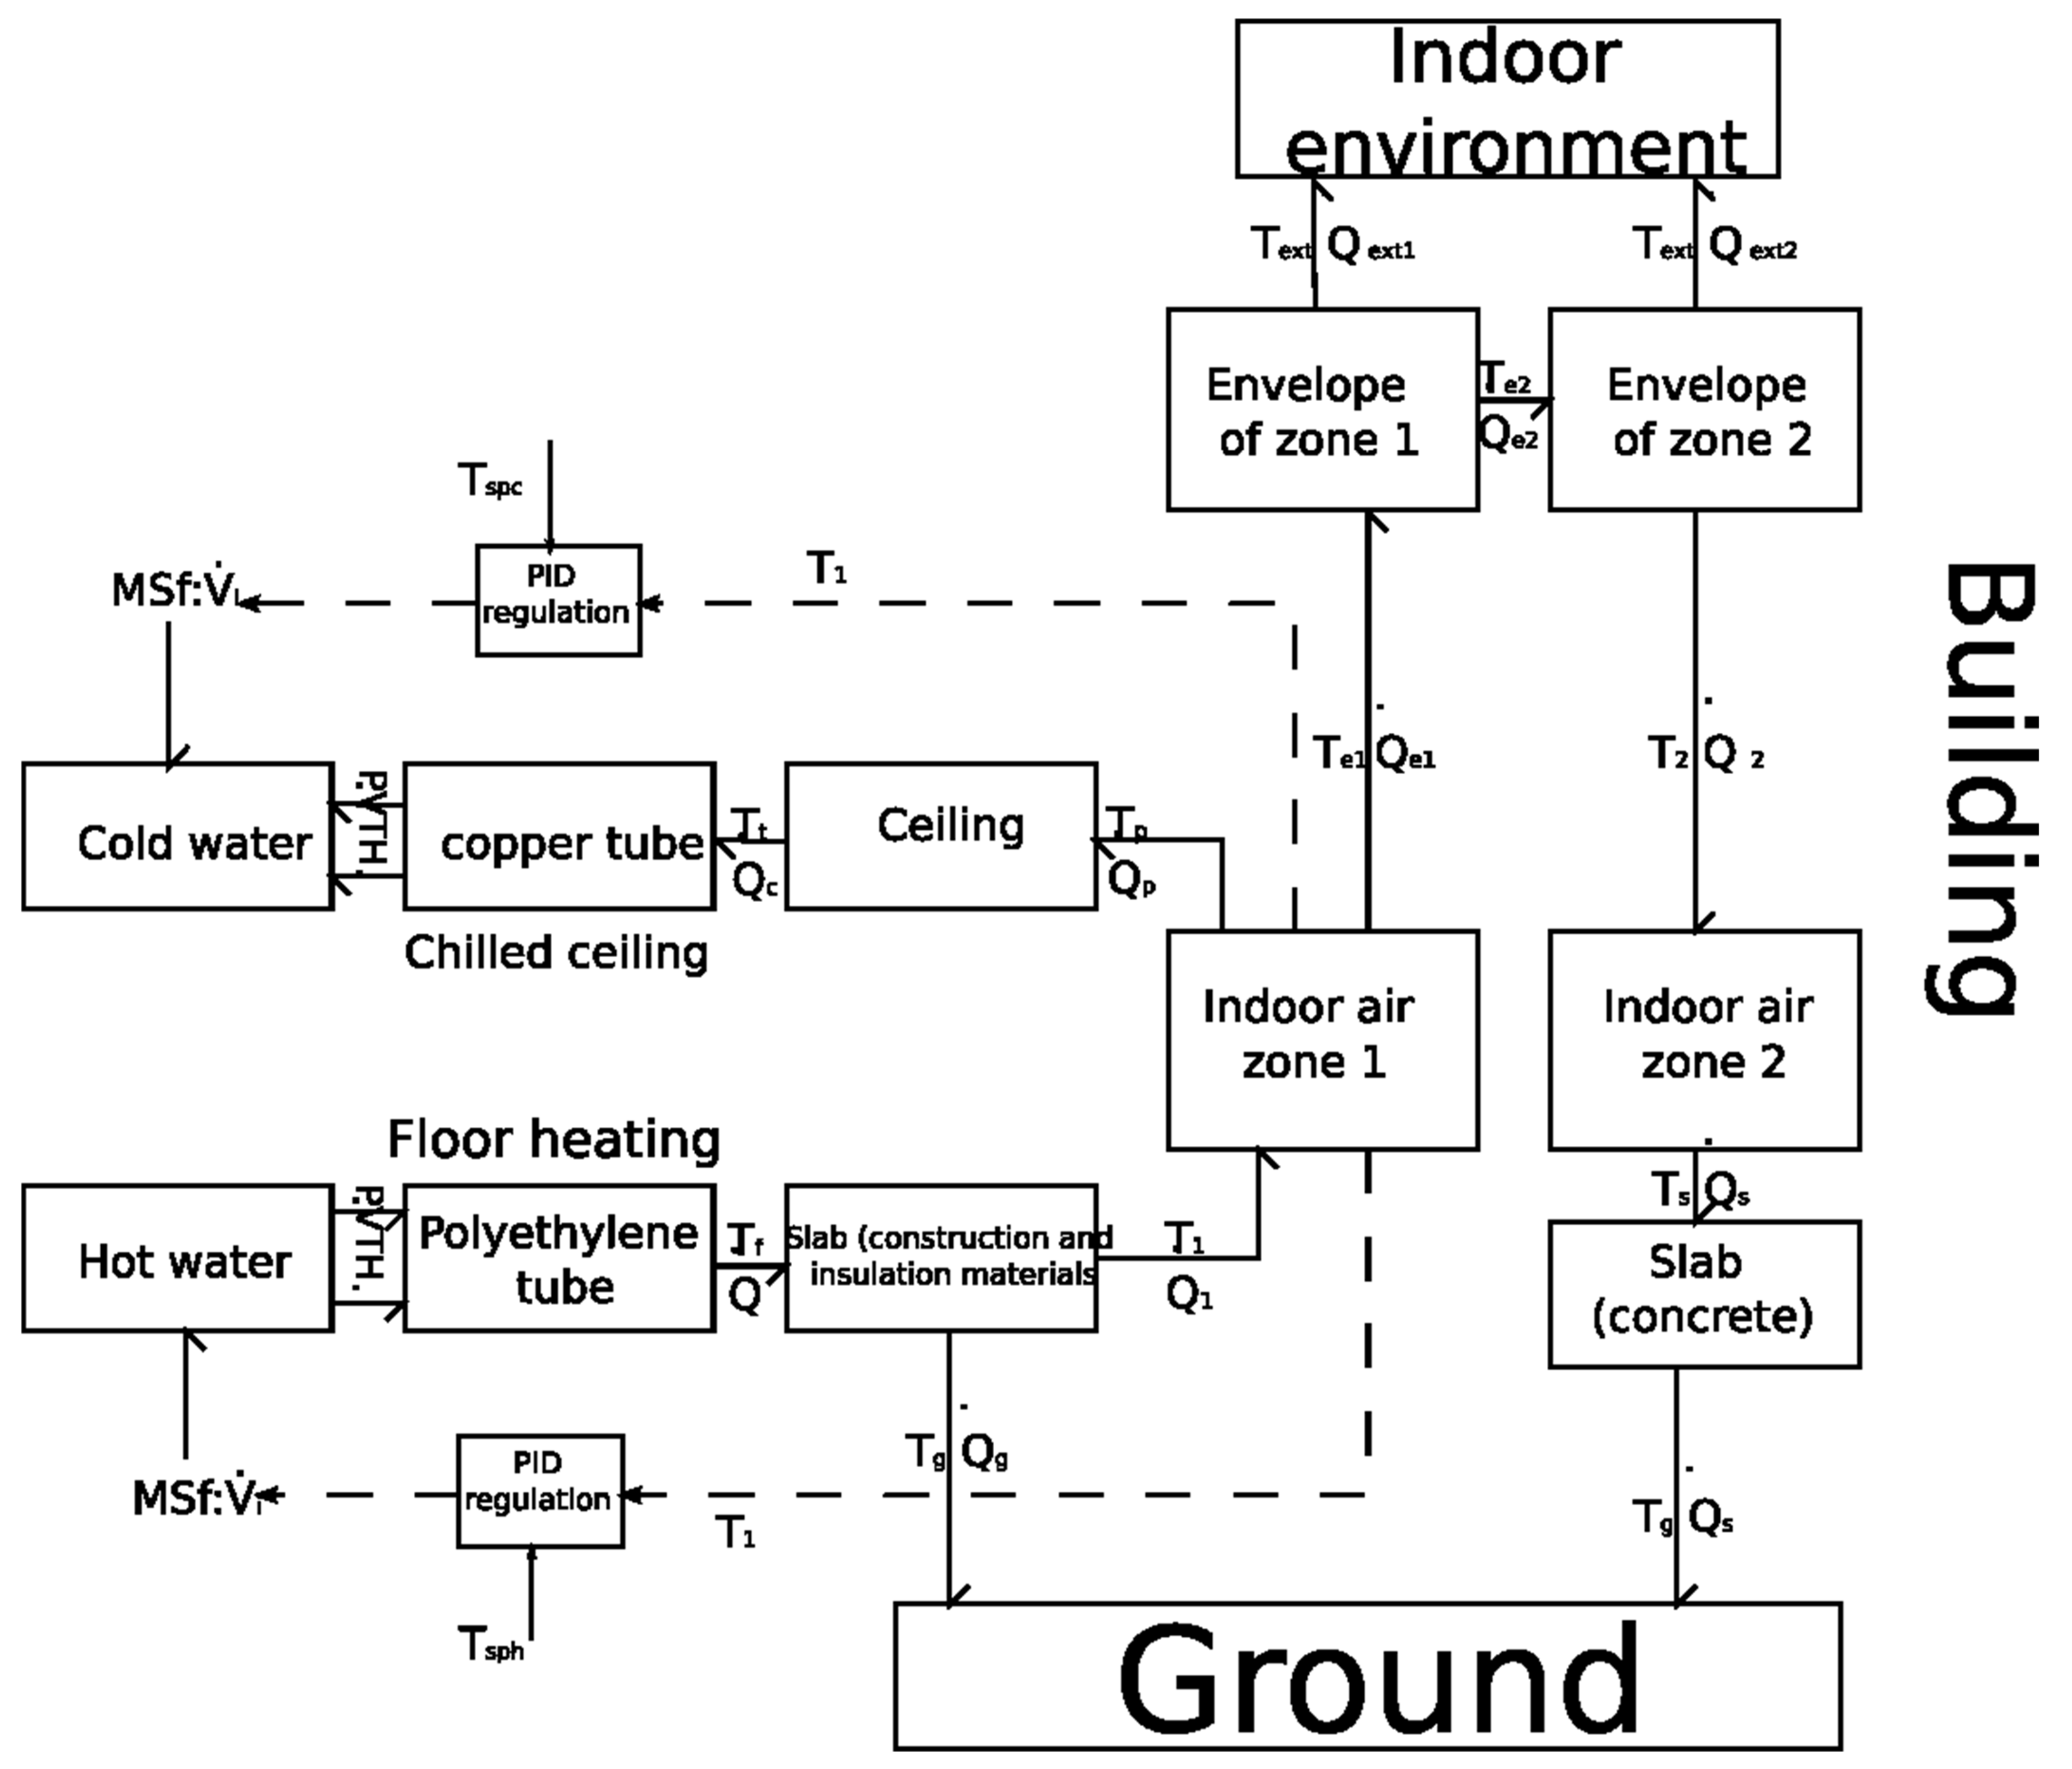
The bond graph sub-models representing the walls of the outer envelope, the roof, and the floor are then connected to a 0-junction with the temperature being the indoor temperature of zone 1. The same modeling procedure is applied to zone 2, which also includes the attic partitions. Additionally, the two neighboring zones are connected via the ceiling sub-model.
2.3. Modeling of Heating and Cooling Systems
Before detailing the modeling procedure, it is important to recall the main assumptions considered:
The fluid flow is one-dimensional.
The thermophysical properties of the fluid are homogeneous within a control volume. However, for conduits with significant lengths, these are divided into a finite number of control volumes, each having homogeneous properties.
The thermodynamic system is considered open, thus allowing heat and mass transfers.
In the fluid, heat transfers by conduction are neglected.
The fluid is incompressible.
The bond graph model represents the physical interaction between two types of energy: hydraulic energy, caused by the fluid circulating in the pipes, and thermal energy, resulting from variations in internal energy and particularly temperature [
35]. This interaction is represented by the thermo-hydraulic element
and the two-port resistive element
[
22].
In the case of an incompressible fluid, we chose two state variables: internal energy (U) and volume (V). These displacement variables correspond to, for thermal energy, temperature (T) and enthalpy flux H, and for hydraulic energy, pressure (P) and volumetric flow rate . The calculation of internal energy (U) is performed within element (C), which represents the energy stored by the fluid. Meanwhile, the multiport element (R) is used to calculate the enthalpy flux H. This element represents energy dissipation along the hydraulic circuit.
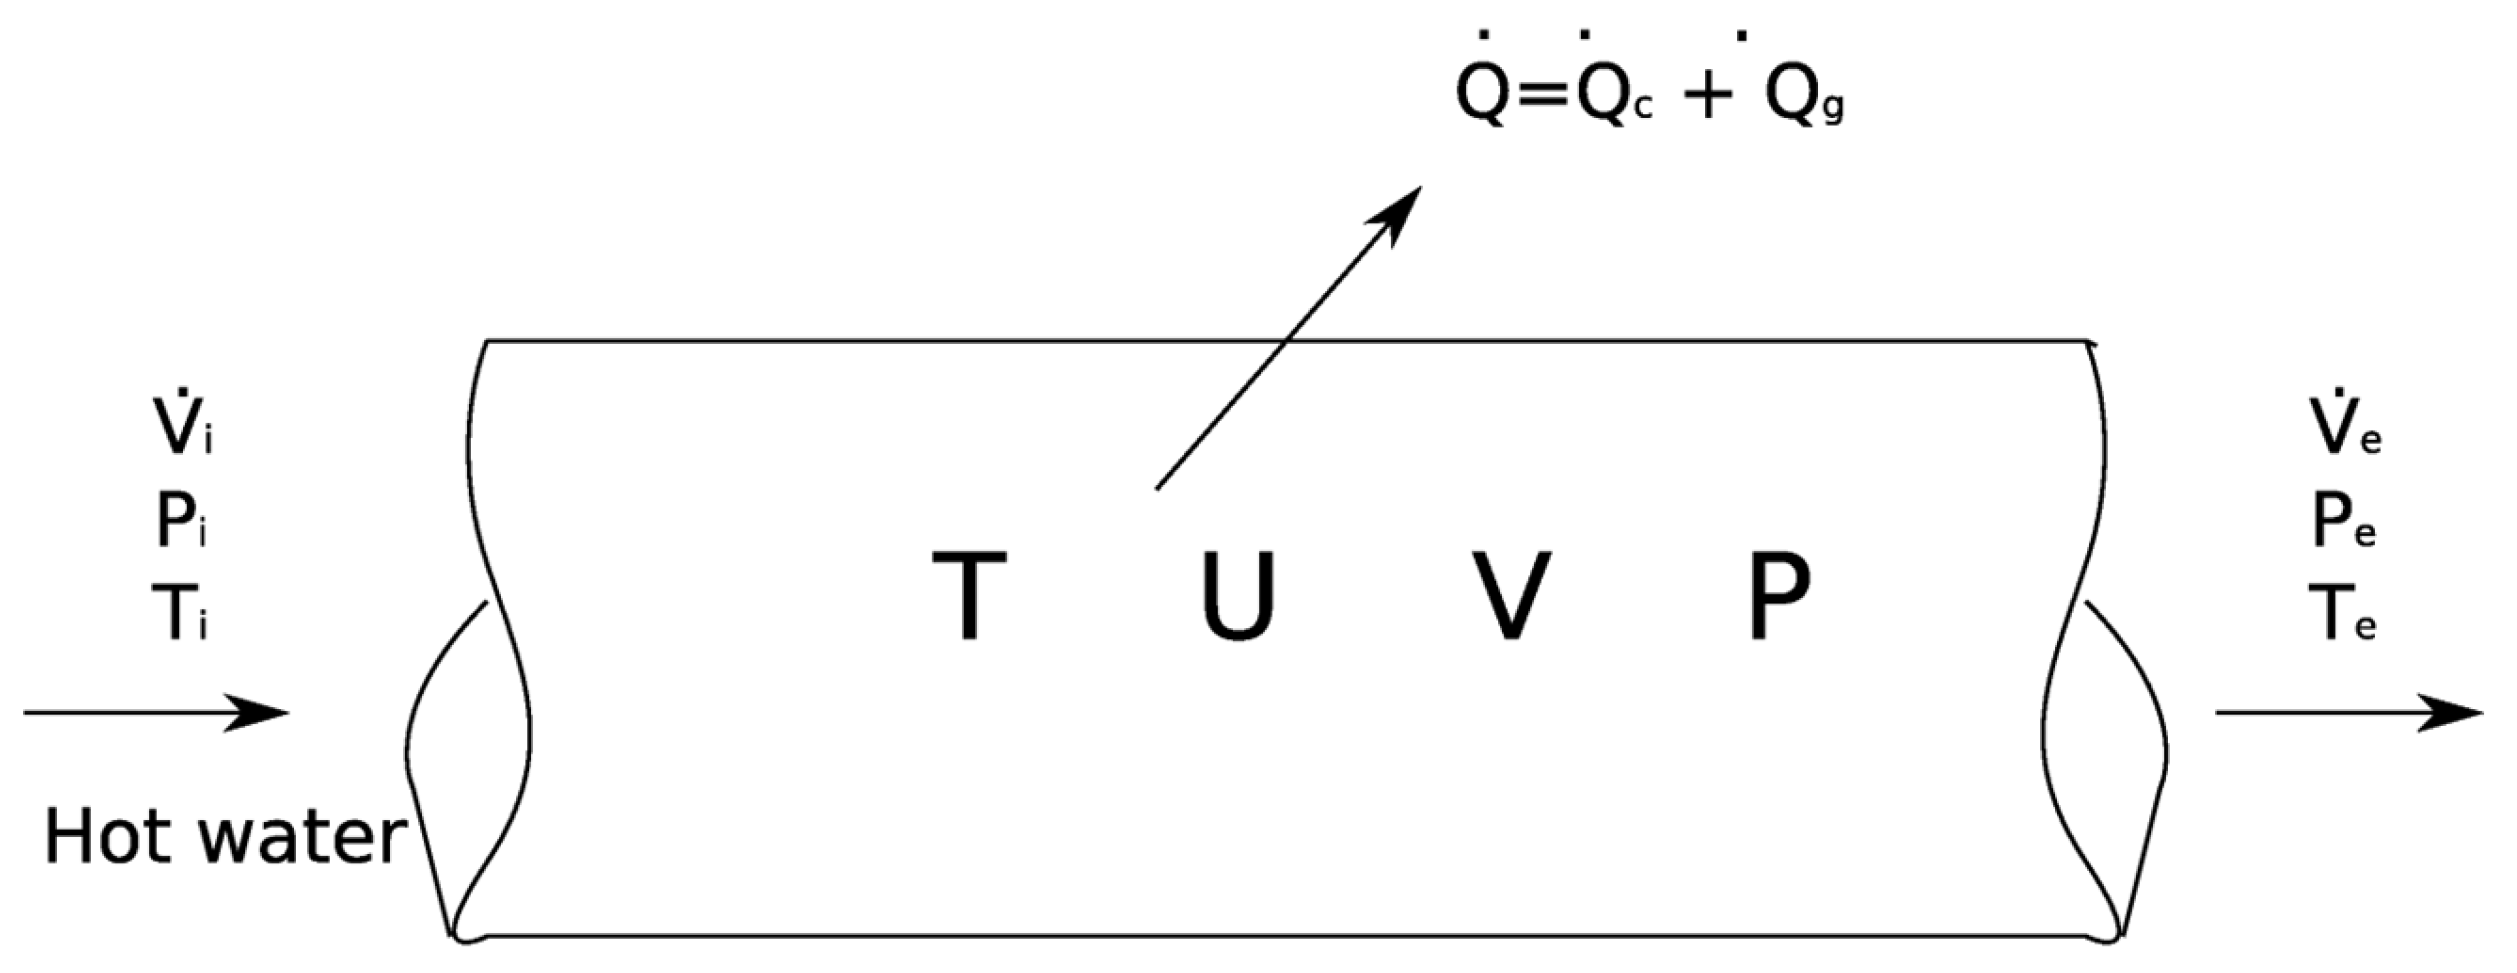
We consider the control volume shown in
Figure 2. The water flow, having a pressure (P), temperature (T), volume (V), and internal energy (U), is assumed to be steady and permanent. As it flows through the pipe, hot (or cold) water diffuses (or absorbs) heat across the peripheral surface of the conduit. It should be noted that the pressure, temperature, and water density are assumed to be homogeneous within the control volume.
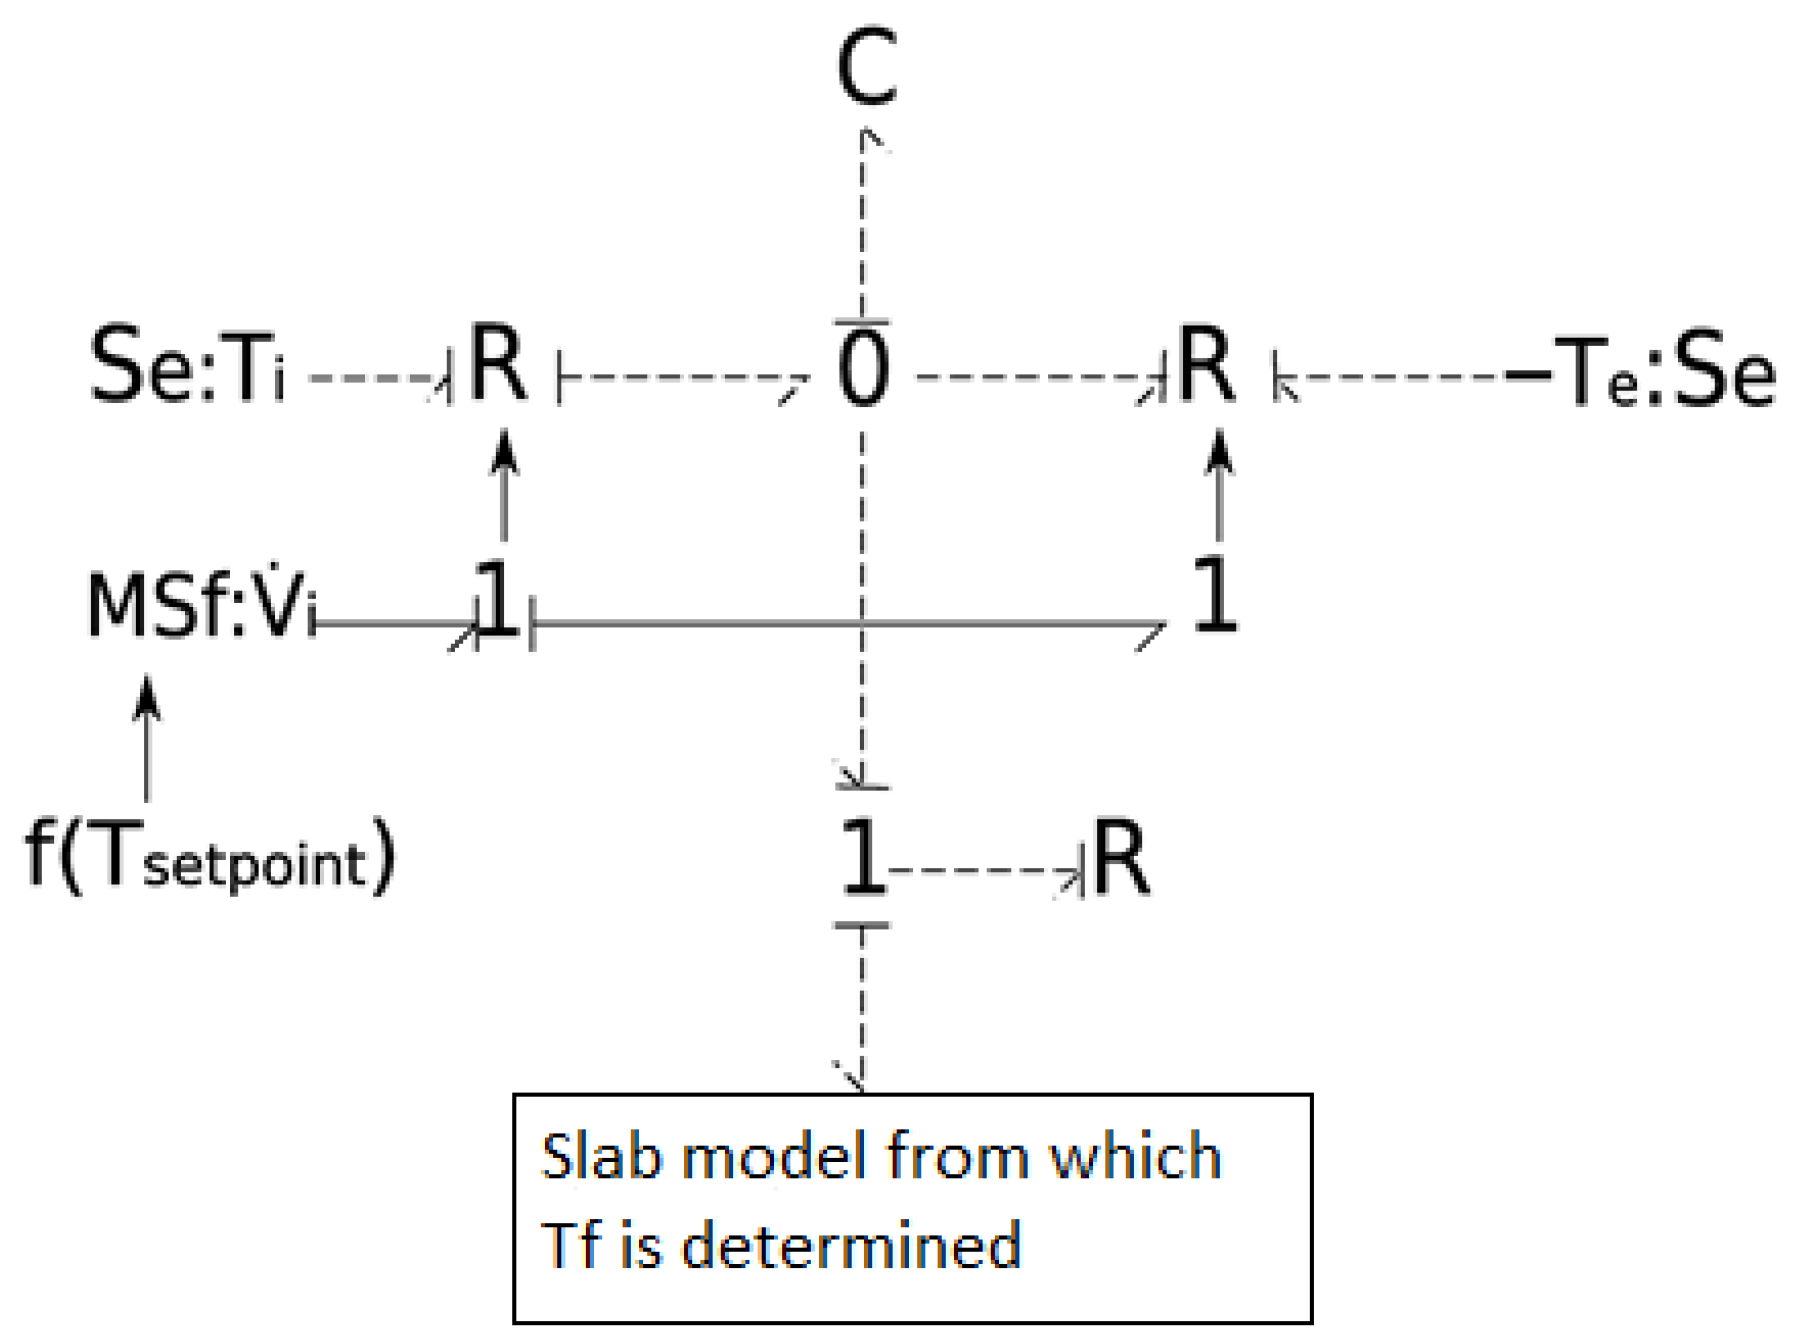
Figure 3 presents the bond graph model of the hydraulic circuit of a heated floor. The coupling between thermal and hydraulic energy is highlighted via signal links.
The sub-model representing thermal energy (bond graph links shown as dashed lines) consists of an assembly of a C element, representing the thermal capacity of water, two 2-port R elements, reflecting the dissipation of thermal energy at the inlet and outlet of the control volume, and a 1-port R element, representing heat diffusion into the slab through the external surface of the pipe.
As for the hydraulic energy part (solid lines), it is modeled by a modulated flow source (MSf). Regulation is based on modulating the volumetric flow rate of the circulation pump depending on the setpoint temperature. The MSf element is connected to a junction (1), which represents the conservation of the volumetric flow rate () at the inlet and outlet of the pipe. The absence of an R element is due to the assumption that water pressure at the inlet and outlet remains constant.
It should be noted that the bond graph sub-model is also valid for the hydraulic circuit of a cooling ceiling. In this case, heat is evacuated rather than supplied by the fluid. This is represented by reversing the direction of thermal energy flow.
From the hydraulic sub-model, we derive Equations (7) and (8). Equation (9), representing the conservation of energy, is derived from the thermal sub-model. Given that the fluid is incompressible, we obtain
The energy balance in the control volume is derived from the bond graph model. Around junction 0, and following the direction of the flows, we consider the following equation:
with
where
represents the thermal resistance due to convection and conduction of heat from the hot water to the outer surface of the tube [K.W−1];
is the average temperature of the water [K];
is the temperature of the outer surface of the tube [K].
Equations (8) and (9) are consistent with the equations for the conservation of mass and total energy, respectively. The fulfillment of the energy balance requires a 0-junction connected to the two 2-port R elements, reflecting energy dissipation at the entry and exit, to the C element, and to a 1-junction. The 2-port R elements are also connected to temperature sources at the boundaries of the control volume. The coupling of thermal and hydraulic energies is achieved through a signal link that provides the volumetric flow rate needed for calculating the enthalpy flux in the 2-port R element.
4. Simulation Results and Model Validation
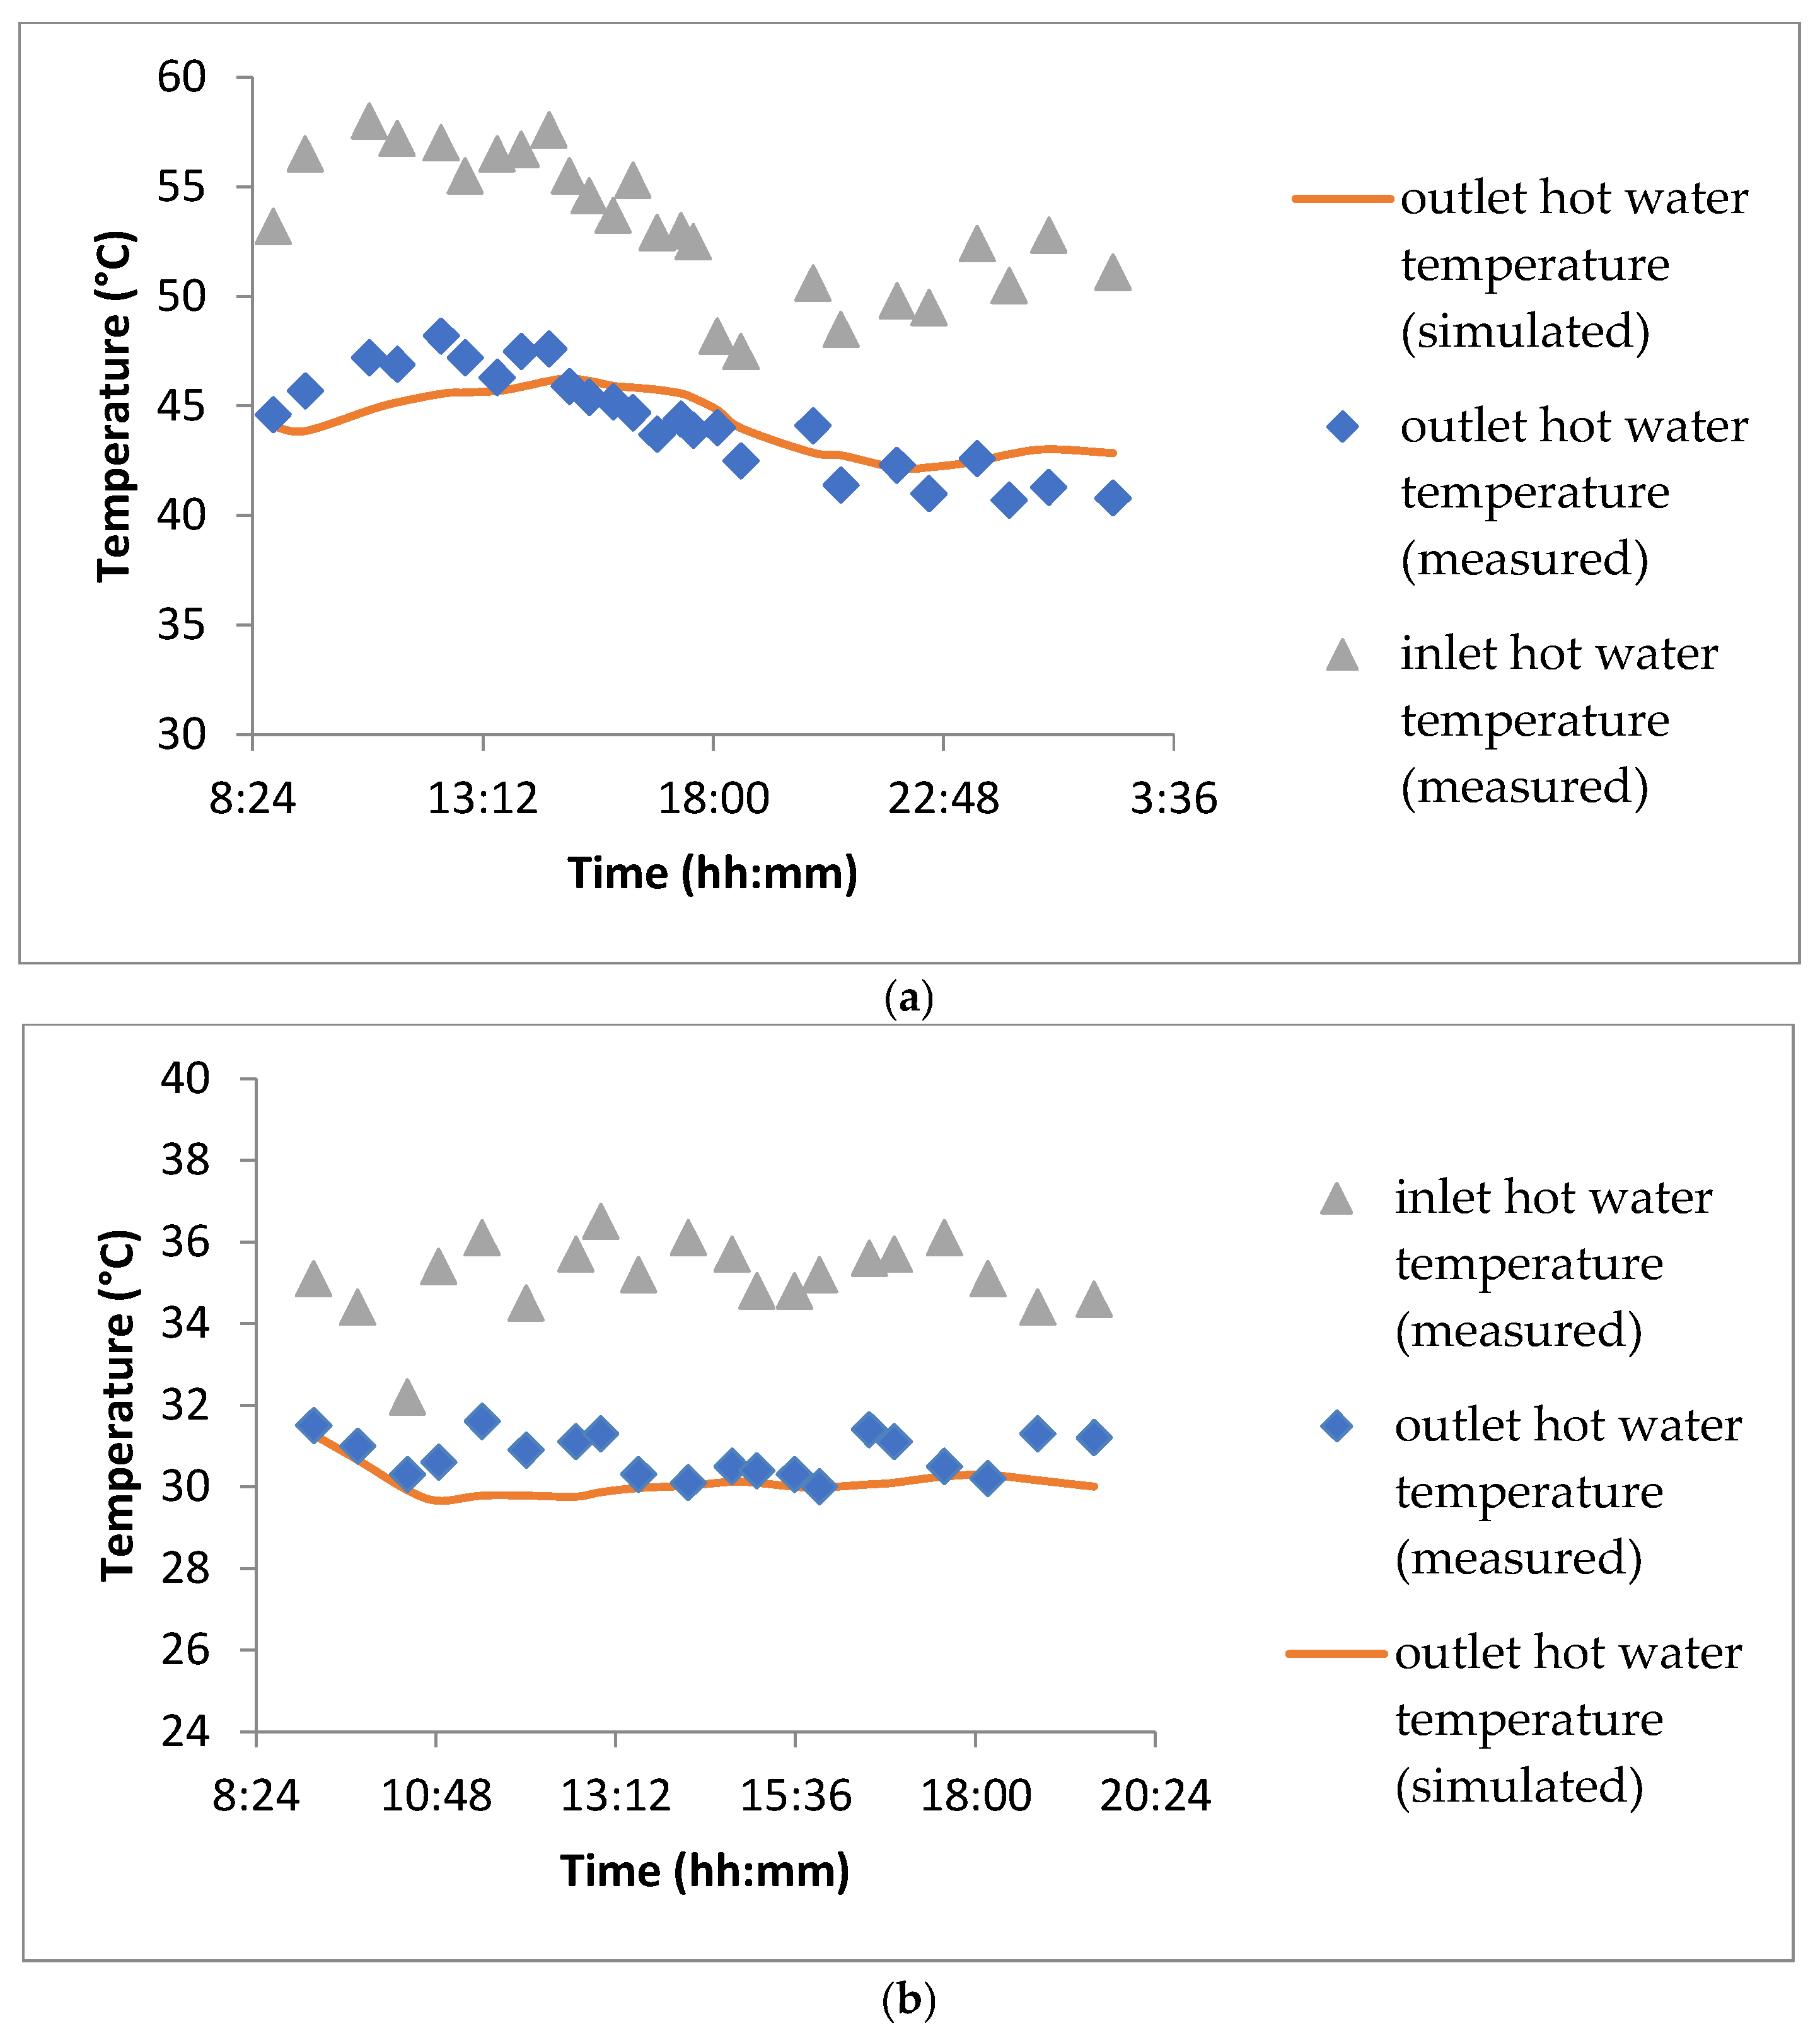
Figure 10 shows the comparison between simulated and measured hot water temperature regarding scenarios 1 and 2.
Figure 10a illustrates the variations in hot water temperatures at the inlet and the outlet of the floor heating system under the operation mode of scenario 1. The temperature of the outgoing hot water is notably higher between 10:50 and 18:35, as the cogeneration unit was activated to meet the demands of the hot water storage tank. Subsequently, the unit was turned off, leading to fluctuations in temperature.
Additionally, the return water temperature follows a qualitatively similar trend with a temperature difference ranging from 4.2 °C to 11.5 °C, largely influenced by variations in the external temperature. A good agreement is obtained between simulated and measured return hot water temperatures.
These temperature fluctuations highlight the dynamic response of the system to external conditions and energy input. The cogeneration unit plays a crucial role in stabilizing the supply temperature, but its operation and shutdown cycles introduce notable thermal variations. Understanding these temperature changes is essential for optimizing energy efficiency, ensuring consistent thermal comfort, and minimizing losses in the system. Future improvements could involve refining control algorithms to reduce temperature fluctuations and enhance overall system stability.
The established steady-state regime enables the energy balance of the test cell to be determined. According to scenario 2, the hot water temperature is maintained within the range of 34 °C < T5 < 36 °C, and the water volume flow was lowered to ensure stable conditions throughout the experimental period. These values are significantly lower than those imposed in the initial experiment.
Similar to
Figure 10a,
Figure 10b compares the return water temperatures, along with the outgoing temperature. A good accordance between numerical and experimental results is observed, with a maximum deviation not exceeding 1.8 °C.
Maintaining a stable temperature range is crucial for ensuring consistent thermal conditions during experimentation. The observed minimal deviation between numerical and experimental results suggests a well-calibrated model that accurately reflects system behavior. Further refinement in temperature regulation strategies could enhance precision and improve system efficiency, particularly in applications where tight thermal control is necessary. Investigating alternative heat exchange methods or insulation techniques may also contribute to reducing temperature fluctuations and optimizing energy consumption.
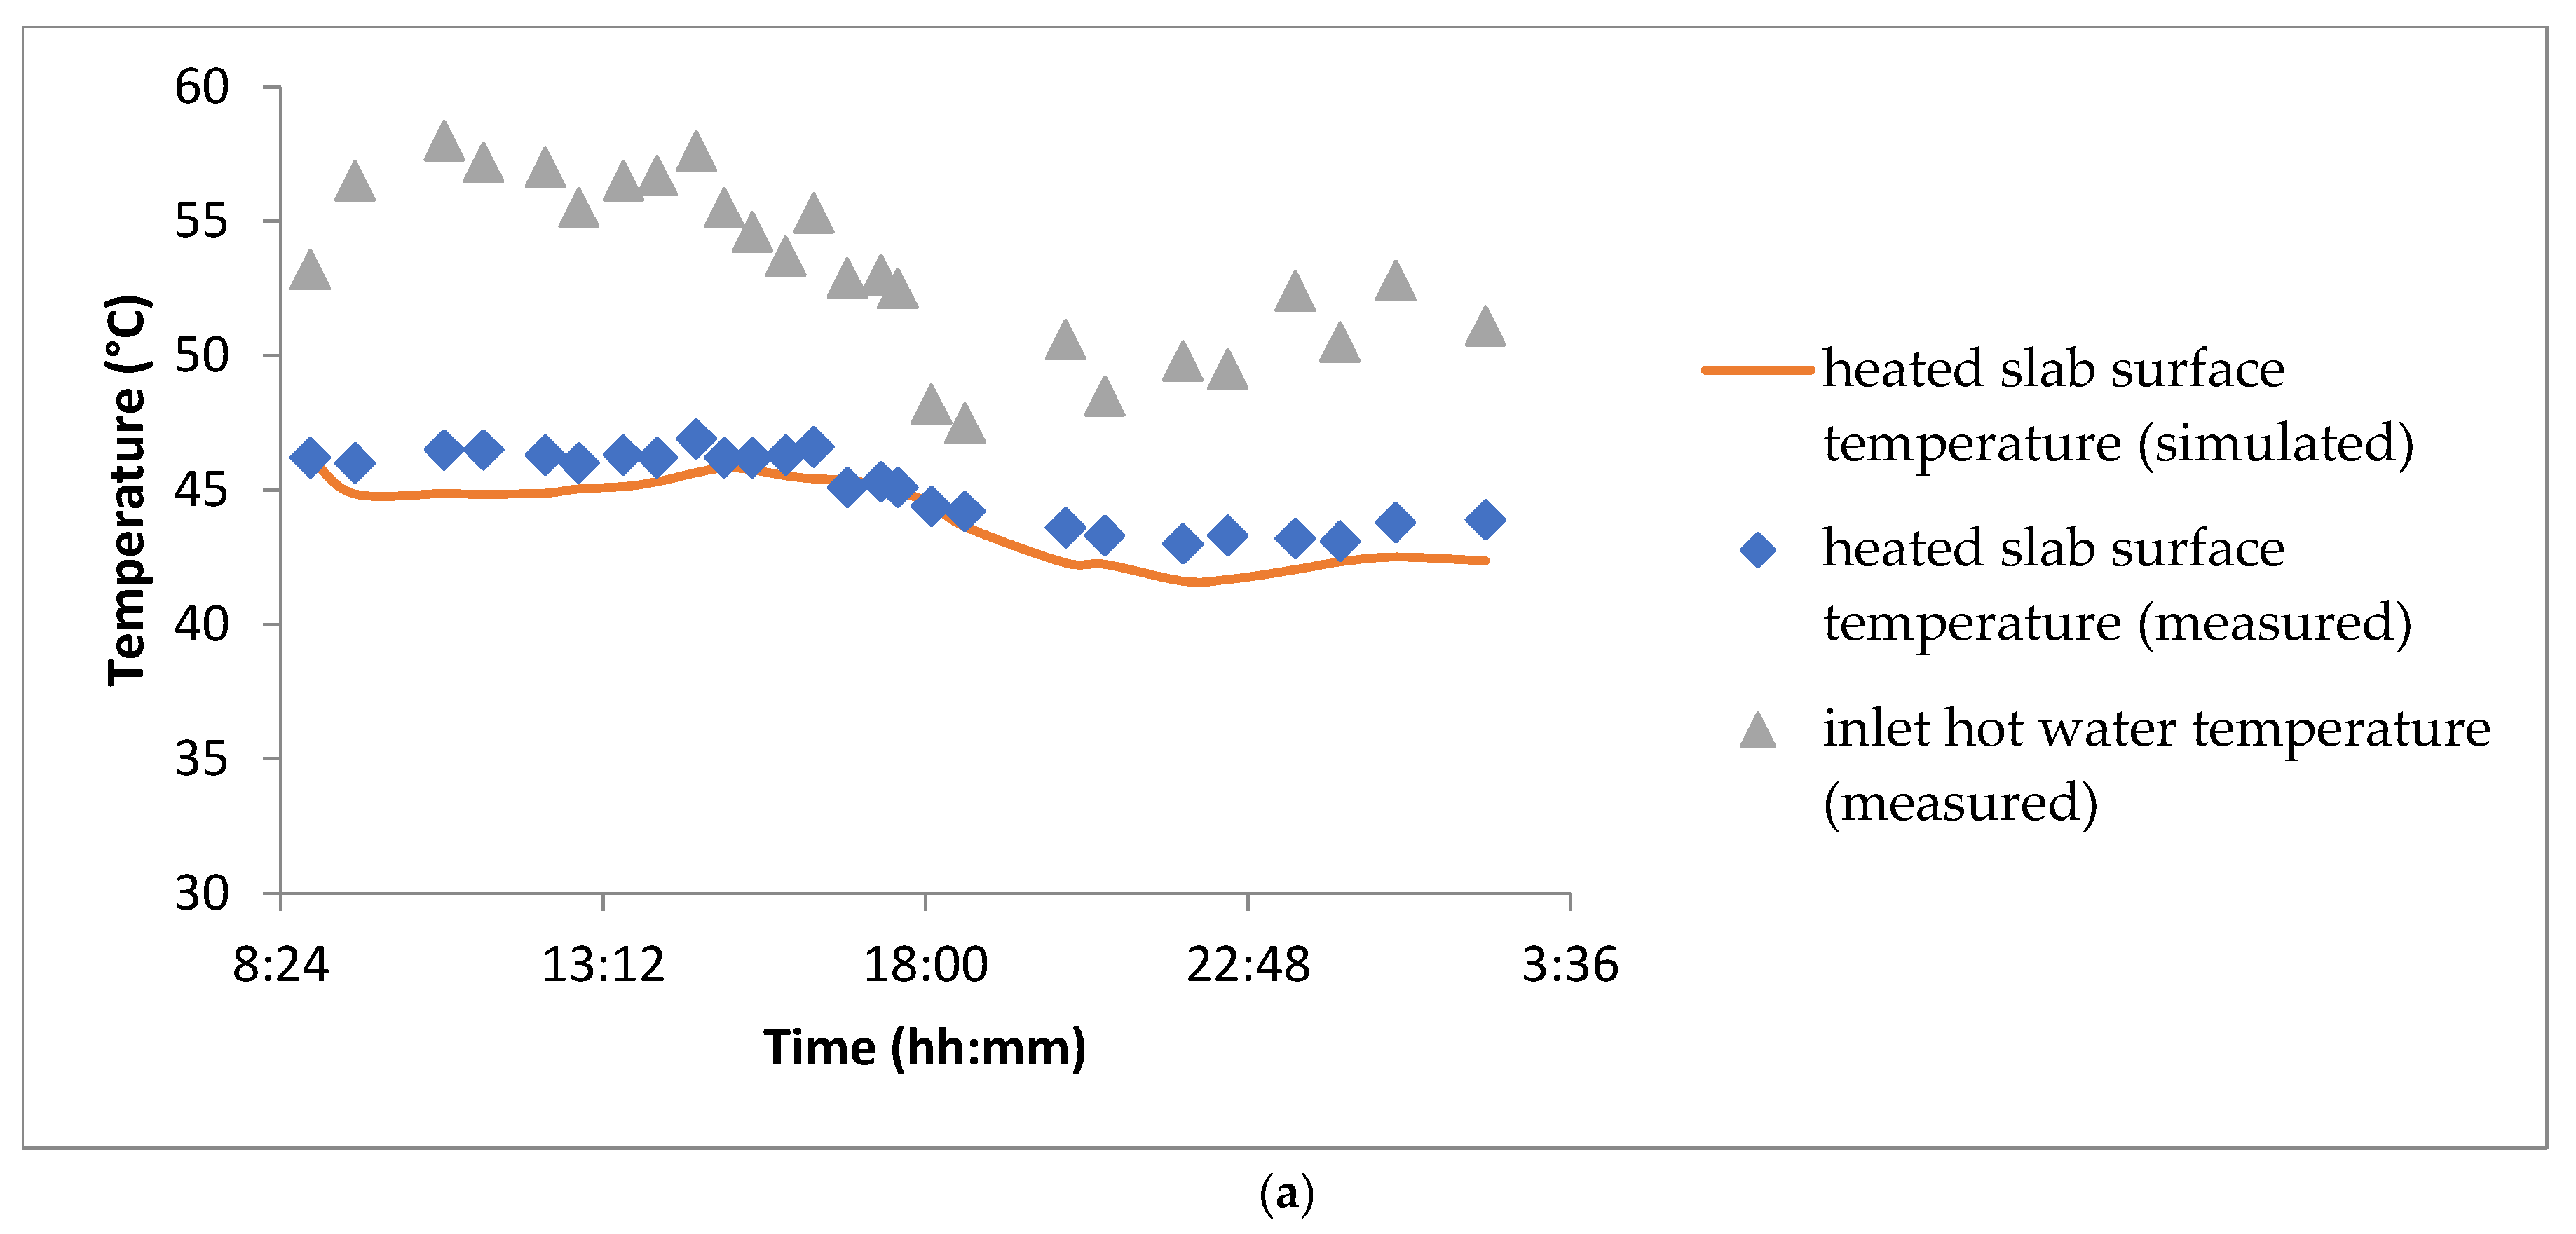
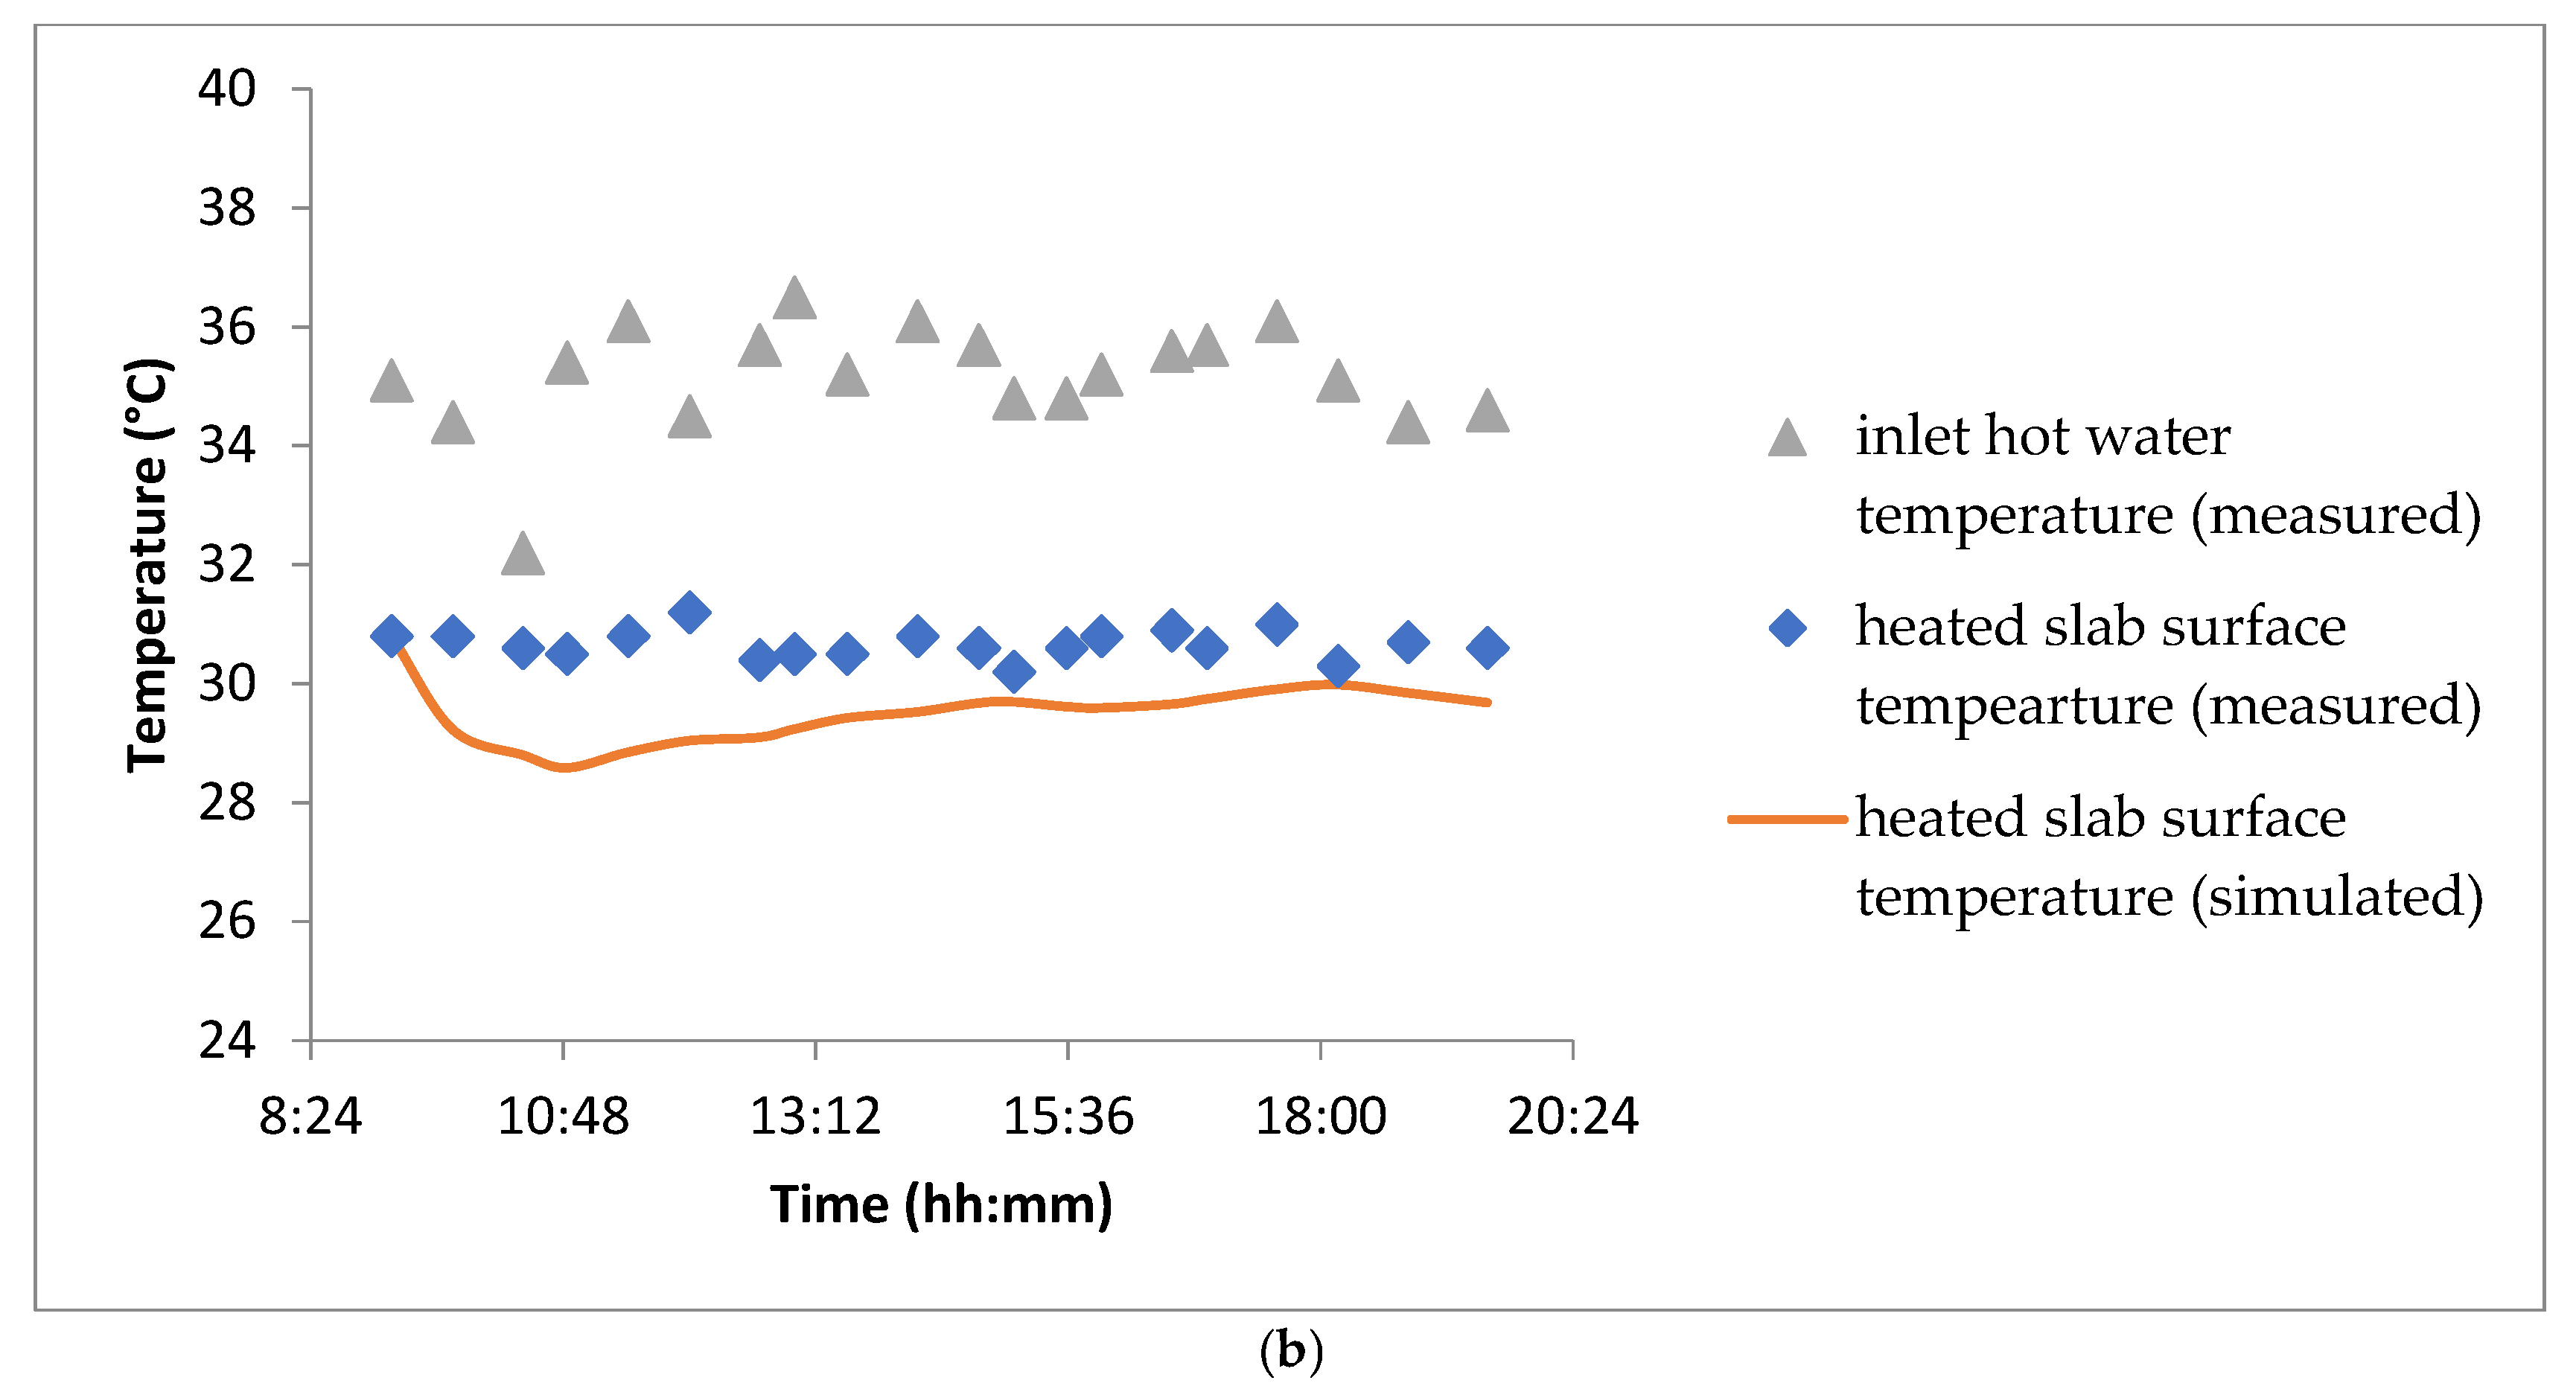
Figure 11 illustrates the surface temperature profiles of the heated slab according to scenario 1 and scenario 2.
The surface temperature and the outlet temperature of the hot water circulating through the underfloor heating system regarding scenario 1 are presented in
Figure 11a. The floor temperature is notably high, reaching up to 47 °C, due to the elevated temperature of the circulating hot water. Overall, the comparison between measured and estimated surface temperatures is satisfactory, with a maximum absolute deviation of approximately 1.6 °C.
The high surface temperature indicates an efficient heat transfer process, ensuring adequate thermal comfort within the heated space. The minimal deviation between measured and estimated values suggests that the thermal modeling of the system is reliable. Further optimization could involve refining the water temperature control to enhance energy efficiency and maintain consistent heating performance. Additionally, investigating the effects of different flooring materials on heat dissipation could contribute to improved system design.
According to scenario 2, the surface temperature of the floor is presented alongside the outgoing temperature of the hot water in
Figure 11b. The floor surface temperature fluctuates between 29 °C and 31 °C, with a maximum absolute deviation of 2.15 °C.
These temperature variations indicate stable thermal behavior within the underfloor heating system. The observed deviation remains relatively low, suggesting an effective heat distribution process. Further improvements could involve optimizing flow rates and adjusting water temperature control mechanisms to enhance efficiency and maintain even heat distribution. Additionally, exploring the thermal conductivity of different flooring materials could contribute to optimizing comfort and minimizing temperature fluctuations.
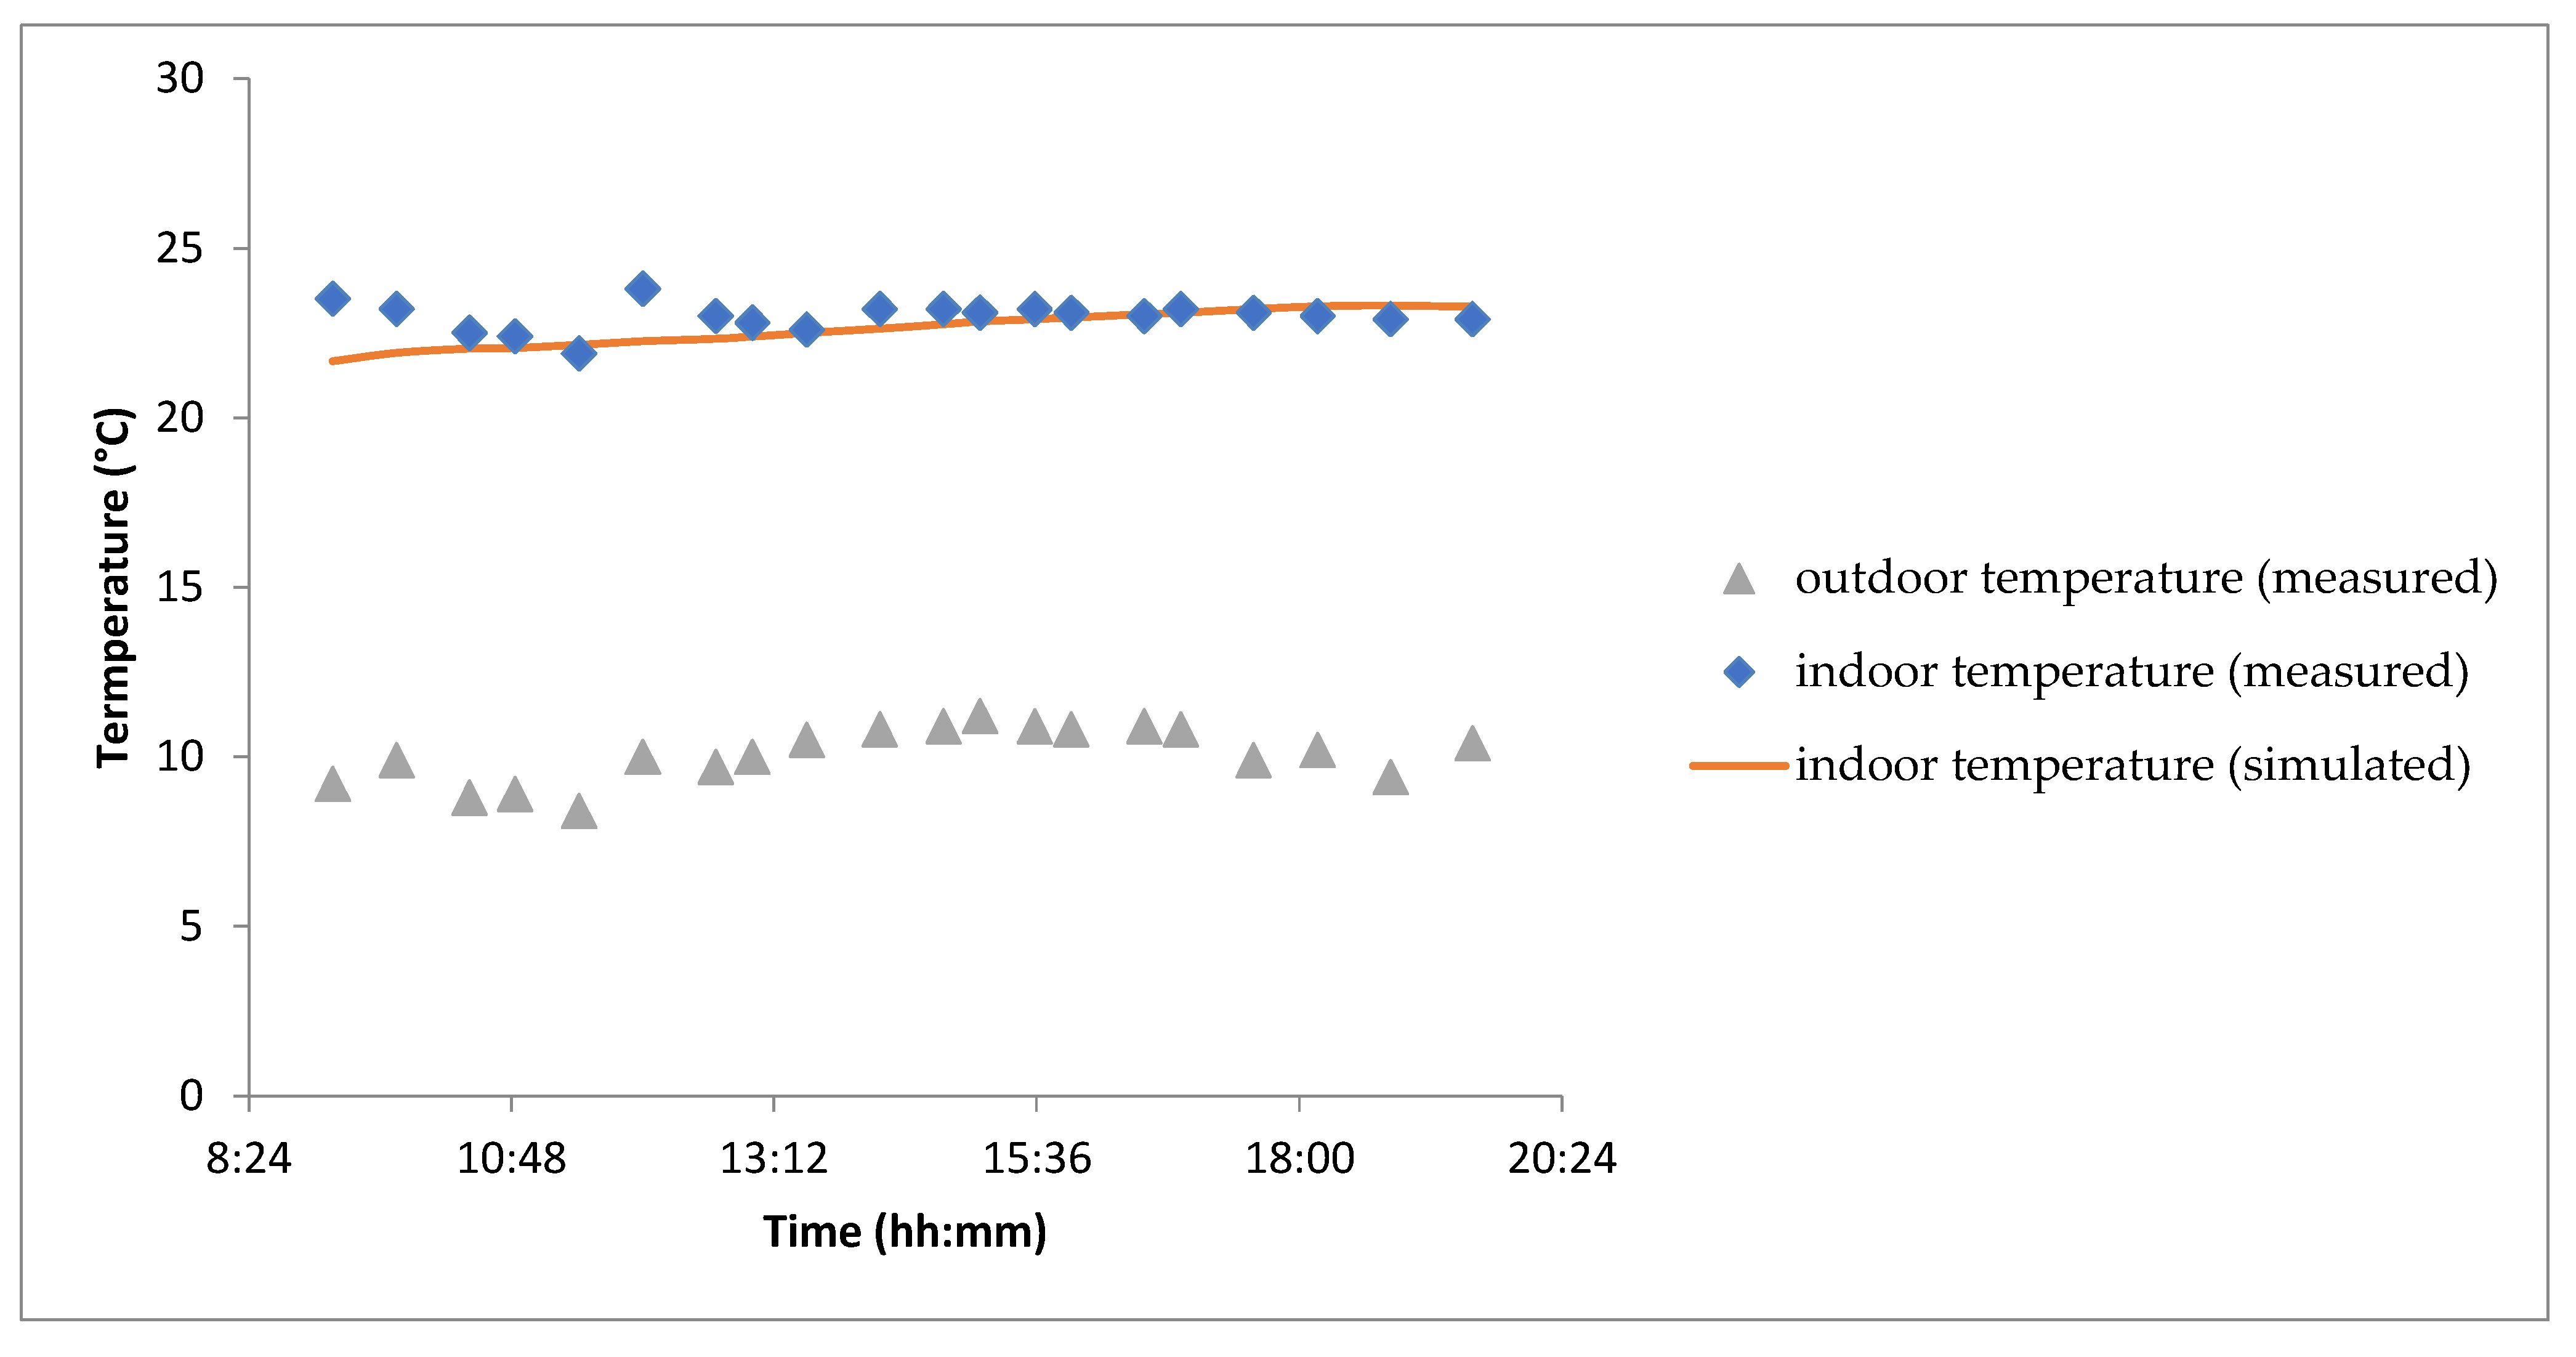
Figure 12 compares the estimated and measured temperatures of the indoor air in zone 1. A good agreement is observed between the results, with a maximum absolute difference of 1.8 °C. The indoor space temperature ranges between 21 °C and 24 °C. The phase shift and attenuation phenomena are not visible under the established steady-state regime. The consistency between estimated and measured values suggests that the thermal modeling of the indoor environment is reliable. The absence of phase shift and attenuation effects indicates a stable thermal response, likely due to controlled heating and minimal external disturbances. Further investigation into insulation properties, air circulation dynamics, and heat exchange mechanisms could refine temperature predictions and enhance thermal comfort. Exploring adaptive control strategies might also help optimize temperature regulation based on external influences.
During the cooling period, the indoor environment in zone 2 is cooled using a chilled ceiling system, according to scenario 2.
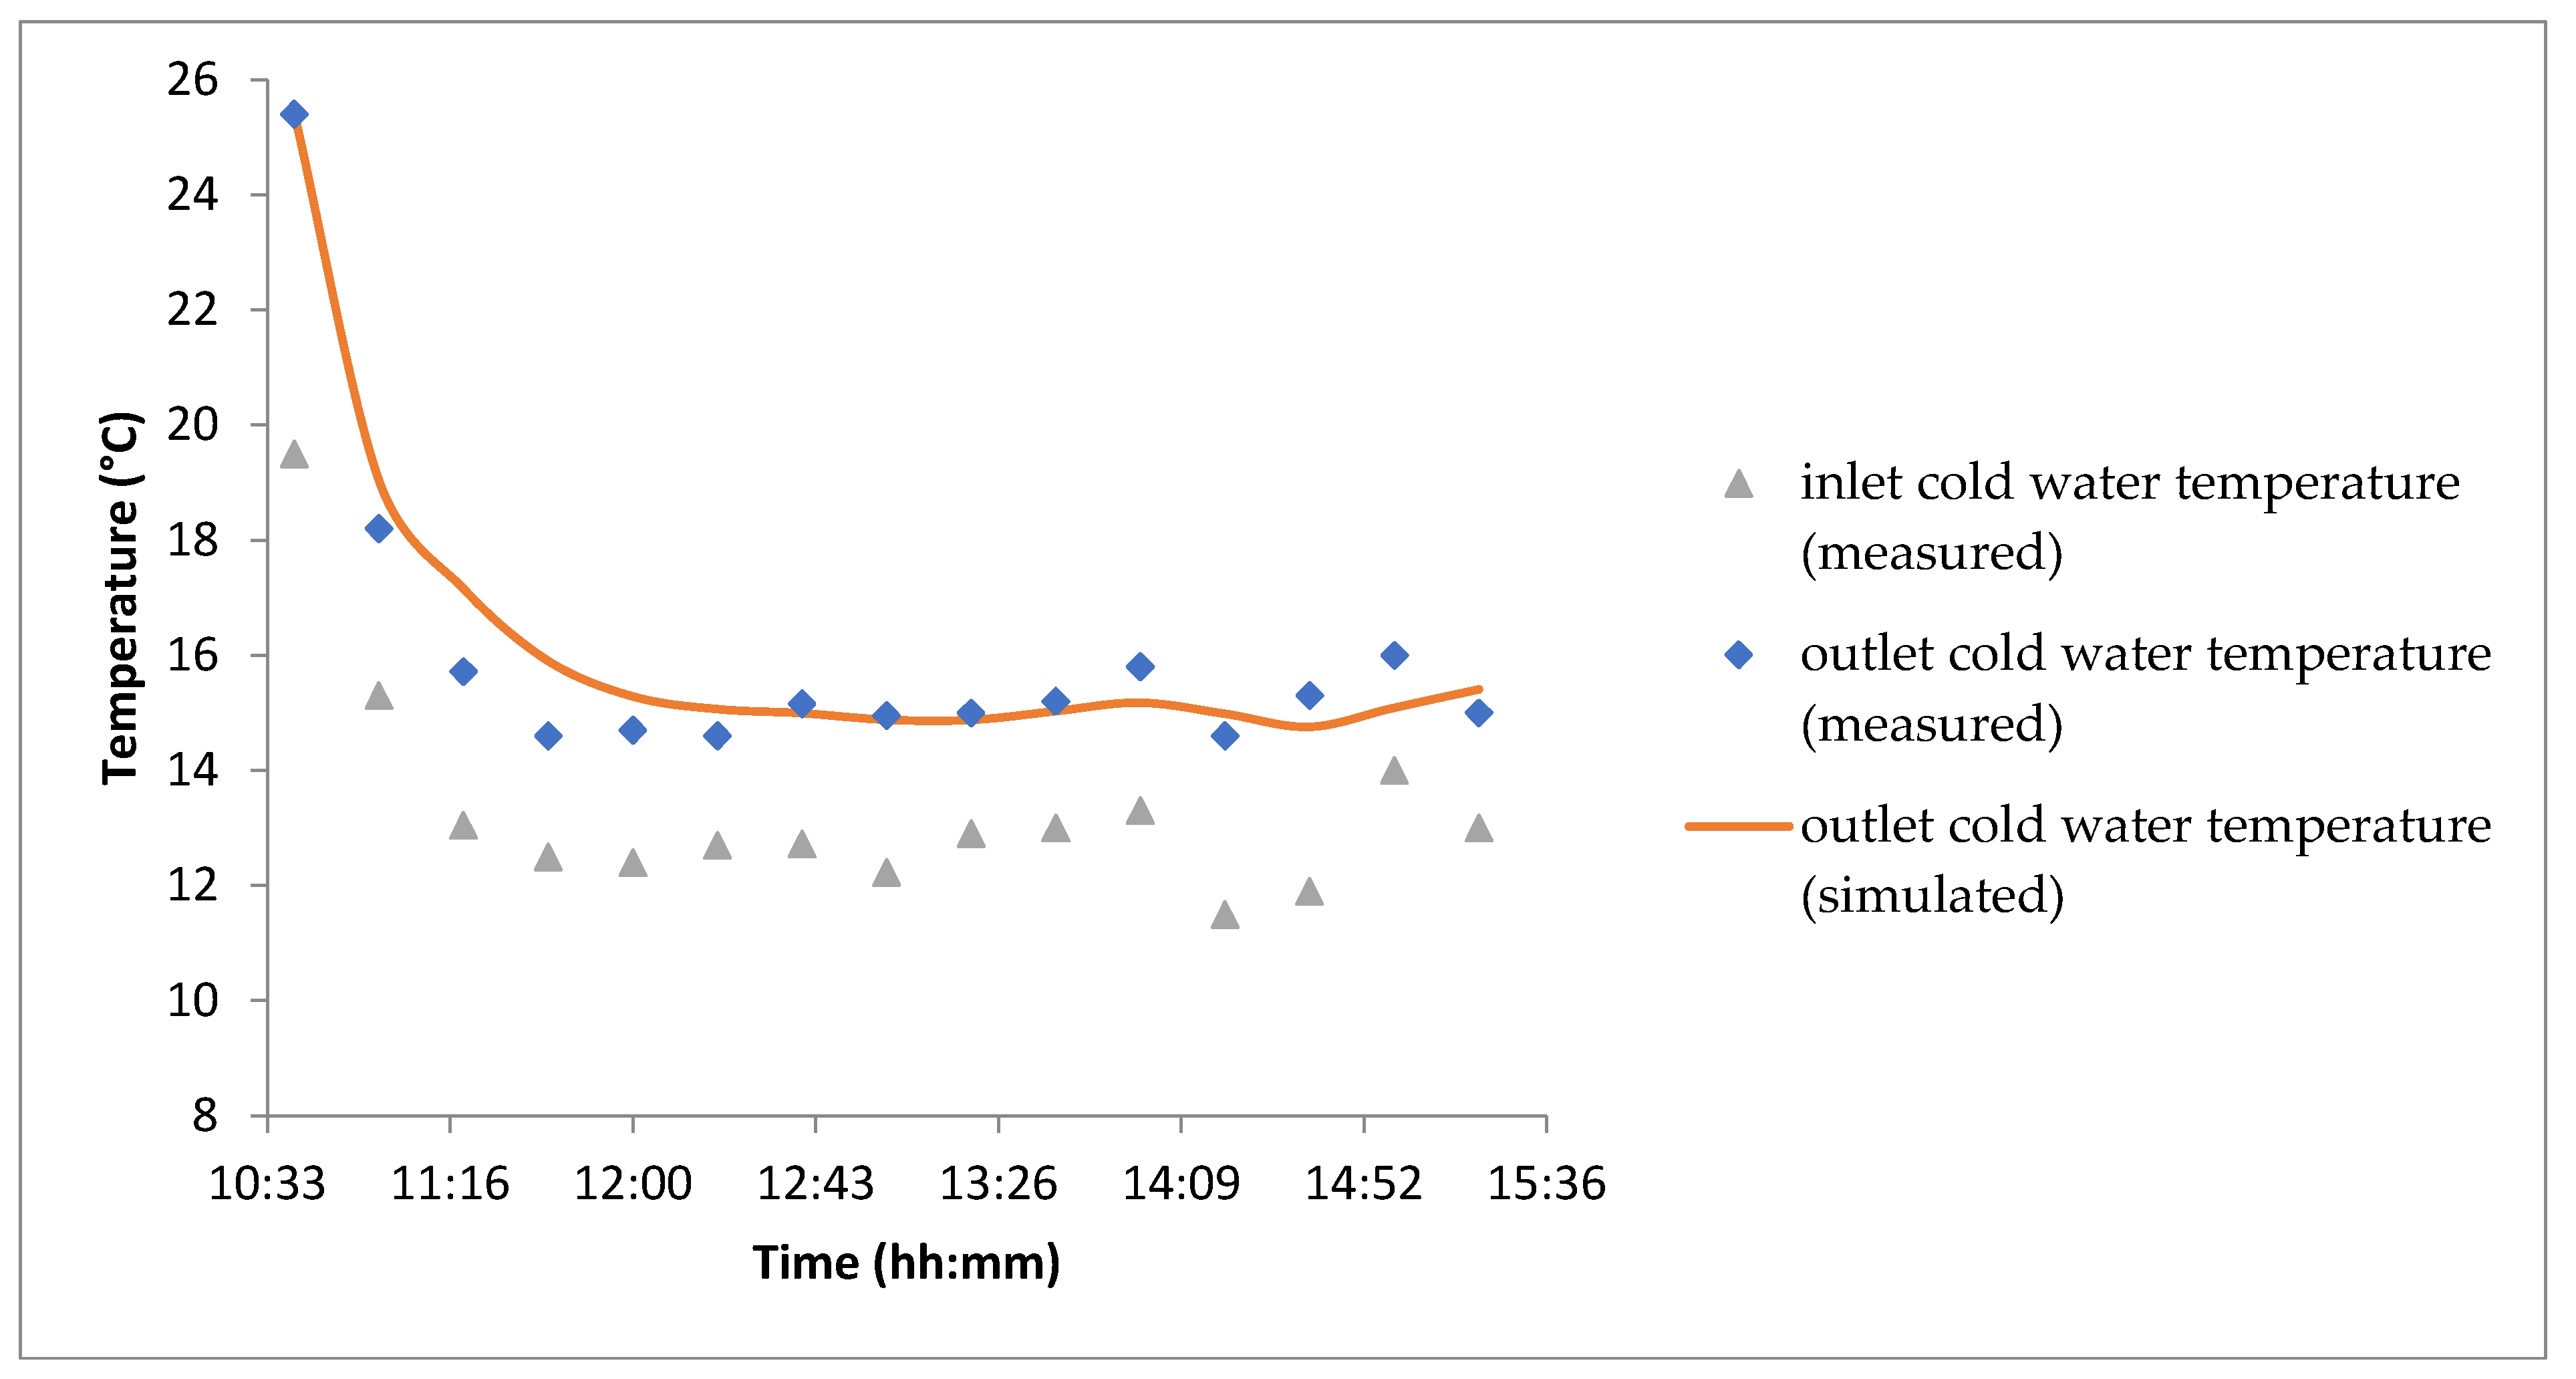
Figure 13 illustrates the temperature profiles of the cold water circulating through the chilled ceiling system, at both the departure and return points, based on measurements and simulations. A good agreement between the measured and estimated temperatures is observed. The consistency between measured and simulated values suggests an accurate representation of the system’s thermal behavior. The effectiveness of the chilled ceiling system in maintaining a stable indoor climate highlights its potential for energy-efficient cooling. Further refinement of the hydraulic circuit’s control parameters could enhance performance by optimizing flow rates and reducing thermal fluctuations.
The temperature profiles inside and outside zone 2 are illustrated in
Figure 14. The indoor temperature undergoes two distinct phases: an initial drop due to the activation of the chilled ceiling system, followed by a slight increase as a result of rising outdoor temperatures. The temperature ranges between 20 °C and 24 °C, ensuring thermal comfort for the occupant. The average cooling power consumption is approximately 0.6 kW. The ability of the chilled ceiling system to maintain a stable and comfortable indoor climate highlights its effectiveness. The observed temperature variation suggests that external thermal influences moderately affect the indoor environment, emphasizing the importance of adaptive control strategies. Optimizing the system’s response to external temperature fluctuations—perhaps through predictive thermal regulation or dynamic flow adjustments—could further enhance energy efficiency and occupant comfort. Investigating materials with higher thermal inertia may also contribute to minimizing sudden temperature shifts.
The Normalized Mean Bias Error (NMBE) and the Coefficient of Variation of the Root Mean Square Error (CV(RMSE)) were used as validation indices as per the ASHRAE Guideline 14-2014 [
36] and the International Performance Measurement and Verification Protocol (IPMVP) [
37].
The indices are calculated as follows:
and
are, respectively, the simulated and measured data at instant t.
Table 3 depicts the values of
and
for the compared temperatures. The values meet the criteria of ASHRAE Guideline 14-2014 and IPMVP model validation for hourly data, shown in
Table 4.
5. Discussion
Bond graph modeling presents a promising approach to building performance simulation by accurately capturing thermal dynamics and energy interactions. The results demonstrate strong agreement between measured and estimated temperatures in various heating and cooling scenarios, reinforcing the reliability of this modeling method. In hot water circulation systems,
Figure 10a,b show predictable trends, with absolute deviations below 2.5 °C and 1.8 °C, respectively. These results indicate that bond graphs can effectively represent system interactions and transient thermal behaviors, making them suitable for analyzing dynamic energy exchange processes in heating networks. This capability allows for improved control strategies, ensuring that thermal fluctuations are minimized while optimizing energy usage.
Similarly, underfloor heating temperatures in
Figure 11a,b confirm accurate heat transfer representation, as maximum deviations of 1.6 °C and 2.15 °C indicate strong alignment between measured and simulated results. The ability of bond graphs to model the interactions between the heat source, flooring materials, and environmental conditions provides insight into optimizing heating efficiency while maintaining uniform thermal distribution. In practical applications, this could lead to enhanced system configurations that adjust flow rates and heating intensity based on occupancy and external temperature variations, ensuring consistent comfort levels without excessive energy consumption.
Indoor thermal conditions analyzed in
Figure 12 highlight minimal phase shift effects, with estimated and measured values closely matching within a maximum deviation of 1.8 °C. This suggests that bond graph modeling can predict indoor temperature fluctuations with high accuracy, ensuring stable environmental control. The strong correlation between numerical and experimental data confirms the robustness of this approach in replicating real-world building behavior. The absence of significant phase shift effects under steady-state conditions further reinforces the potential of bond graphs to refine HVAC control mechanisms, particularly in applications where maintaining precise indoor climate regulation is crucial.
In the cooling scenario,
Figure 13 and
Figure 14 showcase a well-regulated indoor temperature ranging between 20 °C and 24 °C, with an average cooling power consumption of 0.6 kW. These results demonstrate the efficiency of advanced modeling techniques in maintaining consistent thermal comfort while optimizing energy consumption. Bond graphs, by systematically integrating hydraulic circuits and thermal exchange mechanisms, offer a detailed representation of the cooling process. This enables predictive control strategies that adjust system operation in response to external temperature variations, reducing unnecessary energy use while ensuring a stable and comfortable indoor environment. Additionally, their adaptability makes them well-suited for designing innovative cooling solutions tailored to different building configurations and climate conditions.
Bond graphs integrate multi-physic interactions, enabling predictive control and optimization strategies while ensuring scalability for different building configurations. Their ability to focus on energy exchange rather than isolated component behavior enhances their applicability in heating, cooling, and overall energy management. By systematically representing heat transfer, hydraulic circuits, and adaptive thermal regulation, bond graphs offer a viable solution for improving building performance simulation, making them a valuable tool for optimizing thermal efficiency and occupant comfort. They not only support efficient energy distribution but also provide a foundation for future advancements in smart building technologies, where real-time control and automated system adaptation can lead to substantial improvements in energy conservation and operational reliability.
While bond graph modeling offers significant advantages in capturing multi-physics interactions and supporting predictive control strategies, it is not without limitations. One of the primary challenges lies in the computational complexity associated with large-scale or highly detailed models. As the number of components and interactions increases—particularly in large or multi-zone buildings—the resulting bond graph can become computationally intensive to simulate, potentially requiring high-performance computing resources or advanced numerical solvers to maintain real-time responsiveness. This complexity may limit the practical scalability of bond graph models for very large buildings or urban-scale simulations unless model reduction techniques or hierarchical modeling strategies are employed [
38].
Another notable challenge is the parameter identification and model calibration process. Accurate bond graph modeling relies heavily on precise physical parameters—such as thermal resistances, capacitances, and flow coefficients—which are often difficult to obtain, especially in existing buildings with limited documentation or sensor coverage. This can lead to uncertainties in model predictions unless extensive experimental data is available for validation. Additionally, integrating bond graph models with existing building management systems or simulation platforms may require custom interfaces or middleware, which can pose technical and interoperability barriers. Addressing these challenges through improved parameter estimation methods, standardized modeling libraries, and hybrid modeling approaches could enhance the accessibility and robustness of bond-graph-based simulations in future research and practical applications.
6. Conclusions
Bond graph (BG) methodology stands out as a powerful and versatile modeling approach for addressing the complexities of building energy performance simulation. Its unique ability to represent multi-domain systems—thermal, hydraulic, and control—within a unified, energy-conserving framework offers a significant advantage over traditional simulation tools. The graphical and modular nature of bond graphs enhances interpretability, facilitates system-level analysis, and supports advanced functionalities such as control design, fault detection, and predictive regulation. These features make BG particularly well-suited for the evolving demands of smart and sustainable building design.
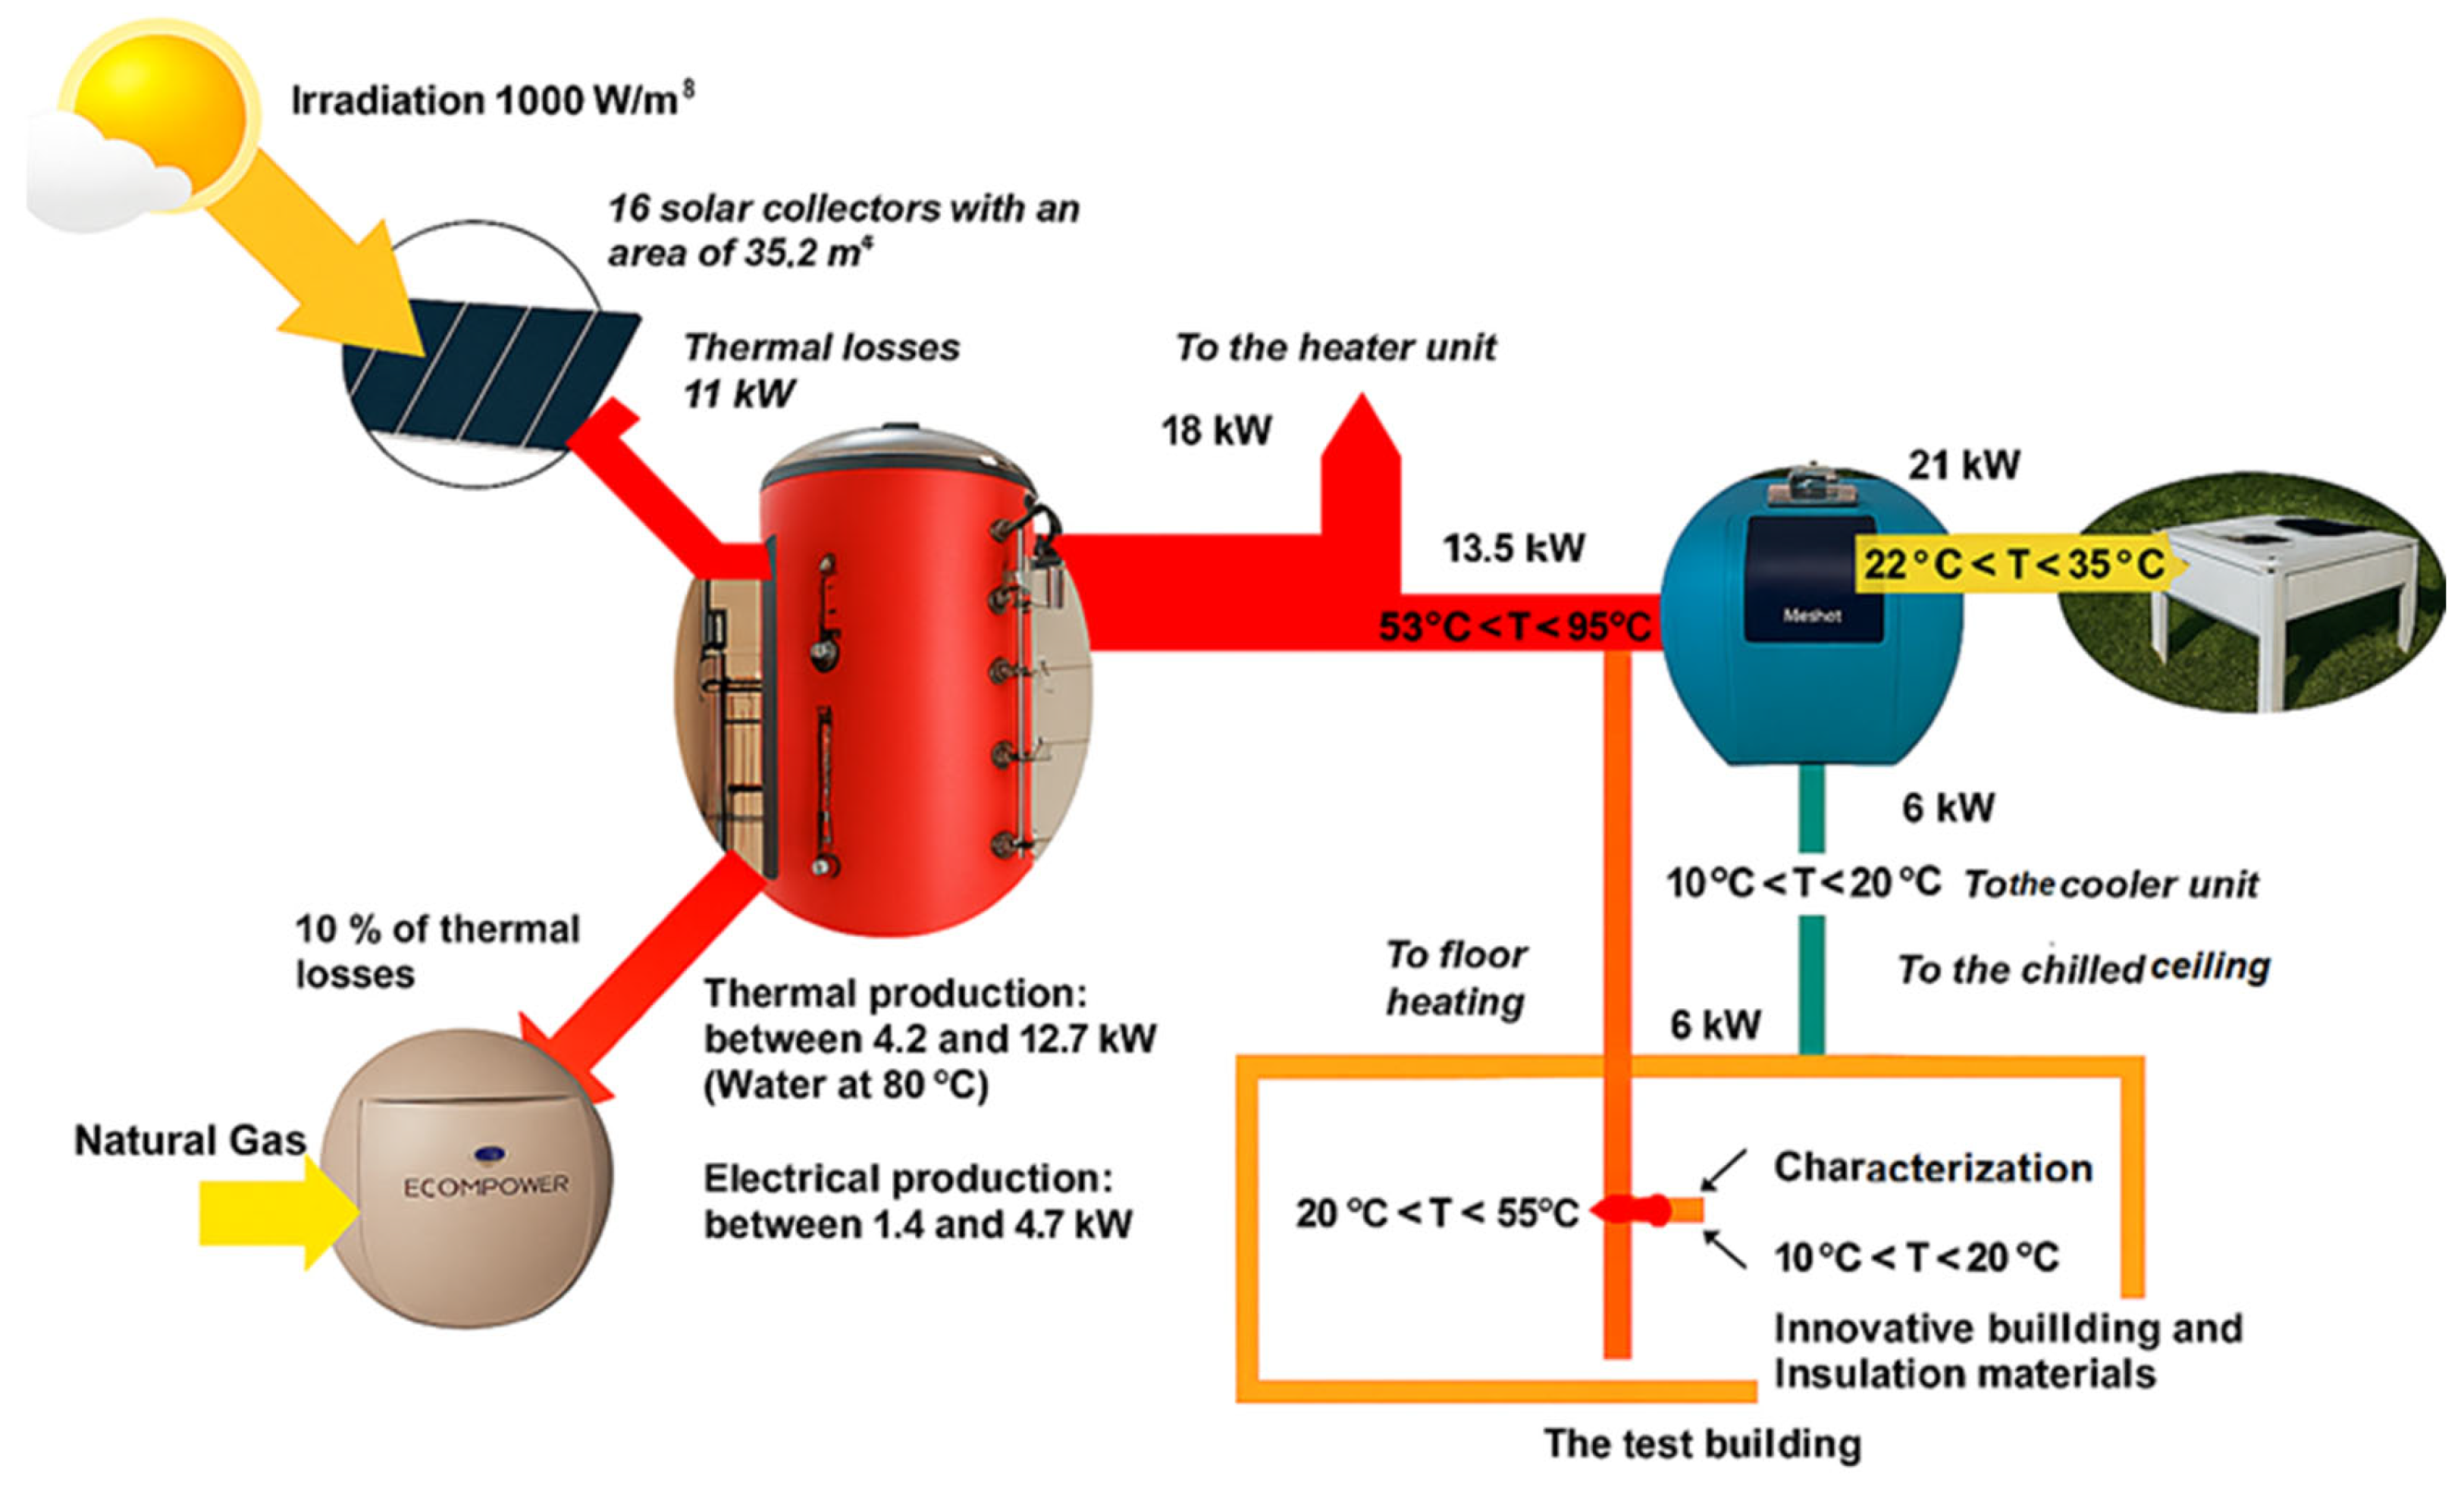
The core novelty of this study lies in the application of bond graph modeling to an integrated trigeneration system implemented within an experimental test cell, a configuration that has not been extensively explored in the prior literature. This system includes the coupling of heating, cooling, and domestic hot water production, all modeled within a single BG framework. The study provides a systematic validation of the model under both dynamic and steady-state conditions across two distinct climatic periods. The close agreement between simulated and measured data—across hot water circulation, underfloor heating, and indoor air temperature regulation—demonstrates the method’s robustness and accuracy in replicating real-world thermal behavior. This validation not only confirms the reliability of the BG approach but also highlights its potential for predictive control, adaptive energy management, and real-time optimization in complex building systems.
Furthermore, the study illustrates how BG modeling can support scalable and modular simulation architectures, making it adaptable to a wide range of building configurations and energy systems. By integrating hydraulic circuits, thermal exchange processes, and control strategies into a cohesive model, this work bridges the gap between theoretical modeling and practical implementation. It also opens new avenues for research in areas such as hybrid renewable integration, fault-tolerant control, and digital twin development for smart buildings.
In conclusion, this research not only reinforces the value of bond graph methodology in building performance simulation but also contributes a novel case study that demonstrates its practical applicability to integrated energy systems. Future work should focus on extending this approach to larger-scale buildings, automating parameter identification, and integrating BG models with real-time building management systems to fully leverage their potential in advancing energy-efficient and resilient building design.
