Article

Thermal Analysis of Energy Efficiency Performance and Indoor Comfort in a LEED-Certified Campus Building in the United Arab Emirates

by
Khushbu Mankani
1,
Mutasim Nour
1,* and
Hassam Nasarullah Chaudhry
2,*
1
School of Engineering and Physical Sciences, Heriot-Watt University, Dubai P.O. Box 501745, United Arab Emirates
2
School of Energy, Geoscience, Infrastructure and Society, Heriot-Watt University, Dubai P.O. Box 501745, United Arab Emirates
*
Authors to whom correspondence should be addressed.
Energies 2025, 18(15), 4155; https://doi.org/10.3390/en18154155
Submission received: 7 July 2025 / Revised: 1 August 2025 / Accepted: 1 August 2025 / Published: 5 August 2025
(This article belongs to the Special Issue Energy Efficiency and Thermal Performance in Buildings)

Abstract

Enhancing the real-world performance of sustainably designed and certified green buildings remains a significant challenge, particularly in hot climates where efforts to improve thermal comfort often conflict with energy efficiency goals. In the United Arab Emirates (UAE), even newly constructed facilities with green building certifications present opportunities for retrofitting and performance optimization. This study investigates the energy and thermal comfort performance of a LEED Gold-certified, mixed-use university campus in Dubai through a calibrated digital twin developed using IES thermal modelling software. The analysis evaluated existing sustainable design strategies alongside three retrofit energy conservation measures (ECMs): (1) improved building envelope U-values, (2) installation of additional daylight sensors, and (3) optimization of fan coil unit efficiency. Simulation results demonstrated that the three ECMs collectively achieved a total reduction of 15% in annual energy consumption. Thermal comfort was assessed using operative temperature distributions, Predicted Mean Vote (PMV), and Predicted Percentage of Dissatisfaction (PPD) metrics. While fan coil optimization yielded the highest energy savings, it led to less favorable comfort outcomes. In contrast, enhancing envelope U-values maintained indoor conditions consistently within ASHRAE-recommended comfort zones. To further support energy reduction and progress toward Net Zero targets, the study also evaluated the integration of a 228.87 kW rooftop solar photovoltaic (PV) system, which offset 8.09% of the campus’s annual energy demand. By applying data-driven thermal modelling to assess retrofit impacts on both energy performance and occupant comfort in a certified green building, this study addresses a critical gap in the literature and offers a replicable framework for advancing building performance in hot climate regions.

Graphical Abstract

1. Introduction

Buildings are among the largest consumers of energy worldwide, accounting for 34% of the global energy demand, and 37% of the energy and process-related CO2 emissions in 2022 [1]. In the UAE, the buildings sector contributes to nearly 70% of total national electricity usage, primarily driven by the need for year-round cooling in its hot and arid climate, and generates approximately 540,000 tonnes of greenhouse gas (GHG) emissions [2]. These energy-intensive characteristics highlight the important role of the buildings sector in tackling climate change, driven by GHG emissions resulting from conventional energy generation using fossil fuels. A study by the Emirates Green Building Council (EGBC) indicated that the UAE’s buildings sector has the potential to contribute over 42% of the energy intensity reductions needed by 2030 to stay within the Paris Agreement’s 1.5 °C target [3].
Recognizing this opportunity, the UAE launched its Net Zero 2050 initiative in 2021, aligning its commitment with the global goals of the Paris Agreement, with significant emphasis placed on enhancing energy performance in the built environment [4]. Since then, the UAE has invested in various research and development programs, national schemes, and regulations to improve building design, performance, and operations. Mandating the design of built environments in line with the local green building certifications is one such measure. According to Odriguez-Ubinas et al., buildings complying with national regulatory certifications—such as Estidama in Abu Dhabi, Al Sa’fat in Dubai, and Barjeel in Ras-Al-Khaimah (RAK)—have proven to yield 30–40% long-term cost savings on utility bills compared to traditional buildings [5]. These certifications not only enforce stricter building performance metrics but also integrate indoor environmental quality (IEQ) requirements, including thermal comfort, as a key certification criterion. Green building rating systems such as LEED, Estidama, and Al Sa’fat mandate compliance with their IEQ requirements, which are aligned with internationally recognized thermal comfort standards such as ASHRAE Standard 55 and ISO 7730 [6,7,8].
Thermal comfort has evolved to be a critical component in measuring building IEQ, playing a vital role in the design and performance of energy-efficient buildings, particularly in the post-COVID era, to address the rising demand for healthier indoor environments and reduce various transmission risks. It reflects the occupants’ level of satisfaction with the thermal conditions in a space and is directly influenced by variables such as air temperature, humidity, air velocity, radiant temperature, metabolic rate, and clothing insulation. Universities and educational institutions now face amplified expectations for occupant well-being, driving the need for integrated retrofit strategies that balance health, comfort, and sustainability. The Fanger model of evaluating thermal comfort remains predominant when measuring levels of occupant comfort, utilizing two key indices: the Predicted Mean Vote (PMV) and the Predicted Percentage of Dissatisfied (PPD). PMV predicts the average thermal sensation of a set of people on a seven-point thermal scale ranging from −3 (cold) to +3 (hot), while the PPD estimates the proportion of individuals likely to feel thermally uncomfortable under those conditions [9,10]. According to the ASHRAE Standard 55 and ISO 7730, optimal comfort is achieved when PMV ranges are maintained between −0.5 and +0.5, while stabilizing PPD values below 10% [7,8,9,10].
While these design standards and guidelines offer a structured framework for evaluating occupant comfort, their direct applicability in hot-arid and semi-arid climates like those in the Middle East has been re-evaluated by several researchers. A review of regional thermal comfort studies reveals a noticeable divergence between predicted and actual occupant responses under local conditions. A study conducted by Al-ajmi et al. in 2010 analyzed thermal comfort conditions among 111 occupants of air-conditioned domestic buildings across Kuwait’s dry-desert climate and found that the optimum operative temperature based on Actual Mean Vote (AMV) was 25.20 °C, while the Predicted Mean Vote (PMV) indicated a lower neutral temperature of 23.30 °C [11]. Similarly, another study by Al-ajimi on thermal comfort in mosques in Kuwait, based on both physical measurements and occupant feedback, indicated a preferred neutral temperature of 26.10 °C, substantially higher than the 23.30 °C predicted by the PMV range [12]. This 2.80 °C discrepancy between the perceived and predicted ranges depicted the limitations of conventional comfort models when applied to culturally and climatically distinct contexts. This discrepancy suggests that Fanger’s thermal comfort model, as adopted in ISO 7730 and ASHRAE 55, may not fully capture real comfort responses in arid environments, potentially underestimating what occupants actually find acceptable [12]. As such, a number of regional studies in the Middle Eastern region revolve around developing adaptive thermal comfort models and design guidelines that are not directly equated with international codes but are tailored to better reflect the region’s specific climatic context and occupant behavior.
Further evidence supporting the need for regionally adapted models is provided by Elnaklah et al., who in 2021 investigated 31 air-conditioned buildings in four Middle Eastern countries involving over 1100 occupants. The findings of this study revealed that despite 58% of indoor measurements falling within ASHRAE 55 and ISO 7730 comfort ranges, only 40% of occupants reported feeling thermally satisfied. Notably, 94% of cases exhibited a mismatch between PMV predictions and actual thermal sensation votes, with many occupants feeling cold despite model projections indicating slight overheating. These findings suggest a fundamental disconnect between standard comfort models and perceived experience in the Middle Eastern region, highlighting the need for adaptive comfort approaches that better reflect the regional climate, as well as occupant behavior and cultural practices [6].
Moreover, regional studies have emphasized the influence of clothing insulation, which varies significantly due to cultural dress norms. Existing research in Middle Eastern buildings has reported average clothing insulation values ranging from 0.75 to 1.20 clo, with a mean value around 0.9 clo, which is found to be considerably higher than the assumptions typically used in PMV-based assessments [12].
A growing number of local Green Building Codes (GBCs) have begun to acknowledge these contextual distinctions. Out of fifteen countries in the Middle East, eight have established local GBCs that incorporate ASHRAE 55 and ISO 7730 compliance. These include systems such as Estidama Pearl Building Rating System (based in the UAE), Global Sustainability Assessment System, GSAS (from Qatar), and Mostadam (from Saudi Arabia) [6]. Common elements among these GBCs include requirements for occupant thermal control, zoning, operable windows, and sensor controls. GSAS mandates the post-occupancy thermal comfort surveys, while both GSAS and Mostadam require thermal comfort modelling at the design stage. This illustrates a regional trend toward integrating international best practices while adapting them to local expectations [6,13,14].
Additionally, adaptive comfort research has demonstrated the potential for energy savings when thermal comfort benchmarks are regionally recalibrated. Elnaklah et al. found that increasing indoor temperatures in offices in Amman and Doha by 2.30 °C and 4.10 °C, respectively, resulted in annual cooling energy reductions of 20% and 13%, respectively. These findings reinforce the dual benefit of tailoring thermal comfort standards to actual occupant preferences, not only enhancing occupant comfort and wellbeing but also improving energy efficiency [6].
One way of addressing the need for such performance improvements in buildings is through innovative technologies such as digital twin (DT) development. DT technology addresses this challenge by enabling the creation of virtual models that mirror the physical characteristics and real-time performance of buildings. This technology offers a comprehensive approach to modelling energy-efficient buildings by simulating real-world performance and predicting energy consumption patterns. The concept of DT, first proposed by Professor Grieve at the University of Michigan in 2003, involves constructing a digital replica of a physical entity, with continuous interaction between the real and virtual worlds to optimize performance [15]. Digital twins therefore provide a dynamic digital representation of a building’s lifecycle, integrating real-time data to track energy usage, thermal performance, building systems interactions, and project renewable energy generation. This enables early-stage prediction of building performance from design through construction and into the operational stage, making it more efficient and cost-effective for designers and various stakeholders to undertake informed decisions in sustainable building design and operations.
A study conducted by Sun et al. highlighted the effectiveness of DT technology in evaluating the impact of photovoltaic solar module configuration angles on building energy consumption [16]. The study revealed that DT technology provided more accurate energy consumption predictions compared to traditional methods like real-time monitoring of similar buildings and Building Information Modelling (BIM). These insights demonstrate the transformative potential of digital twins in achieving energy-efficient and sustainable building designs, aligning with global decarbonization efforts.
Energy consumption of buildings in Arab countries has been found to have steadily increased over the past 25 years, based on a recent study by M Krarti [17]. The research projected that if the rising trend in Energy Use Intensity (EUI) persists within Arab countries, building energy consumption will reach 1450 TWh by 2030, which would be twice the EUI levels recorded in 2006, and could escalate further to 2000 TWh by 2050, which would be twice the EUI levels recorded in 2015 [17]. Moreover, the government has realized that the prime hurdle in combating this EUI rise lies in the region’s older building stock, constructed before 2001, lacking energy-efficient systems, energy monitoring, or thermal insulation, for which mandatory retrofitting incentives were launched [18]. According to research conducted by Alkhateeb et al., it was found that applying feasible retrofitting measures to an old federal building in RAK, such as U-value optimization, chiller Coefficient Of Performance (COP) optimization, and integration of rooftop PV panels, can yield a 63.2% savings in energy consumption [3]. In 2023, the Dubai Supreme Council of Energy (DSCE) reframed its Building Retrofit Programme to align with the Dubai Net Zero Carbon Emissions Strategy 2050. Since the programme’s launch in 2015, roughly 8000 buildings, including 7791 government-owned facilities, have been retrofitted, targeting improvements in air-conditioning systems, lighting, building envelope performances, and rooftop solar installations. As part of the programme, DSCE aims to scale up to 30,000 retrofitted buildings by 2030, leading to projected savings of 1.4 TWh of electricity, and offsetting over 1 million tonnes of CO2 emissions [18,19,20]. Similarly, in Abu Dhabi, the Department of Energy (DoE) reported that retrofit projects in 2024 delivered around 185 GWh of energy savings, with plans to retrofit 200 buildings in 2025, and 300 buildings by 2026 as part of an ambition to drive a ten-fold rise in retrofitted assets under the Emirate’s Demand Side Management (DSM) Strategy 2030 [21]. The Dubai Chamber of Commerce building, having a GFA of 226,042 sq.ft., was able to achieve a LEED Platinum certificate in 2009 by reducing its energy use by nearly 47% [22]. Another remarkable study by the Dubai International Financial Centre (DIFC) in Dubai revealed that as part of a retrofit and sustainability initiative in 2023, the iconic building received a LEED Platinum certification backed by energy-efficient HVAC systems, LED lighting and controls, and solar PV integration, contributing to overall savings of 0.5 million kWh per year [23].
A wide array of retrofit measures can therefore be implemented, using passive, active, and behavioral change strategies. This paper specifically examines the effects of implementing various passive and active retrofitting measures on the case study building assessed within the research. Passive retrofitting strategies generally have a greater impact on reducing the space heating or cooling energy demands, while futureproofing the buildings from projected climate change impacts. Hanan M. Taleb’s research on residential buildings in the UAE revealed that passive strategies alone could reduce cooling loads by 23.60% [24,25]. The research also observed that active measures such as optimizing cooling or heating set points are highly effective in cutting energy usage without any upfront costs [24]. A market survey conducted by the EGBC states that the biggest challenges to retrofits in the UAE are the lack of financial incentives and low tariff rates, resulting in long paybacks and high capital costs that lead to a lack of interest from building stakeholders [18,26].
Although green building certification systems aim to promote energy efficiency and thermal comfort, there is a noticeable difference between the expected energy performance during the design phase and the actual energy use once the building is operational. This difference, known as the ‘performance gap’ in the existing literature, has been studied by many researchers. Studies have shown that commercial buildings can emit up to 3.8 times more carbon than predicted during the design stage, despite having a green building certification [27]. A study by Wilde that evaluated multiple certified buildings to identify their performance gaps revealed that while most LEED-certified buildings demonstrated 18–39% energy savings during the design stage, their actual energy consumption during operational stages was found to be 28–35% more than conventional non-certified buildings [27].
While existing research focuses on retrofitting older, inefficient buildings, there is limited investigation into improving the energy performance of newer buildings that already meet local design codes and green certification requirements. These structures still have potential for further optimization through the implementation of additional energy-saving measures or the integration of renewable energy sources. This study addresses that gap by evaluating a recently constructed, LEED-certified building to determine how its energy performance can be further optimized beyond the existing standards.
Furthermore, the use of digital twin technology for newer, certified buildings has not been widely explored due to the challenges associated with developing highly accurate digital twins. To support this, a highly accurate and calibrated digital twin of the case study building was developed using Integrated Environment Software (IES), enabling detailed analysis of its current sustainability features and identification of performance gaps. The IES thermal model of the campus building was then used to quantify the benefits of its existing sustainable design features and subsequently explore ECMs to further optimize its energy performance. In addition to evaluating ECMs, this study also examines their impact on occupant thermal comfort using the digital twin. The analysis focused on key comfort indicators such as operative indoor temperatures, PMV, and PPD, in alignment with ASHRAE Standard 55. This dual approach helps identify retrofit strategies that optimize both energy performance and indoor comfort in academic buildings with long operational hours and varying occupancy levels.
The findings of this study further aim to enhance the operational performance of the campus, potentially leading to achieving higher levels of green building certification such as LEED Platinum, LEED Zero, or LEED for Operations and Maintenance (O + M), thereby benefiting the building occupants and owners.

2. Materials and Methods

2.1. Research Methodology Workflow

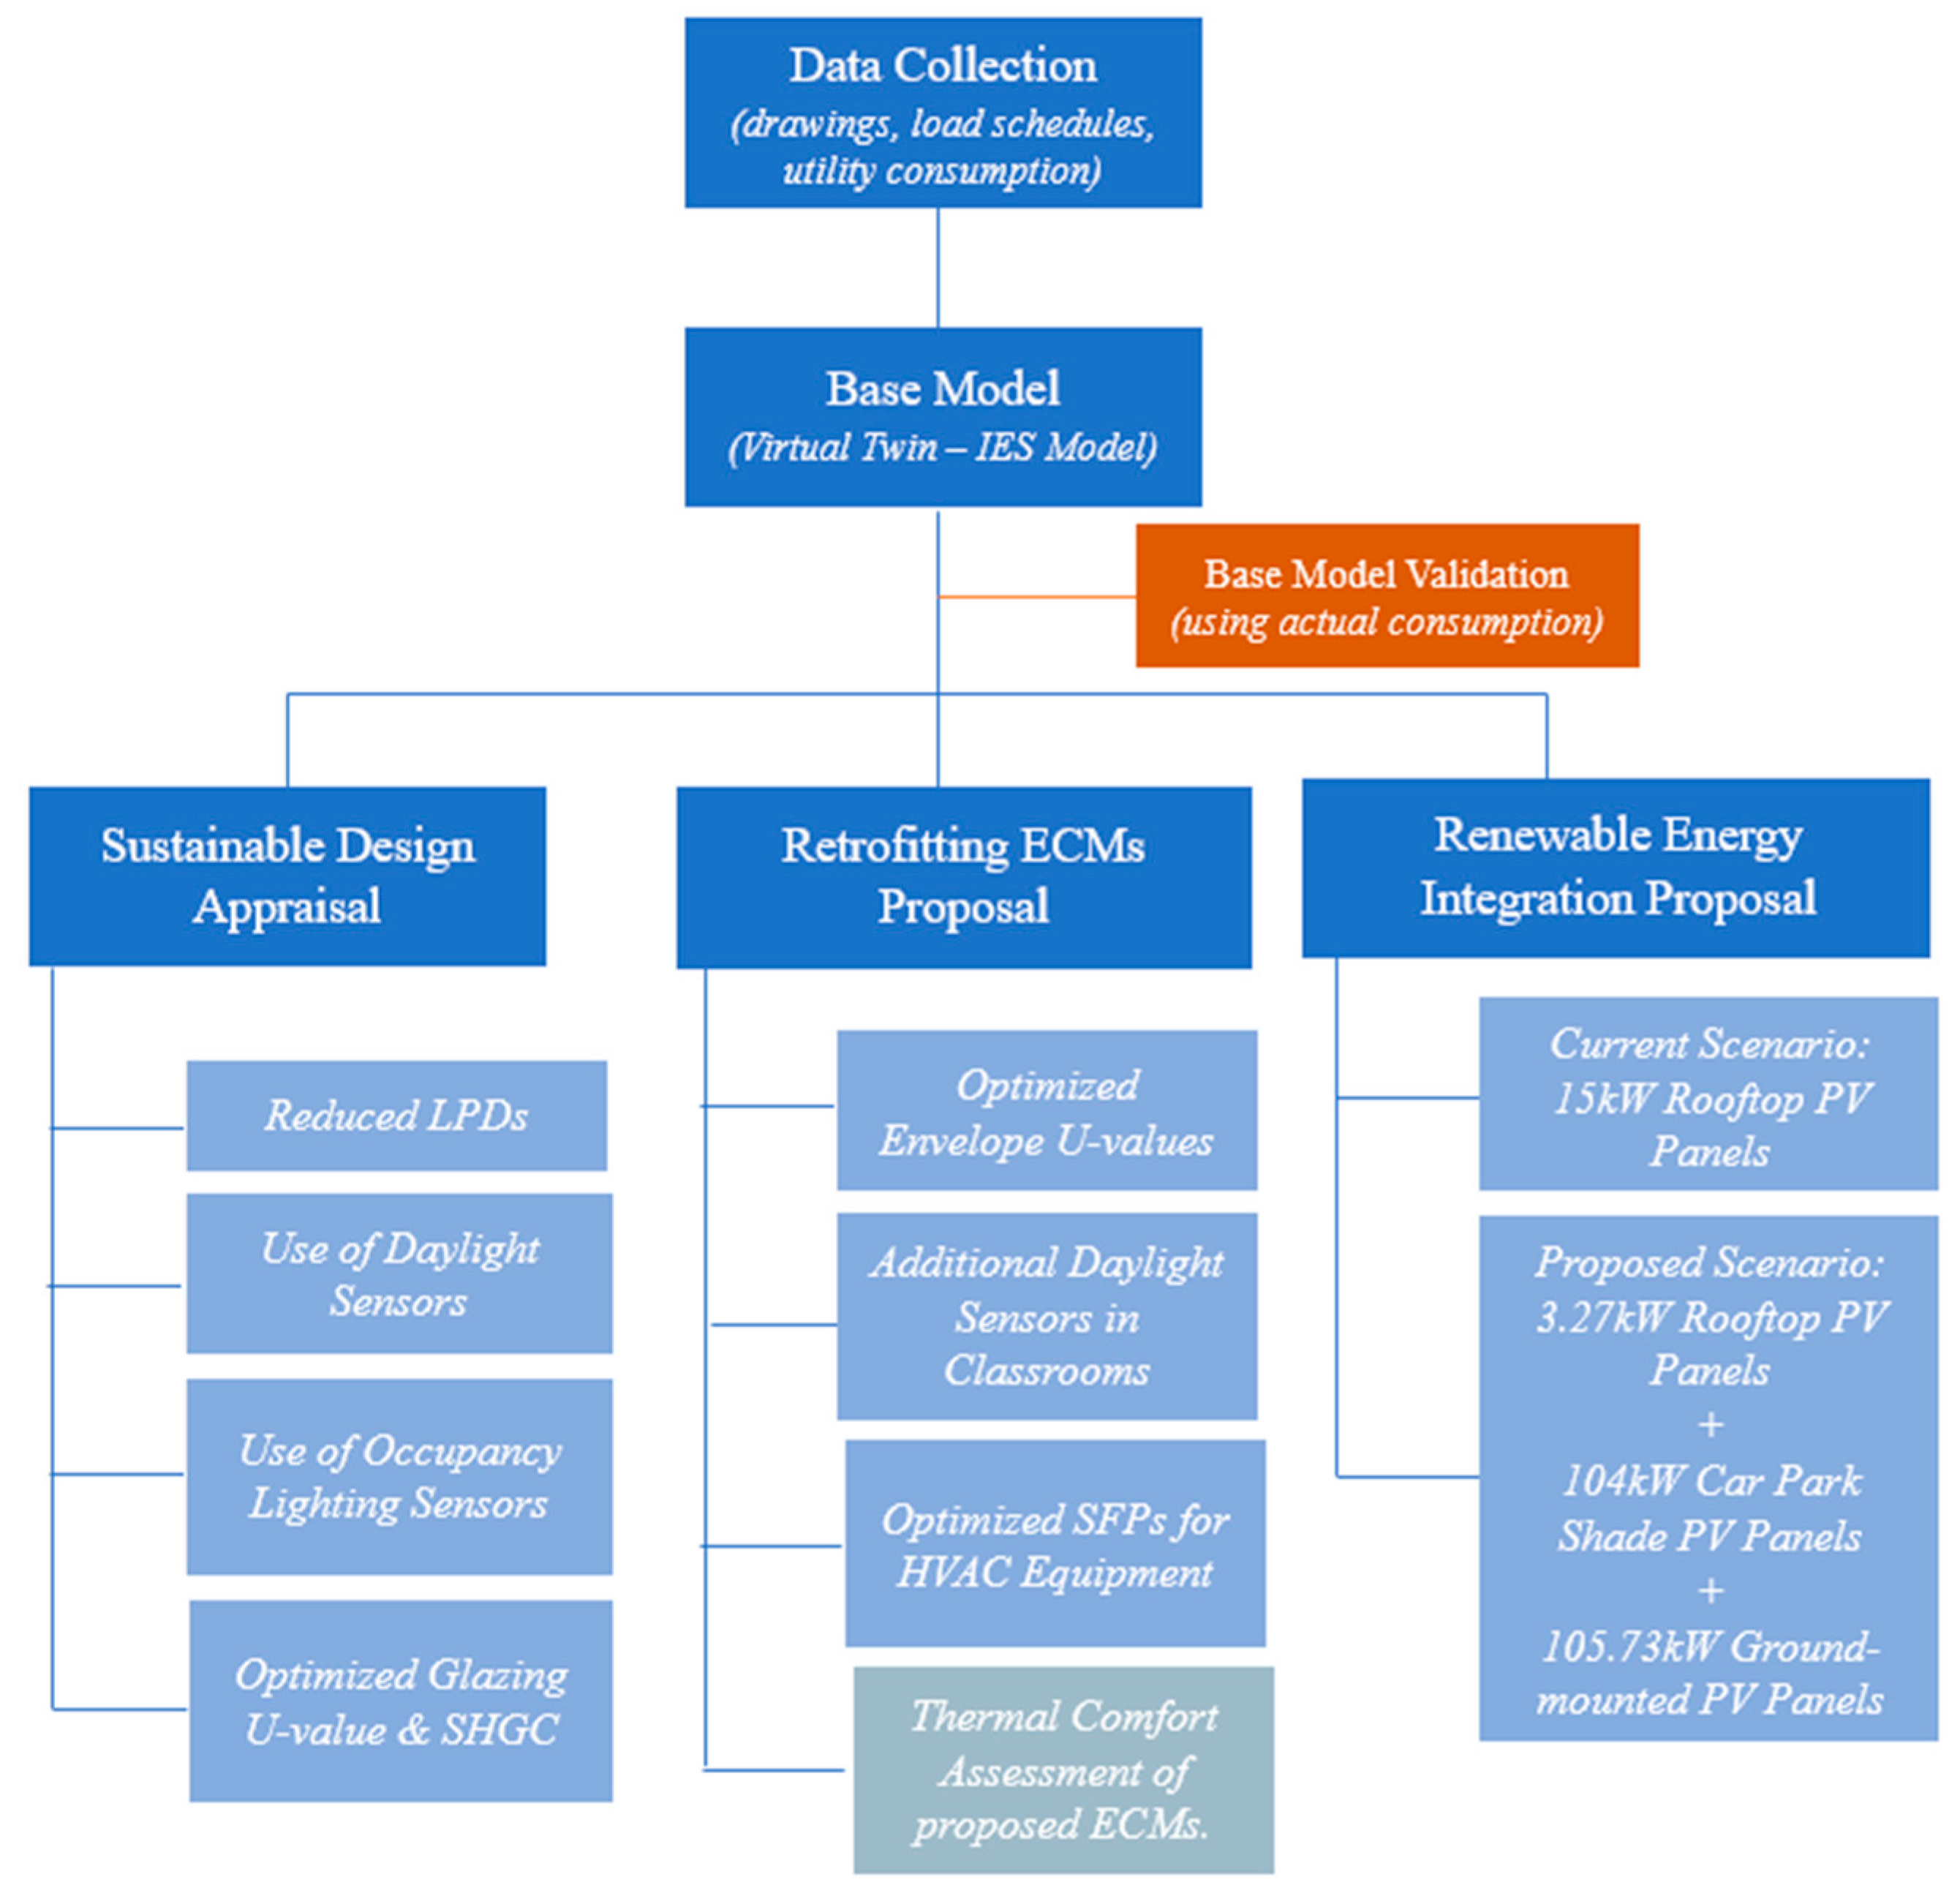
The scope of this research includes an energy audit and sustainability assessment of a LEED-certified university campus located in Dubai. This research quantifies the energy conservation benefits of the campus’s sustainable design and proposes energy retrofitting measures to further reduce its energy consumption, which can aid in achieving a higher rating of LEED certification, obtaining LEED O + M certification, and moving closer to attaining a Net Zero energy target. The research also evaluates the proposed ECMs in terms of their impact on thermal comfort, using PMV and PPD indices, to examine the correlation between energy savings and occupant comfort. This integrated assessment supports informed decision-making by identifying ECMs that offer optimal performance both in terms of energy efficiency and thermal comfort. Lastly, this research proposes the integration of renewable energy systems, using a solar PV plant to offset the energy consumption of the building and mitigate resulting carbon emissions. The foremost step in this research was data collection, which included the collection of architectural and building services drawings, HVAC schedules, operational details, and historic energy consumption data and meter readings. This research was performed using the commercially available IES energy modelling software (version 2021) by developing a digital twin of the campus building using the steps described in Section 2.3: IES Energy Modelling Methodology.
The methodology workflow undertaken for this research is illustrated in Figure 1.

2.2. Study Description: Mixed-Use University Building in Dubai

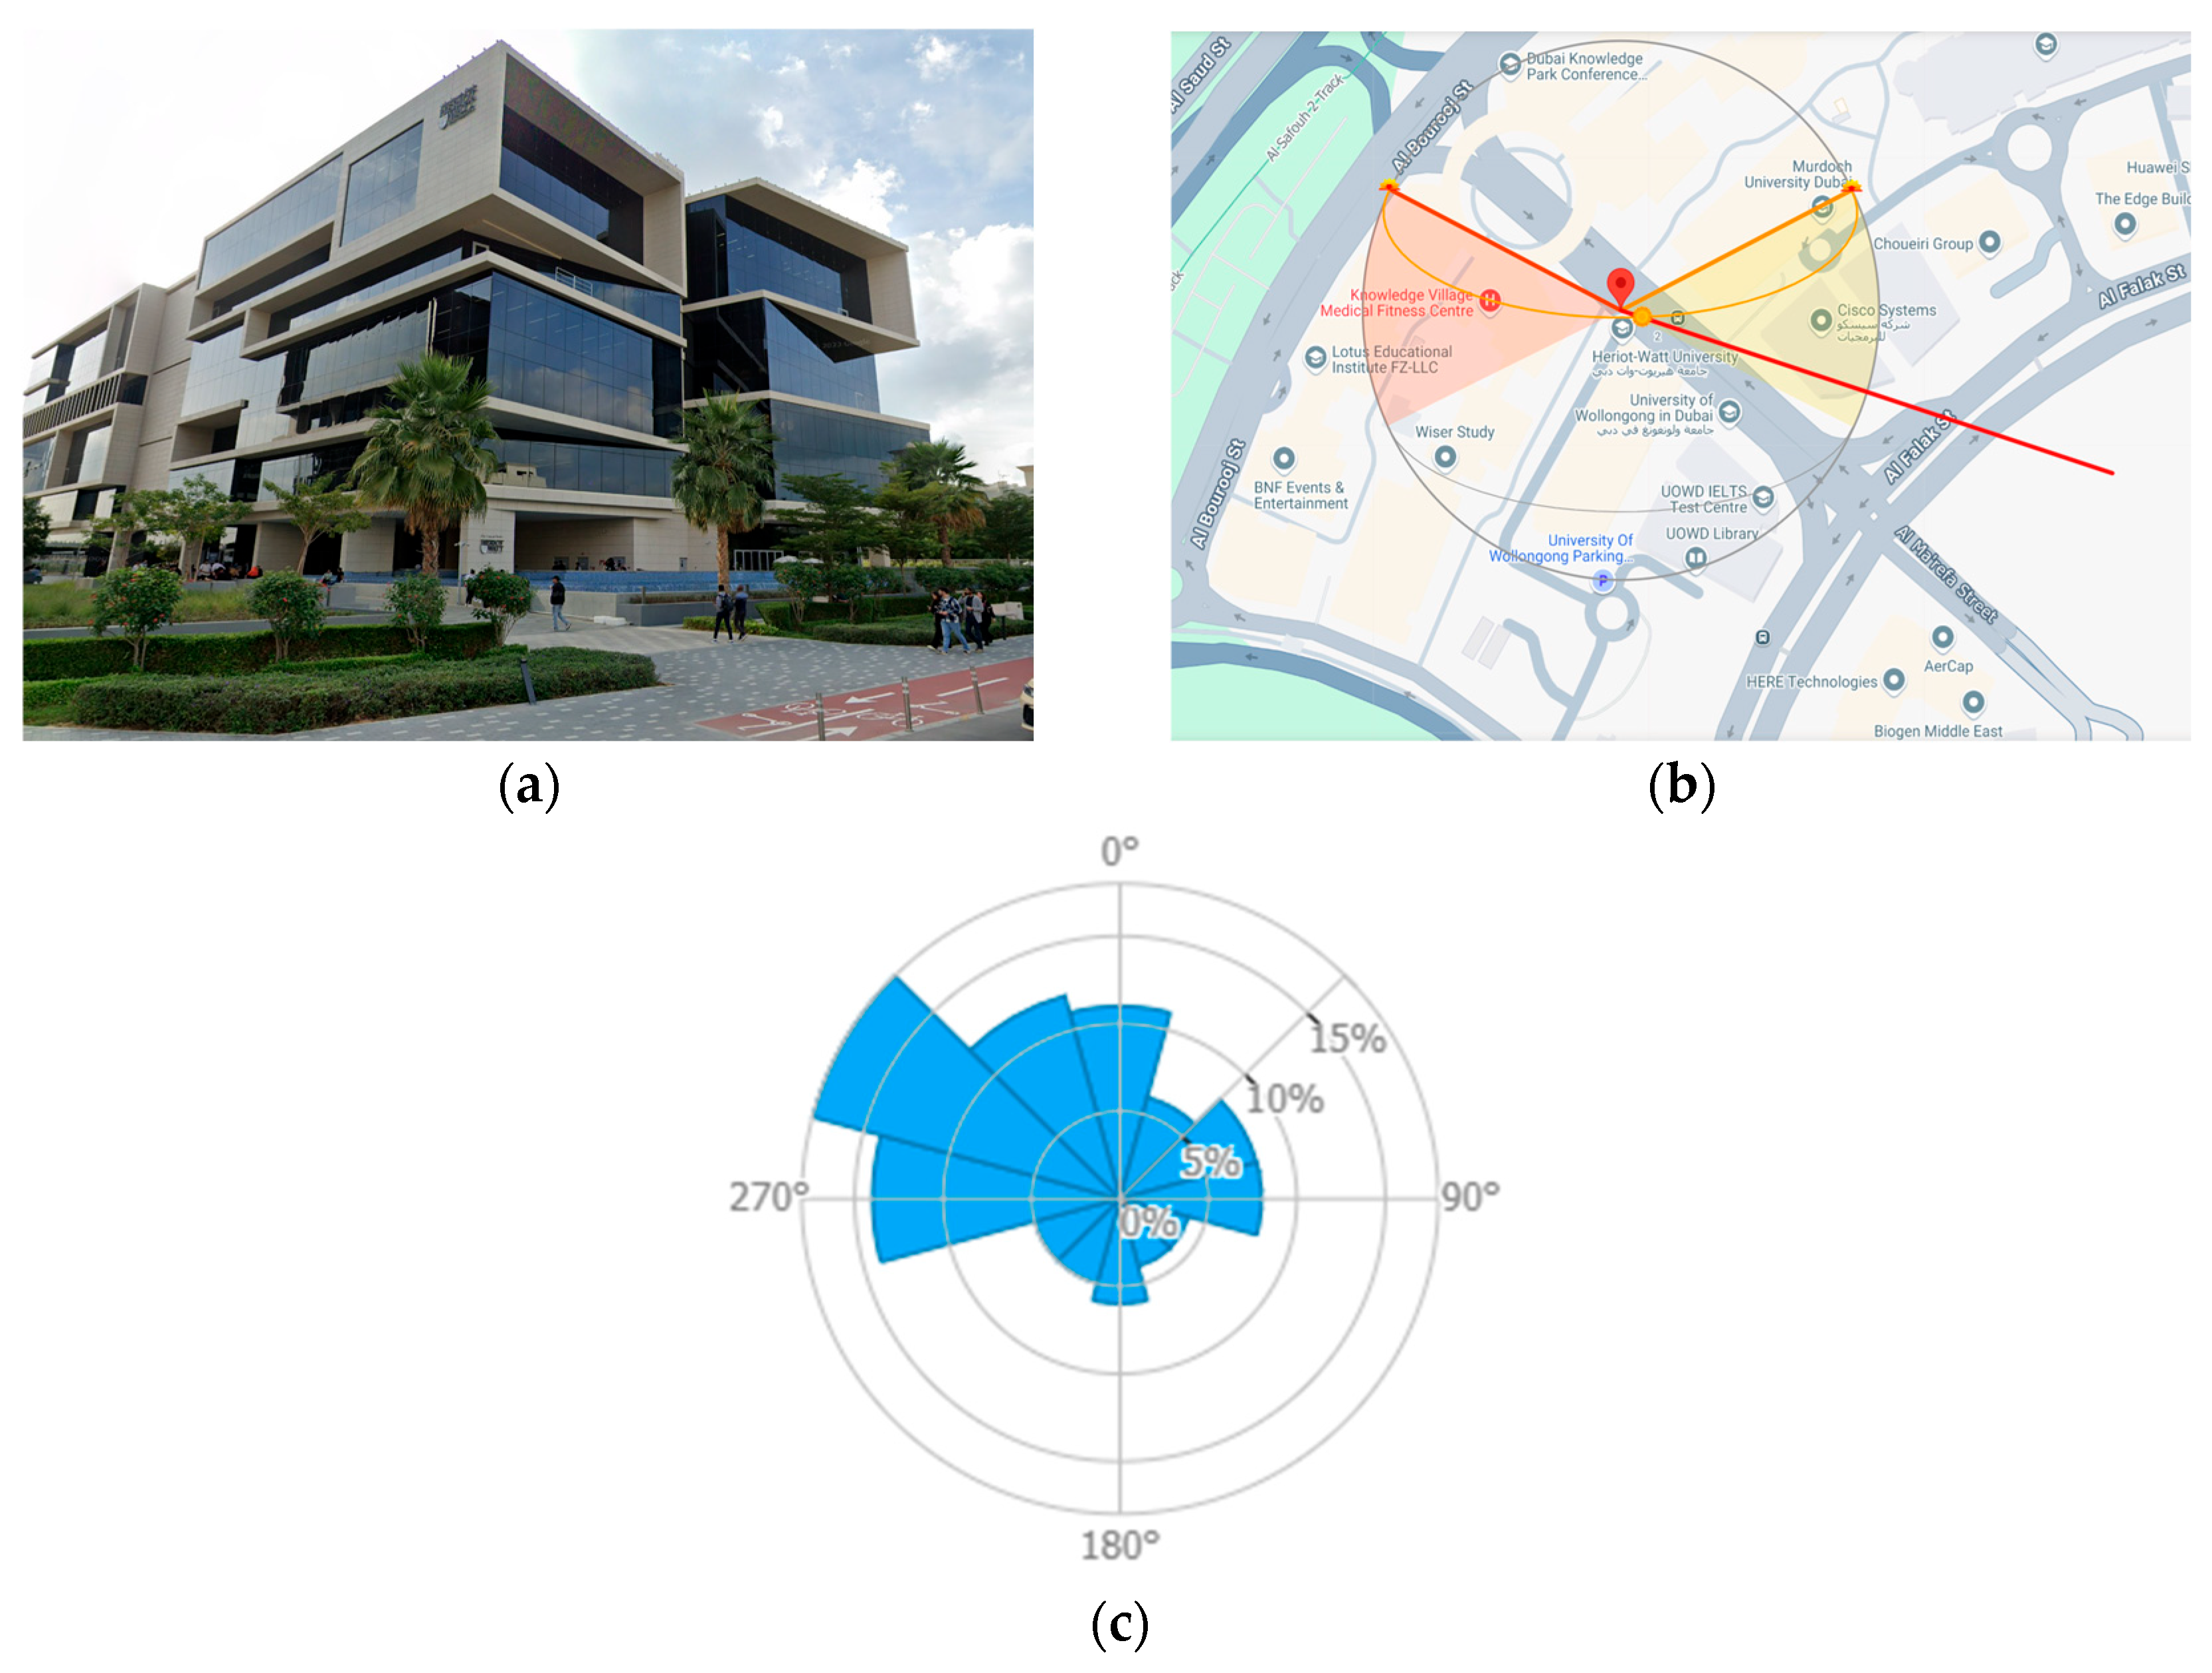
In 2021, the seven-story university campus was inaugurated in the Knowledge Park district of Dubai, spanning an area of 218,000 sq.ft. The site characteristics and location details are illustrated in Figure 2. The campus is a LEED-certified Gold-rated building. LEED, short for Leadership in Energy and Environmental Design, is a globally used green building certification system developed by the U.S. Green Building Council (USGBC). It assesses aspects of building environmental performance such as energy efficiency, water conservation, materials, sustainable site strategies, environmental stewardship, and indoor environmental quality, and rates the buildings into varying levels—such as Certified, Silver, Gold, or Platinum—showcasing their dedication to sustainability [28,29,30,31].
Key sustainable design features of the campus building included a 46% reduction in indoor water consumption, a 34% reduction in lighting power density (LPD), and a 30–40% waste diversion rate achieved through recycling facilities. Additionally, the campus’s strategic location within the existing infrastructure of Dubai and proximity to public transportation facilities and bikeable infrastructure further encourage the use of sustainable commuting options, reducing dependence on conventional fuel-powered vehicles [32].

2.3. Building Energy Modelling

Thermal modelling and performance analysis for this study were conducted using the commercially available IES Virtual Environment software (version 2021). This is a widely used industry standard for whole building performance simulation and complies with ASHRAE parameters and LEED certification guidelines [32]. The results of the IES thermal model were derived from the IES ApacheSim engine that applies the dynamic heat balance method to solve transient thermal behavior of each zone, based on sub-hourly timesteps. The core energy balance equation used is as below.
Qzone = ∑ Qconduction + ∑ Qcovection + ∑ Qradiation + Qinternal + QHVAC
where
  • Qconduction = Heat transfer through building envelope components (walls, roof, windows, floor).
  • Qconvection = Heat exchange between air and surfaces within the zone due to air movement.
  • Qradiation = Net radiative heat exchange between surfaces and solar gains from glazing elements.
  • Qinternal = Internal heat gains from occupants, lighting, and equipment.
  • QHVAC = Sensible and latent heat added or removed by the HVAC system to maintain desired thermal conditions.
  • QZone = Net rate of energy accumulated in the thermal zone.

2.3.1. Assigning Location and Weather File

The built-in ‘Dubai Intl Airport’ (ASHRAE Climate Zone: 1B) weather file to model real-world environmental conditions was used to represent local climatic conditions. Average maximum dry-bulb temperatures of 45.00 °C and wet-bulb temperatures of 23.50 °C were assigned as per the weather file.

2.3.2. Model Geometry Development

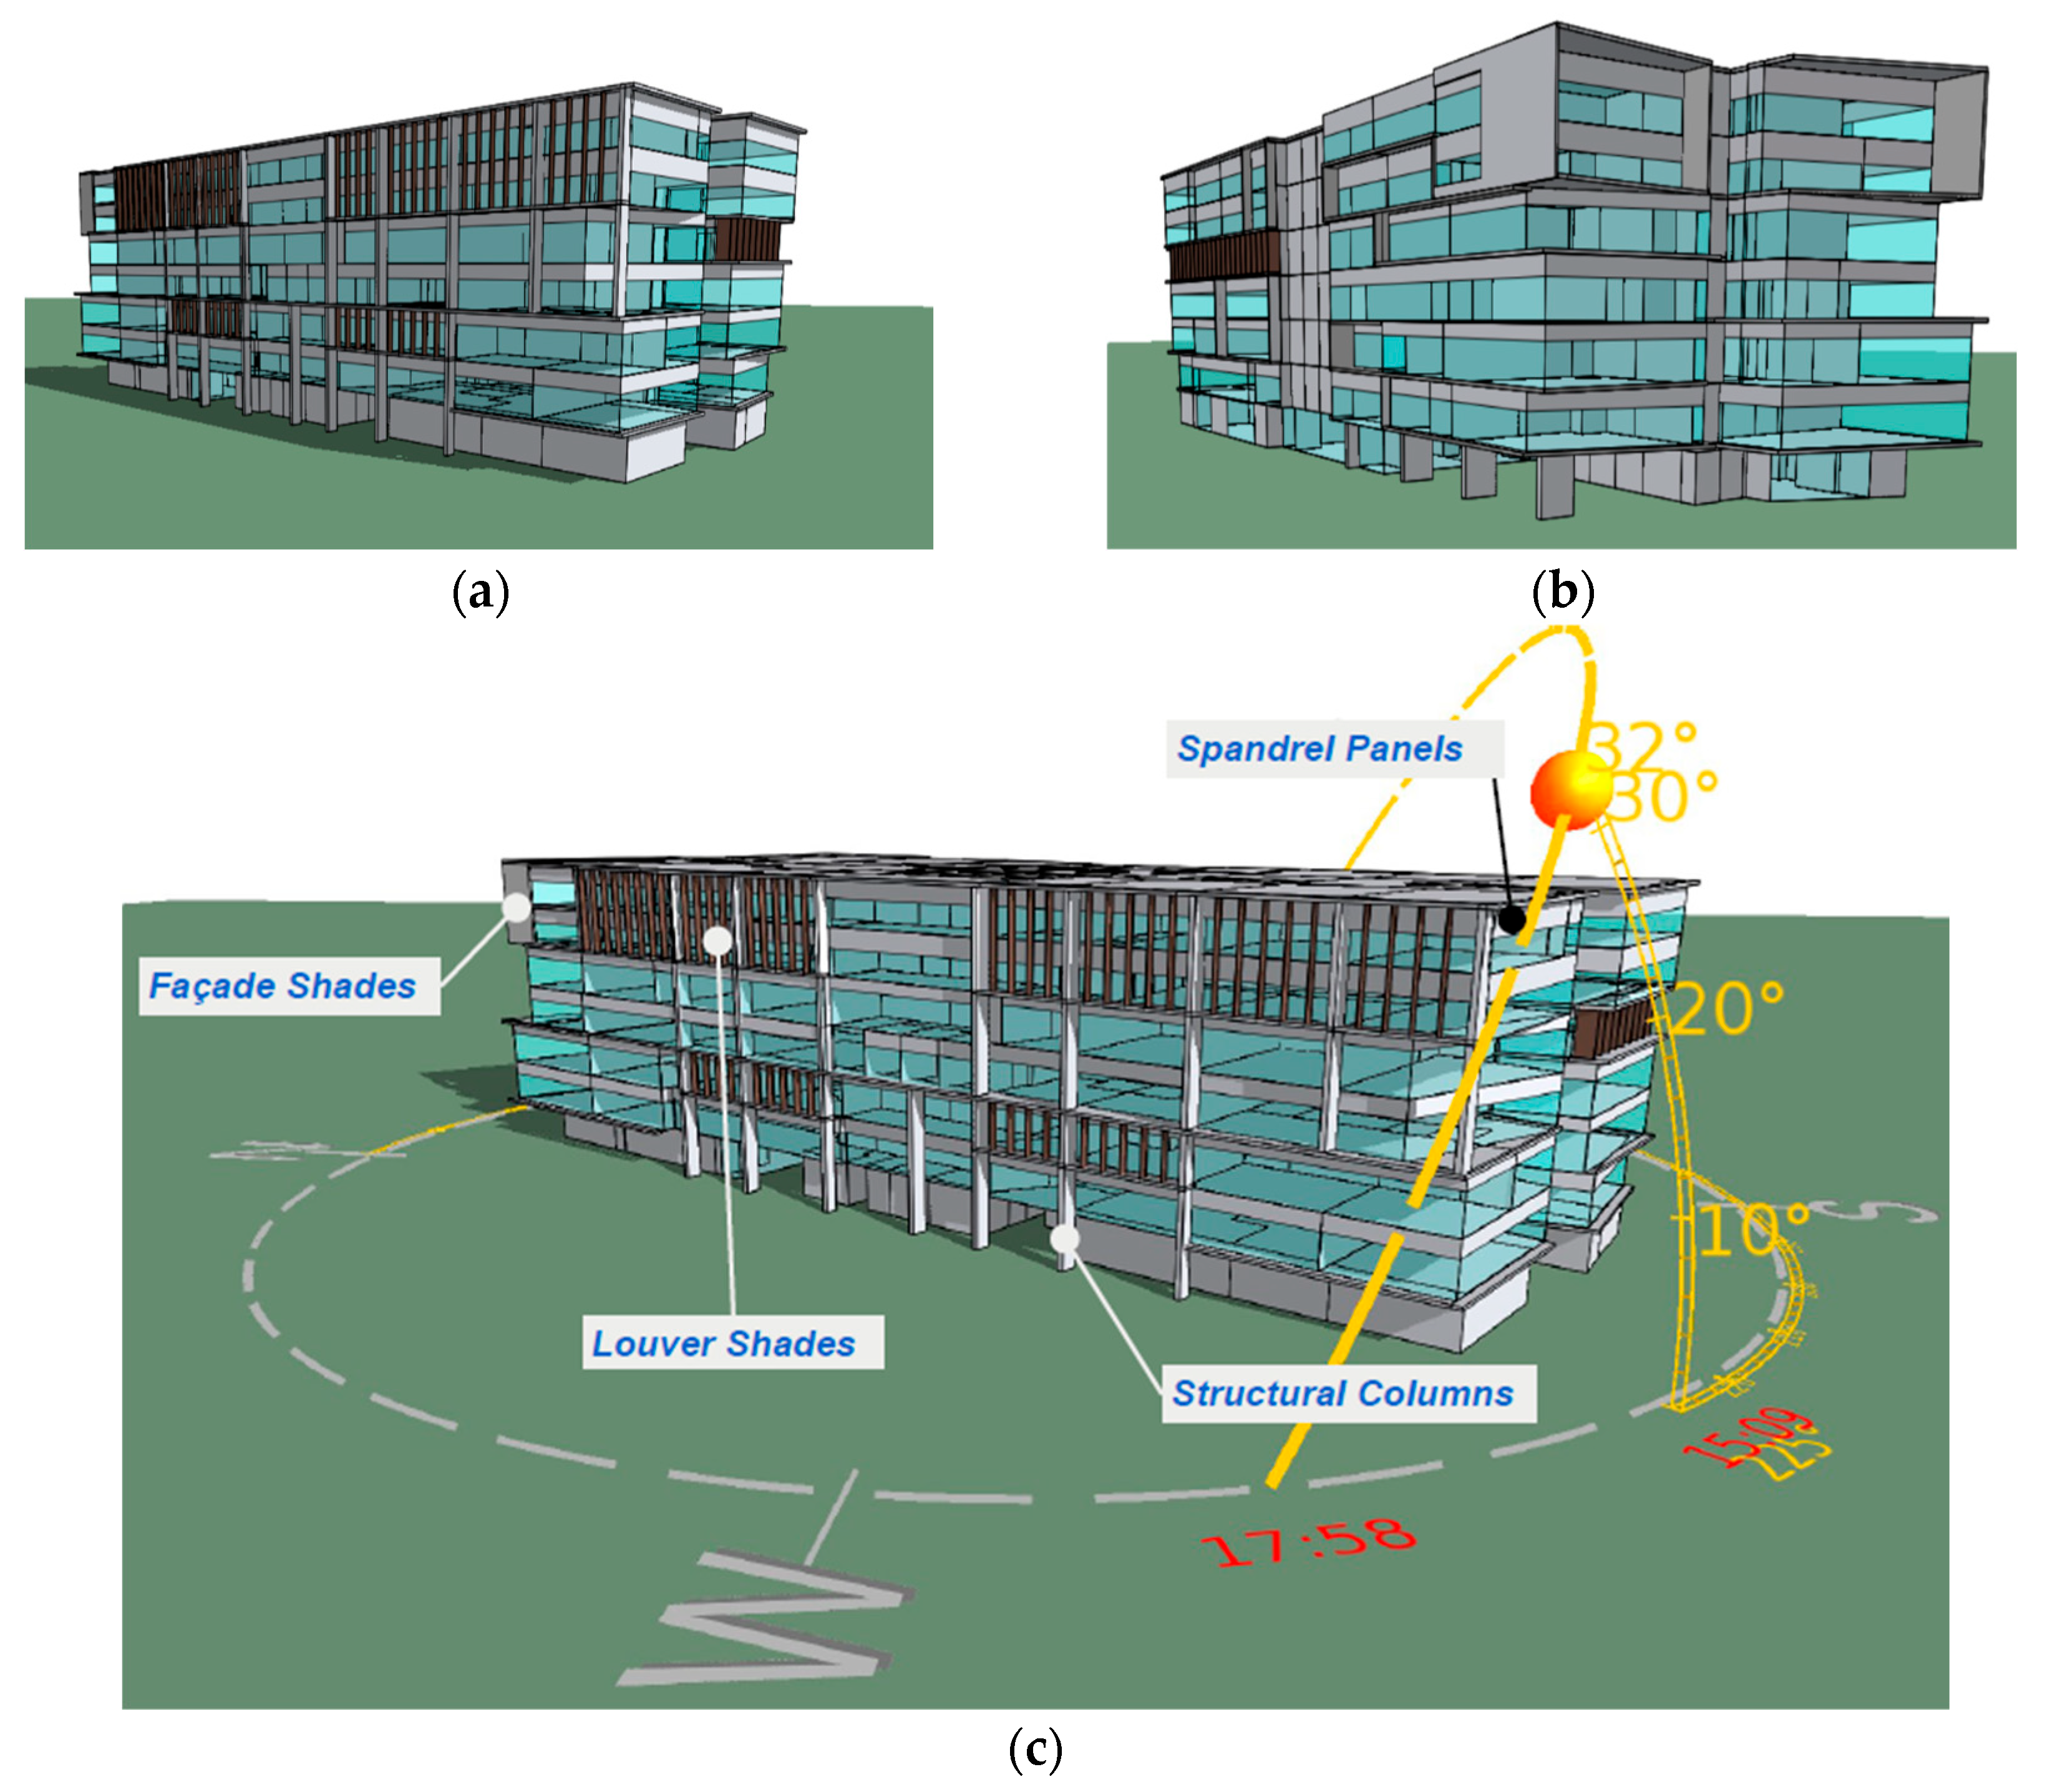
Model geometry was developed using the ModelIT interface of IES 2021 version ((Integrated Environmental Solutions Ltd., Capella Building, 7th Floor, 60 York Street, Glasgow, G2 8JX, United Kingdom) using as-built architectural drawings. Figure 3 and Figure 4 depict a comparison between the university building’s architectural design features as modelled in IES and real-life images taken on site.

2.3.3. Assigning Envelope U-Values

Envelope U-values were assigned as per Dubai Green Building Regulations (DGBR): 0.57 W/m2k for external walls, 0.30 W/m2k for roofs, and 0.30 W/m2k for ground floor slabs [33]. The glazing U-value of 1.36 W/m2k and SHGC of 0.17 were based on the manufacturer’s lab test data of installed materials.

2.3.4. Assigning ASHRAE Space Types and Boundary Conditions

Spaces in the IES model were assigned specific room types based on their functional use and occupancy patterns in line with ASHRAE 90.1-2010 standards, using the software’s space type library [34]. Each space was allocated default thermal zones and ventilation conditions to align with ASHRAE guidelines, ensuring industry-compliant simulation of spatial thermal characteristics.
Occupant gains and equipment power densities (EPDs) were set to default ASHRAE 90.1-2010 values. The LPD within the campus building was modelled with a 34.07% reduction compared to the ASHRAE 90.1-2010 guidelines, and an additional reduction was applied to account for lighting control strategies such as occupancy and lighting sensors incorporated within the campus’s default design, using control credit factors in line with ASHRAE 90.1-2010 guidelines [34,35]. Typical control factors for a university campus are 10% for classrooms, conference rooms, and libraries, and 5% for open office spaces. The adjusted LPD was calculated using the formula below.
Adjusted LPDzone = Baseline LPD × (1 − fcontrol)
where
  • fcontrol = lighting control factor, representing the fractional reduction in lighting energy use based on space type.
Table 1 depicts a consolidated summary of the thermal boundary conditions and input parameters used for the thermal model of the campus building.

2.3.5. Assigning Thermal Operating Profiles

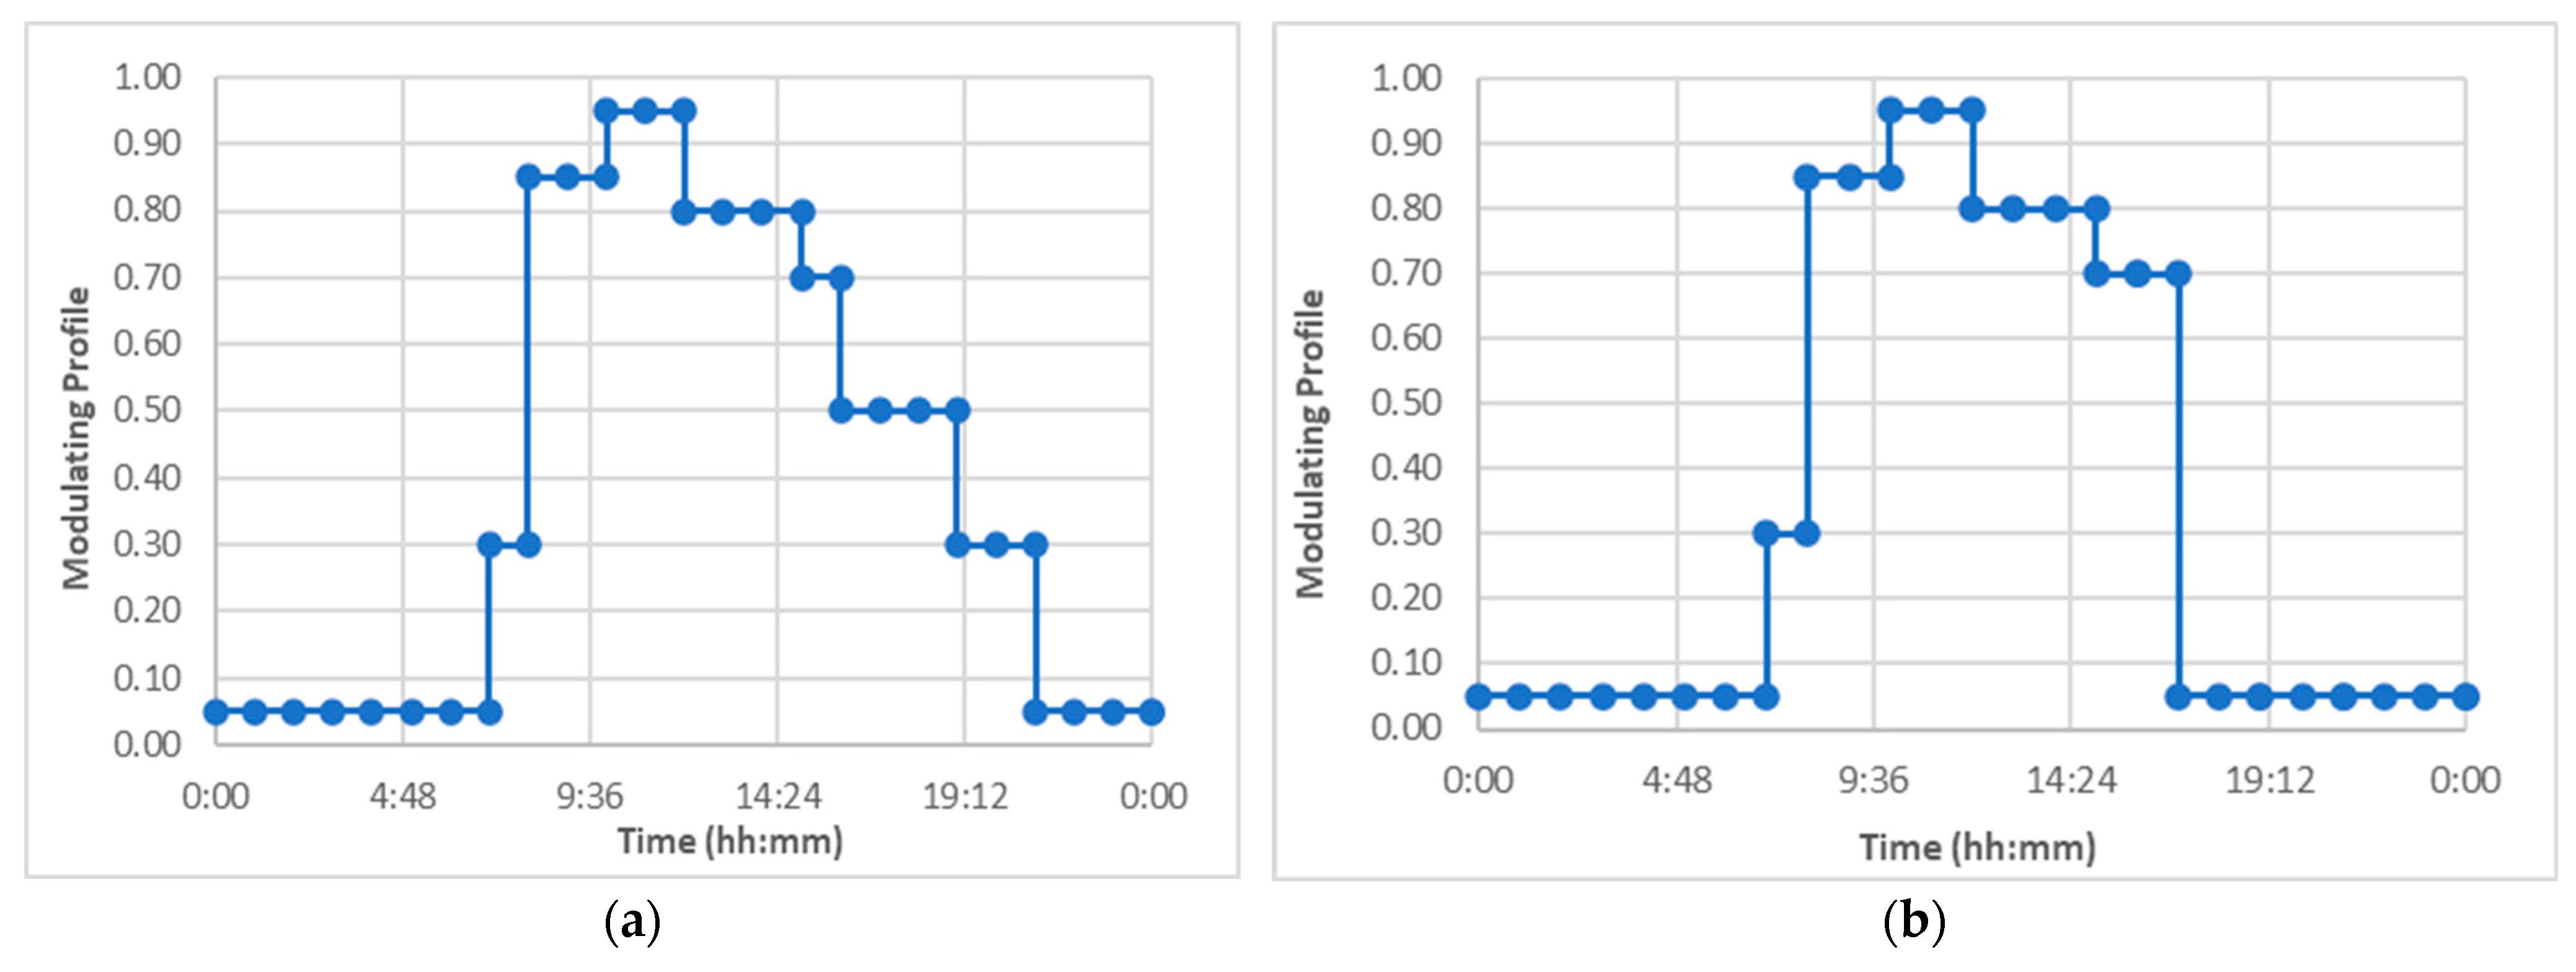
Interior gains were modelled to align with the operational hours of the campus, i.e., 9:00 a.m. to 10:00 p.m. on weekdays and 9:00 a.m. to 5:00 p.m. on weekends. The ground floor spaces and the library were set to operate throughout the week from 9:00 a.m. to 10:00 p.m. Figure 5 depicts the load profiles input into the thermal model on weekdays (a) and weekends (b).

2.3.6. Modelling HVAC Networks

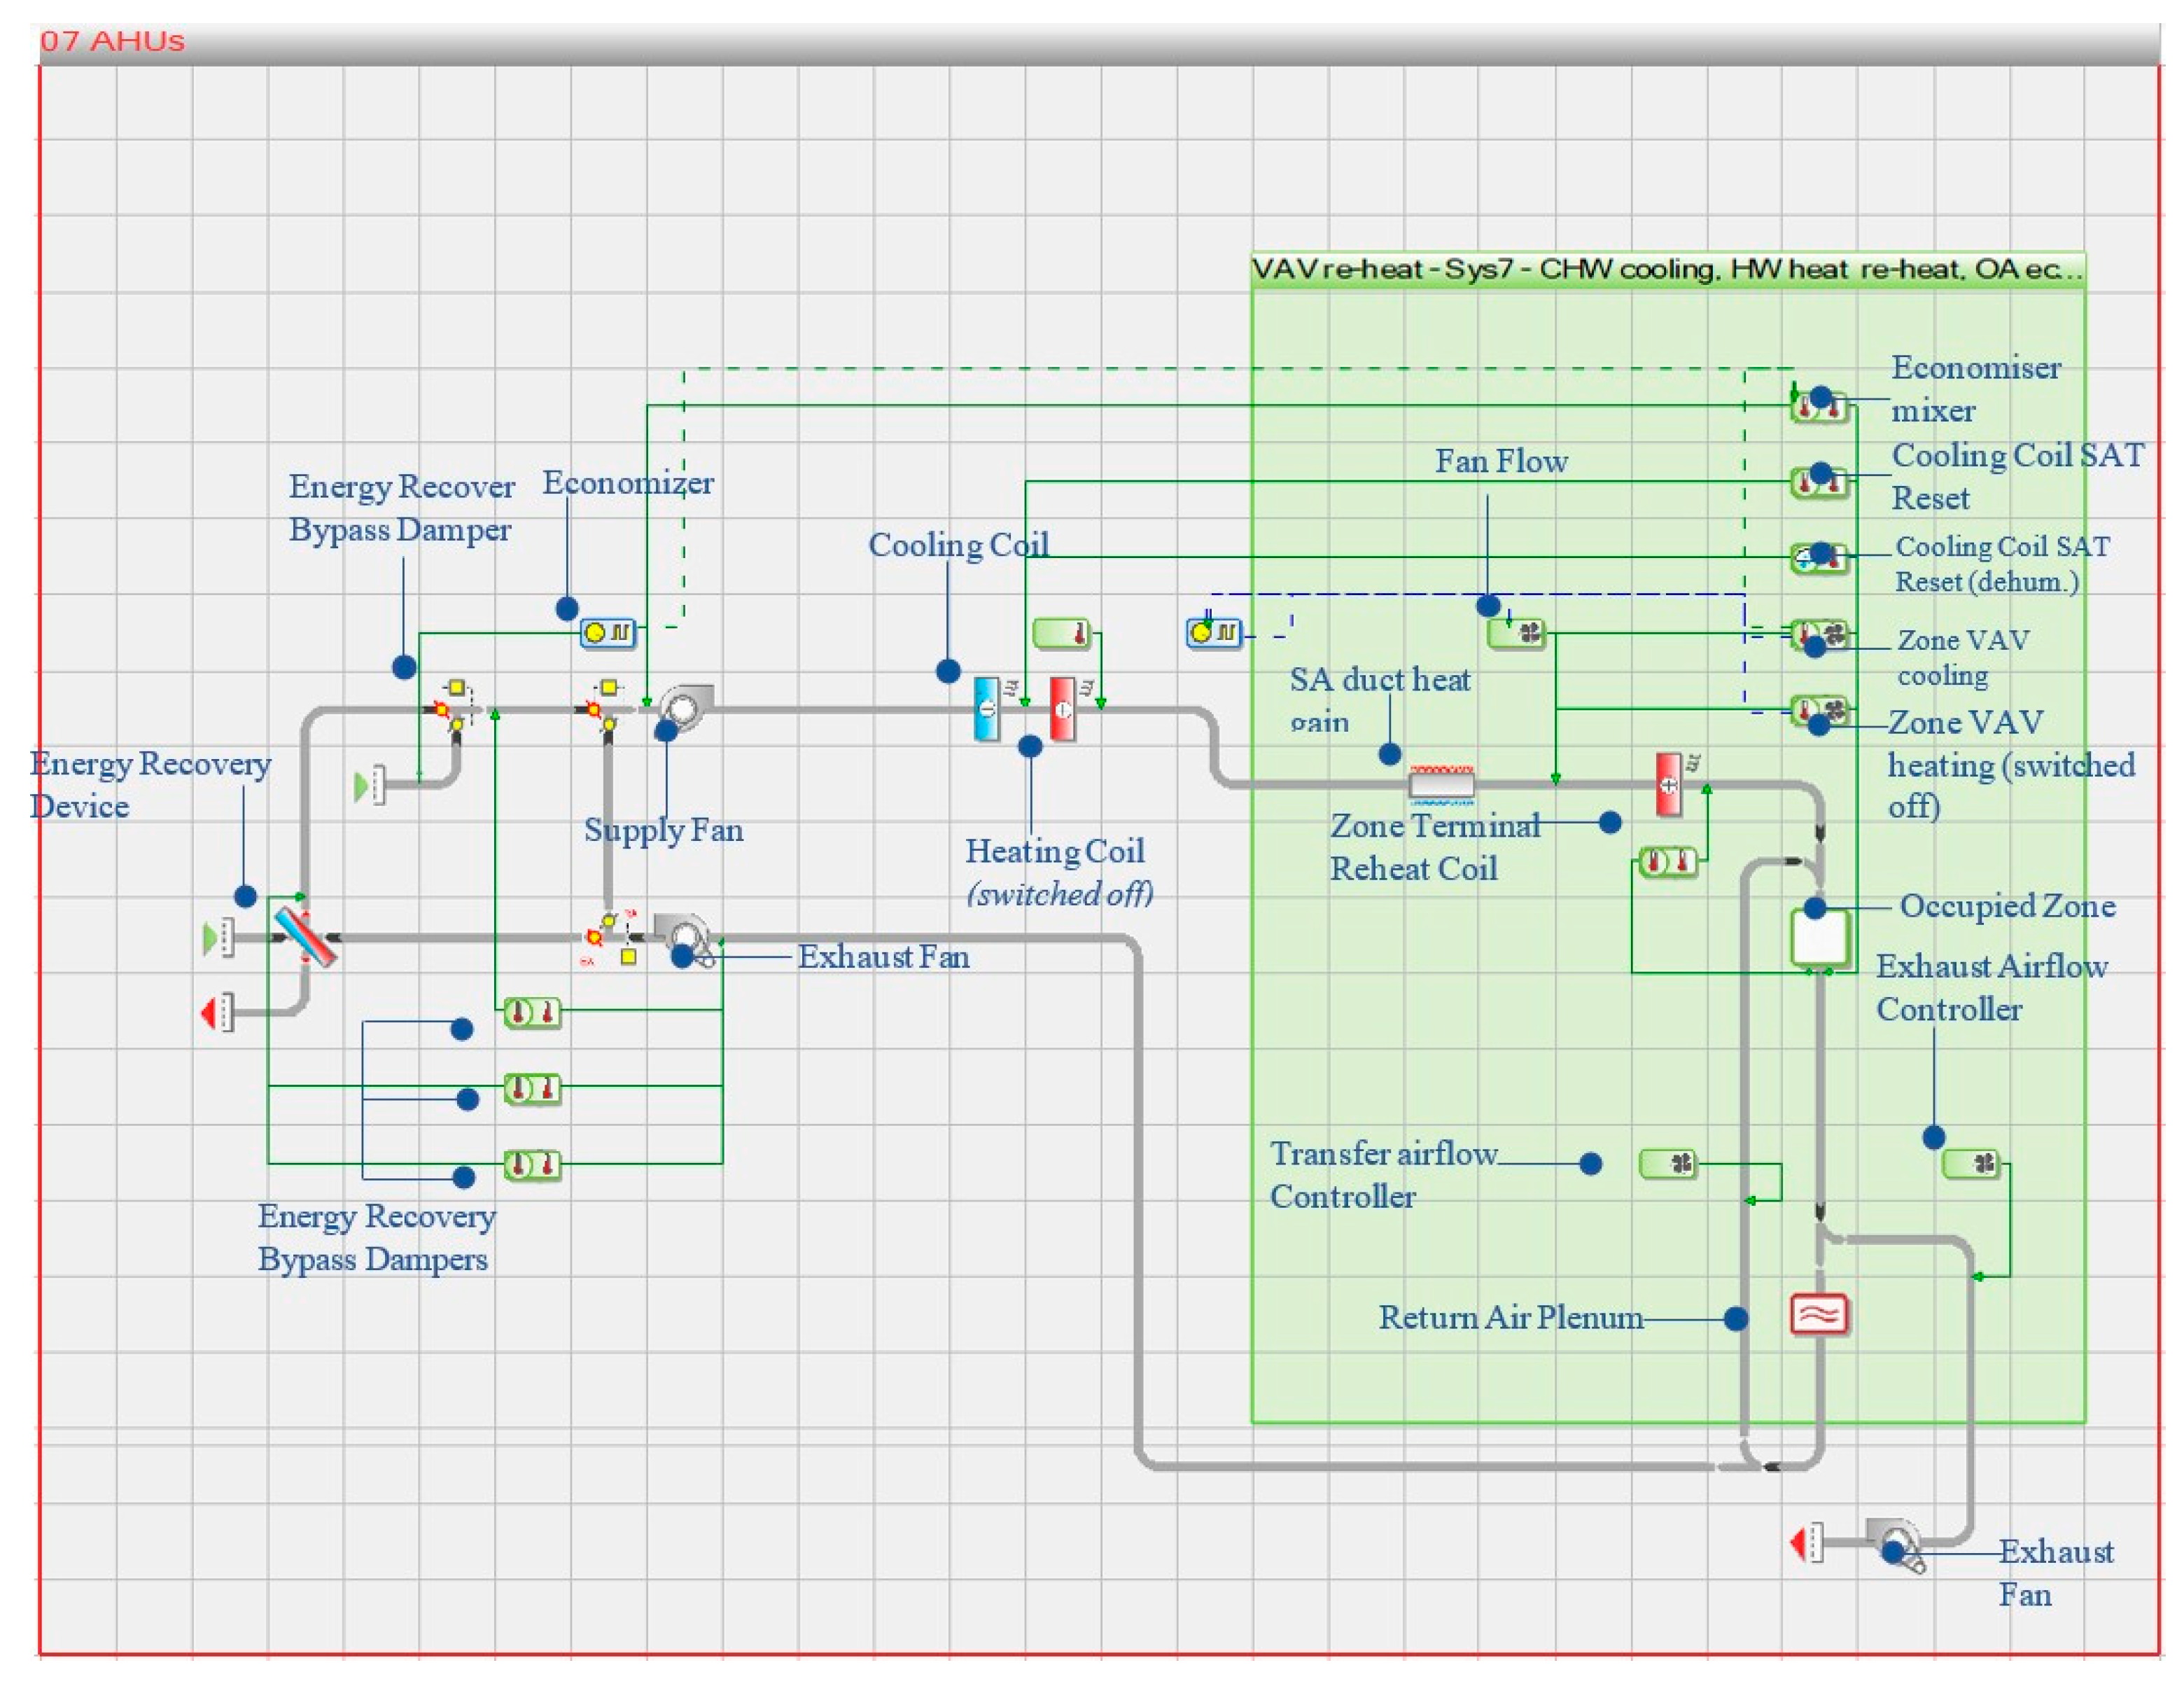
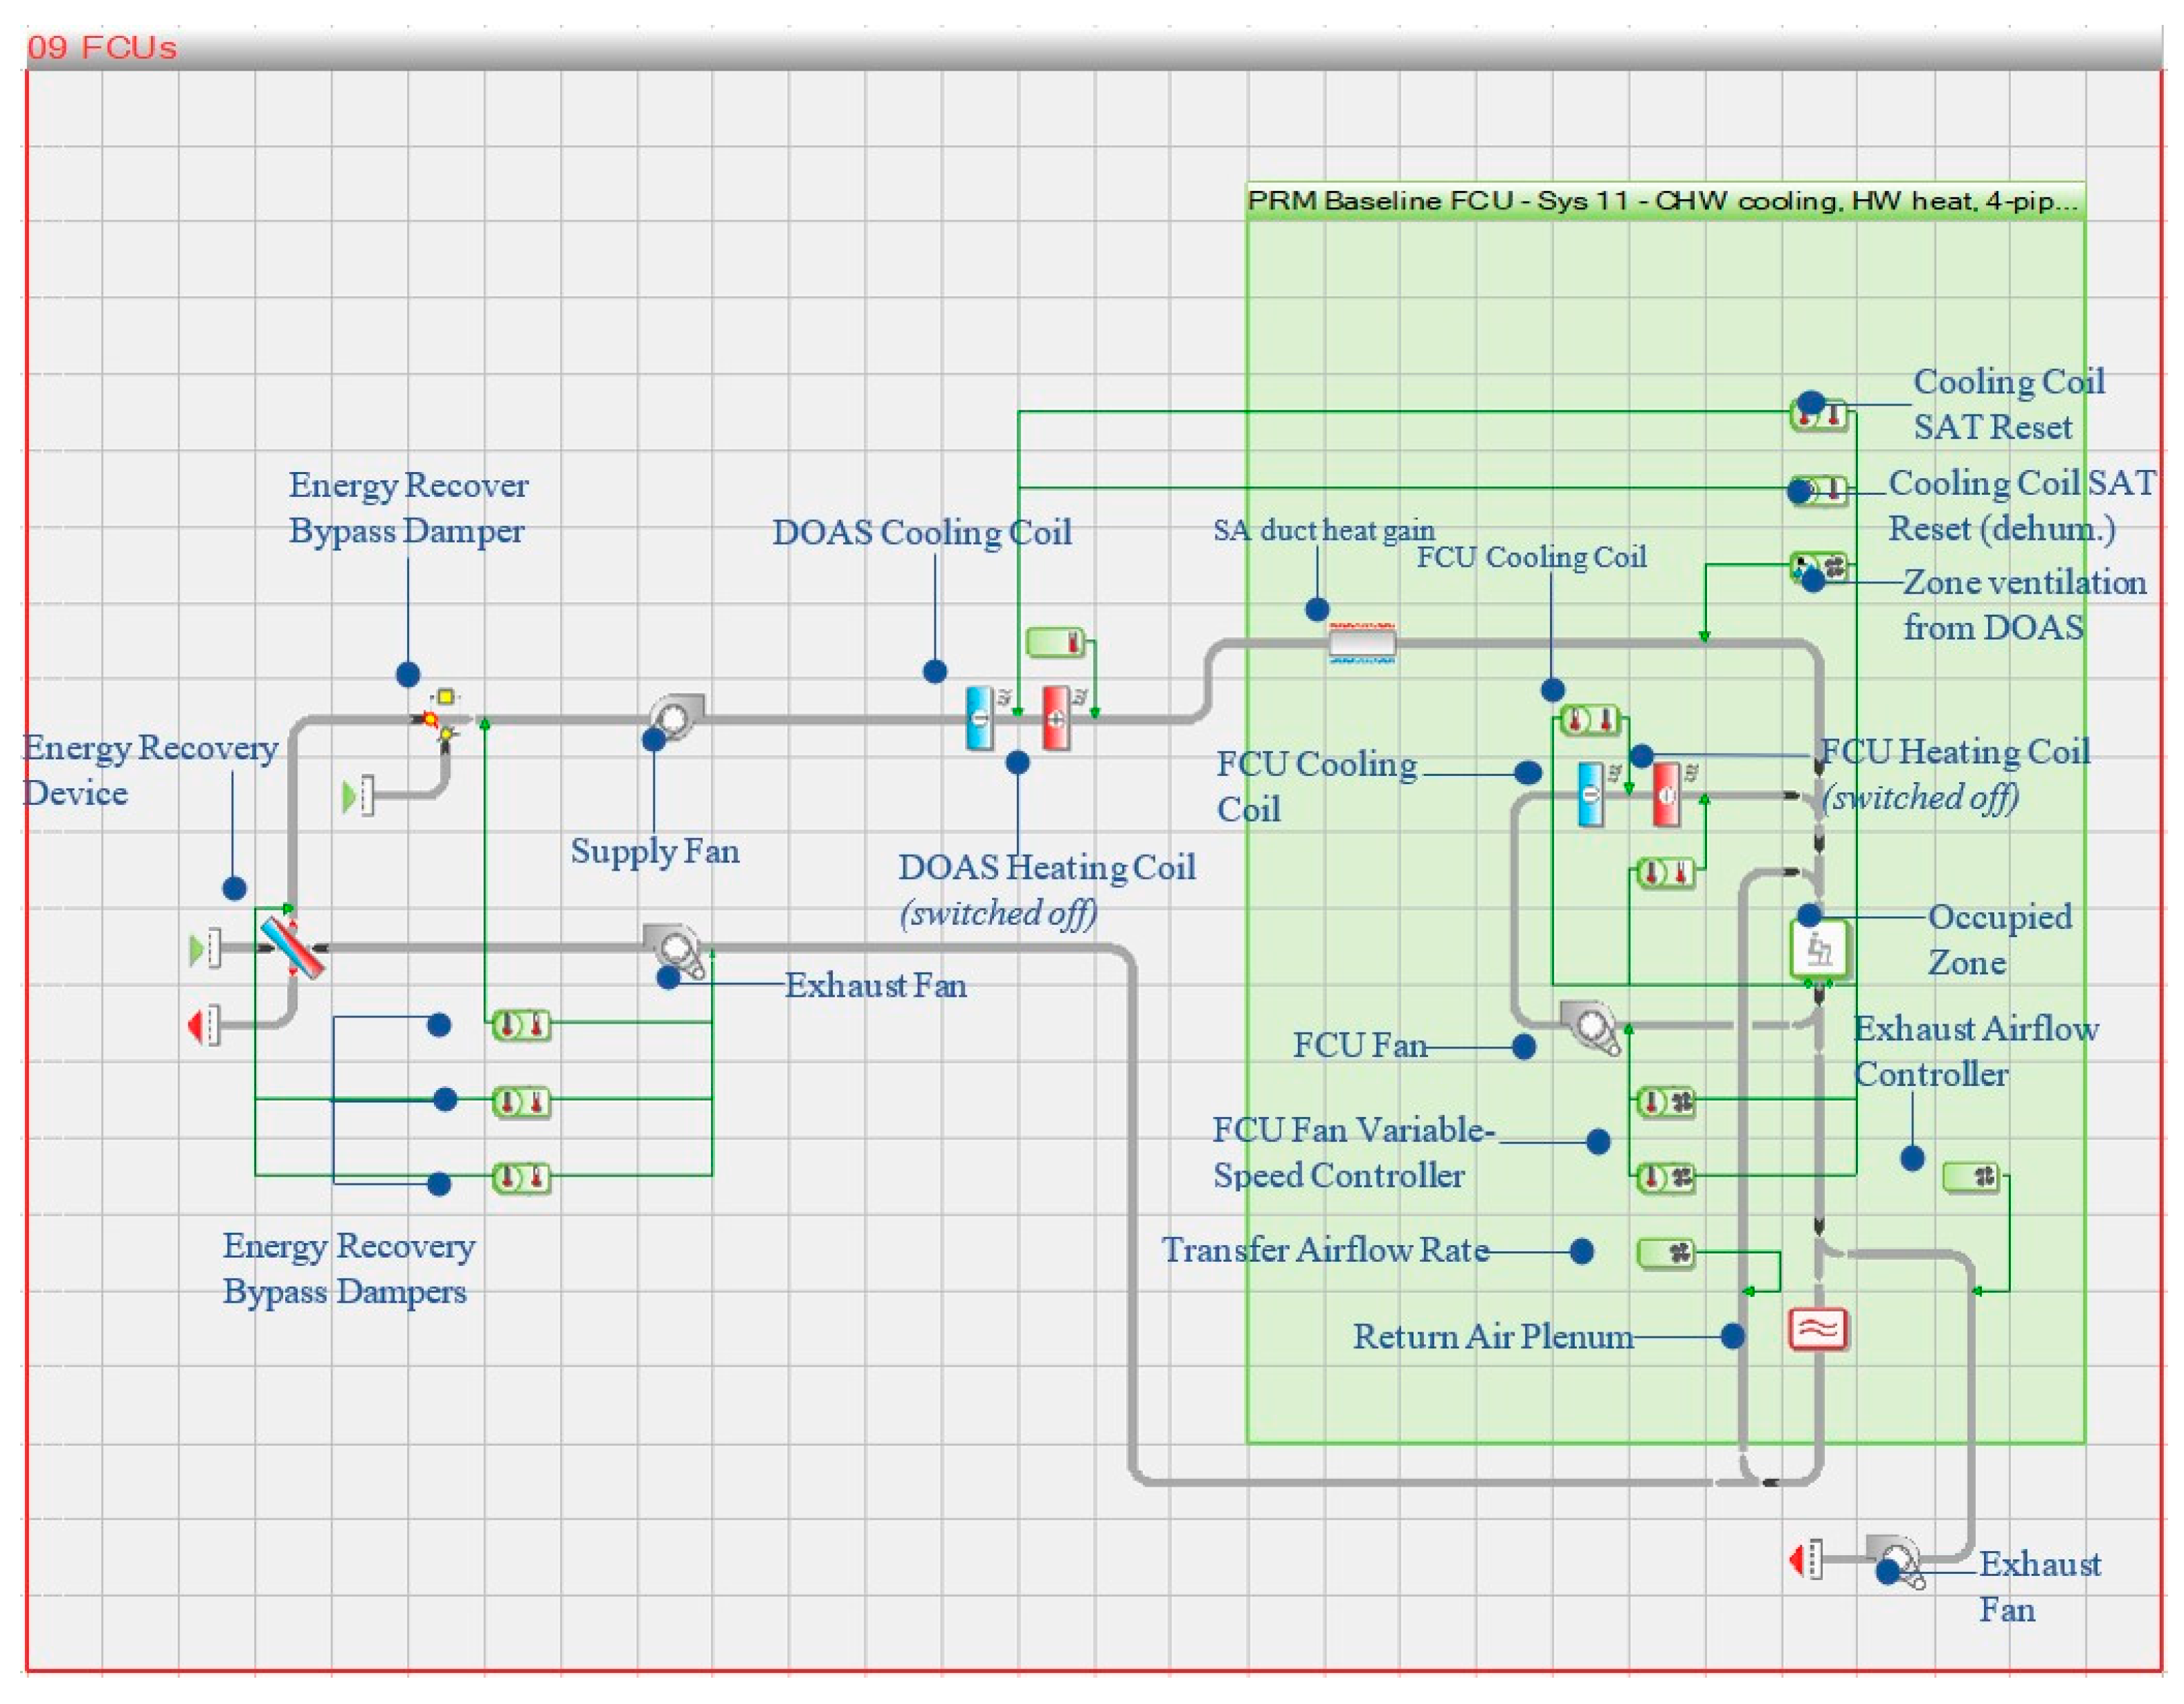
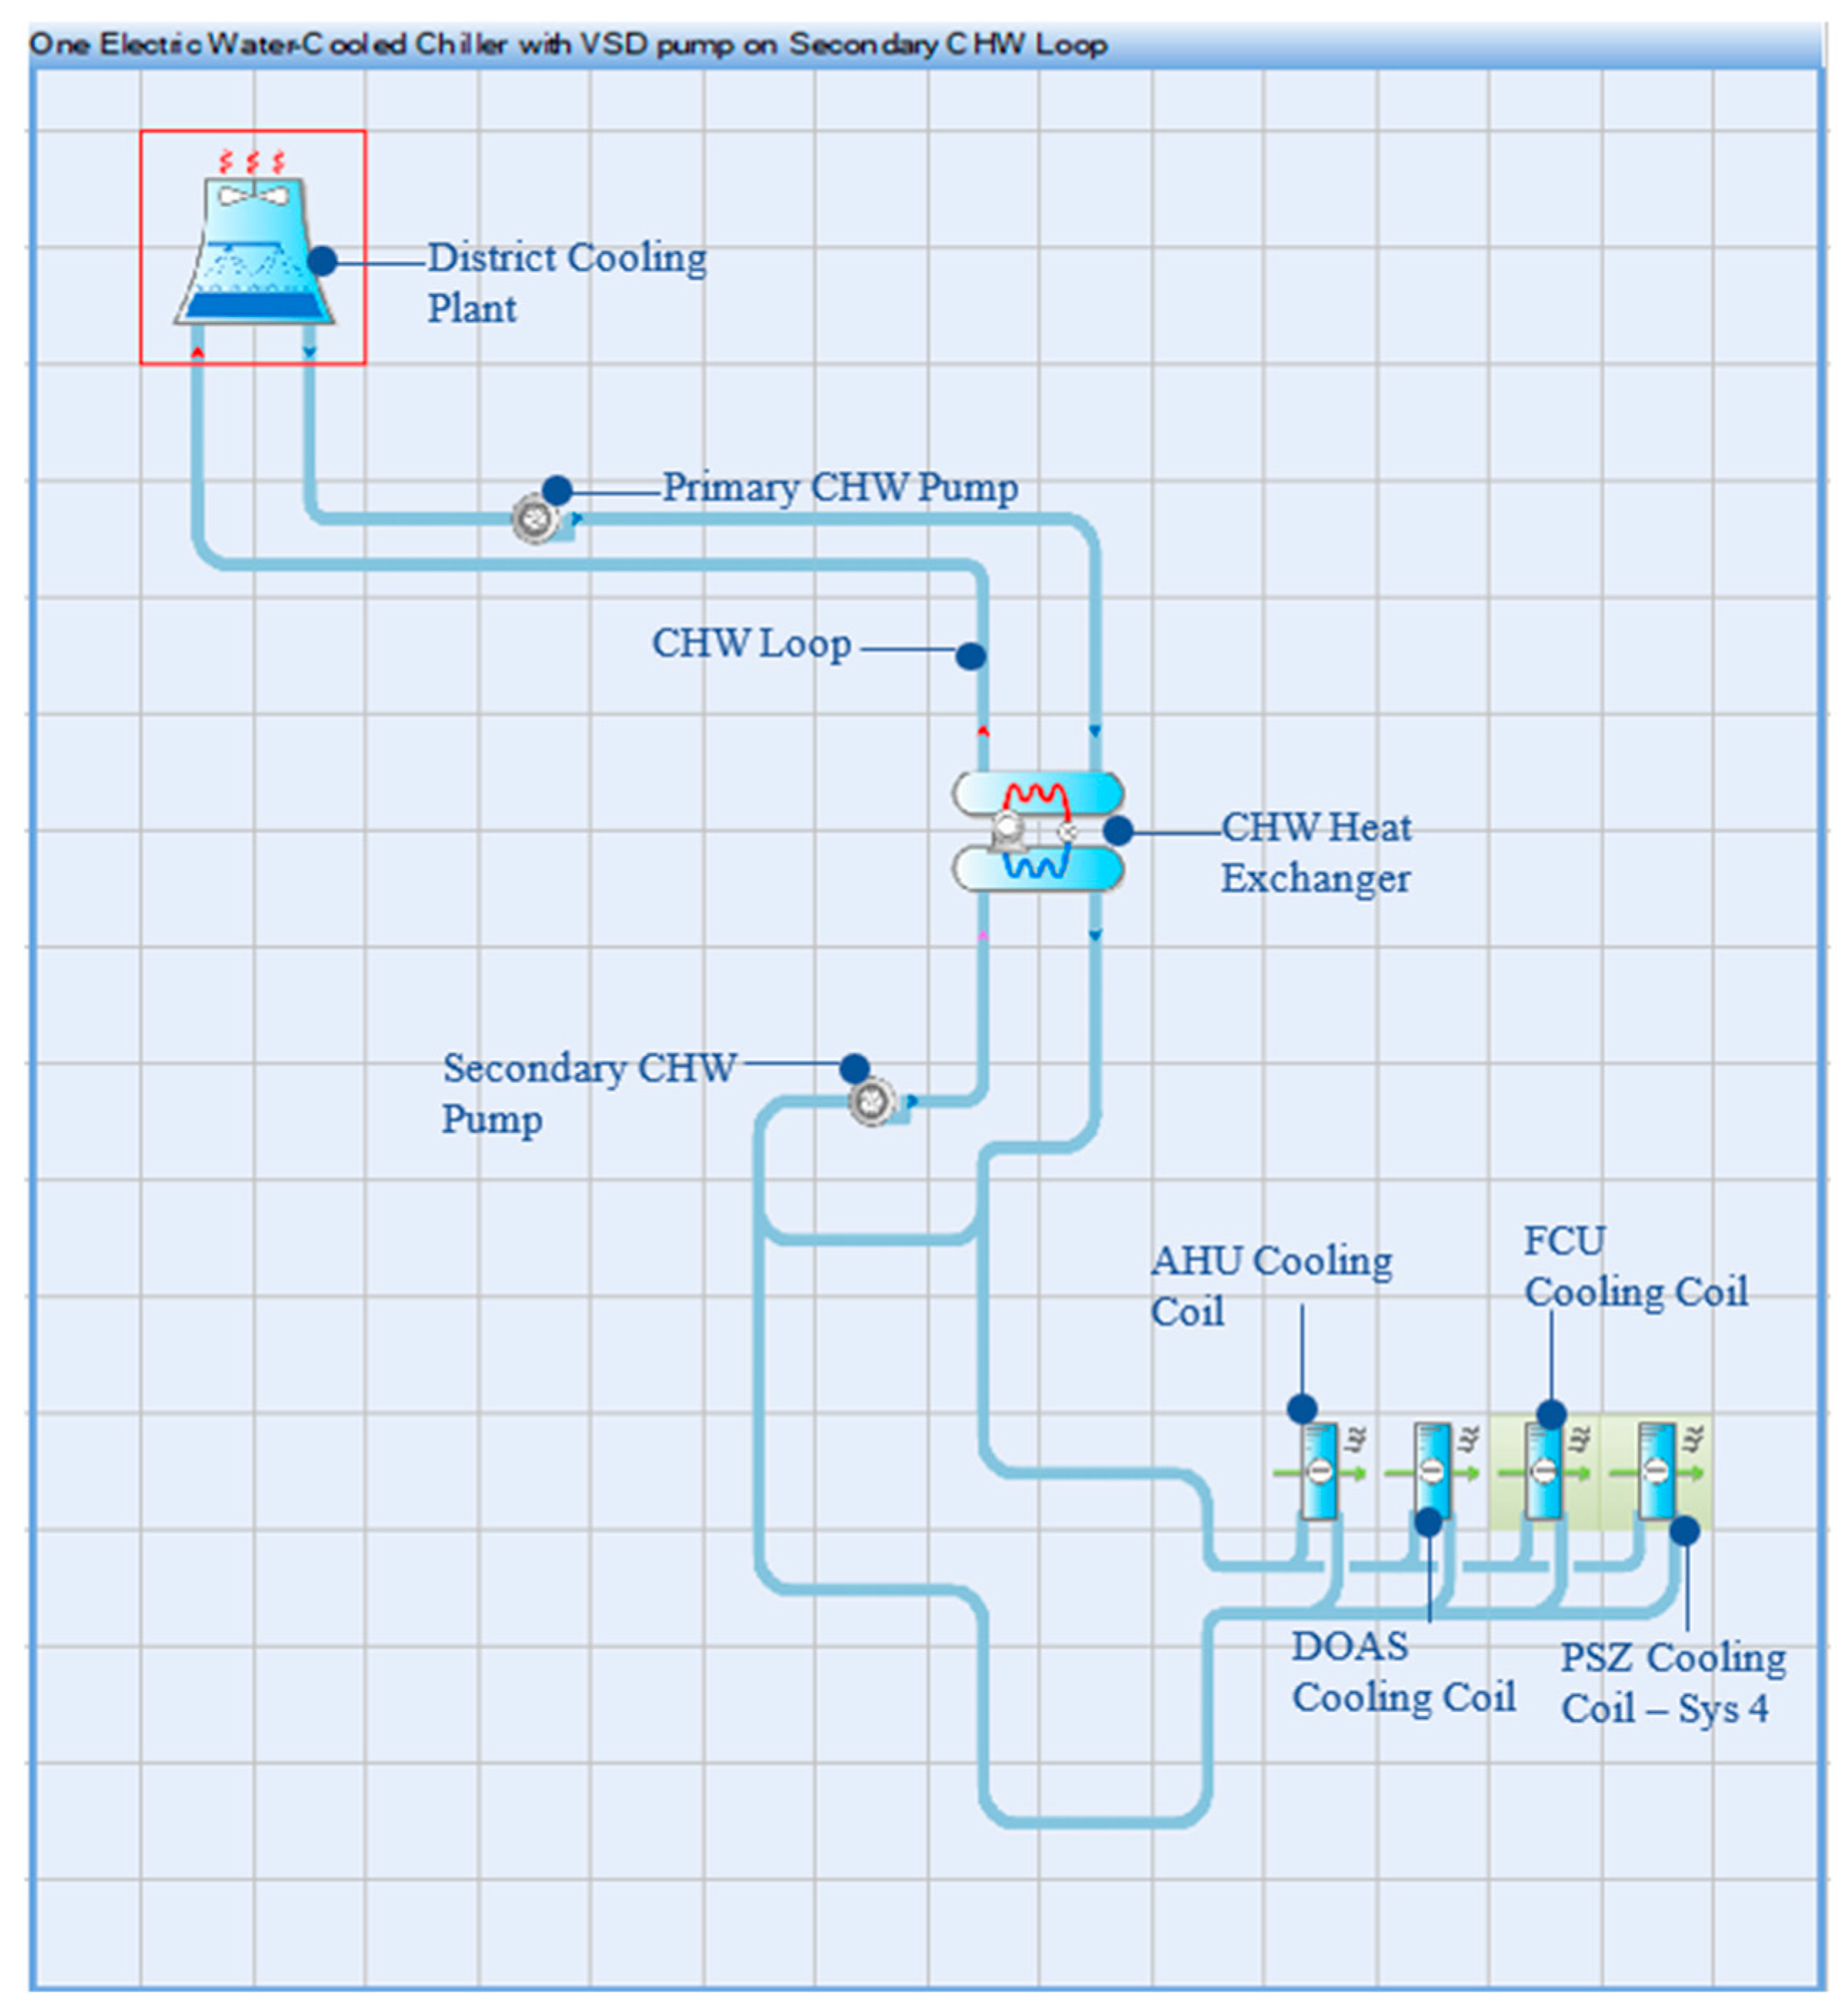
The campus is served by two main HVAC networks: the ground floor areas are served by AHUs, while the remaining spaces are served by FCUs. A Direct Outdoor Air System (DOAS) was designed to feed into these AHU and FCU networks. Both HVAC networks employ variable air volume (VAV) to adjust to airflow rates according to space cooling demand. VAV systems regulate airflow between minimum and design flow rates, ensuring optimal efficiency and comfort across the building. Figure 6 and Figure 7 depict the two HVAC networks modelled into IES, along with annotations of each system component assigned in IES.
The cooling setpoints for all occupied spaces were set to 24 °C. A setback temperature of 30 °C was applied during partial occupancy, allowing controlled temperature drift to maintain comfort without unnecessary cooling [36].
Table 2 summarizes the system configurations input into IES for the two HVAC networks.
The campus’s HVAC systems are powered by a district cooling plant, supplying chilled water (CHW) to HVAC networks via insulated pipes from the district cooling plant at an extremely low temperature of 5.50 °C, as per the incoming temperatures noted at the campus. As CHW enters the facility, heat exchange takes place between the recirculating water used on campus and the incoming CHW [37]. Figure 8 represents the CHW loop input into the IES model to accurately model the district cooling supply. Table 3 shows the CHW loop input parameters.

3. Results

This section discusses the energy modelling results for the base model and the several iterations performed to study the existing sustainable design features and assess the proposed retrofitting measures.

3.1. Base Model

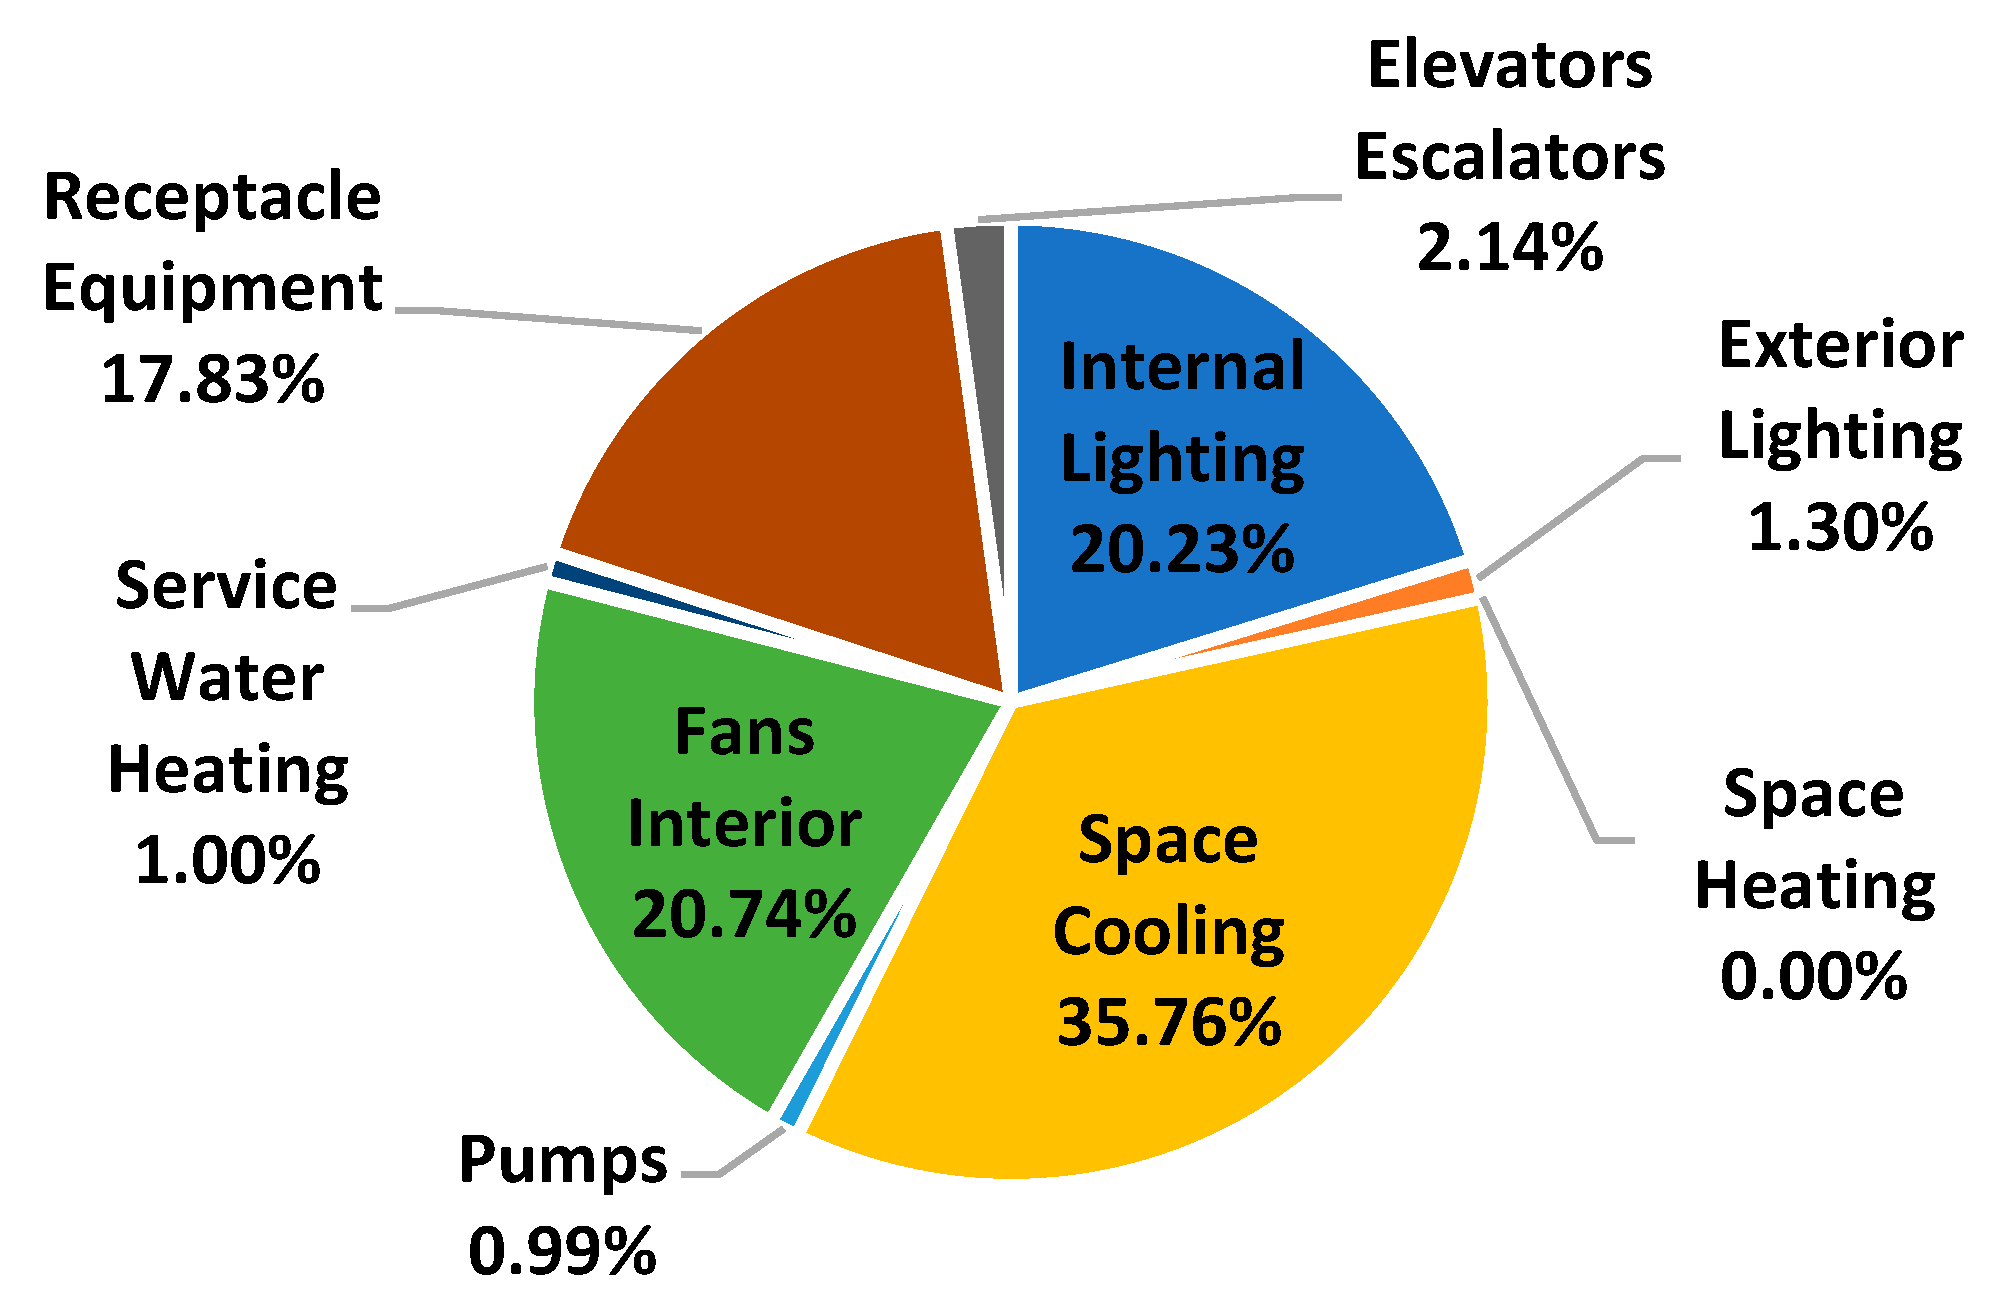
The base model, representing the actual design scenario, was developed using specific inputs to ensure accuracy and alignment with the campus as-built drawings, schedules, and specifications. The simulation results are presented in Table 4 and Figure 9, which provide a breakdown of energy consumption across various end-uses.

3.1.1. Model Validation

To validate the accuracy of the simulation results, the simulated energy consumption results were compared against actual utility meter data for the years 2022 and 2023. As shown in Table 5, the model showed deviations of 3.36% and 3.69% from the respective annual metering data. The results fall well within the acceptable calibration thresholds for building simulations as per the existing research. The existing literature indicates IES simulations of existing buildings typically yield a 6–9% deviation from the actual consumption [3,38]. A report by Jieran et al. indicated that calibrated IES models for institutional buildings can achieve mean absolute percentage errors (MAPE) of around 7%, while ASHRAE Guideline 14 specifies acceptable deviation limits of ±10% for monthly ratings [39]. Given that the base model’s deviations are substantially lower than reported in existing literature, the simulation performance can be regarded as robust and reliable for this research.
Several inevitable factors, such as software limitations and data unavailability, contributed to deviations in the IES simulation results compared to consumption. The use of an older weather file, based on the ‘ASHRAE Standard 169-2021’ by the IES 2021 version employed in this research, may lead to slight disparities in the modelled outdoor conditions compared to current data [40]. Furthermore, the inability to measure and model anomalies in space usage patterns, occupant densities, and operating hours throughout the year adds to the modelling complexity, resulting in possible deviations.
Four iterations of the IES base model were conducted, each progressively incorporating refined design scenarios and inputs to better align with the actual building’s characteristics. The iterations were carried out with the objective of attaining accurate results that closely reflect the building’s actual energy consumption. As complete design data and operational parameters of the campus were obtained progressively during the research, each subsequent iteration integrated more precise inputs as these became available. Table 6 summarizes the inputs for each iteration and highlights the deviations from actual consumption. The fourth iteration, which closely replicated the campus building, was used as the base model for this research.

3.1.2. Sensitivity Analysis

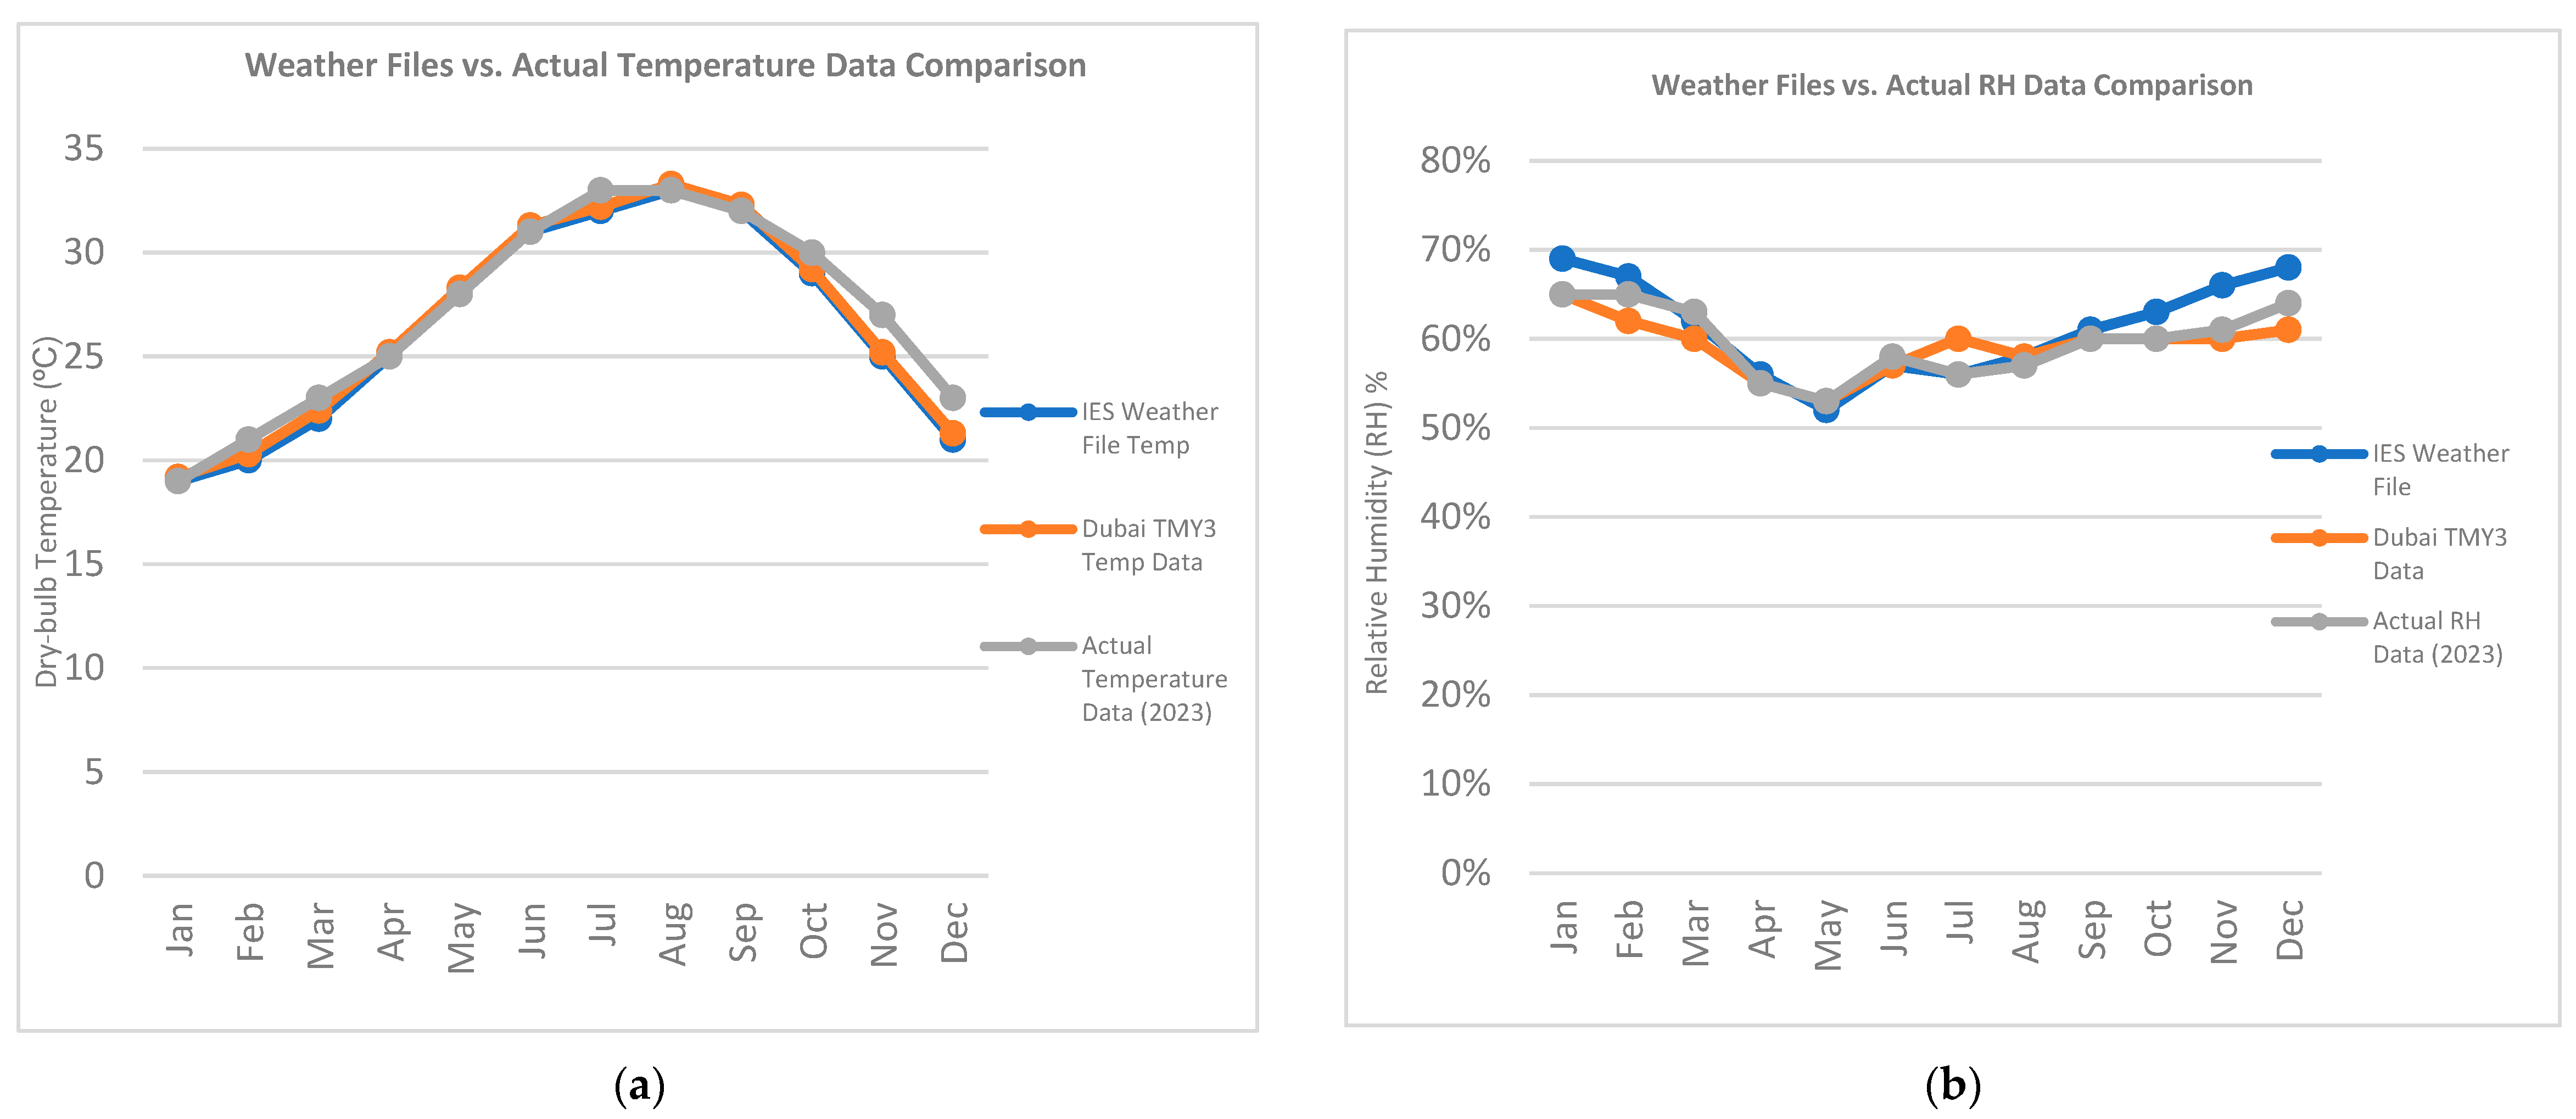
To evaluate the sensitivity of the calibrated digital twin model to weather data inputs and assess the reliability of the selected IES weather file (Dubai Intl Airport), the simulated energy consumption results were compared with the actual utility data from 2022 and 2023, as well as the climate characteristics of the TMY3 (Typical Meteorological Year 3) dataset for Dubai. Figure 10 illustrates the monthly average dry-bulb temperatures and Relative Humidity (RH) levels from three sources: the IWEC file used in the IES model, the Dubai TMY3 dataset, and actual meteorological data for Dubai [41,42]. The dry-bulb temperature remained consistent across all three datasets, with actual values slightly higher during November and December than the weather files data. RH levels from IWEC closely aligned with actual data, while TMY3 showed more variability, especially during cooler months, thereby indicating that IWEC provides a more accurate representation of recent climate conditions in Dubai.
The calibrated model, developed using the IWEC weather file, yielded an annual energy consumption of 2,046,643.07 kWh, resulting in a deviation of 3.36% from 2022 utility data and 3.69% from 2023 data. These deviations fall well within the ±10% accuracy threshold recommended by ASHRAE Guideline 14, thereby validating the reliability of the model and the suitability of the weather file used [38].
To further validate the appropriateness of the IES weather file (IWEC) used in the energy model, a statistical comparison was conducted between the IWEC file and actual 2023 data for Dubai. The Mean Bias Error (MBE) and Root Mean Square Error (RMSE) were calculated for monthly average dry-bulb temperature and relative humidity levels, using the mathematical formulas below [43,44].
MBE = 1 n   i = 1 n ( T I W E C ,   i T a c t u a l ,   i )
RMSE = 1 n   i = 0 n ( T I W E C , i   T a c t u a l ,   i ) 2
where
  • TIWEC,i = Actual average temperature for month i.
  • Tactual,i = Actual average temperature for month i.
  • n = 12 months.
Results indicated a minor temperature bias of −0.27 °C and an RMSE of 0.27 °C, while relative humidity showed an MBE of +1.5% and an RMSE of 2.52%. These small deviations confirm that the IWEC dataset closely represents actual climatic conditions, further supporting its reliability as a weather input for the calibrated energy model.

3.2. Appraisal of Implemented Quantifiable Energy Conservation Measures at the Campus Building

3.2.1. Reduced Lighting Power Densities

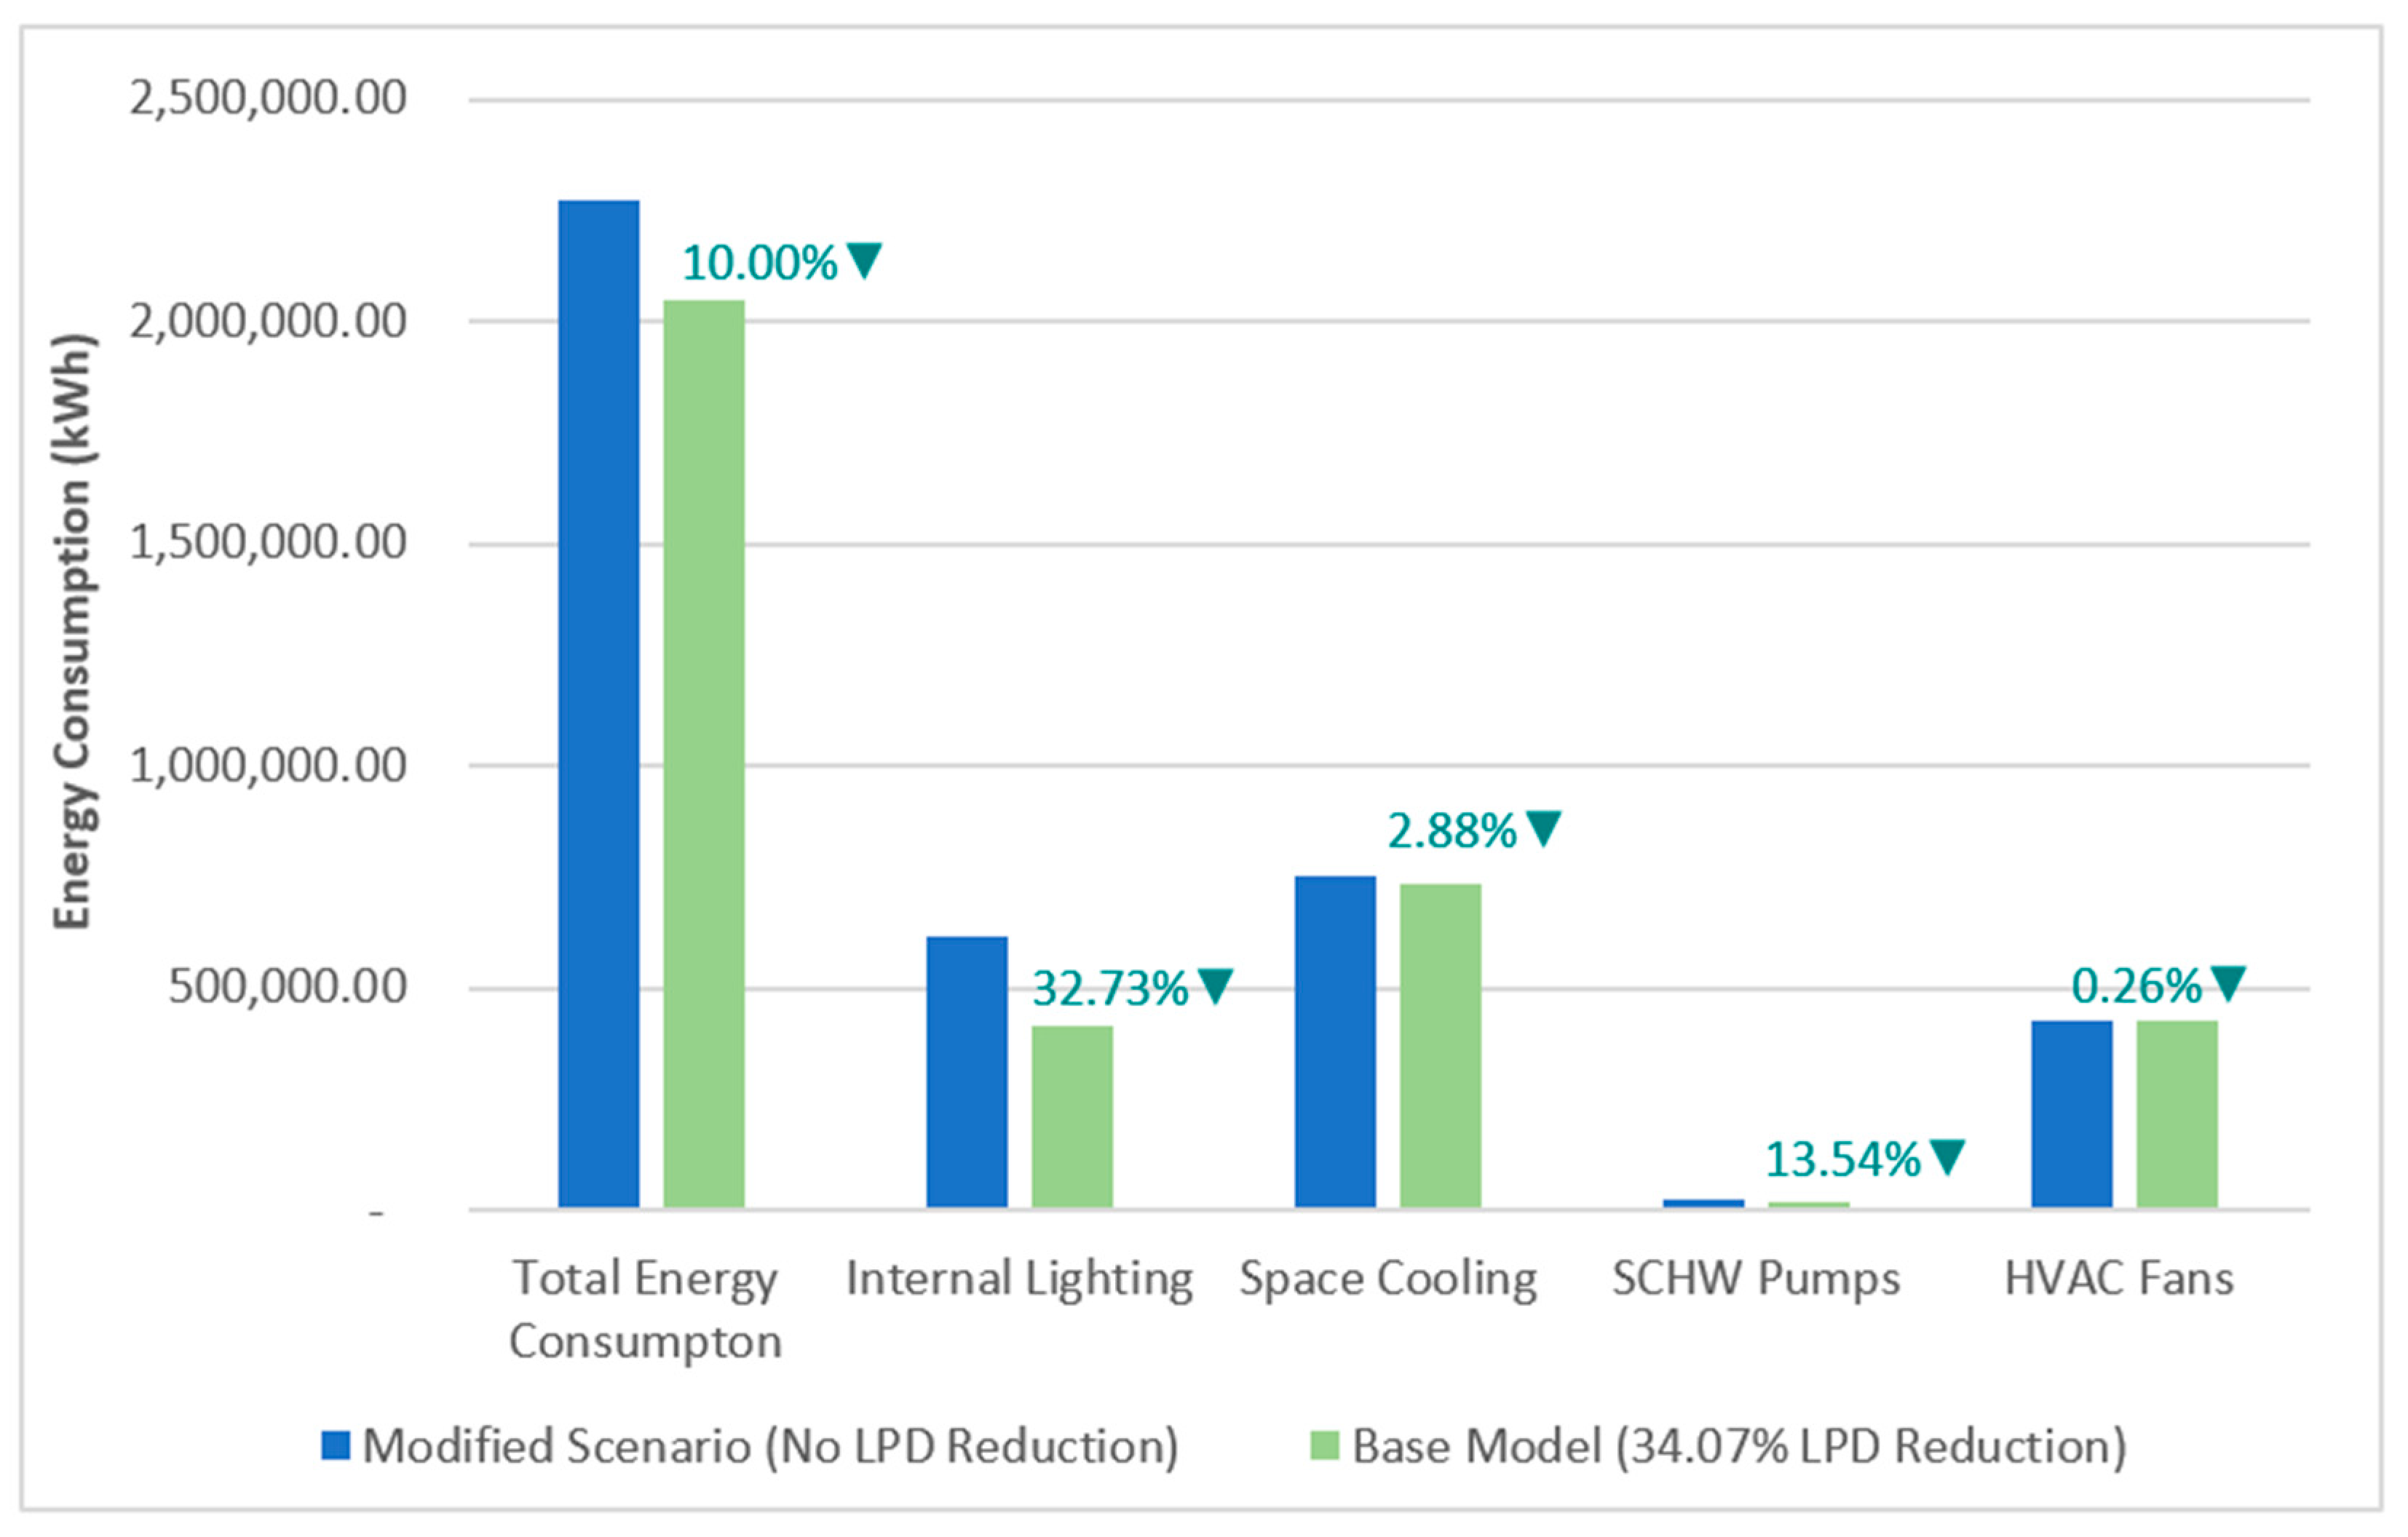
The campus lighting design achieves a 34.07% reduction in the LPD compared to the ASHRAE 90.1-2010 baseline. This reduction contributes to overall energy savings of 10.00% and reduces lighting energy consumption by 32.73%. Furthermore, as artificial lighting dissipates heat and increases interior heat gains, the reduction in LPD levels also led to 2.88% savings on space cooling energy consumption, a 13.54% reduction in CHW pumps energy use, and 0.26% savings in interior fan power consumption.
Table 7 depicts the IES results obtained for the model with no LPD reduction and compares them with the actual design.

3.2.2. Daylight Sensors for Indoor Lighting Fixtures

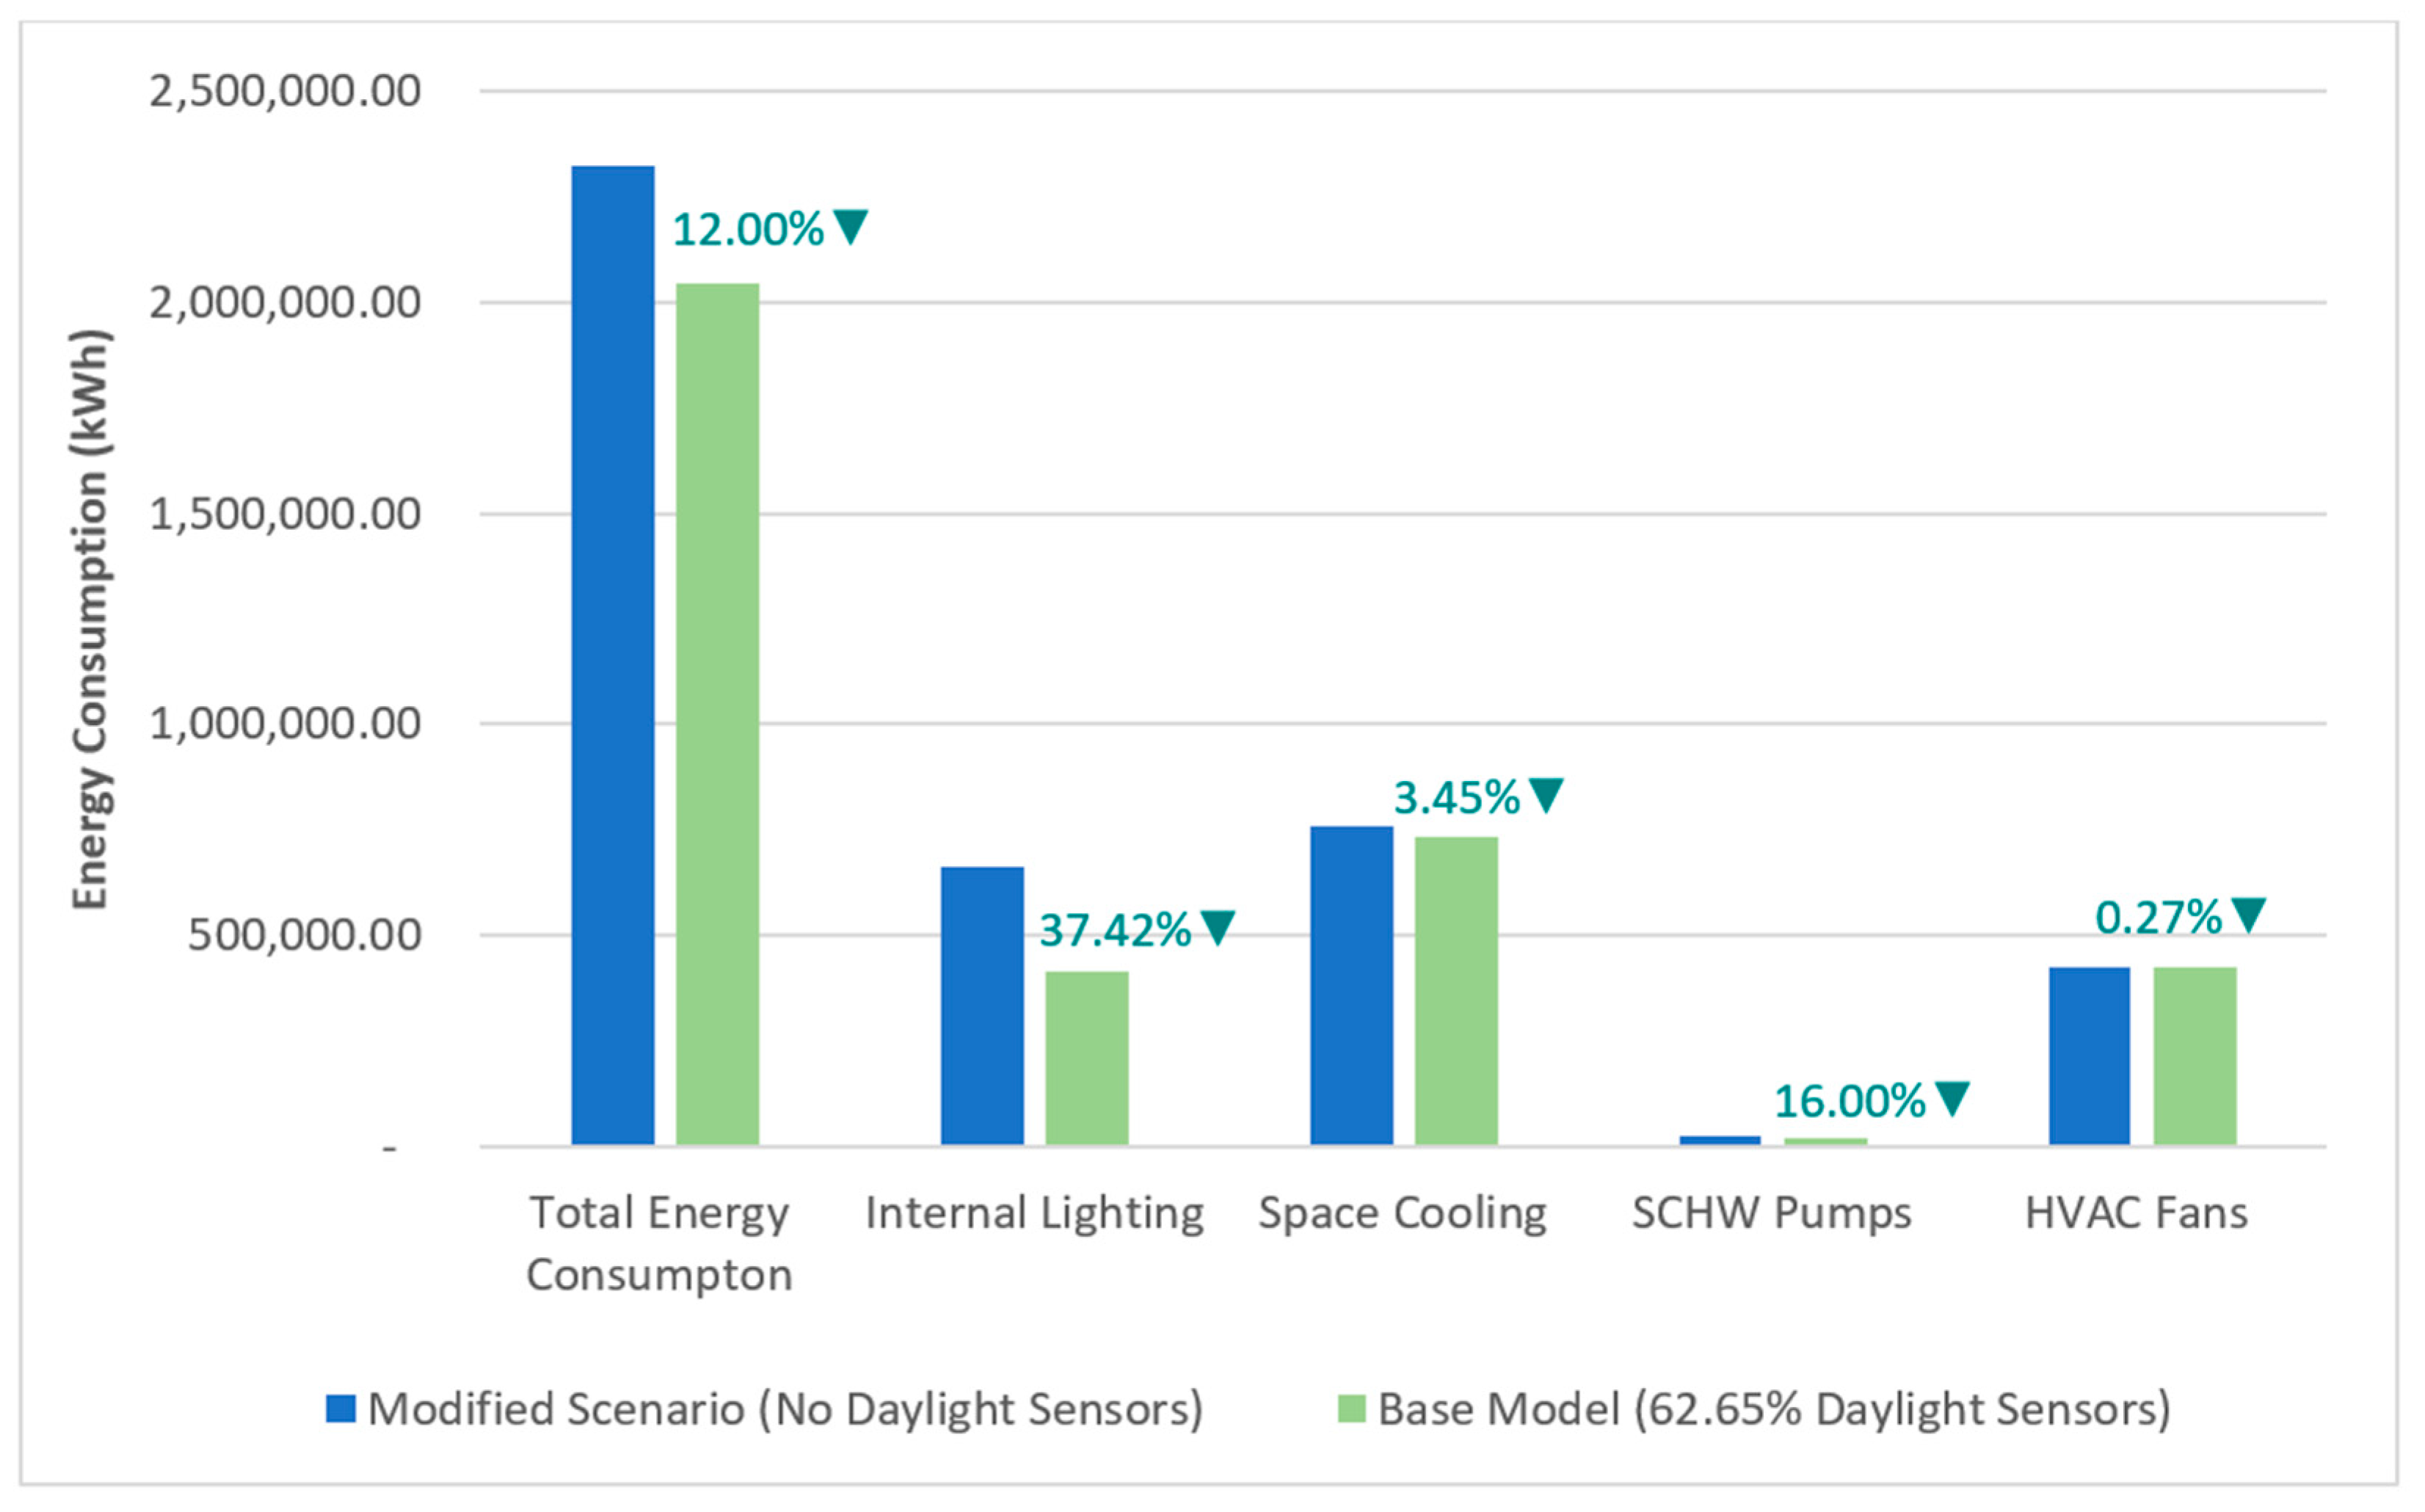
The campus also incorporates daylight sensors for about 62.65% of its lighting load in areas such as welcome lobbies, workshops, open study areas, studios, and laboratories. Using daylight sensors results in 12% savings on overall energy consumption, with 37.42% savings in the lighting, 3.45% savings in space cooling, 15.60% savings in CHW pump power, and 0.27% in HVAC fans end uses.
Table 8 depicts the IES results obtained for the model with no daylight sensors and their comparison with the actual design.

3.2.3. Occupancy Sensors for Indoor Lighting Fixtures

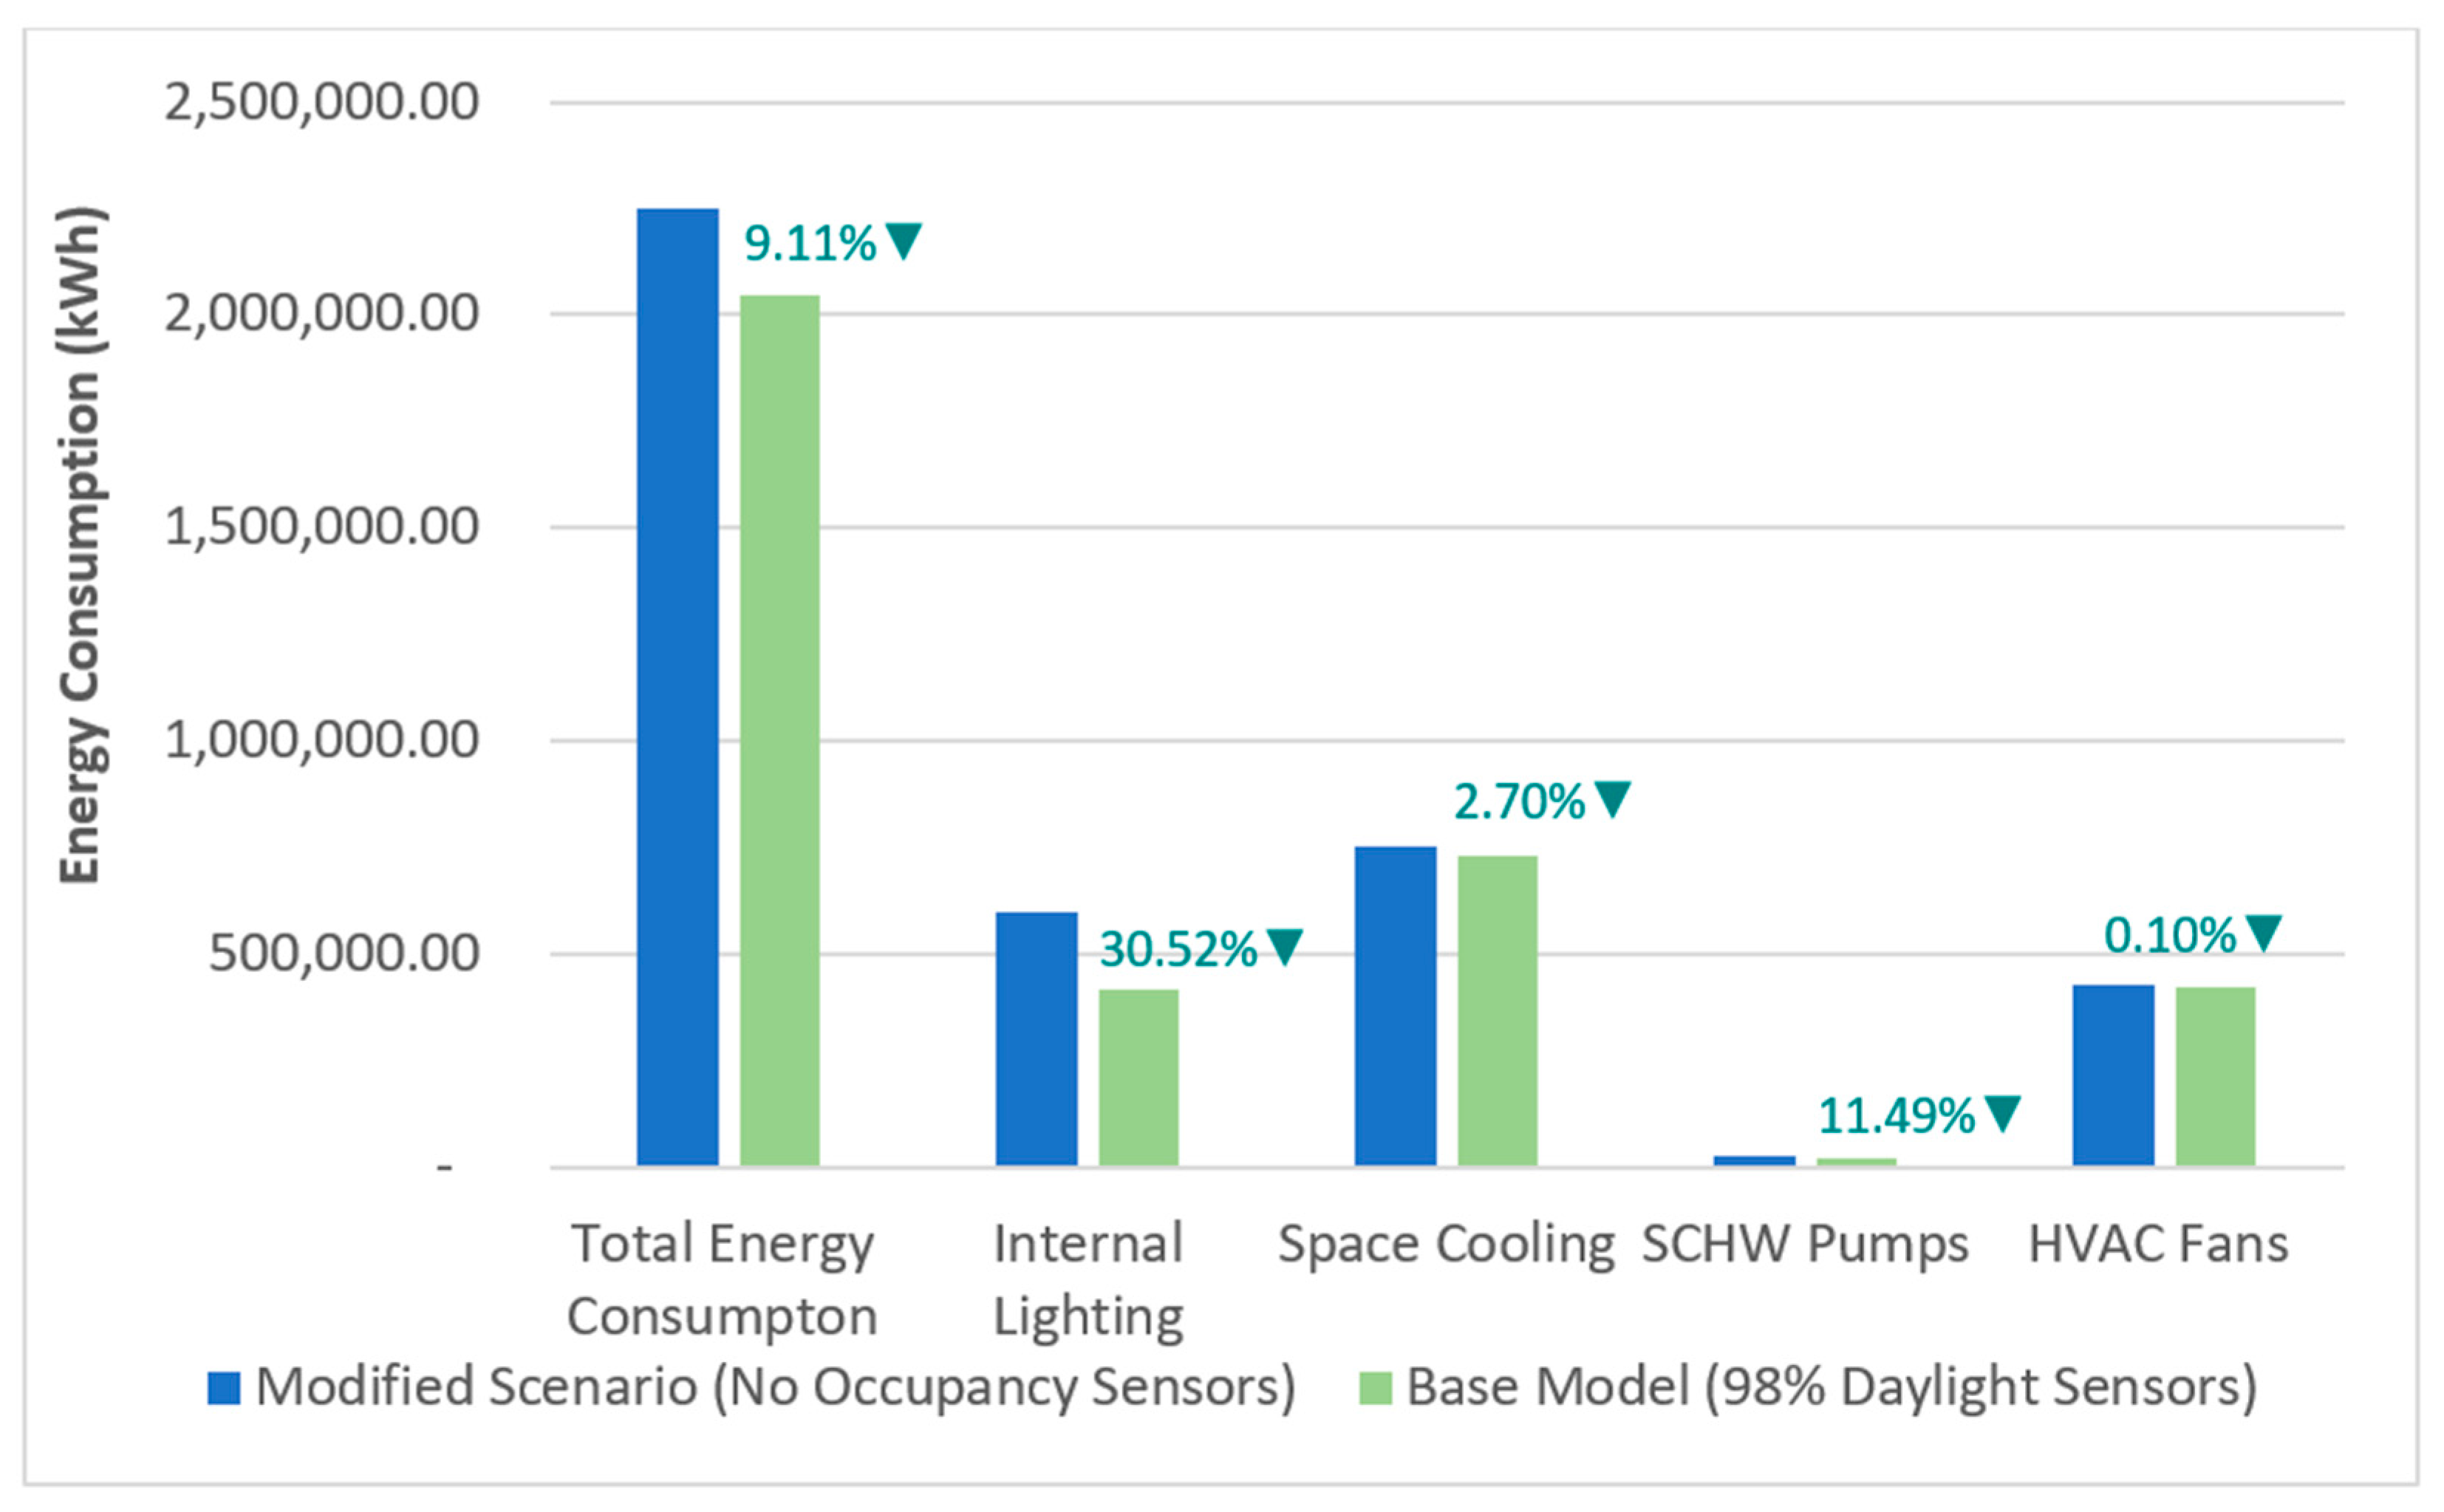
The campus also uses occupancy sensors for 98.48% of its lighting load in areas such as study spaces, waiting areas, offices, meeting rooms, exhibition areas, studios, and laboratories, resulting in 9.11% saving on the overall building’s energy consumption with significant savings in the lighting, space cooling, pumping, and HVAC fan end uses.
Table 9 depicts IES results obtained for the model with no occupancy sensors and comparison with the actual design.

3.3. Proposal of Retrofitting Energy Conservation Measures for Enhanced Energy Conservation

3.3.1. Measure 1: Optimized Envelope U-Values

Optimizing envelope U-values of major envelope components, such as walls, roofs, and glazing systems, was proposed as a passive energy retrofitting measure. Table 10 depicts a 3.27% reduction in the overall energy consumption, 6.76% reduction in space cooling consumption, 20.27% reduction in CHW pumps consumption, and 3.12% reduction in HVAC fans consumption. Refer to Section 4.2.1 Measure 1: Optimized Envelope U-values for a detailed comparison between the actual design and optimized U-values.

3.3.2. Measure 2: Additional Daylight Sensors in Classrooms

The second ECM proposed was an active measure of integrating daylight sensors in classrooms, resulting in 0.5% and 2.10% savings in overall energy consumption and lighting loads, respectively, and additional savings on space lighting, space cooling, CHW pumps, and HVAC fans, as shown in Table 11. Classrooms lack daylight sensors despite ample glazing, offering retrofitting potential. A detailed analysis is conducted in Section 4.2.2 Measure 2: Additional Daylight Sensors in Classrooms to identify additional energy-saving measures through the addition of daylight sensors within the classrooms.

3.3.3. Measure 3: Optimized SFPs for FCU

The third ECM proposed was an active measure of optimizing the SFP for the installed FCUs. The FCUs have SFPs ranging from 0.48 to 1.83 W/(L/s). By transitioning to lower SFPs available in the UAE market (0.2–0.3 W/(L/s)), substantial reductions in electrical fan power consumption are attainable [45]. As seen in Table 12, integrating an average SFP of 0.30 W/(L/s) into the IES base model yielded overall consumption savings of 11.12% and savings on space cooling energy by 5.88%, CHW pump power by 12.55%, and HVAC fan power by 42.88%. This implies that optimized fan operations reduce the overall heat load on the other HVAC components, thereby reducing the workload on CHW pumps.
Detailed analysis of the above IES results and energy savings is included in Section 4, which elaborates on the findings, examines industry standards, and discusses the feasibility of the proposed ECMs.

3.4. Integration of Renewable Energy Systems

Renewable energy integration was assessed for the seven-story university building, which currently hosts a 15.78 kW rooftop solar PV testing site, contributing only 0.24% (4820 kWh) to its energy consumption due to limited rooftop space. Due to the limited share of current renewable energy systems, this study proposes the installation of additional PV panels on the campus rooftop, over carpark shades, and on an adjacent vacant plot, to significantly enhance the campus’s renewable energy share. To accurately model the solar PV system in IES, real-world performance losses were incorporated by calibrating the model based on existing site conditions. Losses such as soiling in the UAE climate reduce efficiency by approximately 8%, with an additional 0.4–0.5% drop in efficiency per °C rise above 25 °C resulting from overheating [46,47]. Shading losses were also considered, estimated at 3–5% for rooftop panels due to nearby equipment and parapet walls, and an additional 5–7% shading losses were considered for the ground-mounted panels from adjacent building structures. These shading estimates were based on PVsyst near-shading guidelines and supported by National Renewable Energy Laboratory (NREL) best practice documentation [48]. The system performance was simulated with panels tilted at 22° from true south. An average inverter efficiency of 96% derived from performance curves of modern string inverters from SolarEdge’s efficiency data, to accurately capture real-world Direct Current (DC) to Alternating Current (AC) conversion losses [49].
These combined factors were reflected through reduced panel efficiency in the IES model, as detailed in Table 13.
In the proposed scenario, a total of 391 additional panels (rated at 213 kW) are considered, which could generate approximately 165,599.67 kWh annually, offsetting 8.09% of the campus’s total energy consumption. Table 14 presents the renewable energy generation results derived from IES simulations, which comprehensively integrate site-specific variables and system derating factors such as panel tilt, measured inverter efficiency, and shading factors.
This research investigated strategies to increase the share of on-site solar PV generation, addressing the limited solar PV capacity installed in the base case building to support its alignment with the UAE’s Net Zero goals. While the focus remained on expanding PV capacity, the scalability and long-term feasibility of complementary technologies such as battery storage and hybrid PV-wind systems were also considered conceptually. Battery storage was excluded from the analysis due to spatial constraints, high capital costs, and the campus’s stable grid-connected status, which eliminates the need for storage to ensure supply continuity. The grid effectively manages variability in solar output, making it a more practical and cost-effective solution. Although batteries offer future potential for peak load reduction and demand-side management, such applications were beyond the scope of this research.
Similarly, hybrid systems, such as combining PV with small-scale wind turbines, were not evaluated, as the UAE’s urban wind conditions are unsuitable for such systems. Building-Integrated Wind Turbines (BIWT) typically require steady wind speeds of 4.5–5.5 m/s, while the site experiences average speeds below 3.0 m/s, compounded by turbulence from surrounding buildings [50,51]. This makes wind integration technically unfeasible and economically unjustified in this context.

4. Analysis and Discussion

4.1. Appraisal of Implemented Quantifiable Energy Conservation Measures

4.1.1. Reduced Lighting Power Densities

Lighting power density, as defined by ASHRAE, refers to the amount of lighting power required per unit area [35]. The campus was initially designed with a 34.07% reduction in the LPD levels compared to the ASHRAE 90.1-2010 baseline. Using the IES energy modelling tool, it was determined that this LPD reduction resulted in overall energy savings of 10.00% and 32.73% savings in lighting energy consumption. Inputting LPDs as per the ASHRAE 901.-2010 baseline into the base model provides an annual energy consumption of 2276.50 MWh, as shown in Figure 11. Reducing LPDs during the design stage is a common practice for achieving the LEED EAp Minimum Energy Performance prerequisite and EAc Optimize Energy Performance credit that contributes the highest number of LEED credit points.
Further assessment of reduced LPDs depicted 2.88% energy savings on space cooling, 13.54% on CHW pumps, and 0.26% on HVAC fan power, as seen in Figure 11. This implies that by decreasing the lighting wattage, which generates internal heat gains in buildings, savings can be achieved on HVAC systems due to reduced cooling demands [52]. The higher savings on CHW pumps compared to HVAC fans stem from the direct impact of changes in thermal loads on secondary CHW pumps in responding more sensitively to variations in heat dissipation from lighting reduction. However, the HVAC fans would operate at similar speeds or marginally lower, irrespective of the cooling demand to meet the minimum ventilation rate requirements.

4.1.2. Daylight Sensors for Indoor Lighting Fixtures

It is found that the use of daylight sensors for only 62.65% of the lighting load results in 12% savings in the overall energy consumption of the campus, in addition to 37.42% savings in lighting energy. Additionally, 3.45% savings on space cooling, 16% savings on CHW pumps power, and 0.27% on HVAC fan power consumption were observed, as seen in Figure 12. The large floor-to-ceiling windows at the campus facilitate adequate daylight into occupied zones, providing potential for the use of daylight sensors. The UAE receives average daily daylight levels between 75,000 and 107,500 lux, far exceeding the minimum lux requirements of 400 lux for educational buildings as per IESNA (Illuminating Engineering Society of North America) standards [53,54]. Such favorable conditions emphasize the substantial advantage that daylight offers in reducing reliance on artificial lighting, contributing to 20.23% of the overall energy consumption of the campus.
Integration of daylight sensors also contributes to savings in space cooling-related consumption since artificial lighting adds to internal heat gains [52]. Reduced intensity and use of artificial lighting result in marginally reduced space cooling demand and improved thermal comfort. Further, the energy savings on secondary CHW pumps (16%) are observed to be higher than for fans (0.27%), as a reduction in cooling demand decreases the load on CHW systems, leading to lower pump energy consumption, while the fans may still operate at similar speed and power. However, it is crucial to maintain a balance between the use of natural and artificial lighting to prevent excessive solar heat gain and glare from causing thermal and visual discomfort. This is ensured by using blinds and shading devices within the building.
However, daylight sensors are not installed in classrooms, which can potentially yield additional energy savings. This is further explored below in Section 4.2.2 Measure 2: Additional Daylight Sensors in Classrooms.

4.1.3. Occupancy Sensors for Indoor Lighting Fixtures

Occupancy Sensors integrated into lighting fixtures minimize energy usage by automatically turning off lights in the absence of motion after a certain period, eliminating the need for manual control. These sensors have been installed in lobbies, library, classrooms, and meeting rooms within the campus, and result in a 9.11% reduction in overall energy consumption, with lighting loads experiencing a substantial decrease of 30.52%, as seen in Figure 13. In a study conducted at an educational facility in Florida, adding occupancy sensors in classrooms led to a 10% reduction in energy usage, particularly noticeable during after-school hours [55].
Furthermore, occupancy sensors contribute to energy savings on the HVAC side by reducing space cooling energy usage by 2.70%, CHW pumps energy usage by 11.49% and HVAC fans power usage by 0.10%, attributed to decreased internal heat gains from artificial lighting. Like other sustainable practices, the energy savings on CHW pumps surpass those of HVAC fans due to the direct impact of reduced thermal loads and heat dissipation from lighting, whereas fans operate at consistent speeds to maintain air circulation.

4.2. Proposal of Retrofitting Energy Conservation Measures for Enhanced Energy Conservation

The second step of this research aims to further optimize energy consumption by assessing passive and active retrofitting ECMs. The retrofitting measures are finally backed by the addition of solar PV systems. Passive measures considered included optimizing envelope U-values for better thermal insulation, whereas the active measures considered included the addition of daylight sensors within classrooms and optimization of FCU fan powers.

4.2.1. Measure 1: Optimized Envelope U-Values

Improving the insulation and air tightness of building envelopes is regarded as a beneficial passive retrofitting measure, especially in extreme climates, as the difference between the indoor and outdoor temperatures varies greatly, adding to the load on HVAC systems. Envelope retrofitting is a highly cost-intensive measure for large and complex buildings, but it provides long-term benefits by future-proofing buildings against worsening external temperatures and flood conditions.
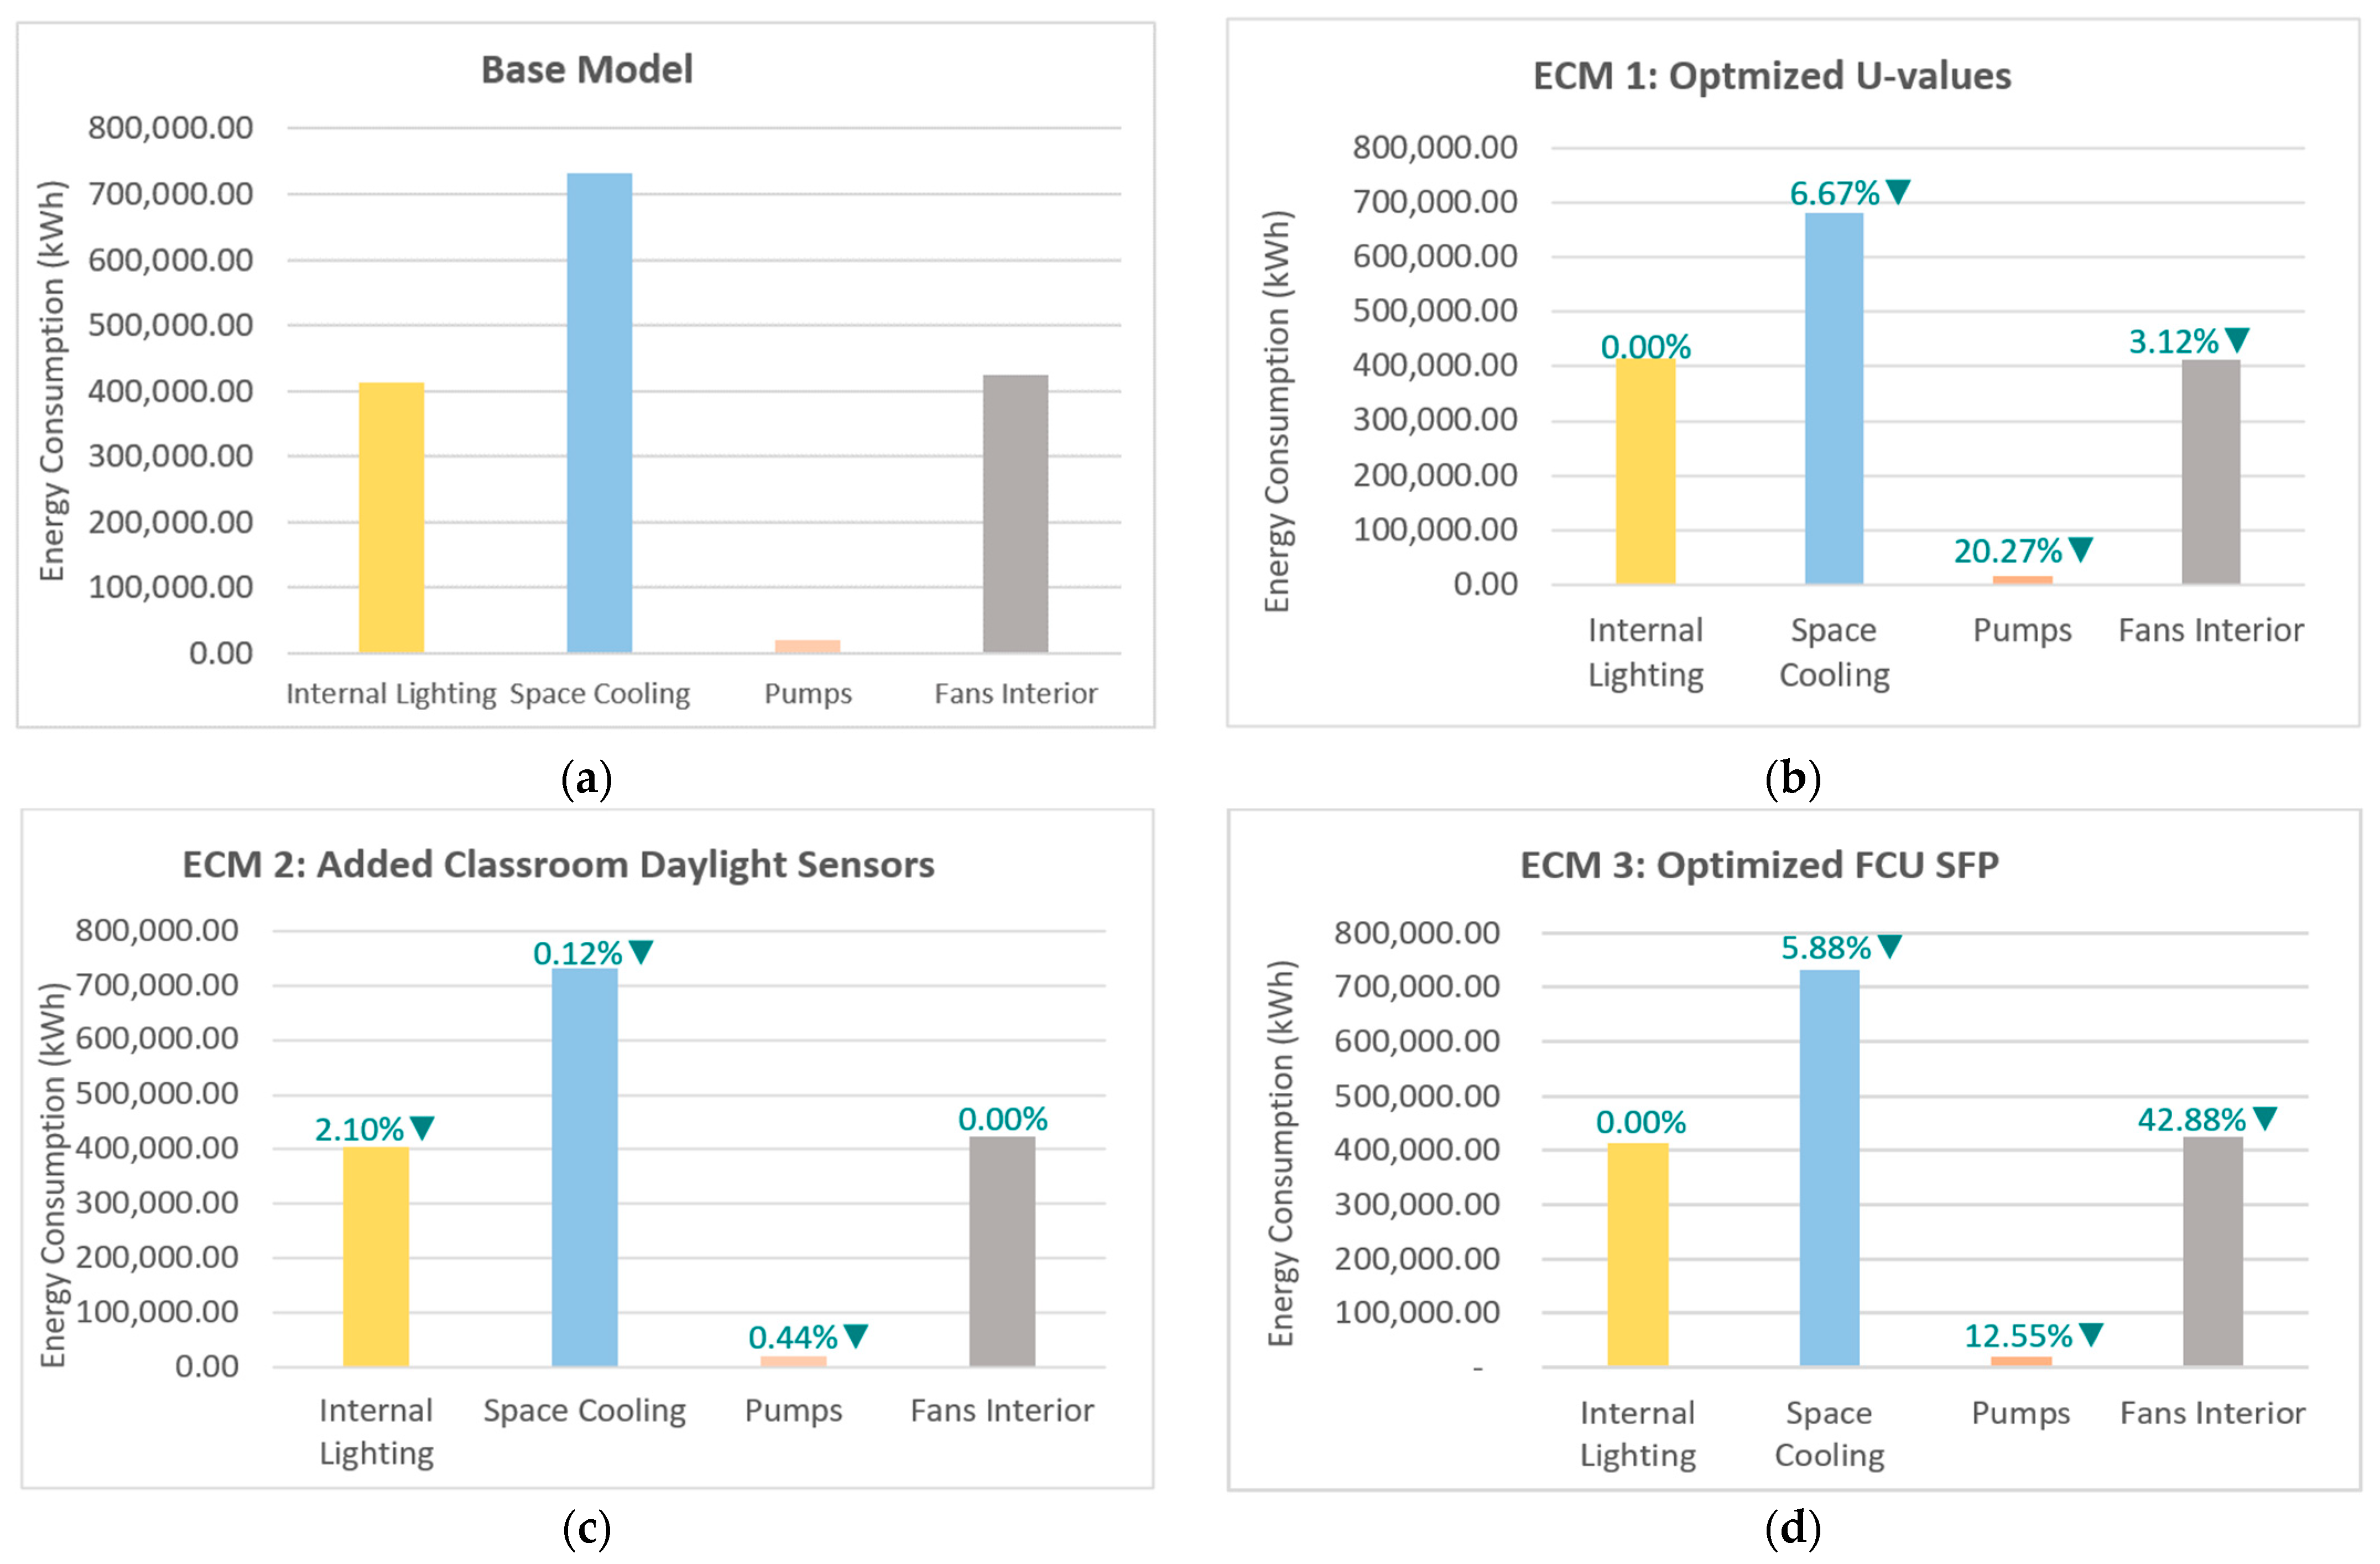
The simulation results revealed that improving the base model U-values to optimized ones resulted in a 3.27% reduction in the overall building energy consumption, along with a 6.76% reduction in energy consumption for space cooling, 20.27% reduction in energy consumed by CHW pumps, and 3.12% reduction in energy consumed for powering HVAC fans, as shown in Table 15. The optimized U-values used for this research were derived from Estidama, the local green building rating system in Abu Dhabi, as these are better suited to the regional climate and align with product specifications commonly available in the local market [6]. The energy savings on CHW pumps are higher than those for fans due to the reduction in cooling demand, leading to lower pump energy consumption, while the fans may still operate at similar speeds.
U-value optimization for external walls can be conducted by adding insulation layers to the inner leaf to minimize renovation costs. Insulation such as polystyrene, XPS, and EPS, offering U-values as low as 0.16 W/m2K, is locally available [56,57]. However, it is found that in buildings with a Window-to-Wall Ratio (WWR) greater than 30%, an improvement in the wall insulation does not provide major energy conservation benefits, as the majority of the heat gain penetrates through the glazing that occupies a significantly larger area. Al-Tamimi stated that conducting an IES simulation of an existing office building in KSA with a WWR of 45% resulted in a 1.7% reduction in energy consumption when adding EPS insulation of 50 mm [39].
Retrofitting the roof structure is simpler when insulating the outer layer, as it allows for easier access and minimizes disturbance to interior areas. However, this approach yields moderate energy savings because the space below the roof serves as a buffer, limiting heat transfer to other areas. Al-Tamimi’s research depicted only a 0.61% reduction in energy consumption when simulating a roof with 95 mm of additional XPS insulation [39].
Given that 55% of the building’s outer surface is glazed, a significant amount of heat enters through glazing, reaching up to 18.48 MJ/m2/day based on numerical research findings in the UAE [34]. Despite using glass with optimal thermal properties, the glazing U-value can be further improved to 1.20 W/m2K, as the local market offers products with better thermal properties. The building design also incorporates recessed windows and structural shades to minimize solar gains. Glazing retrofits can be performed in various ways, ranging from replacing the glass with an improved alternative such as low-e filled glass, which has 30% better insulation due to better heat reflecting properties of low-e gases, or through the addition of architectural solar films [58,59]. Al-Tamimi’s research proved that the greatest energy reduction in the office building, approximately 22%, was obtained by replacing windows with better insulation properties. It is, however, important to ensure a balance between eliminating envelope heat gain and providing adequate daylight penetration to ensure overall energy savings, including reduced reliance on artificial lighting [39].

4.2.2. Measure 2: Additional Daylight Sensors in Classrooms

The absence of daylight sensors in classrooms presented an area of investigation for energy conservation advancements. Incorporating these sensors into the IES base model resulted in a 2.10% reduction in lighting energy consumption, 0.12% reduction in space cooling energy use, and about 0.44% reduction in energy use by secondary CHW pumps. However, the overall reduction in the total campus energy consumption was only 0.5%, due to the fact that the classrooms occupied merely 8% of the building’s total spaces, resulting in lower-impact reductions. Various studies and industrial guidelines have recognized the incorporation of daylight sensors as a cost-effective retrofitting measure, offering moderate payback periods, particularly when paired with LED lighting in offices and institutional buildings [60,61].
The classrooms are already equipped with occupancy lighting sensors and integrating daylight sensors, which will maximize the energy conservation benefits as the daylight sensors adjust lighting intensity based on solar irradiance, while occupancy sensors activate or switch off lights based on movement, independent of daylight levels [62,63]. The existing literature suggests that combining multiple lighting controls through a sophisticated design yields 30–55% energy savings, depending on space usage [64]. The classrooms are also designed with floor-to-ceiling windows, facilitating adequate natural light into interiors. Internal blinds are provided to control excessive heat gain and glare, ensuring artificial lighting is used at maximum intensity only when necessary.
Moreover, integrating daylight sensors with occupancy sensors will help meet LEED certification requirements, earning credits such as EQc Daylight, EAp Minimum Energy Performance, and INc Innovation credits, aiding in achieving a higher certification level of Platinum.

4.2.3. Measure 3: Optimized SFPs for FCU

The SFPs serve as a pivotal measure in evaluating the energy efficiency of building HVAC systems. SFPs quantify the power required for fans to propel air through the HVAC equipment, indicating the performance efficiency of the equipment. SFP (W/(L/s)) is a design specification of fan-powered HVAC equipment, expressed as a ratio of rated power (Watts) and supply airflow rate (L/s), typically specified by the manufacturer. Since HVAC fans contribute to 20.74% of the campus’s total energy consumption, it is imperative to install fans with maximum efficiency to minimize energy wastage and optimize overall system performance. Upon analysis of HVAC load schedule drawings of the campus, it was found that the FCU SFPs currently range between 0.48 and 1.83 W/(L/s). However, integrating FCUs with optimized SFPs, available in the UAE market at 0.2–0.3 W/(L/s) from reputable manufacturers such as Trosten and Daikin, yields significant energy savings [45]. Implementation of an average SFP of 0.3 W/(L/s) into the IES base model resulted in a significant reduction in overall energy consumption by 11.12%, space cooling energy by 5.88%, CHW pump power by 12.55%, and HVAC fans power by 42.88%.
Replacing existing FCUs with ones with optimized SFPs proves to be a beneficial solution for enhancing the energy efficiency of a building’s HVAC system for several reasons. Integrating efficient FCUs helps better achieve energy conservation requirements in green building certifications. Implementing this ECM at the university campus can result in achieving higher energy savings from ASHRAE 90.1 baselines, leading to the possibility of transitioning from the university’s LEED Gold rating to Platinum with minimal cost investment and without major renovations. Under the BREEAM certification, achieving a 10% energy savings by replacing standard FCUs with efficient ones contributes to at least 3 BREEAM points. Replacing design-stage FCUs after the building has been operational for several years helps achieve better thermal comfort as the occupancy and operational scenarios may have altered since the design stage, requiring better HVAC performance.
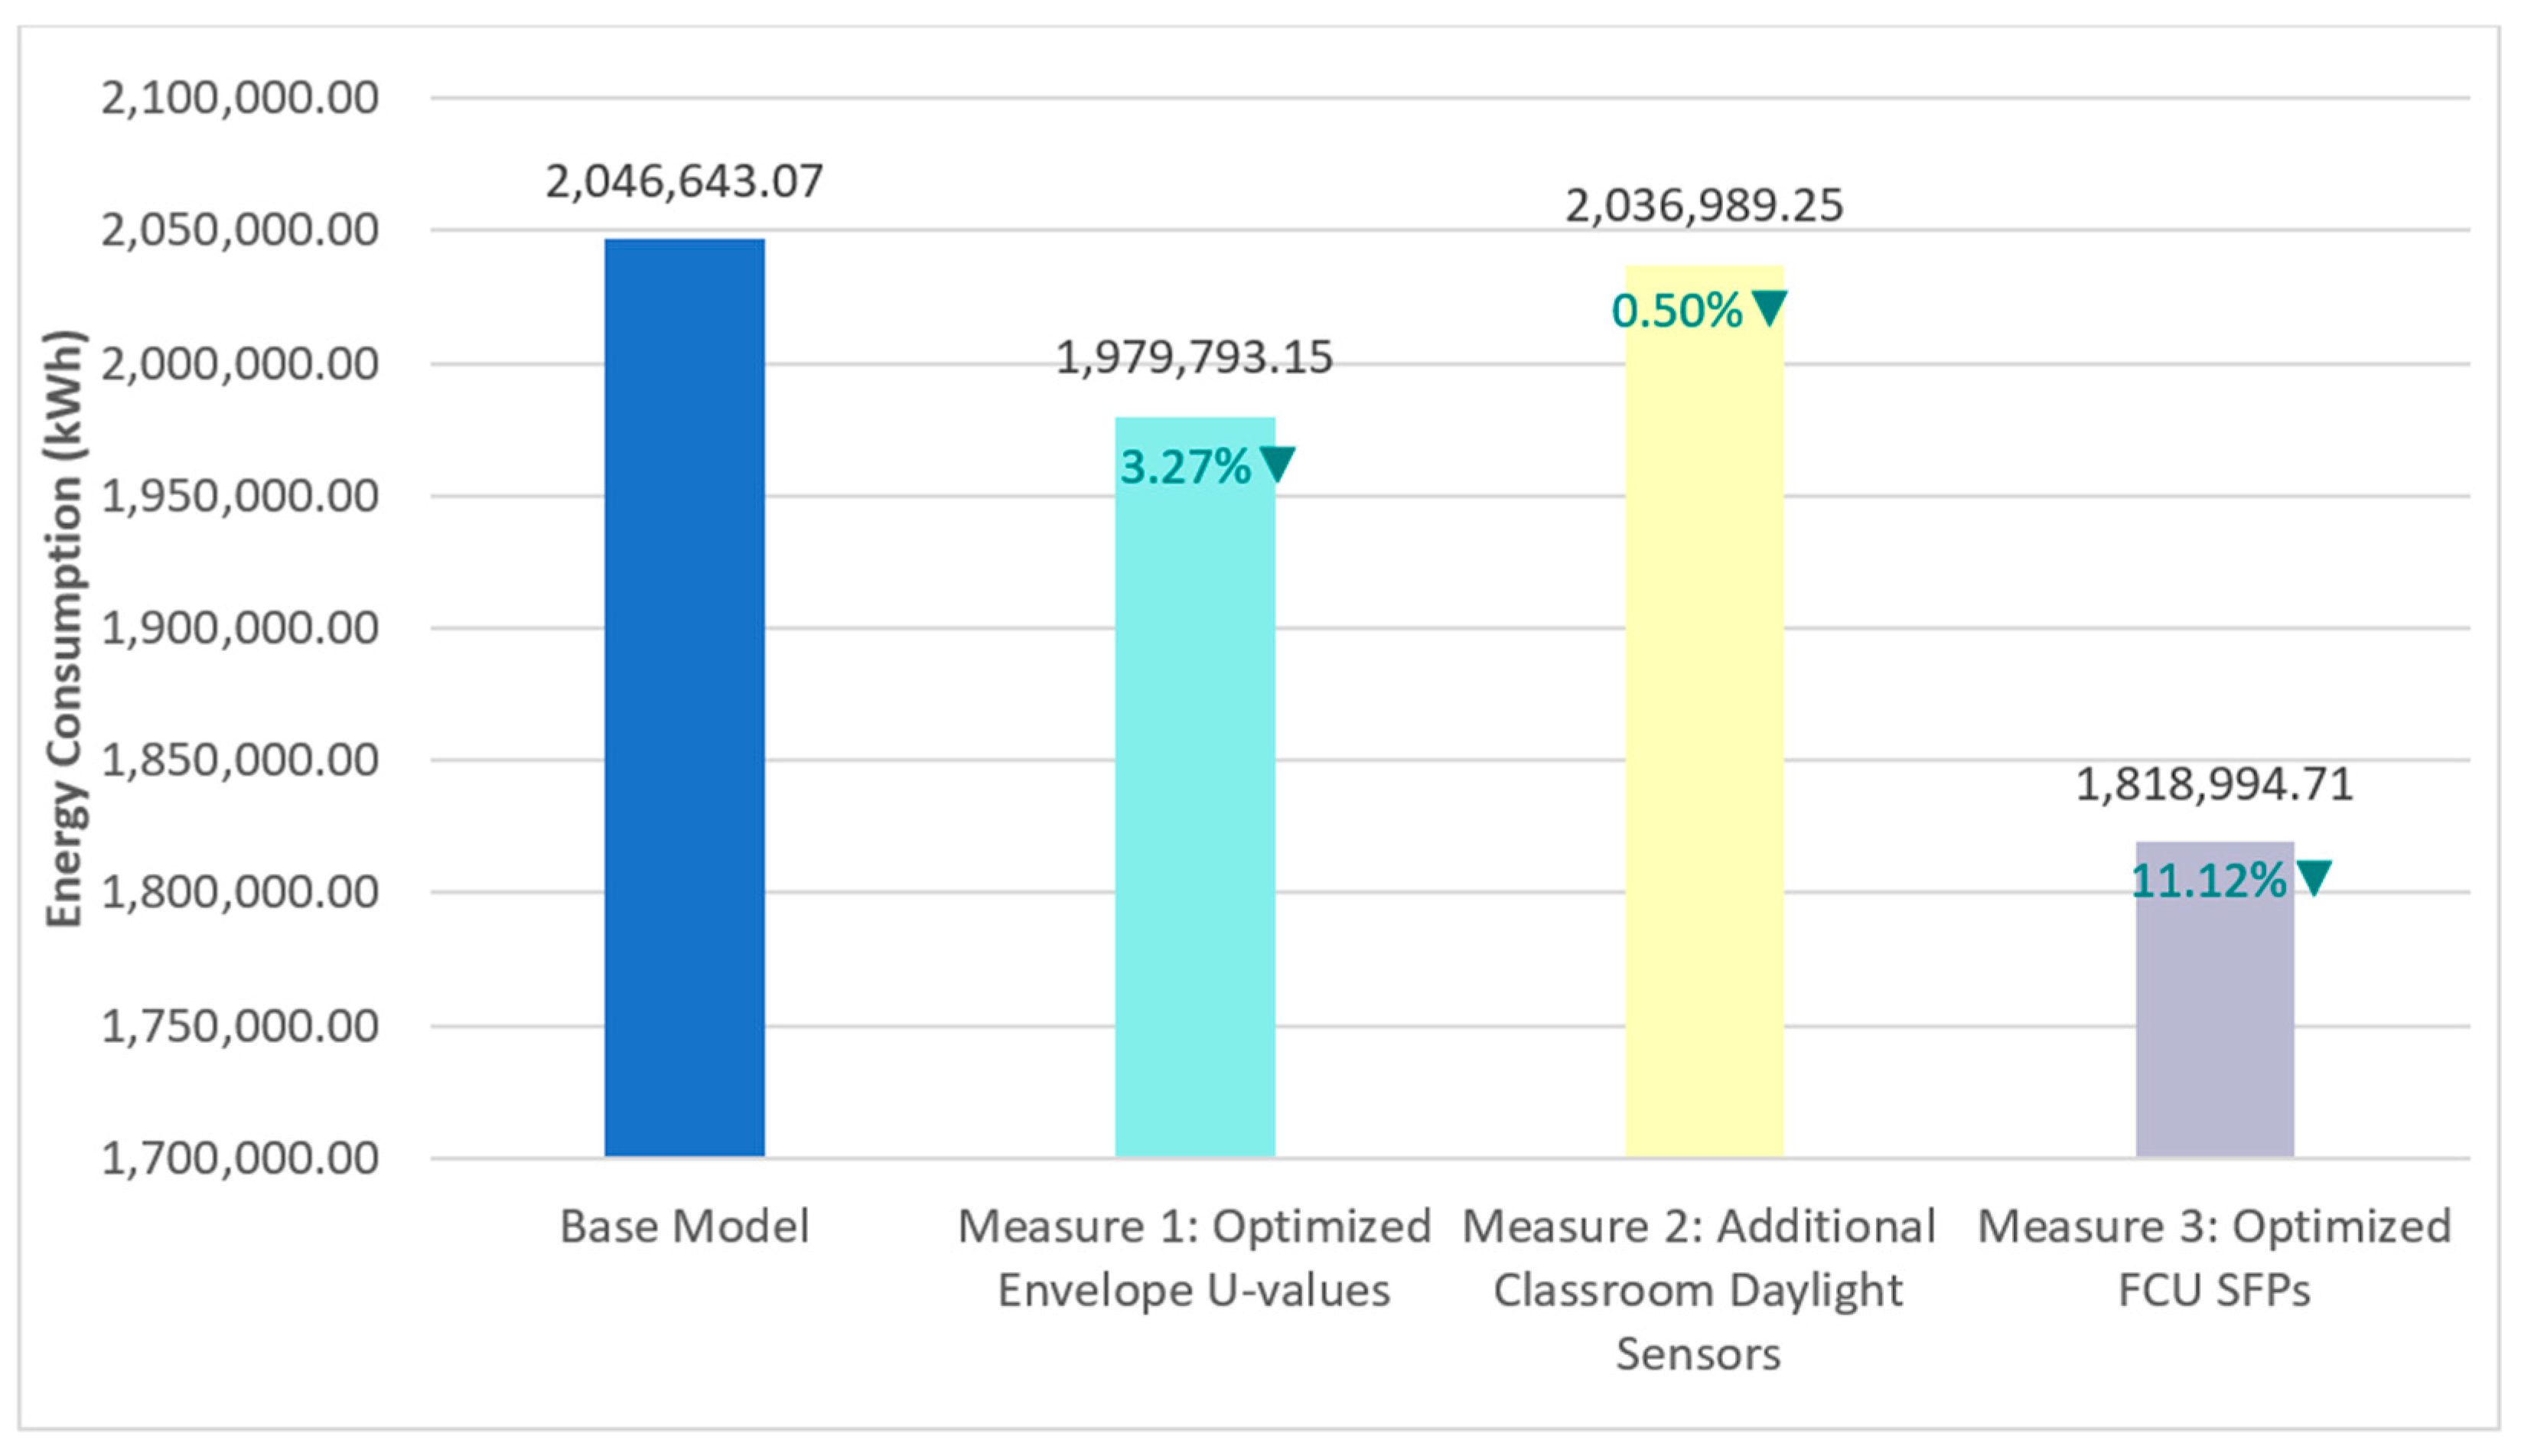
Figure 14 represents a summary of the energy savings achieved by each measure, as well as the energy end-use breakdown for the base model of the campus and for the proposed ECMs. Each graph highlights the percentage reduction in energy consumption for individual end-use categories, demonstrating the effectiveness of the proposed ECMs in reducing energy demand. On combining the proposed ECMs, 15% savings on the overall energy consumption can be obtained cumulatively, reducing the campus’s total energy consumption from 2046.64 MWh to 1739.64 MWh.

4.3. Cumulative Energy Savings Across ECMs

Table 16 summarizes the overall and end-use energy consumption for each ECM explored in this research, along with the overall and end-use energy savings achieved.
Figure 15 illustrates the savings on total energy consumption obtained for the three proposed ECMs (measures 1, 2, and 3). On combining the proposed ECMs, 15% savings on overall energy consumption can be obtained cumulatively, reducing the campus’s total energy consumption from 2046.64 MWh to 1739.64 MWh.
Achieving a 15% reduction in the overall energy consumption compared to the base model brings the EUI of the case study building down to 90 kWh/m2/year from 101.05 kWh/m2/year. This performance exceeds that of several high-performance buildings in the UAE, including the LEED Platinum-certified Siemens Headquarters in Masdar City, Abu Dhabi, which reports an EUI of 125 kWh/m2/year despite being an office building in a similarly arid climate [65]. Moreover, the case study building outperforms the typical range observed in educational facilities across Dubai, such as schools, kindergartens, and universities, which, according to the EGBC benchmarks, typically exhibit EUIs between 134 and 149 kWh/m2/year [66].
Positioning this outcome within the context of green building certification frameworks further supports its significance. Under the LEED O + M certification, achieving a 15% reduction in actual energy bills can earn the building up to 14 points under EAc Optimized Energy Efficiency [67]. Likewise, within Dubai’s local Al Sa’fat rating system, a 15% improvement in energy performance through envelope enhancements, lighting power density reductions, and on-site renewable energy integration substantially improves the building’s eligibility for the Golden Sa’fa classification [68]. In addition, the proposed renewable energy systems, which can offset approximately 8.09% of the total building energy demand, align with LEED O + M requirements for onsite renewables and may contribute up to five additional points [67]. Collectively, these comparisons highlight that case study building not only outperforms comparable typologies but will also be well-positioned to be rewarded under current sustainability frameworks and pursue future certifications with a strong performance baseline.
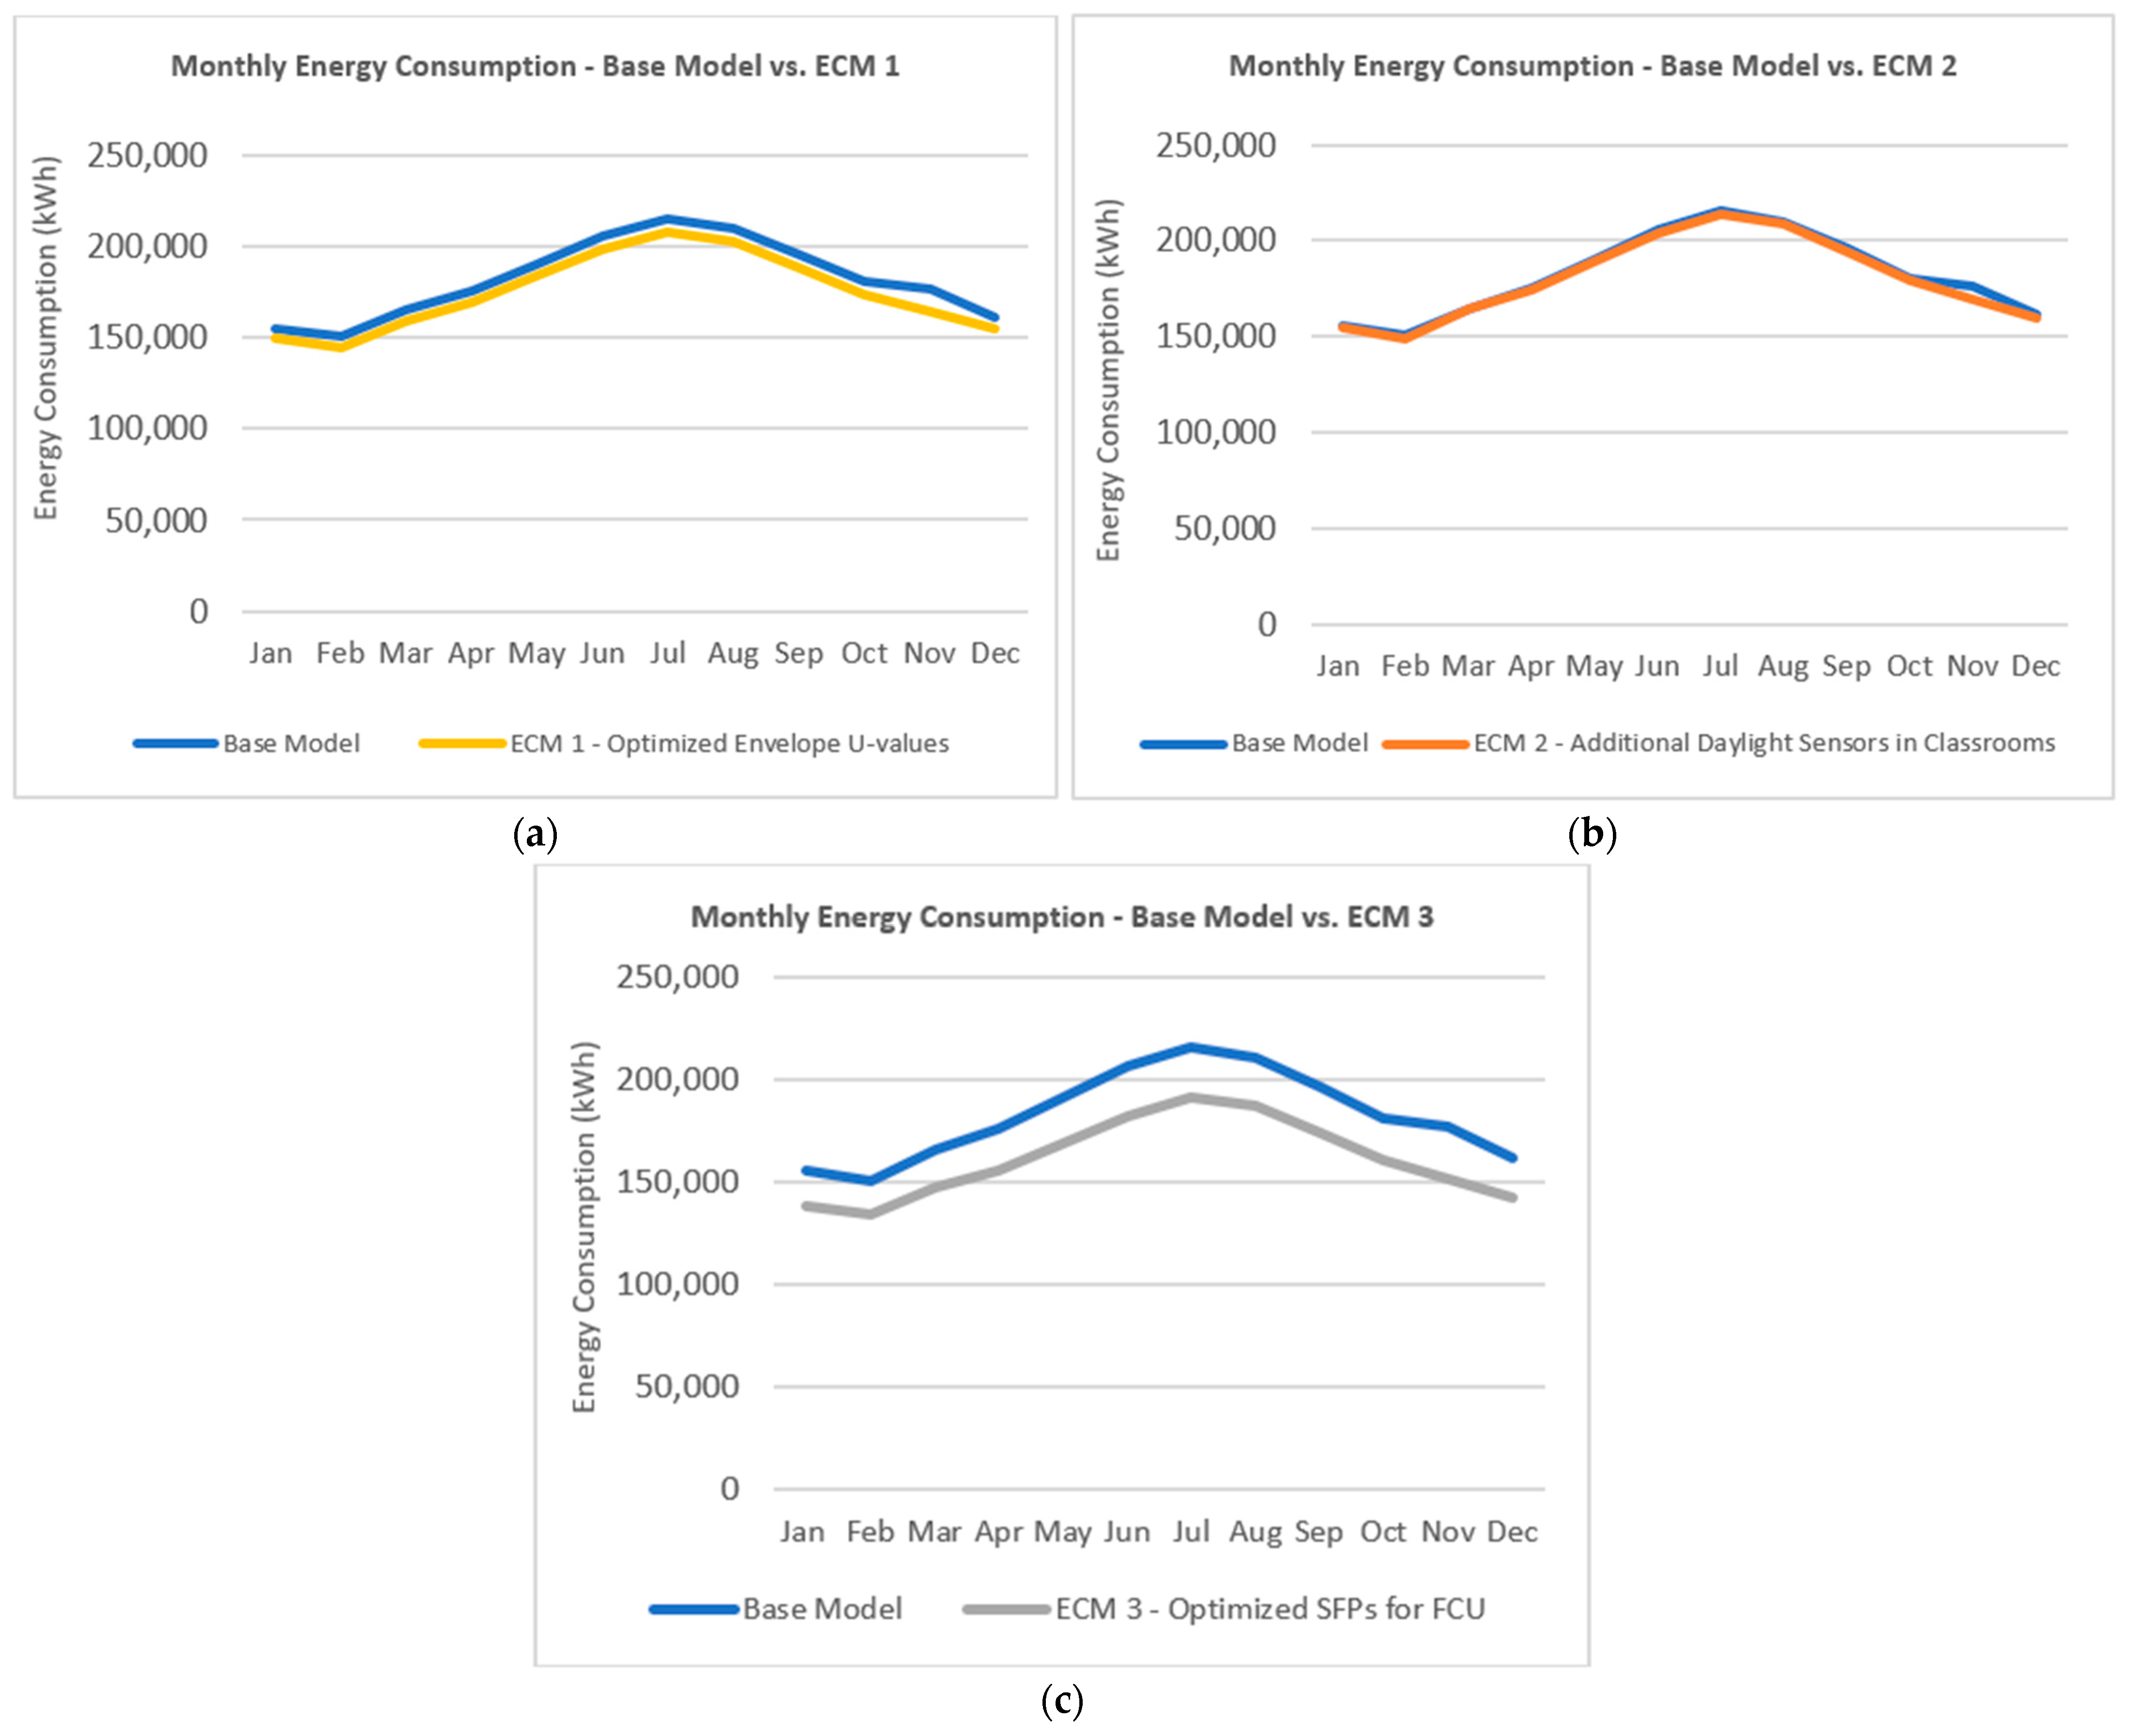
Figure 16 presents a comparative analysis of monthly energy consumption for the base model and each ECM. ECM 3 demonstrates the highest energy savings of 11.12%, largely driven by the reduction in HVAC fan energy use, which accounts for 20.74% of the campus’s total energy use. This is followed by ECM 1 (Optimized Envelope U-values), which demonstrates moderate savings of 3.27% through improved thermal performance of the building envelope, effectively minimizing heat ingress and lowering cooling demand. Lastly, ECM 2 yielded minimal energy savings of 0.50% since the integration of additional sensors was implemented only in classrooms, which comprise 8% of the campus’s total spaces, resulting in limited influence on overall energy use.

4.4. Thermal Comfort Assessment Across the ECMs

In addition to evaluating the energy performance enhancements of the proposed ECMs, this study also investigated the thermal comfort implications of the proposed ECMs using the IES digital twin models. The assessment focused on three key thermal comfort parameters within the campus: operative indoor dry-bulb temperatures, PMV, and PPD indices, in line with ASHRAE Standard 55.

4.4.1. Operative Indoor Temperatures

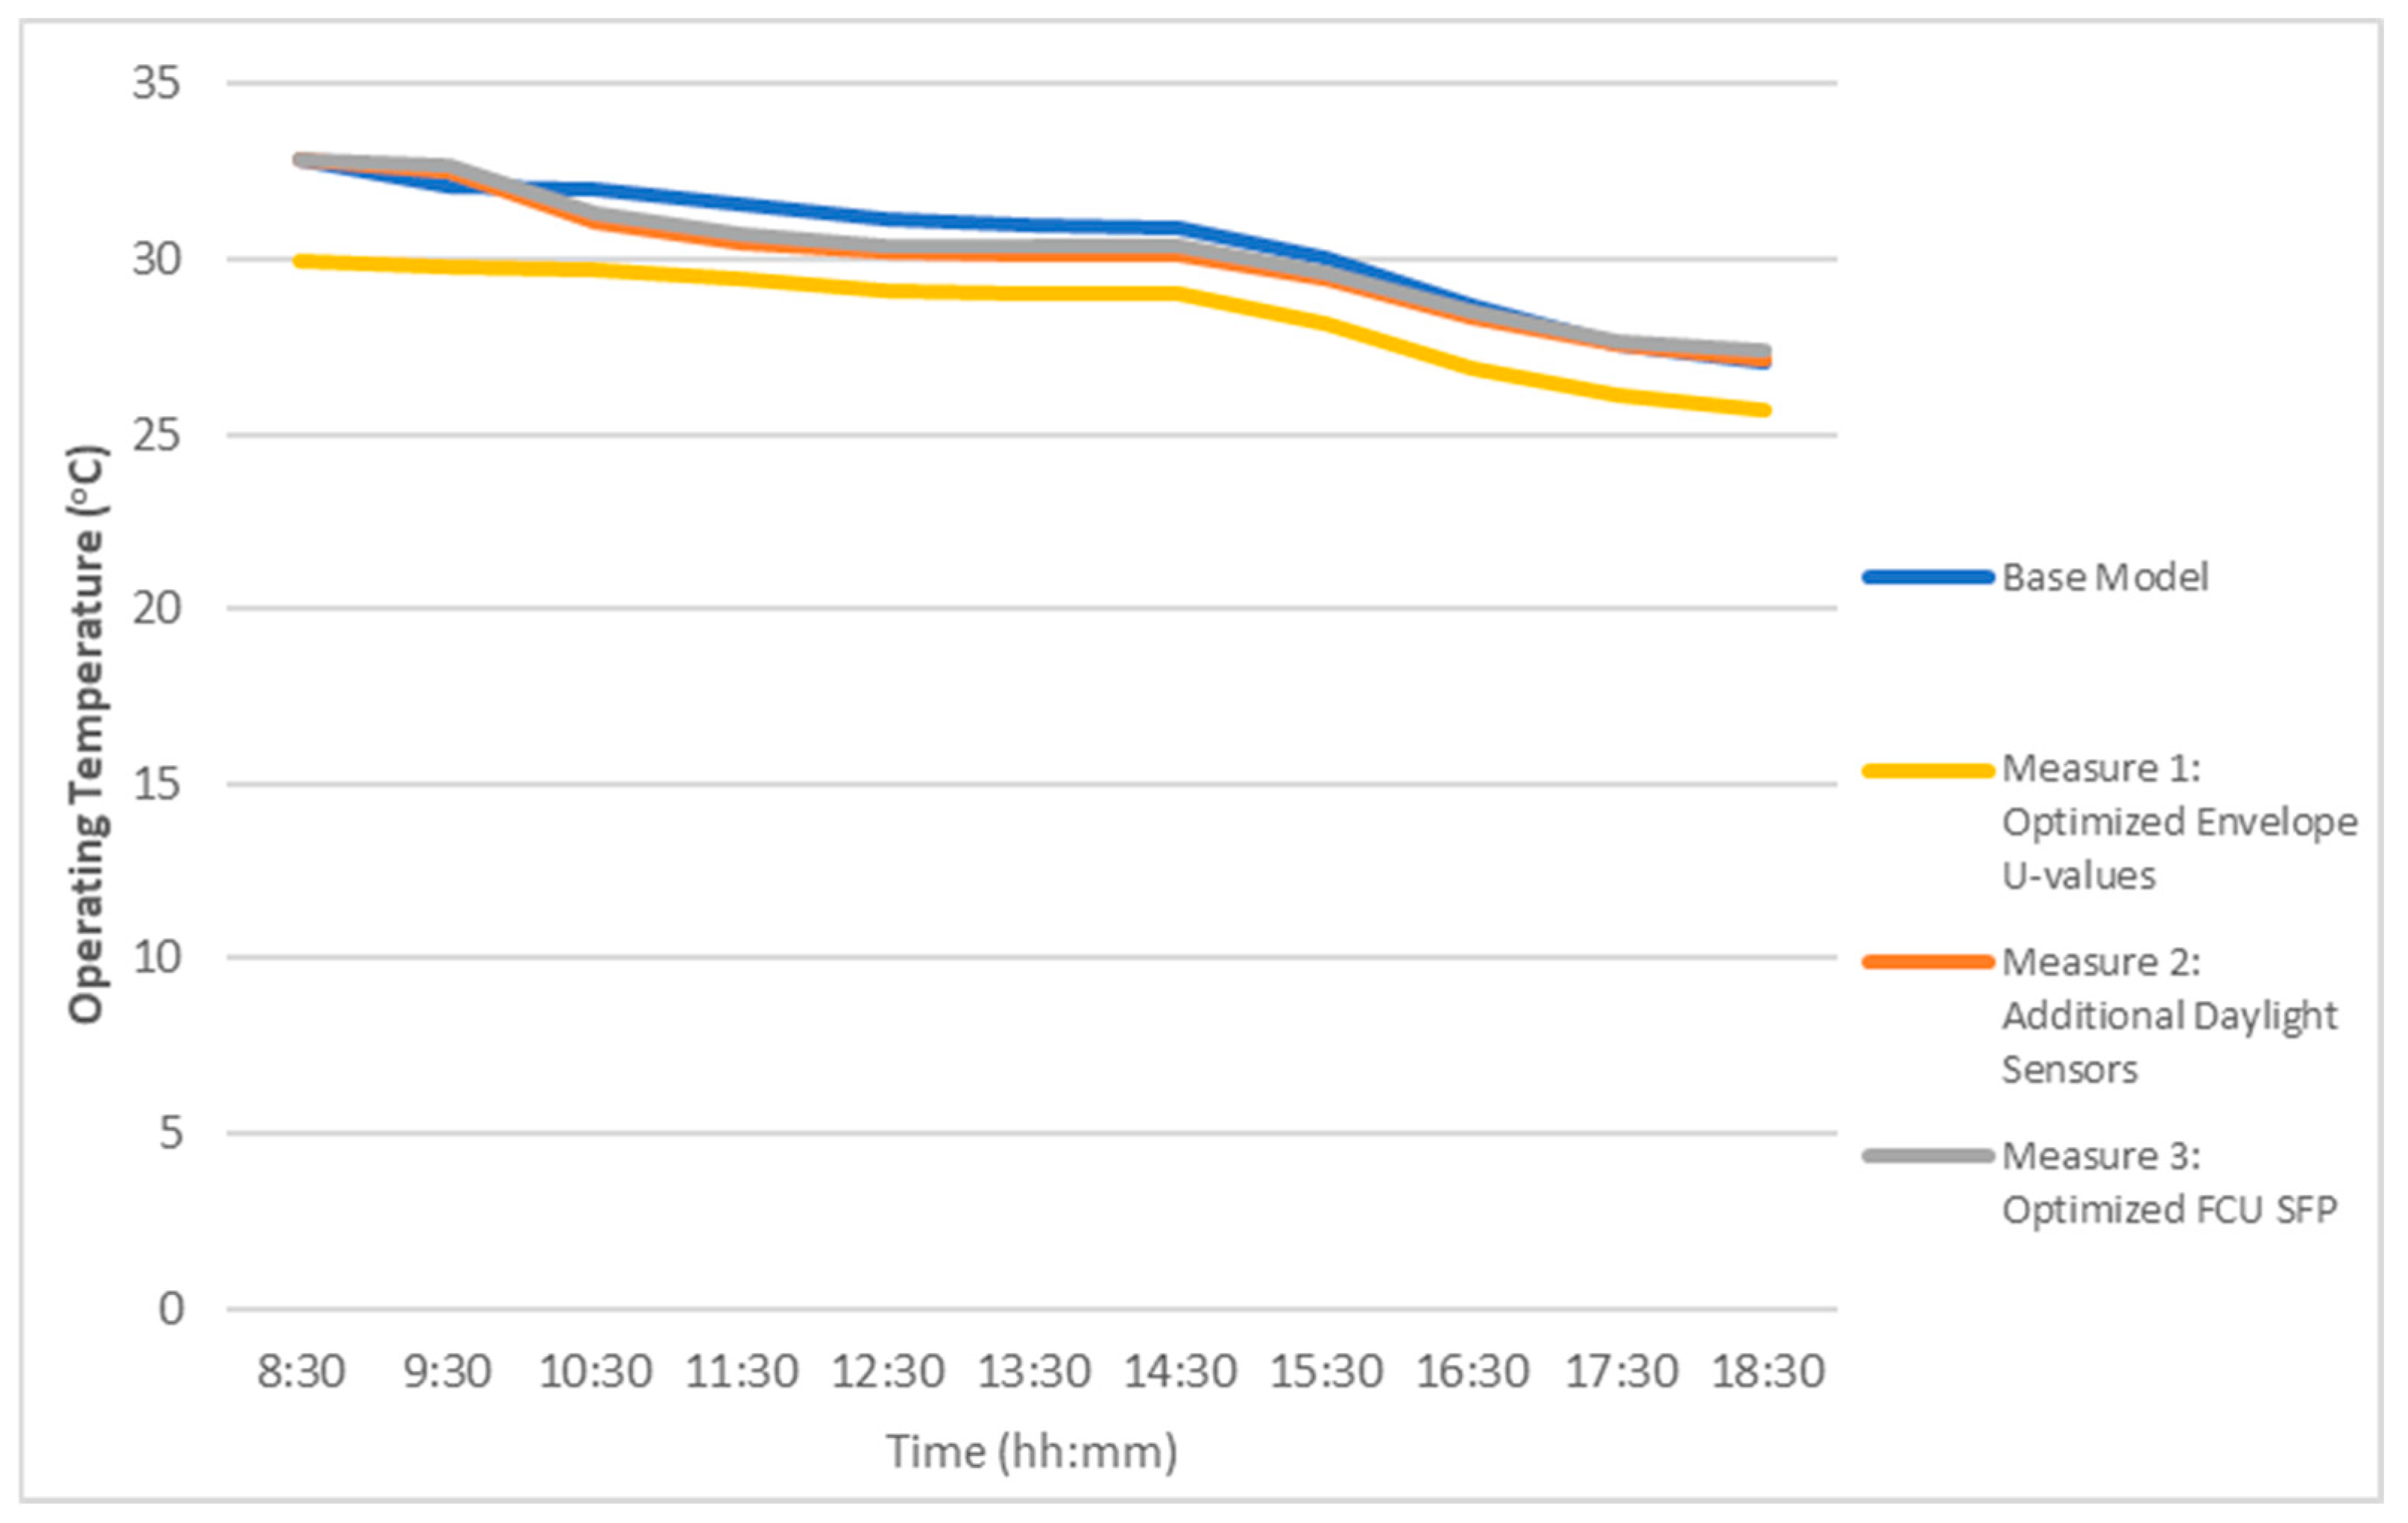
Figure 17 demonstrates the hourly trend in operative indoor dry-bulb temperatures across the base model and the three ECM scenarios during the campus operating hours (from 8:30 a.m. to 6:00 p.m.). Among the ECMs proposed, Measure 1: Enhanced Envelope U-values yielded a significant improvement in indoor thermal conditions, demonstrating a lower, comfortable temperature throughout the day. Compared to the base model, which maintained average operating temperatures around 30 °C, ECM Measure 1 recorded a much lower average operating temperature of 27 °C, especially during the mid-to-late afternoon hours. This improvement reflects enhanced thermal resistance resulting from optimized building envelope insulation, which reduces heat ingress from the external environment. All other ECMs (Measure 2: Additional Daylight Sensors and Measure 3: Optimized FCU SFP) showed marginal improvements over the base model operating temperatures, but maintained temperatures above 28–29 °C for most of the day. The relatively higher temperatures observed during the early morning hours (08:30–10:30) across all scenarios are attributed to HVAC system ramp-up, with conditions stabilizing by midday and gradually decreasing in the late afternoon. Furthermore, Figure 17 also indicates that Measure 1 maintained stable temperatures, while others fluctuated and depict temperature peaks, particularly in the early operating hours.

4.4.2. Predicted Mean Vote (PMV) and Predicted Percentage Dissatisfied (PPD)

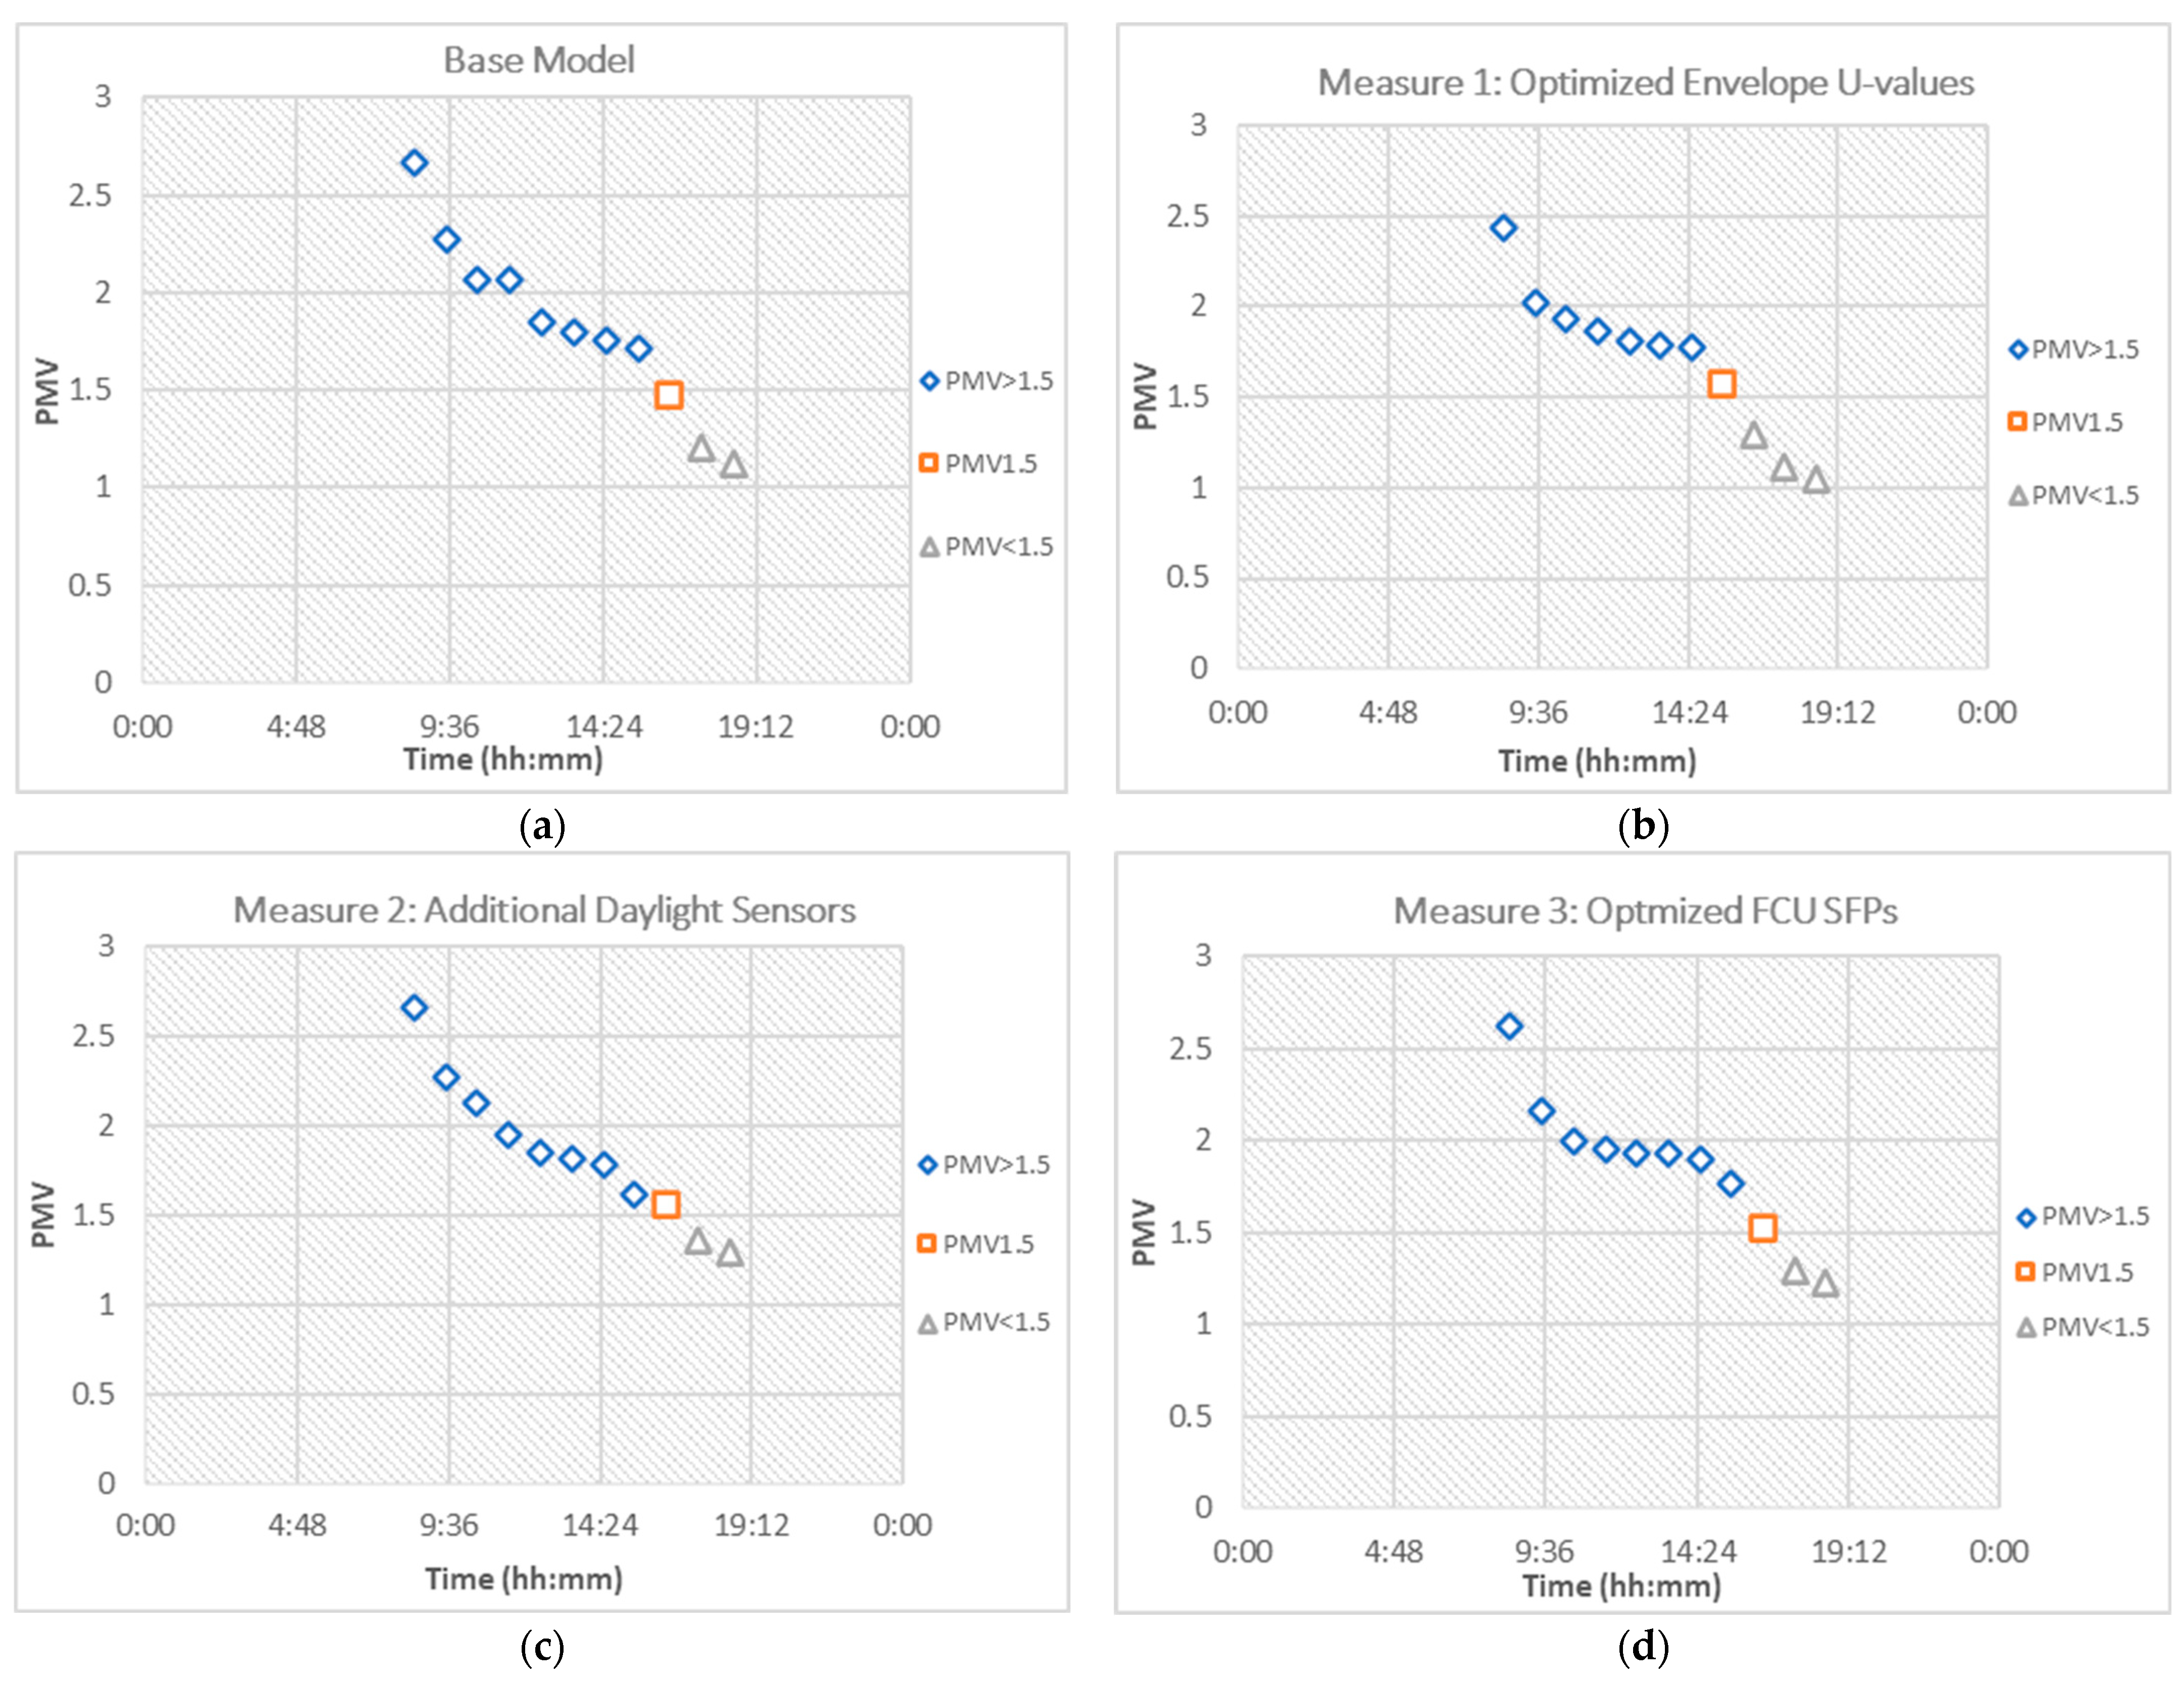
The PMV values demonstrated a deeper understanding of the thermal comfort properties within the occupiable zones on the campus. The PMV metric is based on Fanger’s scale and is widely adopted by ASHRAE Standard 55 and ISO 7730, ranging between −3 (cold) to +3 (hot), while PPD estimates depict the percentage of individuals likely to perceive discomfort at a given PMV level [6,9]. As per ASHRAE Standard 55, optimal thermal comfort is defined within PMV ranges of −0.5 to +0.5, corresponding to PPD levels ≤ 10% [9,10]. However, several studies on existing buildings in hot climates have shown that occupants often tolerate permissive thermal comfort conditions, within acceptable PMV ranges of ±1.0 and ±1.5. This is largely attributed to higher adaptive comfort levels observed in warmer regions [68,69]. Studies across countries like Kuwait, Saudi Arabia, Qatar, and the UAE support the adoption of region-specific thresholds, where occupants have demonstrated thermally comfortable conditions even when the PMVs are higher by 0.33 and 0.75, at operating temperatures of about 26 °C [6,11]. Based on such region-specific findings, this study adopts a permissible comfort range of PMV ≤ 1.5 and PPD ≤ 20%.
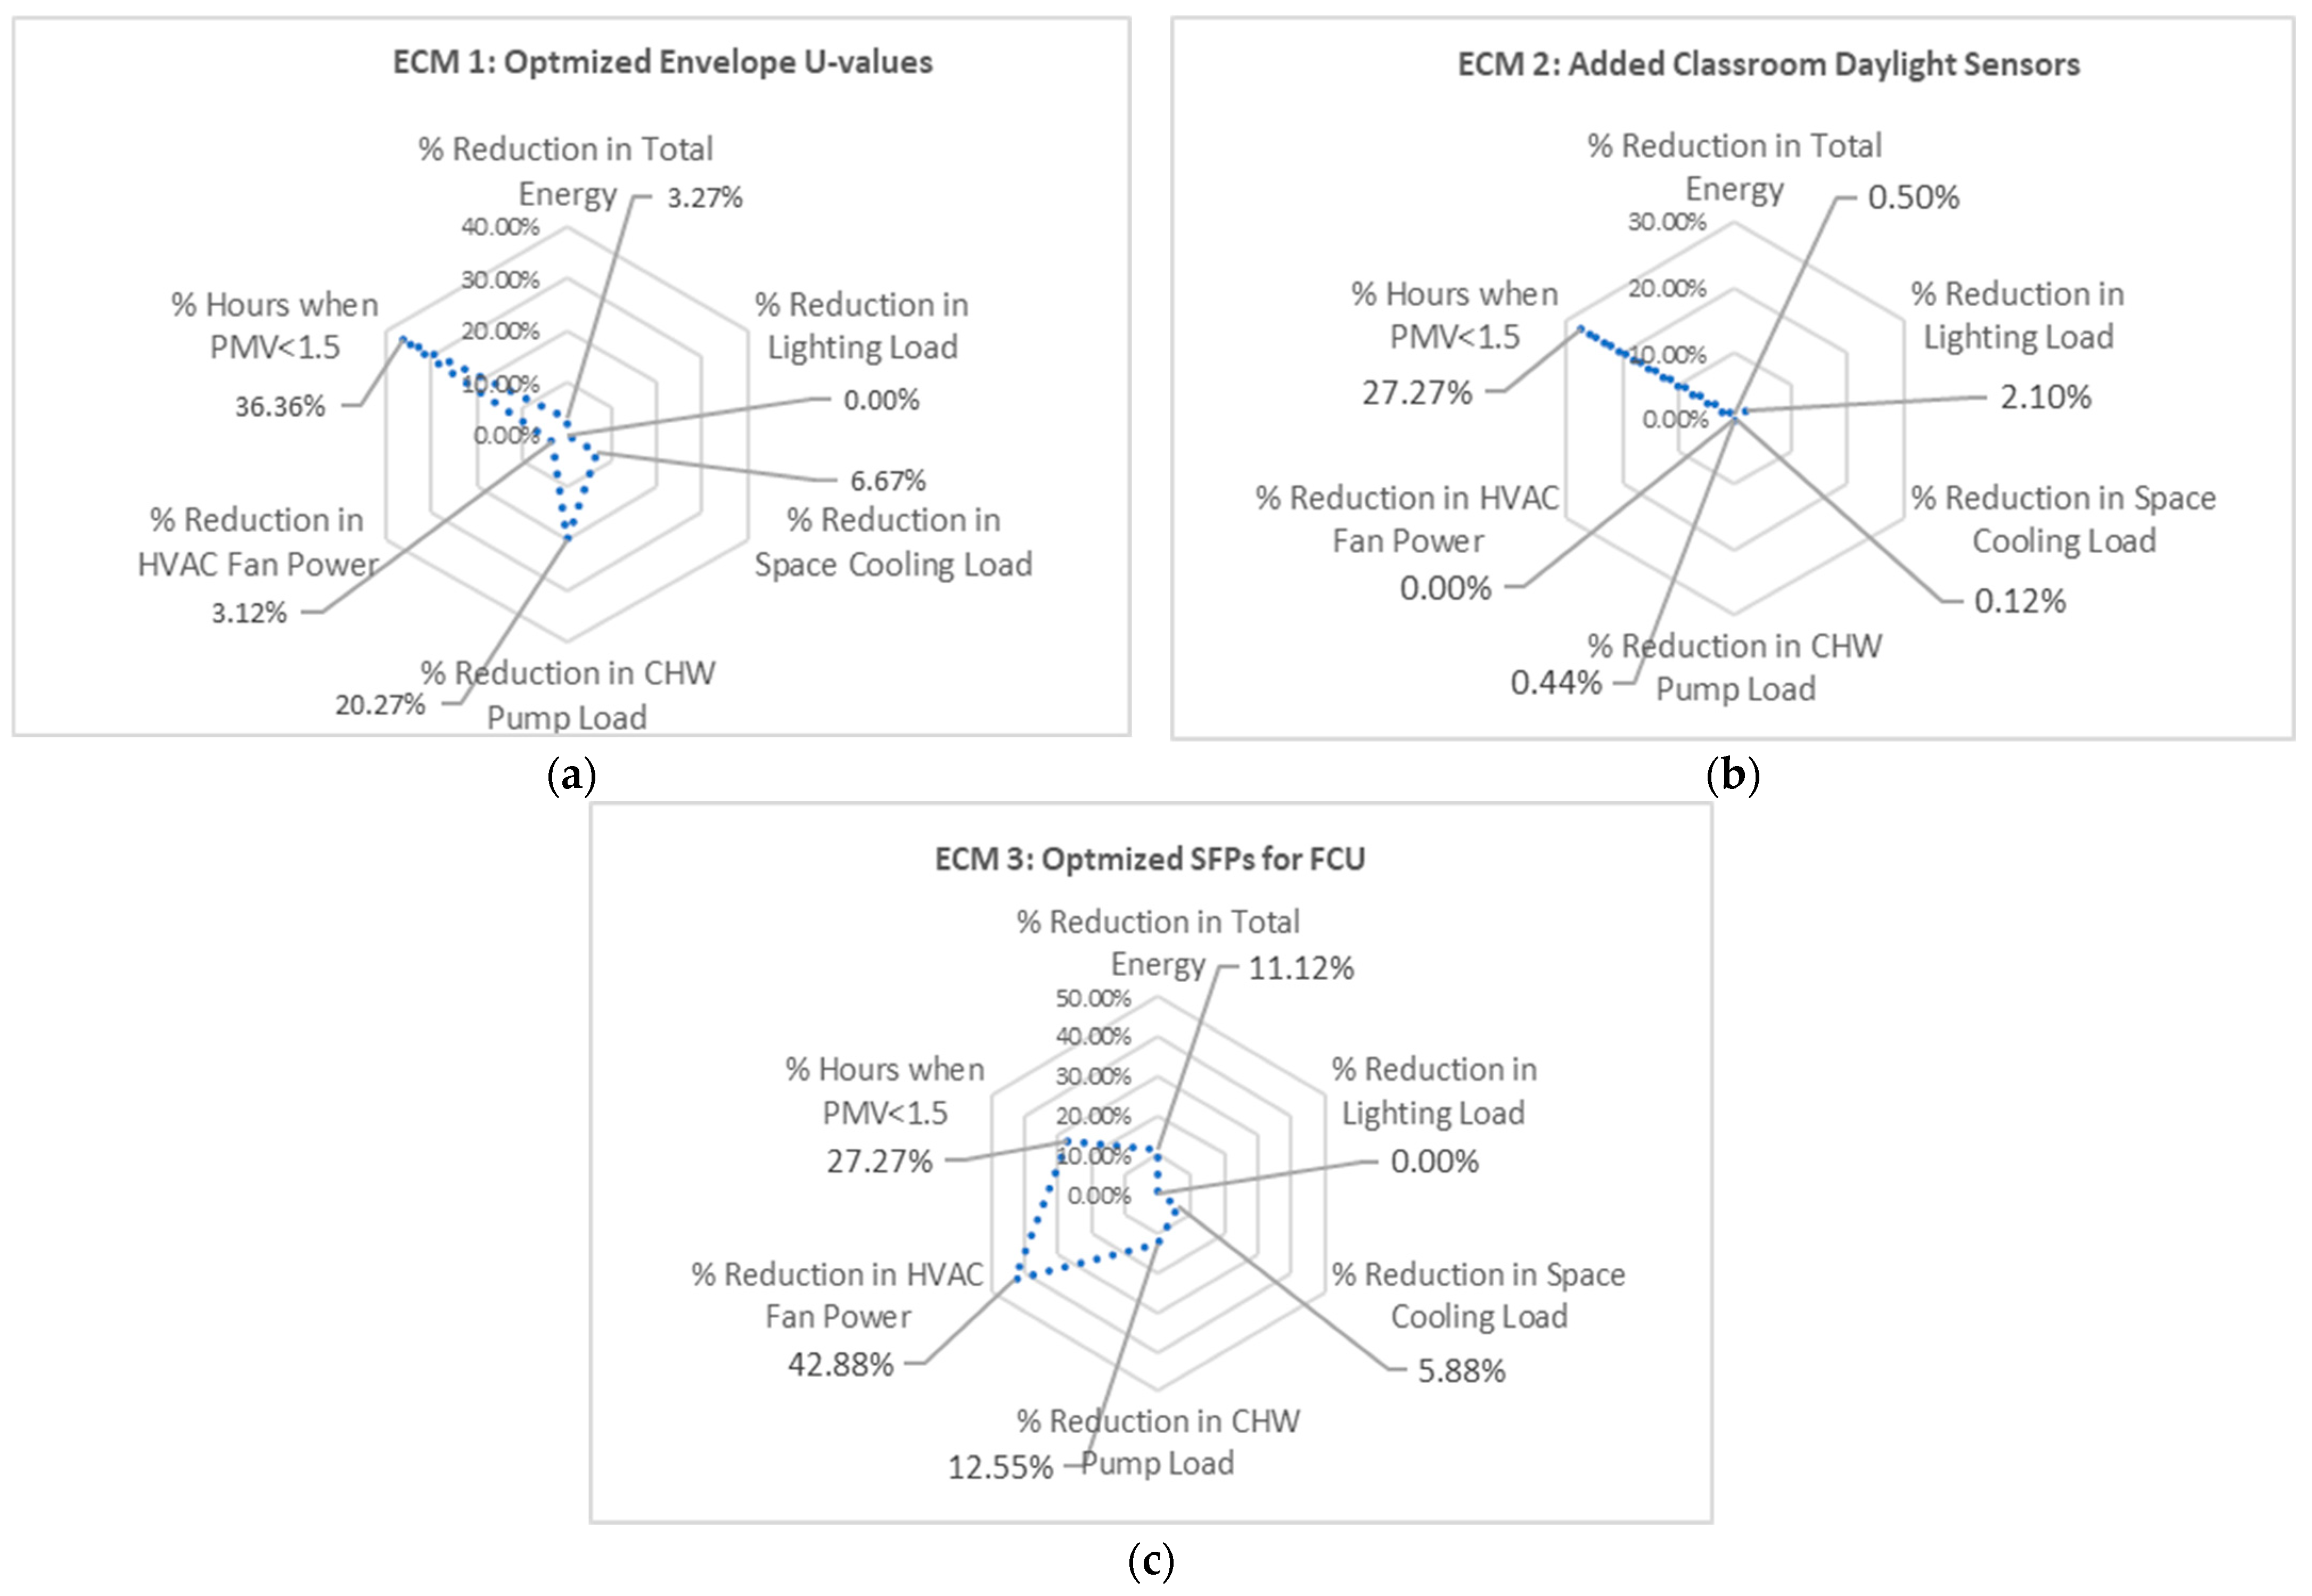
Figure 18 indicates that 36.40% of the PMVs were closer to the thermal comfort range of ≤1.5 when optimizing the envelope U-values, whereas for the base model and all other ECMs, only 27.30% of the PMVs were found to be within the thermally comfortable range of ≤1.5. Figure 18 also shows that a considerable percentage of PMVs in other ECM scenarios were higher, reaching the PMV ranges of “hot” at PMV > 2.0 and PMV = 2.5 conditions during peak hours, a condition significantly minimized in the lower U-value strategy.
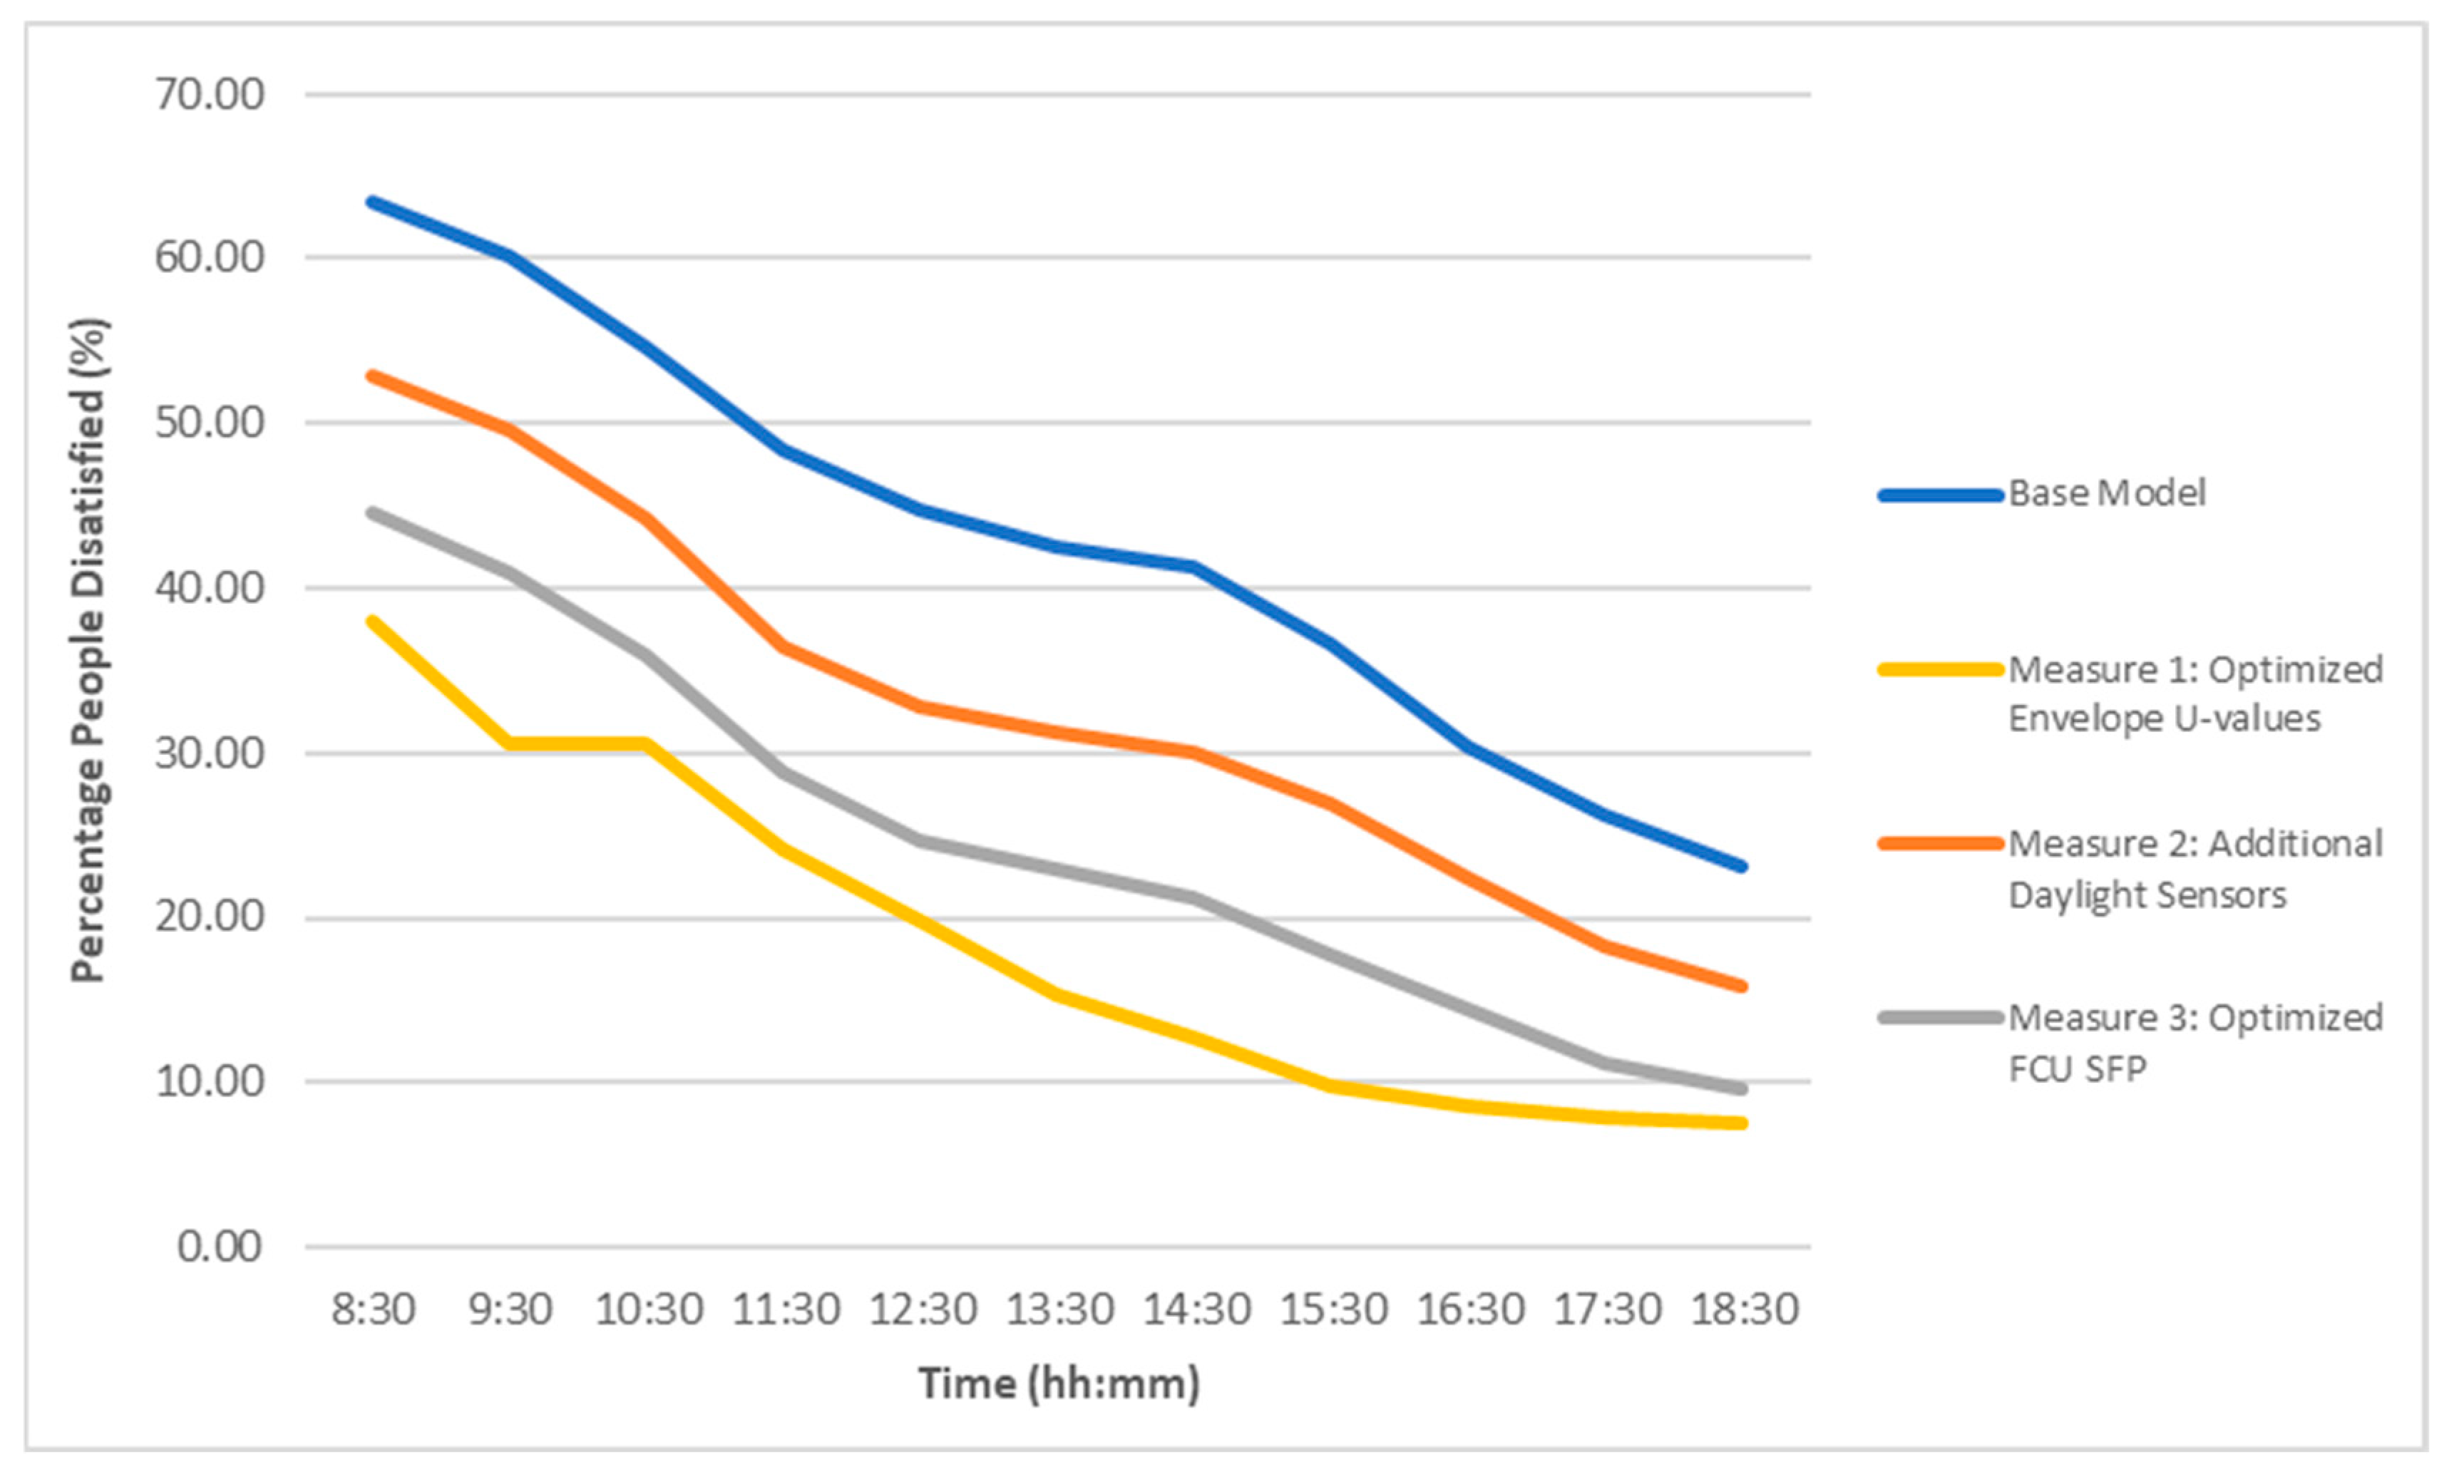
The PPD values across the evaluated ECMs demonstrate notable variations in thermal comfort during the campus operational hours. Among all scenarios, the optimized envelope U-values (Measure 1) consistently yielded the lowest PPD levels, with values declining steadily from 38.00% in the early hours due to HVAC system start-up lag and residual overnight heat gain. The values dropped to below 10.00% by late afternoon, aligning well with ASHRAE comfort thresholds. The improved FCU SFP scenario (Measure 3) also showed favorable performance, maintaining moderate PPD levels between 45.00% and 10.00% across the day. The additional daylight sensor strategy (Measure 2) exhibited slightly higher PPD values, ranging from approximately 53.00% in the morning to around 16.00% in the evening. The base model, while still falling within a reasonable range, recorded the highest PPD values throughout the day, with early-hour peaks above 60.00% and gradual improvement observed toward evening. These results reflect the relative influence of each ECM on perceived thermal comfort, emphasizing the effectiveness of envelope enhancements and HVAC fan efficiency in improving occupant satisfaction. Figure 19 depicts the hourly trend in PPD levels across the base model and the three ECM scenarios during the campus operating hours.
Among the three ECMs, Measure 1 (Optimized Envelope U-values) yielded the most substantial improvements in thermal comfort, followed by Measure 3 (Optimized SFPs for FCUs), with Measure 2 (Integration of Daylight Sensors) contributing marginally. These findings underscore the importance of considering occupant comfort alongside energy performance in retrofit strategies. The integration of thermal comfort assessments into the evaluation of ECMs provides a more holistic understanding of their benefits, ensuring that energy conservation measures do not compromise, and ideally enhance occupant well-being.
Furthermore, to facilitate a comparative assessment of the ECMs, Figure 20 presents an integrated analysis of their energy conservation results and thermal comfort performance. Energy conservation parameters include reductions in total consumption and key end uses such as lighting, space cooling, HVAC fans, and CHW pumps, while thermal comfort is represented by occupied hours with PMV < 1.5. ECM 1 demonstrates the highest thermal comfort improvement, with 36.36% of occupied hours within the PMV threshold of 1.5, with significant reductions in overall energy use (3.27%) and chilled water pump loads (20.27%). In contrast, ECM 2 achieves only 27.27% thermally comfortable hours when PMV remains within 1.5, and yields minimal energy savings of 0.5%. ECM 3 similarly records 27.27% comfort hours but delivers the highest total energy savings of 11.12%, primarily driven by significant reductions in HVAC fan energy consumption (42.88%).

5. Conclusions

This study evaluated the performance of a LEED Gold-certified university campus building in Dubai through digital twin thermal modelling using IES simulation software, focusing on both energy efficiency and thermal comfort. The campus building demonstrated a 31% reduction in energy demand during its design stage, compared to the ASHRAE baseline building with no LEED-recommended energy efficiency design components. This research proposed three energy conservation measures that projected an additional 15% energy reduction in operational energy demand. Among the three ECMs proposed, optimizing FCU fan performance (ECM 3) delivered the highest energy savings of 11.12%, followed by envelope insulation optimization (ECM 1) at 3.27% and additional daylight sensor controls (ECM 2) at 0.50%.
While Measure 3 was the most effective in terms of optimizing the campus’s energy performance, the thermal comfort analysis of the three ECMs revealed that it did not sufficiently improve thermal comfort, with PMV and PPD levels exceeding comfort thresholds during most occupied hours. In contrast, Measure 1 demonstrated a more balanced performance, reducing energy use while maintaining indoor thermal conditions within the ASHRAE Standard 55 comfort range. The findings of this research emphasize the importance of evaluating retrofit strategies not only on energy metrics but also their implications for occupant comfort and well-being.
The proposed integration of a 228.87 kW solar PV system further supports the building’s transition towards Net Zero energy efficiency, offsetting 8.09% of its annual energy consumption. By applying thermal modelling to a newer, green-rated building and assessing retrofitting impacts on both operational energy and thermal comfort, this research addresses a substantial gap in the existing literature. It offers a practical and replicable framework for advancing building performance in hot climate regions, contributing meaningfully to the UAE’s Net Zero 2050 ambitions.
While envelope insulation retrofits demonstrated a balanced improvement in both energy performance and thermal comfort, their higher capital costs and potential operational disruptions require a detailed lifecycle cost-benefit analysis. In contrast, active retrofits such as FCU fan power optimization offer quicker returns with less invasive implementation. A multi-criteria decision-making framework that considers cost, energy savings, occupant comfort, installation complexity, and environmental impact would better guide stakeholders in identifying optimal retrofit strategies for hot-climate contexts such as the UAE. To promote wider adoption of such retrofitting schemes in large institutional buildings, several targeted policy actions can be introduced by the local authorities. Introducing retrofit-specific incentives under existing demand-side management programs in Dubai will encourage adoption of cost-intensive yet effective retrofitting strategies. Furthermore, integrating retrofit performance requirements within building permit renewal processes for facilities over a defined GFA threshold and mandating annual improvements in energy performance would enhance alignment with the UAE’s Net Zero by 2050 goals. Moreover, upgrading existing green building regulations, such as the DGBR, by mandating retrofit compliance paths for existing buildings would further support systematic improvements in building performance.
Author Contributions

Conceptualization, K.M. and M.N.; methodology, K.M. and M.N.; software, K.M.; validation, K.M., M.N. and H.N.C.; formal analysis, K.M.; investigation, K.M., M.N. and H.N.C.; resources, M.N. and K.M.; data curation, K.M., M.N. and H.N.C.; writing—original draft preparation, K.M.; writing—review and editing, K.M., M.N. and H.N.C.; visualization, M.N. and H.N.C.; supervision, M.N. and H.N.C.; project administration, M.N. All authors have read and agreed to the published version of the manuscript.

Funding

This research received no external funding.

Data Availability Statement

The data utilized for the research are contained within the manuscript. No additional data was utilized for this research.

Conflicts of Interest

The authors declare no conflicts of interest.

Abbreviations

The following abbreviations are used in this manuscript:
AHUAir Handling Unit
AMVActual Mean Vote
ASHRAEAmerican Society of Heating, Refrigerating and Air-Conditioning Engineers
BIMBuilding Information Modelling
CHWChilled water
COPCoefficient of Performance
DGBRDubai Green Building Regulations
DOASDedicated Outdoor Air System
DoEDepartment of Energy
DSCEDubai Supreme Council of Energy
DTDigital twin
ECMEnergy conservation measure
EGBCEmirates Green Building Council
EPDEquipment Power Density
ESCOEnergy Service Company
EUIEnergy Use Intensity
FCUFan coil unit
GBCsGreen Building Codes
GSASGlobal Sustainability Assessment System
HVACHeating Ventilation Air Conditioning
IEQIndoor environmental quality
IESIntegrated Environmental Solutions
LEEDLeadership in Energy and Environmental Design
LPDLighting power density
MAPEMean absolute percentage errors
MBEMean Bias Error
NRELNational Renewable Energy Laboratory
n-ZEBNearly Zero Energy Buildings
O + MOperation and Maintenance
PMVPredicted Mean Vote
PPDPredicted Percentage of Dissatisfaction
PVPhotovoltaic
RMSERoot Mean Square Error
SFPSpecific Fan Power
SHGCSolar Heat Gain Coefficient
UAEUnited Arab Emirates
VAVVariable air volume
WGBCWorld Green Building Council
WWRWindow-to-Wall Ratio

References

  1. UNEP. Global Status Report for Buildings and Construction—UN Environment Programme. 2024. Available online: https://www.unep.org/resources/report/global-status-report-buildings-and-construction (accessed on 2 July 2025).
  2. Albattah, M.; Attoye, D.E. A Quantitative Investigation on Awareness of Renewable Energy Building Technology in the United Arab Emirates. Sustainability 2021, 13, 6665. [Google Scholar] [CrossRef]
  3. Alkhateeb, E.; Abu-Hijleh, B. Potential for retrofitting a federal building in the UAE to net zero electricity building (nzeb). Heliyon 2019, 5, 2405–8440. [Google Scholar] [CrossRef] [PubMed]
  4. Shihabi, F.A. Net Zero Readiness Report, KPMG. 2024. Available online: https://kpmg.com/ae/en/home/insights/2023/11/net-zero-readiness-report-2023.html#:~:text=The%20UAE’s%20Energy%20Strategy%202050,carbon%20intensity%20of%20power%20generation (accessed on 2 July 2025).
  5. Rodriguez-Ubinas, E.; Alzarouni, S.; Alhammadi, N.; Alantali, M.; Behzad, F.; Sgouridis, S. Sustainability Through Energy Conservation Building Codes: Comparative Analysis of Green Building Regulations in the Middle East. WIT Trans. Ecol. Environ. 2020, 249, 85–100. [Google Scholar] [CrossRef]
  6. Elnaklah, R.; Alnuaimi, A.; Alotaibi, B.S.; Topriska, E.; Walker, I.; Natarajan, S. Thermal comfort standards in the Middle East: Current and future challenges. Build. Environ. 2021, 200, 107899. [Google Scholar] [CrossRef]
  7. ASHRAE Standard 55-2017; Thermal Environmental Conditions for Human Occupancy. ASHRAE: Tullie Circle, NE, USA; Atlanta, GA, USA, 2020; pp. 3–14. Available online: https://www.ashrae.org/file%20library/technical%20resources/standards%20and%20guidelines/standards%20addenda/55_2017_d_20200731.pdf (accessed on 3 August 2025).
  8. ISO 7730:2005(E); Ergonomics of the Thermal Environment—Analytical Determination and Interpretation of Thermal Comfort Using Calculation of the PMV and PPD Indices and Local Thermal Comfort Criteria. International Organization for Standardization: Geneva, Switzerland, 2005; pp. 7–13. Available online: https://cdn.standards.iteh.ai/samples/39155/9632a0563ca742209edb45856ff69296/ISO-7730-2005.pdf (accessed on 3 August 2025).
  9. Perera, I.; Hewage, K.; Rana, A.; Sadiq, R. Combining Energy Performance and Indoor Environmental Quality (IEQ) in Buildings: A Systematic Review on Common IEQ Guidelines and Energy Codes in North America. Energies 2025, 18, 1740. [Google Scholar] [CrossRef]
  10. Shaikh, Z.; Chaudhry, H.N. Energy Modelling and Indoor Air Quality Analysis of Cooling Systems for Buildings in Hot Climates. Fluids 2018, 3, 77. [Google Scholar] [CrossRef]
  11. Al-Ajmi, F.F.; Loveday, D.L. Indoor thermal conditions and thermal comfort in air-conditioned domestic buildings in the dry-desert climate of Kuwait. Build. Environ. 2010, 45, 704–710. [Google Scholar] [CrossRef]
  12. Al-Ajmi, F.F. Thermal comfort in air-conditioned mosques in the dry desert climate. Build. Environ. 2010, 45, 2407–2413. [Google Scholar] [CrossRef]
  13. Bluvalt. Mostadam D + C Commercial Buildings Technical Guide 2019. 2024, pp. 152–155. Available online: https://subdivision-prod.ruh-s3.bluvalt.com/s3fs-public/mostadam/2024-05/Mostadam%20for%20Commercial%20Buildings%20%28D%2BC%29.pdf (accessed on 19 July 2025).
  14. GSAS Qatar. GSAS Technical Guide 2019. 2021, pp. 37–39. Available online: https://gsas.gord.qa/wp-content/uploads/2021/10/GSAS-Technical-Guide_2019.pdf (accessed on 19 July 2025).
  15. Liu, M.; Fang, S.; Dong, H.; Xu, C. Review of Digital Twin about concepts, technologies, and Industrial Applications. J. Manuf. Syst. 2020, 58, 346–361. [Google Scholar] [CrossRef]
  16. Sun, H.; Liu, Z.; Lv, Z. Research on Intelligent Dispatching System Management Platform for Construction Projects Based on Digital Twin and BIM Technology. Adv. Civ. Eng. 2019, 2022, 8273451. [Google Scholar] [CrossRef]
  17. Krarti, M. Evaluation of Energy Efficiency Potential for the Building Sector in the Arab Region. Energies 2019, 12, 4279. [Google Scholar] [CrossRef]
  18. EmiratesGBC. UAE Sustainability Environment Built Blueprint. 2024, pp. 24–44. Available online: https://emiratesgbc.org/wp-content/uploads/2024/03/EGBC_UAE-Sustainability-Built-Environment-Blueprint_FINAL_v2.pdf (accessed on 5 February 2024).
  19. Sustainability Middle East News Service, Dubai Supreme Council of Energy Reviews Performance of the Building Retrofit Programme. Available online: https://www.sustainabilitymenews.com/energy/dubai-supreme-council-of-energy-reviews-performance-of-the-building-retrofit-programme?utm.com (accessed on 19 July 2025).
  20. Dubaisce.gov.ae. Building Retrofits–Dubai Supreme Council of Energy. Available online: https://dubaisce.gov.ae/en/taqati/building-retrofits/ (accessed on 19 July 2025).
  21. Doe.gov.ae. Abu Dhabi Department of Energy Concludes Retrofit Tech Abu Dhabi 2025 Summit Driving Shift. Available online: https://www.doe.gov.ae/en/Media-Centre/News/Abu-Dhabi-Department-of-Energy-Concludes-Retrofit-Tech-Abu-Dhabi-2025-Summit-Driving-Shift?utm.com (accessed on 19 July 2025).
  22. Greentechno.com. Dubai Chamber (DC)|Green Technologies. Available online: https://www.greentechno.com/leed-design-project-management-dubai-chamber-dc/?utm.com (accessed on 19 July 2025).
  23. Difc.com. DIFC Continues to Turbo Charge Sustainability Drive with LEED Certifications Across Multiple Buildings. Available online: https://www.difc.com/whats-on/news/difc-continues-to-turbo-charge-sustainability-drive-with-leed-certifications?utm.com (accessed on 19 July 2025).
  24. Taleb, H.M. Using passive cooling strategies to improve thermal performance and reduce energy consumption of residential buildings in U.A.E. buildings. Front. Archit. Res. 2014, 3, 154–165. [Google Scholar] [CrossRef]
  25. Fayyad, M.; John, J. Advancing Deep Retrofits in the UAE Appendix, Emirates GBC. 2020, pp. 7–18. Available online: https://emiratesgbc.org/wp-content/uploads/2020/10/Advancing-Deep-Retrofits-Appendix_FINAL-.pdf (accessed on 26 April 2024).
  26. Demand Logic. Bridging the Performance Gap: Ensuring Sustainable Building Operations, Demandlogic.co.uk. 2025. Available online: https://www.demandlogic.co.uk/news-and-views/bridging-the-performance-gap-ensuring-sustainable-building-operations (accessed on 2 July 2025).
  27. de Wilde, P. The gap between predicted and measured energy performance of buildings: A framework for investigation. Autom. Constr. 2014, 41, 40–49. [Google Scholar] [CrossRef]
  28. USGBC. LEED Rating System. 2025. Available online: https://www.usgbc.org/leed (accessed on 2 July 2025).
  29. EmiratesGBC. UAE Has Nearly 64 Million sq m Built-Up Area as per Local Green Building Regulations: EmiratesGBC’s 2020 UAE Green Building Market Brief Study. 2020. Available online: https://emiratesgbc.org/press_releases/uae-has-nearly-64-million-sq-m-built-up-area-as-per-local-green-building-regulations-emiratesgbcs-2020-uae-green-building-market-brief-study/ (accessed on 5 February 2024).
  30. Verdinez, D. U.S. Green Building Council. USGBC Announces Top 10 Countries and Regions for LEED in 2021. 2022. Available online: https://www.usgbc.org/articles/usgbc-announces-top-10-countries-and-regions-leed-2021 (accessed on 5 February 2024).
  31. JLL. Real Estate Advisors & Professionals, A University that Is Leading the Way, Creates a Campus to Match. 2024. Available online: https://www.jll-mena.com/en/case-studies/heriot-watt-university-dubai (accessed on 5 February 2024).
  32. Attia, S.G.; Herde, A.D. Early Design Simulation Tools for Net Zero Energy Buildings: A Comparison of Ten Tools. In Proceedings of the Building Simulation: 12th Conference of International Building Performance Simulation Association, Sydney, Australia, 14–16 November 2011; pp. 94–98. Available online: https://publications.ibpsa.org/proceedings/bs/2011/papers/bs2011_1148.pdf (accessed on 5 February 2024).
  33. Dubai Municipality. Green Building Regulations & Specifications. 2018; pp. 54–55. Available online: https://www.dm.gov.ae/wp-content/uploads/2018/01/05_ENG_DCL_LawsLegislation_EngineeringSection_GreenBuildingRegulation.pdf (accessed on 6 July 2025).
  34. ASHRAE 90.1-2010; Energy Standard for Buildings Except Low-Rise Residential Buildings. ASHRAE: Tullie Circle, NE, USA; Atlanta, GA, USA, 2010; pp. 43–211. Available online: https://lorisweb.com/LEEDv4/graphics/ASHRAE%20Standards/ASHRAE-D-86267%2090.1-2010.pdf (accessed on 26 April 2024).
  35. ASHRAE 90.1-2016; Energy Standard for Buildings Except Low-Rise Residential Buildings. ASHRAE: Tullie Circle, NE, USA; Atlanta, GA, USA, 2021; pp. 131–134. Available online: https://www.ashrae.org/file%20library/technical%20resources/standards%20and%20guidelines/standards%20addenda/90.1-2016/90_1_2016_be_bm_bn_bo_bp_br_bs_bu_bv_cf_cl_cm_cq_ct_cu_cv_cw_cy_20210324.pdf?utm (accessed on 5 February 2024).
  36. Khalilnejad, A.; French, R.H.; Abramson, A.R. Evaluation of cooling setpoint setback savings in commercial buildings using electricity and exterior temperature time series data. Energy 2021, 233, 121117. [Google Scholar] [CrossRef]
  37. Empower. Conditions of Service (DCS). 2024. Available online: https://www.empower.ae/media/gtgaqbiy/dcs_terms_pdf (accessed on 26 April 2024).
  38. Li, J. Calibration of Energy Simulation Model Using Ies ve Software in Institutional Buildings—A Case Study of Nus Sde2. DSpace. 2025. Available online: https://scholarbank.nus.edu.sg/handle/10635/223636 (accessed on 26 April 2024).
  39. Al-Tamimi, N. Building envelope retrofitting strategies for energy-efficient office buildings in Saudi Arabia. Buildings 2022, 12, 1900. [Google Scholar] [CrossRef]
  40. ASHRAE Standard 169-2021; Climate Data for Building Design Standards. ASHRAE: Tullie Circle, NE, USA; Atlanta, GA, USA, 2021; pp. 10–230. Available online: https://www.scribd.com/document/832715351/ANSIASHRAE-Standard-169-2021-Climatic-Data-for-Building-Design-Standards-ASHRAE-Z-Library#:~:text=(Z%2DLibrary)-,ANSI/ASHRAE%20Standard%20169%2D2021%20provides%20comprehensive%20climatic%20data%20essential,ensuring%20its%20relevance%20and%20accuracy (accessed on 26 April 2024).
  41. Onebuilding.org. Climate.onebuilding.org. Available online: https://climate.onebuilding.org/?utm.com (accessed on 19 July 2025).
  42. Weatherspark.com. Dubai 2023 Past Weather (United Arab Emirates). Available online: https://weatherspark.com/h/y/105470/2023/Historical-Weather-during-2023-in-Dubai-United-Arab-Emirates (accessed on 19 July 2025).
  43. Bande, L.; Cabrera, A.G.; Kim, Y.K.; Afshari, A.; Ragusini, M.F.; Cooke, M.G. A Building Retrofit and Sensitivity Analysis in an Automatically Calibrated Model Considering the Urban Heat Island Effect in Abu Dhabi, UAE. Sustainability 2019, 11, 6905. [Google Scholar] [CrossRef]
  44. IESVE. The Impact of Weather File Selection. Available online: https://www.iesve.com/discoveries/view/29641/impact-of-weather-file-selection (accessed on 19 July 2025).
  45. Trosten Industries. Fan Coil Unit Manufacturers—AC FCU—Trosten Industries. Available online: https://www.trosten-industries.com/fcu-fan-coil-unit-manufacturer-uae/ (accessed on 26 April 2024).
  46. Dhaouadi, R.; Al-Othman, A.; Aidan, A.A.; Tawalbeh, M.; Zannerni, R. A characterization study for the properties of dust particles collected on photovoltaic (PV) panels in Sharjah, United Arab Emirates. Renew. Energy 2021, 171, 133–140. [Google Scholar] [CrossRef]
  47. Mankani, K.; Chaudhry, H.N.; Calautit, J.K. Optimization of an air-cooled heat sink for cooling of a solar photovoltaic panel: A computational study. Energy Build. 2022, 270, 112274. [Google Scholar] [CrossRef]
  48. Nrel.gov. Available online: https://docs.nrel.gov/docs/fy15osti/63234.pdf?utm.com (accessed on 19 July 2025).
  49. Solaredge.com. Available online: https://knowledge-center.solaredge.com/sites/kc/files/application_note_solaredge_inverters_efficiency.pdf?utm.com (accessed on 19 July 2025).
  50. Emirati-German Energy and Climate Partnership. Exploring the Potential of Wind Energy in the United Arab Emirates. 2023, pp. 16–22. Available online: https://energypartnership-uae.org/fileadmin/vae/publications/Guidehouse_Exploring_UAE_Wind_Energy_Potential_2023.pdf (accessed on 19 July 2025).
  51. Bošnjaković, M.; Veljić, N.; Hradovi, I. Perspectives of Building-Integrated Wind Turbines (BIWTs). Smart Cities 2025, 8, 55. [Google Scholar] [CrossRef]
  52. Dubois, M.-C.; Bisegna, F.; Gentile, N.; Knoop, M.; Matusiak, B.; Osterhaus, W.; Tetri, E. Retrofitting the electric lighting and daylighting systems to reduce energy use in buildings: A literature review. Energy Res. J. 2015, 6, 25–41. [Google Scholar] [CrossRef]
  53. Richman, E.E. Lumitron Lighting, Requirements for Lighting Levels. 2024. Available online: http://www.lumitronlighting.com/lighting_nowledge/LUX%20LEVEL_usace_Requirements%20for%20Lighting%20Levels.pdf (accessed on 5 February 2024).
  54. Ma’bdeh, S.; Al-Khatatbeh, B. Daylighting retrofit methods as a tool for enhancing daylight provision in existing educational spaces—A case study. Buildings 2019, 9, 159. [Google Scholar] [CrossRef]
  55. Floyd, D.B.; Parker, D.S.; Sherwin, J.R. Measured Field Performance and Energy Savings of Occupancy Sensors: Three Case Studies; Florida Solar Energy Center: Florahome, FL, USA, 2024; Available online: https://publications.energyresearch.ucf.edu/wp-content/uploads/2018/06/FSEC-PF-309-96.pdf (accessed on 26 April 2024).
  56. STYRO. Extruded Polystyrene (XPS): Styrofoam UAE, Dubai, Sharjah, AD. 2024. Available online: https://www.styrouae.com/trading-items/extruded-polystyrenexps/ (accessed on 26 April 2024).
  57. Islam, M.D.; Kubo, I.; Ohadi, M.; Alili, A. Measurement of solar energy radiation in Abu Dhabi, UAE. Appl. Energy 2009, 86, 511–515. [Google Scholar] [CrossRef]
  58. Jacques, K.; GreenBuildingAdvisor. Windows for Hot Climates. 2024. Available online: https://www.greenbuildingadvisor.com/article/windows-for-hot-climates (accessed on 5 February 2024).
  59. 3M United Arab Emirates. United Arab Emirates, Energy. 2024. Available online: https://www.3mae.ae/3M/en_AE/building-window-solutions-mea/solutions/energy/ (accessed on 26 April 2024).
  60. Banks, K. Forbes. How Much Does Window Replacement Cost in 2024? Available online: https://www.forbes.com/home-improvement/windows/window-replacement-cost/ (accessed on 26 April 2024).
  61. Yang, I.-H.; Nam, E.-J. Economic Analysis of the daylight-linked lighting control system in office buildings. Sol. Energy 2010, 84, 1513–1525. [Google Scholar] [CrossRef]
  62. STUDYLIB. Retrofit Demonstration of LED Fixtures with Integrated Sensors and Controls. 2015. Available online: https://studylib.net/doc/18888818/retrofit-demonstration-of-led-fixtures-with-integrated?utm (accessed on 6 July 2025).
  63. Akrasakis, S.; Tsikalakis, A.G. Corridor lighting retrofit based on occupancy and Daylight Sensors: Implementation and energy savings compared to LED lighting. Adv. Build. Energy Res. 2017, 12, 274–288. [Google Scholar] [CrossRef]
  64. Philips. Lighting for LEED—Application Guide for Sustainable Offices. 2012. Available online: https://images.philips.com/is/content/PhilipsConsumer/PDFDownloads/United%20Kingdom/ODLI20150421_001-UPD-en_GB-leed-brochure.pdf (accessed on 26 April 2024).
  65. MasdarCity. Building Information Pack Q3 2022. 2024, p. 5. Available online: https://masdarcity.ae/docs/default-source/pdf-to-download/reit-building-information-2022-q3.pdf?sfvrsn=52838774_1#:~:text=to%20obtain%20LEED-,O&M%20(Operations%20and%20Maintenance)%20ratings%20on%20buildings%20which%20are%20currently,(Overall) (accessed on 19 July 2025).
  66. EmiratesGBC. Focus Day Brief. 2024, pp. 4–27. Available online: https://emiratesgbc.org/wp-content/uploads/2024/03/Focus-Day-Brief-Final-1.pdf (accessed on 19 July 2025).
  67. Usgbc.org. 2025. Available online: https://www.usgbc.org/credits/existing-buildings-schools-existing-buildings-retail-existing-buildings-data-centers-exist-1?return=/credits/Existing%20Buildings/v4/Energy%20&%20atmosphere (accessed on 19 July 2025).
  68. Government of Dubai. Al Sa’fat—Dubai Green Building System—2nd Edition. 2023; pp. 64–65. Available online: https://www.dm.gov.ae/documents/al-safat-dubai-green-building-system-2nd-edition/ (accessed on 19 July 2025).
  69. Jastaneyah, Z.; Kamar, H.M.; Hashmi, A.; Ghaleb, F.A.; Al Garalleh, H. The influence of zonal air supply on thermal comfort in a classroom located in a hot and humid environment: A case study from Jeddah—Saudi Arabia. Discov. Sustain. 2024, 5, 526. [Google Scholar] [CrossRef]
Figure 1. Workflow of research methodology.
Energies 18 04155 g001
Figure 2. Site characteristics: (a) campus site location; (b) Google Maps site location; (c) climate characteristics (sun path and wind rose diagrams).
Energies 18 04155 g002
Figure 3. DT geometry of campus building modelled in IES: (a) north-west DT elevation; (b) south-west DT elevation; (c) DT architectural elements and sun path from IES.
Energies 18 04155 g003
Figure 4. Real-life photographs of the campus building: (a) north-west building elevation; (b) south-west building elevation.
Energies 18 04155 g004
Figure 5. IES operating load profile: (a) weekdays IES load profile (9:00 a.m. to 10:00 p.m.); (b) weekends IES load profile (9:00 a.m. to 5:00 p.m.).
Energies 18 04155 g005
Figure 6. Modelling of DOAS network connected to AHUs.
Energies 18 04155 g006
Figure 7. Modelling of DOAS network connected to FCUs.
Energies 18 04155 g007
Figure 8. CHW loop schematic input into IES.
Energies 18 04155 g008
Figure 9. Energy use breakdown for base model.
Energies 18 04155 g009
Figure 10. Comparison of monthly weather data across IWEC, TMY3, and actual 2023 Dubai weather data: (a) dry-bulb temperature and (b) relative humidity (RH).
Energies 18 04155 g010
Figure 11. Reduced LPD—energy consumption comparison.
Energies 18 04155 g011
Figure 12. Building daylight sensors—energy consumption comparison.
Energies 18 04155 g012
Figure 13. Occupancy sensors—energy consumption comparison.
Energies 18 04155 g013
Figure 14. Energy consumption breakdown and impact of retrofitting measures: (a) base model energy consumption breakdown per end-use; (bd) comparison of base model energy consumption vs. proposed ECMs 1–3.
Energies 18 04155 g014
Figure 15. Retrofitting ECM summary: base model energy consumption vs. energy consumption for ECM 1–3.
Energies 18 04155 g015
Figure 16. Hourly energy consumption trend for each ECM vs. base model: (a) ECM 1; (b) ECM 2; (c) ECM 3.
Energies 18 04155 g016
Figure 17. Hourly trend of indoor operating temperatures within occupiable campus zones, for each ECM.
Energies 18 04155 g017
Figure 18. Hourly PMV values categorized by thermal comfort thresholds within occupiable campus zones: (a) base model; (b) ECM Measure 1; (c) ECM Measure 2; (d) ECM Measure 3.
Energies 18 04155 g018
Figure 19. Hourly trend of PPD values within occupiable campus zones for each ECM.
Energies 18 04155 g019
Figure 20. Integrated performance comparison of proposed ECMs based on thermal comfort metrics and energy saving parameters: (a) ECM 1; (b) ECM 2; (c) ECM 3.
Energies 18 04155 g020
Table 1. IES thermal conditions and input parameters for base model.
Space TypesOccupant Gains (W/Person)Minimum Ventilation Rates (L/s/Person)EPDs (W/m2)LPDs (W/m2)
Classroom/Lecture/Training65.943.8010.768.77
Corridor/Transition0.000.002.154.68
Electrical/Mechanical0.000.002.156.72
Food Preparation80.593.8016.157.05
Laboratory–Classrooms73.275.0010.769.10
Lobby–Elevator73.272.505.384.54
Library–Reading Area73.272.5016.158.77
Office–Enclosed73.272.5010.767.85
Office–Open Plan73.272.5016.156.92
Restrooms0.000.005.386.92
Stairway0.000.0010.764.88
Storage0.002.502.154.48
Religious Buildings–Fellowship Hall73.272.5010.7611.27
Workshop109.905.002.154.55
Table 2. AHU network system configuration.
IES InputsAHU Network–Input ValuesFCU Network–Input Values
Areas ServedGround FloorAll Areas, except GF
Operating Hours9 a.m.–10 p.m. (all 7 days)9 a.m.–10 p.m. (weekdays)
9 a.m.–5 p.m. (weekends)
System Extended Hours1.5 h (before opening)
0.5 h (after closing)
1.50 h (before opening)
0.50 h (after closing)
Average Specific Fan Powers (SFPs)2.00 W/(L/s)1.80 W/L/s
Cooling Setpoint24.00 °C24.00 °C
Heating Setpoint0.00 °C0 °C
Table 3. CHW loop system configuration.
District Cooling ElementInput Values
Cooling Capacity 1581.56 kW
COP4.40
CHW Supply Temp.5.50 °C
Distribution Loses 5.00%
CHW Loop ∆T6.67 °C
Table 4. IES simulation results for base model.
Energy End UseEnergy Consumption (kWh)Energy Breakdown Percentage (%)
Internal Lighting414,008.6420.23%
Exterior Lighting26,652.09 1.30%
Space Heating0.000.00%
Space Cooling731,914.0635.76%
Pumps20,349.350.99%
Fans Interior424,509.0020.74%
Service Hot Water20,501.61 1.00%
Receptacle Equipment364,890.4117.83%
Elevators43,817.912.14%
Total2,046,643.07100.00%
Table 5. Base model validation—simulation results vs. actual consumption.
IES Simulation Results—Annual Electricity Consumption 2,046,643.07 kWh
Actual Consumption in 2022 (Meter Readings)1,977,840.00 kWh
Actual Consumption in 2023 (Meter Readings)1,971,200.00 kWh
IES Results Deviation from 2022 Actual Consumption 3.36%
IES Results Deviation from 2023 Actual Consumption3.69%
Table 6. IES base model iterations.
Iteration NumberDefault IES InputsOptimization for Enhanced Model AccuracySimulation ResultsDeviation from 2022 Consumption DataDeviation from 2023 Consumption Data
Iteration 1Equipment and elevator load profiles set to IES default operating hours.Equipment and elevator load profiles set to match campus operating hours.2,578,914.72 kWh23.31%23.56%
Iteration 2Default IES window glass U-value and SHGC.Window glass U-value and SHGC altered as per the material lab test results of the campus building.2,204,040.05 kWh14.28%14.57%
Iteration 3Default IES space heating provision incorporated.Space heating provision turned off as heating equipment is not used.2,050,127.17 kWh3.53%3.85%
Iteration 4-Final Base Model—Exact replica of campus design and operational parameters.2,046,643.07 kWh3.36%3.69%
Table 7. IES simulation results: no LPD reduction vs. base model.
Energy Modelling ScenarioResults
Base Model (Reduced LPDs)2,046,643.07 kWh
Modified Scenario (ASHRAE baseline LPDs)2,276,509.35 kWh
Savings in Overall Energy Consumption 10.00%
Savings in Lighting End-Use Energy Consumption 32.73%
Savings in Space Cooling End-Use Energy Consumption2.88%
Savings in Pumps End-Use Energy Consumption13.54%
Savings in Interior Fans End-Use Energy Consumption0.26%
Table 8. IES simulation results: no daylight sensors vs. base model.
Energy Modelling ScenarioResults
Base Model (Reduced LPDs)2,046,643.07 kWh
Modified Scenario (ASHRAE baseline LPDs)2,276,509.35 kWh
Savings in Overall Energy Consumption 10.00%
Savings in Lighting End-Use Energy Consumption 32.73%
Savings in Space Cooling End-Use Energy Consumption2.88%
Savings in Pumps End-Use Energy Consumption13.54%
Savings in Interior Fans End-Use Energy Consumption0.26%
Table 9. IES simulation results: no occupancy sensors vs. base model.
Energy Modelling ScenarioResults
Base Model (Reduced LPDs)2,046,643.07 kWh
Modified Scenario (ASHRAE baseline LPDs)2,276,509.35 kWh
Savings in Overall Energy Consumption 10.00%
Savings in Lighting End-Use Energy Consumption 32.73%
Savings in Space Cooling End-Use Energy Consumption2.88%
Savings in Pumps End-Use Energy Consumption13.54%
Savings in Interior Fans End-Use Energy Consumption0.26%
Table 10. IES simulation results: no optimized U-value vs. base model.
Energy Modelling ScenarioResults
Base Model (design-case U-values)2,046,643.07 kWh
Modified Scenario (optimized U-values)1,979,793.15 kWh
Savings in Overall Energy Consumption 3.27%
Savings in Space Cooling End-Use Energy Consumption6.76%
Savings in Pumps End-Use Energy Consumption20.27%
Savings in Interior Fans End-Use Energy Consumption3.12%
Table 11. IES simulation results: added daylight sensors in classrooms vs. base model.
Energy Modelling ScenarioResults
Base Model (no daylight sensors in classrooms)2,046,643.07 kWh
Modified Scenario (added daylight sensors in classrooms)2,036,989.25 kWh
Savings in Overall Energy Consumption 0.5%
Savings in Lighting End-Use Energy Consumption2.10%
Savings in Space Cooling End-Use Energy Consumption0.12%
Savings in Pumps End-Use Energy Consumption0.44%
Table 12. IES simulation results: optimized SFPs vs. base model.
Energy Modelling ScenarioResults
Base Model (average SFP of 0.82 W/(L/s))2,046,643.07 kWh
Modified Scenario (reduced SFP of 0.3 W/(L/s))1,818,994.71 kWh
Savings in Overall Energy Consumption 11.12%
Savings in Space Cooling End-Use Energy Consumption5.88%
Savings in Pumps End-Use Energy Consumption12.55%
Savings in Interior Fans End-Use Energy Consumption42.88%
Table 13. Renewable energy scenarios and corresponding system specifications modelled in IES software (2021 version).
Scenario TypeArray and PanelsRated Power per Panel (W)Total Rated Power (W)Panel Efficiency (%)
Current ScenarioRooftop Array 1 (6 panels)5453270.0020.86%
Rooftop Array 2 (6 panels)5453270.0022.50%
Rooftop Array 3 (6 panels)5703420.0022.10%
Rooftop Array 4 (6 panels)4252550.0019.20%
Rooftop Array 5 (6 panels)5453270.0020.86%
Total Installed Capacity-15,780.00-
Proposed ScenarioAdditional Rooftop Array (6 panels)5453270.0022.50%
Car Park Shade Array (191 panels)545104,095.0022.50%
Ground-Mounted PV panels (194 panels)545105,730.0022.50%
Total Proposed Capacity: Rooftop + Car Park + Ground-mounted-213,095.00-
Current + Proposed ScenarioTotal Installation Capacity-228,875.00-
Table 14. IES simulation results: current PV scenario vs. proposed scenario.
Scenario TypeArray and PanelsIES Results
Current ScenarioRooftop Array 1 (6 panels)4820.00 kWh
Rooftop Array 2 (6 panels)
Rooftop Array 3 (6 panels)
Rooftop Array 4 (6 panels)
Rooftop Array 5 (6 panels)
Proposed ScenarioAdditional Rooftop Array (6 panels)160,779.67 kWh
Car Park Shade Array (191 panels)
Ground-Mounted PV panels (194 panels)
Current + Proposed Scenario421 PV panels165,599.67 kWh
Table 15. Comparison of actual U-values vs. proposed optimized U-values.
Envelope ComponentActual Building
U-Values
Proposed Optimized
U-Values
External Wall0.57 W/m2K0.32 W/m2K
Roof0.3 W/m2K0.14 W/m2K
Floor/Slab0.3 W/m2K0.15 W/m2K
Glazing1.36 W/m2K1.20 W/m2K
Glazing SHGC 17% (0.17)17% (0.17)
Table 16. ECM energy conservation summary.
ECMsOverall Energy Consumption (kWh)Energy Saving from Base Model (%)Lighting Energy (kWh)Energy Saving (%)Space Cooling Energy (kWh)Energy Saving (%)CHW Pumps Energy (kWh)Energy Saving (%)Interior Fans Pumps Energy (kWh)Energy Saving (%)
Base Model2,046,643.07-414,008.64-731,914.06-20,349.35-424,509.00-
Measure 11,979,793.153.27%--682,425.006.76%16,224.5220.27%411,272.973.12%
Measure 22,036,989.250.5%405,329.742.10%731,037.780.12%20,259.220.44%424,500.490.00%
Measure 31,818,994.7111.12%--688,853.705.88%17,796.0512.55%242,474.3042.88%
Disclaimer/Publisher’s Note: The statements, opinions and data contained in all publications are solely those of the individual author(s) and contributor(s) and not of MDPI and/or the editor(s). MDPI and/or the editor(s) disclaim responsibility for any injury to people or property resulting from any ideas, methods, instructions or products referred to in the content.