Abstract
This study aims to quantify total VOC emissions and evaluate how torrefaction alters the heat of combustion of three agricultural residues. The work examines the amount of VOC emissions during the torrefaction process at various temperatures and investigates the changes in the heat of combustion of agri-biomass resulting from the torrefaction process. The process was carried out at the following temperatures: 225, 250, 275, and 300 °C. Total VOC emission factors were determined. The reaction kinetics analysis revealed that meadow hay exhibited the most stable thermal behavior with the lowest activation energy. At the same time, rye straw demonstrated higher thermal resistance and complex multi-step degradation characteristics. The authors analyze three types of agricultural biomass: meadow hay, rye straw, and oat straw. The research was divided into five stages: determination of moisture content in the sample, determination of ash content, thermogravimetric analysis, measurement of total VOC emissions from the biomass torrefaction process, and determination of the heat of combustion of the obtained torrefied biomass. Based on the research, it was found that torrefaction of biomass causes the emission of torgas containing VOC in the amount of 2–10 mg/g of torrefied biomass, which can be used energetically, e.g., to support the torrefaction process, and the torrefied biomass shows a higher value of the heat of combustion. Unlike prior studies focused on single feedstocks or limited temperature ranges, this work systematically compares three major crop residues across four torrefaction temperatures and directly couples VOC quantifications.
1. Introduction
The costs of adapting the Polish heating sector to the requirements of Fit for 55 and the Green Deal by 2050 are estimated at PLN 300 to 500 billion, which was estimated by the Polish Thermal Power Society. The Polish heating sector is the largest in Europe, and heat is the most widely consumed energy source in Poland, accounting for around 60%. This is a unique sector on a continental scale, and EU regulations are not adapted to its problems. Biomass plays a significant role in the structure of fuels used in district heating. According to data from the Energy Regulatory Office, it is used to produce over 12.5% of district heating, responsible for 97% of heat production from all renewable energy sources in heating systems.
Raw biomass has a lower heat of combustion compared to hard coal. However, subjecting it to the torrefaction process means that the obtained torrefied biomass has a higher heat of combustion value. In the torrefaction process, which may be a stage in preparing biomass fuel for combustion or co-firing with coal, volatile organic compound (VOC)-containing torches are emitted, which can be utilized as a source of energy in the torrefaction process. Currently, there is a growing demand for energy, particularly in highly developed countries. One of the negative effects of this phenomenon is the depletion of non-renewable natural energy resources such as hard coal or lignite [1,2,3,4]. This often results in the need to import large quantities of raw materials from other countries, consequently increasing energy production costs. Therefore, other renewable energy sources have been sought. Biomass is undoubtedly an example of this renewable energy resource [5,6,7,8]. For energy purposes, the following forms of biomass are used: agricultural waste [9] (e.g., cereal straw, corn straw, and hay), waste from the wood industry, yields from energy crop plantations, organic waste, biofuels, or biogas [10,11,12,13,14]. Meadow hay is widely used in agriculture and animal husbandry in Poland, serving as a staple feed for cattle, horses, sheep, and goats, especially during periods when fresh feed is unavailable. Furthermore, meadow hay is used in phytobalance therapy (water therapy with herbs) in health resorts. Meadow hay is a staple food for many farm animals, including cattle, horses, sheep, and goats. Figure 1 illustrates the increasing importance of renewable energy sources in electricity production. Biomass shares account for less than 10% of all renewable energy sources in 2023, including agri-biomass. In Poland in May 2025, biomass accounted for 4.1% of total electricity production, corresponding to a 15.6% share of production from renewable energy sources, according to Forum Energy [15].
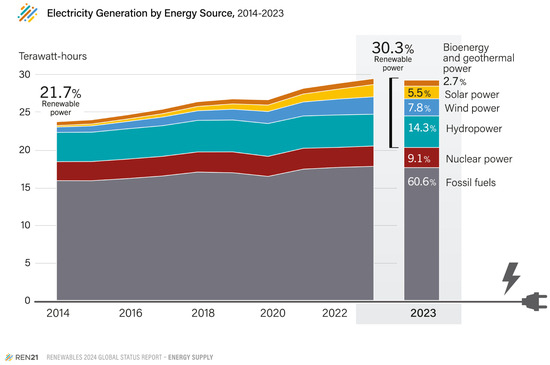
Figure 1.
Electricity generation by energy source, 2014–2023 [16].
Torrefaction began to be investigated in the late 1920s and gained popularity in the last 10–20 years. A process that includes the dry, wet, and steam methods is a crucial thermal pretreatment process that enhances the properties of biomass, making it more suitable for various applications. Through torrefaction, biomass undergoes thermal decomposition at relatively low temperatures, resulting in an improved energy density, hydrophobicity, and grindability of the produced biochar.
To improve the energy properties of biomass, it is subjected to various processing techniques. Torrefaction is one of the methods of thermal treatment of biomass [17,18,19,20], which is applied at lower temperatures (200–350 °C) than pyrolysis [21]. This process has been known for many years; however, there has been a recent growing interest in this subject. Thanks to torrefaction, a new product is obtained—a torrefied biomass, also called bio-coal [22]. It has similar properties to coal, thanks to which it is possible to co-fire it [23,24,25,26]. Torrefaction is a process of thermal conversion during which weight and part of the chemical energy contained in biomass is lost [27,28]. Conditions for the torrefaction should be selected so that the weight loss is a maximum of 30% and the energy loss is no more than 10% [29,30,31,32], which leads to a significant increase in the calorific value of the torrefied biomass obtained. The use of the torrefaction process is a solution that enables the management of substantial amounts of biomass, increases the share of co-fired biomass, and thus reduces the use of coal as a fuel. The interest in the biomass torrefaction process has been systematically growing in recent years [33].
The use of biomass for energy purposes is associated with the combustion process [34,35,36,37]. Emissions of pollutants into the environment occur both during the combustion of conventional fuels and biomass. When coal is burned, dust (including particulate matter), nitrogen dioxide, sulfur dioxide, as well as benzo(a)pyrene, dioxins, and furans, among others, are emitted into the air [38,39,40,41]. For biomass, the most commonly emitted air pollutants are nitric oxide and VOC (recorded as total organic carbon, but also ammonia) [42,43,44,45,46,47,48,49]. Biomass burning is also a source of polycyclic aromatic hydrocarbons, as well as dioxins and furans [50,51].
Given the significant differences in the elemental composition of fossil fuels, such as hard coal and biomass, as well as the variations in the content of volatile substances, moisture, and ash, co-combustion of coal and biomass presents numerous technical and technological challenges. After the torrefaction process, biomass approaches hard coal in its composition and properties, which allows us to avoid many problems during the co-burning process of these fuels [52,53,54].
One of the additional problems in using biomass as fuel is its storage, in particular in the form of wood chips. The presence of wood dust triggers an explosion hazard [55]. Unfortunately, torrefied biomass is also the fuel that causes this problem. During storage, VOCs are released and can easily ignite. Several papers have been devoted to the issue of VOC release from torrefied biomass during storage [56,57,58,59,60]. The authors of these studies found the emission of dozens of VOCs during the storage of torrefied biomass. The most extensive list of emitted compounds was recently provided by Białowiec [42,43,44,45,46]. The study also included VOC emissions from the torrefaction process itself [61,62,63,64,65,66]. The emissions of CO, CO2, as well as methane, formaldehyde, furfural, formic and acetic acid, and small amounts of hydrogen, ethane, propane, ethylene, acetone, propionic acid, and water were found. Methane, carbon monoxide, and formaldehyde had the largest share of the emissions. For example, according to Hronova’s [65] research, the concentrations of CO in torgas may be 0.6–1.3%, methane 1.4–2.6%, and CO2 2.6–3.8%. The other authors of all these works gave only the concentrations of the mentioned compounds, without relating them to the mass of the tested sample.
Alternatively, biological conversion can be employed, where torrefied biomass serves as a substrate for fermentation to produce biofuels, bioenergy, and biochemicals such as ethanol, butanol, acetone, and lipids. Figure 2 highlights how biomass can be transformed into renewable energy and valuable chemicals.
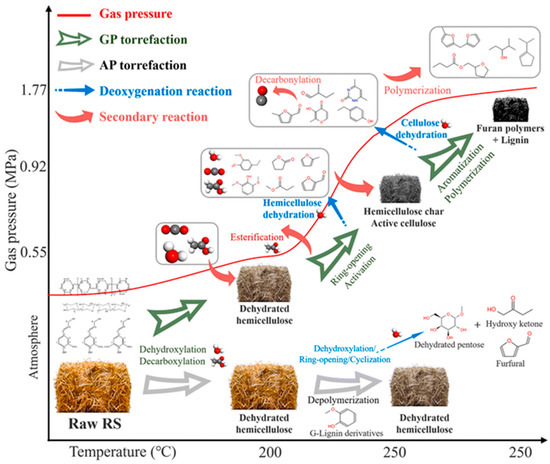
Figure 2.
Chemical evolution mechanisms of biomass components during the torrefaction process [66].
The following types of agricultural biomass were tested: meadow hay, rye straw, and oat straw. The torrefaction process was carried out in a carbon dioxide atmosphere, which behaves as an inert gas under the chosen process conditions. This study’s primary objective is to quantify total VOC emissions during torrefaction and assess how torrefaction at four temperatures (225, 250, 275, 300 °C) increases the heat of combustion of three agricultural residues (meadow hay, rye straw, and oat straw). Notably, it systematically compares these three feedstocks across multiple temperatures, directly coupling VOC emission measurements with changes in fuel energy content.
2. Materials and Methods
The first stage of research involved a technical analysis of the biomass, including the determination of its moisture and ash content. The biomass used in our experiments was Avena sativa (oat), Secale cereale (rye), and Sporobolus pumilus (meadow hay, also known as salt meadow hay). To determine the moisture content, 1–2 g samples were prepared and then dried at 105 °C for 24 h [67]. After this time, the samples were placed in a desiccator to cool down. This process was repeated until a constant weight of the samples was obtained. After drying, the samples were ground to a particle size of 3–5 mm. Figure 3a shows the samples placed in the dryer, and Figure 3b shows the samples placed in the desiccator after drying.
Moisture content in the biomass was calculated using the following formula [68]:
- where W—moisture content (%);
- m1—crucible weight with biomass before drying (g);
- m2—crucible weight with biomass after drying (g);
- m3—weight of the empty crucible (g).
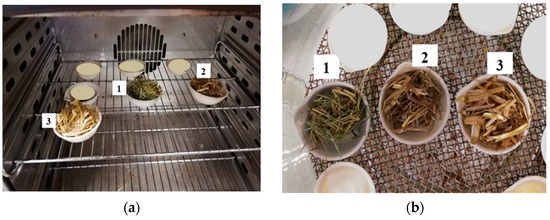
Figure 3.
Samples of biomass during drying process (1—meadow hay, 2—rye straw, 3—oat straw): (a) placed in the dryer, (b) after drying.
The next stage of technical analysis involved determining ash content. For this purpose, the previously dried samples were placed in a muffle furnace LINN High Therm, (High Therm, Berlin, Germany) (1200 °C/50 Hz) at 815 °C ± 15 °C for 4 h [69]. After that time, the crucibles with ash were placed in a desiccator to cool down. Next, the samples were weighed on an analytical balance, and the results were recorded. Figure 4a shows samples placed in the muffle furnace, and Figure 4b shows samples in the desiccator after combustion.
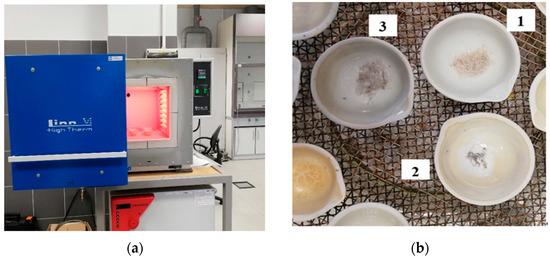
Figure 4.
Samples during ash content determination (1—hay, 2—rye straw, 3—oat straw) (a) placed in a muffle furnace, (b) samples after combustion.
Ash content in the tested samples was determined using the following formula [70]:
- where A—ash content (%);
- m4—crucible weight with biomass before combustion (g);
- m5—crucible weight with biomass after combustion (g);
- m6—weight of the empty crucible (g).
At the second stage, a thermogravimetric analysis of biomass was conducted to determine the range of temperatures at which the torrefaction process would be examined and the total VOC emission would be measured. Before the thermogravimetric analysis, the samples were dried, and following, 10–20 mg samples were weighed and placed in a NETZSCH TG 209 F3 Tarsus thermogravimeter (Netzsch, Numberg, Germany). The particle size of the material was 3–5 mm. The thermogravimetric analysis involved heating the biomass sample to 600 °C at a rate of 10 K/min, with an inert gas flow (nitrogen in this case) at a rate of 20 mL/min. In the research, the sample temperature and weight were continuously monitored and recorded using a computer program. For TGA and DTG analysis, we used NETZSCH Proteus Software (Version 7.1.0/04.02.2019, Build 7.1.19035.1). As a result of the analysis, a thermogravimetric curve was obtained. The curve was used to determine the temperature at which the weight loss of the samples was the highest [71,72,73,74].
After specifying the temperature range, the total VOC emissions were tested. To do this, a previously dried sample of 2–2.5 g was placed on quartz glass half-tubes and then inserted into an electric oven. The process was carried out at the following temperatures: 225, 250, 275, and 300 °C. Dutch researchers [64] both identify 220–300 °C as the “active torrefaction zone” for agricultural residues, where oxygen-to-carbon ratios drop rapidly and HHV increases most steeply. Broader ranges such as 200–350 °C have been studied (e.g., Libra et al., 2011 [18]), but they typically include two distinct regimes, mild torrefaction (200–230 °C) and severe carbonization (>300 °C). By concentrating at 225–300 °C, we capture the full spectrum of mild to moderate torrefaction reactions without overlapping into the pyrolysis-dominated regime, thus optimizing both yield and fuel quality [64].
Carbon dioxide gas was used as the inert gas with a flow rate of approximately 1 L/min [75]. The 1 L/min rate was chosen due to the closed system with the analyzer. At higher flow rates, the pressure in the system increased, causing the tube to spring back. At that time, the emission of total VOCs was measured using the standard [76] VOCs Total Hydrocarbon Analyzer Model 3-500 (J.U.M. Engineering Gmbh, Karlsfeld, Germany) stationary analyzer, which was connected to a computer equipped with appropriate software. The frequency of data reading was 10 s. Three replicates were performed for each type of biomass and each temperature. Typical sensitivity of J.U.M Model 3-700 FID Analyzer is 0.01 ppm CH4. After the torrefaction process, the sample was weighed again to determine the weight loss. Figure 5a,b show a schematic of the experimental setup.
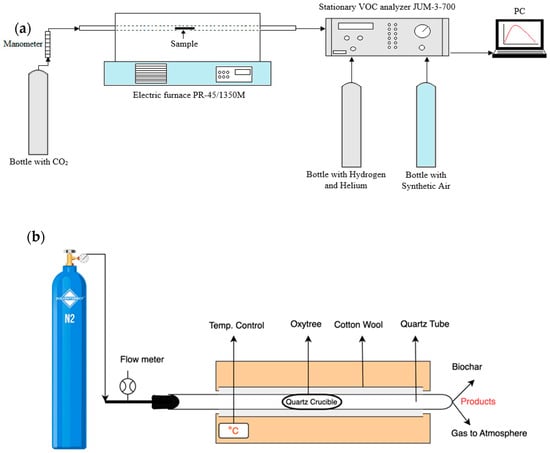
Figure 5.
(a) Schematic of the experimental setup for total VOC emission measurement and (b) Electrical Furnace PR-45/135M with possible use of CO2/N2 gases.
As a result of the tests, the emission of total VOC over time was determined. Based on this, the value of the emission index was calculated. The emission index determines the amount of emitted pollutants from the process. The total VOC emission index was calculated using the following formulas [77]:
- where —carbon dioxide flow rate (m3/s);
- cm—average VOC concentration (mg/m3);
- τ—torrefaction time (s);
- —weight of the sample subjected to torrefaction (g).
Figure 6 shows a sample placed on a quartz glass half tube before and after the torrefaction. Heat of combustion measurements were performed in a Parr 6400 calorimeter (PARR, Moline, IL, USA). The samples, weighing approximately 1 g, were pressed.
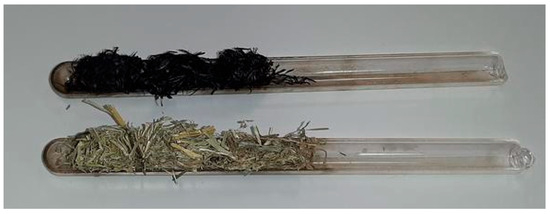
Figure 6.
The quartz glass half tubes with meadow hay samples before and after torrefaction.
The reaction kinetics of oat straw, meadow hay, and rye straw were evaluated based on thermogravimetric analysis (TGA) using NETZSCH Kinetics Neo 3 software. This software enables the determination of reaction rate constants, activation energy profiles, and pre-exponential factors from non-isothermal thermal decomposition data. The kinetic analysis provided insights into the decomposition behavior of the selected biomass types during torrefaction, allowing for the modeling of their temperature-dependent degradation mechanisms.
Two model-free (isoconversional) methods were employed: the Ozawa–Flynn–Wall (OFW) method and the Vyazovkin method. The Ozawa–Flynn–Wall method, on the other hand, is an integral isoconversional method that estimates activation energy without assuming a reaction model. The Vyazovkin method further refines the model-free approach by minimizing the integral discrepancy across heating rates for each conversion level, improving the reliability of Ea determination.
In addition to these model-free methods, the model-fitting approach was applied using an nth-order reaction model, which assumes a single-step reaction mechanism and enables the estimation of the overall reaction order (n), activation energy (Ea), and pre-exponential factor (A). These kinetic parameters were obtained by fitting the experimental TGA data.
The combination of model-free and model-fitting approaches enabled a robust kinetic evaluation, facilitating the comparison of thermal stability and reactivity among the tested biomass samples.
3. Results and Discussion
As previously mentioned, the first stage of research involved determining the moisture content of the biomass samples being studied. Table 1 presents the values of moisture content.

Table 1.
The content of moisture and ash in the tested biomass samples.
Based on the above results, the highest moisture contents are characteristic of hay and rye straw, which exceed 10%, at 10.88% and 10.81%, respectively. Moisture content in oat straw was 8.82%. Both straw and hay were collected after harvest time between August and September. The samples used for the tests were seasoned for six months under shelter. Dry torrefaction has an allowance of around 10% moisture. Pyrolysis, which is applied at higher temperatures, results in higher mass loss and requires higher energy to process. HTC might be a better choice for high-humidity samples; however, 10% is acceptable for dry torrefaction and a safer process, especially in applications with lower pressures.
The next stage of the technical analysis of biomass involved determining the ash content in the samples. Results are given in Table 1. The highest ash content was reported for hay and oat straw, and was 3.00% and 2.99%, respectively. The smallest content of ash after the combustion process was documented for rye straw—1.63%. At the second stage of research, a thermogravimetric analysis was performed. Based on thermogravimetric curves, the temperature range for total VOC emissions was determined.
Figure 7 and Figure 8 show the thermogravimetric curves for the three tested types of biomass. The maximum mass loss rate was observed at 342.4 °C for rye straw. For oat straw, this temperature was 336.6 °C, and for meadow hay, it was 326.5 °C. The most significant weight loss in the tested biomass samples occurred at temperatures higher than 320 °C. For all analyzed biomass samples, no significant changes were observed after exceeding the elevated temperatures. The weight of the samples decreased, however, at a small rate. It follows from the thermogravimetric curves that approximately 70% of the weight loss of the tested samples occurs at temperatures up to 300 °C. Accordingly, it was decided that the measurement of total VOC emissions will be carried out for four temperatures: 225 °C, 250 °C, 275 °C, and 300 °C.
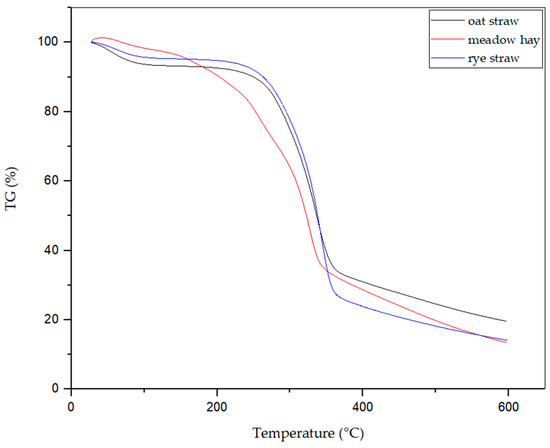
Figure 7.
TGA analysis of all 3 biomasses: oat straw, meadow hay, and rye straw.
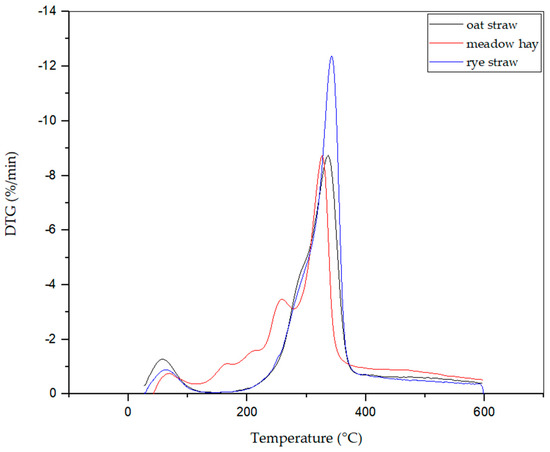
Figure 8.
DTG analysis of all 3 biomasses: oat straw, meadow hay, and rye straw.
The kinetic analysis was conducted using the specialized NETZSCH Kinetics Neo software, a tool designed to extract reaction kinetics from temperature-dependent experimental data. This software enables the quantitative evaluation of chemical reaction rates and the influence of various thermal conditions, providing critical insights into the mechanistic pathways of complex reactions. By incorporating multiple variables that affect reaction rates, such as activation energy, reaction order, and pre-exponential factors, Kinetics Neo facilitates the development of robust kinetic models that accurately reflect the system’s behavior across a wide range of temperatures. In the context of this study, the software was utilized to model the torrefaction behavior of biomass, enabling the prediction of system responses under user-defined thermal scenarios. Such kinetic modeling is essential not only for understanding the decomposition mechanisms of lignocellulosic materials but also for optimizing process parameters in thermochemical conversion technologies.
The comparison of reaction kinetics parameters derived from different biomass samples (rye straw, meadow hay, and oat straw) reveals notable variations in their thermal degradation behavior, as summarized in Table 2. Among the three, rye straw exhibited the highest activation energy (106.904 kJ/mol), suggesting greater thermal resistance and a higher energy barrier for decomposition. In contrast, meadow hay demonstrated the lowest activation energy (63.166 kJ/mol), indicating that it decomposes more readily under thermal treatment, which may reflect differences in biochemical composition, such as lower lignin content or higher volatile fractions.

Table 2.
Reaction kinetics parameters for different methods.
The pre-exponential factor (log A) followed a similar trend, being highest for rye straw (7.575), moderate for oat straw (5.946), and lowest for meadow hay (3.807), which aligns with their respective activation energies and reflects the frequency of molecular collisions leading to the reaction. Reaction orders (n) were also distinct, with rye straw displaying a notably higher value (5.29) compared to meadow hay (3.603) and oat straw (3.719), implying a more complex reaction mechanism or multi-step degradation pathway in rye straw.
Regarding the goodness-of-fit (R2 values), all three biomass types showed strong correlations in the nth-order model (≥0.994), with meadow hay slightly outperforming others (R2 = 0.99548). Across model-free methods, the Ozawa–Flynn–Wall approach yielded perfect or near-perfect fits for all samples (R2 = 1.00 for meadow hay and oat straw; 0.99999 for rye straw), highlighting its robustness. The Friedman method showed the lowest R2 for oat straw (0.98053), possibly due to higher sensitivity to noise in derivative-based data. The Vyazovkin model confirmed consistent trends, with meadow hay again showing the best fit (R2 = 0.99763), indicating high reliability of the kinetic data.
Overall, meadow hay appears to offer a more kinetically favorable profile for thermochemical processes due to its lower activation energy and consistent model fits. In contrast, rye straw’s high activation energy and complex kinetics may require more energy-intensive processing conditions. These findings provide a strong basis for selecting appropriate feedstocks and optimizing conditions in biomass torrefaction systems.
Figure 9, Figure 10 and Figure 11 present the reaction rate profiles of oat straw, meadow hay, and rye straw, respectively, under varying heating rates (10, 20, and 30 K/min). Among the three, oat straw (Figure 9) exhibited the highest peak reaction rate (0.0028 s−1 at 30 K/min), followed by meadow hay (Figure 10) and rye straw (Figure 11), which showed the lowest maximum rate. Moreover, the peak degradation temperature increased with the heating rate for all samples; however, rye straw consistently required a higher temperature to reach its maximum reaction rate, indicating greater thermal stability. This is consistent with the higher activation energy values observed in rye straw.
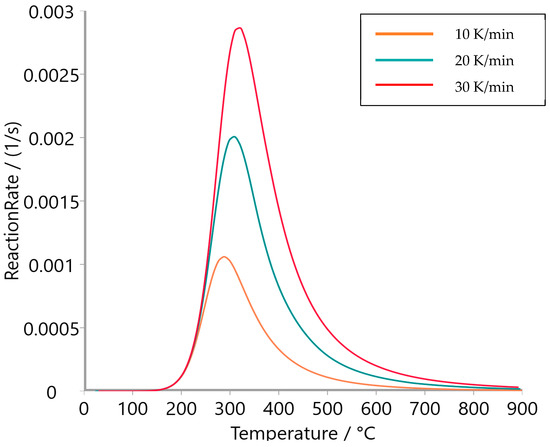
Figure 9.
Reaction rate of oat straw.
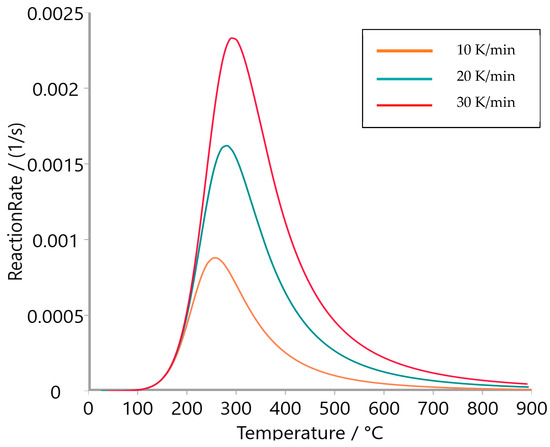
Figure 10.
Reaction rate of meadow hay.
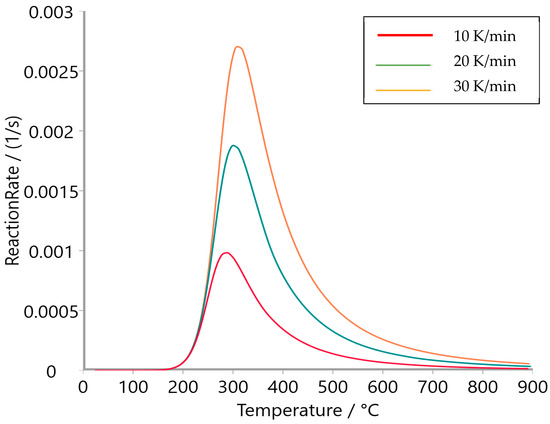
Figure 11.
Reaction rate of rye straw.
Figure 12, Figure 13 and Figure 14 display the variation in activation energy (Ea) with conversion (α) using the Ozawa–Flynn–Wall method. Oat straw (Figure 12) showed a decreasing trend in Ea from approximately 300 kJ/mol at low conversion to 100 kJ/mol beyond α = 0.4, reflecting the typical behavior of heterogeneous biomass decomposition. Meadow hay (Figure 13) exhibited a relatively stable Ea profile, fluctuating mildly between 50 and 200 kJ/mol across most of the conversion range, suggesting a more uniform degradation mechanism. In contrast, rye straw (Figure 14) exhibited significant fluctuations in activation energy, including sharp peaks and negative values near α = 0.6–0.7, which may be attributed to complex, overlapping reactions or secondary decomposition steps.
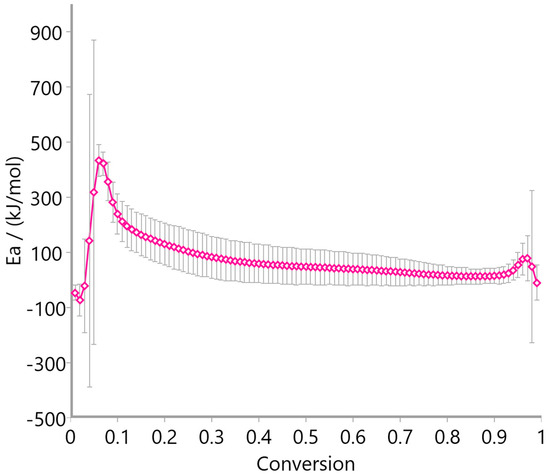
Figure 12.
Activation Energy of oat straw using the Ozawa–Flynn–Wall method.
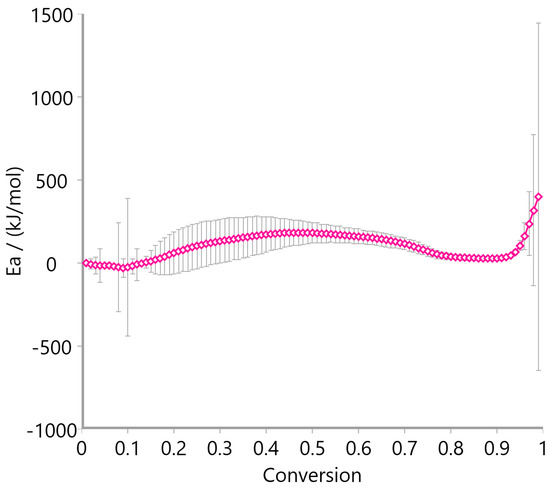
Figure 13.
Activation energy of meadow hay using the Ozawa–Flynn–Wall method.
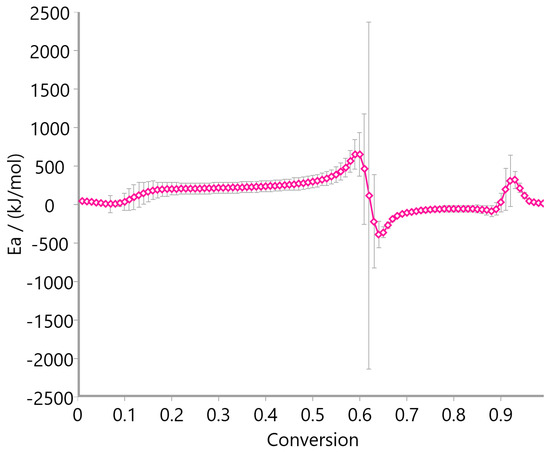
Figure 14.
Activation energy of rye straw using Ozawa–Flynn–Wall method.
The pre-exponential factor (log A), calculated via the Vyazovkin method and presented in Figure 15, Figure 16 and Figure 17, further supports the kinetic complexity of these materials. Oat straw (Figure 15) and meadow hay (Figure 16) both showed a declining trend in log A with increasing conversion, stabilizing around log A = 10–20 beyond a 0.5 conversion fraction. This trend is indicative of progressively slower molecular dynamics as the reaction proceeds. Conversely, rye straw (Figure 17) exhibited erratic behavior in log A values, with sharp deviations and a pronounced drop around α = 0.6, mirroring the instability seen in its activation energy curve.
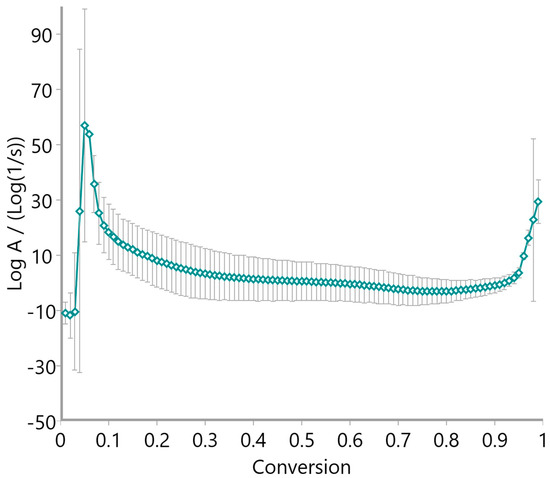
Figure 15.
Pre-exponential factor of oat straw using the Vyazovkin method.
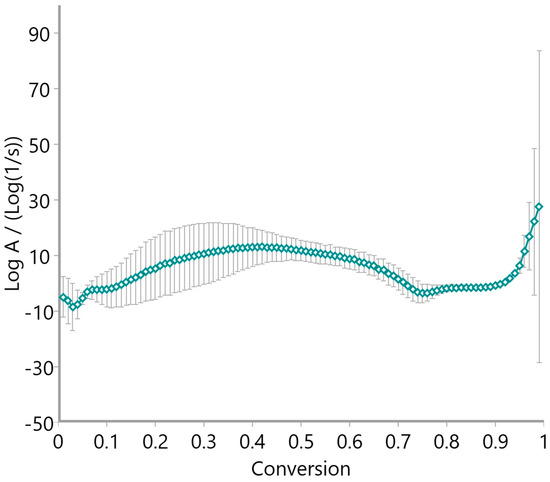
Figure 16.
Pre-exponential factor of meadow hay using the Vyazovkin method.
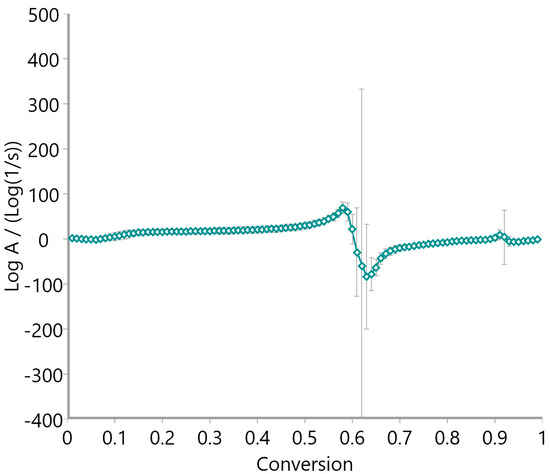
Figure 17.
Pre-exponential factor of rye straw using the Vyazovkin method.
Collectively, these figures highlight that meadow hay possesses the most kinetically consistent degradation behavior, likely due to its more homogeneous composition. Oat straw displays intermediate behavior, while rye straw is characterized by thermally resistant and kinetically complex decomposition, likely involving multiple reaction pathways and secondary processes. These differences have direct implications for the optimization of thermal conversion processes such as torrefaction or pyrolysis.
The investigation of total VOC emissions enabled the determination of emissions during the torrefaction process. The first sample that was tested was meadow hay (Figure 18).
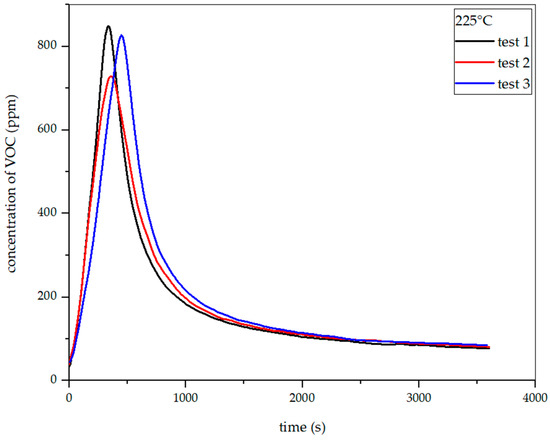
Figure 18.
Dependence of total VOC emission on time for hay torrefaction at 225 °C.
Figure 19, Figure 20 and Figure 21 show the dependence of total VOC emissions on time at subsequent temperatures for hay. The graphs show that the emissions increase with temperature. At 225 °C, the highest emission was approximately 850 ppm, occurring at the 330th second of the process. At 250 °C, the emission increased to about 1500 ppm in the 304th second. At 275 °C, the highest emission was observed in the 283rd second and amounted to about 2050 ppm. At 300 °C in the 247th second, this value increased to about 2700 ppm.
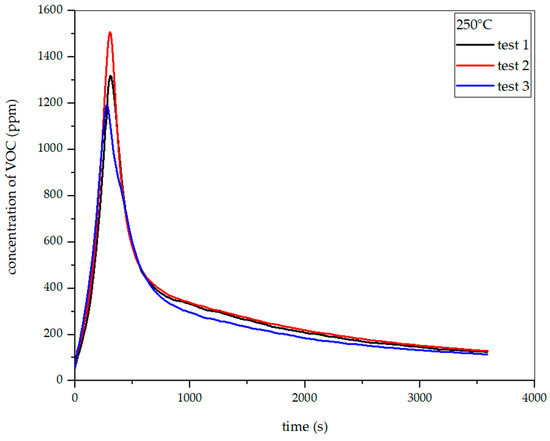
Figure 19.
Dependence of total VOC emission on time for hay torrefaction at 250 °C.
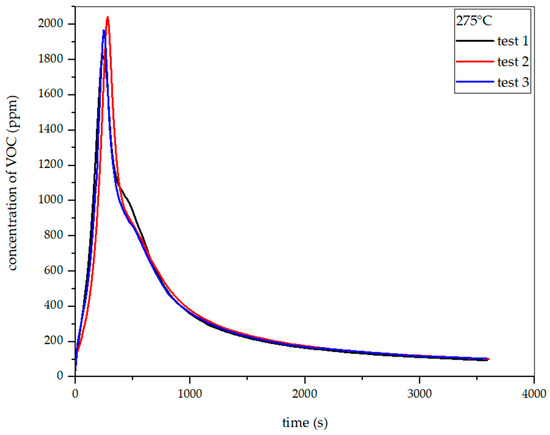
Figure 20.
Dependence of total VOC emission on time for hay torrefaction at 275 °C.
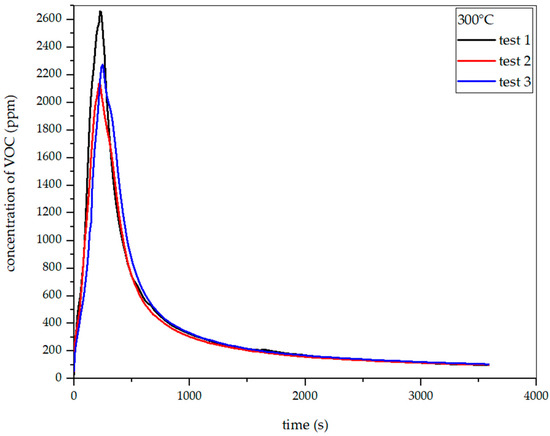
Figure 21.
Dependence of total VOC emission on time for hay torrefaction at 300 °C.
Figure 22, Figure 23, Figure 24 and Figure 25 show the dependence of total VOC emission on time at given temperatures for rye straw. Based on the diagrams, it can be observed that the emission increases with temperature, as in the case of hay. At 225 °C, the highest emission amounted to about 360 ppm in the 420th second of the process. At 250 °C, the emission increased to about 1000 ppm in the 330th second. At 275 °C, the highest emission was observed at the 342nd second, reaching approximately 1960 ppm. At 300 °C, in the 254th second, this value increased to about 2950 ppm. Based on the above-presented results, the total VOC emission index for rye straw was determined.
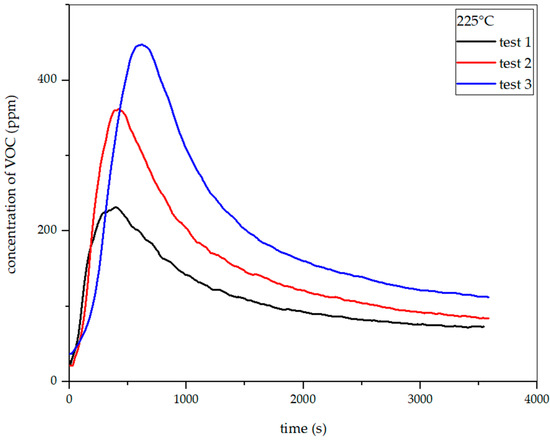
Figure 22.
Dependence of total VOC emission on time for rye straw torrefaction at 225 °C.
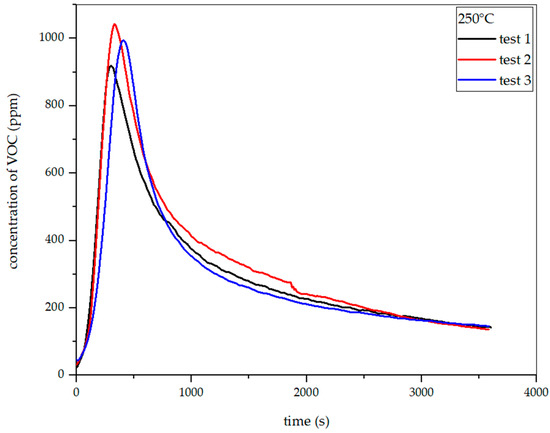
Figure 23.
Dependence of total VOC emission on time for rye straw torrefaction at 250 °C.
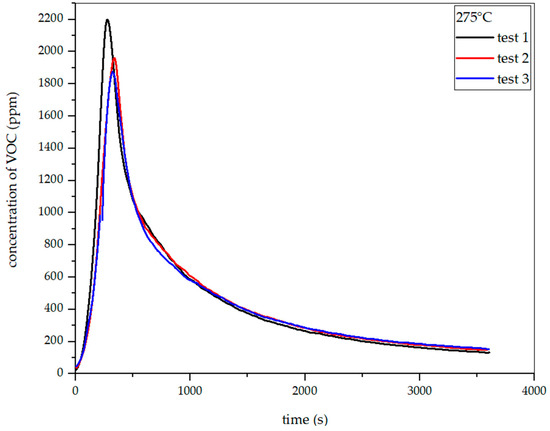
Figure 24.
Dependence of total VOC emission on time for rye straw torrefaction at 275 °C.
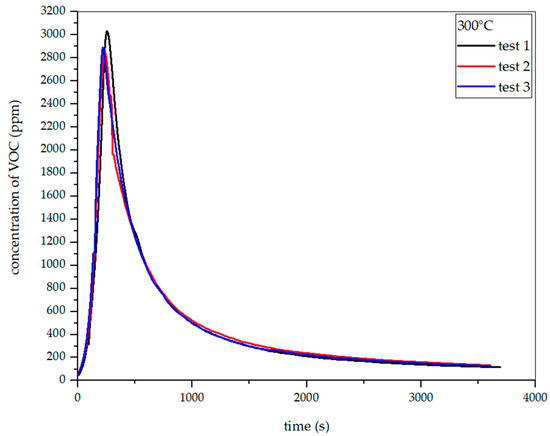
Figure 25.
Dependence of total VOC emission on time for rye straw torrefaction at 300 °C.
Figure 26, Figure 27, Figure 28 and Figure 29 show the dependence of total VOC emission on time at different temperatures for oat straw. It follows from these diagrams that the dependence of VOC emission on temperature is the same as in the two previous cases. At 225 °C, the highest emission was about 700 ppm in the 480th second of the process. At 250 °C, the emission increased to about 1200 ppm in the 256th second. At 275 °C, the highest emission was observed at the 245th second, with a value of around 1700 ppm. At 300 °C in the 303rd second, the emission grew to about 3700 ppm. Based on the results presented above, the total VOC emission index for oat straw was calculated.
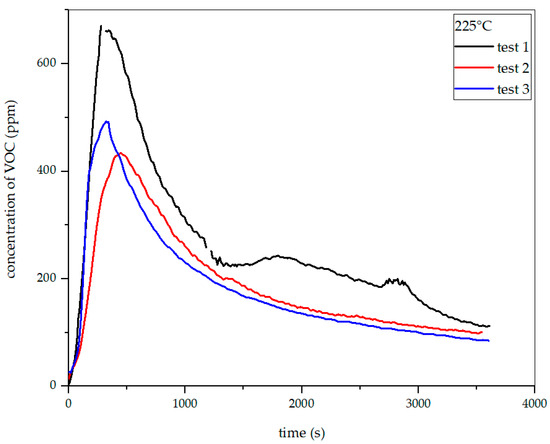
Figure 26.
Dependence of total VOC emission on time for oat straw torrefaction at 225 °C.
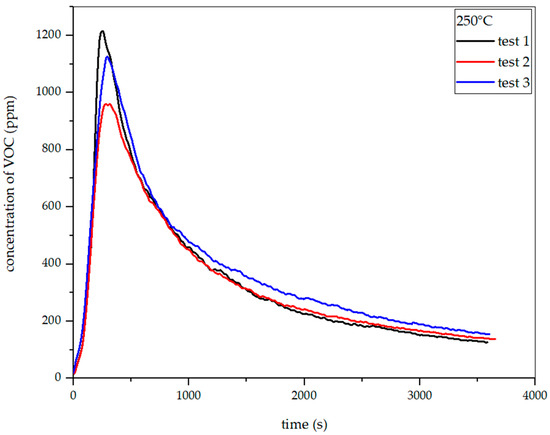
Figure 27.
Dependence of total VOC emission on time for oat straw torrefaction at 250 °C.
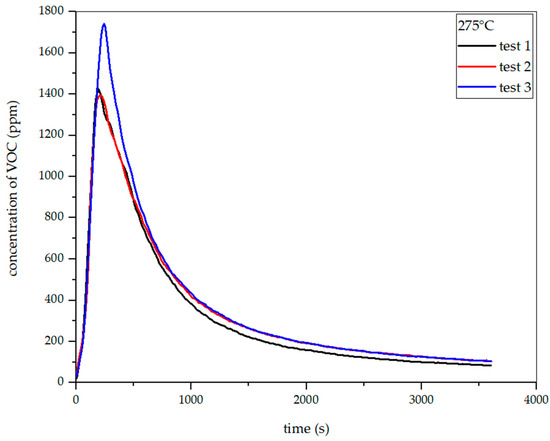
Figure 28.
Dependence of total VOC emission on time for oat straw torrefaction at 275 °C.
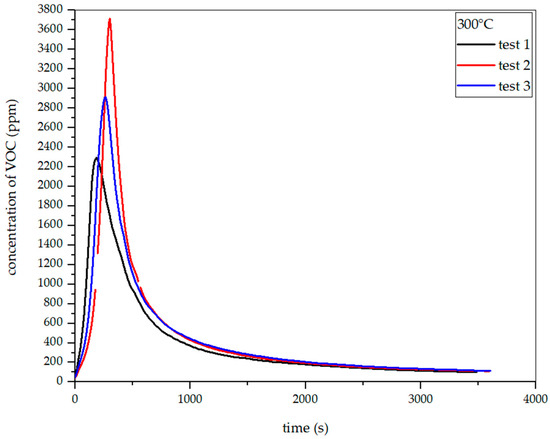
Figure 29.
Dependence of total VOC emission on time for oat straw torrefaction at 300 °C.
The VOC emission factor from the torrefaction process ranged from slightly more than 2 to nearly 10 mg/g of torrefied biomass (depending on the type of biomass and temperature). Assuming, after results of Hroncova [65] and Mehrabian [66], that the main volatile components of torgas are methane and carbon monoxide, and considering the heat of combustion of methane (approx. 50 MJ/kg) [78] and carbon monoxide (approx. 10 MJ/kg), it is possible to estimate the energy emission factor contained in torgas [79]. Based on the literature, the CH4:CO ratio can be rounded to be approximately 3:1. Hence, the average heat of combustion of torgas will be approximately 40 MJ/kg. If the emission of VOCs from the torrefaction process is 2–10 mg/g, this torgas will be a source of 80–400 kJ/kg of torrefied biomass, as shown in Table 3.

Table 3.
VOC emission index for different torrefaction temperatures for 3 samples.
Calculated weight losses for oat straw after the torrefaction are shown in Table 4.

Table 4.
Weight losses for oat straw.
The weight loss of oat straw ranged from 28 to 87%. The relationships between temperature and weight loss were the same as in the case of the two other types of biomass. Rye straw torrefaction resulted in weight loss ranging from 31 to 86%, depending on the process temperature. The same dependence of weight loss on temperature as for hay was observed. During the torrefaction of hay, weight loss ranged from 37 to 84% depending on temperature. The weight loss increased with temperature.
The final stage of the research involved determining the heat of combustion of the tested samples before and after the torrefaction process [54,80]. The torrefied samples are shown in Figure 30, Figure 31 and Figure 32.

Figure 30.
Hay samples before and after the torrefaction process.

Figure 31.
Rye straw samples before and after the torrefaction process.

Figure 32.
Oat straw samples before and after the torrefaction process.
The results of combustion heat measurements for the torrefied samples are given in Table 5.

Table 5.
Heat of combustion of the tested biomass samples and their torrefied products.
In the raw form, the highest heat of combustion, equal to 18.0479 MJ/kg, was measured for rye straw (Table 5). The lowest heat of combustion was observed for raw oat straw—17.49 MJ/kg. After the torrefaction process, the highest heat of combustion was recorded for the torrefied biomass obtained from hay at 300 °C, and the lowest for rye straw and its torrefied product obtained at 225 °C—19.77 MJ/kg. Thus, it can be observed that the torrefaction process for all types of tested biomass increased the heat of combustion, thereby improving the use of biomass as a fuel. Dyjakon and Noszczyk (2020) found that torrefied at 320 °C, HHV values of forestry fruit residues ranged from 24.5 MJ·kg−1 to almost 27.0 MJ·kg−1 [81].
Therefore, it can be utilized as a heat source in a continuous torrefaction process. Research on the torrefaction process of agricultural biomass, in the form of meadow hay, rye straw, and oat straw, has shown that this process improves the combustible properties of agricultural waste biomass. Across all three agricultural residues, higher torrefaction temperatures yield both increased energy density and greater VOC release, but the rate of each response varies by feedstock. Meadow hay’s HHV rises from 17.87 MJ/kg (raw) to 25.58 MJ/kg at 300 °C. At the same time, its VOC emissions climb from 3.88 mg/g at 225 °C to 7.04 mg/g at 300 °C. Rye straw shows a 30% HHV gain (18.05 to 23.39 MJ/kg) alongside the steepest VOC increase from 3.02 mg/g to 9.36 mg/g, indicating its hemicellulose and lignin fractions volatilize most aggressively. Oat straw’s HHV improves by 23% (17.49 to 21.52 MJ/kg) as VOCs grow from 4.35 mg/g to 7.17 mg/g. In all cases, the bulk of the calorific upgrade occurs between 225 and 275 °C, where HHV climbs by roughly 4–6 MJ/kg, while VOC emissions double or triple. This parallel behavior confirms that devolatilization of oxygen-rich compounds both enriches the solid residue in carbon, raising HHV, and generates a torgas stream whose magnitude is feedstock- and temperature-dependent. Consequently, torrefaction parameters can be tuned to balance maximum energy densification against manageable VOC by-products for each biomass type. The overall heat of combustion increased by approximately 25–30%, which, combined with the drying of the flammable material, resulted in torrefied biomass becoming a fuel with properties similar to those of hard coal, commonly used in power generation and heating like for example Arigna Fuels Figure 33. The bulk density has decreased, which increases the energy density of the fuel and makes it easier to mix the torrefied biomass with fossil fuels for co-firing. The emission of VOCs from the torrefaction of several mg/g biomass allows us to expect that the stream of torrefied gas could be used as additional fuel, the source of energy, in the amount of 80–400 kJ/kg of torrefied biomass, supplied to the torrefaction process, improving significantly the economics of the project.
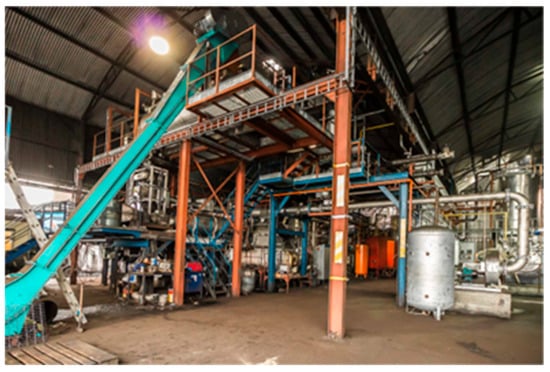
Figure 33.
Biomass torrefaction plants MK1 and MK2 in Arigna, Ireland, in operation.
In industrial-scale installations that operate continuously, such as the one at Arigna Fuels (Ireland, Figure 24), which produces 10 t/h of torrefied biomass for renewable biofuel applications, issues related to VOC emissions are crucial due to several reasons, including energy efficiency and economic considerations.
Typically, torrefaction gas is normally de-dusted using special types of cyclones before being used as a fuel to dry incoming feedstock, such as biomass. The parts, including much heavier tars, which are inside the torrefaction gas, may condense in the ducts upstream of the burner; this can lead to hazardous operational problems. To avoid this, special torrefaction gas ducts must be insulated. Nearly all leading developers of torrefied materials reuse the torrefaction gas by combusting it in a separate combustion unit, thereby increasing the overall efficiency of the process. The additional “waste” heat from the flue gas leaving the combustion unit is then utilized in the process and circulated through the dryer to dry the wet biomass directly or indirectly, as was done by our team at Lodz University of Technology, where we use the heat from the torgas indirectly via a heat exchanger for drying the biomass in a “rolling-bed” dryer—Figure 34.
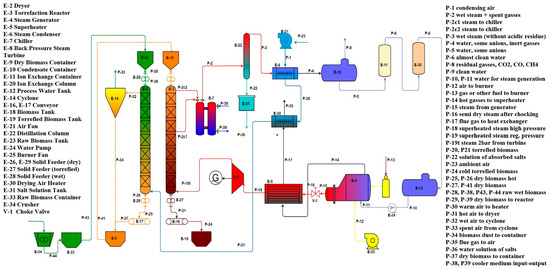
Figure 34.
Installation for the torrefaction process using SHS in a counter-flow reactor and a rolling bed dryer [82].
For stable and reliable operation of the torrefaction gas burner, a sufficient residence time, adequate mixing with combustion air, and a flame temperature above 900 °C are recommended. Looking at NOx emissions, they are generally low because of the modest combustion temperature of the gas. Considering relatively high amounts of F, S, or Cl, which are typically present in the feedstock, especially in agricultural biomass such as straw, treatment of the burner flue gases using an activated carbon filter or a wet precipitator may be necessary. To clean biomass fuels, a dust filter may be sufficient. At the end, it all depends on the exact layout and the temperature profile inside the reactor, as well as on the temperature of the flue gas (to avoid the possibility of fire and explosion, which have been a big issue and danger that have already happened in many industrial-scale installations in the EU).
From a socioeconomic perspective, as mentioned, there is strong potential for the use of selected straw in Poland for energy applications. Poland ranks fourth in the European Union in terms of total available biomass potential, and third in terms of agricultural biomass potential. Using locally available straw as an energy source is a strong accelerator for creating new jobs for local people, especially in rural areas. Villages and small towns are having huge problems with high unemployment rates. Several new jobs can be created through the application of agricultural torrefaction valorization technology, which involves multiple stages of preparation of agricultural biomass before direct combustion, such as collecting from the field, cleaning, sieving, grinding, drying, and storage. Agricultural biomass is increasingly being investigated as a substrate for valorization processes, such as torrefaction [83,84,85,86,87,88], pyrolysis [89,90,91,92], or hydrothermal valorization [72,93,94,95,96,97,98,99,100,101].
4. Conclusions
The torrefaction of waste biomass will enable the utilization of waste biomass generated on farms in co-firing processes with coal in large and medium-sized energy facilities, such as combined heat and power plants, thereby reducing pressure on the use of fossil fuels. The use of torrefied biomass with properties similar to those of coal also has the potential to improve combustion efficiency and allow us to avoid many technical problems that arise when co-firing raw biomass with coal (e.g., fouling and slagging phenomena described in the literature). Kinetic modeling indicated that feedstock-specific differences, particularly in activation energy and pre-exponential factor profiles, significantly influence thermal conversion behavior, with meadow hay being the most reactive and rye straw the most resistant. It is very important to use volatile organic compounds rich in carbon compounds and characterized by high energy content. It is best to use the heat contained in the gases to pre-dry the biomass before its final torrefaction process. In the next step, the research team from Lodz University of Technology plans to measure the content of volatile organic compounds in installations used for the biomass torrefaction process operating in continuous mode in industry shortly. The most crucial element of further research will be to determine the most efficient and economical method of collecting heat from torgas and using it for pre-drying biomass. In future work, authors will perform a comprehensive energy balance analysis of the torrefaction gas and its chemical composition to more accurately assess its potential as a heat source for pre-drying biomass prior to the primary torrefaction step.
Author Contributions
Conceptualization, J.C. and G.W.; methodology, G.W.; software, J.C.; validation, J.C.; formal analysis, J.C., G.W. and S.S.; investigation, S.S.; resources, J.C. and S.S.; data processing, J.C.; writing—original draft preparation, J.C., H.U., G.W. and S.S.; writing—review and editing, H.U., G.W. and S.S.; visualization, J.C.; supervision, G.W.; project administration, G.W. and S.S.; funding acquisition, G.W. All authors have read and agreed to the published version of the manuscript.
Funding
The studies presented were financed by the National Science Centre (NCN), Poland, 2022/45/N/NZ9/02110. For the purpose of Open Access, the author has applied a CC-BY public copyright license to any Author Accepted Manuscript (AAM) version arising from this submission. The publication was produced as part of the NAWA Mieczysław Bekker program: “BioGainValue—Research on biomass torrefaction process using superheated steam and properties on new bio-based products” (Grant No. BPN/BEK/2021/1/00248/U/DRAFT/00001), and the Horizon Europe project: “BIOmass Valorisation via Superheated Steam Torrefaction, Pyrolisis, Gasification Amplified by Multidisciplinary Researchers TRAINing for Multiple Energy and Products’ Added VALUEs” (Project No. 101086411, Horizon Europe, Maria Skłodowska-Curie Staff Exchange).
Data Availability Statement
The original contributions presented in the study are included in the article, further inquiries can be directed to the corresponding author.
Acknowledgments
This work was completed while the second author was a doctoral candidate in the Interdisciplinary Doctoral School at the Lodz University of Technology, Poland.
Conflicts of Interest
The authors declare no conflicts of interest.
References
- Silva, S.; Soares, I.; Afonso, O. Economic and Environmental Effects under Resource Scarcity and Substitution between Renewable and Non-Renewable Resources. Energy Policy 2013, 54, 113–124. [Google Scholar] [CrossRef]
- Allen, C.; Day, G. Depletion of Non-Renewable Resources Imported by China. China Econ. Rev. 2014, 30, 235–243. [Google Scholar] [CrossRef]
- Hart, R. Non-Renewable Resources in the Long Run. J. Econ. Dyn. Control 2016, 71, 1–20. [Google Scholar] [CrossRef]
- International Energy Agency Paris. World Energy Outlook 2020. Available online: https://www.iea.org/reports/world-energy-outlook-2020 (accessed on 22 May 2025).
- Wang, Z.; Bui, Q.; Zhang, B. The Relationship between Biomass Energy Consumption and Human Development: Empirical Evidence from BRICS Countries. Energy 2020, 194, 116906. [Google Scholar] [CrossRef]
- Unyay, H.; Perendeci, N.A.; Piersa, P.; Szufa, S.; Skwarczynska-Wojsa, A. Harnessing Switchgrass for Sustainable Energy: Bioethanol Production Processes and Pretreatment Technologies. Energies 2024, 17, 4812. [Google Scholar] [CrossRef]
- Irfan, M.; Zhao, Z.-Y.; Panjwani, M.K.; Mangi, F.H.; Li, H.; Jan, A.; Ahmad, M.; Rehman, A. Assessing the Energy Dynamics of Pakistan: Prospects of Biomass Energy. Energy Rep. 2020, 6, 80–93. [Google Scholar] [CrossRef]
- Schwerz, F.; Neto, D.D.; Caron, B.O.; Nardini, C.; Sgarbossa, J.; Eloy, E.; Behling, A.; Elli, E.F.; Reichardt, K. Biomass and Potential Energy Yield of Perennial Woody Energy Crops under Reduced Planting Spacing. Renew. Energy 2020, 153, 1238–1250. [Google Scholar] [CrossRef]
- Tuğrul, K.M.; İçöz, E.; Perendeci, N.A. Determination of Soil Loss by Sugar Beet Harvesting. Soil Tillage Res. 2012, 123, 71–77. [Google Scholar] [CrossRef]
- Schuenemann, F.; Msangi, S.; Zeller, M. Policies for a Sustainable Biomass Energy Sector in Malawi: Enhancing Energy and Food Security Simultaneously. World Dev. 2018, 103, 14–26. [Google Scholar] [CrossRef]
- Romanowska-Duda, Z.; Piotrowski, K.; Szufa, S.; Sklodowska, M.; Naliwajski, M.; Emmanouil, C.; Kungolos, A.; Zorpas, A.A. Valorization of Spirodela Polyrrhiza Biomass for the Production of Biofuels for Distributed Energy. Sci. Rep. 2023, 13, 16533. [Google Scholar] [CrossRef]
- Unyay, H.; Altay, H.O.; Perendeci, N.A.; Szufa, S.; Ozdemir, F.; Angelidaki, I. Valorisation potential of black tea processing wastes for bioactive compounds recovery and renewable energy production. J. Environ. Chem. Eng. 2025, 13, 117124. [Google Scholar] [CrossRef]
- Banja, M.; Sikkema, R.; Jégard, M.; Motola, V.; Dallemand, J.-F. Biomass for Energy in the EU—The Support Framework. Energy Policy 2019, 131, 215–228. [Google Scholar] [CrossRef]
- Başar, İ.A.; Perendeci, N.A.; Yenilmez, F.; Ünyay, H.; Yaldız, O.; Soylu, S. Characterisation and biofuel production potential assessment of eight switchgrass cultivars grown in Türkiye: Insights from principal component analysis. Biomass Bioenergy 2025, 201, 108103. [Google Scholar] [CrossRef]
- Miesięcznik Forum Energii: Styczeń 2025–Podsumowanie. Available online: https://nowa-energia.com.pl/2025/02/10/miesiecznik-forum-energii-styczen-2025-podsumowanie/ (accessed on 22 May 2025).
- Available online: https://www.ren21.net/gsr-2024/modules/energy_supply/01_global_trends/ (accessed on 22 May 2025).
- Chew, J.J.; Doshi, V. Recent Advances in Biomass Pretreatment—Torrefaction Fundamentals and Technology. Renew. Sustain. Energy Rev. 2011, 15, 4212–4222. [Google Scholar] [CrossRef]
- Libra, J.A.; Ro, K.S.; Kammann, C.; Funke, A.; Berge, N.D.; Neubauer, Y.; Titirici, M.-M.; Fühner, C.; Bens, O.; Kern, J.; et al. Hydrothermal carbonization of biomass residuals: A comparative review of the chemistry, processes and applications of wet and dry pyrolysis. Biofuels 2011, 2, 71–106. [Google Scholar] [CrossRef]
- Tumuluru, J.S.; Sokhansanj, S.; Wright, C.T. Boardman Biomass Torrefaction Process Review and Moving Bed Torrefaction System Model Development; Idaho National Lab. (INL): Idaho Falls, ID, USA, 2010. [Google Scholar] [CrossRef]
- Chen, W.H.; Lin, B.J.; Lin, Y.Y.; Chu, Y.S.; Ubando, A.T.; Show, P.L.; Ong, H.C.; Chang, J.S.; Ho, S.H.; Culaba, A.B.; et al. Progress in biomass torrefaction: Principles, applications and challenges. Prog. Energy Combust. Sci. 2021, 82, 100887. [Google Scholar] [CrossRef]
- Kazimierski, P.; Januszewicz, K.; Godlewski, W.; Fijuk, A.; Suchocki, T.; Chaja, P.; Barczak, B.; Kardaś, D. The Course and the Effects of Agricultural Biomass Pyrolysis in the Production of High-Calorific Biochar. Materials 2022, 15, 1038. [Google Scholar] [CrossRef]
- Unyay, H.; Piersa, P.; Perendeci, N.A.; Wielgosinski, G.; Szufa, S. Valorization of Anaerobic Digestate: Innovative Approaches for Sustainable Resource Management and Energy Production—Case Studies from Turkey and Poland. Int. J. Green Energy 2024, 21, 1928–1943. [Google Scholar] [CrossRef]
- Mamvura, T.A.; Danha, G. Biomass Torrefaction as an Emerging Technology to Aid in Energy Production. Heliyon 2020, 6, e03531. [Google Scholar] [CrossRef]
- Proskurina, S.; Heinimö, J.; Schipfer, F.; Vakkilainen, E. Biomass for Industrial Applications: The Role of Torrefaction. Renew. Energy 2017, 111, 265–274. [Google Scholar] [CrossRef]
- Bridgeman, T.G.; Jones, J.M.; Shield, I.; Williams, P.T. Torrefaction of Reed Canary Grass, Wheat Straw and Willow to Enhance Solid Fuel Qualities and Combustion Properties. Fuel 2008, 87, 844–856. [Google Scholar] [CrossRef]
- Szufa, S.; Piersa, P.; Junga, R.; Błaszczuk, A.; Modliński, N.; Sobek, S.; Marczak-Grzesik, M.; Adrian, Ł.; Dzikuć, M. Numerical Modeling of the Co-Firing Process of an in Situ Steam-Torrefied Biomass with Coal in a 230 MW Industrial-Scale Boiler. Energy 2023, 263, 125918. [Google Scholar] [CrossRef]
- Felfli, F.; Luengo, C.; Beaton, P.; Suarez, J. Efficiency test for bench unit torrefaction and characterization of torrefied biomass. In Biomass—A Growth Opportunity in Green Energy and Value-Added Products, Proceedings of the Fourth Biomass Conference of the Americas, Oakland, CA, USA, 29 August–2 September 1999; Elsevier Science: Oxford, UK, 1999; pp. 1–2. [Google Scholar]
- Jackowski, M.; Niedźwiecki, Ł.; Mościcki, K.; Arora, A.; Saeed, M.A.; Krochmalny, K.; Pawliczek, J.; Trusek, A.; Lech, M.; Skřínský, J.; et al. Synergetic Co-Production of Beer Colouring Agent and Solid Fuel from Brewers’ Spent Grain in the Circular Economy Perspective. Sustainability 2021, 13, 10480. [Google Scholar] [CrossRef]
- Szufa, S.; Wielgosiński, G.; Piersa, P.; Czerwińska, J.; Dzikuć, M.; Adrian, Ł.; Lewandowska, W.; Marczak, M. Torrefaction of Straw from Oats and Maize for Use as a Fuel and Additive to Organic Fertilizers—TGA Analysis, Kinetics as Products for Agricultural Purposes. Energies 2020, 13, 2064. [Google Scholar] [CrossRef]
- Duranay, N.D.; Akkuş, G. Solid fuel production with torrefaction from vineyard pruning waste. Biomass Convers Biorefinery 2021, 11, 2335–2346. [Google Scholar] [CrossRef]
- Ramos-Carmona, S.; Pérez, J.F.; Pelaez-Samaniego, M.R.; Barrera, R.; Garcia-Perez, M. Effect of torrefaction temperature on properties of Patula pine. Maderas Cienc. Tecnol. 2017, 19, 39–50. [Google Scholar] [CrossRef]
- Marczak-Grzesik, M.; Budzyń, S.; Tora, B.; Szufa, S.; Kogut, K.; Burmistrz, P. Low-Cost Organic Adsorbents for Elemental Mercury Removal from Lignite Flue Gas. Energies 2021, 14, 2174. [Google Scholar] [CrossRef]
- Filipe dos Santos Viana, H.; Martins Rodrigues, A.; Godina, R.; Carlos de Oliveira Matias, J.; Jorge Ribeiro Nunes, L. Evaluation of the Physical, Chemical and Thermal Properties of Portuguese Maritime Pine Biomass. Sustainability 2018, 10, 2877. [Google Scholar] [CrossRef]
- Vandenbroek, R. Biomass Combustion for Power Generation. Biomass Bioenergy 1996, 11, 271–281. [Google Scholar] [CrossRef]
- Saidur, R.; Abdelaziz, E.A.; Demirbas, A.; Hossain, M.S.; Mekhilef, S. A Review on Biomass as a Fuel for Boilers. Renew. Sustain. Energy Rev. 2011, 15, 2262–2289. [Google Scholar] [CrossRef]
- da Silva, J.B.S.; Cabral, A.A.; Bezerra, G.V.P.; da Cruz, N.C.; Conconi, C.C.; Cruz, G. Buriti (Mauritia flexuosa L.) wastes as potential lignocellulosic feedstock for bioenergy production: Physicochemical properties, thermal behavior, and emission factors. Ind. Crops Prod. 2023, 206, 117689. [Google Scholar] [CrossRef]
- Dyjakon, A.; Sobol, Ł.; Krotowski, M.; Mudryk, K.; Kawa, K. The Impact of Particles Comminution on Mechanical Durability of Wheat Straw Briquettes. Energies 2020, 13, 6186. [Google Scholar] [CrossRef]
- Atienza-Martínez, M.; Fonts, I.; Ábrego, J.; Ceamanos, J.; Gea, G. Sewage sludge torrefaction in a fluidized bed reactor. Chem. Eng. 2013, 222, 534–545. [Google Scholar] [CrossRef]
- Wielgosiński, G.; Czerwińska, J. Smog Episodes in Poland. Atmosphere 2020, 11, 277. [Google Scholar] [CrossRef]
- Duan, Y.; Duan, L.; Wang, J.; Anthony, E.J. Observation of Simultaneously Low CO, NOx and SO2 Emission during Oxy-Coal Combustion in a Pressurized Fluidized Bed. Fuel 2019, 242, 374–381. [Google Scholar] [CrossRef]
- Dmitrienko, M.A.; Nyashina, G.S.; Strizhak, P.A. Major Gas Emissions from Combustion of Slurry Fuels Based on Coal, Coal Waste, and Coal Derivatives. J. Clean. Prod. 2018, 177, 284–301. [Google Scholar] [CrossRef]
- Danish; Wang, Z. Does Biomass Energy Consumption Help to Control Environmental Pollution? Evidence from BRICS Countries. Sci. Total Environ. 2019, 670, 1075–1083. [Google Scholar] [CrossRef] [PubMed]
- Fais, B.; Sabio, N.; Strachan, N. The Critical Role of the Industrial Sector in Reaching Long-Term Emission Reduction, Energy Efficiency and Renewable Targets. Appl. Energy 2016, 162, 699–712. [Google Scholar] [CrossRef]
- Zheng, S.; Yang, Y.; Li, X.; Liu, H.; Yan, W.; Sui, R.; Lu, Q. Temperature and Emissivity Measurements from Combustion of Pine Wood, Rice Husk and Fir Wood Using Flame Emission Spectrum. Fuel Process. Technol. 2020, 204, 106423. [Google Scholar] [CrossRef]
- Alves, J.L.F.; da Silva, J.C.G.; Mumbach, G.D.; Di Domenico, M.; da Silva Filho, V.F.; de Sena, R.F.; Machado, R.A.F.; Marangoni, C. Insights into the Bioenergy Potential of Jackfruit Wastes Considering Their Physicochemical Properties, Bioenergy Indicators, Combustion Behaviors, and Emission Characteristics. Renew. Energy 2020, 155, 1328–1338. [Google Scholar] [CrossRef]
- Guo, Z.; Wu, J.; Zhang, Y.; Wang, F.; Guo, Y.; Chen, K.; Liu, H. Characteristics of Biomass Charcoal Briquettes and Pollutant Emission Reduction for Sulfur and Nitrogen during Combustion. Fuel 2020, 272, 117632. [Google Scholar] [CrossRef]
- Siuda, R.; Kwiatek, J.; Szufa, S.; Obraniak, A.; Piersa, P.; Adrian, Ł.; Modrzewski, R.; Ławińska, K.; Siczek, K.; Olejnik, T.P. Industrial Verification and Research Development of Lime–Gypsum Fertilizer Granulation Method. Minerals 2021, 11, 119. [Google Scholar] [CrossRef]
- Pawlak-Kruczek, H.; Arora, A.; Mościcki, K.; Krochmalny, K.; Sharma, S.; Niedzwiecki, L. A Transition of a Domestic Boiler from Coal to Biomass—Emissions from Combustion of Raw and Torrefied Palm Kernel Shells (PKS). Fuel 2020, 263, 116718. [Google Scholar] [CrossRef]
- Dębowski, M.; Bukowski, P.; Kobel, P.; Bieniek, J.; Romański, L.; Knutel, B. Comparison of Energy Consumption of Cereal Grain Dryer Powered by LPG and Hard Coal in Polish Conditions. Energies 2021, 14, 4340. [Google Scholar] [CrossRef]
- Nunes, L.J.R. A Case Study about Biomass Torrefaction on an Industrial Scale: Solutions to Problems Related to Self-Heating, Difficulties in Pelletizing, and Excessive Wear of Production Equipment. Appl. Sci. 2020, 10, 2546. [Google Scholar] [CrossRef]
- Borén, E.; Pommer, L.; Nordin, A.; Larsson, S.H. Off-Gassing from Pilot-Scale Torrefied Pine Chips: Impact of Torrefaction Severity, Cooling Technology, and Storage Times. Fuel Process. Technol. 2020, 202, 106380. [Google Scholar] [CrossRef]
- Murayama, T. Effects of Fuel Properties in Combustion Systems. In Advanced Combustion Science; Springer: Tokyo, Japan, 1993; pp. 245–272. [Google Scholar]
- Vassilev, S.V.; Vassileva, C.G.; Vassilev, V.S. Advantages and Disadvantages of Composition and Properties of Biomass in Comparison with Coal: An Overview. Fuel 2015, 158, 330–350. [Google Scholar] [CrossRef]
- Vassilev, S.V.; Baxter, D.; Andersen, L.K.; Vassileva, C.G.; Morgan, T.J. An Overview of the Organic and Inorganic Phase Composition of Biomass. Fuel 2012, 94, 1–33. [Google Scholar] [CrossRef]
- Kazimierski, P.; Hercel, P.; Januszewicz, K.; Kardaś, D. Pre-Treatment of Furniture Waste for Smokeless Charcoal Production. Materials 2020, 13, 3188. [Google Scholar] [CrossRef]
- Andritz Industrial Applications. Available online: https://www.andritz.com/feed-and-biofuel-en/industries/industrial-applications (accessed on 25 May 2025).
- Spokas, K.A.; Novak, J.M.; Stewart, C.E.; Cantrell, K.B.; Uchimiya, M.; DuSaire, M.G.; Ro, K.S. Qualitative Analysis of Volatile Organic Compounds on Biochar. Chemosphere 2011, 85, 869–882. [Google Scholar] [CrossRef]
- Borén, E.; Larsson, S.H.; Thyrel, M.; Averheim, A.; Broström, M. VOC Off-Gassing from Pelletized Steam Exploded Softwood Bark: Emissions at Different Industrial Process Steps. Fuel Process. Technol. 2018, 171, 70–77. [Google Scholar] [CrossRef]
- Bourgois, J.; Guyonnet, R. Characterization and Analysis of Torrefied Wood. Wood Sci. Technol. 1988, 22, 143–155. [Google Scholar] [CrossRef]
- Białowiec, A.; Micuda, M.; Szumny, A.; Łyczko, J.; Koziel, J. Waste to Carbon: Influence of Structural Modification on VOC Emission Kinetics from Stored Carbonized Refuse-Derived Fuel. Sustainability 2019, 11, 935. [Google Scholar] [CrossRef]
- Tumuluru, J.S.; Ghiasi, B.; Soelberg, N.R.; Sokhansanj, S. Biomass Torrefaction Process, Product Properties, Reactor Types, and Moving Bed Reactor Design Concepts. Front. Energy Res. 2021, 9, 728140. [Google Scholar] [CrossRef]
- van der Stelt, M.J.C.; Gerhauser, H.; Kiel, J.H.A.; Ptasinski, K.J. Biomass Upgrading by Torrefaction for the Production of Biofuels: A Review. Biomass Bioenergy 2011, 35, 3748–3762. [Google Scholar] [CrossRef]
- Nocquet, T.; Dupont, C.; Commandre, J.-M.; Grateau, M.; Thiery, S.; Salvador, S. Volatile Species Release during Torrefaction of Biomass and Its Macromolecular Constituents: Part 2—Modeling Study. Energy 2014, 72, 188–194. [Google Scholar] [CrossRef]
- Prins, M.J.; Ptasinski, K.J.; Janssen, F.J.J.G. Torrefaction of Wood. J. Anal. Appl. Pyrolysis 2006, 77, 35–40. [Google Scholar] [CrossRef]
- Hroncová, E.; Puskajler, J. Emission of Pollutants from Torrefaction of Wood. Eur. J. Environ. Saf. Sci. 2014, 2, 19–22. [Google Scholar]
- Zhou, Q.; Shen, Y.; Gu, X. Progress in torrefaction pretreatment for biomass gasification. Green Chem. 2024, 26, 9652–9670. [Google Scholar] [CrossRef]
- PN-EN ISO 18134-1:2015-11; Biopaliwa Stałe—Oznaczenie Zawartości Wilgoci—Metoda Suszarkowa. Część 1: Wilgoć Całkowita—Metoda Referencyjna. International Organization for Standardization: Geneva, Switzerland, 2015.
- Lang, K.W.; Steinberg, M.P. Calculation of Moisture Content of a Formulated Food System to Any Given Water Activity. J. Food Sci. 1980, 45, 1228–1230. [Google Scholar] [CrossRef]
- PN-80/G-04512:1998; Paliwa Stałe—Oznaczanie Zawartości Popiołu Metodą Wagową. Polski Komitet Normalizacyjny (PKN): Warsaw, Poland, 1998.
- Ismail, B.P. Ash Content Determination. In Nielsen’s Food Analysis Laboratory Manual; Springer International Publishing: Cham, Switzerland, 2017; pp. 117–119. [Google Scholar]
- He, Q.; Ding, L.; Gong, Y.; Li, W.; Wei, J.; Yu, G. Effects of torrefaction on pinewood pyrolysis kinetics and thermal behavior using thermogravimetric analysis. Bioresour. Technol. 2019, 280, 104–111. [Google Scholar] [CrossRef]
- Wang, S.; Wen, Y.; Shi, Z.; Niedzwiecki, L.; Baranowski, M.; Czerep, M.; Mu, W.; Kruczek, H.P.; Jönsson, P.G.; Yang, W. Effect of Hydrothermal Carbonization Pretreatment on the Pyrolysis Behavior of the Digestate of Agricultural Waste: A View on Kinetics and Thermodynamics. Chem. Eng. J. 2022, 431, 133881. [Google Scholar] [CrossRef]
- Čespiva, J.; Niedzwiecki, L.; Wnukowski, M.; Krochmalny, K.; Mularski, J.; Ochodek, T.; Pawlak-Kruczek, H. Torrefaction and Gasification of Biomass for Polygeneration: Production of Biochar and Producer Gas at Low Load Conditions. Energy Rep. 2022, 8, 134–144. [Google Scholar] [CrossRef]
- Luo, H.; Wang, X.; Krochmalny, K.; Niedzwiecki, L.; Czajka, K.; Pawlak-Kruczek, H.; Wu, X.; Liu, X.; Xiong, Q. Assessments and Analysis of Lumped and Detailed Pyrolysis Kinetics for Biomass Torrefaction with Particle-Scale Modeling. Biomass Bioenergy 2022, 166, 106619. [Google Scholar] [CrossRef]
- Chen, B.; Koziel, J.A.; O’Brien, S.C.; Bialowiec, A. The Mitigation of Gaseous Emissions from Swine Manure: A Review of Biochar Application for Environmental Management. In Proceedings of the 2022 ASABE Annual International Meeting, Houston, Texas, USA, 17–20 July 2022; American Society of Agricultural and Biological Engineers: St. Joseph, MI, USA, 2022. [Google Scholar]
- PN-EN 12619:05; Emisja Ze Źródeł Stacjonarnych—Metoda Ciągłego Pomiaru z Detekcją Płomieniowo-Jonizacyjną. European Committee for Standardization: Brussels, Belgium, 2013.
- Chai, M.; Xie, L.; Yu, X.; Zhang, X.; Yang, Y.; Rahman, M.M.; Blanco, P.H.; Liu, R.; Bridgwater, A.V.; Cai, J. Poplar Wood Torrefaction: Kinetics, Thermochemistry and Implications. Renew. Sustain. Energy Rev. 2021, 143, 110962. [Google Scholar] [CrossRef]
- Kryshtopa, S.; Kryshtopa, L.; Panchuk, M.; Smigins, R.; Dolishnii, B. Composition and Energy Value Research of Pyrolise Gases. IOP Conf. Ser. Earth Environ. Sci. 2021, 628, 012008. [Google Scholar] [CrossRef]
- James, A.M.; Yuan, W.; Boyette, M.D.; Wang, D. The Effect of Air Flow Rate and Biomass Type on the Performance of an Updraft Biomass Gasifier. BioResources 2015, 10, 3615–3624. [Google Scholar] [CrossRef]
- Vasileiadou, M.A.; Altiparmaki, G.; Moustakas, K.; Vakalis, S. Quality of Hydrochar from Wine Sludge under Variable Conditions of Hydrothermal Carbonization: The Case of Lesvos Island. Energies 2022, 15, 3574. [Google Scholar] [CrossRef]
- Dyjakon, A.; Noszczyk, T. Alternative Fuels from Forestry Biomass Residue: Torrefaction Process of Horse Chestnuts, Oak Acorns, and Spruce Cones. Energies 2020, 13, 2468. [Google Scholar] [CrossRef]
- Szufa, S.; Unyay, H.; Pakowski, Z.; Piersa, P.; Siczek, K.; Kabaciński, M.; Sobek, S.; Moj, K.; Likozar, B.; Kostyniuk, A.; et al. Batch rolling-bed dryer applicability for drying biomass prior to torrefaction. Renew. Energy 2025, 239, 122106. [Google Scholar] [CrossRef]
- Szufa, S.; Unyay, H.; Piersa, P.; Kędzierska-Sar, A.; Romanowska-Duda, Z.; Likozar, B. Reduction of spruce phytotoxicity by superheated steam torrefaction and its use in stimulating the growth of ecological bio-products: Lemna minor L. Biomass Conv. Bioref. 2025, 15, 17739–17760. [Google Scholar] [CrossRef]
- Massaro Sousa, L.; Ogura, A.P.; Anchieta, C.G.; Morin, M.; Canabarro, N.I. Biomass Torrefaction for Renewable Energy: From Physicochemical, Bulk Properties, and Flowability to Future Perspectives and Applications. Energy Fuels 2024, 38, 18367–18385. [Google Scholar] [CrossRef]
- Ünyay, H.; Yılmaz, F.; Başar, İ.A.; Altınay Perendeci, N.; Çoban, I.; ¸Sahinkaya, E. Effects of organic loading rate on methane production from switchgrass in batch and semi-continuous stirred tank reactor system. Biomass Bioenergy 2022, 156, 106306. [Google Scholar] [CrossRef]
- Torres Ramos, R.; Valez Salas, B.; Montero Alpírez, G.; Coronado Ortega, M.A.; Curiel Álvarez, M.A.; Tzintzun Camacho, O.; Beleño Cabarcas, M.T. Torrefaction under Different Reaction Atmospheres to Improve the Fuel Properties of Wheat Straw. Processes 2023, 11, 1971. [Google Scholar] [CrossRef]
- Luo, H.; Niedzwiecki, L.; Arora, A.; Mościcki, K.; Pawlak-Kruczek, H.; Krochmalny, K.; Baranowski, M.; Tiwari, M.; Sharma, A.; Sharma, T.; et al. Influence of Torrefaction and Pelletizing of Sawdust on the Design Parameters of a Fixed Bed Gasifier. Energies 2020, 13, 3018. [Google Scholar] [CrossRef]
- Szufa, S.; Adrian, Ł.; Piersa, P.; Romanowska-Duda, Z.; Grzesik, M.; Cebula, A.; Kowalczyk, S. Experimental studies on energy crops torrefaction process using batch reactor to estimate torrefaction temperature and residence time. In Renewable Energy Sources: Engineering, Technology, Innovation; Springer: Cham, Switzerland, 2018; pp. 365–373. [Google Scholar]
- Kazimierski, P.; Hercel, P.; Suchocki, T.; Smoliński, J.; Pladzyk, A.; Kardaś, D.; Łuczak, J.; Januszewicz, K. Pyrolysis of Pruning Residues from Various Types of Orchards and Pretreatment for Energetic Use of Biochar. Materials 2021, 14, 2969. [Google Scholar] [CrossRef] [PubMed]
- Głowacki, S.; Salamon, A.; Sojak, M.; Tulej, W.; Bryś, A.; Hutsol, T.; Salamon, M.; Kukharets, S.; Janaszek-Mańkowska, M. The Use of Brewer’s Spent Grain after Beer Production for Energy Purposes. Materials 2022, 15, 3703. [Google Scholar] [CrossRef] [PubMed]
- Mudryk, K.; Jewiarz, M.; Wróbel, M.; Niemiec, M.; Dyjakon, A. Evaluation of Urban Tree Leaf Biomass-Potential, Physico-Mechanical and Chemical Parameters of Raw Material and Solid Biofuel. Energies 2021, 14, 818. [Google Scholar] [CrossRef]
- Nieścioruk, M.J.; Bandrow, P.; Szufa, S.; Woźniak, M.; Siczek, K. Biomass-Based Hydrogen Extraction and Accompanying Hazards—Review. Molecules 2025, 30, 565. [Google Scholar] [CrossRef]
- Zhao, Y.; Lu, T.; Xu, G.; Luo, Y.; Zhang, X.; Wu, X.; Han, X.; Tester, W.J.; Wang, K. Hydrothermal co-carbonization of rice straw and acid whey for enhanced hydrochar properties and nutrient recovery. Green Energy Resour. 2024, 2, 100077. [Google Scholar] [CrossRef]
- Wen, Y.; Wang, S.; Shi, Z.; Nuran Zaini, I.; Niedzwiecki, L.; Aragon-Briceno, C.; Tang, C.; Pawlak-Kruczek, H.; Jönsson, P.G.; Yang, W. H2-Rich Syngas Production from Pyrolysis of Agricultural Waste Digestate Coupled with the Hydrothermal Carbonization Process. Energy Convers. Manag. 2022, 269, 116101. [Google Scholar] [CrossRef]
- Mendiara, T.; Navajas, A.; Abad, A.; Pröll, T.; Munárriz, M.; Gandía, L.M.; García-Labiano, F.; de Diego, L.F. Life Cycle Assessment of Wheat Straw Pyrolysis with Volatile Fractions Chemical Looping Combustion. Sustainability 2024, 16, 4013. [Google Scholar] [CrossRef]
- Nizamuddin, S.; Qureshi, S.S.; Baloch, H.A.; Siddiqui, M.T.H.; Takkalkar, P.; Mubarak, N.M.; Dumbre, D.K.; Griffin, G.J.; Madapusi, S.; Tanksale, A. Microwave Hydrothermal Carbonization of Rice Straw: Optimization of Process Parameters and Upgrading of Chemical, Fuel, Structural and Thermal Properties. Materials 2019, 12, 403. [Google Scholar] [CrossRef]
- Sobol, Ł.; Dyjakon, A.; Dlugogorski, B.Z. Dioxin-like polychlorinated biphenyls (dl-PCB) in hydrochars and biochars: Review of recent evidence, pollution levels, critical gaps, formation mechanisms and regulations. J. Hazard. Mater. 2025, 486, 136615. [Google Scholar] [CrossRef] [PubMed]
- Jackowski, M.; Niedzwiecki, L.; Lech, M.; Wnukowski, M.; Arora, A.; Tkaczuk-Serafin, M.; Baranowski, M.; Krochmalny, K.; Veetil, V.K.; Seruga, P.; et al. HTC of Wet Residues of the Brewing Process: Comprehensive Characterization of Produced Beer, Spent Grain and Valorized Residues. Energies 2020, 13, 2058. [Google Scholar] [CrossRef]
- Aragon-Briceño, C.; Pożarlik, A.; Bramer, E.; Brem, G.; Wang, S.; Wen, Y.; Yang, W.; Pawlak-Kruczek, H.; Niedźwiecki, Ł.; Urbanowska, A.; et al. Integration of hydrothermal carbonization treatment for water and energy recovery from organic fraction of municipal solid waste digestate. Renew. Energy 2022, 184, 577–591. [Google Scholar] [CrossRef]
- Urbanowska, A.; Kabsch-Korbutowicz, M.; Aragon-Briceño, C.; Wnukowski, M.; Pożarlik, A.; Niedzwiecki, L.; Baranowski, M.; Czerep, M.; Seruga, P.; Pawlak-Kruczek, H.; et al. Cascade Membrane System for Separation of Water and Organics from Liquid By-Products of HTC of the Agricultural Digestate—Evaluation of Performance. Energies 2021, 14, 4752. [Google Scholar] [CrossRef]
- Marczak-Grzesik, M.; Piersa, P.; Karczewski, M.; Szufa, S.; Ünyay, H.; Kędzierska-Sar, A.; Bochenek, P. Modified Fly Ash-Based Adsorbents (MFA) for Mercury and Carbon Dioxide Removal from Coal-Fired Flue Gases. Energies 2021, 14, 7101. [Google Scholar] [CrossRef]
Disclaimer/Publisher’s Note: The statements, opinions and data contained in all publications are solely those of the individual author(s) and contributor(s) and not of MDPI and/or the editor(s). MDPI and/or the editor(s) disclaim responsibility for any injury to people or property resulting from any ideas, methods, instructions or products referred to in the content. |
© 2025 by the authors. Licensee MDPI, Basel, Switzerland. This article is an open access article distributed under the terms and conditions of the Creative Commons Attribution (CC BY) license (https://creativecommons.org/licenses/by/4.0/).