Article

Multi-Energy Flow Optimal Dispatch of a Building Integrated Energy System Based on Thermal Comfort and Network Flexibility

by
Jian Sun
1,*,
Bingrui Sun
2,
Xiaolong Cai
2,
Dingqun Liu
2 and
Yongping Yang
1
1
State Key Laboratory of Alternate Electrical Power System with Renewable Energy Sources, Beijing 102206, China
2
School of Energy Power and Mechanical Engineering, North China Electric Power University, No. 2 Beinong Road, Beijing 102206, China
*
Author to whom correspondence should be addressed.
Energies 2025, 18(15), 4051; https://doi.org/10.3390/en18154051
Submission received: 11 June 2025 / Revised: 11 July 2025 / Accepted: 30 July 2025 / Published: 30 July 2025
(This article belongs to the Special Issue Energy Efficiency and Thermal Performance in Buildings)

Abstract

An efficient integrated energy system (IES) can enhance the potential of building energy conservation and carbon mitigation. However, imbalances between user-side demand and supply side output present formidable challenges to the operational dispatch of building energy systems. To mitigate heat rejection and improve dispatch optimization, an integrated building energy system incorporating waste heat recovery via an absorption heat pump based on the flow temperature model is adopted. A comprehensive analysis was conducted to investigate the correlation among heat pump operational strategies, thermal comfort, and the dynamic thermal storage capacity of piping network systems. The optimization calculations and comparative analyses were conducted across five cases on typical season days via the CPLEX solver with MATLAB R2018a. The simulation results indicate that the operational modes of absorption heat pump reduced the costs by 4.4–8.5%, while the absorption rate of waste heat increased from 37.02% to 51.46%. Additionally, the utilization ratio of battery and thermal storage units decreased by up to 69.82% at most after considering the pipeline thermal inertia and thermal comfort, thus increasing the system’s energy-saving ability and reducing the pressure of energy storage equipment, ultimately increasing the scheduling flexibility of the integrated building energy system.

1. Introduction

According to the projections of the International Energy Agency (IEA), global carbon emissions are set to peak by 2030, with the demand for fossil energy accounting for two-thirds of global energy consumption. The escalating demand for energy exerts substantial pressure on environmental sustainability and energy infrastructure, underscoring the imperative for expedited structural transformation of the energy system [1]. Within the energy sector, the building industry accounts for over one-third of global energy consumption and emissions, according to the IEA. The integration and advancement of integrated energy systems (IESs) in architectural applications have markedly optimized the energy profile of building operations [2]. As the complexity and significance of energy systems in the building sector increase, driven by the convergence of diverse energy sources and conversion technologies, these developments pose considerable challenges to system integration and development.
At present, plans for building a power system have been developed by many studies. Yu et al. [3] proposed an extensible multi-objective optimization framework to optimize building thermal energy and battery storage, and achieved a balance between economic feasibility and emission reduction. Rosales-Asensio et al. [4] evaluated and reduced the critical peak load and recovery capacity by optimizing the dispatching, heating, and cooling strategies in buildings with key microgrids, thus realizing the optimization of building microgrids. Lou et al. [5] established a distributed energy system for buildings and optimized the parameters of a hybrid microgrid in grid-connected operation mode and isolated operation mode. The results show that the optimal scheduling strategy reduces its maintenance cost by 14.3%.
The aforementioned studies [3,4,5], which investigate multiple grid flexibility services, are limited in scope. They primarily focus on the generation and storage resources within buildings, neglecting the diverse flexibility potential of other building loads, including heating and cooling systems. Building thermal comfort is a critical parameter that indicates the adaptability of building envelopes and HVAC systems to meet occupant thermal needs while optimizing energy efficiency. Developing robust methodologies for the assessment and enhancement of thermal comfort within building energy management systems is an essential approach for advancing sustainable building performance. An optimized thermal management strategy can mitigate reliance on active temperature regulation systems, thereby decreasing energy utilization, operational costs, and greenhouse gas emissions [6]. In order to promote the energy saving and thermal comfort of large public buildings, Qi et al. [7] developed an optimal scheduling method considering the demand response (DR) and thermal comfort of buildings, and verified the validity of the scheme. Tang and Wang [8] put forward a new model-based forecasting and dispatching strategy for a hybrid building energy system, which takes into account the comfort of residents with various flexible resources to maximize the economic benefits of the building's multi-service market. Feng et al. [9] proposed a two-stage conditional value at risk (CVaR) model to determine the optimal day-ahead scheduling of intelligent buildings with heating, ventilation, and air conditioning (HVAC) systems, considering temperature range and power fluctuation, and verified the effectiveness and economy in a building case study. Zhang et al. [10] proposed a day-ahead scheduling model considering thermal inertia and user comfort. Their results show that thermal inertia and thermal comfort are equivalent to increasing the energy storage capacity of the system, positively impacting large-scale renewable energy use. Tan et al. [11] proposed an improved indirect control strategy of predicted mean vote (PMV) based on an adaptive neuro-fuzzy inference system (ANFIS) for a solar heating system, improving the adjustment accuracy of the fuzzy controller by 17.65% and providing a solution for indoor environment control. However, the majority of the existing research predominantly employs indirect and coarse control of thermal comfort through ambient temperature measurements, relying solely on conventional PMV indices for assessment, and thereby lacking a more precise and comprehensive analysis of occupant thermal comfort within built environments.
The thermal characteristics of heating pipelines, collectively referred to as thermal inertia, are generally manifested in two aspects: pipeline thermal delay and heat loss. The pipeline network functions as a virtual thermal storage system, leveraging its dynamic response, particularly within the primary heating network. The current research on the thermal inertia of heating and cooling zones predominantly concentrates on formulating the characteristic equations of the chilled and hot water pipe networks and solving them within the IES framework. Li and Wang [12] proposed an IES model based on the demand response mechanism and the multi-time scale optimal scheduling method, considering the role of pipeline thermal inertia in resisting supply/demand uncertainty, which increased IES scheduling flexibility. Yi and Li [13] put forward an improved cogeneration dispatching strategy based on the heat storage/release characteristics of heating networks and the thermal inertia of heating areas, enhancing system economy and wind absorption/abandonment ability. Li et al. [14] studied the energy transmission mechanism and dynamic response characteristics of cold and hot pipe networks, and realized the collaborative optimization of the supply, transmission, and demand sides. However, none of these investigations individually examined the impact of thermal inertia on system output and the overall performance of ancillary equipment, thereby failing to elucidate the specific benefits conferred by this thermal characteristic.
Heat pumps, devices that extract thermal energy from a source and transfer it to a designated location, are increasingly recognized as a critical technology for the decarbonization of thermal energy systems. Their high coefficient of performance and low operational maintenance costs facilitate a rapid return on investment and confer substantial long-term benefits over their extended operational lifespan. From the perspective of distribution network planning, heat pumps can function as flexible assets, modulating both electrical load and thermal demand [15]. Zhang et al. [16] proposed a new reliability evaluation method for a heat pump combined heating system. The results indicate that heat pump location, capacity, performance coefficient, and distribution network security constraints significantly affect reliability indices. Zhang et al. [17] constructed an IES model with GSHP and solved the scheduling optimization problem of IES on typical seasonal days. Wu et al. [18] proposed a new IES-ORC system, which connected the absorption heat pump and ORC in parallel, and highlighted the advantages of the system. However, the thermodynamic control of power and temperature regulation in heat pump systems is not addressed in the existing research, with the heat pump being modeled solely based on the efficiency–-input energy relationship. This approach neglects the operational temperature requirements inherent in its applications.
This study proposes a building IES utilizing a waste heat absorption heat pump (WAHP) for building heating and cooling applications. It integrates comprehensive assessments of occupant thermal comfort and pipeline thermal inertia to optimize building energy efficiency. The novel contributions of this study are as follows: (1) the development of an absorption heat pump process and a power–temperature–flow model to optimize waste heat recovery and dynamically control device temperature as well as flow rates, considering the multi-energy integration framework and operational standards for building thermal comfort in cooling and heating scenarios; (2) a comprehensive analysis of the heat pump’s operational characteristics and influencing factors across various seasonal modes; (3) the integration of thermal comfort constraints (modeled using the Gagge two-node model) and pipeline thermal inertia effects on overall system performance.
Building on the outlined research objectives and novel contributions, the subsequent sections of this manuscript are structured to systematically elaborate on the methodology, analysis, and findings. Specifically, Section 2 delineates the mathematical formulations of the components within the IES; Section 3 develops the optimization scheduling framework for the IES; Section 4 provides a comparative analysis of five case studies across three representative seasonal periods; and finally, Section 5 summarizes the conclusions of this study.

2. Mathematical Modeling of IES

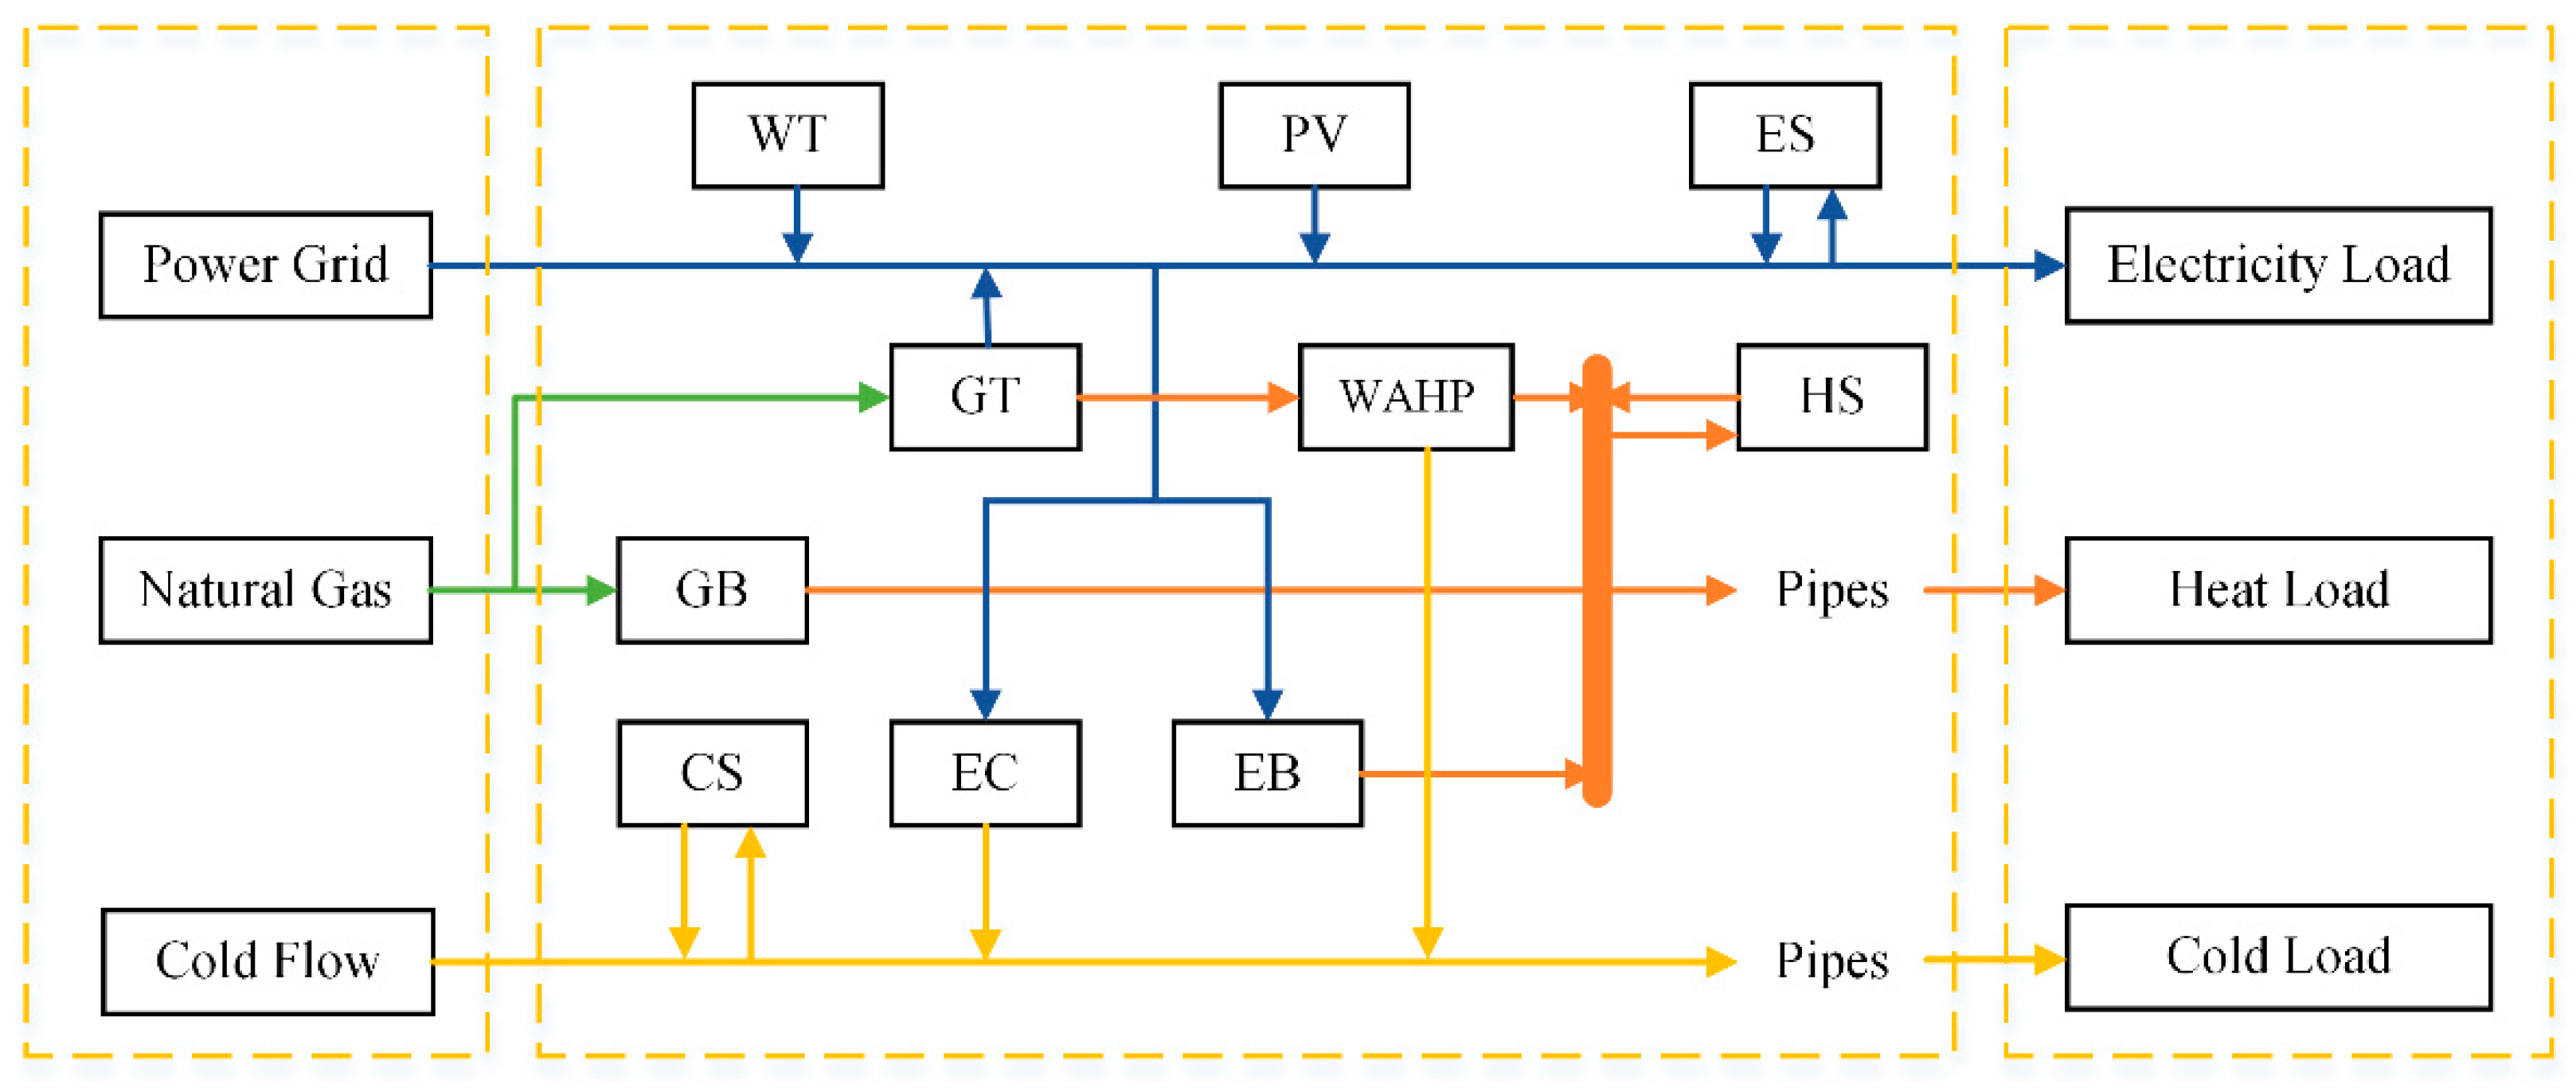
2.1. IES Description
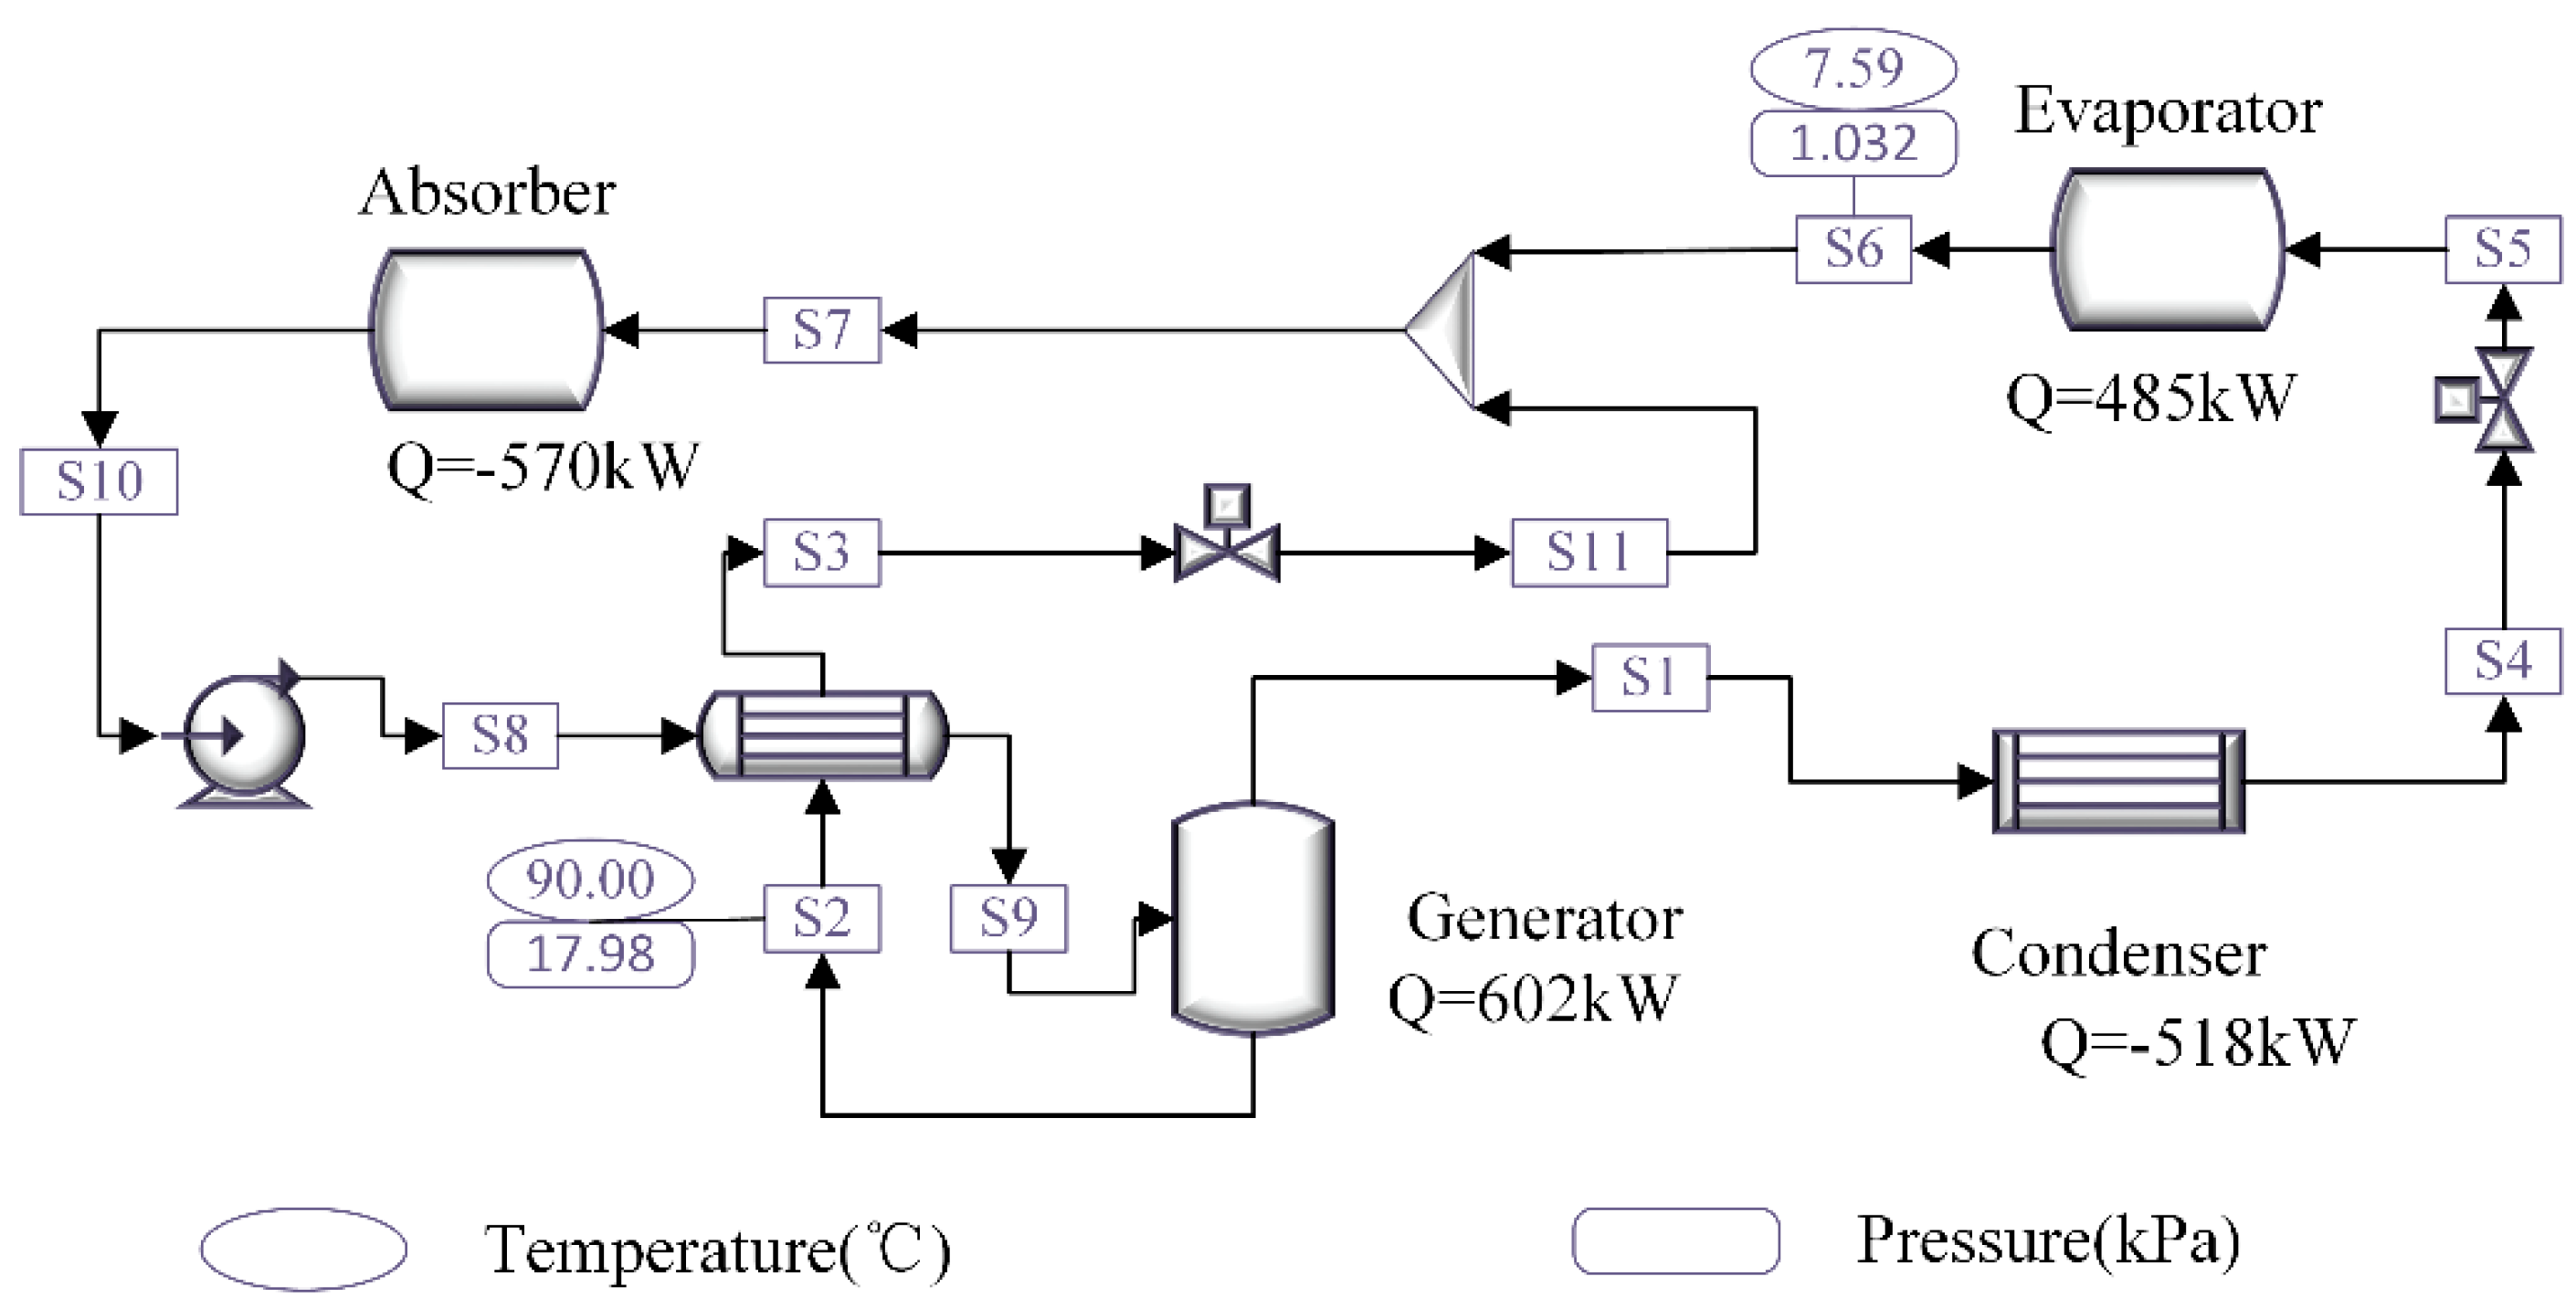
To optimize the efficiency of diverse equipment coupling, this study proposes an IES for the centralized coupling of cooling, heating, and electricity. The structure of IES and the schematic diagram of multi-energy flow are shown in Figure 1, which intuitively provides the multi-energy conversion relationship between devices. The IES is mainly composed of photovoltaic (PV), wind turbine (WT), gas turbine (GT), electric chiller (EC), waste heat absorption heat pump (WAHP), gas boiler (GB), electric boiler (EB), and electricity/heat/cold storage (ES, HS, CS) to meet the building energy consumption.
Electricity is primarily generated by the GT, PV, WT, and power grid; heat can be supplied by the HS, GB, EB, and WAHP; while cooling is shared by the CS, EC, and WAHP. The WAHP is connected in series with the gas turbine, which absorbs the waste heat of the flue gas and provides heat and cold for the building at the same time. In addition, the system considers three kinds of energy storage systems to promote the substantial consumption of renewable energy and exhaust heat. Only the modeling of key parts is listed below, and the rest of the models refer to [12].

2.2. WAHP Model

2.2.1. Mixed Operation Mode

In an IES, electric heat pumps are commonly employed for waste heat recovery, yet their cooling capabilities are infrequently utilized. Given the seasonal variability in the COP of electric heat pumps, optimizing waste heat utilization and meeting building demands across different seasons presents a challenge. Conversely, absorption heat pumps demonstrate greater suitability for year-round building energy supply due to their negligible seasonal COP fluctuations. Therefore, a waste heat absorption heat pump process is presented in this paper as a replacement for electric heat pumps.
This study employs a first kind of absorption heat pump, leveraging a minimal high-temperature heat source to generate medium temperature thermal energy. LiBr-H2O serves as the working fluid. The thermodynamic process and component-level parameters (heat transfer coefficients and pressure drops) of the absorption heat pump were modeled in Aspen Plus, adhering to the building heating and cooling temperature specifications outlined in the HVAC manual. In this software, we designed and simulated the relevant parameters of the WAHP in the system (COP and refrigerant parameters), and applied the specific parameters to the building system. As illustrated in Figure 2, the evaporator facilitates heat exchange with the building’s chilled return water, producing 8 °C chilled water for building cooling. The absorber and condenser interact with the heating return water, with the resultant fluids subsequently combined and distributed to the building for heating purposes.
The C O P of the heat pump is defined as follows:
C O P H = Q A d + Q C d Q D d
C O P C = Q E d Q D d
where Q A d is the heat designed for absorption; Q C d is the heat designed for the condenser; Q D d is the drive heat; Q E d is the heat designed for the evaporator; C O P H is the heating efficiency of WAHP; C O P C is the cooling efficiency of WAHP.
The heat involved in heating and cooling is defined as follows:
H W A H P ( t ) = C O P H Q R ( t )
C W A H P ( t ) = C O P C Q R ( t )
where Q R ( t ) is the drive heat of WAHP in the system; H W A H P ( t ) is the heat produced by WAHP for heating; C W A H P ( t ) is the heat produced by WAHP for cooling.
The flow rate and temperature of output hot water and cold water are defined as follows:
C W A H P ( t ) = c p m c ( t ) ( T i n ( t ) T o u t ( t ) )
H W A H P ( t ) = c p m h ( t ) ( T i n ( t ) T o u t ( t ) )
where T i n ( t ) is the backwater temperature; T o u t ( t ) is the water supply temperature; m c ( t ) is the water mass flow rate; c p is the specific heat capacity.

2.2.2. Heating Mode

Given the high efficiency of the heat pump, the operational characteristics of the alternative single-mode systems are maintained to facilitate a direct comparison of their respective energy-saving capabilities. The evaporator’s heat exchange component is modulated while maintaining the fundamental parameters of the pure heating absorption heat pump process. In heating mode, the waste heat fluid undergoes heat exchange with the generator and subsequently with the evaporator, thereby ensuring cyclical operation. The flue gas waste heat is then recovered from the gas turbine via the heat exchange, waste-heated fluid.
The heat involved in heating is calculated as follows:
H W A H P ( t ) = C O P Q R ( t )
The flow rate and temperature of the hot water output are calculated as follows.
H W A H P ( t ) = c p m h ( t ) ( T i n ( t ) T o u t ( t ) )

2.2.3. Cooling Mode

In refrigeration mode, the heat pump’s operational parameters are modulated on the absorber and condenser sides, maintaining the fundamental system characteristics analogous to the heating mode. The working fluid, having undergone thermal exchange within the absorber and condenser, is subsequently routed to the cooling tower for temperature reduction along with the waste heat transfer fluid, thereby facilitating cyclical heat transfer processes.
The heat involved in heating and cooling is as follows:
C W A H P ( t ) = C O P Q R ( t )
The flow rate and temperature of the output cold water are calculated by Equation (10) as follows:
C W A H P ( t ) = c p m c ( t ) ( T i n ( t ) T o u t ( t ) )

2.3. Energy Storage System Model

The ES system is employed to sequester excess power, thereby facilitating peak shaving and enhancing system stability. The operational paradigm of the ES is delineated as follows [19]:
P e t = 1 μ e P e t 1 + η c h a r e P c h a r e P d i s e η d i s e
where μ e is the self-discharge rate of the electricity storage device; P e t 1 is the electricity storage energy in the (t − 1) period; P c h a r e , P d i s e is the charge and discharge power of the electricity storage device; η c h a r e , η d i s e is the charge and discharge efficiency of the electricity storage device.
The HS and CS models are adopted, where the heat storage H h t and cold storage degree C c t are defined as follows [19]:
H h t = 1 μ h H h t 1 + η c h a r h H c h a r h H d i s h η d i s h
C c t = 1 μ c C c t 1 + η c h a r c C c h a r c C d i s c η d i s c
where μ h is the heat storage loss rate; H h t 1 is the heat storage energy in the (t − 1) period; H c h a r h , H d i s h is the input and output heat power of the heat storage device; η c h a r h , η d i s h is the input and output conversion efficiency of the heat storage device; μ c is the cold storage loss rate; C c t 1 is the cold storage energy in the (t − 1) period; C c h a r c , C d i s c is the input and output cold power of the cold storage device; η c h a r c , η d i s c is the input and output conversion efficiency of the cold storage device.

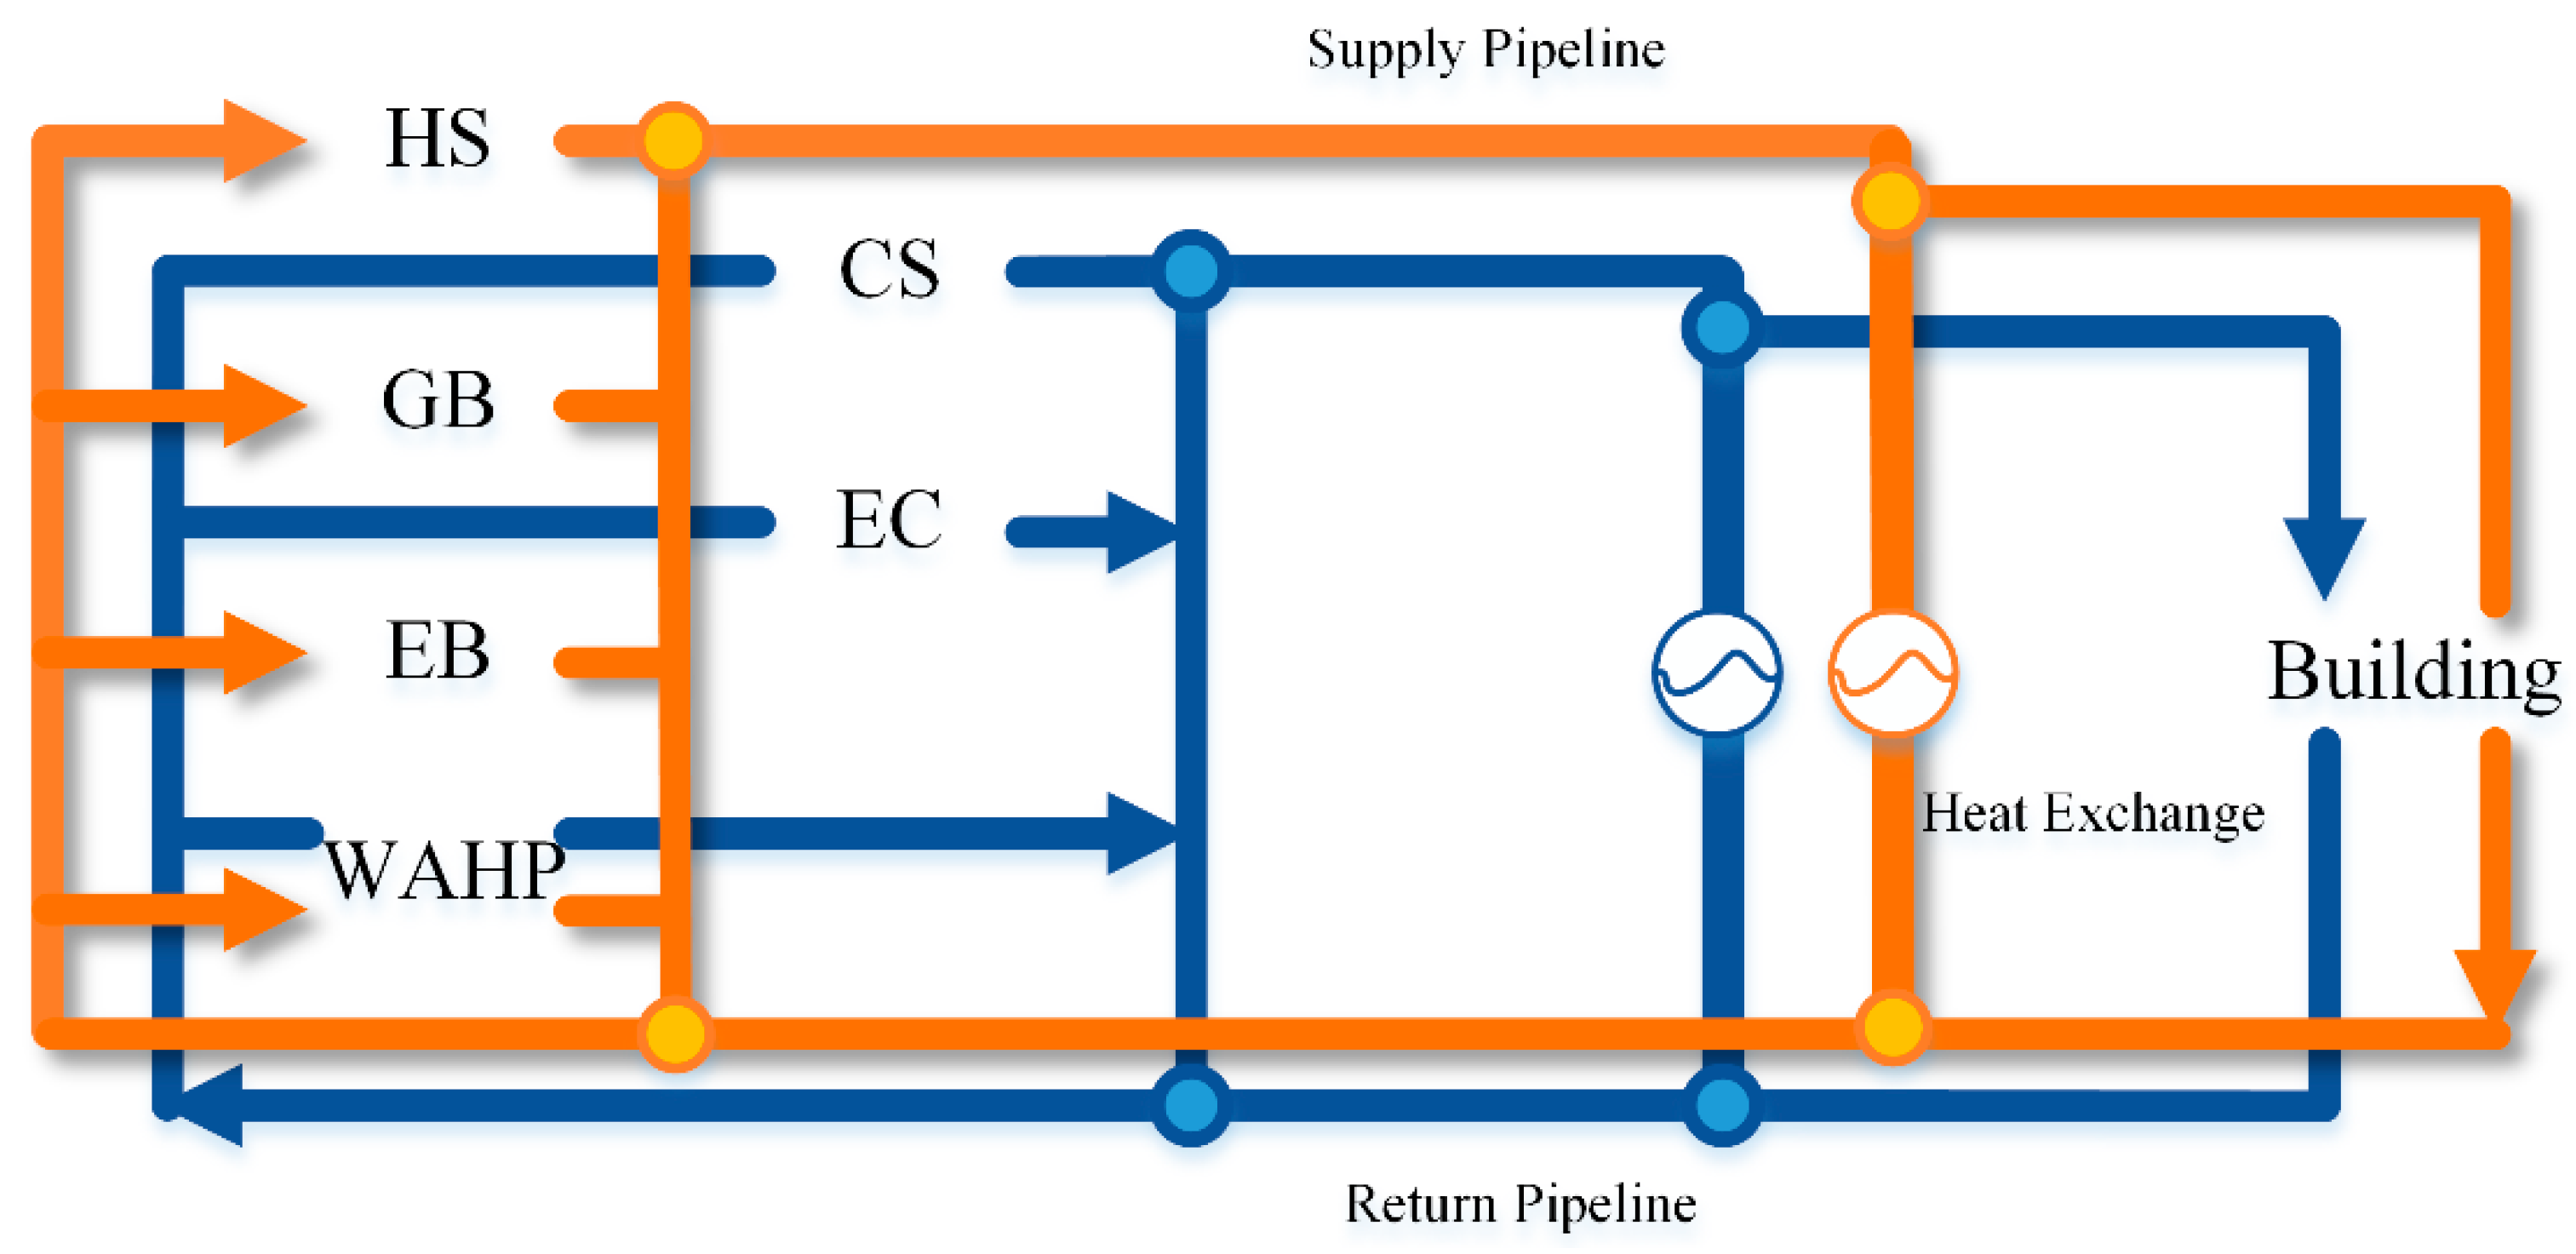
2.4. Temperature-Flow Model

This study develops an energy consumption model for cooling and heating equipment, establishing the correlation between energy consumption and controllable parameters to accurately represent the key factors influencing equipment performance. A variable flow measurement is implemented at the equipment level, with constant flow adjustment at the building level. The heat exchange process for heating and cooling in each piece of equipment is illustrated in Figure 3. The model correlating equipment output power with heating, cooling temperatures, and flow rates is crucial, enabling the final temperature of mixed hot and cold fluids to be adjusted via tributary flow rate regulation, thereby controlling building cooling and heating temperatures. The main formula is as follows:
Q P R O ( t ) = c p m ( t ) ( T o u t ( t ) T i n ( t ) )
where Q P R O ( t ) is the heat produced by devices in the system.
The fluid mixing temperature is calculated, neglecting heat losses and environmental thermal exchange, as follows:
T M I X ( t ) = i = 1 n m i ( t ) T i ( t ) i = ` n m i ( t )
where T M I X ( t ) is the temperature of the fluid after mixing; m i ( t ) is the water mass flow rate; T i ( t ) is the water temperature.

2.5. Building Thermal Comfort and Inertia of Pipeline

2.5.1. Thermal Comfort

At present, the PMV index proposed by Fanger in 1970 is widely used to evaluate the building thermal comfort of IES. The values of PMV range from −3 to +3, representing the feeling degree of temperature from very cold to very hot, and the optimal thermal comfort is achieved when the value is 0. Conversely, the two-node model is applicable for predicting physiological responses under transient conditions, rendering it more suitable for IES that exhibit continuous self-regulation according to the ASHRAE handbook. The lumped parameter model conceptualizes the human body as a series of concentric thermal compartments, representing the skin and core ( t s k , t c r ), with the energy balance described across these two components [20].
M + M s h i v = W + q r e s + ( K + S k B F c c p , b l ) ( t c r t s k ) + m c r c c r d t c r d θ ( K + S k B F c p , b l ) ( t c r t s k ) = q d r y + q e v a p + m s k c s k d t s k d θ
The parameters within the equations, as detailed in the parameter table, represent the determinants of human thermal comfort within a built environment. These factors collectively influence the overall thermal sensation experienced by occupants. Given the system’s temporal resolution of 1 h, the governing partial differential equations were ultimately solved using a discretization method.
The model uses an empirical formula to predict thermal sensation (TSENS). This index is based on 11-point numerical scales, and it is based on the same scale as PMV, but with extra terms for ±4 (very hot/cold) and ±5 (intolerably hot/cold), as shown in Table 1. The empirical formula for calculation, in which the TSENS index is ultimately computed through the solution of human body temperature, is as follows [20]:
TSENS = 0.4685 ( t b t b , c ) t b < t b , c 4.7 η e v ( t b t b , c ) / ( t b , h t b , c ) t b , c t b t b , h 4.7 η e v + 0.4685 ( t b t b , h ) t b , h < t b
where t b represents the average human body temperature, defined as the weighted average of the temperatures of two parts of the human body ( t s k , t c r ). t b , c and t b , h are the “set points” of the average human body temperature. The calculation is as follows:
t b , c = 0.194 58.15 ( M W ) + 36.301 t b , h = 0.347 58.15 ( M W ) + 36.669

2.5.2. Thermal Inertia

According to the thermal characteristics of heating pipes, thermal inertia can be divided into thermal delay and thermal loss. The total time delay of pipeline T D , which is related to mass flow, can be expressed as follows [12]:
T D ( t ) = c p ρ L U A m ( t )
where U is the heat transfer coefficient of the pipeline; A is the heat transfer area of the pipeline; ρ and L are the water density and pipe length.
The heat loss of the pipes can be described as follows [13]:
T l o s s ( t ) = k l o s s ( T i n ( t ) T e x t ( t ) )
k l o s s = 1 e λ L C w q λ L C w q
T e ( t ) = T i n ( t T d ( t ) ) T l o s s ( t )
where k l o s s is the heat loss coefficient; T i n ( t ) , T e x t ( t ) , and T e ( t ) are the pipe head end temperature, external ambient temperature, and pipe end temperature, respectively; λ is the heat conduction coefficient 1.5.

3. Optimal Scheduling Modeling of IES

3.1. Constraints

3.1.1. Energy Balance Constraints

The electricity balance is expressed as follows:
P P V ( t ) + P W T ( t ) + P G T ( t ) + P d i s e ( t ) + P b u y ( t ) = P l o a d ( t ) + P c h a r e + P E C ( t ) + P E B ( t )
The heat balance is expressed as follows:
H W A H P ( t ) + H G B ( t ) + H E B ( t ) + H d i s h ( t ) = H l o a d ( t ) + H c h a r h ( t )
The cold balance is expressed as follows:
C W A H P ( t ) + C E C ( t ) + C d i s c ( t ) = C l o a d ( t ) + C c h a r c ( t )

3.1.2. Device Operation Constraints

The constraints on ES, HS, and CS are expressed as follows:
Capacity constraint:
0 C inv ES C max , ES
0 C inv HS C max , H S
0 C inv CS C max , C S
SOC constraint:
S O C ES , min S O C t ES S O C ES , max S O C HS , min S O C t HS S O C HS , max S O C CS , min S O C t CS S O C CS , max
Charge and discharge limit:
0 P t E S , c h a β t E S , c h a P c h a , d i s E S 0 P t E S , d i s β t E S , d i s P c h a , d i s E S
0 P t H S , c h a β t H S , c h a P c h a , d i s H S 0 P t H S , d i s β t H S , d i s P c h a , d i s H S
0 P t C S , c h a β t C S , c h a P c h a , d i s C S 0 P t C S , d i s β t C S , d i s P c h a , d i s C S
Charge and discharge state constraint:
β t E S , c h a + β t E S , d i s 1 β t H S , c h a + β t H S , d i s 1 β t C S , c h a + β t C S , d i s 1
The electricity purchased from the grid is defined as follows:
p min , grid P t grid p max , grid
The constraints on water supply flow of devices are expressed as follows:
0 m E C m max ,   c 0 m C S m max ,   c 0 m W A H P m max ,   c 0 m G B m max ,   h 0 m E B m max ,   h 0 m H S m max ,   h i = 1 n m c , i m max ,   c i = 1 n m h , i m max ,   h

3.2. Objective Function

The economic cost of the system consists of energy purchase cost and operation and maintenance cost. The modeling of costs is performed as follows:
min F 2 = t ( P b u y c o s t e l e + G g a s c o s t g a s + i = 1 n x P o u t , i c o s t i )

3.3. Optimization Algorithm

The IES scheduling model comprises a canonical nonlinear optimization problem, which is addressed using the mixed-integer linear programming (MILP) methodology. For the optimization part of the integrated energy system, including the construction of objective functions (minimizing energy consumption) and the handling of constraints (thermal comfort limits and equipment operation constraints), MATLAB is implemented and its optimization toolbox is used to solve the MILP problem. Specifically, to enhance computational efficiency, the problem is reformulated as a convex optimization model and solved by a CPLEX commercial solver within a MATLAB environment.
The solution methodology for parameter transfer is illustrated in Figure 4. The proposed methodology is as follows: initially, the preliminary flow rates and fluid temperatures for each component are determined via the primary model. Subsequently, these parameters are incorporated into the thermal comfort model, and the partial differential equation is resolved using the discretization method to ascertain the TSENS value. Feedback, which is contingent upon the TSENS constraint, is then relayed to the initial flow rate and temperature calculations, thereby ensuring the solution’s adherence to the specified criteria.

4. Results and Discussion

The discussion of the results is presented in Section 4. Specifically, Section 4.1 presents the input settings of the integrated energy system. Section 4.2 compares five cases with various operating conditions on three typical days. In particular, the factors affecting waste heat absorption are discussed in detail.

4.1. Basic Parameter Settings of the IES Model

A simulation calculation is conducted on representative days, using typical residential buildings in Beijing as a case study. The primary load profiles for three representative seasonal days of a simplified residential building model were obtained using DeST (20230713) software, as illustrated in Figure 5. Table 2 details the capacity and operational costs of the system components, which are critical parameters influencing system optimization strategies. The fundamental specifications of the equipment employed across the three scenarios are outlined in Section 2.2.2.
To demonstrate the impact of three operation modes of WAHP, thermal comfort, and thermal inertia of buildings, this study establishes five simulation scenarios as detailed in Table 3. Cases 1, 2, and 3 employ the standard IES basic model, excluding additional thermal comfort and inertia parameters. Case 4 incorporates thermal comfort criteria into the baseline case, while Case 5 further integrates thermal inertia considerations into Case 4.

4.2. Comparisons of Case Study

The financial implications of the five scenarios are presented in Table 4, illustrating the cost variation patterns under typical operational conditions. The data indicate that the system’s economic expenditure for Case 1 is lower than for Cases 2 and 3 across three representative seasonal periods, demonstrating the energy efficiency and operational flexibility of the WAHP in simultaneous cooling and heating modes. This is evident by the observed reduction in economic costs. Meanwhile, variable flow regulation offers enhanced flexibility for energy conservation and thermal management within the system, obviating the need for significant adjustments to the equipment output to maintain indoor temperature stability. This approach enhances the system stability and mitigates the risk of energy supply equipment failure. As detailed in Table 4, the operational costs of Case 1 are reduced by 4.4% to 8.5% compared to Cases 2 and 3 across three seasonal periods, indicating that WAHP technology effectively decreases electricity and natural gas consumption. In comparison to the study by Yang et al. [21], the utilization of waste heat from P2A improves the operational benefits of the P2A system, reducing operational costs by 3.86%, which is lower than the 4.4–8.5% cost reduction observed in this study. Therefore, WAHP demonstrates an advantage in the multi-level energy utilization of IES.
It is evident that the economic expenditure during the transitional season is markedly reduced compared to the standard daily operational costs in winter and summer. This discrepancy arises from the absence of extreme thermal demand in the transitional period, whereas substantial heating and cooling loads are required during winter and summer, respectively. It is also noticeable that the typical daily operational expenditure during summer is substantially lower than the energy procurement costs incurred in winter. Analyzing the performance data of the respective HVAC systems reveals that the increased output of gas boilers in winter significantly elevates fuel consumption, thereby contributing to a marked rise in overall economic costs during the winter season. This effect diminishes the comparative advantages of WAHP systems in heating applications, a point that will be elaborated upon through a detailed analysis of daily data across representative seasonal periods. The economic expenditure associated with Case 4 marginally exceeds that of Case 1 by 0.65% at most, attributable to the integration of thermal comfort parameters, which augment the requirements for indoor temperature regulation. This results in continuous adjustments aimed at maintaining human thermal comfort beyond basic heating and cooling setpoints, thereby increasing operational costs. The data indicate that the economic costs for Case 5 are comparable to those of Case 4, with a slight reduction being observed during the summer months.
The electricity balance in summer (July), winter (January), and transition season (October) demonstrates consistent patterns in terms of energy source composition, with variations primarily driven by seasonal renewable energy generation and load demands. As illustrated in Figure 6, the electricity supply in all seasons is primarily derived from GT, PV, and WT, with grid imports compensating for deficits during peak demand periods. The electrical load distribution during a typical summer month (July) is depicted in Figure 6a. Consistent with prior findings, PV, WT, and GT constitute the primary generation sources, while any deficit in electricity demand is offset by grid imports. Figure 6b depicts the energy balance on a typical day of the transition season (October). The power supply from GT, PV, and WT in the IES is prioritized to meet user load demand. The building operation schedule spans from 00:00 to 24:00, with a portion of the power demand supplemented by electricity procured from the power grid. The power load profile for the typical winter month (January) is shown in Figure 6c, indicating that the dynamics of electricity demand and energy generation during winter are analogous to those observed in the transitional seasons.
As illustrated in Figure 7a, a substantial portion of the waste heat rejected by the gas turbine is recuperated via the WAHP. During this process, the thermal load is predominantly supplied by the WAHP, with any deficit in heat demand supplemented by the GB and HS. Due to the disparity between heating and cooling requirements, the heat produced by the WAHP was not entirely absorbed at 21:00, despite satisfying the cooling load. The cooling demand is primarily met by the WAHP and EC, as depicted in Figure 7b, with any additional cooling requirements supplemented by the CS.
Based on the thermal and heat transfer diagram during the transitional season, a comparison of the cooling load distribution between Case 1 and Case 3, as depicted in Figure 7b,d, reveals that both configurations achieve a 100% coefficient of performance for the WAHP. However, notable discrepancies are observed in the equipment output at various temporal points, indicating differences in system efficiency and operational dynamics. The total output of WAHP in the Case 1 refrigeration scheme reached 53.81%, and that of WAHP in Case 3 reached 23.70%. It can be seen from the comparison diagram that the total output of WAHP in Case 3 is 50.75% of that in Case 1, demonstrating a substantial reduction relative to Case 1. Additionally, as depicted in Figure 7a,c, there are notable variations in the thermal output of the WAHP between the two cases. Specifically, the total output of WAHP accounts for 89.01% in the heat balance of Case 1 and 86.05% in Case 2. During the transitional season, the thermal load for heating and cooling is relatively balanced, resulting in improved energy efficiency of the WAHP system compared to summer and winter periods. However, there remains residual energy consumption at 21:00 in the Case 1 heating scenario, indicating potential for further optimization.
As shown in Figure 8a,b, the WAHP system accounts for a significant portion of the cooling demand, with the residual cooling load supplied by the CS. Due to minimal cooling requirements during winter, the IES does not necessitate the activation of supplementary refrigeration units. Nevertheless, a coupling characteristic exists between WAHP’s thermal and cooling generation, prioritizing heat supply during the periods of 00:00 to 08:00 and 18:00 to 24:00, while maintaining a proportional cold energy output. Consequently, some of the cold energy produced by the IES remains unabsorbed during winter, resulting in energy wastage. This scenario indicates significant potential for energy conservation within the system.
The variation in WAHP performance during typical winter conditions predominantly manifests on the cooling side. Analyzing the chilled water balance in Cases 1 and 3, as depicted in Figure 8 b,d, reveals that the WAHP output in Case 1 reaches 87.87%, whereas in Case 3 it is 46.09%, indicating a substantial reduction. Similarly, examining the thermal energy balance in Figure 8a,c demonstrates that the system’s heat input is primarily supplied by the gas boiler and WAHP, with complete absorption by the system. Under these conditions, Cases 1 and 2 exhibit comparable energy output distributions.
As illustrated in Figure 9b, the cooling load is primarily satisfied by EC and WAHP, with the EC output constituting the dominant contribution. Both Case 1 and Case 3 systems fully utilize the cold supply from the WAHP to meet the building’s cooling requirements. The thermal demand is predominantly supplied by the WAHP, as depicted in Figure 9a. A comparative analysis of the summer heat balance for Case 1 and Case 2, as shown in Figure 9a,c, indicates that due to the significantly higher cooling demand relative to heating demand during summer, and the proportional coupling between WAHP thermal output and cooling production, the system’s heat supply surpasses the thermal load while satisfying cooling needs. This behavior mirrors the winter operation, where some heat generated by the IES remains unabsorbed during summer. Similarly, when comparing the cold energy output depicted in Figure 9b,d, it is evident that the primary sources are EC and WAHP, which are entirely integrated within the system. Under these conditions, Case 1 and Case 3 exhibit comparable distribution shares of cold energy output.
By evaluating the thermal performance of the WAHP system across three seasons, it is evident that the system’s energy conservation potential is significantly constrained due to inadequate heating load utilization, stemming from the numerical imbalance between thermal demand and cooling demand. The integration of thermal energy storage systems is extensively examined owing to their capacity to modulate energy consumption and influence waste heat utilization efficiency. Key factors include the SOC limitations of the energy storage units. Consequently, this study comprehensively investigates the impact of energy storage device capacity and SOC constraints on the energy efficiency of the WAHP system, aiming to identify strategies to enhance waste heat recovery and overall system energy performance.

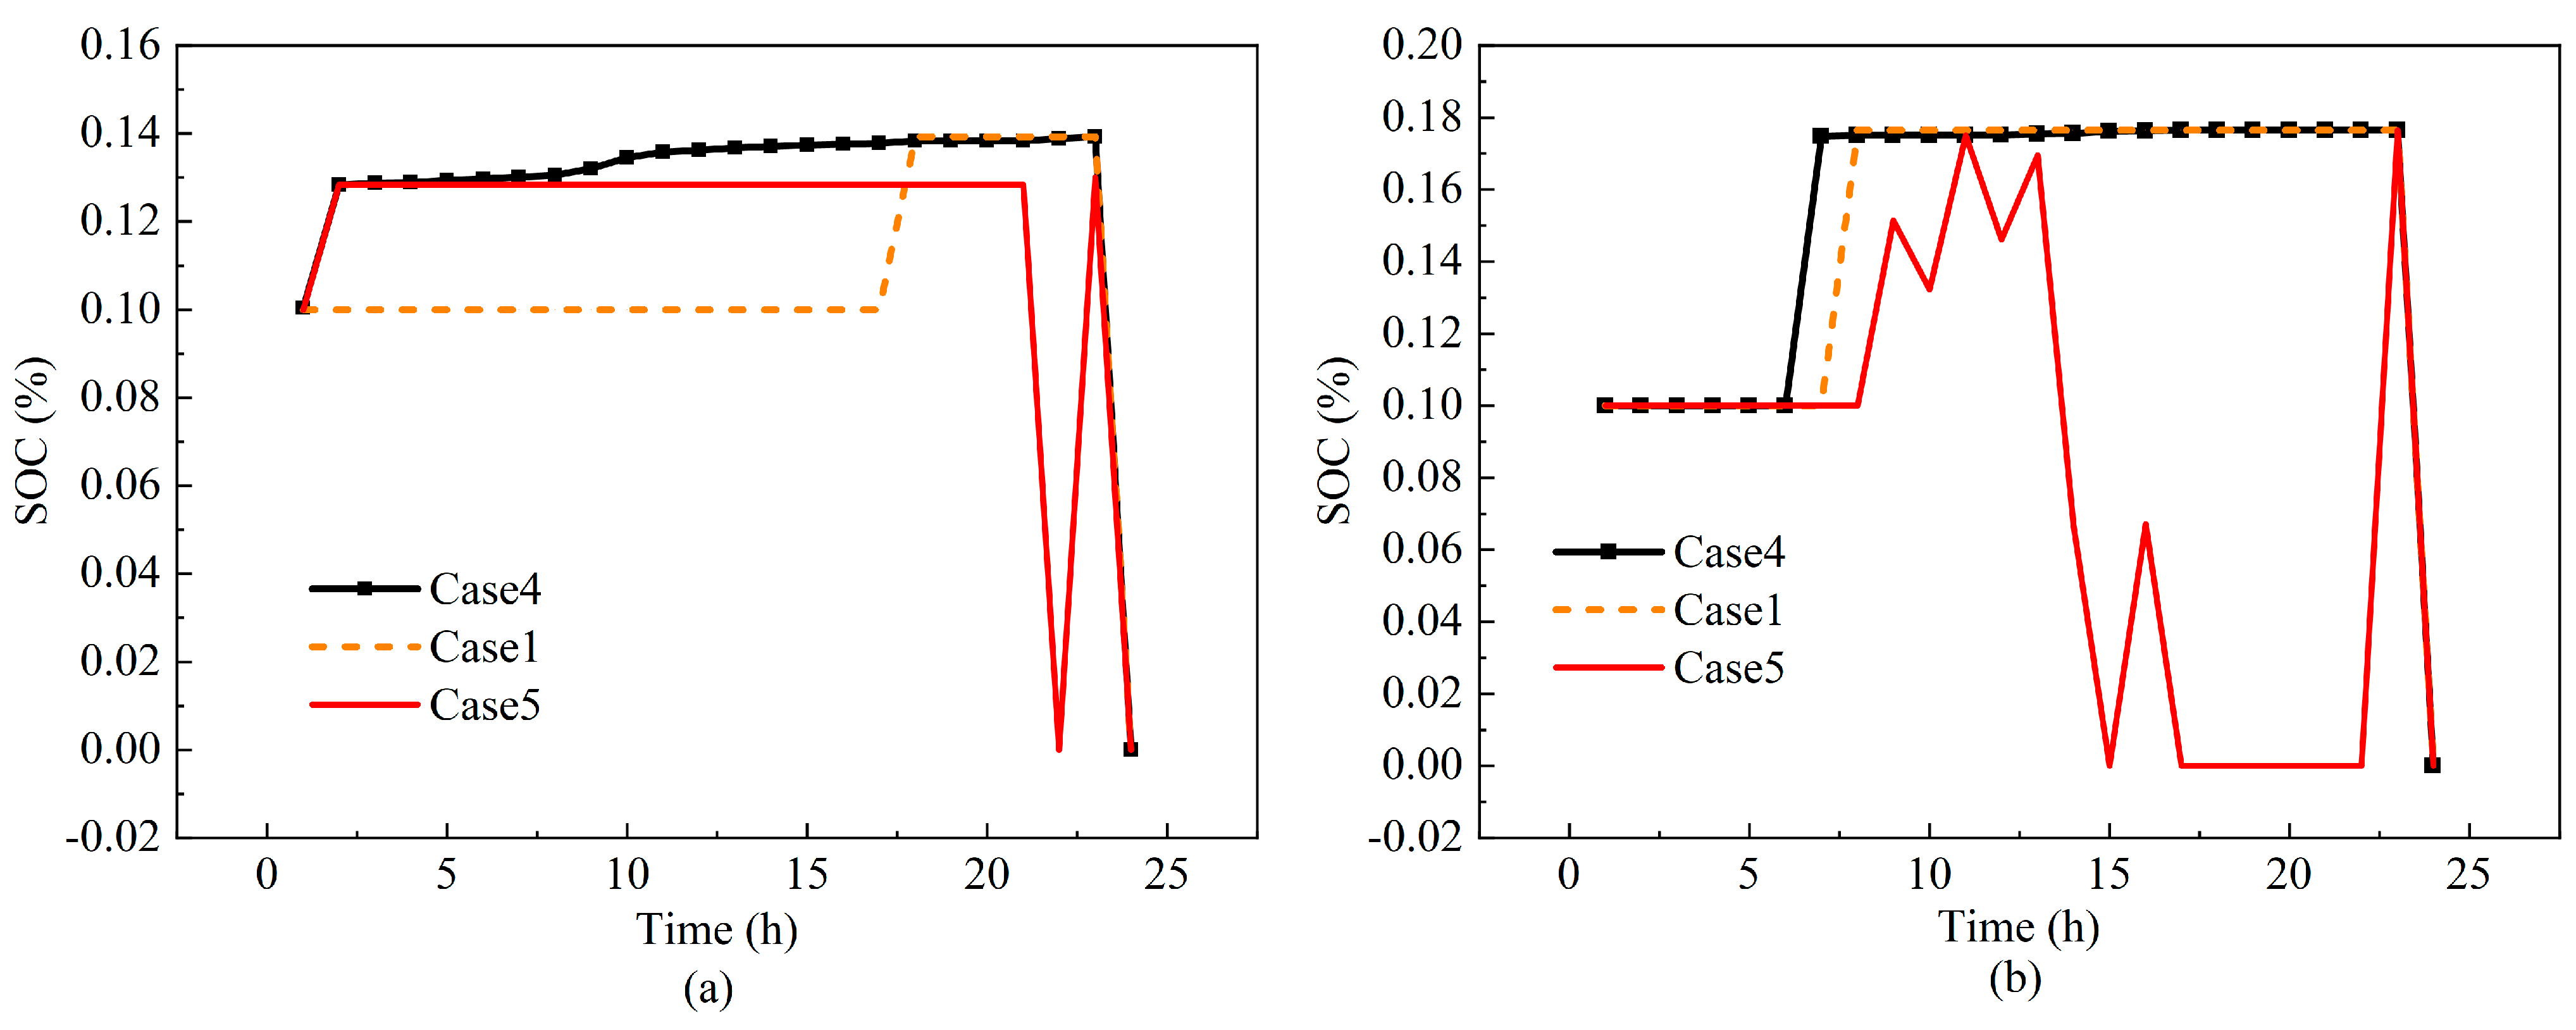
4.2.1. Energy Storage System Analysis

Given the analogous patterns of thermal imbalance during summer and winter, along with the opposing thermodynamic principles governing WAHP’s cooling and heating functions, this study exclusively examines the impact of thermal energy storage capacity and the heat operating constraint (HOC) of thermal storage systems on the energy supply and demand performance of WAHP systems during typical summer conditions. Figure 10a illustrates that the economic expenditure exhibits an inverse relationship with the thermal storage capacity; specifically, an increase in heat storage capacity results in a reduction in the system’s operational costs, reaching an optimal point at a certain capacity threshold. Holding the thermal storage capacity constant, variations in the HOC demonstrate a negative correlation with operational costs, indicating that augmenting the HOC effectively diminishes the system’s operational expenditure. From Figure 10b, it is evident that the system’s carbon emissions and economic costs exhibit a correlated trend; specifically, increasing the HS capacity and the HOC results in reduced carbon emissions and enhanced energy efficiency. Additionally, the WAHP-P utilization curve in Figure 10 indicates that larger HS capacities correspond to higher utilization rates until reaching an optimal point of 51.46%. When HS capacity remains constant, augmenting HOC contributes to an increase in WAHP-P utilization, demonstrating a positive correlation. Han et al. [22] achieved an energy-saving rate of 26.68% under heating conditions utilizing a combined energy system based on an organic Rankine cycle and a Stirling engine in series. This performance is inferior to the 28.62% energy-saving rate achieved by the WAHP in winter heating across two operational modes following optimization, thus underscoring the energy-saving potential of WAHP within the IES.
In summer, the WAHP reduces electricity consumption compared to traditional electric chillers by utilizing waste heat from GT; in winter, its synergistic operation with building heating networks lowers system procurement costs. This “multi-functional” capability makes it suitable for diverse building types, including commercial complexes and industrial parks, aligning with the diversified load demands of modern IES. But the thermal energy consumption of WAHP cannot achieve full capacity utilization at this time, as summer heating loads are significantly lower than cooling loads. This phenomenon may be attributed to capacity adjustments of the HS, which, constrained by thermal and cold balance requirements, induce variations in the operational outputs of other system components. Specifically, modifications in the GT’s power output, serving as a waste heat source for both heating and cooling processes, alter the thermal and electrical outputs across the system’s subsystems, thereby impacting overall energy distribution and efficiency. Therefore, parameter optimization of energy storage systems influences the overall system coordination and operational efficiency, thereby reducing operational costs while enhancing the energy utilization efficiency of WAHP. Consequently, the capacity and operational constraints of energy storage devices significantly impact the system’s energy-saving and emission reduction potential.
In summary, the series integration of the WAHP with gas turbines enables direct capture of high-temperature flue gas waste heat, thereby minimizing energy losses associated with conventional indirect recovery methodologies. The waste heat recovery efficiency of 51.46% positions the WAHP as a viable technology for building-scale waste heat utilization, directly supporting IES decarbonization objectives by decreasing reliance on fossil fuel-based heating and cooling. The achieved cost reduction of 4.4–8.5% is realized without compromising system stability. The WAHP’s operational stability is maintained through dynamic adjustments to flow rate and temperature parameters. This operational flexibility allows the WAHP to function as a “flexible regulation unit” within IES, mitigating grid peak-valley impacts and enhancing overall system resilience. Furthermore, the WAHP demonstrates potential for integration with distributed photovoltaic (PV) systems and energy storage within microgrids, with its waste heat recovery and comfort control functionalities amenable to integration into community energy management systems (EMS) to optimize “source-grid-load-storage” coordination.

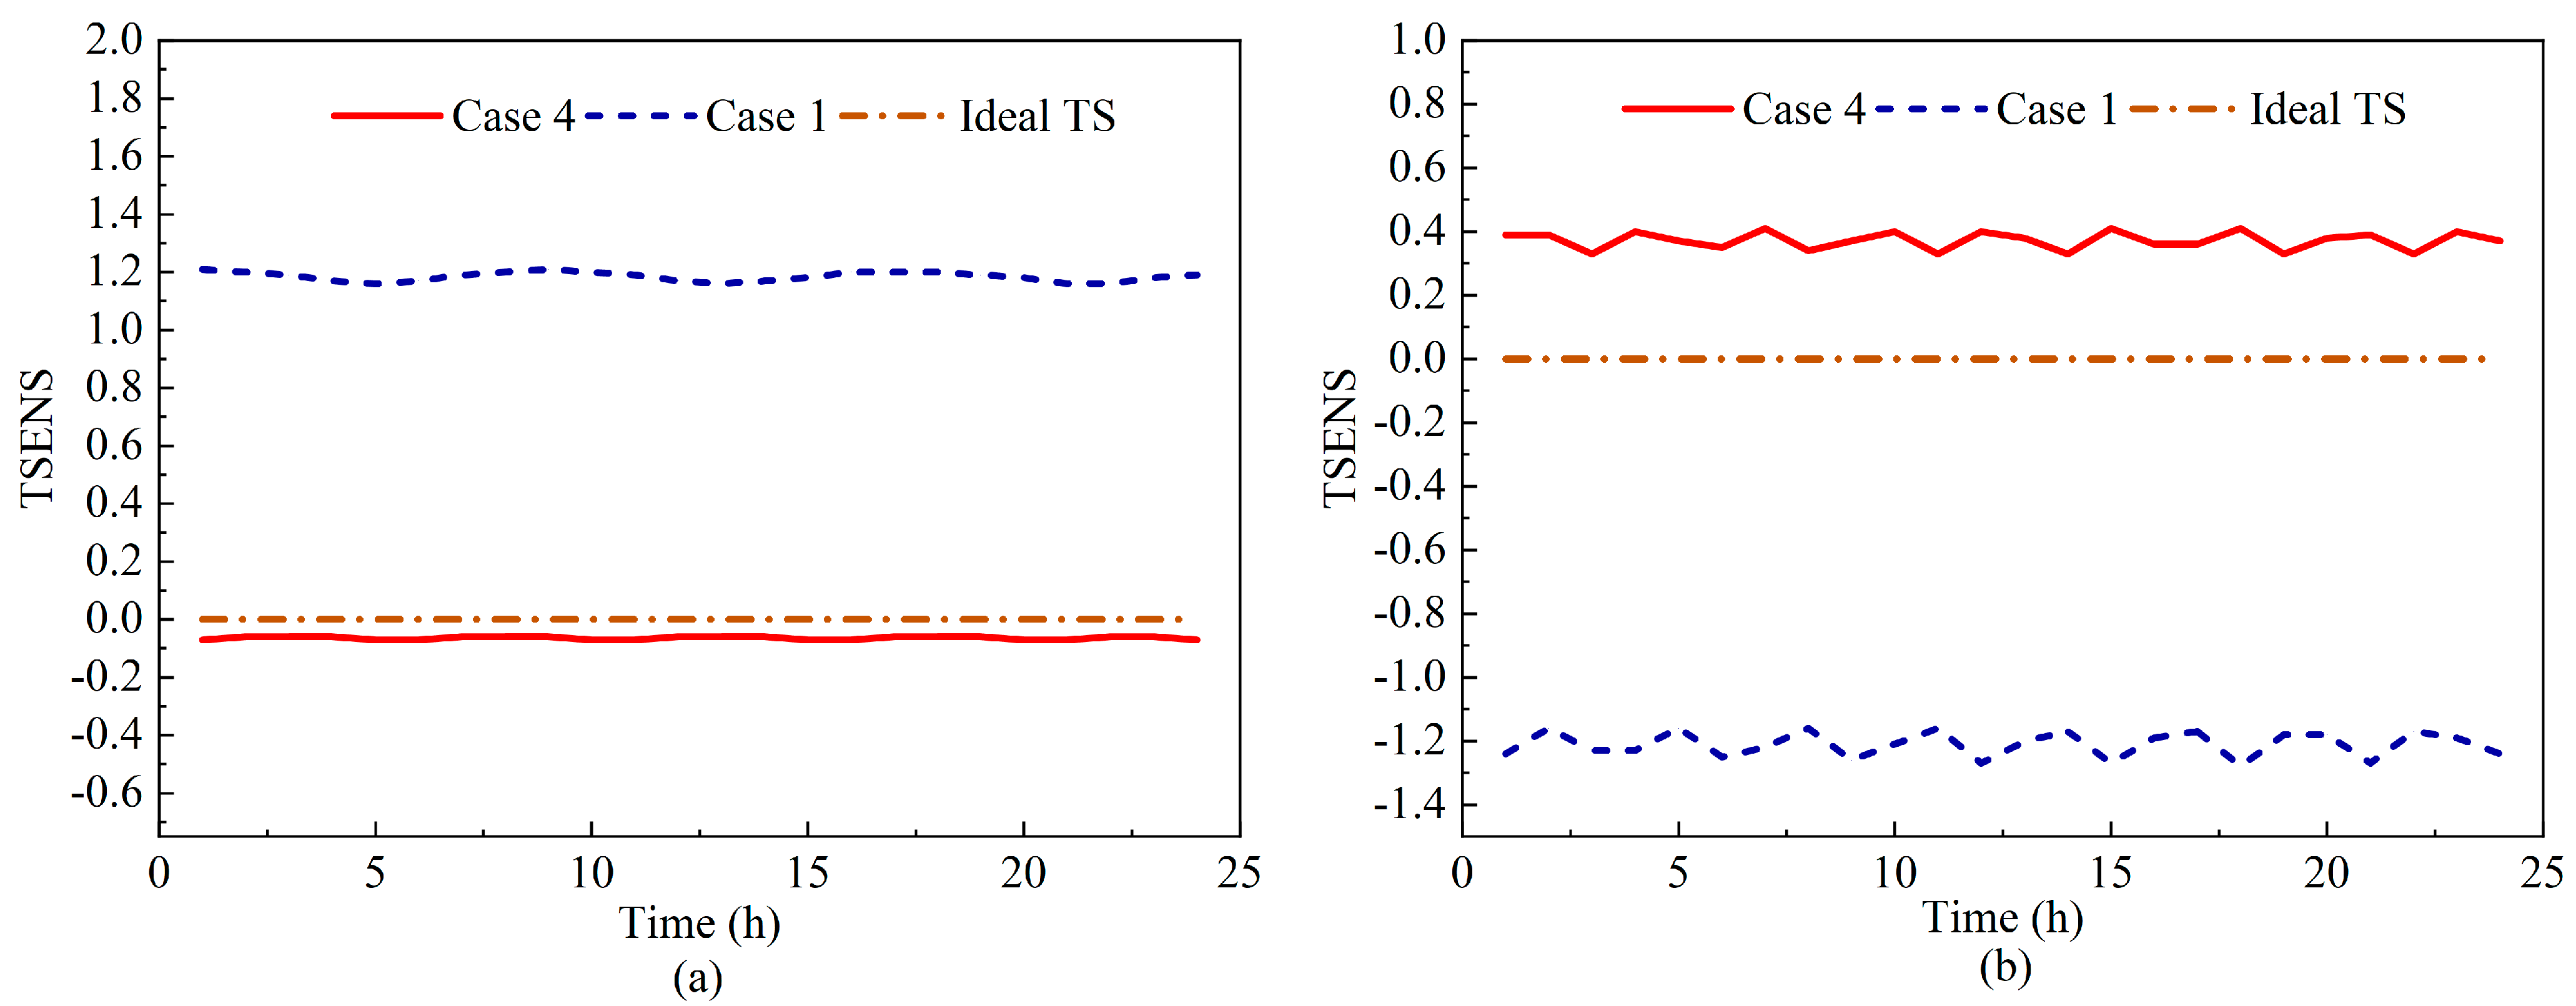
4.2.2. Effect of Thermal Comfort Control

In Case 4, the TSENS index constraint was implemented to restrict its absolute value within ±1. To effectively evaluate the system’s thermal regulation capacity under extreme weather conditions, thermal comfort assessments were conducted on two representative days: summer and winter.
The TSENS metrics for system operation in Case 1 and Case 4 are compared as illustrated in Figure 11. As depicted in Figure 11a, during summer, the mean TSENS value is −0.064 on a typical day with thermal comfort constraints (TSCs) and 1.18 in the absence of TSCs. At this juncture, the temperature regulation capacity of the system with constraints markedly surpasses that of the unconstrained system, significantly enhancing human thermal comfort, with TSENS variations exhibiting a more gradual trend. Similarly, as depicted in Figure 11b, in winter, the mean TSENS value with the constraint system is 0.37, whereas without the constraint system, it is −1.21. Consequently, implementing TSCs facilitates the achievement and satisfaction of thermal comfort for occupants within the building. In contrast to traditional approaches that maintain air temperature within a 22–29 °C range [23], which fail to control the temperature within a comfortable range at a certain time, resulting in occupant discomfort, this study employs real-time calculation of core and skin temperatures to regulate the TSENS index within ±1, thereby more accurately reflecting thermal comfort. Enhanced occupant satisfaction confirms the viability of a “human-centric” approach in intelligent environmental systems (IESs), transitioning from equipment-focused efficiency to user experience. The synergistic optimization of efficiency and comfort is demonstrated by the minimal energy penalty (0.65%) associated with thermal comfort regulation, which indirectly improves energy efficiency by reducing superfluous heating/cooling demands. These findings contribute to the expansion of IES multi-objective optimization frameworks, emphasizing the potential to balance “efficiency-cost-comfort” trade-offs.

4.2.3. Effect of Pipeline Thermal Inertia

Incorporating the TSENS constraint imposes more rigorous specifications on the thermal energy provision for the building’s HVAC system, thereby impacting the system’s performance output, elevating operational costs, and necessitating more frequent deployment of energy storage systems. Table 5 further analyzes the influence of thermal comfort and thermal inertia on the system performance. It is evident that the energy utilization efficiency of storage systems in Case 1 with thermal comfort constraints is inferior to that without constraints, except during winter electricity storage. Consequently, the inclusion of thermal comfort constraints necessitates enhanced coordination among energy storage components and elevates the overall demand for energy storage capacity. The frequent utilization of energy storage systems accelerates their degradation, diminishes performance efficiency, and elevates maintenance expenditures. Comparative analysis of data from Case 4 and Case 1 indicates that incorporating pipeline thermal inertia and accounting for pipeline thermal losses in Case 4 effectively alleviates the operational stress on energy storage devices, markedly decreasing their cycling frequency. The thermal inertia of the pipeline introduces a temporal delay in its regulation and control response to building load variations, effectively functioning as a virtual energy buffer within the building system. This mechanism mitigates the rapid cycling and startup frequency of the energy storage units, thereby enhancing their operational stability and aligning system performance with demand requirements.
To enhance the analysis of cryogenic and thermal energy storage system performance under extreme environmental conditions, two representative days—winter and summer—are selected to examine the hourly operational profiles of the cold and heat storage units, as illustrated in Figure 12. During the winter season, the primary focus is on the heat demand, leading to an emphasis on the operational status of HS equipment; conversely, in summer, the discussion extends to CS equipment performance. The data presented in Figure 12a indicates that the SOC of the HS in Case 5 outperforms that of Case 4 during winter conditions. In Case 5, the HS operational efficacy is diminished, resulting in reduced operational duration and decreased utilization frequency due to thermal inertia effects. The peak SOC achieved during operation is 13%, corresponding to an unused capacity of 435 kW. Enhanced system flexibility, stemming from the coupling unit’s output modulation and the integration of the heating network pipeline supplying auxiliary heat, leads to a lower capacity utilization rate in Case 5 compared to Case 4, with a reduction of 2.51%. In summer, as depicted in Figure 12b, the SOC of the CS in Case 5 surpasses that of Case 4. Specifically, the pressure within the CS unit is decreased in Case 5, resulting in a shorter operational duration and reduced utilization frequency due to thermal inertia effects. The peak SOC during operation reaches only 18%, corresponding to an available capacity of 410 kW. Enhanced system flexibility, achieved through the coupling unit’s output modulation and the integration of the heating network pipeline supplying auxiliary thermal energy, leads to a lower capacity utilization rate in Case 5 compared to Case 4, with a reduction of 69.82%.
In conclusion, the Case 5 system, which accounts for pipeline thermal inertia, demonstrates superior performance by enhancing the efficiency of the energy storage system’s operational scheduling and mitigating system pressure fluctuations.

5. Conclusions

This study proposes an IES for buildings leveraging the waste heat recovery of an absorption heat pump. The system design incorporates the thermodynamic cycle and operational modes of the heat pump to optimize waste heat utilization, thereby reducing construction costs and promoting low-carbon building practices. Additionally, a thermal flow-temperature model is developed, accounting for indoor thermal comfort parameters and the thermal inertia of the piping infrastructure. The analysis evaluates the system’s performance across representative seasonal conditions, offering strategic insights for enhancing building energy efficiency and occupant satisfaction. Based on five case studies, the following conclusions are drawn:
(1) WAHP cooling and heating mode can effectively reduce the economic cost of the system to 4.4% ~ 8.5%. The flow temperature model of devices promotes the flexibility of the system and plays a critical role in maintaining indoor thermal comfort while minimizing energy waste. The parameters of energy storage components influence the overall energy consumption of WAHP. In this case, reasonable adjustment of parameters improved the utilization rate from 37.02% to 51.46%, thereby contributing to reduced system costs and lower carbon emissions.
(2) The Gagge two-node model enhances the dynamic regulation of building thermal comfort by effectively improving indoor thermal conditions and stabilizing the indoor TSENS value near zero. However, the increased demand for temperature regulation imposes a greater load on HVAC equipment, necessitating additional energy storage solutions and resulting in elevated economic costs for the system.
(3) The thermal inertia of the building pipeline can reduce the operating pressure of energy storage equipment, thereby reducing their cycling frequency and capacity utilization. In Case 5, the utilization rate of CS decreased by 69.82%. Without compromising system operational performance, a capacity margin exceeding 400 kW is achieved. Thermal inertia offers significant potential for enhancing energy efficiency and carbon mitigation, while also alleviating pressure fluctuations in the energy supply that are attributable to thermal comfort demands.
This system facilitates the economically optimized and low-carbon integration of multi-energy systems in building operations, demonstrating substantial research significance and potential within the domain of building energy management and conservation.

Author Contributions

J.S.: writing—review and editing, resources, funding acquisition, methodology. B.S.: writing—original draft, methodology, visualization, software. X.C.: writing—review and editing, visualization, supervision. D.L.: writing—review and editing, supervision. Y.Y.: writing—review and editing, resources. All authors have read and agreed to the published version of the manuscript.

Funding

The work is supported by financial support from the National Natural Science Foundation of China (52090062).

Data Availability Statement

The original contributions presented in this study are included in the article. Further inquiries can be directed to the corresponding author.

Acknowledgments

The authors would like to thank the reviewers for their critical comments and valuable suggestions.

Conflicts of Interest

The authors declare that they have no known competing financial interests or personal relationships that could have appeared to influence the work reported in this paper.

Nomenclature

IES, Integrated energy system PV, Photovoltaic
WT, Wind turbine GT, Gas turbine
EC, Electric chiller WAHP, Waste heat absorption heat pump
GB, Gas boiler EB, Electric boiler
ES, Electricity storageHS, Heat storage
CS, Cold storagePMV, Predicted mean vote
TSENS, Thermal sensationTSC, Thermal comfort constraints
Symbols
M rate of metabolic heat production, W/m2 P t grid grid purchase power, kWh
M s h i v metabolic level required for shivering W/m2 S O C t ES state of charge of ES
W rate of mechanical work accomplished, W/m2 S O C t HS state of charge of HS
q r e s total rate of heat loss through respiration, W/m2 S O C t CS state of charge of CS
K skin heat transfer coefficient, 5.28 W/(m2·K) C inv ES ES capacity, kW
q d r y dry (sensible) heat loss from the skin, W/m2 C inv HS HS capacity, kW
q e v a p wet (sensible) heat loss from the skin, W/m2 C inv CS CS capacity, kW
c c r specific heats of core, 3500 J/(kg·K) P b u y c o s t e l e electricity purchase cost, RMB
c s k specific heats of skin, 3500 J/(kg·K) G g a s c o s t g a s gas purchase cost, RMB
c p , b l specific heats of skin, 4190 J/(kg·K) P o u t , i c o s t i equipment maintenance cost RMB
m c r body core weight, kg η e v evaporative efficiency (0.85)
m s k body skin weight, kg C w heat capacity of fluid, MJ/kg °C
S k B F peripheral blood mass flow, kg/s β t H S , c h a , β t H S , d i s HS charging and discharging state, only 0 or 1.
β t E S , c h a , β t E S , d i s battery charging and discharging status, only 0 or 1. β t C S , c h a , β t C S , d i s HS charging and discharging state, only 0 or 1.

References

  1. Zhu, Y.; Xu, Y.; Chen, H.; Guo, H.; Zhang, H.; Zhou, X.; Shen, H. Optimal dispatch of a novel integrated energy system combined with multi-output organic Rankine cycle and hybrid energy storage. Appl. Energy 2023, 343, 121113. [Google Scholar] [CrossRef]
  2. Ma, M.; Zhou, N.; Feng, W.; Yan, J. Challenges and opportunities in the global net-zero building sector. Cell Rep. Sustain. 2024, 1, 100154. [Google Scholar] [CrossRef]
  3. Yu, M.G.; Huang, B.; Ma, X.; Devaprasad, K. Multi-objective sizing and dispatch for building thermal and battery storage towards economic and environmental synergy. Appl. Energy 2024, 372, 123819. [Google Scholar] [CrossRef]
  4. Rosales-Asensio, E.; Icaza, D.; González-Cobos, N.; Borge-Diez, D. Peak load reduction and resilience benefits through optimized dispatch, heating and cooling strategies in buildings with critical microgrids. J. Build. Eng. 2023, 68, 106096. [Google Scholar] [CrossRef]
  5. Lou, J.; Wang, Y.; Wang, H.; Wang, J.; Chen, L.; Zhang, J.; Islam, M.; Chua, K. Operation characteristics analysis and optimal dispatch of solar thermal-photovoltaic hybrid microgrid for building. Energy Build. 2024, 315, 114340. [Google Scholar] [CrossRef]
  6. Zhou, B.; Huang, Y.; Nie, J.; Ding, L.; Sun, C.; Chen, B. Modification and verification of the PMV model to improve thermal comfort prediction at low pressure. J. Therm. Biol. 2023, 117, 103722. [Google Scholar] [CrossRef]
  7. Qi, T.; Hui, H.; Song, Y. Chance constrained economic dispatch of central air conditionings in large-scale commercial buildings considering demand response. Energy Build. 2024, 320, 114607. [Google Scholar] [CrossRef]
  8. Tang, H.; Wang, S. A model-based predictive dispatch strategy for unlocking and optimizing the building energy flexibilities of multiple resources in electricity markets of multiple services. Appl. Energy 2022, 305, 117889. [Google Scholar] [CrossRef]
  9. Feng, W.; Wei, Z.; Sun, G.; Zhou, Y.; Zang, H.; Chen, S. A conditional value-at-risk-based dispatch approach for the energy management of smart buildings with HVAC systems. Electr. Power Syst. Res. 2020, 188, 106535. [Google Scholar] [CrossRef]
  10. Zhang, J.; Kong, X.; Shen, J.; Sun, L. Day-ahead optimal scheduling of a standalone solar-wind-gas based integrated energy system with and without considering thermal inertia and user comfort. J. Energy Storage 2023, 57, 106187. [Google Scholar] [CrossRef]
  11. Tan, X.; Wang, Y.; Wu, L.; Yu, Y.; Yu, Q.; Sun, G. An ANFIS-Based indirect control strategy for solar heating system: Exploring PMV approach. Energy Build. 2024, 309, 114056. [Google Scholar] [CrossRef]
  12. Li, X.; Wang, H. Integrated energy system model with multi-time scale optimal dispatch method based on a demand response mechanism. J. Clean. Prod. 2024, 445, 141321. [Google Scholar] [CrossRef]
  13. Yi, Z.-K.; Li, Z.-M. Combined Heat and Power Dispatching Strategy Considering Heat Storage Characteristics of Heating Network and Thermal Inertia in Heating Area. Power Syst. Technol. 2018, 42, 1378–1384. Available online: https://kns.cnki.net/kcms2/article/abstract?v=liLFU49ICVu9Z9Lwdgbmlu0QtEJydFeL0dpnWJs5wGzLw4VEm0gHVMliesrE4irTJxd_CHo5AqoxVUABFY3Yo4GI6_9oPUKrBHx_fQRTeW5YSKCe3ov6TrmzGpRKcL7llvS8_4f8HMmRdoTBAAt1riMDAuMa6piTVqLIyCKmp2V_08h1R-1OuA==&uniplatform=NZKPT&language=CHS (accessed on 29 July 2025).
  14. Li, B.; Niu, H.-H.; Yu, F.; Chen, P.; Lou, Q.-H. Research on Optimized Model of IES Integrated with Building. Process Autom. Instrum. 2020, 41, 85–88. Available online: https://kns.cnki.net/kcms2/article/abstract?v=liLFU49ICVvPrbyLfVRJ0c4-ZE5FIY9lOG7Yqt1pacq-a7C0sFJCFgTznk-Wy1QkiGatK9ykbjinUr7GeL5lfnFIKqIPccertKjOYg4L84t7tA9tT3o2p5PvE03J00MIq5VdrqcSaIIXe4l_Dq6267AcLHtVY4Oa0uXpV6UpTARmv6oBBoNdg==&uniplatform=NZKPT&language=CHS (accessed on 29 July 2025).
  15. Klyapovskiy, S.; You, S.; Cai, H.; Bindner, H.W. Integrated Planning of a Large-Scale Heat Pump in View of Heat and Power Networks. IEEE Trans. Ind. Appl. 2019, 55, 5–15. [Google Scholar] [CrossRef]
  16. Zhang, S.; Wen, M.; Cheng, H.; Hu, X.; Xu, G. Reliability Evaluation of Electricity-Heat Integrated Energy System with Heat Pump. CSEE J. Power Energy Syst. 2018, 4, 425–433. [Google Scholar] [CrossRef]
  17. Zhang, Z.-L.; Zhang, H.-J.; Xie, B.; Zhang, X.-T. Energy scheduling optimization of the integrated energy system with ground source heat pumps. J. Clean. Prod. 2022, 365, 132758. [Google Scholar] [CrossRef]
  18. Wu, D.; Liu, Z.; Han, Z.; Zhang, H.; Ma, F.; Zhang, S.; Yang, X.; Ge, H. Thermodynamic performance analyses and collaborative optimization for a novel integrated energy system coupled with organic Rankine cycle. Energy Convers. Manag. 2020, 225, 113484. [Google Scholar] [CrossRef]
  19. Tao, J.; Xu, W.X.; Li, Y.L.L.; Huo, Y.W.H.; Zhang, Y.M. Optimal operation of integrated energy system combined cooling heating and power based on multi-objective algorithm. Sci. Technol. Eng. 2019, 19, 200–205. Available online: https://kns.cnki.net/kcms2/article/abstract?v=liLFU49ICVt4TfYQ_oFLZ8GPKm-nXF4R6uD14QGJemqmfu-pTk_ELZJoX4LL0FRrdPSZimEz5NPpaorAugZrf69BRtaAxLYTylflNadpbUZKKutNqtS3Q5xY6kOM6dj3VHxnSBYA-ZV_fv2b0iT5TBhjiP_D1md7dhzQEepbj5IzEPni8RLkng==&uniplatform=NZKPT&language=CHS (accessed on 29 July 2025).
  20. Yu, L.G. A study on Human Thermal Comfort and Dynamic Thermal Comfort in Outdoor Shaded Environments. Master’s thesis, Dalian University of Technology, Dalian, China, 2004. Available online: https://kns.cnki.net/kcms2/article/abstract?v=liLFU49ICVu8fhMTz2dZxNPB1eVXUIiLXXf8TySCMPiZvsEhKGWJbCDSY31HDuO1ToBGcm92EUL2bfbRDfhkdnXaOWIkWyRlnfB6r9WQkIPP0m3ZABzu1ALUa35ZRCsK24QSy2YZplGo97Ji9JsPIdQLAyC6TpL-BhiCCfsUL1ts8sy0j0bbqT5rvt8Z8qGQ&uniplatform=NZKPT&language=CHS (accessed on 29 July 2025).
  21. Yang, S.; Wu, H.; Song, J.; Li, H.; Chen, H. Two-stage robust optimization scheduling for integrated energy systems considering ammonia energy and waste heat utilization. Energy Convers. Manag. 2024, 319, 118922. [Google Scholar] [CrossRef]
  22. Han, Z.; Zhang, X.; Wu, D.; Liu, A.; Han, S.; Liu, Z.; Wu, X. Cascaded utilization of heat energy and coordinated optimization of quantity and quality in an integrated energy system. Energy Convers. Manag. 2025, 342, 120108. [Google Scholar] [CrossRef]
  23. Lyu, Z.; Huang, M.; Liu, B.; Liu, Y. Robust optimization of regional integrated energy systems considering thermal comfort and uncertainty in heat networks. Appl. Therm. Eng. 2025, 275, 126895. [Google Scholar] [CrossRef]
Figure 1. The structure of the building IES.
Energies 18 04051 g001
Figure 2. Design process of the absorption heat pump.
Energies 18 04051 g002
Figure 3. System heat exchange process flow.
Energies 18 04051 g003
Figure 4. Parameter passing logic.
Energies 18 04051 g004
Figure 5. Hourly loads on a typical day of (a) summer, (b) winter, and (c) transition season.
Energies 18 04051 g005
Figure 6. Operating power characteristics of IES on a typical transition season day of (a) summer, (b) transition season, and (c) winter.
Energies 18 04051 g006
Figure 7. System heat balance of (a) Case 1, (c) Case 2, and cold balance of (b) Case 1, (d) Case 3 in the transition season.
Energies 18 04051 g007
Figure 8. System heat balance of (a) Case 1, (c) Case 2, and cold balance of (b) Case 1, (d) Case 3 in winter.
Energies 18 04051 g008
Figure 9. System heat balance of (a) Case 1, (c) Case 2, and cold balance of (b) Case 1, (d) Case 3 in summer.
Energies 18 04051 g009
Figure 10. Influence of HS parameters on the system in summer: (a) Economic cost; (b) Carbon emission and WAHP-P utilization rate.
Energies 18 04051 g010
Figure 11. TSENS value of (a) summer and (b) winter.
Energies 18 04051 g011
Figure 12. System SOC value of EH in (a) winter and EC in (b) summer.
Energies 18 04051 g012
Table 1. ASHRAE thermal sensation scale.
DegreeSensation
±5intolerable hot/cold
±4limited tolerance
±3very hot/cold
±2uncomfortable and unpleasant
±1slightly hot/cold but acceptable
0comfortable
Table 2. Input data of energy devices in the IES.
DeviceInstalled Capacity Performance Coefficient and Parameter/Time
GB(kW)10000.9
EB(kW)10000.98
EC(kW)10003.50
GT(kW)20000.30(power)/0.40(heat)
ES(kW)5000.01(loss)/0.95(char)/0.9(discharge)
HS(kW)5000.01/0.95/0.90
CS(kW)5000.01/0.95/0.90
Main pipe(kg/s)200/
Gas price (¥/m3)2.55/
Electricity price (¥/kWh)1.19:00–13:00
0.7514:00–17:00
0.50:00–9:00, 18:00–24:00
Table 3. Five certain cases and operating conditions for IES.
CaseWAHPTSENS ConstraintPipeline Thermal Inertia and Loss
HeatingCooling
Case 1××
Case 2×××
Case 3×××
Case 4×
Case 5
Note: “√” indicates the factor is considered/enabled; “×” indicates not considered/disabled.
Table 4. Operating cost comparisons of IES for five certain cases on typical season days.
CaseEconomic Cost
SummerWinterTransition Season
Case 110,735.9917,949.286196.95
Case 211,726.7218,783.296708.11
Case 311,706.8119,248.397395.42
Case 410,737.5817,961.126200.11
Case 510,736.0017,961.126200.11
Table 5. Utilization ratio of the energy storage device in typical seasons.
CaseUtilization Ratio of Energy Storage Device
ESHSCS
SummerWinterSummerWinterSummerWinter
Case 141.67%12.5%54.17%8.33%8.33%54.17%
Case 458.33%4.17%54.17%45.83%29.17%75%
Case 533.33%4.17%54.17%8.33%8.33%33.33%
Disclaimer/Publisher’s Note: The statements, opinions and data contained in all publications are solely those of the individual author(s) and contributor(s) and not of MDPI and/or the editor(s). MDPI and/or the editor(s) disclaim responsibility for any injury to people or property resulting from any ideas, methods, instructions or products referred to in the content.

