Abstract
The converter transformer is subjected to AC/DC composite voltage during operation, and the sealed and time-varying internal state makes its electric field distribution and charge accumulation unable to be monitored in real-time experiments. In this paper, aiming at the influence of bubbles in the oil passage of the converter transformer on charge accumulation before discharge, a simulation model in a laminar flow environment is established, and four different calculation conditions are set to simulate the charge accumulation in 1 s. It is found that under laminar flow conditions, the trapped bubbles on the insulation paper wall play an obvious role in intensifying the charge accumulation in transformer oil, and the extreme range of charge density will increase by about 104 times. Bubbles aggravate the electric field distortion, and the insulation strength of bubbles is lower, which becomes the weak link of insulation. In the laminar flow environment, the oil flow will take away part of the accumulated charge in the oil, but in the case of trapped bubbles, the charge accumulation in the insulating paper will increase from the order of 10−2 to 10−1. In the case of no bubbles, the transformer oil layer flow will increase the charge accumulation in the insulation paper by 4–5 orders of magnitude. Therefore, it can be seen that the flow of transformer oil will increase the deterioration level of insulation paper. And when the transformer oil is already in the laminar flow state, the influence of laminar flow velocity on charge accumulation is not obvious. The research results in this paper provide a time-varying simulation reference state for the charge accumulation problem that cannot be measured experimentally under normal charged operation conditions, and we obtain quantitative numerical results, which can provide a valuable reference for the study of transformer operation and insulation discharge characteristics.
1. Introduction
At present, China’s deep-seated contradictions, such as an unreasonable energy structure, tighter resource and environmental constraints and prominent energy security risks, are increasingly prominent. Building a clean, low-carbon, safe and efficient power energy system is an important strategic plan to solve the above contradictions and achieve the goal of “double carbon”, which puts forward higher requirements for the deep perception of the operation state of power equipment and intelligent decision-making. Under this requirement, the Ultra-High-Voltage Direct Current (UHVDC) transmission system plays an important role in China’s energy structure optimization [1,2].
The converter transformer is one of the key pieces of equipment in UHVDC transmission, and the insulation problem is very important, which directly affects the safe and stable operation of the whole DC transmission system. The converter transformer needs to withstand AC voltage, DC bias voltage, harmonic voltage (generated by the converter valve switch) and transient overvoltage (such as lightning impulse or switching overvoltage) [3], and its internal insulation needs to deal with the coupling effect of the electric field, temperature field, mechanical vibration and other fields at the same time. The converter transformer is faced with complex operating conditions. Under the DC electric field, the electric field distribution in the insulation material is different from that of the AC, which easily leads to charge accumulation (space charge effect). Under long-term operation, it may cause local electric field distortion, accelerate insulation aging and even breakdown [4]. However, insulation failure may lead to internal short circuit, partial discharge, or insulation breakdown, which may lead to equipment explosion or fire, threatening personnel safety and power grid operation [5]. Converter transformers generally adopt an oil-impregnated paper insulation structure. Under the influence of factors such as oil temperature rise, insulation deterioration, or mechanical disturbance [6,7], gas may be separated out in the oil passage and generate suspended bubbles, which is one of the main reasons for partial discharge and oil passage breakdown.
Scholars have made a lot of research results on the mechanism of bubbles and discharge in transformer oil. In [8], the author measured the partial discharge initiation voltage and breakdown voltage of transformer oil with bubbles through experiments and explained the mechanism of the influence of bubbles on the state of insulating oil. Under the combined action of an electromagnetic field, temperature field, flow field and other physical fields, bubbles will show extremely complex morphological evolution and movement rules. Reference [9] has studied the interaction between multiple adjacent elliptical bubbles and obtained the differences between their discharge laws and those of a single bubble. Reference [10] used the pulsed electroacoustic method to measure the charge accumulation at the oil–paper interface under oil flow and compared the effect of oil flow velocity on the accumulation law. The author of reference [11] theoretically analyzed the charge distribution in the oil–paper insulation system and designed an experimental method to verify it. Reference [12] summarizes the diagnosis and detection methods in the field of high-voltage insulation and introduces the detection of discharge process signals and charge accumulation in insulating materials.
In order to accurately describe and quantitatively express the discharge phenomena and laws of bubbles and transformer oil, it is necessary to accurately capture the key characteristic physical quantities in the discharge process. In the current research results, the charge accumulation theory and the one-time measurement of charge in the static bubble free state have made breakthroughs. However, due to the limitations of current scientific and technological means, under the operating condition of being electrified, it is still impossible to track the charge distribution and micro discharge process when the flowing oil contains bubbles in real time. Therefore, the combination of simulation research and discharge representation law can broaden the way of research in this field. In view of the above requirements, based on the charge drift diffusion model of fluid and the double carrier theoretical model of solid insulating materials, the dynamics and charge accumulation of bubbles in the oil passage of converter transformer under laminar flow state are simulated and calculated. Combined with the external law of partial discharge of transformer, the mechanism of the influence of bubbles in the oil channel on the insulation state is explained.
The remainder of this paper is organized as follows. Section 2 provides the hydrodynamic model of suspended bubbles in the oil passage. Section 3 introduces the charge accumulation theory of the oil–paper insulation structure. Section 4 describes the simulation model and its parameter settings in detail. In Section 5, based on the simulation results under four different conditions, the charge accumulation and law of oil–paper insulation structure with bubbles are compared and analyzed. Finally, Section 6 concludes the paper and outlines future research directions.
2. Fluid Model of Bubbles in Transformer Oil Passage
2.1. Model of Transformer Oil Passage
Winding is the circuit part of the transformer. There is a narrow gap between windings. For better heat dissipation and insulation, the gap is filled with transformer oil, which is the transformer oil passage mentioned in this paper. The windings of the transformer can be divided into layer winding and pie winding according to the arrangement. There are many cases where the pie winding structure is used in the winding of large oil-immersed power transformers, so the calculation model of pie winding is selected in this paper. The partition structure of pie winding is shown in Figure 1, and the oil flow flows in from the lower left and out from the upper right [13].
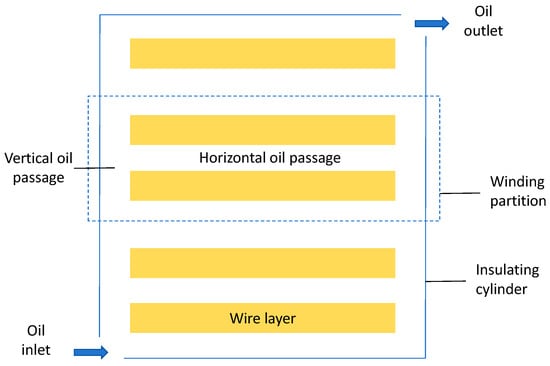
Figure 1.
Schematic diagram of oil passage of pie winding.
A partition in the pie winding is extracted to simulate the occurrence of bubbles at different positions in the passage. Based on the dynamic characteristics of laminar flow, the fluid mainly flows continuously in a fixed direction without random vortex. At the same time, considering the withstand voltage of ±500 kV and ±800 kV in the converter transformer oil duct, a 2D model is used for calculation. In order to simplify the calculation and save the calculation time, the oil passage model of a partition is simplified to the form of a curved bipolar plate, as shown in Figure 2.
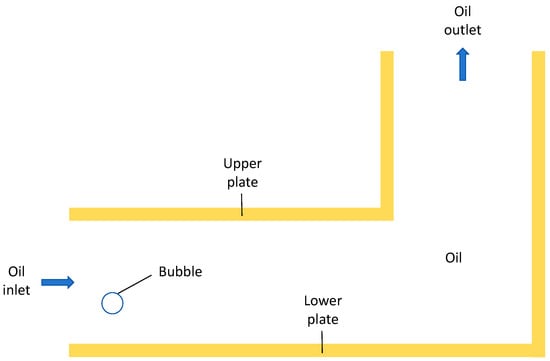
Figure 2.
Schematic diagram of oil passage model.
2.2. Laminar Flow Model of Transformer Oil
The laminar flow and turbulent state of fluid are usually judged by the Reynolds number. The Reynolds number is a dimensionless number used to predict the flow state. When the Reynolds number is lower than the critical value, the flow is laminar. If the critical value is exceeded, it is turbulent. The formula for calculating Reynolds number is
where ρ is the fluid density, v is the flow rate, D is the characteristic length and μ is the dynamic viscosity.
When the Reynolds number is less than 2000, the fluid motion state can be considered as laminar flow [14]. Laminar flow is common in transformer oil when the temperature rise is not high and the flow rate is not very fast. In this paper, for the laminar flow state, set the oil flow rate v < 0.5 m/s, and the Reynolds number is not more than 2000.
2.3. Dynamic Analysis of Bubbles in Transformer Oil Flow
For better heat dissipation in the oil-immersed transformer, the circulating flow of transformer oil is required to discharge the heat to the outside world. With the circulating flow of transformer oil, the bubbles will also move together. But unlike solid substances, deformation and other physical processes may occur during the movement, so it is necessary to analyze the force of the bubble during the movement. In the process of movement, the bubbles in the transformer oil will be affected by many forces, including electric field force, buoyancy, surface tension, gravity, resistance and oil drag. The electric field force and surface tension will cause the deformation of the bubble, and the combined force of buoyancy, gravity, resistance and oil drag will affect the trajectory of the bubble. The stress analysis of bubbles in oil flow is shown in Figure 3.
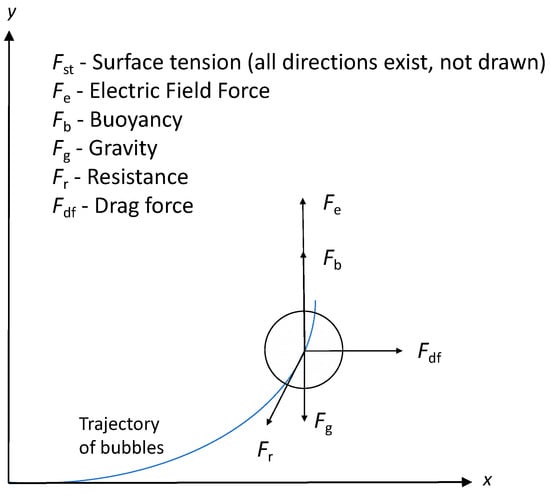
Figure 3.
Force analysis of bubbles.
3. Charge Accumulation Theory
3.1. Charge Drift Diffusion in Fluid
The hydrodynamic drift diffusion approximation model is not only short-time-consuming, but it can also effectively reflect the development law and interaction of electric field and charge density distribution in the process of self-sustaining discharge, so as to effectively describe the propagation and evolution process of the streamer in oil. In recent years, it has been widely used in the electric field problem of oil flow.
The charge drift diffusion theory in fluid is a multi-physical field coupling model, involving charge transport, electric field distribution and fluid motion. Through the multi-party coupling of electric field intensity E (negative potential gradient) and fluid velocity v, in this model, there is no ionization reaction and only the charge accumulation process in the early stage is described. The core equations include the following:
- 1.
- Poisson equation:
This equation describes the potential distribution:
where εo is the dielectric constant of the fluid, φ is the potential, ρe is the charge density (the total charge density after the superposition of various charges such as electrons, positive and negative ions), zi and ci are the charge number and concentration of the ith charged particle, respectively, and e is the basic charge.
- 2.
- Nernst–Planck equation:
This equation describes the variation of the concentration of various kinds of charged particles with time.
where is the source term of the chemical reaction, and the flux consists of three parts: diffusion, migration and convection:
where is the diffusion coefficient in the fluid, kb is Boltzmann constant, T is temperature and is fluid velocity.
- 3.
- Navier–Stokes Equation describing fluid motion:
This equation shows that the inertial force of fluid can be composed of pressure, viscous force and external force:
where is the fluid density, μ is the fluid dynamic viscosity and is the electric field force density (the external force in this model).
- 4.
- Continuity equation:
This equation represents the incompressible fluid studied in this paper.
3.2. Bipolar Charge Carrier Transport in Insulating Paper
The bipolar carrier transport model, which reflects the distribution characteristics of the electric field and charge in the insulating paper, is based on the assumption that the traps in the insulating paper are uniformly distributed. In the model, the conduction band free electron (valence band hole) is related to the effective migration of charge, which explains that the charge may be trapped or separated from the trap. For the bipolar charge carrier, deep traps are approximately described as single trap energy levels. It is possible for the charge carrier to overcome the potential barrier and fall out of the trap, and the recombination of the charge carrier mainly depends on the recombination rate between different composite objects. Once the charge carrier is in the trap compound, the trap will be released and the charge may be trapped again [15,16,17].
Insulating paper is a solid dielectric. In the interior of insulating paper, the diffusion of charge carrier due to concentration is not easy to occur, so this item can be ignored. On this basis, the bipolar carrier transport model inside the insulating paper (excluding the metal electrode) is described by the following equations.
where εp is the dielectric constant of insulating paper. ρmh, ρth, ρme and ρte are the charge density of the free hole, trapped hole, free electron and trapped electron, respectively. Be and Bh are the electron and hole entry rates, respectively. De and Dh are the electron and hole escape rates, respectively. S0 is the recombination rate of trapped holes and trapped electrons. S1 is the recombination rate of trapped holes and free electrons. S2 is the recombination rate of free holes and trapped electrons. S3 is the recombination rate of free holes and free electrons. In this model, it can be disregarded (its value is 0).
3.3. Charge Accumulation Process
In the simulation model of charge accumulation, when there is no ionization reaction, the charge source inside the insulating material is mainly the injection of the electrode (electron injection and hole injection), and the way of charge disappearance is mainly recombination (inside the medium) and extraction (on the surface of the electrode).
Corresponding to the establishment of the simulation model, there is a potential difference between the upper and lower windings of the transformer oil passage, which is the source of the applied electric field; The electric field intensity will be further distorted by the charge accumulation. On different dielectric surfaces, due to the existence of normal electric field strength and the different work functions of materials, the charge will also be transported between the dielectric interfaces. However, due to the limitation of traps, the interface passing rate is low, so the charge accumulation will be formed on both sides of the interface, which will further aggravate the distortion of electric field strength and ultimately affect the insulation state [18,19,20].
Due to the AC/DC composite voltage, the charge accumulation of the converter transformer is more serious than that under the pure AC condition because AC voltage has periodic zero crossing, while DC does not. Therefore, in the process of charge accumulation, the influence of the DC component of the composite voltage on the results is more obvious, while the charge accumulation is less and much slower when the AC boundary condition is applied only.
4. Simulation Modeling
4.1. Simplified Conditions of Fluid Model
In the modeling of this paper, insulating oil and bubbles are both fluid. According to the physical conditions of the model, some acceptable simplifications are made, including the following:
- Ions are regarded as point charges without considering their volume effects.
- Fluid is continuous and incompressible Newtonian fluid.
- The dielectric constant ε is constant and does not change with position or field strength.
- Ignoring the magnetic effect, that is, quasi-static approximation, without considering the change of magnetic field.
- In the case of no ionization, the source term of the chemical reaction can be ignored, that is, in Formula (3).
- The calculation area of this model is obviously smaller than the winding size of the converter transformer, so the temperature is constant and the thermal effect is ignored; that is, the temperature T in Formula (4) is constant in the individual model and does not change with time, and there is no coupling with the temperature field in the model.
- The dilute solution hypothesis is that the ion concentration is low enough that the interaction between them can be ignored, and the activity coefficient is approximately 1.
4.2. Model Establishment and Boundary Conditions
Based on the physical model in Figure 2, the simulation model is built in the form of a two-dimensional longitudinal section. The upper and lower plates are made of insulating paper, and the potential difference between windings is simulated under the boundary condition of loading potential on the upper and lower edges of insulating paper. The upper boundary potential is applied with 1:1 AC/DC composite voltage, and the lower boundary potential is applied with 0 potential.
Since the temperature change and the thermal effect of the material are not considered, the heat transfer boundary condition is set as thermal insulation. The distribution of electric field intensity depends on the superposition effect of the applied electric field and charge accumulation, and it meets the charge conservation condition.
The charge transport between the interfaces of different materials is related to the electric field intensity component in the normal direction of the interface, and it meets the restriction of ohmic model. The charge injection from the electrode to the contact surface of the insulating paper meets Schottky’s law, and the charge will be extracted when it moves to the electrode surface of opposite polarity.
The inlet of the oil flow is set as a fully developed flow, and the average flow velocity is used as the boundary condition. The oil flow outlet is set to 0 pressure outlet and inhibits backflow. Gravity and buoyancy are set in the fluid part, and the interface between oil flow and insulating paper is set as a wetting wall. The two-phase flow interface tracking of transformer oil bubbles is calculated by the level set method. The simulation model settings are shown in Figure 4.
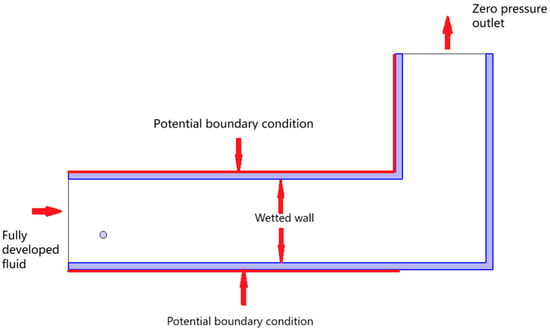
Figure 4.
Simulation model settings.
4.3. Physical Field Decoupling Simplification
Under normal operation conditions, the influence of internal electric field intensity distortion and charge accumulation on the insulation level of the transformer is slow and continuous, often measured in months and years. The oil flow in the transformer oil passage is laminar at low velocity and turbulent at high temperature and high velocity. The overall velocity is about 0.1~0.6 m/s. After bubbles are generated in the transformer oil passage, the bubbles are subjected to comprehensive forces and show a certain trajectory. Because of the existence of resistance, the movement speed of bubbles in the horizontal oil passage is generally slower than that of the oil flow, but the overall speed remains the same order of magnitude. The bubble in the vertical oil passage is affected by buoyancy, and if the oil flow direction is consistent with the buoyancy direction, the bubble movement will be accelerated.
Oil inside the transformer not only plays the role of insulation and cooling but also weakens the degree of charge accumulation [21]. The oil flow circulates inside the transformer with bubbles and part of the charge, and it is regularly filtered to reduce the accumulation of fixed positions in the oil and electric field distortion. As shown in Figure 5, it can be seen in the red box that the accumulated charge enters the cycle with the flow of oil.
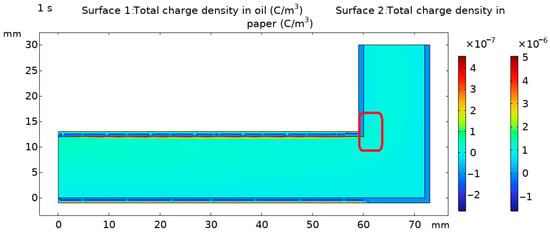
Figure 5.
The oil flow pushes the charge to move circularly.
In view of the above, the charge accumulation in the oil flow under normal operation will not cause obvious insulation problems in the short term. When there are defects in the oil–paper insulation structure, the charge accumulation will be serious, and the impact on the insulation state will be aggravated. In the transformer oil passage, when the bubble moves with the oil flow, it may stop at a certain position due to buoyancy, eddy current and other reasons, forming a wall attached deformation state, thus forming a relatively long-term defect state.
Based on the large difference in time constant between the fluid field and the dilute material transfer field, and because the oil passage bubble in the stopped state has a greater impact on the insulation level, this paper couples the dilute material transfer field, the fluid field of oil and the electric field, and it sets the position of the bubble as fixed.
Compared with insulating paper and oil, the insulation strength of air bubbles is obviously poor. Under the condition of charge accumulation and electric field distortion, they will first break down and produce partial discharge. During the simulation study, it was found that due to the small volume of the bubble, the overall effect of the charge stored in the bubble was small. Therefore, in the simulation of charge accumulation rather than the breakdown process, only the overall effect of the stationary bubble on the fluid flow and charge accumulation is calculated, and the charge accumulation inside the bubble is not calculated.
In this way, the two-phase flow problem of the fluid field will be decoupled from other fields, so as to reduce the amount of calculation and obtain results with reference value by reasonable simplification.
5. Simulation Analysis
5.1. Movement of Bubbles in the Oil Passage
Set the oil flow rate as 0.2 m/s and the bubble radius as 0.5 mm to calculate the movement of bubbles in the laminar oil flow (because the paperboard is a solid without considering the flow and deformation, the paperboard part is not displayed when calculating the bubble movement problem). When the level set method is used to track the interface of two-phase fluid, the position with a volume fraction of 0.5 represents the position of the interface at the moment.
Figure 6 shows the movement trajectory and deformation of bubbles in the laminar oil passage at different times (t = 0 s, 0.1 s, 0.2 s). It can be seen that in the process of moving forward, the bubble moves upward under the action of buoyancy. And it is deformed by the blocking effect of the upper paperboard and gradually attached to the paperboard wall in an approximate oval shape.
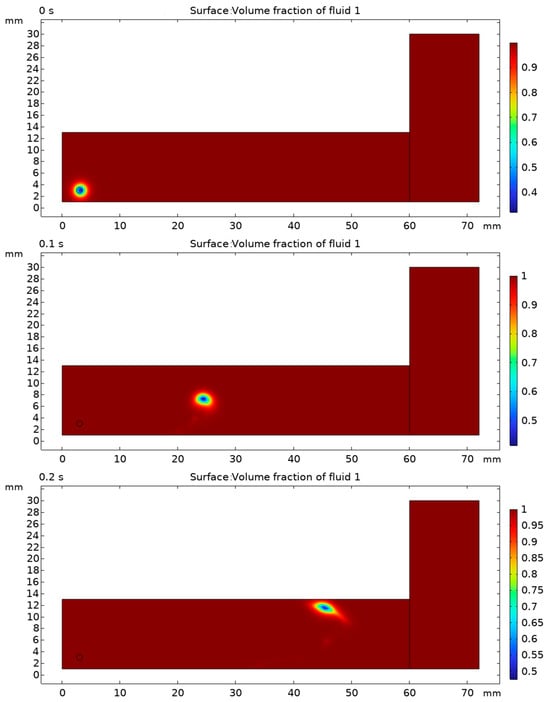
Figure 6.
Movement and deformation of bubble in oil passage under laminar flow condition.
5.2. Effect of Deformation Bubble on Charge Accumulation
Based on the simplified conditions described above, the oval bubble is set to stop near the upper paperboard. In order to avoid the non-convergence of the calculation process caused by the tangency between the bubble and the paperboard, a small spacing distance is set between the bubble and the paperboard. In the potential boundary condition, the electrode of the upper paperboard contact is applied with the condition of a high DC potential component, and the electrode of the lower paperboard is added with 0 potential. In the two areas of transformer oil and insulating cardboard, the overall charge accumulation at 1 s is shown in Figure 7. When other conditions remain unchanged, the charge accumulation is positively correlated with the time length. In order to save the amount of calculation, 1 s is selected as the calculation time length, which can reasonably reflect the characteristics of the research object. The total charge in the oil region is the sum of the charges of positive ions, negative ions and electrons, and the total charge in the paperboard region is the sum of the charges of holes and electrons, in C/m3.
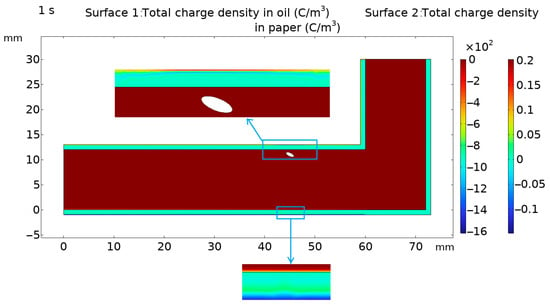
Figure 7.
Effect of adherent deformation bubble on charge accumulation.
It can be seen that the total charge accumulates more in the paperboard and less in the oil flow, because the charge in the oil flow is brought into circulation by the fluid. It can be seen from Figure 8 that the electric field intensity near the bubble is obviously distorted, resulting in several regions with large differences in value. Because the simulation time in this paper is 1 s, the trend of charge accumulation is clear, but the total charge is not enough to significantly change the distribution of electric field intensity. If the charge accumulation is obvious after long-term operation, the electric field distortion around the bubble will be more distorted due to the existence of accumulated charge. The charge accumulation in the upper paperboard near the bubble position is obviously affected by the bubble. The accumulated charge in the upper paperboard is mainly positive charge. The existence of bubbles increases its own electric field strength and slightly reduces the electric field strength in the nearby paperboard, resulting in the weakening of the electric field migration activity in the paperboard in this small area, and the amount of charge injected into the electrode has little change. Therefore, the positive charge is more concentrated near the electrode, causing local distortion. The positive charge accumulation layer will cause electric field distortion and attract negative charges to form relatively thin negative charge accumulation layers around the positive charge.
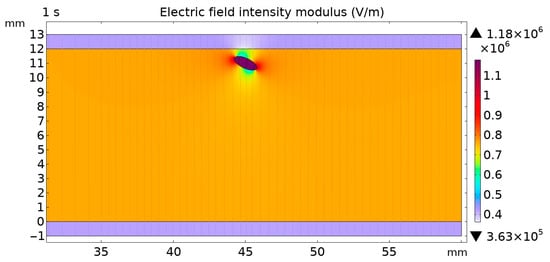
Figure 8.
Distribution of electric field intensity modulus near bubble.
It can be seen from Figure 9 and Figure 10 that the stopped bubbles will affect the flow velocity of the fluid, forming a region with smaller velocity between the bubbles and the cardboard. At this time, the ability of the oil flow to take away the charge is affected, and the accumulation of positive ions in the oil is unbalanced.
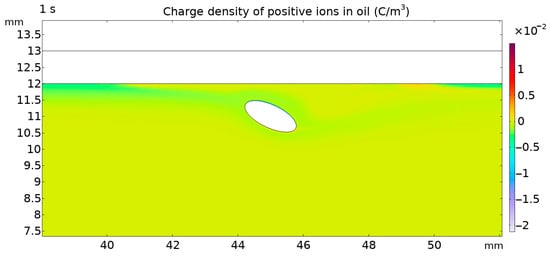
Figure 9.
Effect of adherent deformation bubble on positive ion charge accumulation in oil partial diagram.
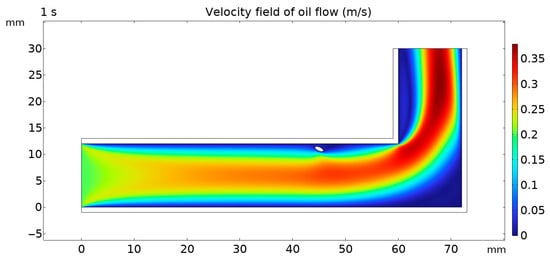
Figure 10.
Effect of adherent deformation bubble on fluid velocity field.
The negative charge is mainly accumulated in the lower paperboard. After the negative charge is injected into the contact position with the lower electrode, the negative charge accumulation layer is thicker than the positive charge accumulation layer of the upper paperboard because the migration speed of electrons is faster than that of positive ions.
5.3. Influence of Bubbles and Oil Flow on Charge Accumulation and Insulation State
Under the framework of the winding model, boundary conditions and simplified conditions set in this study, in order to compare the effects of bubbles and oil flow on charge accumulation, four different simulation conditions are set as shown in Table 1. The total charge accumulation under the four conditions is shown in Figure 5, Figure 7, Figure 11 and Figure 12. Under the influence of four conditions, the numerical difference of charge accumulation is shown in Table 1. In the table, √ indicates the presence of this condition, and × indicates the absence of this condition.

Table 1.
Comparison of charge accumulation under four conditions.
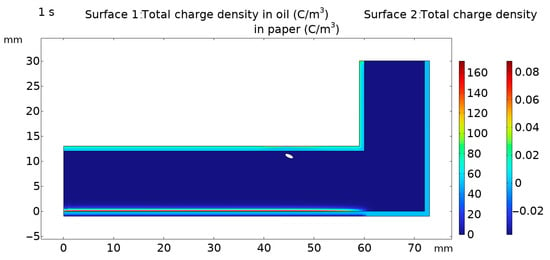
Figure 11.
Total charge accumulation without oil flow but with bubbles.
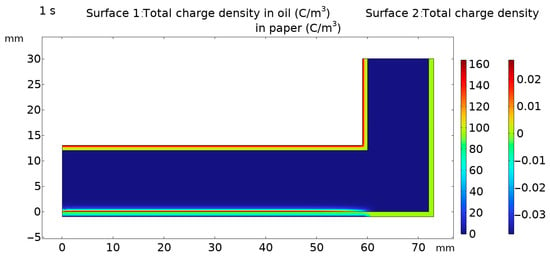
Figure 12.
Total charge accumulation without oil flow and bubble.
Summing up the total charge accumulation under four conditions, we can find that the influence of bubbles and flow on charge accumulation is diverse.
- Under the condition of no bubble and no laminar flow, the total charge accumulation is the least, and the range of positive and negative charge accumulation values in oil and paper is very small, which is an order of magnitude smaller than the value of the same charge under other conditions. It can be seen that there is no bubble distortion effect on the field, the electric field strength in each region is closer to the uniform electric field, the charge injection is significantly reduced and the oil flow takes away the accumulated charge, making the whole insulation environment better.
- In the case of the same bubble, the fluid flow has an obvious effect on the accumulation of positive charge in transformer oil. Because the migration and diffusion rate of positive ions in oil is lower, the degree of accumulation can be significantly reduced by the convection effect of oil flow. In the simulation case of this paper, the oil flow velocity near the corner of the upper paperboard increases due to the change of pipeline structure, and the convection effect is significantly faster than that in the same abscissa area of the lower paperboard. However, the accumulation of negative charges in oil is significantly increased, because the diffusion and migration rate of electrons is faster, and the negative charge injection rate at the contact position between the paperboard and the electrode is higher than that of the positive charge (the electron injection barrier is lower than that of the positive charge). When the negative charge is taken away by the slower oil flow, the new negative charge is replenished faster and passes through the oil–paper interface faster, and the slightly thinner positive charge layer attracted by the outside of the negative charge accumulation layer increases the local electric field distortion.
- In the case of the same bubble, the laminar flow plays a significant role in increasing the charge accumulation in the insulating paper. The existence of bubbles distorts the electric field, obviously, and the charge injection rate of the two electrodes increases significantly compared with that without bubbles. The fluid in the oil takes away the charge, which makes the charge density gap between paper and oil larger, the degree of electric field distortion deepened and the injection increased.
- In the case of the same bubble, the laminar flow rate of 0.2 m/s and 0.4 m/s has no obvious difference compared with the charge accumulation, so it is not detailed.
- Under the same condition without laminar flow, the existence of bubbles mainly affects the positive charge accumulation in insulating paper. Compared with the two sides, the positive and negative charges in the oil and the negative charge accumulation in the paper are not significantly different, only the positive charge accumulation in the paper is three times larger due to the existence of bubbles. Because, in the simulation model in this paper, the bubble is closer to the high potential side, the electric field on the paperboard is severely distorted.
- In this paper, the charge accumulation of the model at 1 s under various conditions is calculated. When there is no ionization reaction, the charge accumulation level is positively correlated with the duration. The transformer has been running for many years. When the bubbles are stuck in a certain position due to the internal structure of the transformer, the electric field distortion caused by the charge accumulation will aggravate the deterioration of the insulation state and affect the service life of the internal insulation.
6. Conclusions
In this paper, aiming to describe the influence of bubbles in the oil passage of a converter transformer on charge accumulation, a simulation model without discharge in a laminar flow environment is established, and four different calculation conditions are set to simulate the charge accumulation in 1 s. The conclusions are as follows:
- The existence of bubbles will significantly increase the degree of charge accumulation, and under the same laminar flow conditions, the extreme range of charge density will increase by about 104 times. It aggravates the distortion of the electric field, and the insulation strength of bubbles is lower, which becomes the weak link of insulation.
- In the laminar flow environment, the oil flow will take away part of the accumulated charge in the oil, but in the case of trapped bubbles, the charge accumulation in the insulating paper will increase from the order of 10−2 to 10−1. In the case of no bubbles, the transformer oil layer flow will increase the charge accumulation in the insulation paper by 4–5 orders of magnitude. So, the oil flow promotes the deterioration level of insulating paper.
- When the transformer oil is already in the laminar flow state, the effect of laminar flow velocity on charge accumulation is not obvious.
The internal environment of the transformer is sealed and time-varying, so it is difficult to measure the electric field and charge in real time. The state can be obtained by simulation calculation, which can provide a valuable reference for the study of transformer operation and insulation discharge characteristics.
In this paper, the problem of charge accumulation under the condition of 1:1 AC/DC composite voltage in laminar flow is studied. In UHVDC converter transformers, the conditions of oil temperature and oil flow velocity may make the fluid run in a turbulent state, and there are also many voltage ratios, which is also the direction of future extensions of this study. The subsequent research will use the parameters of the actual converter transformer and establish a 3D model in order to achieve more accurate results.
Author Contributions
Conceptualization, W.S. and H.L. (Hongshun Liu); methodology, W.S. and H.L. (Haibo Li); software, W.S. and X.G.; validation, W.S. and X.G.; formal analysis, W.S.; investigation, W.S. and H.L. (Haibo Li); resources, H.L. (Hongshun Liu) and H.L. (Haibo Li); writing—original draft preparation, W.S.; writing—review and editing, H.L. (Haibo Li) All authors have read and agreed to the published version of the manuscript.
Funding
This research was funded by Natural Science Foundation of Shandong Province, grant number ZR2021QE134.
Data Availability Statement
The raw data supporting the conclusions of this article will be made available by the authors on request.
Conflicts of Interest
Author Haibo Li was employed by the company State Grid Shandong Electric Power Company. The remaining authors declare that the research was conducted in the absence of any commercial or financial relationships that could be construed as a potential conflict of interest.
Abbreviations
The following abbreviations are used in this manuscript:
| UHVDC | Ultra-High-Voltage Direct Current |
References
- Shu, Y.B.; Chen, W.J. Research and application of UHV power transmission in China. High. Volt. 2018, 3, 1–13. [Google Scholar] [CrossRef]
- Rao, H.; Bing, L.; Li, X.L.; Cai, Z.Y.; Licheng, L.C. Development of ±800kV UHVDC Transmission Technology in China. In Proceedings of the 2008 International Conference on High Voltage Engineering and Application, Chongqing, China, 9–13 November 2008. [Google Scholar]
- He, D.X.; Guo, H.X.; Gong, W.J.; Xu, Z.; Li, Q.Q.; Xie, S.J. Dynamic behavior and residence characteristics of space charge in oil-paper insulation under polarity-reversal electric field. IEEE Trns. Dielectr. Electr. Insul. 2023, 30, 1021–1031. [Google Scholar] [CrossRef]
- Xiu, L.C.; Du, Z.Y.; Tian, Y.; He, J.X.; Cai, H.W.; Yi, F. Numerical calculation of transient electric field considering space charge in oil-paper insulation of converter transformers. Compel-Int. J. Comp. Math. Electr. Electron. Eng. 2022, 41, 155–171. [Google Scholar] [CrossRef]
- Zhu, Y.W.; Li, S.T.; Min, D.M.; Li, S.J.; Cui, H.Z.; Chen, G. Space charge modulated electrical breakdown of oil impregnated paper insulation subjected to AC-DC combined voltages. Energies 2018, 11, 1547. [Google Scholar] [CrossRef]
- Cui, Y.; Ma, H.; Saha, T.; Liu, Y.L. Hypothesis of Interfacial Charge Transportation in Oil-Paper Insulation for Transformer Moisture Estimation. In Proceedings of the 2019 IEEE power & energy society general meeting, Atlanta, GA, USA, 4–8 August 2019. [Google Scholar]
- Cheng, C.H.; Fu, M.L.; Wu, K.; Ma, Y.T.; Hao, Y.P.; Chen, C. Aging effect on interface charges between oil and oil immersed paper. IEEE Trns. Dielectr. Electr. Insul. 2021, 28, 1579–1587. [Google Scholar] [CrossRef]
- Zhang, R.; Zhang, Q.G.; Guo, C.; He, X.H.; Wu, Z.C.; Wen, T. Bubbles in transformer oil: Dynamic behavior, internal discharge, and triggered liquid breakdown. IEEE Trns. Dielectr. Electr. Insul. 2022, 29, 86–94. [Google Scholar] [CrossRef]
- Saleh, D.N.; Algwari, Q.T. Partial discharge features in a string of air bubbles floating in transformer oil. IEEE Trans. Plasma Sci. 2023, 51, 2117–2123. [Google Scholar] [CrossRef]
- Zhang, C.Y.; Wu, K.; Lv, Z.P.; Wang, X.; He, Y.F.; Wu, Y.; Chen, J.X.; Dai, J. Effects of oil flow on space charge behaviors in oil-paper composite insulation. IEEE Trns. Dielectr. Electr. Insul. 2022, 29, 1777–1784. [Google Scholar] [CrossRef]
- Raj, R.A. Space charge and its effects on oil-paper insulation in power transformers: A review. J. Electrost. 2023, 126, 103861. [Google Scholar] [CrossRef]
- Biswas, B.; Du, B.X.; Florkowski, M.; Hammarström, T.; Judd, M.D.; Koltunowicz, W.; Kordi, B.; Kuniewski, M.; Ma, G.; Pan, C.; et al. Trends in diagnostics and monitoring of high-voltage insulation. IEEE Electr. Insul. Mag. 2024, 40, 6–26. [Google Scholar] [CrossRef]
- Jia, Y.F.; Ji, S.C.; Bu, Z.W.; Yang, X.Y.; Li, S.M.; Zhu, L.Y. An insulation monitoring method for transformer windings based on electroluminescence effect. IEEE Trns. Dielectr. Electr. Insul. 2023, 30, 1294–1301. [Google Scholar] [CrossRef]
- Wang, L.J.; Qi, J.H.; Chen, Y.F.; Zhang, L.B.; Zhang, J.W. Reverse oil flow characterization in transformer windings: A fluid-thermal network approach. Energies 2025, 18, 1593. [Google Scholar] [CrossRef]
- Cheng, C.A.H.; Wu, K.; Fu, M.L.; Hao, Y.P.; Ren, S.Z.; Wu, J.F.; Wu, H. Interface charge barrier between oil and oil immersed paper. IEEE Trns. Dielectr. Electr. Insul. 2021, 28, 390–397. [Google Scholar] [CrossRef]
- Gao, L.; Xu, H.; Qin, Y.; Lv, Z.P.; Wu, K. Effect of insulating oil type on charge transportation at oil-paper interface. IEEE Trns. Dielectr. Electr. Insul. 2025, 32, 297–305. [Google Scholar] [CrossRef]
- Shi, S.L.; Hao, J.; Jian, Z.; Liao, R.J. DC electric field effect on conductivity and interface charge of oil-paper insulation. IEEE Trns. Dielectr. Electr. Insul. 2023, 30, 1525–1533. [Google Scholar] [CrossRef]
- He, D.X.; Geng, P.; Liu, H.S.; Xu, Z.; Li, Q.Q.; Xie, S.J. Space charge characteristics of electrothermally aged oil-paper insulation under slightly nonuniform electric field. IEEE Trns. Dielectr. Electr. Insul. 2023, 30, 1125–1134. [Google Scholar] [CrossRef]
- Che, L.; Wu, J.D.; Zhou, G.Y.; Yin, Y.; Wang, Q.H. Effect of moisture content on space charge behavior in oil-paper insulation under dc electric field. IEEE Trns. Dielectr. Electr. Insul. 2020, 27, 1570–1577. [Google Scholar] [CrossRef]
- Ma, Y.T.; Lv, Z.P.; Zhang, Y.N.; Peng, J.Y.; Ge, Y.; Wu, K.; Cheng, Y.H. Analysis of space charge and current characters of oil-immersed-paper with simultaneous measurement. AIP Adv. 2024, 14, 85014. [Google Scholar] [CrossRef]
- Chi, C.; Yang, F.; Ren, Z.X. The movement characteristics of space charge in flowing transformer-oil. IEEE Trans. Magn. 2021, 57, 8401305. [Google Scholar] [CrossRef]
Disclaimer/Publisher’s Note: The statements, opinions and data contained in all publications are solely those of the individual author(s) and contributor(s) and not of MDPI and/or the editor(s). MDPI and/or the editor(s) disclaim responsibility for any injury to people or property resulting from any ideas, methods, instructions or products referred to in the content. |
© 2025 by the authors. Licensee MDPI, Basel, Switzerland. This article is an open access article distributed under the terms and conditions of the Creative Commons Attribution (CC BY) license (https://creativecommons.org/licenses/by/4.0/).