1. Introduction
The implementation of variable renewable energy sources (VRES) requires careful planning regarding plant deployment, location, and storage capacity to ensure grid stability. Studies have shown that solar photovoltaic (PV) penetration above 50% can lead to significant curtailment and low energy prices, highlighting the need for market reforms to efficiently balance supply and demand [
1]. Strategic overbuilding of PV capacity combined with proactive curtailment has been proposed as a cost-effective approach to deliver reliable and dispatchable renewable power, particularly when integrated with wind generation [
2]. In addition to economic considerations, technical challenges such as voltage fluctuations, reactive power imbalances, and transformer overloading must be addressed. Solutions such as Static Synchronous Compensators (STATCOMs) and battery storage have proven effective in mitigating these issues, especially in small or isolated grids [
3]. Advanced control strategies such as multilayer event-triggered management systems can further optimize microgrid operations by dynamically coordinating generation, storage, and load curtailment while minimizing operational costs [
4]. These approaches are particularly critical for island grids, where isolation heightens reliability risks; in these scenarios, optimally configured renewable generation and storage systems can reduce curtailment and enhance grid stability [
5].
However, the inherent variability of wind and solar generation can still threaten grid reliability in scenarios with large VRES penetration, increasing the risk of power failures. Research indicates that high renewable integration affects frequency stability and system resilience, requiring improved forecasting, flexible generation, and storage solutions to mitigate risks [
6]. This challenge is especially pronounced in small or isolated grids such as island networks, where intermittent renewables introduce additional complexities. Case studies highlight that tailored solutions such as energy storage and microgrids are essential to maintaining stability while ensuring sustainable energy access in these constrained systems [
7].
Recent studies have further refined these strategies by focusing on the optimal distribution of storage units to counteract renewable intermittency and enhance grid stability. For instance, Matthiss et al. [
8] investigated storage placement in distribution grids with high PV penetration, demonstrating how strategically located storage can alleviate transmission stress and improve overall grid performance. Similarly, Zhu et al. [
9] explored battery storage siting for transient voltage stability, showing that well-placed storage significantly reduces voltage fluctuations and bolsters system reliability. Advanced optimization techniques have also been applied to this challenge; Montoya et al. [
10] proposed a metaheuristic optimizer to determine the ideal placement and sizing of PV sources in distribution grids, offering a robust method to harmonize generation and storage. Hoosh et al. [
11] assessed the economic value of storage placement by integrating multiple grid applications, proving that distributed storage enhances both operational efficiency and cost-effectiveness. Additionally, Massucco et al. [
12] presented a unified framework for optimizing storage siting and sizing across transmission and distribution systems, highlighting its dual role in reserve provision and grid support. Collectively, these studies underscore the critical importance of optimized storage deployment in building resilient power systems. The work presented here expands on these findings by introducing an alternative integrated approach that minimizes blackout risks while maintaining high efficiency in grids with substantial VRES penetration.
Previous publications have analyzed the blackout risk in scenarios with a large fraction of generation coming from wind [
13] and solar [
14] based on the ORNL-PSERC-Alaska (OPA) model for self-organized criticality in power grid blackouts [
15,
16]. Unlike traditional power system models commonly used in electrical engineering, which focus on detailed physical representations of the grid components such as wind turbines [
17] or hydrogen energy storage systems [
18], the OPA model adopts a self-organized criticality framework that reproduces the statistical characteristics of blackouts. Setting aside the specific dynamics of the components, it considers the key ingredients to reproduce these statistics, such as the transmission grid structure, generation and consumer buses, power flow balance, periodic dispatches, system failures, secular demand growth, and demand fluctuations along with VRES variability. This alternative approach has the advantage of capturing emergent system-wide behaviors such as cascading failures and long-range correlations that are often overlooked by more detailed deterministic models, offering a complementary perspective for optimizing the amount and location of storage.
In detail, the dynamics of the OPA model include a secular constant increase in demand which triggers blackouts due to lines being overloaded, generation being insufficient, or system failures taking place randomly. It also includes daily demand variability and random failures of non-overloaded lines. After a failure has taken place, affected lines are upgraded or generation capacity is increased. As a result, the dynamics bring the system to a critical state in which random failures may trigger cascading blackouts. The size and frequency of the obtained blackouts can then be used to estimate the overall blackout risk of the network. The OPA model has been validated with blackout data from the Western Interconnection in the USA [
19].
In particular, ref. [
14] analyzed grid resilience and stress in scenarios with an increasing penetration of solar generation in the Balearic Islands power grid and considered the fraction of daily demand covered by solar generation as an indicator of the VRES performance. For simplicity, it considered all solar plants as being equal and managed as follows: plants aim to provide constant generation over one-month periods; to cope with the intrinsic weather variability, they are assigned a given storage capacity. For simplicity, a model of the solar generation variability based on a Gaussian fit to the available data was used, and it was found that the storage required in each plant was equivalent to the generation over
days.
Because energy storage is very expensive, this work introduces a more flexible management procedure to reduce requirements. Specifically, solar plants are not committed to produce the same generation every day of a month, only the expected generation of that day. In addition, only a fraction of the solar plants have storage capability. To compensate for demand fluctuations and overall solar variability, plants with storage can offer their daily generation plus their stored energy. Moreover, because the Gaussian fit for the solar generation variability underestimates the number of days with large amounts of insolation, a more accurate fitting method is introduced. As a result, configurations are identified that feature an optimal distribution of solar plants and storage that is capable of meeting about of demand with solar generation while maintaining a low risk of blackouts. The rest of the demand should be covered by current conventional plants and a high-voltage direct current (HVDC) submarine cable to the mainland. Furthermore, a possible operation is discussed in which all conventional power plants in the Balearic Islands are shut down and generation relies only on solar plants and the HVDC cable connection to the mainland, which has a capacity of only of the currently installed total generation capacity.
The rest of this paper is structured as follows.
Section 2 briefly summarizes the OPA model and the risk measures, then introduces a more accurate fitting method for the solar variability along with a more flexible procedure for power plant management.
Section 3 analyzes different scenarios in which solar plants cover a large fraction of the demand while the rest is covered by the current conventional plants and HVDC cable to the mainland. The analysis focuses on the optimal cases in which solar generation covers approximately
of the demand, the blackout risk is lower than in the current baseline scenario, and the required amounts of solar plants and storage are minimized.
Section 3.2 examines a scenario in which generation relies solely on solar power and the HVDC cable connection to the mainland.
Section 3.3 considers with the impact of the spatial distribution of solar variability.
Section 4 contains an overall discussion of the results. Finally, some concluding remarks are provided in
Section 5.
2. Materials and Methods
2.1. The OPA Model
The OPA model describes the power flow dynamics in the transmission grid using a standard direct current (DC) approximation. It considers both fast and slow timescales. The fast timescale effectively describes line overloads and outages resulting from generation dispatch, which may trigger blackouts. The slow timescale describes the evolution over years, in which the demand in each grid node increases secularly ( daily growth, which corresponds to approximately annually), and also includes daily random variations.
The model assumes that overloaded lines can fail immediately with a probability . A line connecting nodes i and j is considered overloaded at time t if the dimensionless ratio of the power flow transmitted at that time to the flow limit reaches the value . In addition, non-overloaded lines can also fail over time due to random events with a probability rate .
The dynamics are as follows: every day, power is dispatched to cover the demand, giving VRES generation preference over conventional plants; in the event of a line failure, power is repeatedly re-dispatched using the remaining available lines until no more line failures take place. The final dispatch may not be able to provide power to all grid nodes, that is, there may be a load shed . This event is considered a blackout if the dimensionless ratio of to the total power demand is larger than . On the day after a blackout, overloaded and outaged lines are upgraded by increasing the flow maximum capacity by a factor .
To cope with the secular demand increase, generators are upgraded yearly by a fixed percentage () if the generation capacity margin (where is the total generation capacity) averaged over a year decreases below a critical value .
All simulations in this study were performed using a custom implementation of the OPA model, developed entirely in C/C++ without reliance on commercial software. The fast-timescale blackout dynamics are modeled through an iterative process of cascading line failures and solved using a DC load flow approximation. Power dispatches at each iteration are computed by minimizing a cost function that includes generation costs and a high penalty for load shedding [
15,
16,
20]. This optimization problem is solved using a simplex algorithm based on the open source C++ library CLP specifically adapted for the problem structure, including constraints on nodal power balance, generation limits, and transmission line capacities. The overall simulation framework includes routines for both the fast (cascading failures) and slow (network upgrade and demand growth) dynamics, allowing for long-term evolution studies. Simulations were executed on a high-performance computing cluster, with each run comprising tens of thousands of blackout cycles to ensure statistical robustness.
2.2. Stress and Risk Indicators
The overall stress and risk computed from numerical simulations over extended periods (
days) are used as indicators of grid vulnerability. The overall stress is defined as
where
N is the number of power lines and angle brackets and
indicates averages over the time duration of a simulation. Because the line stress values
are dimensionless and have a maximum value of 1 at any time,
is also dimensionless and cannot exceed 1.
The risk is an indicator of the economic cost caused by blackouts. For each blackout, the cost is taken as proportional to the lost energy, which can be computed as the load shedding
times the duration of the blackout. The duration of a blackout is assumed to be proportional to its relative size
. Thus, the risk is evaluated as
where
is the probability density distribution of having a blackout of size
S. In general, it is difficult to determine the value of the proportionality constant
A. Normalizing the risk to the case without VRES yields a dimensionless quantity and avoids the evaluation of
A. As discussed in [
14], the risk has similar properties to the standard System Average Interruption Frequency Index (SAIFI), which measures the average number of interruptions that a customer experiences.
2.3. The Balearic Islands Transmission Network
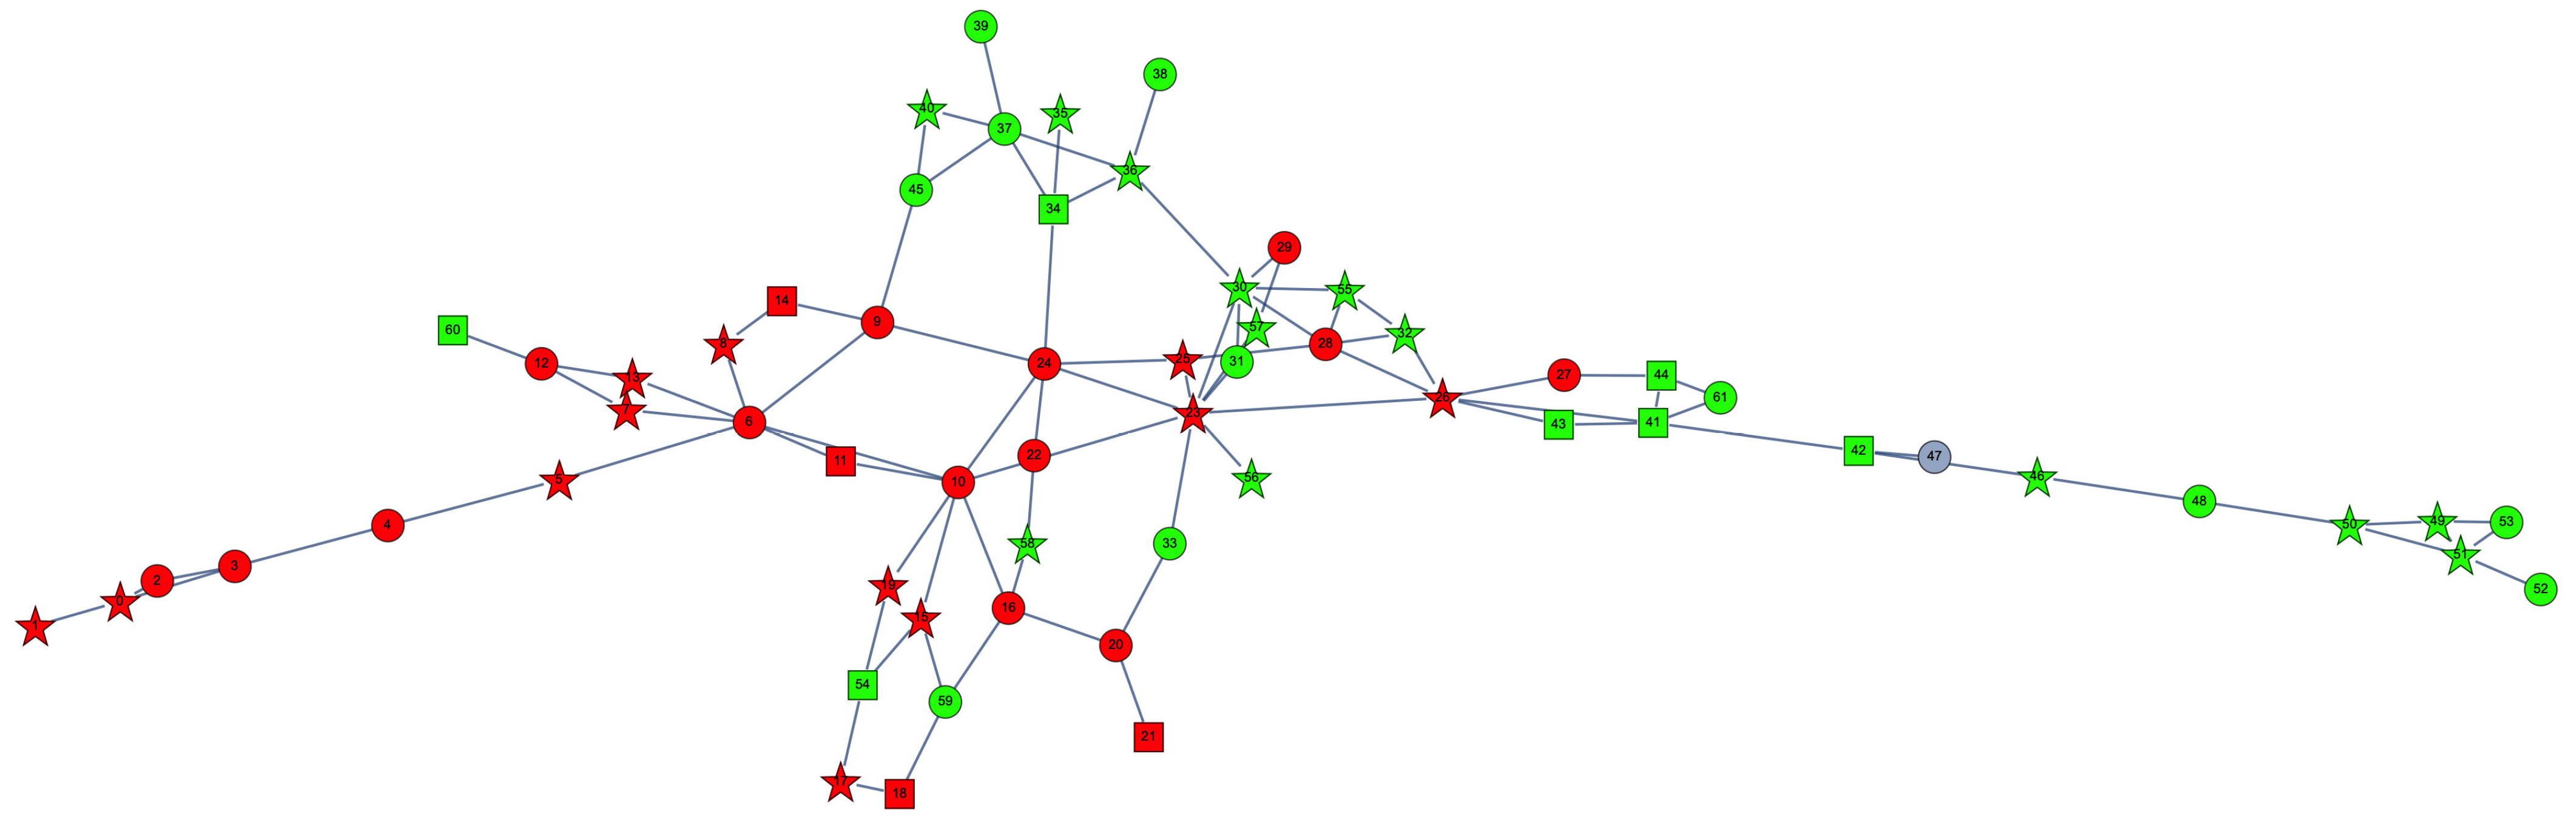
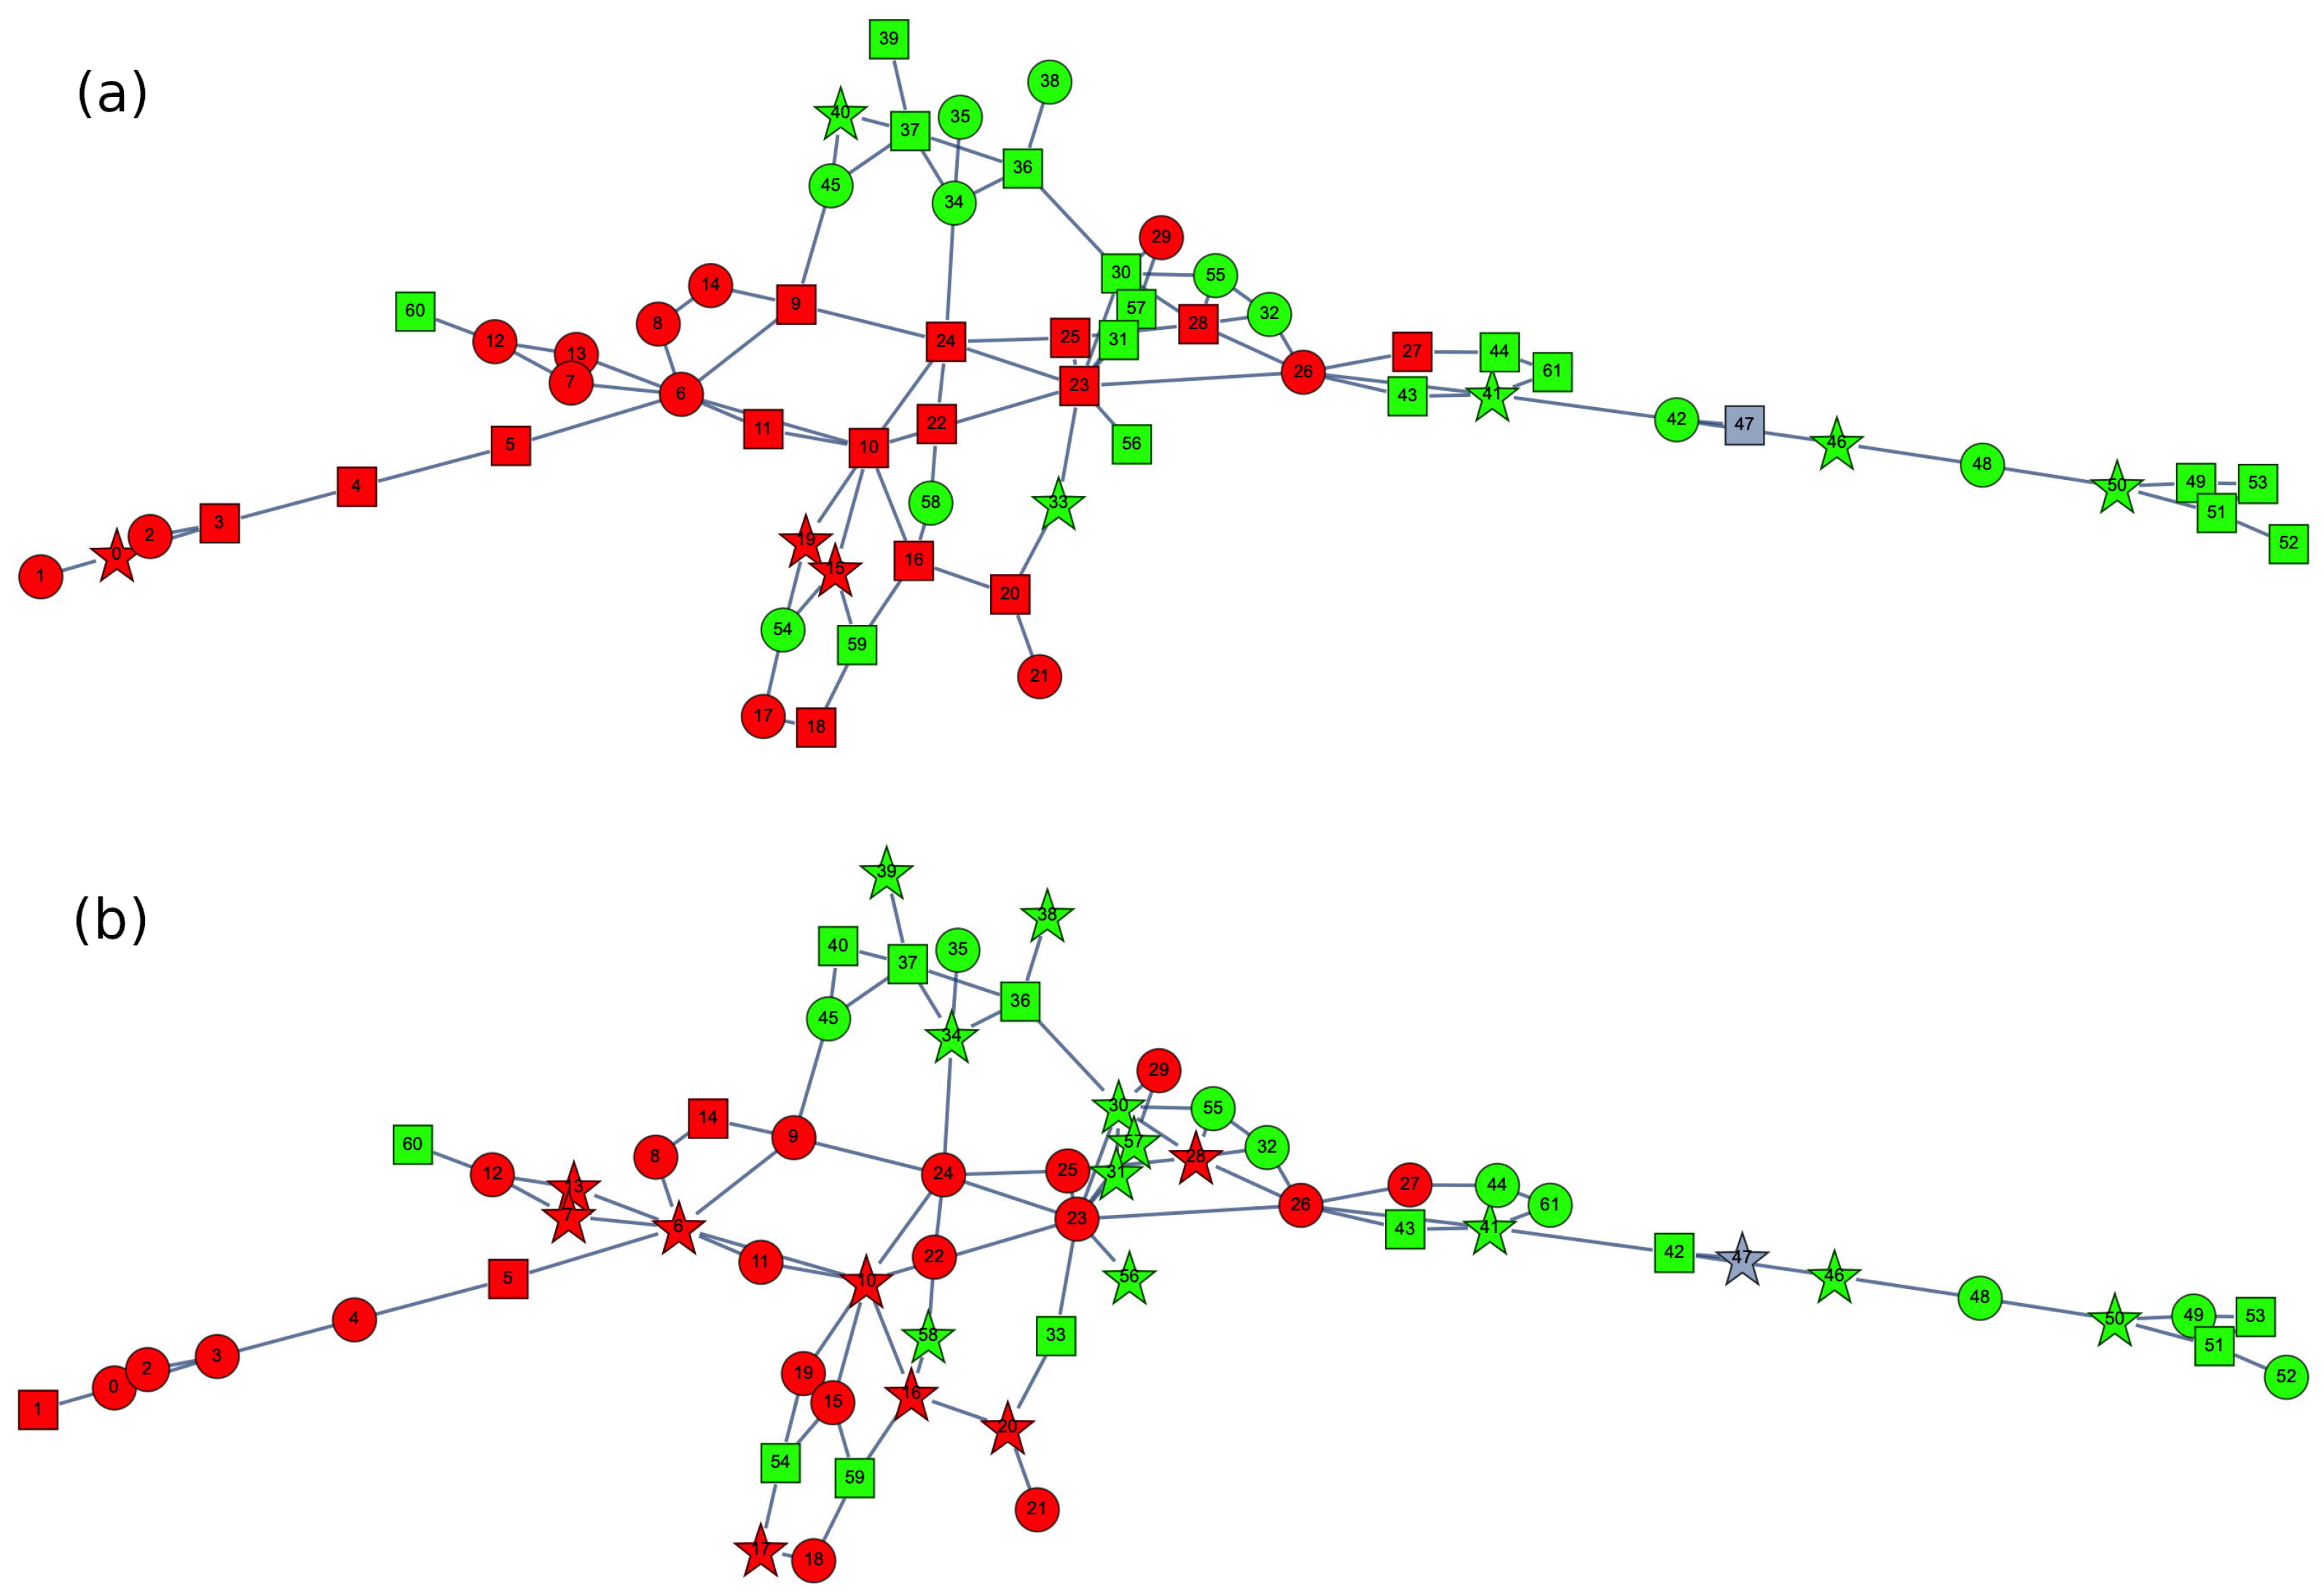
Figure 1 shows the schematic representation of Balearic Islands transmission grid considered here based on information on the location of power plants and substations provided through the website of the Spanish Transmission System Operator, Red Eléctrica de España [
21]. The grid covers the four main islands of Minorca, Mallorca, Ibiza, and Formentera, interconnected by alternate current (AC) submarine cables, which for the purpose of the model are considered as regular overhead AC lines. The grid has a total of 62 nodes interconnected by 89 transmission lines. In addition, there is a connection to the mainland grid through an HVDC submarine cable. For simplicity, this cable is represented by an equivalent conventional plant located at the node where the cable is connected (the gray circle in
Figure 1).
2.4. Solar Plant Generation Variability
A synthetic solar generation model based on [
14] is used here, consisting of a monthly base value to capture seasonal variability combined with a stochastic term representing daily variability.
As discussed in [
14], installed solar capacity that is sized to match the annual average proves insufficient during the winter months. To address this, source redundancy is introduced by duplicating the monthly base generation from November to February. For simplicity, the additional installed capacity is assumed to remain unused during the rest of the year, although excess generation could potentially be exported through the HVDC cable or stored using long-term storage technologies such as hydrogen, as noted in [
14].
Shifting the focus to daily variability, the analysis uses empirical power generation data measured at a rooftop solar plant owned by the Consell Insular de Menorca (CIME). Measurements were taken every 15 min for a time span close to 3 years.
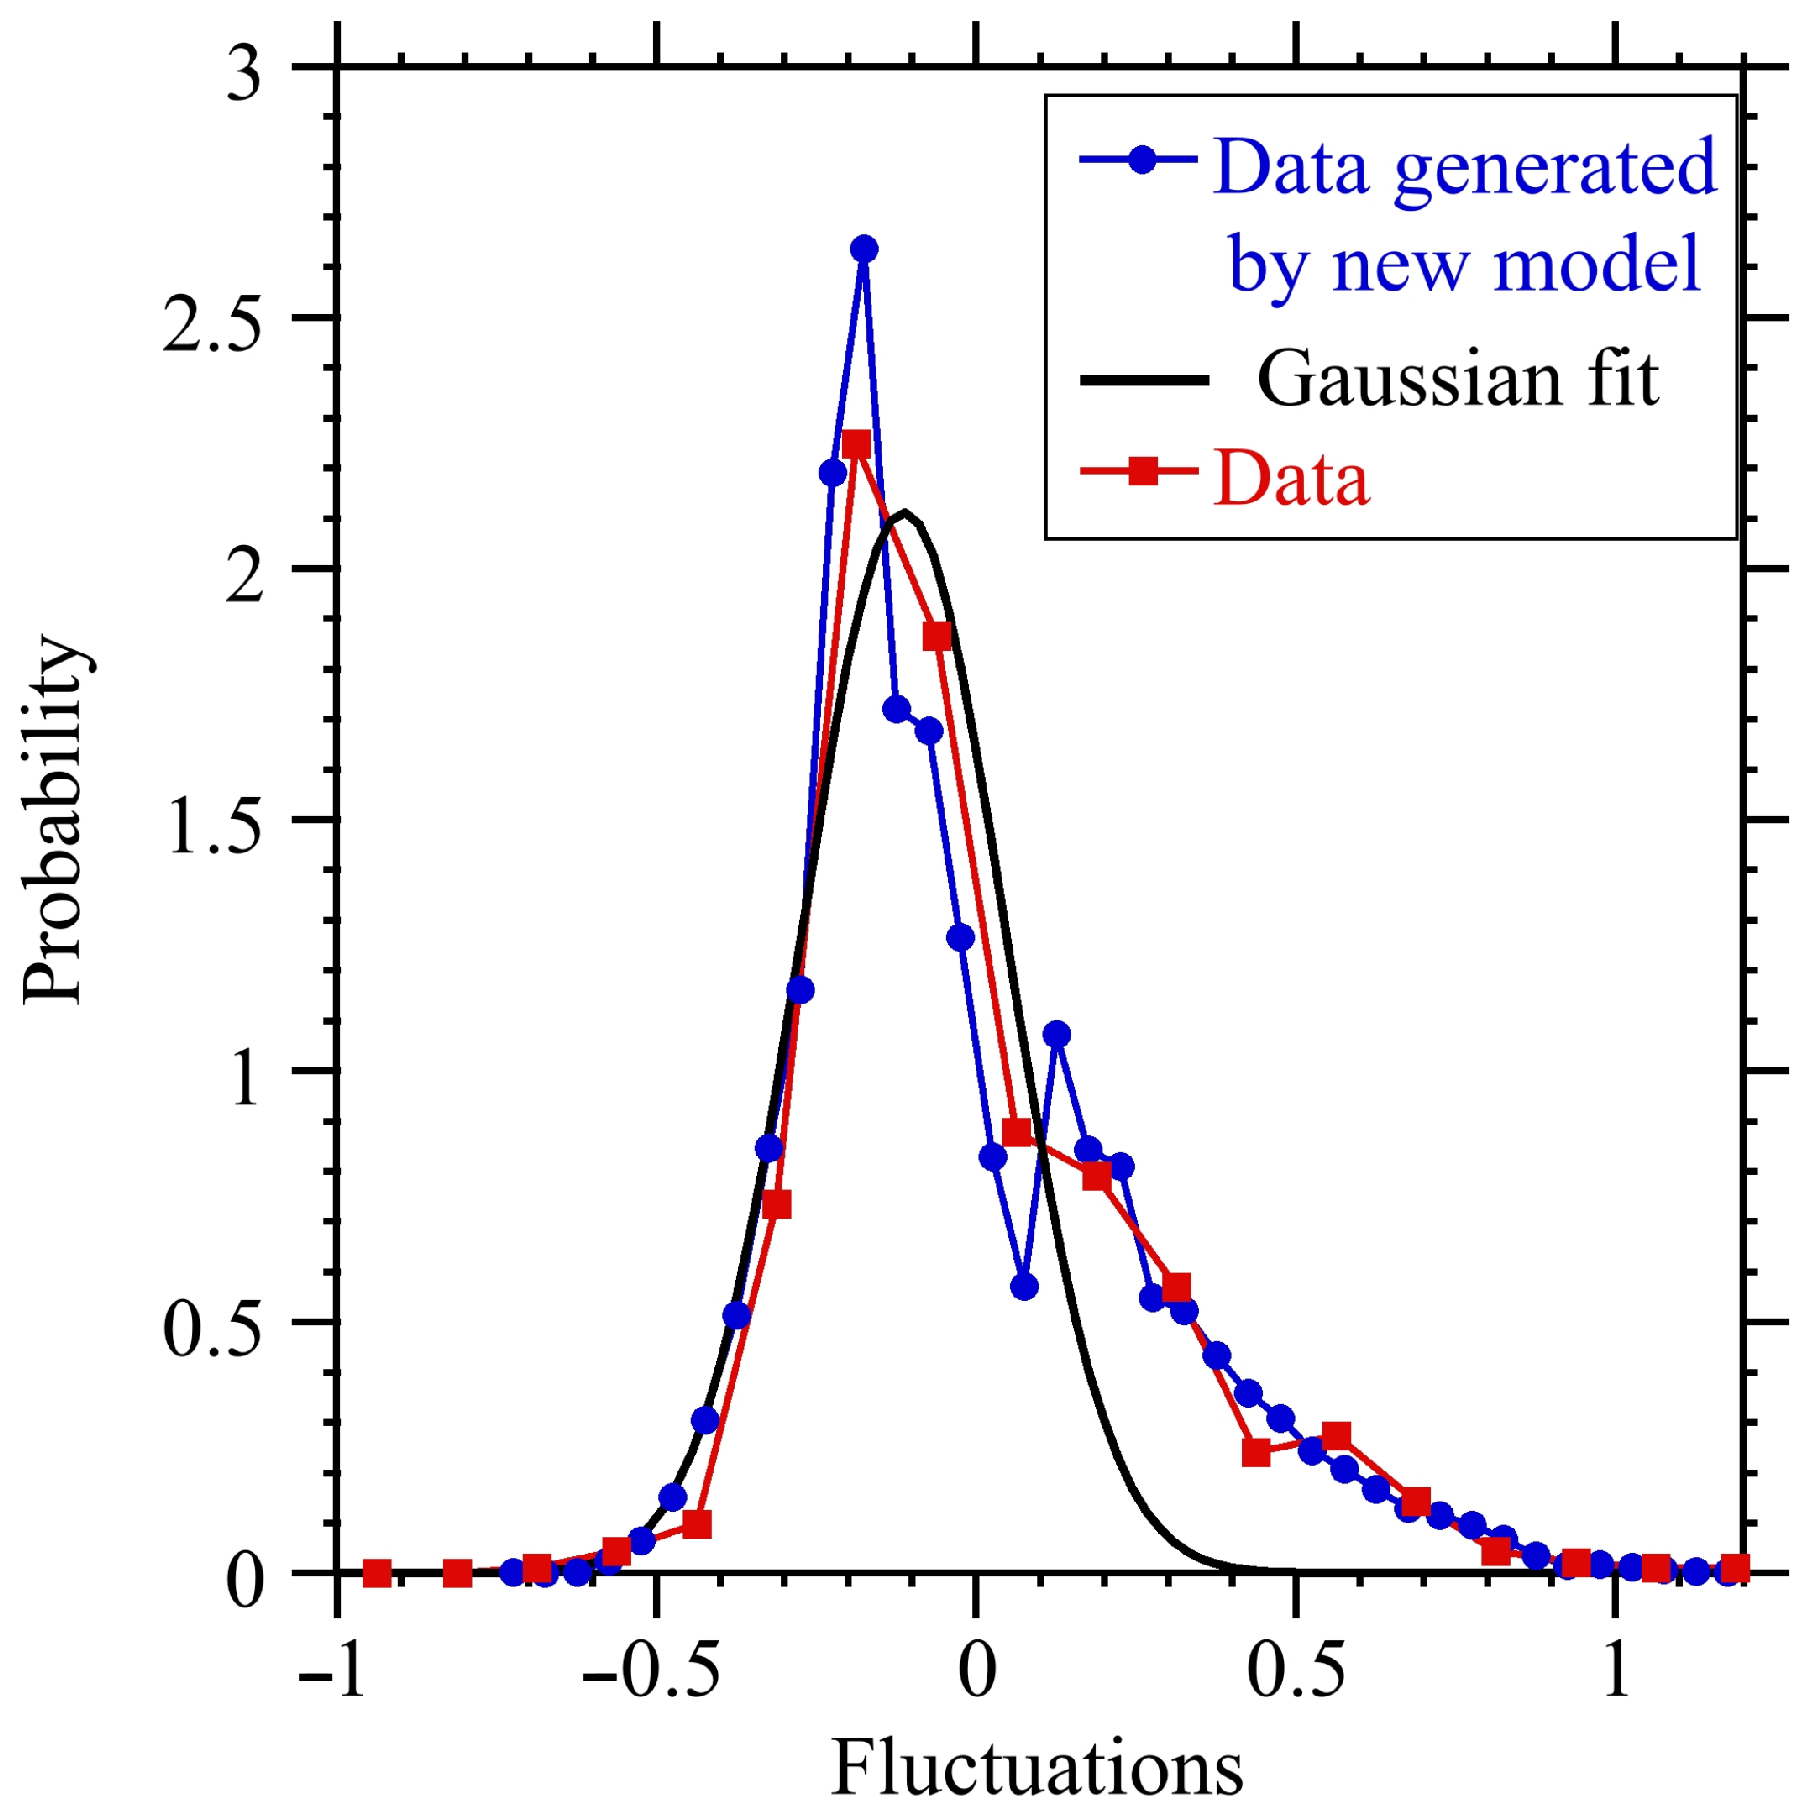
Figure 2 shows the distribution of the solar daily generation with respect to the averaged annual generation (red symbols). For simplicity, in [
14] this distribution was fitted using a Gaussian fit (black line). Gaussian fitting works well for negative fluctuations, but underestimates positive fluctuations, as shown by the right tail in the figure; as a consequence, when performing simulations with the fitted Gaussian distribution for the daily fluctuations, the amount of days with large generation falls short. To address this issue, a new model for the daily fluctuations is considered here based on the combination of two Gaussian distributions. A distribution generated with this new model is plotted with blue symbols in the figure. The new model fits both the left and right tails of the distribution quite nicely.
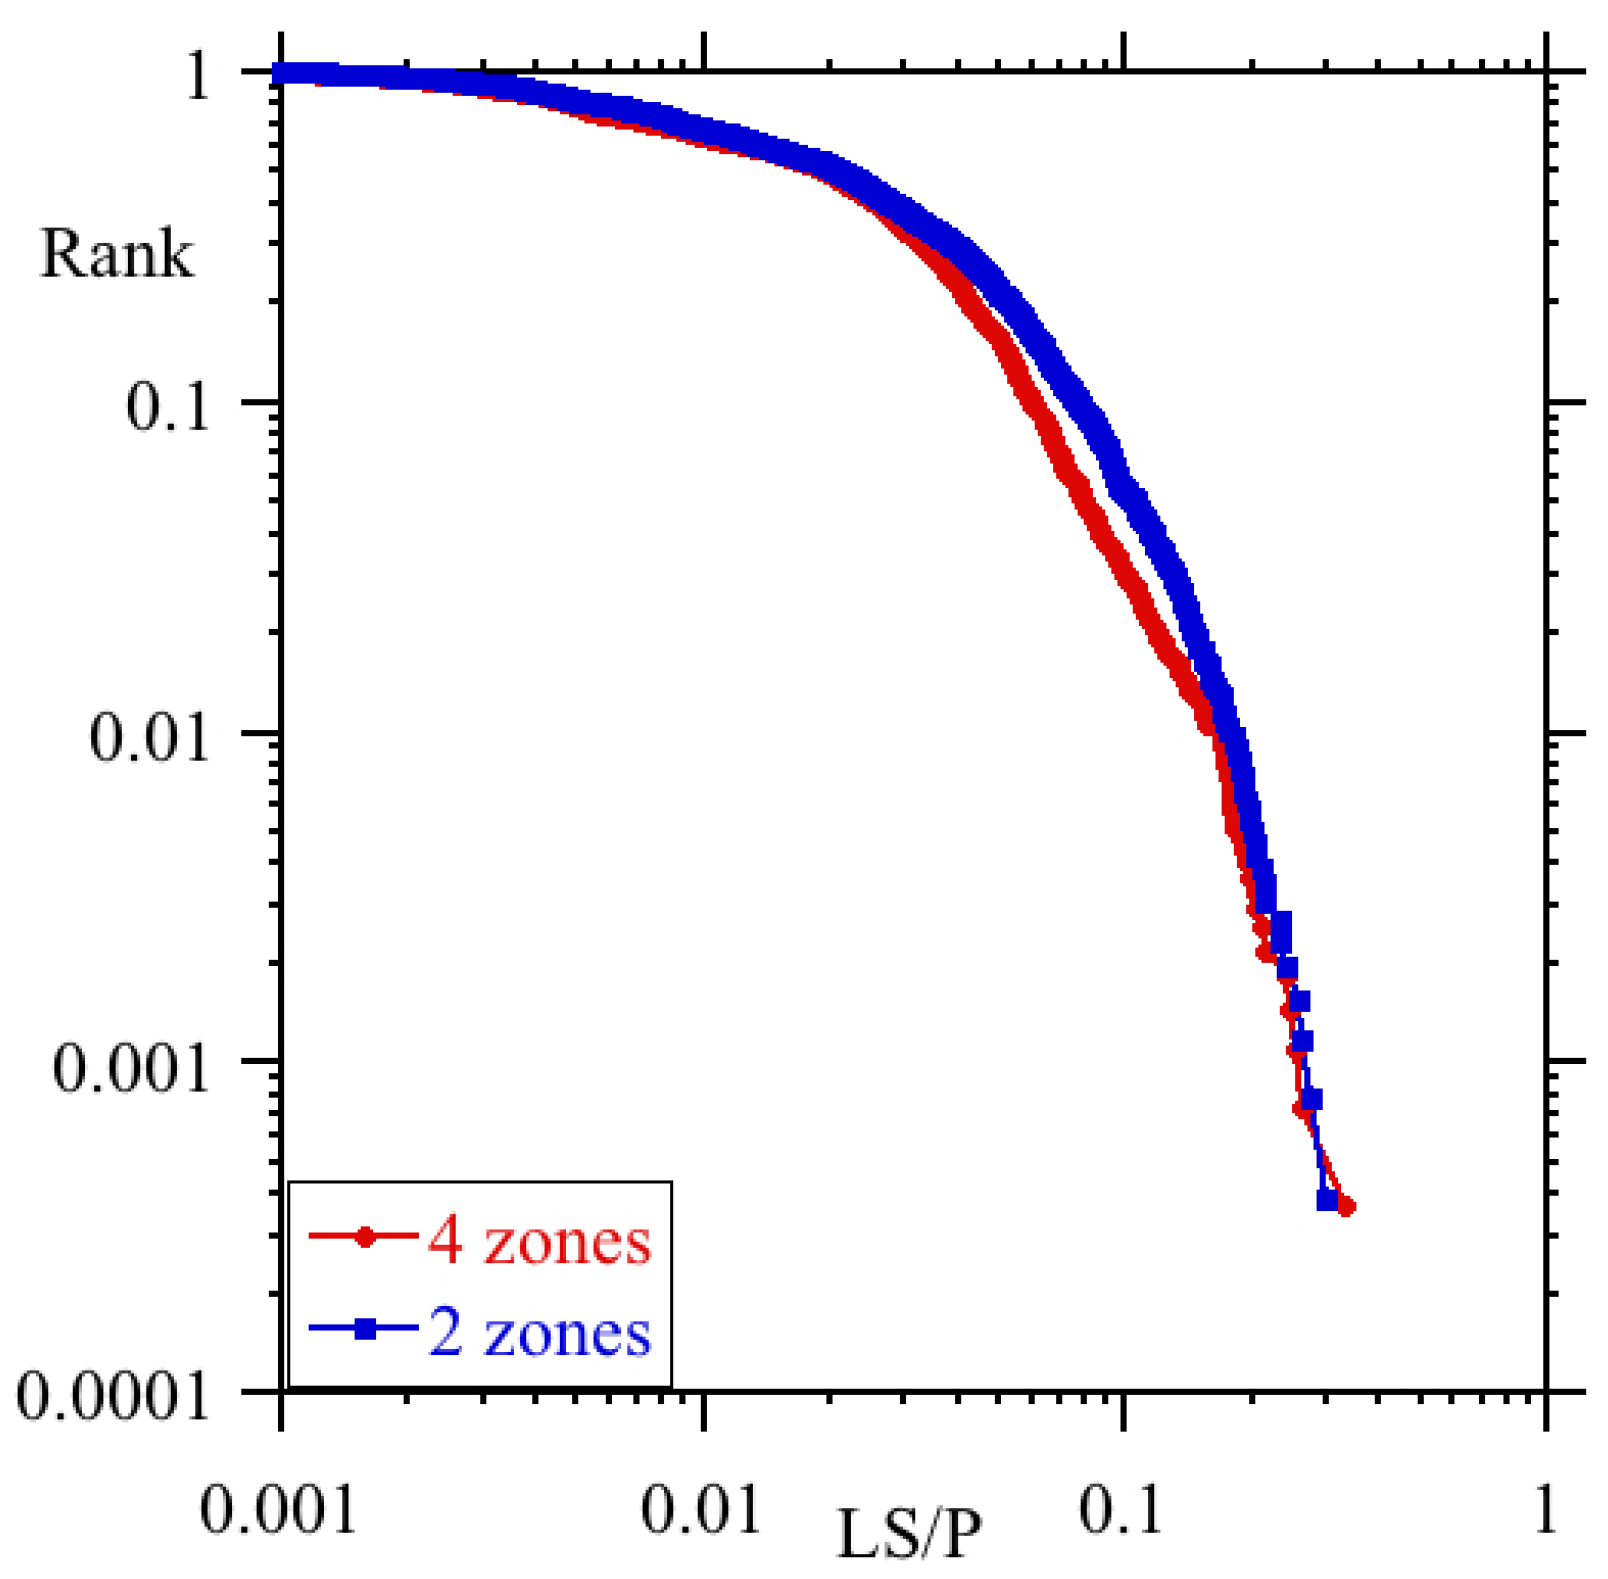
For simplicity, the solar plants are assumed to be randomly distributed across the nodes of the transmission grid, as illustrated in
Figure 1 for one specific case. An important question when dealing with distributed solar generation is the spatial correlation length of solar variability. Because the territory covered by the Balearic Islands is relatively small, strong correlation can occur across many locations. This is taken into account by grouping the solar plants into two sets (shown in green and red), with plants within each set experiencing identical solar variability. The solar variability between the two sets is uncorrelated.
2.5. Solar Power Plant Storage and Management
To smooth the solar generation variability discussed in the previous subsection, a certain amount of storage capacity is assumed to be available. In [
14], an analysis was conducted on a scenario where all solar plants aim to provide the monthly base generation every day. This scenario requires a minimum storage capacity equivalent to
times the nominal daily capacity in order to compensate for the variability of generation. On days when actual generation is lower, solar plants draw from storage if available. On days when actual generation exceeds demand, the surplus is either stored or curtailed if storage is full.
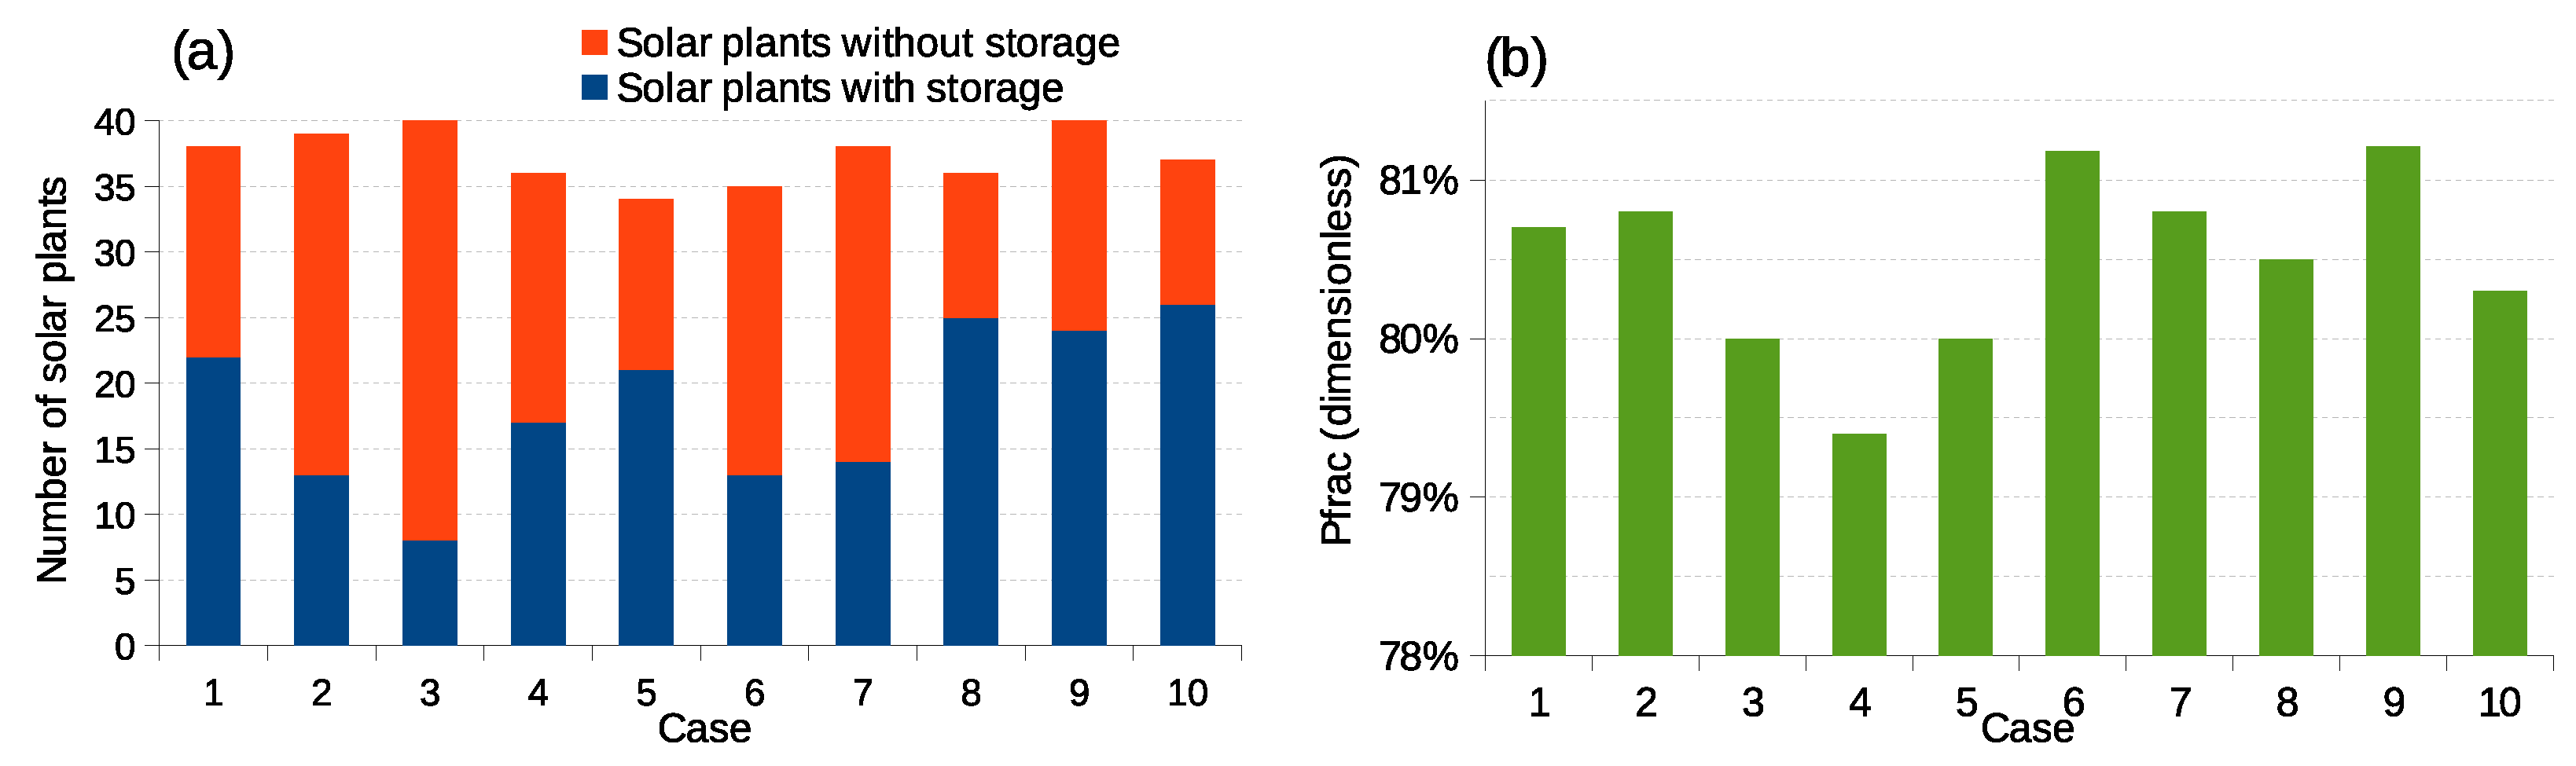
Because storage is expensive, a more flexible scheme is considered here in which only a fraction of the solar plants have storage capacity. The optimal distribution of plants with storage is analyzed. Solar plants without storage provide daily generation capacity equivalent to the solar output on that day, while solar plants with storage provide daily capacity equal to the solar generation plus the energy stored in the battery. Dispatch allocates generation between conventional and solar plants, ensuring that total generation matches total demand and does not exceed the maximum capacity of any plant or line. Due to their lower generation cost, solar plants are prioritized in dispatch over conventional plants.
2.6. Peak Demand and Blackout Data
A daily synthetic peak demand for the OPA model is constructed as follows: first, actual power demand data for the Balearic Islands, which is publicly available from the Red Eléctrica de España website [
22], is used. Specifically, the daily peak data are employed to fit a sixth-order polynomial using least squares fitting [
14], resulting in a smooth annual profile that captures seasonal variations. Second, the smooth profile is adjusted to include secular demand growth (a
daily increase) and random demand fluctuations drawn from a Gaussian distribution with zero mean and variance matching that of the deviations between actual daily peak demand and the smooth annual profile. Third, the daily aggregated peak demand is distributed among the different buses according to the relative weight reported in [
23].
There is very limited public information on blackouts involving the Balearic Islands. No official sources providing detailed blackout data or cascade propagation have been found. For the OPA model, the parameter
days
−1 is adopted from [
14], where it was determined by fitting the probability of large blackouts (exceeding
of total demand) to press reports. Additionally, parameters
and
are taken from [
19], which analyzed blackout cascades in the US power grid.
2.7. Workflow for Implementing the Methodology
This subsection outlines the sequence of steps required to determine the optimal number and placement of solar plants along with the corresponding storage capacity for a given transmission power grid using the proposed simulation-based methodology.
Grid Setup and Parameter Initialization: Begin by constructing a digital representation of the transmission network, specifying the topology (nodes and transmission lines), generation capacities, and load distributions, as was done for the Balearic transmission grid in
Section 2.3. Define the OPA model parameters for the line failure probabilities (
,
), upgrade factor (
), demand growth rate, and solar generation characteristics based on available data. For example, see [
14] for the case of the Balearic transmission network.
Demand and Solar Variability Modeling: Generate synthetic daily demand profiles incorporating secular growth and stochastic fluctuations based on empirical data. Construct synthetic solar generation profiles by combining seasonal variation with daily stochastic fluctuations modeled using a mixture of Gaussian distributions, as discussed in
Section 2.4.
Solar Plant and Storage Allocation: Define candidate configurations with different numbers and locations of solar plants in a Monte Carlo fashion, with a subset of them including storage. Assign the spatial correlation structure of solar variability across zones as explained in
Section 2.4.
Simulation of Grid Dynamics: For each candidate configuration, simulate the long-term evolution of the power system using the OPA model, as described in
Section 2.1. The model operates over fast and slow timescales to capture cascading failures, re-dispatch, upgrades, and demand growth. Power dispatches are computed using a simplex algorithm adapted to minimize generation cost and load shedding under DC load flow constraints.
Evaluation of Stress and Risk: Compute the overall stress
and blackout-induced risk based on the size and frequency of cascading failures, as described in
Section 2.2. Use these metrics to quantify system performance and vulnerability.
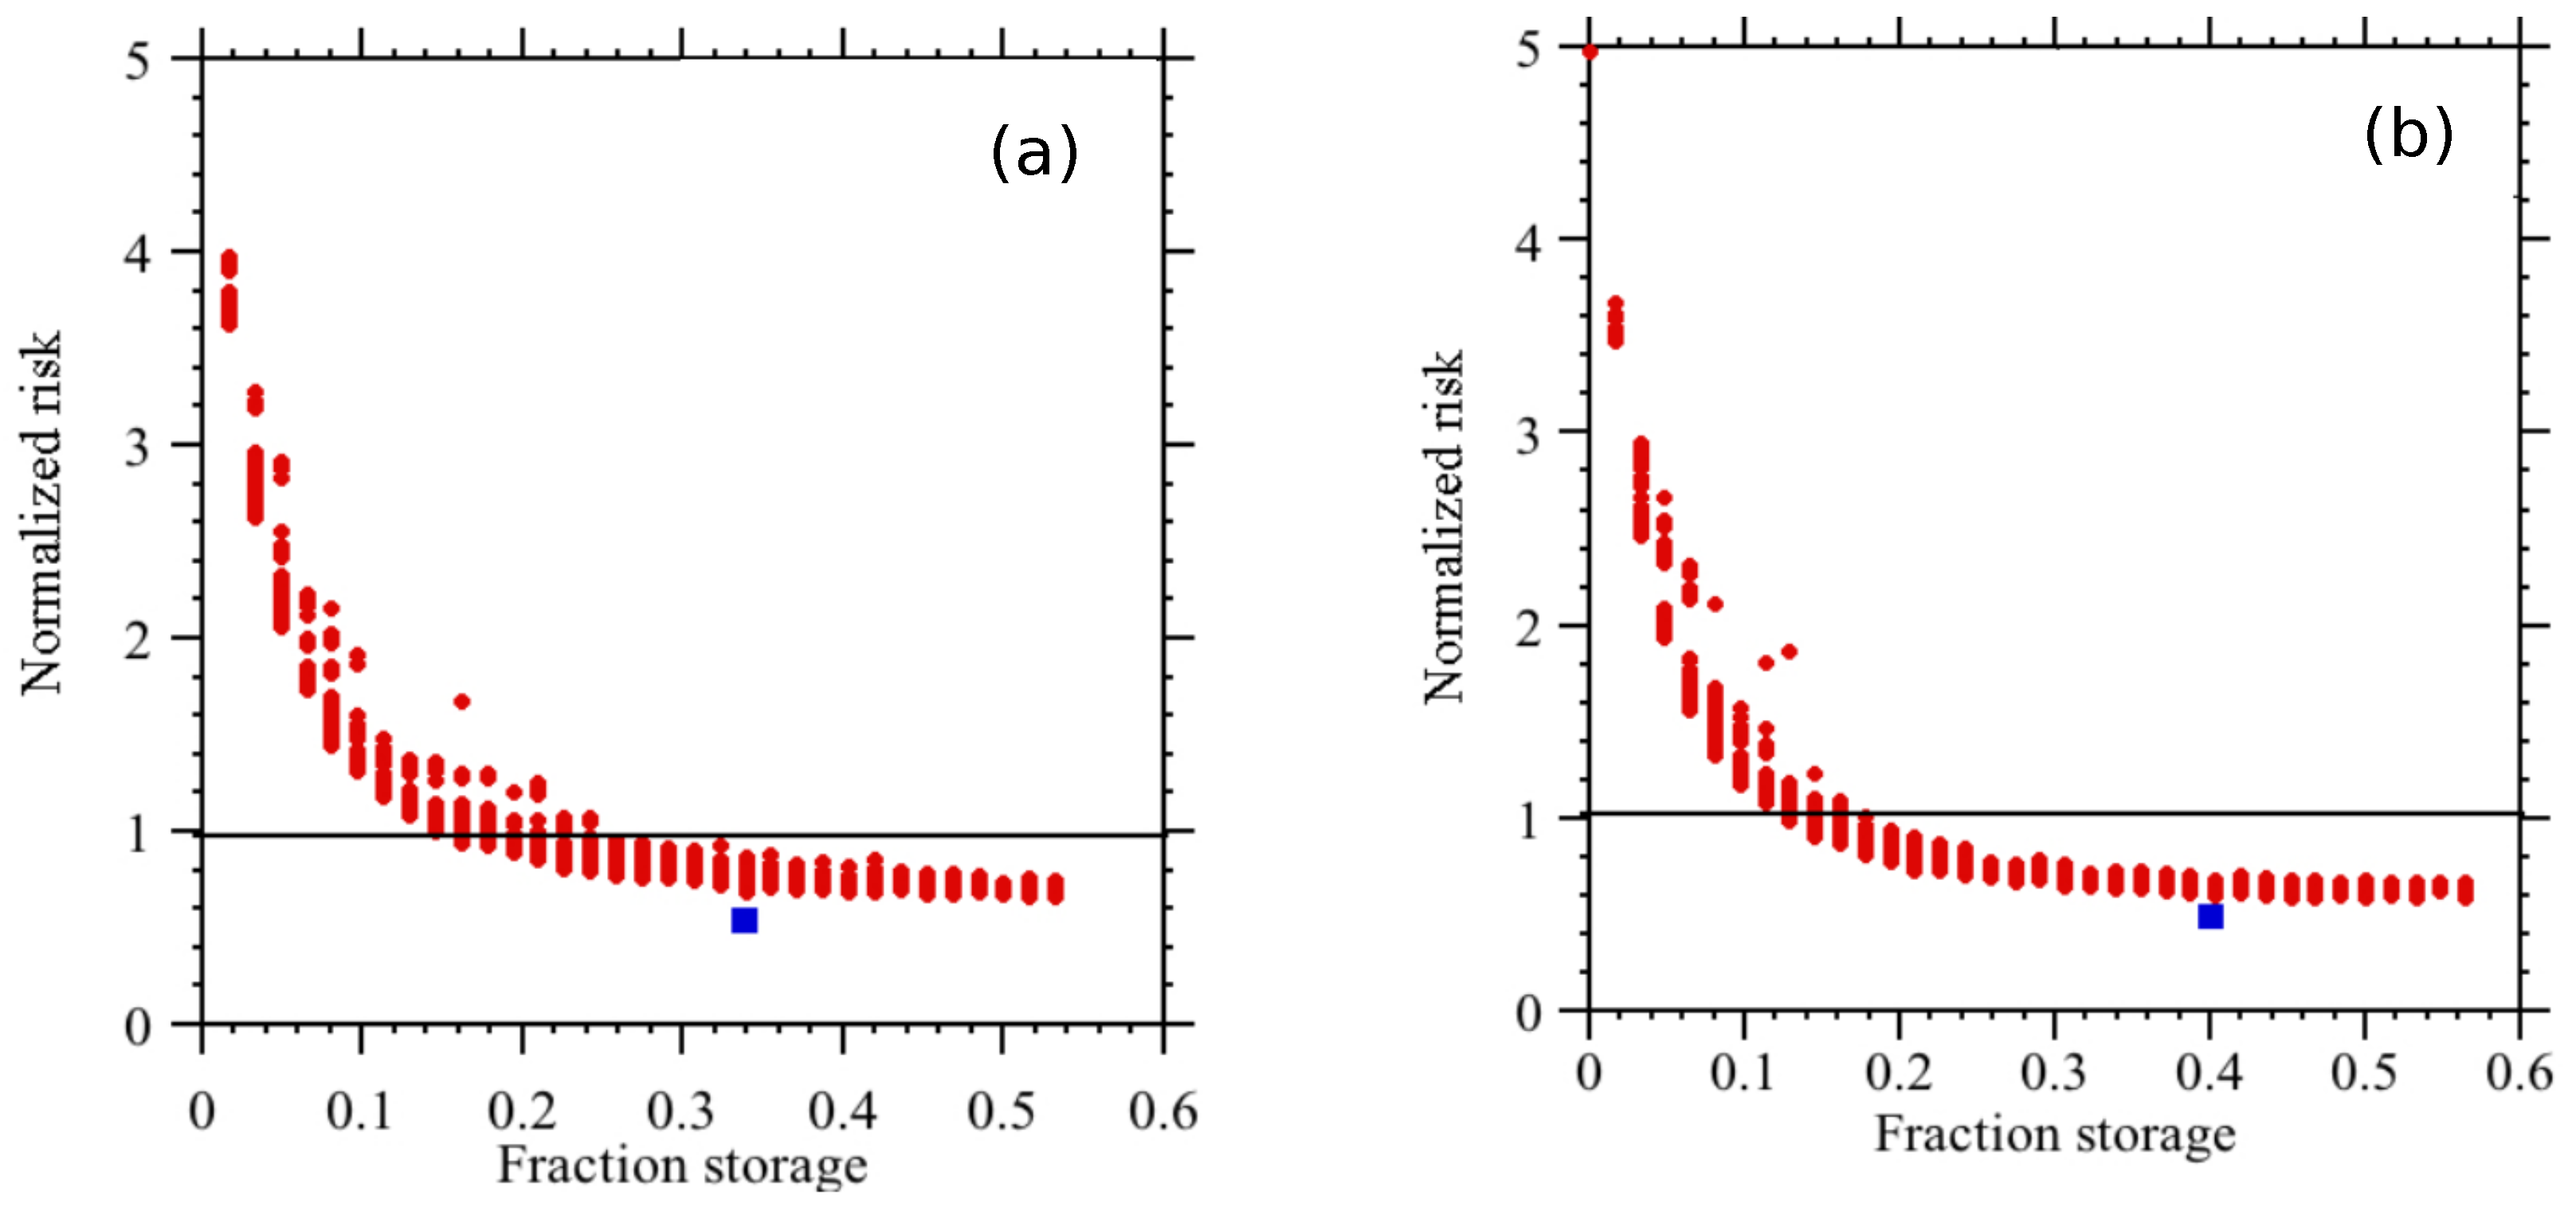
Optimization Loop: Explore the space of possible configurations by varying the number and placement of solar plants and storage. Identify the configuration(s) that minimize the total amount of required storage while keeping the blackout risk below a defined threshold (e.g., the baseline risk without VRES).
This workflow provides a comprehensive, data-informed, and computationally robust method to guide the integration of solar power and storage into existing grids. It leverages the statistical power of the OPA model to evaluate systemic responses that are often missed by deterministic models, offering a powerful tool for planning resilient energy systems in the context of high renewable penetration.
4. Discussion
Optimization of the distribution of solar plants and storage in power grids has been explored using the Balearic Islands transmission grid as a case study, with the goal of achieving high penetration of VRES. By applying the OPA model, optimal configurations can be identified that minimize blackout risk while enhancing efficiency and reliability. These configurations require only a small fraction of the storage originally assumed in [
14].
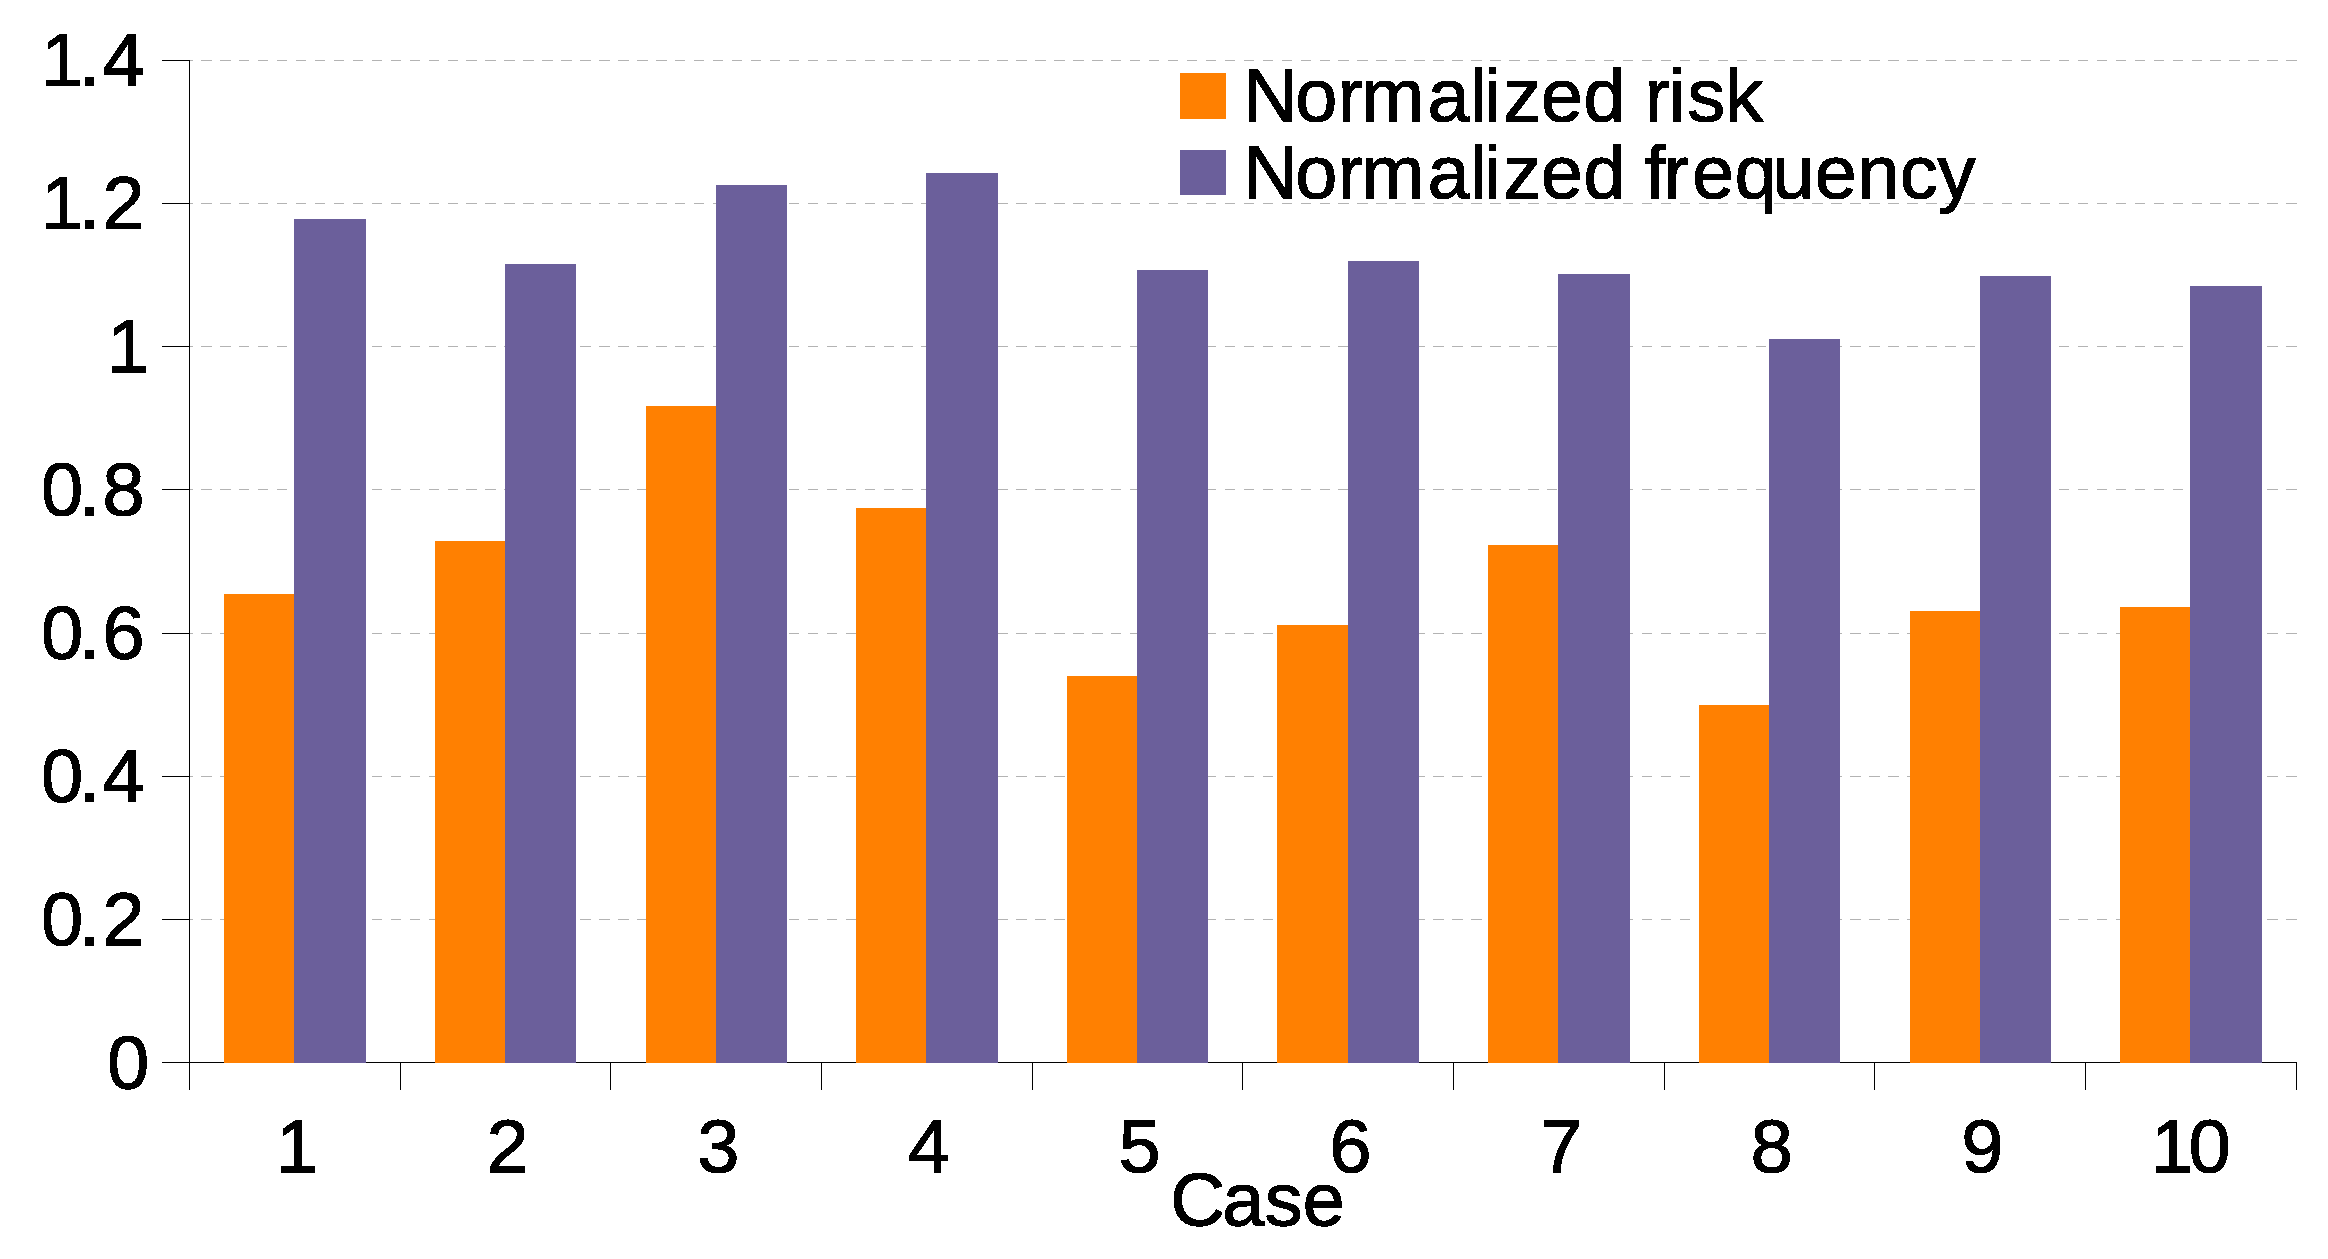
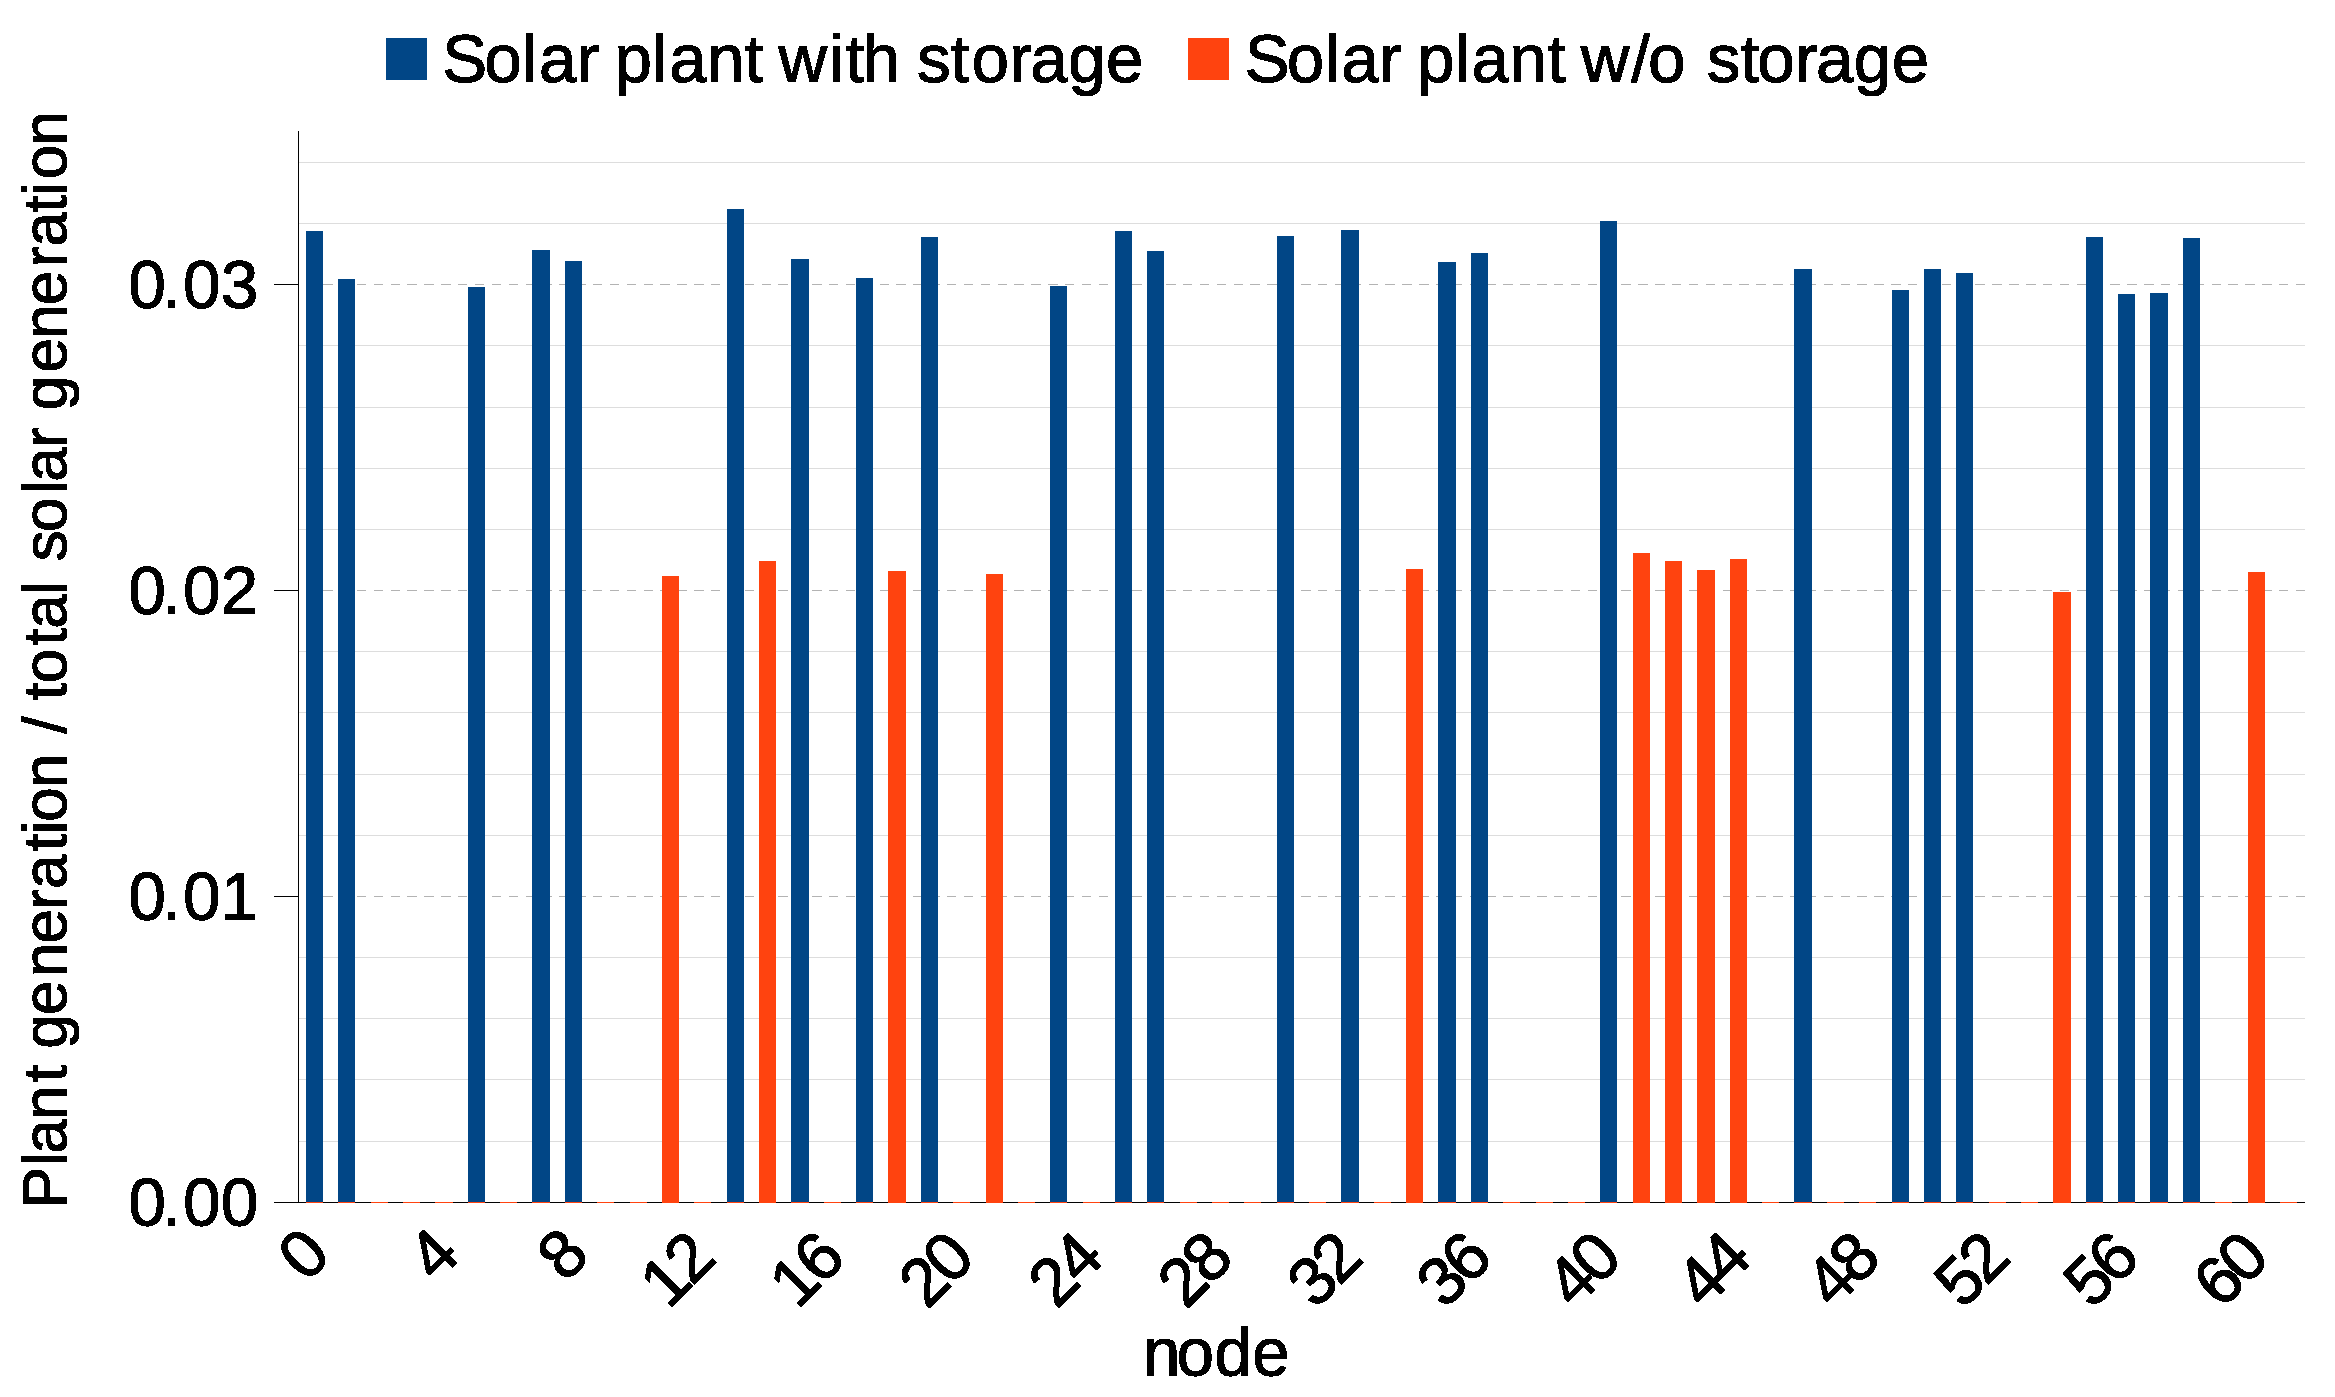
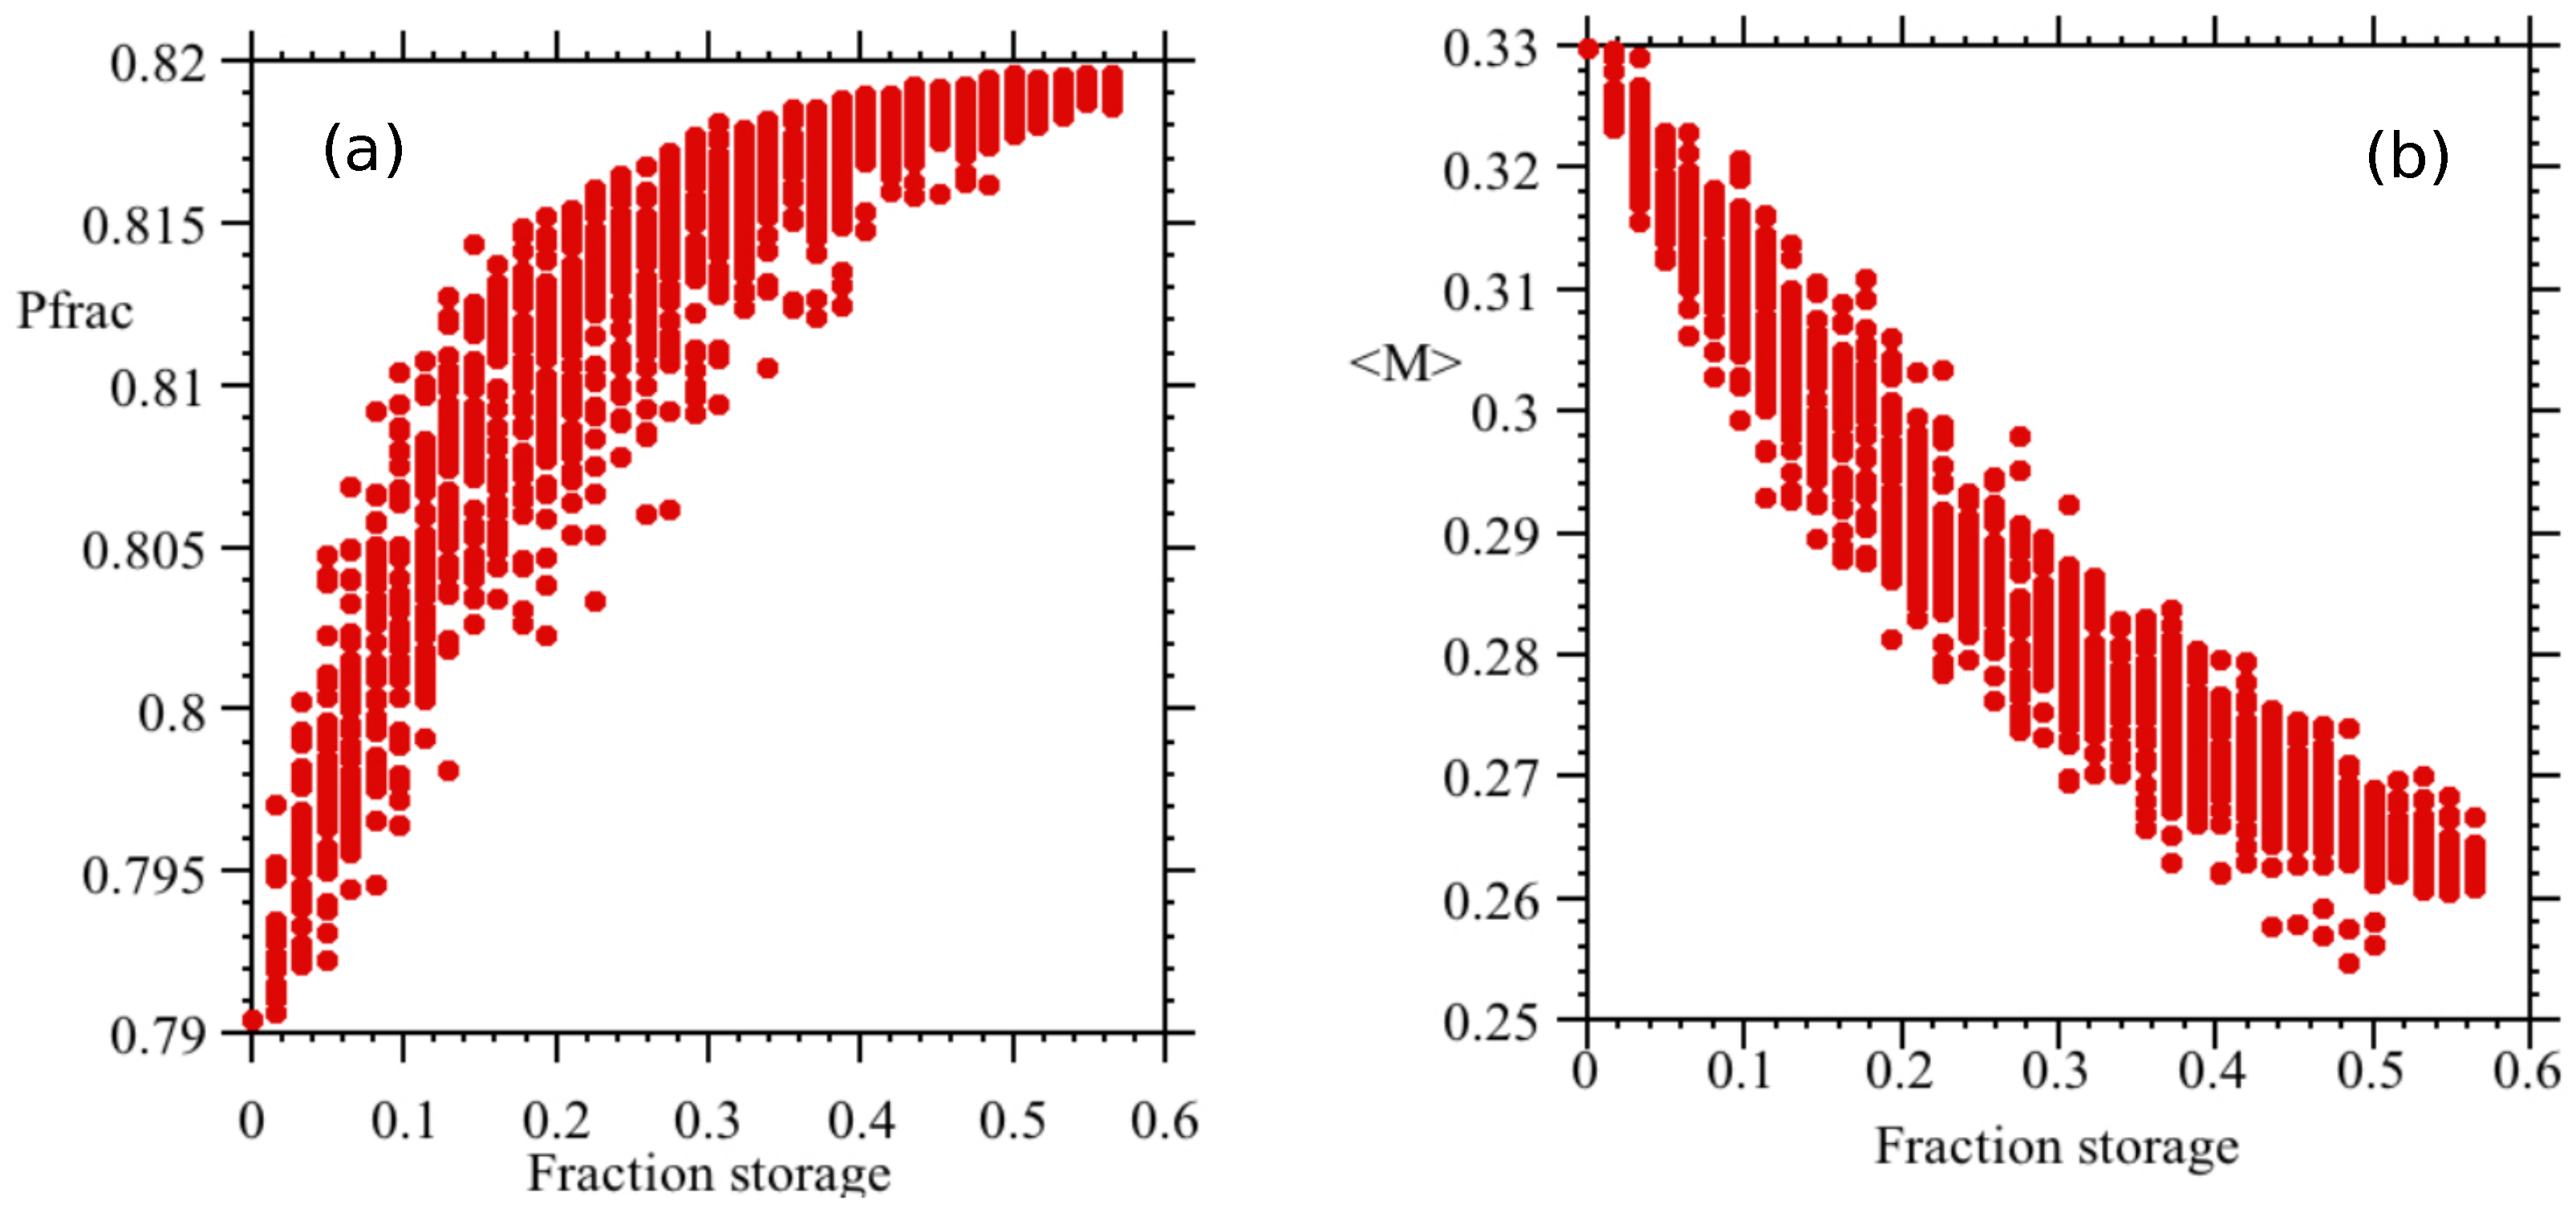
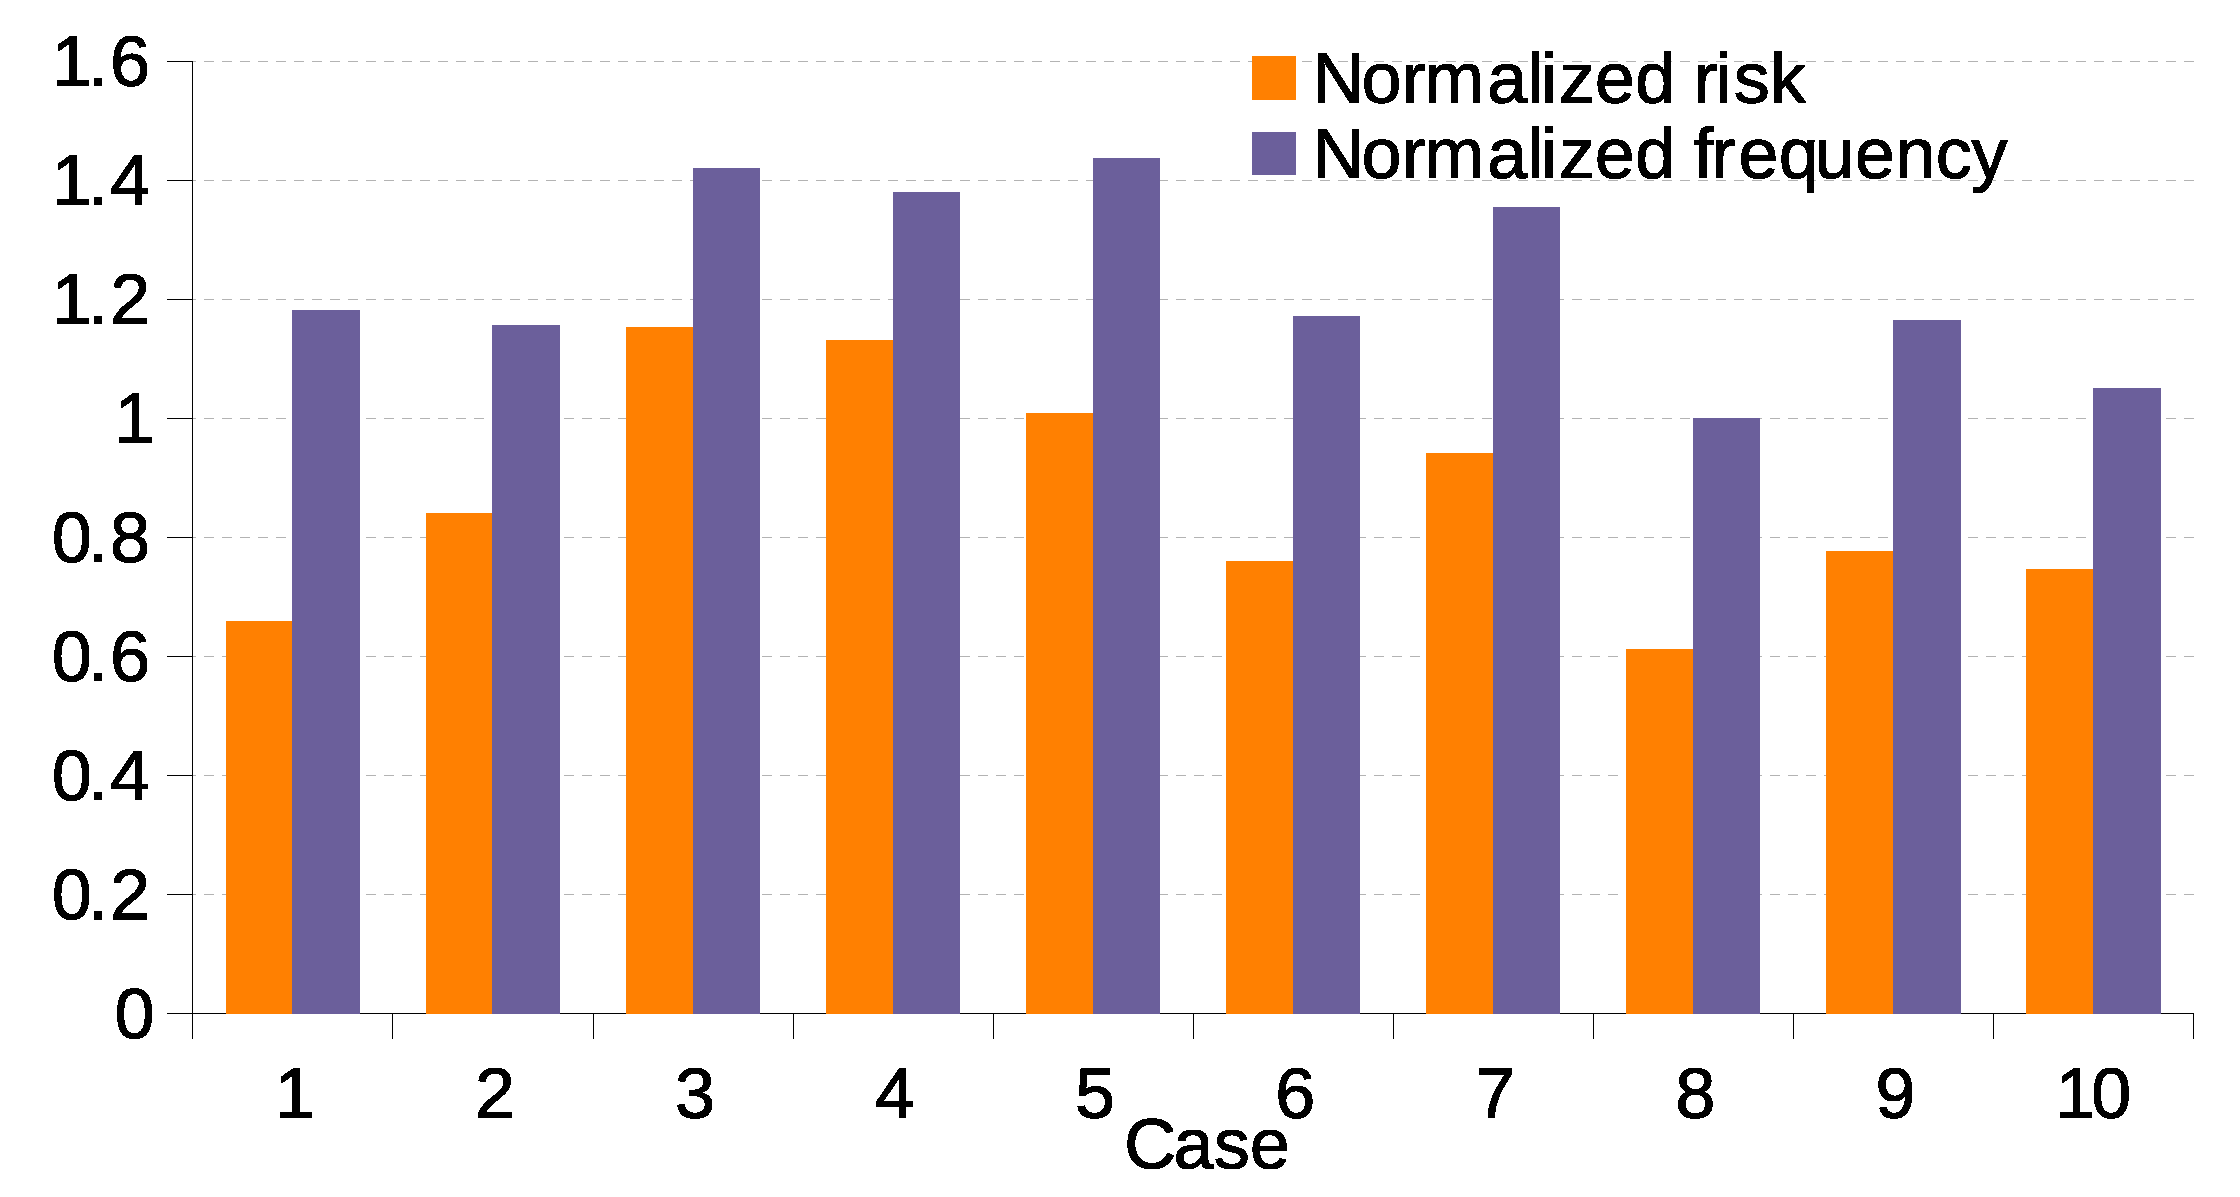
The findings from this study indicate that with an optimal distribution of solar plants and a strategic placement of storage, it is feasible to achieve a scenario where solar generation meets approximately of the total electricity demand. Notably, cases such as the one identified as case 8 demonstrate a significant reduction in blackout risk to approximately half that of the reference case without solar plants while maintaining a manageable frequency of blackouts. The addition of storage at solar plants notably enhances their generation capacity, highlighting the importance of strategic storage integration.
It is important to emphasize that the OPA model is not designed to reproduce specific power systems in detail but rather to capture the statistical characteristics of blackouts and the emergent behavior of complex grids; as such, the solutions proposed here should be interpreted as high-level planning guidelines. The strength of the OPA framework lies in its ability to simulate systemic phenomena such as cascading failures and long-range correlations, which are often overlooked in traditional deterministic analyses. Nevertheless, any proposed configuration based on this methodology should be further tested with more detailed grid models and subjected to technical and economic feasibility assessments prior to implementation.
In addition to the specific case of the Balearic Islands, this approach allows for the extraction of general recommendations that may guide similar planning efforts in other locations. While additional storage generally helps to improve system reliability, it is also costly. The results of this study show that carefully optimized configurations can substantially reduce the number of solar plants that require storage while keeping blackout risk low. Importantly, identifying such configurations is not straightforward and requires extensive statistical analysis. A key insight is that spatial correlations in solar generation must be taken into account, as distributing storage capacity across zones with the least correlated solar fluctuations can significantly improve resilience and reduce the need for redundant infrastructure.
To perform a full optimization that includes economic and societal factors, additional information such as the infrastructure conditions at each node, physical and administrative feasibility of installing a solar plant, and current costs of equipment and installation would be needed. However, the results presented here reveal a broad set of diverse and viable configurations, suggesting that at least one of these requirements could be tailored to match real-world constraints.
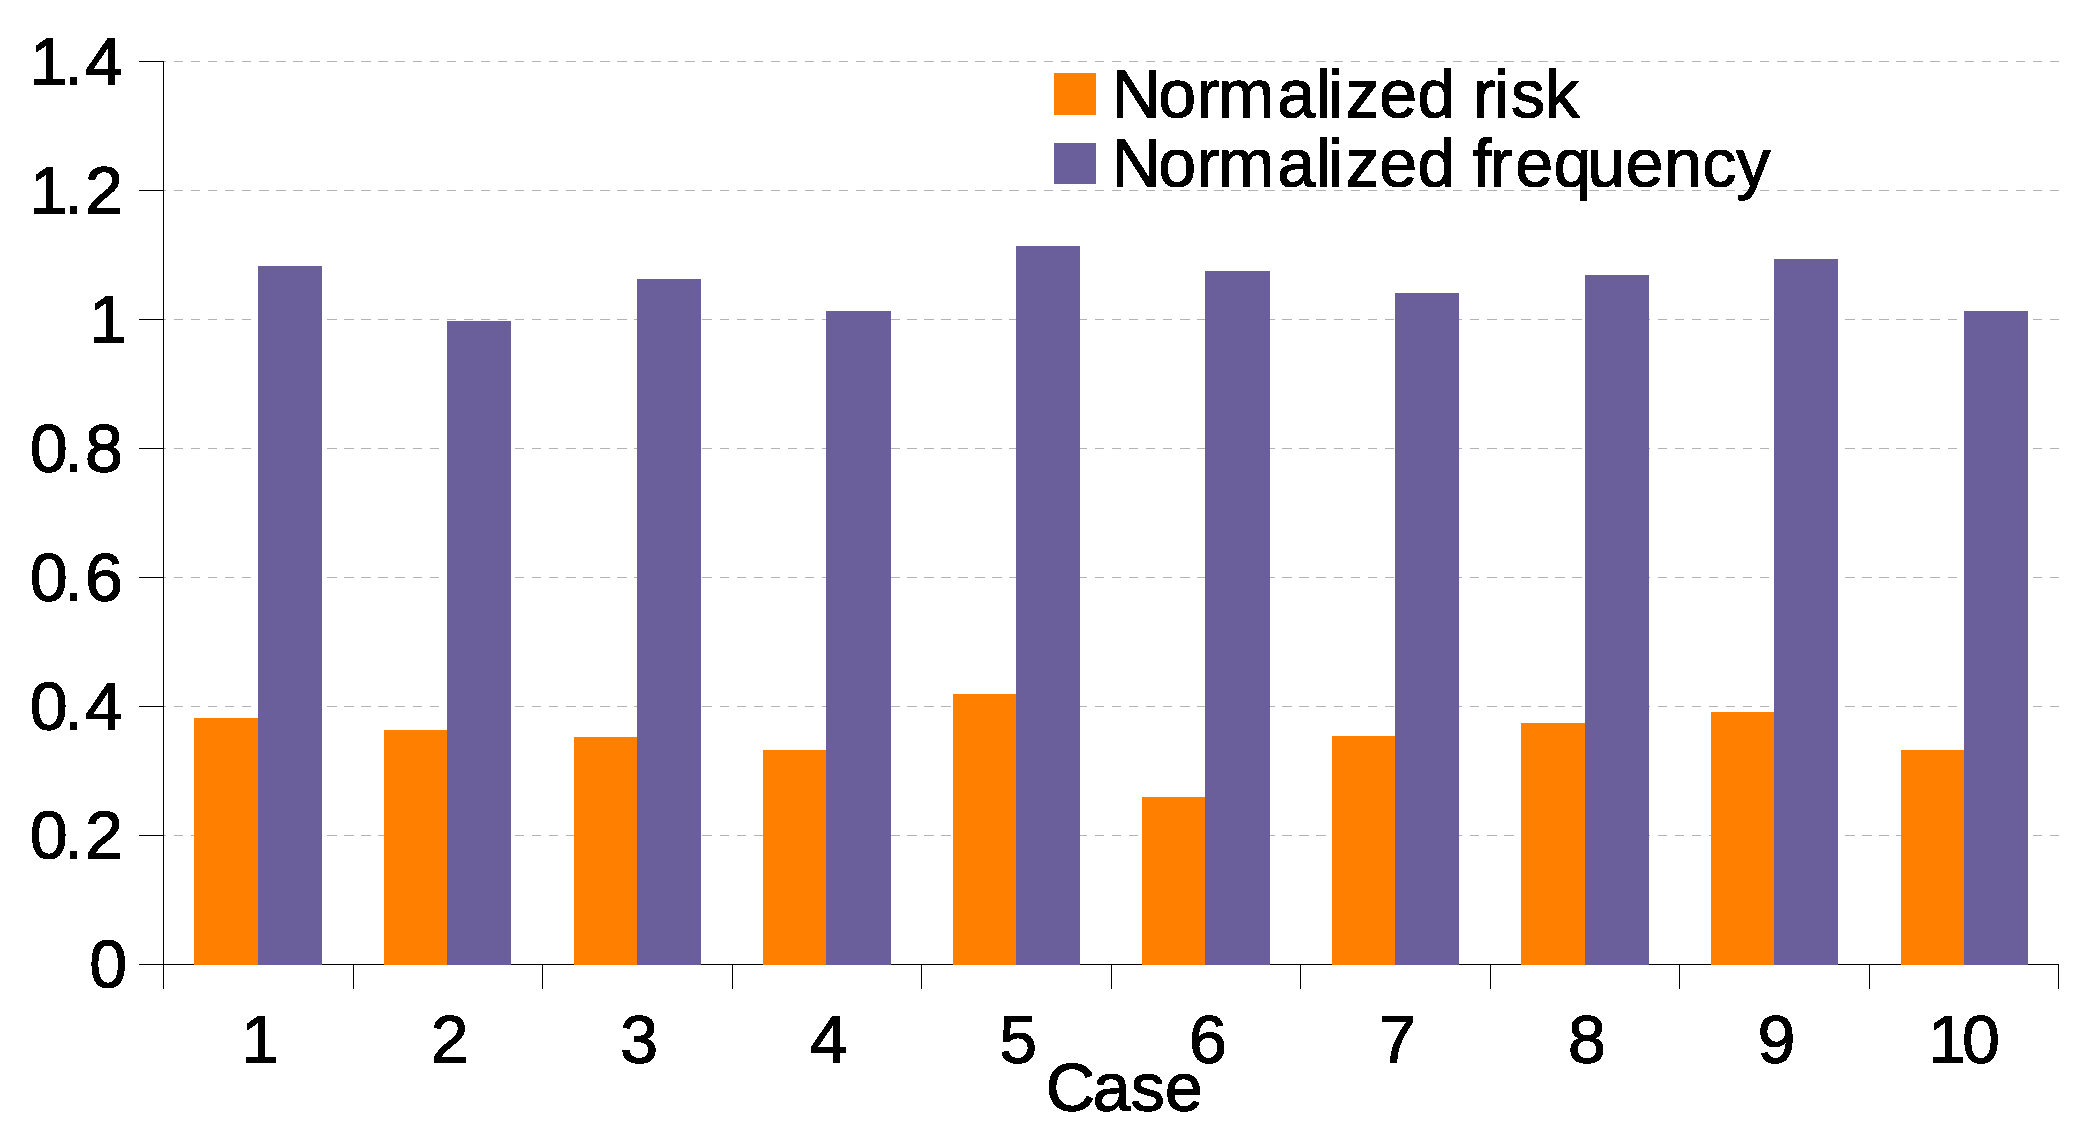
Furthermore, a fully decarbonized scenario has been analyzed in which the Balearic Islands grid operates solely with solar plants and the HVDC cable connection to the mainland, eliminating conventional power plants; although this scenario increases the risk due to the concentration of generation at the HVDC connection point, it remains feasible, highlighting the potential for a significant shift toward renewable energy reliance.
5. Conclusions
This study demonstrates the feasibility of achieving high penetration of variable renewable energy sources in island power systems through optimized placement of solar generation and storage. Using the OPA model, configurations have been identified that minimize blackout risk and reduce the need for extensive storage infrastructure.
The results show that combining a well-designed distribution of solar plants with targeted storage deployment can ensure grid resilience even under high solar penetration. The proposed approach captures emergent behaviors such as cascading failures and offers system-level planning insights that complement traditional deterministic methods.
While findings are grounded in the case study of the Balearic Islands power grid, the methodology and key principles—such as exploiting spatial variability in solar resources and minimizing correlated risk through strategic storage allocation—are broadly applicable. These insights can guide energy transition strategies in other regions, particularly in scenarios where cost, resilience, and environmental sustainability must be balanced.
Future work should incorporate more detailed economic assessments, infrastructure constraints, and local policy frameworks in order to refine these results and support real-world implementations.


