1. Introduction
Against the backdrop of the vigorous development of the digital economy and the accelerated construction of an intelligent society, modern power systems are undergoing unprecedented rapid changes. With the dense deployment of cross-regional and cross-basin ultra-high-voltage transmission networks, as well as the large-scale integration of new energy sources such as wind, solar and storage, the interconnection of power grids has shown an exponential growth trend [
1]. The power networks of different voltage levels and different energy forms are intertwined with each other, making the topological structure of the power system increasingly complex and the difficulty of operation control increase geometrically. Meanwhile, the reliance on power supply in all sectors of society has been continuously deepening. The operation of precision instruments in industrial production, the intelligent dispatching systems in urban transportation, and even the operation of digital equipment in residents’ lives all rely on the support of a stable power supply. This has elevated the reliability of the power system to a strategic height related to the national economy and people’s livelihood. Once a large-scale power outage occurs due to a power grid failure, it will not only cause direct economic losses but it may also trigger a chain reaction such as traffic paralysis, communication interruption, and the shutdown of medical equipment, seriously affecting the normal operation order of society [
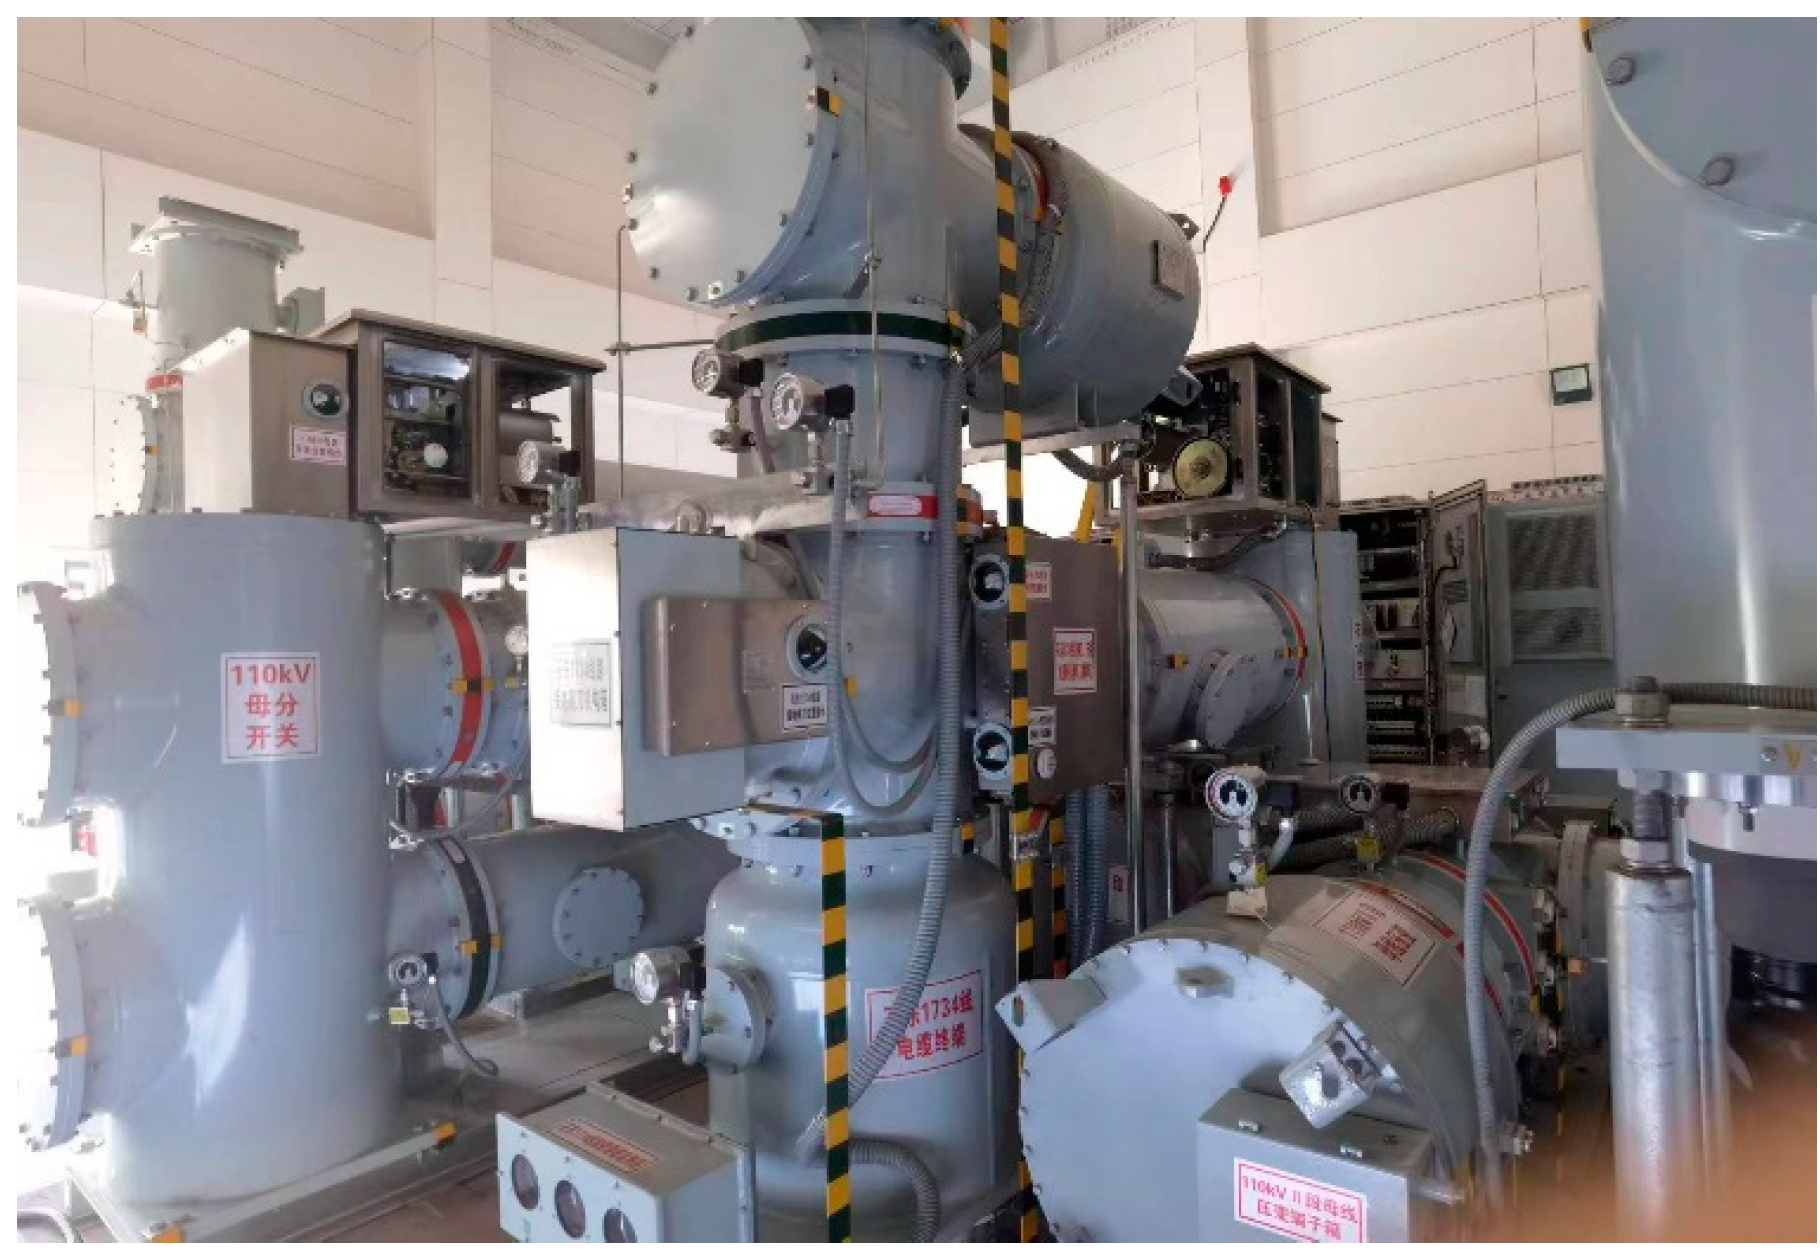
2]. As one of the most important switchgears in the power system, the GIS spring circuit breaker mainly functions to perform the opening and closing operations of lines. It can cut off the fault current within milliseconds, preventing power equipment from being damaged due to faults and thus ensuring the safe and stable operation of the entire power grid [
3,
4,
5,
6,
7], the picture is shown in
Figure 1.
However, the number of operations of a spring circuit breaker during its service life is limited. Due to its long-term exposure to harsh outdoor environments, the performance of the circuit breaker may gradually decline as the years of use increase. Under the superposition of complex environmental factors and mechanical losses, high-voltage circuit breakers have gradually become the weak link in the power system [
8]. High-voltage circuit breakers may experience faults such as failure to operate or misoperation. These faults not only affect the normal operation of the equipment but also seriously threaten the safety and reliability of the power system.
The spring-operated mechanism is a mechanical operating mechanism that uses a spring as the energy storage element. It consists of three parts: the energy storage mechanism, the transmission mechanism, and the control mechanism [
9]. The main function of the energy storage mechanism is to provide energy for the closing spring, etc. The transmission mechanism is mainly used to transmit motion and power. The control mechanism is a device used to control the opening and closing actions and act as a buffer. Among all the faults of circuit breakers, mechanical faults account for more than 60% [
10]. The common fault classifications of spring-operated mechanism circuit breakers are listed in
Table 1.
To ensure the safe and stable operation of high-voltage circuit breakers, operation and maintenance personnel need to carry out maintenance on the circuit breakers. The traditional maintenance methods mainly include post-maintenance and regular maintenance. However, in practice, these methods have gradually exposed many drawbacks [
11]. Post-event maintenance refers to the process where maintenance personnel take the equipment out of operation after it malfunctions and then carry out manual repair work. This passive maintenance strategy has obvious lag. When maintenance personnel become involved, equipment failures have often already caused varying degrees of damage to the power system. Problems such as local power outages and power supply disruptions occur from time to time, and this strategy is unable to provide timely and effective protection for the power system [
12]. For this reason, the post-maintenance method has gradually been replaced by the more proactive regular maintenance method.
Regular maintenance is carried out to estimate the expected service life of the equipment based on the production law and formulate a detailed maintenance plan. Conducting comprehensive maintenance on equipment within a pre-set time period to reduce the failure rate of the equipment has become the most commonly used inspection modes in the current power industry. However, this maintenance method is actually quite blind. Due to the lack of an accurate grasp of the actual operating status of the equipment, regular maintenance is often carried out unnecessarily when the equipment is still in good operating condition, resulting in the waste of maintenance resources [
13,
14,
15]. At the same time, when conducting maintenance operations, to ensure safety, it is usually necessary to cut off the power supply to the relevant areas. This not only affects the normal power consumption of users but also generates high maintenance costs, including economic losses caused by power outages and human and material resources input during the maintenance process, which makes it difficult to meet the requirements of efficient and economic operation of modern power systems.
With the rapid development of contemporary computer, communication and sensor technologies, in order to achieve the economic operation and sustainable development goals of the power system, the condition-based maintenance mode emerged and gradually developed. The key to this mode lies in the application of online condition monitoring and fault diagnosis technology to conduct dynamic assessment of the operating status of power equipment. With the aid of advanced technological means, the specific locations of early defects in equipment can be quickly and accurately identified, and the early warning mechanism can be promptly triggered, enabling maintenance personnel to promptly repair the defective parts, effectively curbing the deterioration of problems and preventing faults from occurring. Compared with traditional maintenance methods, condition-based maintenance can promptly identify potential hazards of equipment, rationally plan maintenance arrangements, and ensure that the equipment is maintained when necessary. This strategy not only significantly enhances the stability and reliability of the operation of power equipment but also greatly reduces the maintenance and repair costs, optimizes the allocation of human and material resources, and fully embodies the concept of efficient, safe and sustainable development of the power grid [
16].
The detection of mechanical faults in circuit breakers is generally divided into three parts: fault data collection, fault feature analysis, and the establishment of fault detection models. The sensor signals commonly used for analysis mainly include current signals of opening and closing coils [
17,
18], vibration signals [
19,
20,
21], and travel signals of moving contacts [
22,
23,
24,
25], etc. At present, the online monitoring technology of the operating mechanism of spring circuit breakers is not yet mature. The main problem lies in that the state quantities for diagnosing faults are relatively single, the basic data are limited, and there are few studies on integrating multiple state quantities for fault diagnosis. Diagnosing faults based only on one state quantity lacks comparative analysis, and it has insufficient credibility and large errors. In recent years, with the rapid development of sensor technology, the collection and analysis of multi-sensor data have become an important means in the field of equipment health monitoring. By integrating data from multiple sensors, the operating status of the equipment can be monitored in real time, and faults can be detected promptly. However, how to effectively utilize a large amount of sensor data for accurate fault detection remains a major technical challenge.
Therefore, the future development trend is to complement the characteristics and advantages of various sensor signals, construct a multi-source information fusion diagnosis strategy, and establish a multi-dimensional fingerprint database of fault features for fault diagnosis [
26].
The organizational structure of this paper is as follows. The experimental equipment used in this study is described in
Section 2, including the operating mechanism of the spring circuit breaker, the closing spring pressure sensor, the opening and closing speed sensor, the opening and closing current sensor, and the energy storage motor sensor. The experimental data were obtained through fault simulation, and then data analysis and processing were carried out, as detailed in
Section 3. Including data noise reduction and feature extraction.
Section 4 integrates multi-sensor data to study the fault detection model of spring circuit breakers based on the RF-Adaboost algorithm. The conclusion and analysis of the experimental results are presented in
Section 5.
2. Materials and Methods
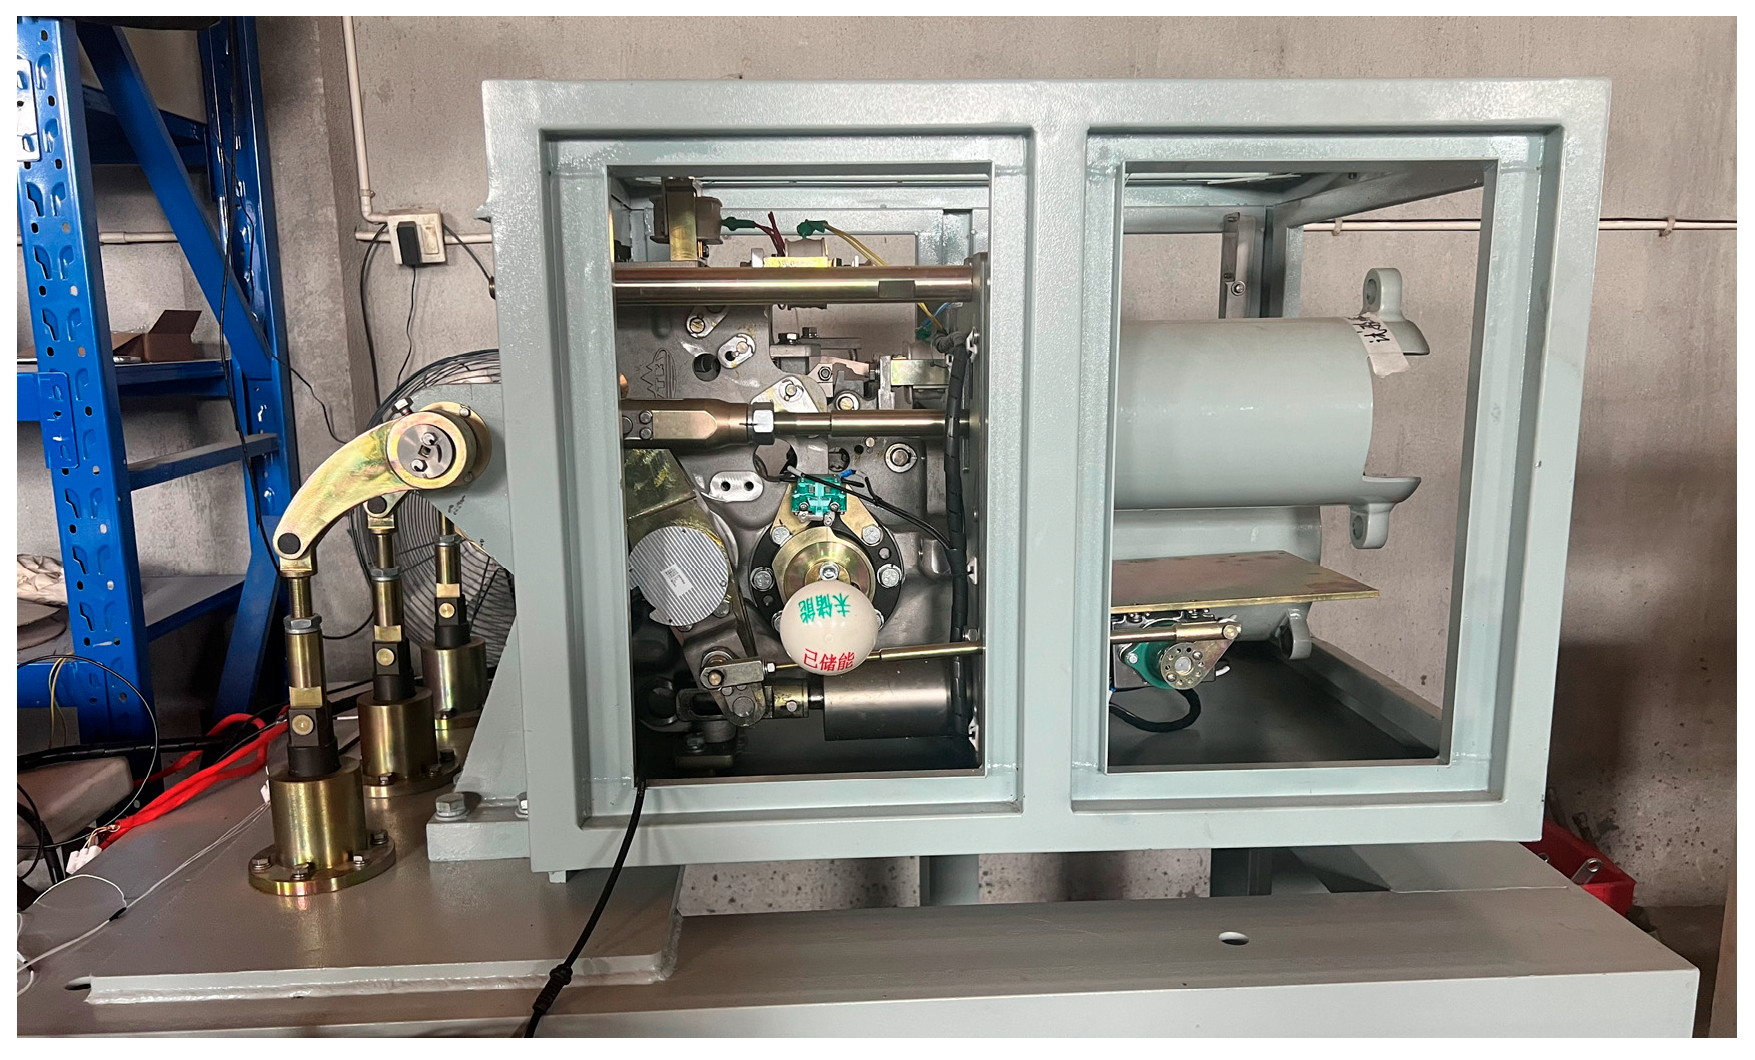
In this study, by installing a closing spring pressure sensor, an opening and closing speed sensor, an opening and closing current sensor, and an energy storage motor sensor in the circuit breaker operating mechanism, the relevant parameters during the opening and closing process were monitored [
27,
28]. The spring-operated mechanism used in the test is shown in
Figure 2.
All experiments were carried out in a controlled laboratory environment at a power system testing facility. The ambient temperature was maintained at 22 ± 2 °C, with humidity below 60%. Electromagnetic shielding was in place to minimize external interference. All sensors used were industrial-grade devices with built-in compensation mechanisms to ensure data reliability.
The main technical indicators of the various sensors adopted in this article are shown in
Table 2:
2.1. Closing Spring Pressure Sensor
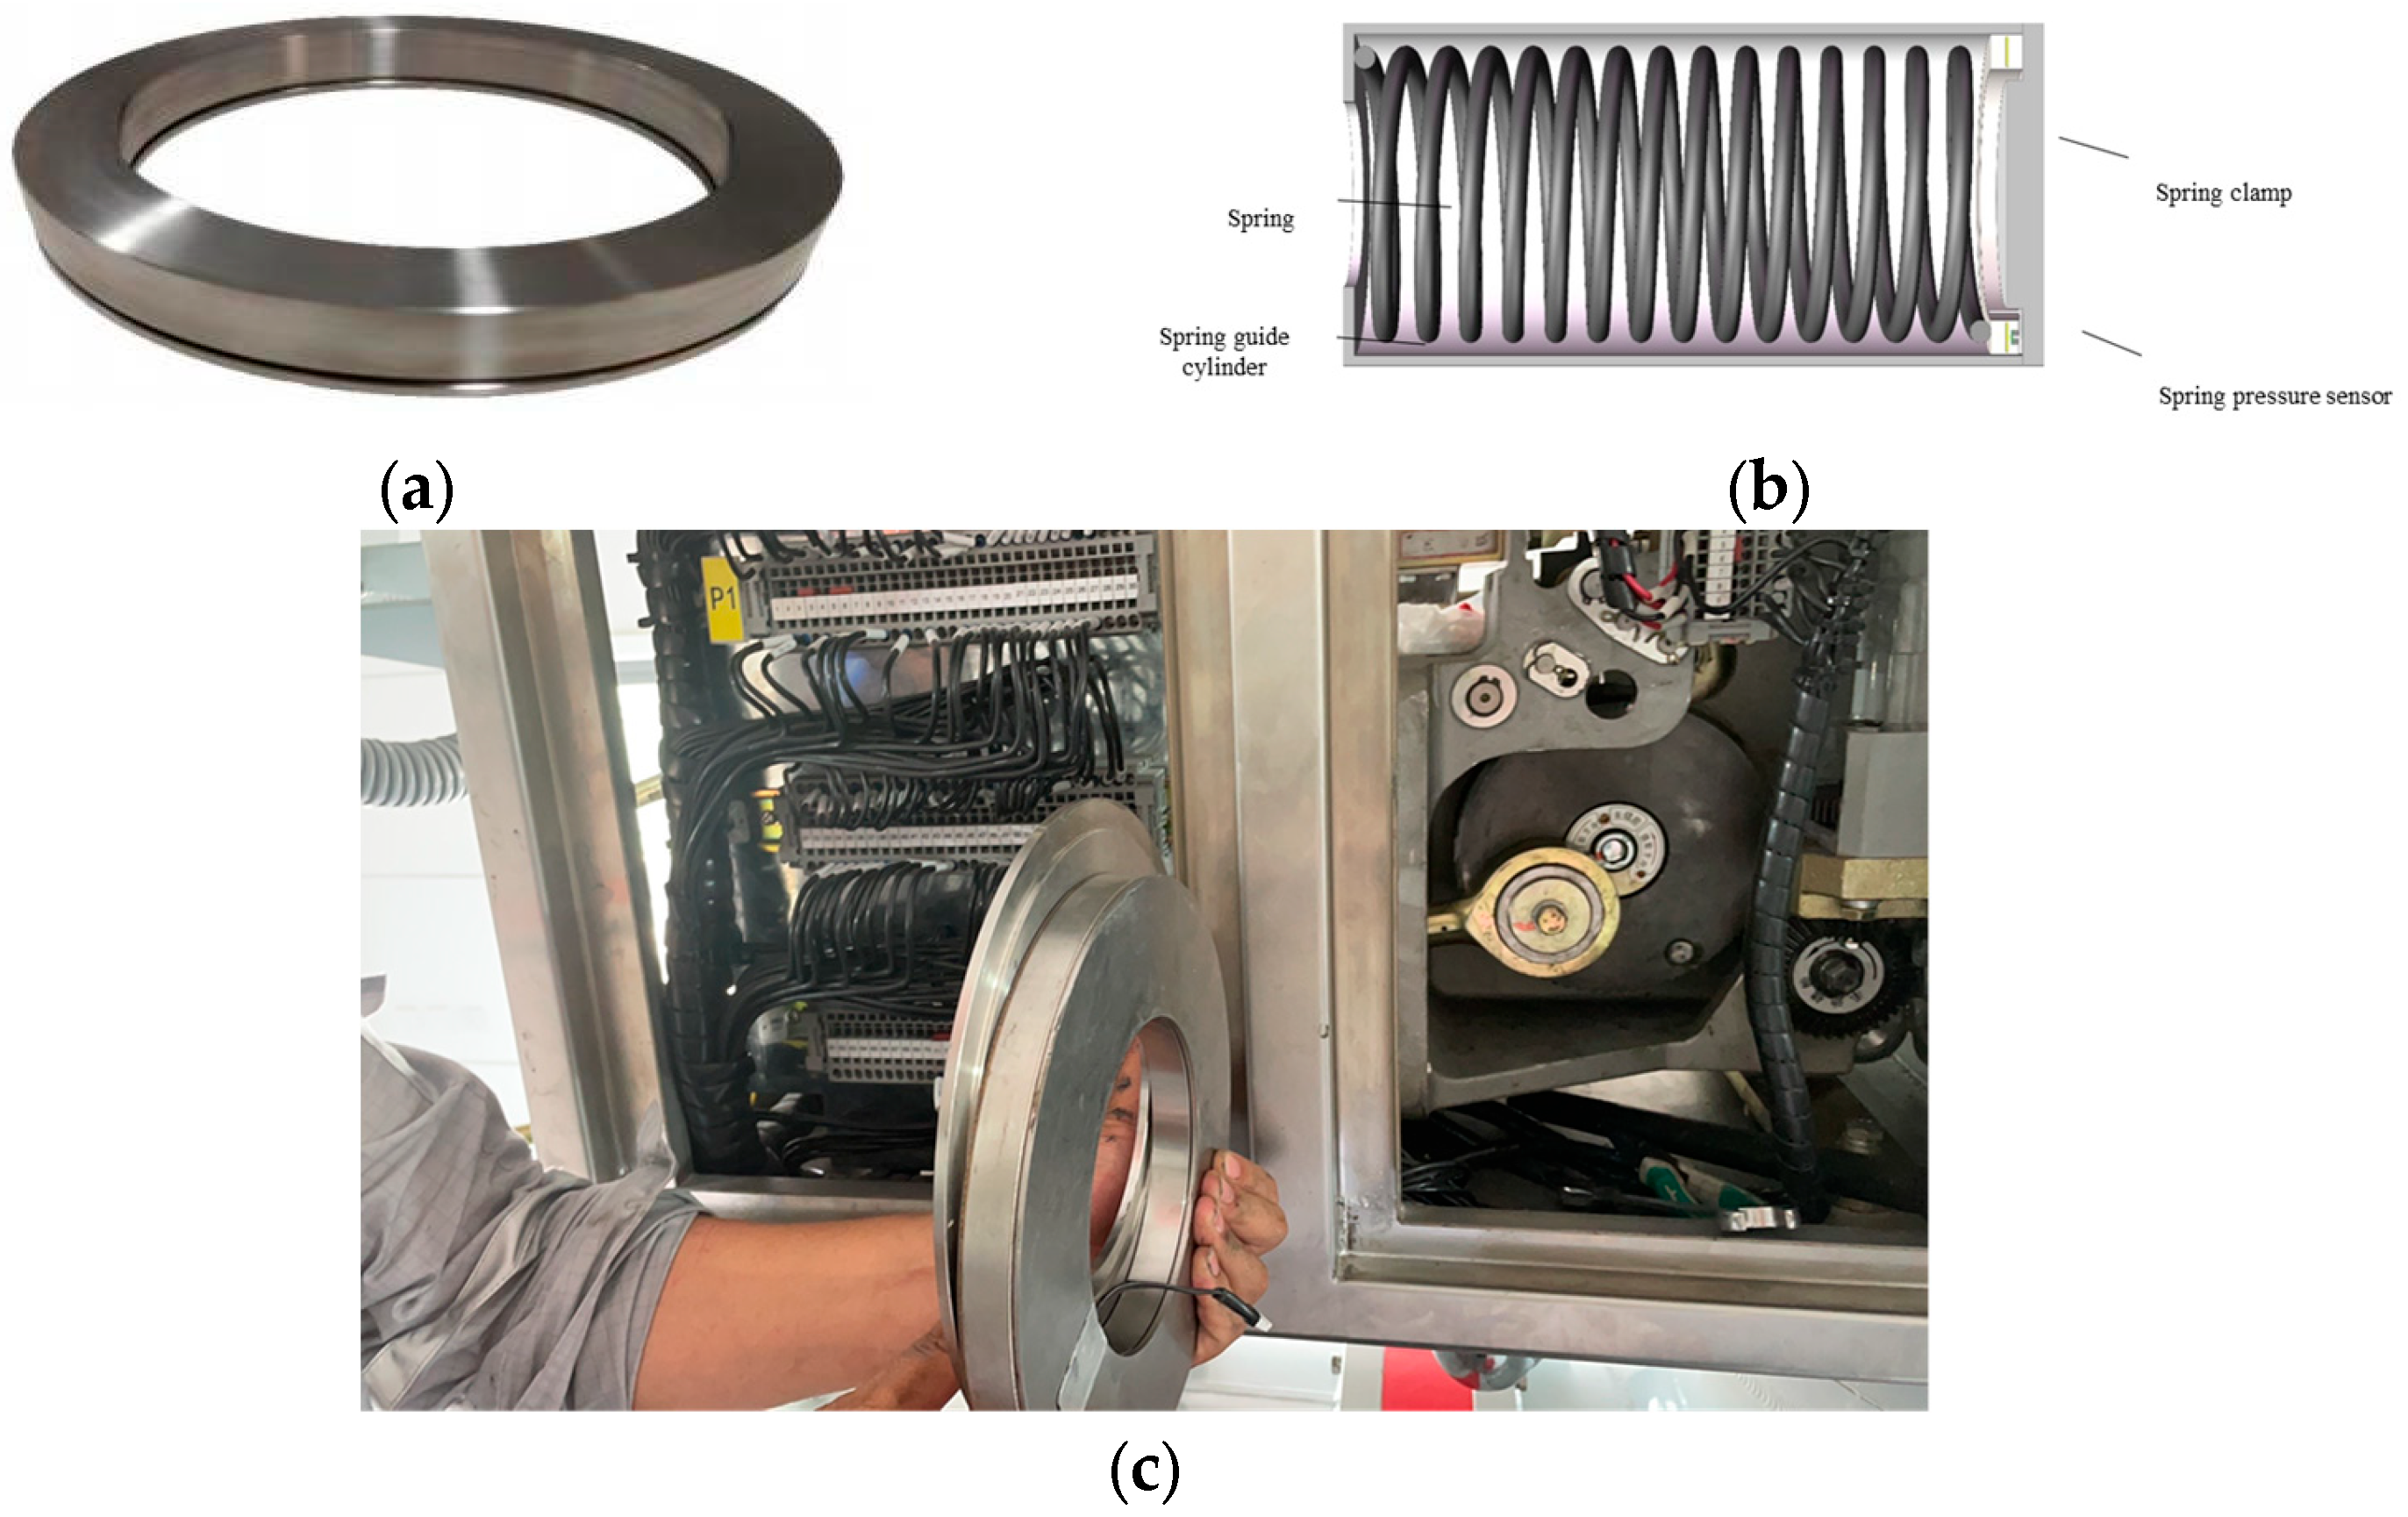
In this study, a circular MEMS pressure sensor was adopted. Its structure and on-site installation are shown in
Figure 3. Traditional force sensors have long been affected by creep effects. In practical applications, traditional force sensors must undergo periodic calibration, and the calibration cycle is usually set between 0.5 and 1 year. However, the calibration cycle of this school does not match the major overhaul cycle of the GIS circuit breaker actuator, and there is a mismatch problem in terms of time. In view of this, this study adopts a force sensor that can effectively overcome creep phenomena and adapt to long-term pressure working conditions. Based on the hydraulic principle and with its unique packaging technology, it can achieve reliable application of force sensors under long-term pressure conditions. When a spring is subjected to pressure, its length will shorten accordingly. The force generated by the compressed spring will be conducted to the hydraulic oil through the circular ring structure. Given that the pressure sensor is encapsulated in an annular cavity, based on the hydraulic principle, the pressure sensor can accurately measure the pressure it experiences in real time, thereby achieving the monitoring of the spring force. When installed on site, it is placed between the spring and the spring pressure plate. The special circular ring structure ensures that it does not affect the assembly of the spring.
This MEMS spring pressure sensor has a range greater than 1 MPa, a hysteresis of 0.05%FS, a comprehensive accuracy of 0.1%FS, a stability of 0.03%FS per year, and an operating temperature range of −40 °C to 80 °C.
2.2. Opening and Closing Speed Sensor
For the selection of opening and closing speed sensors, this scheme adopts a non-contact code disk speed measurement scheme. As shown in
Figure 4, this speed monitoring device adopts a split non-contact design of “sensor-code disk”. The code disk is installed at the existing installation hole of the GIS circuit breaker, and the speed measurement encoder is flexibly connected to the box structure through a custom bracket. This design takes into account both the seismic performance and the on-site alignment assembly adjustment function simultaneously. It can effectively eliminate vibration interference and ensure the accuracy of the test results.
2.3. Current Sensors for Opening and Closing Coils and Energy Storage Motors
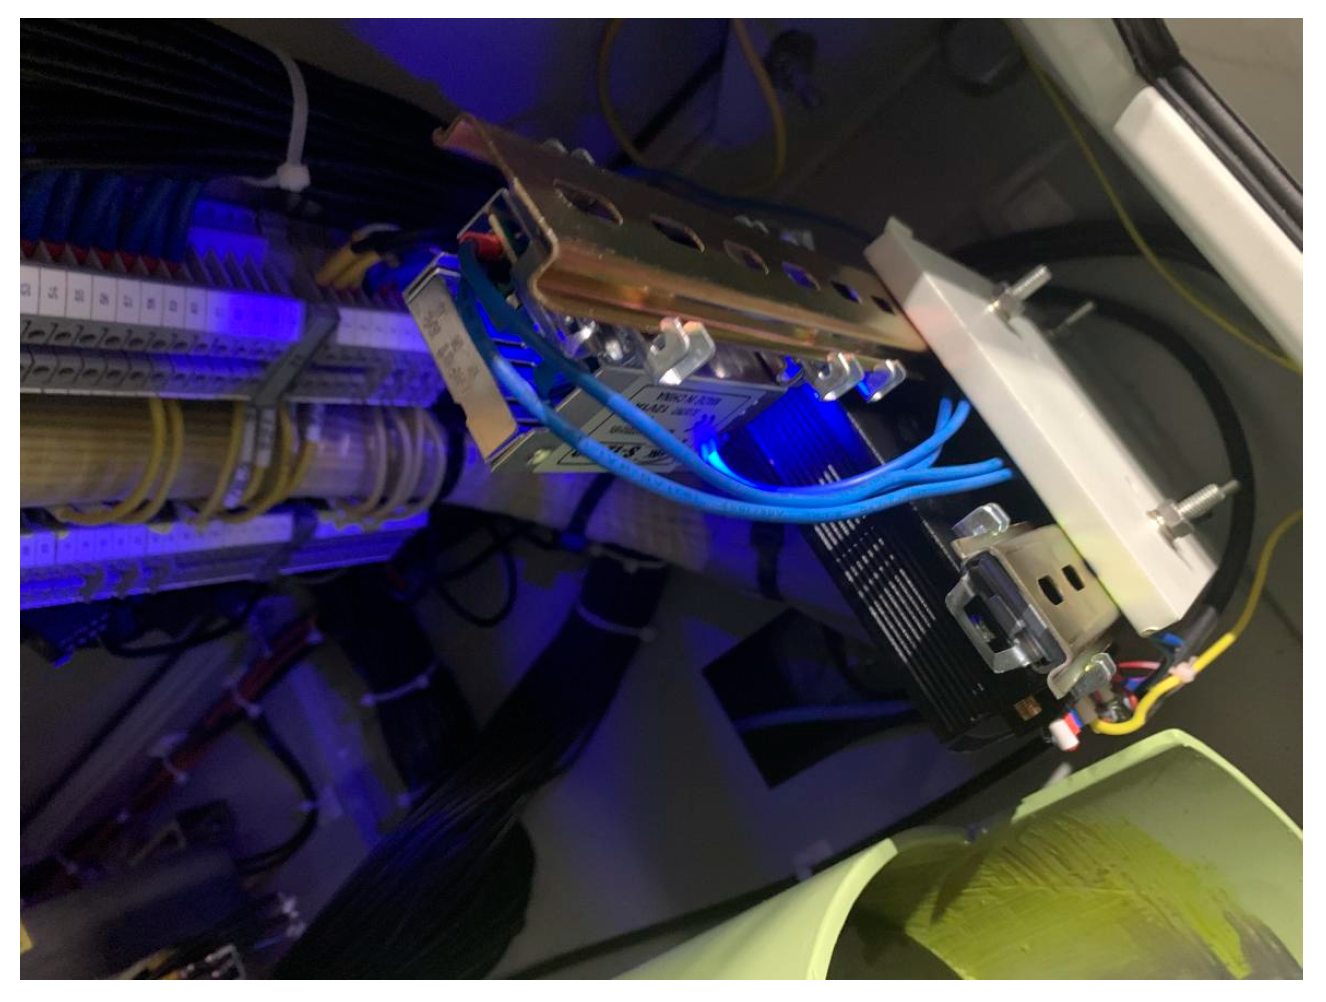
In the online monitoring system of the GIS circuit breaker operating mechanism, Hall coil current sensors are selected for both the opening and closing coils and the current detection modules of the energy storage motor. As shown in
Figure 5, all current sensors are integrated and installed inside the GIS circuit breaker operating mechanism box. This integrated design greatly simplifies the installation process and effectively enhances the convenience of construction. During the operation of the system, the opening and closing current sensors collect the coil current data in real time, and the energy storage motor current sensor synchronously monitors the motor current parameters. The monitoring of the current variation can determine the operating performance of the opening and closing coils and the energy storage motor, and, at the same time, it can indirectly reflect the operation status of the mechanical state of the spring mechanism.
2.4. Fault Simulation Experiment
Fault simulation experiments were conducted by manually setting faults in different parts to obtain sufficient fault data.
Voltage offset of the opening and closing coils: The external DC power supply was connected to change the voltage of the opening and closing coils. Rated voltage values of 85%, 90%, 95%, 105%, and 110% were set, and a total of 123 sets of fault test data were obtained.
The reset spring of the opening and closing switch is fatigued. By changing the position of the reset spring fixing bolt and setting the position degree of the fixing bolt to be different, faults of different degrees were simulated. The experiments were conducted on bolt displacements ranging from 1 to 5 mm. For each group of experiments, the bolt displacement was increased by 1 mm. A total of 5 groups of experiments were carried out, and 132 groups of fault experiment data were obtained.
Fatigue of the closing spring: The pre-compression amount was adjusted by changing the position of the bolt at the bottom of the closing spring sleeve each time the spring position was moved by 2 mm to simulate the aging and fatigue faults of the closing spring. The position of the bottom sleeve bolt of the closing spring was adjusted from 2 mm to 10 mm, increasing by 2 mm each time. A total of 5 sets of experiments were conducted, and 127 sets of fault experiment data were obtained.
3. Experimental Results and Data Processing
3.1. Measured Data of the Sensor
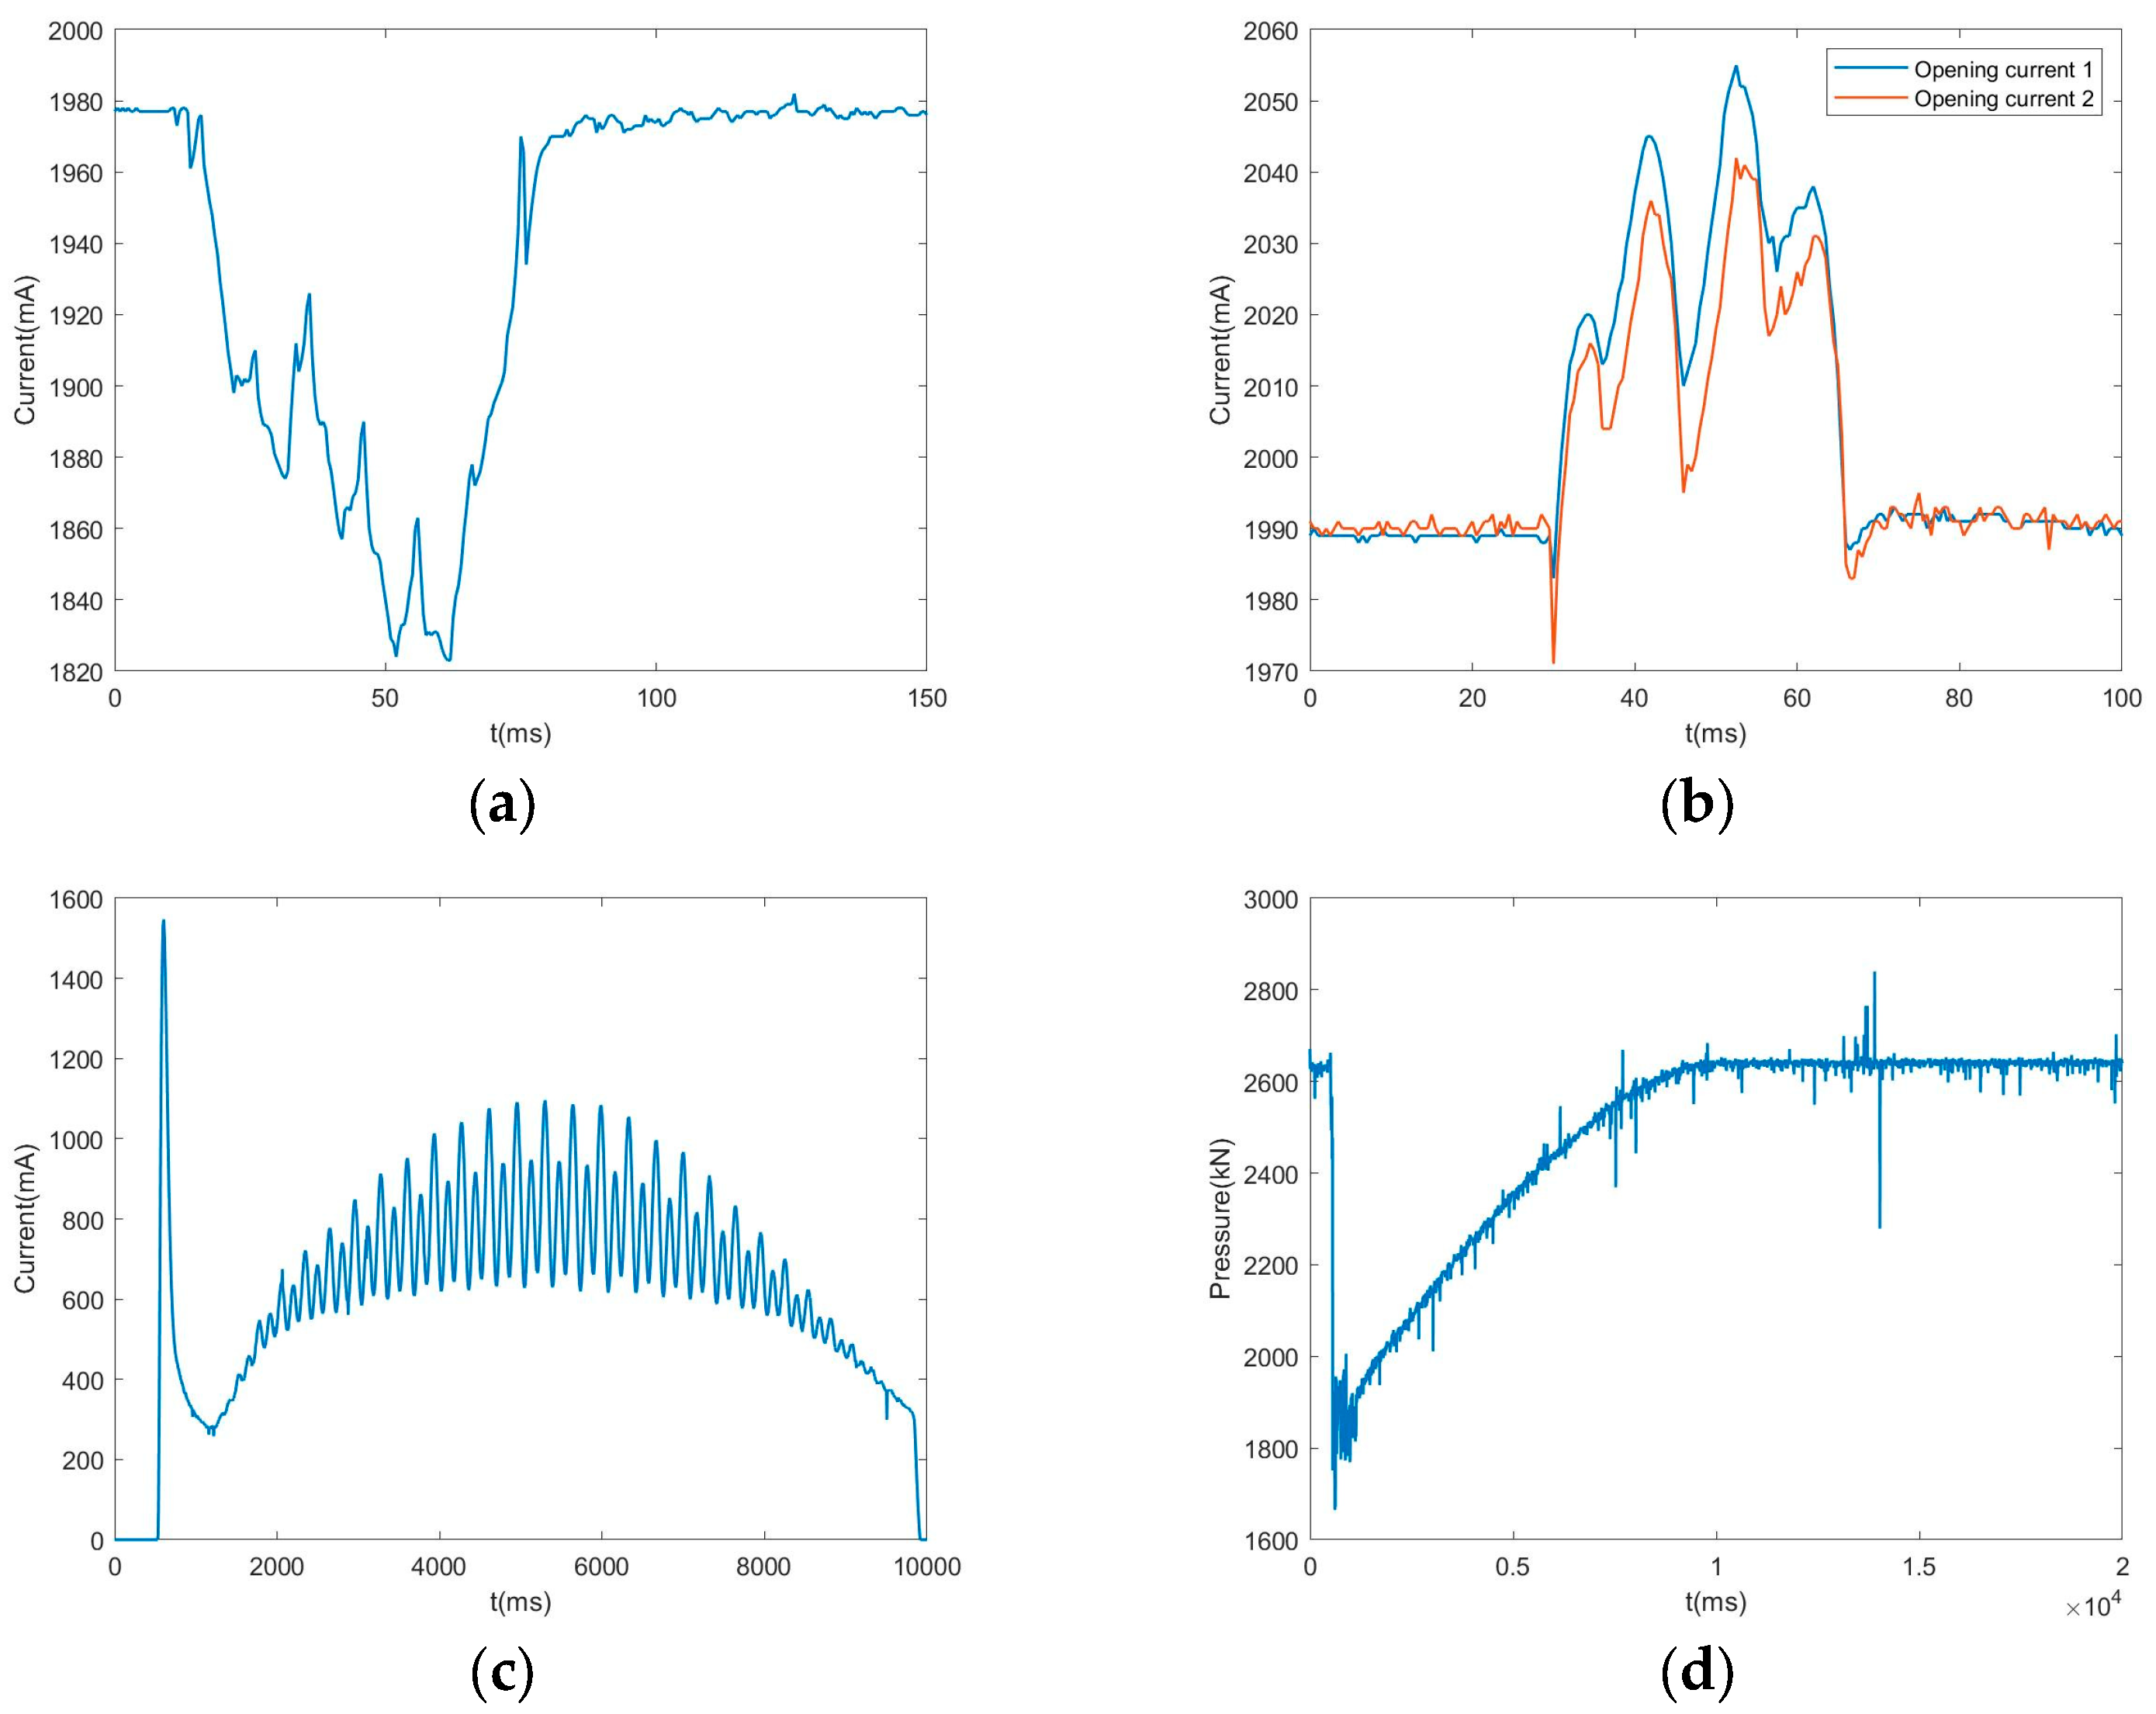
The measured data curves of each sensor are shown in
Figure 6, including the closing current curve, opening current curve, energy storage motor current curve, closing spring pressure curve, and opening and closing speed curve. Among them, the vertical coordinate represents digital quantities, not the actual values of physical quantities.
3.2. Noise Reduction in the Original Signal
Due to the interference of on-site noise and the measurement error of the sensor itself, it is necessary to perform noise reduction preprocessing on the directly collected original signal to obtain more reliable characteristic signals. This paper adopts the wavelet noise reduction method. It can divide the signal into any frequency band at different scales, and the signals within each frequency band do not overlap. For the mother wavelet function
, if its Fourier transform
satisfies:
is called a basic wavelet. By scaling and shifting it, the following function can be obtained:
In the relevant definitions,
is the scale parameter, corresponding to the frequency, and
is the translation parameter, parameters
. We will call
the wavelet basis function dependent on the sum of parameters
and
. When the scale factor
and the displacement factor
satisfy the condition of continuous variation,
becomes a continuous wavelet basis function. If any function
is expanded under a continuous wavelet basis function, this process is called the continuous wavelet transform of the function
, and its mathematical expression is as follows:
From the above definition, it can be determined that the wavelet transform is the same as the Fourier transform, both belonging to the category of integral transformations, where is the wavelet transform coefficient. In practical application scenarios, to facilitate the computer’s analysis and processing work, it is necessary to implement discretization operations on the signal , and the parameters and also need to be discretized. This process is called discrete wavelet transform. To reduce the redundancy degree of the wavelet transform coefficients, the values of and of the wavelet basis functions can be limited to specific discrete points.
A typical discretization method involves performing power series discretization on the scale, that is, let
(where
), which usually takes
. For time variables
, a uniform and discrete value approach is adopted to cover the entire time axis, that is,
. In this case, the wavelet basis function can be expressed as follows:
Then, the discrete wavelet transform is as follows:
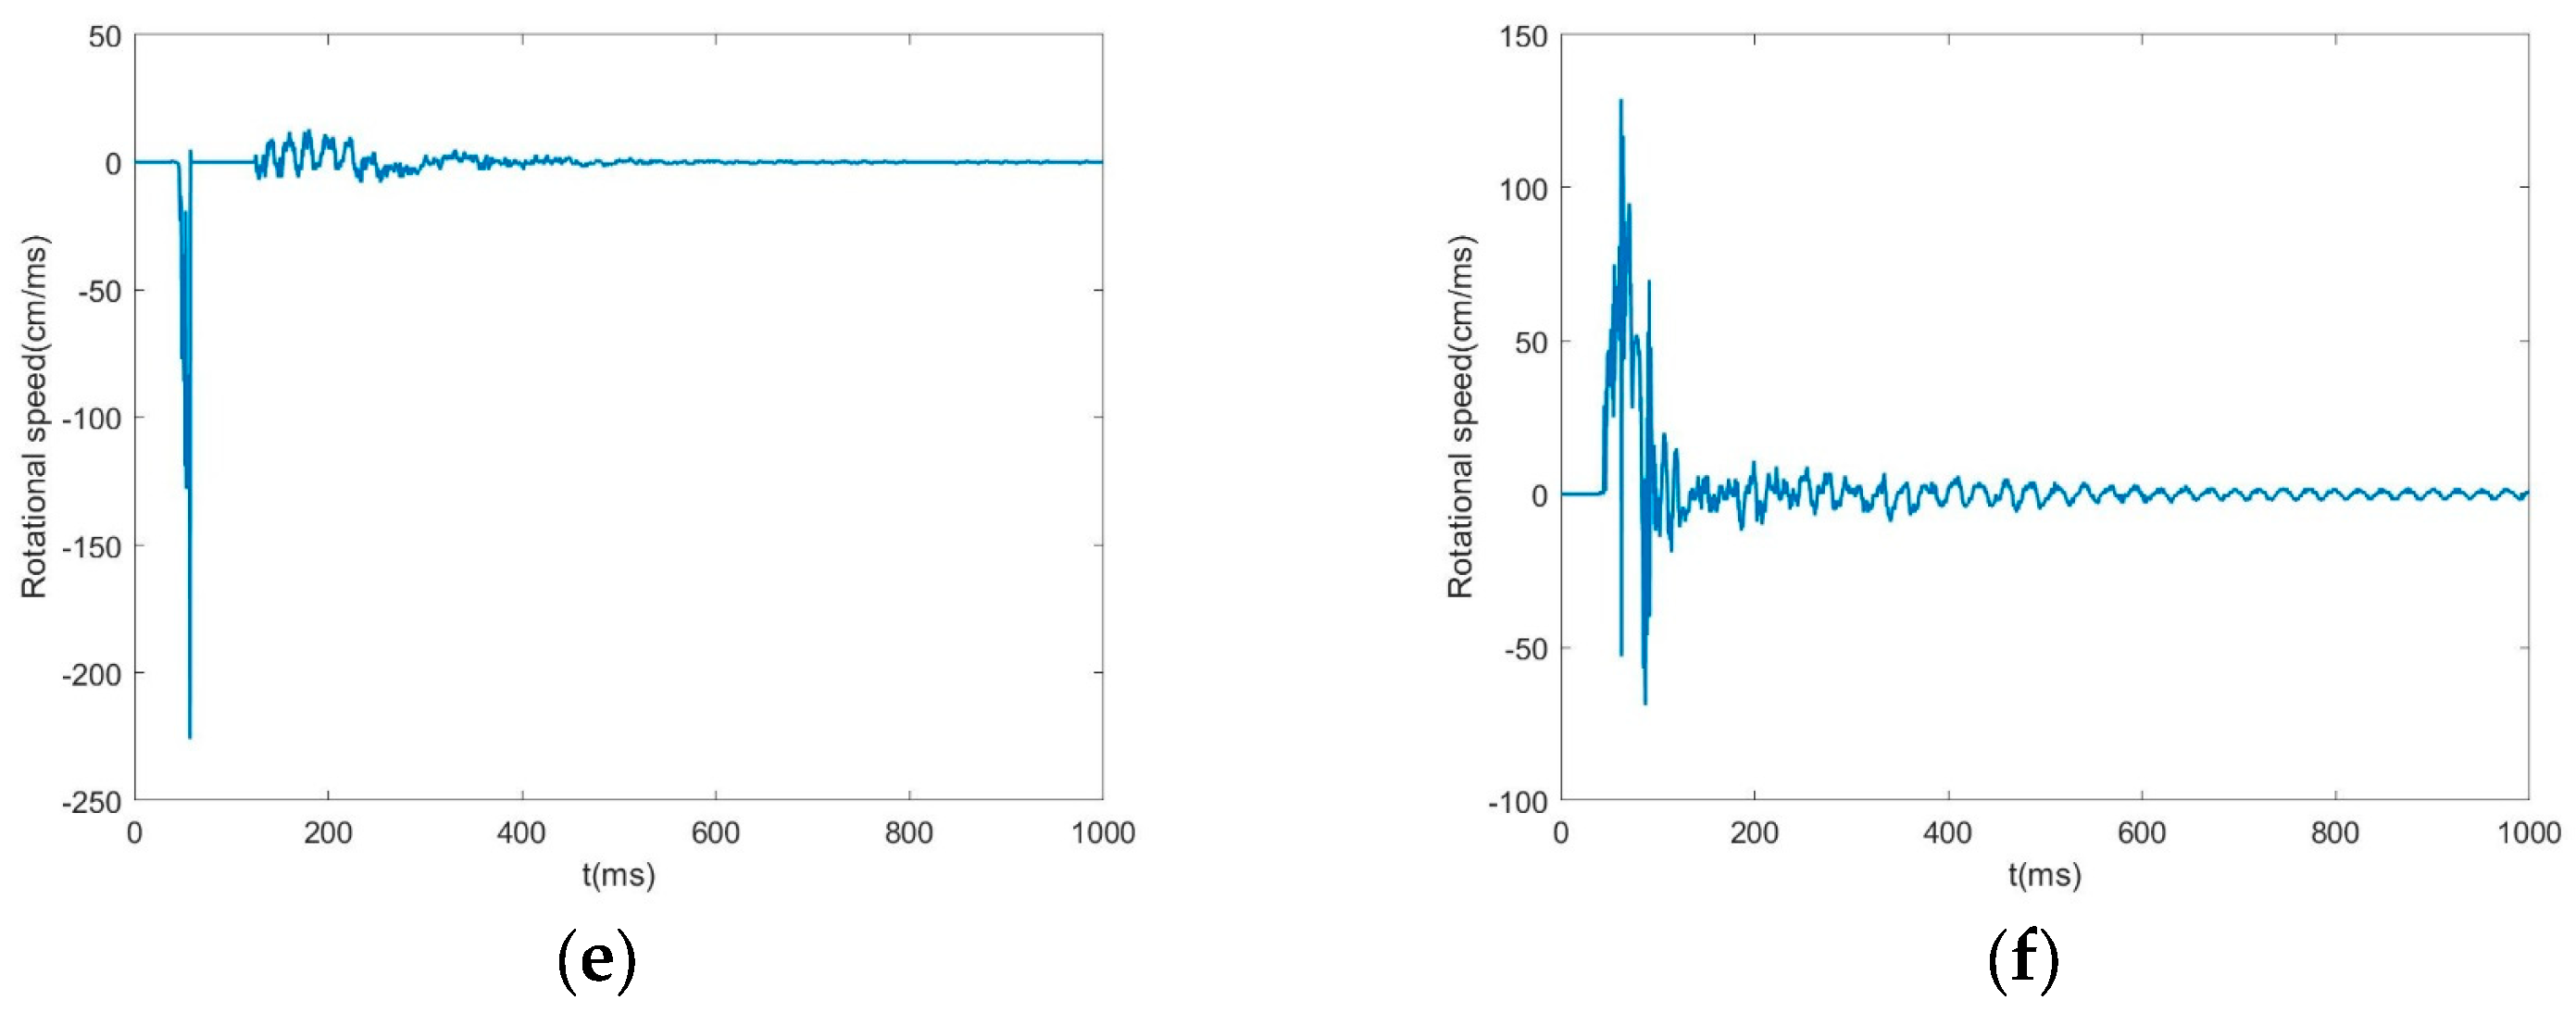
The signal is decomposed into multiple layers by wavelet, and all high-frequency coefficients of the signal are set to 0, that is, all high-frequency parts are filtered out. Then, the signal is reconstructed by wavelet. Taking the opening current signal as an example, the original signal and the signal after noise reduction by wavelet transform are shown in
Figure 7.
It can be seen from the results in the figure that the wavelet transform has a better noise reduction effect on the original signal. While removing the high-frequency interference components, it retains the information of the original signal.
3.3. Extraction of Signal Characteristic Information
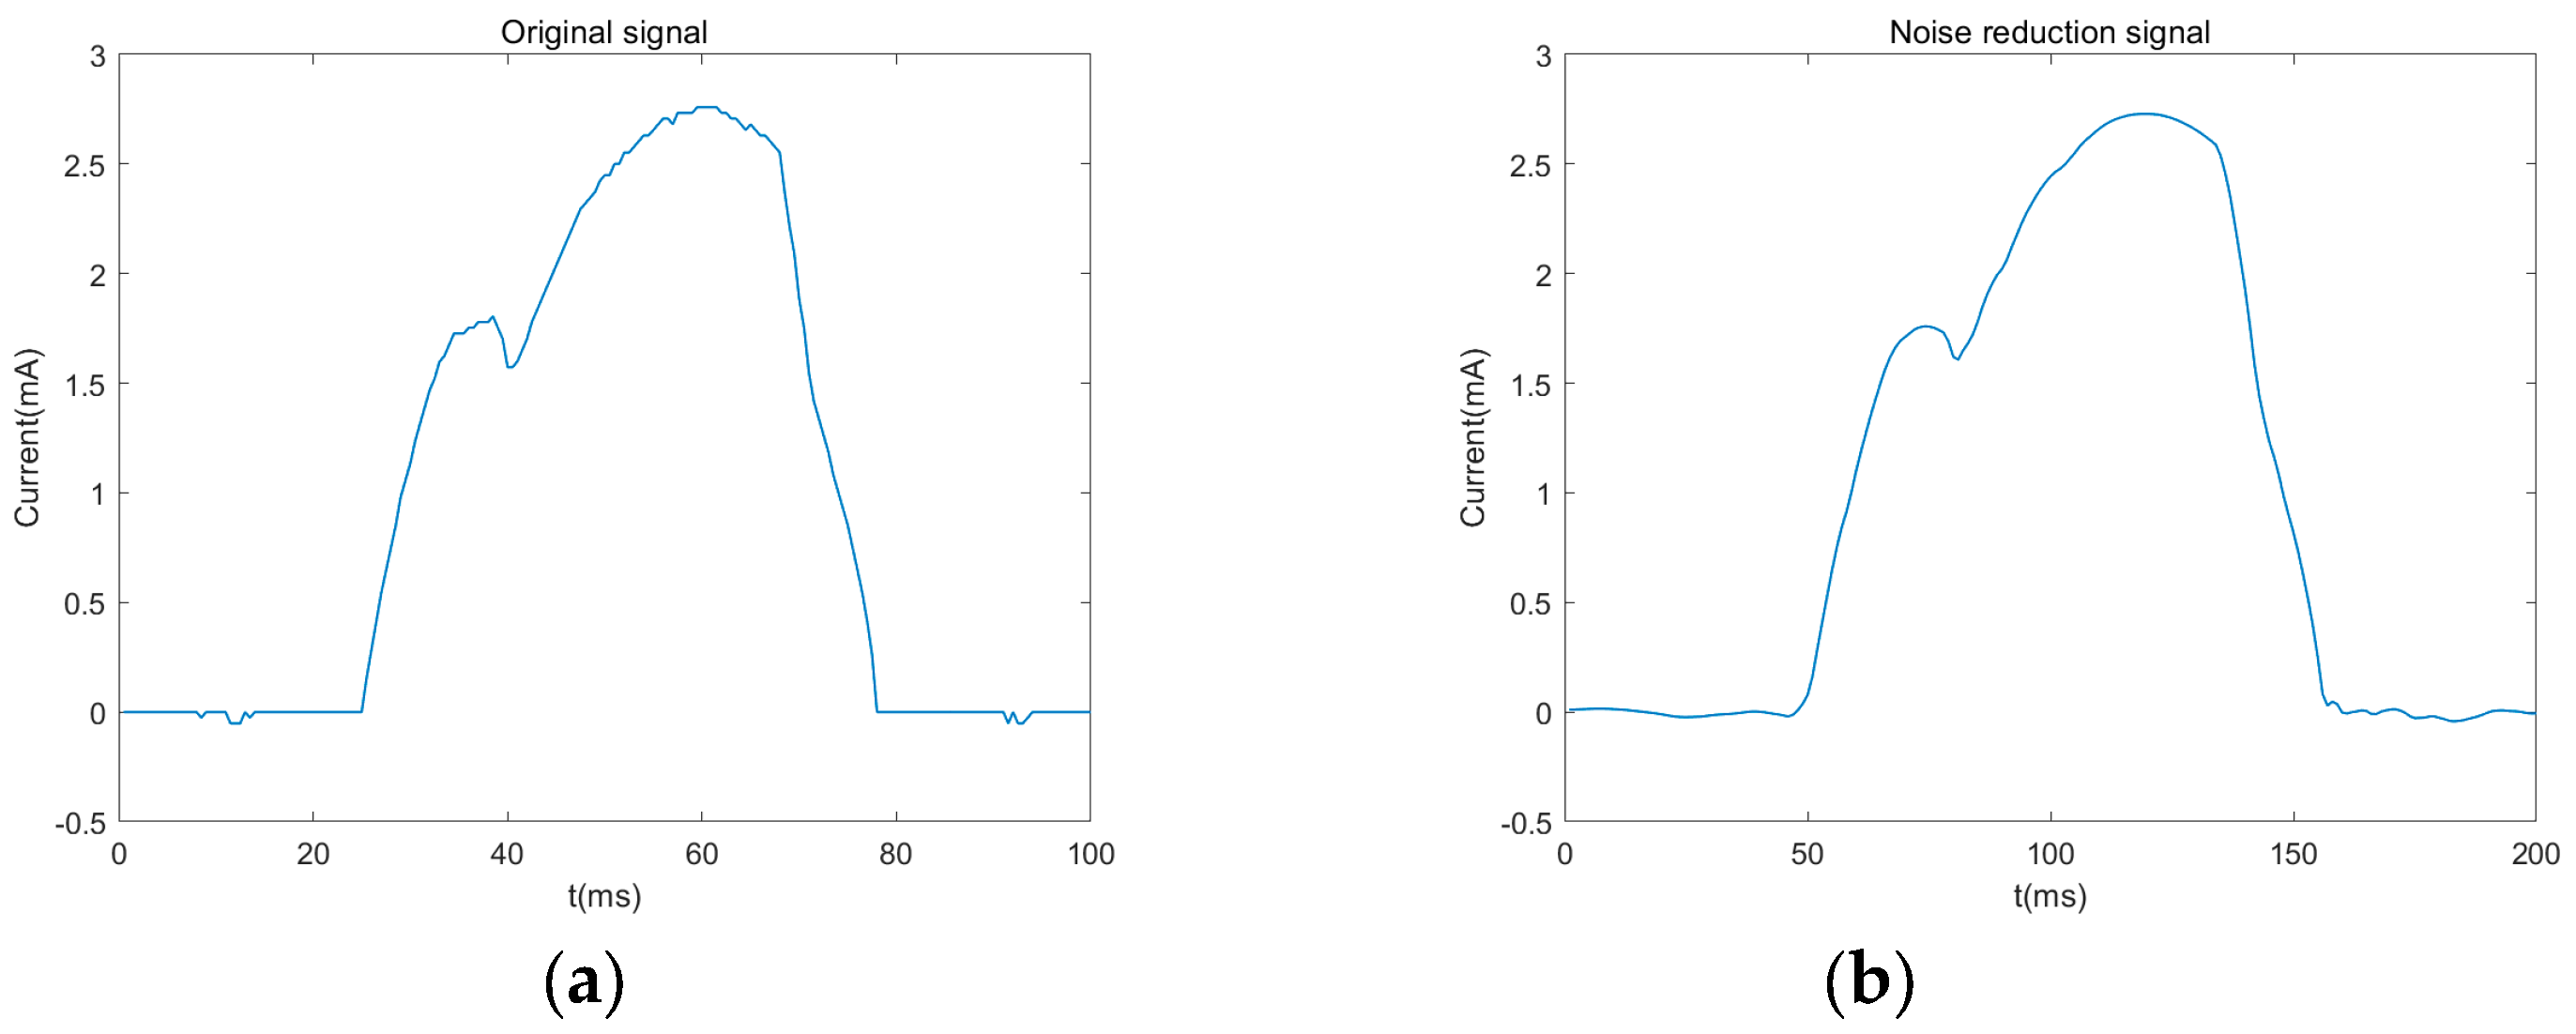
The various mechanical and electrical states of circuit breakers can be well reflected in signals such as current, displacement and pressure. Therefore, the determination and extraction of multi-dimensional eigenvalues are the key to conducting effective state monitoring and fault diagnosis for circuit breakers. In this paper, the characteristic data points are calculated by combining wavelet transform mutation detection with the extreme value method. The characteristic data in each signal are shown in
Figure 8.
Among them, and can fully reflect the movement characteristics during the opening process; the peak travel value can visually present the over-travel status of the circuit breaker, reflecting the status of key components such as the energy storage spring, buffer spring, and moving contact of the circuit breaker. The peak travel time can be used to determine whether the closing speed of the circuit breaker meets the requirements. represents the elastic force of the spring after energy storage, and this feature can be used to determine the energy storage state of the circuit breaker. and , respectively, represent the remaining elastic force of the spring after the closing process is completed and the time required for the release of the elastic force, which can be used to analyze the changes in the internal resistance of the circuit breaker. and , respectively, represent the maximum starting current of the motor and the time, which can be used to approximately determine the change in armature resistance.
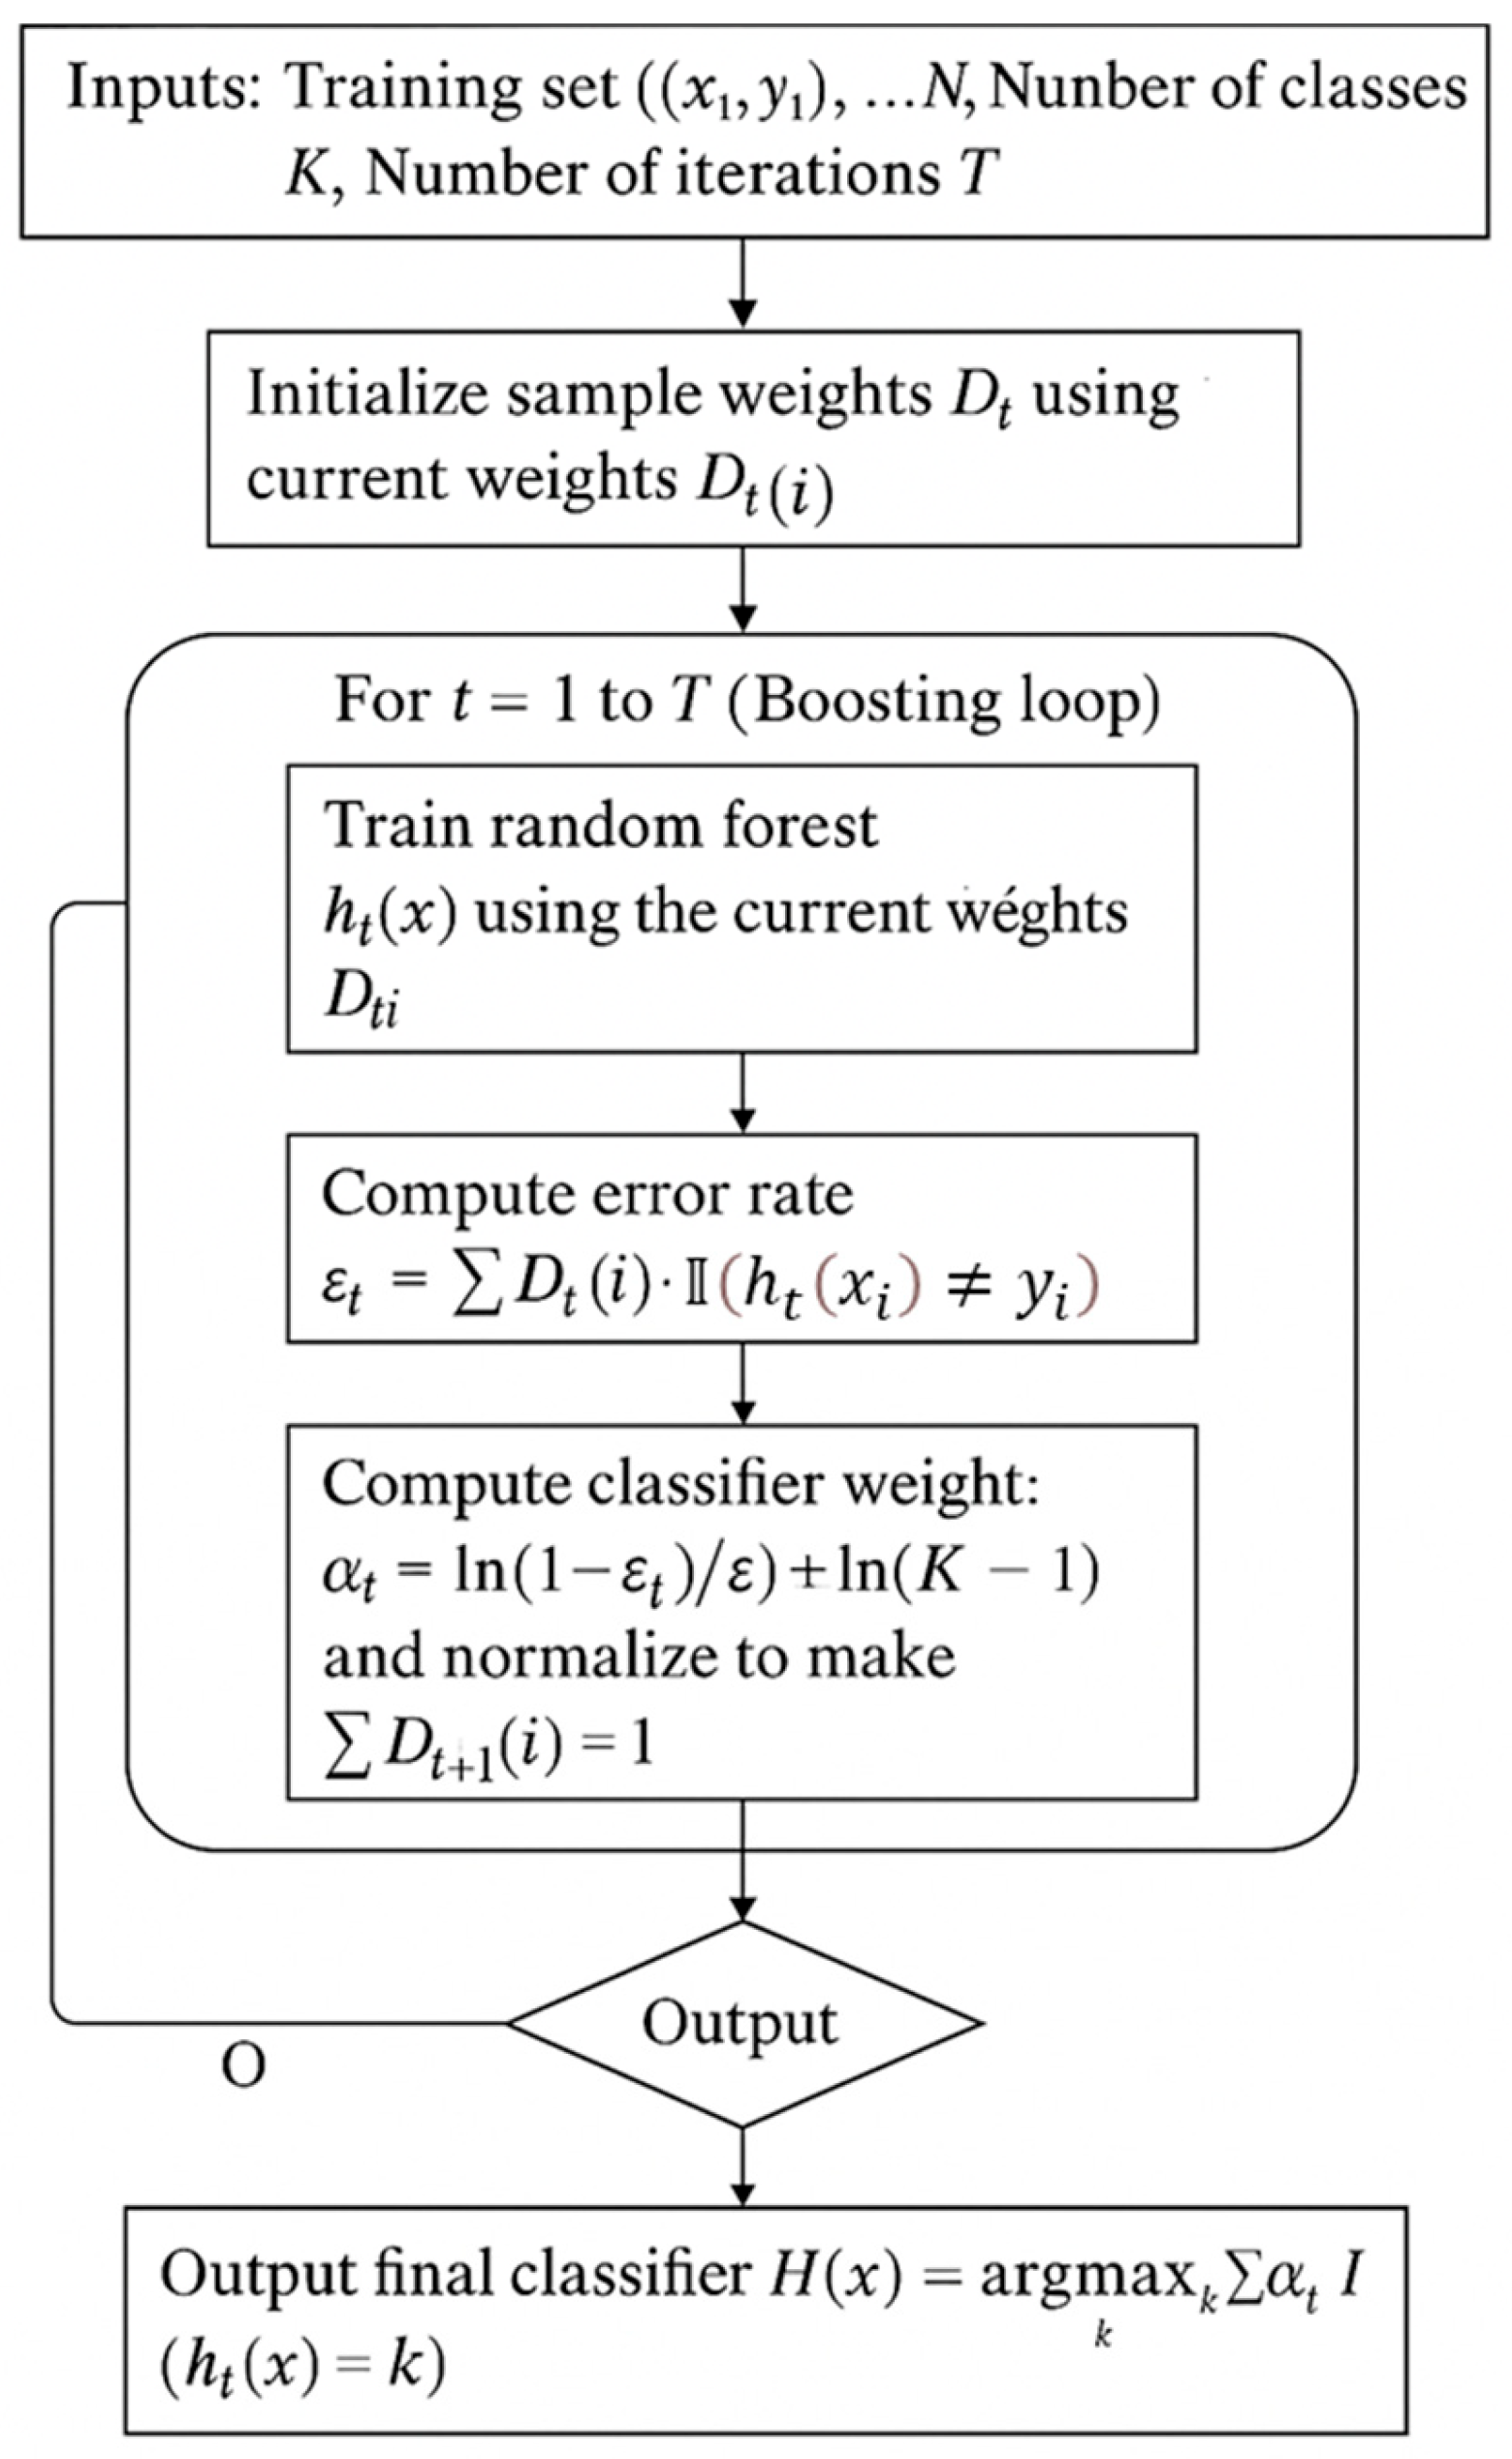
4. Fault Detection Model
Ensemble learning is a powerful strategy that improves the overall learning performance by combining multiple base classifiers. Among them, the Boosting series methods improve multiple weak classifiers to strong classifiers by gradually constructing weighted combined models and have good generalization ability. Adaboost, as one of the classic representatives of Boosting, performs well in binary classification problems [
29]. However, in multi-classification tasks, the standard Adaboost is not applicable and its extended form, the SAMME algorithm, needs to be relied upon. Furthermore, in order to enhance the expressive power and robustness of the base classifier, this paper adopts the Random Forest to replace the traditional weak learner and constructs the RF-Adaboost multi-classification model to achieve multi-fault detection of multi-sensor data of spring circuit breakers. Starting from the principle of Adaboost, the following systematically deduces its multi-classification generalization form and finally introduces the Random-Forest-based learner.
4.1. Adaboost Algorithm
The core idea of Adaboost is to take the exponential loss function as the optimization objective and continuously enhance the model’s attention to difficult-to-classify samples through iterative methods, thereby gradually improving the overall prediction accuracy. Let the training set be as follows:
In each round of iteration, the algorithm constructs a weak classifier
and assigns a weight
to it, and finally combines to form a strong classifier:
The final prediction function is as follows:
The core of each round of training lies in the update of the sample distribution
, which enables misclassified samples to receive higher attention. Initially, the weights of all samples are equal:
Then, the weighted error rate of the base classifier under the current distribution is calculated:
Then, its weight based on the error rate is calculated:
And the sample distribution is updated:
Among them,
is the normalization factor, which is used to ensure that the sum of the weights of all samples is 1:
From a theoretical perspective, what Adaboost minimizes is the exponential loss function under the additive model:
This type of loss function exponentially enhances the penalty intensity for misclassified samples, thereby making the model pay more attention to samples that are difficult to classify. This type of loss function exponentially enhances the penalty intensity for misclassified samples, thereby making the model pay more attention to samples that are difficult to classify.
4.2. Multi-Category Promotion of Adaboost
The original Adaboost algorithm is only applicable to binary classification problems and cannot directly handle multi-class (K > 2) cases. To solve this problem, Zhu et al. proposed SAMME (Stagewise Additive Modeling using a Multiclass Exponential loss function) in 2006. It retains the ideological framework of Adaboost and extends to multi-classification problems by modifying the loss function and weight formula.
Let the category label be
; a classification score function for all categories is constructed in SAMME:
The final classification decision function is as follows:
That is, the category with the highest score is selected as the prediction result. The weights of each round of the classifier are defined as follows:
This formula adds the term
on the basis of the original binary classification weight formula, reflecting the influence of the number of classification categories, thereby maintaining the theoretical convergence and the ability of the upper bound contraction of the error. The update method of the sample distribution is as follows:
It should be pointed out that SAMME does not directly update using category probabilities. Instead, it still relies on the consistency or difference between the predicted labels and the true labels, thereby simplifying the reasoning process.
4.3. Random Forest Classifier
In the traditional Adaboost, the base classifiers are mostly decision stumps, that is, univariate weak classifiers. However, its expressive ability is limited, and coping with high-dimensional or complex pattern recognition tasks is difficult. To improve the performance of the model, this paper adopts the Random Forest as the base learner.
Random Forest was proposed by Breiman in 2001. It is an ensemble learning algorithm based on the idea of Bagging (Bootstrap Aggr-gating), mainly composed of multiple decision trees. This method constructs a group of independent and significantly different base learners through the strategies of “self-service sampling method” and “random feature selection” and synthesizes the final prediction results through the voting mechanism, thereby improving the generalization ability and stability of the model.
Each tree is constructed using the CART (Classification and Regression Tree) algorithm. Take the classification task as an example. During the splitting process of each node, the impurity of Gini is adopted as the division criterion:
Among them, is the sample set of the current node; and represents the sample proportion of category in this node.
The optimal partition is the one that minimizes the weighted Gini index of the left and right child nodes:
The construction of the tree continues until a certain stopping condition is reached (such as the maximum depth, the minimum number of samples, etc.).
For the training set , when the Random Forest constructs the JTH tree, it will resample from the original training set times to form a training subset . Each subset contains about 63.2% of the original sample (with ). The samples that are not sampled are called “out-of-bag samples” (OOB) and are used for model evaluation.
During the splitting process of each node, instead of using all features, features (usually is 14) are randomly selected from them for the best partitioning selection. This mechanism enhances the differences among base learners and reduces the risk of overfitting.
In the classification task, the majority voting method is used:
Here, represents the number of decision trees in the forest, and represents the prediction of the JTH tree.
4.4. RF-Adaboost Algorithm
The flowchart of the RF-Adaboost algorithm is shown in
Figure 9. F-Adaboost combines the high accuracy of AdaBoost with the robustness of Random Forest. It enhances classification performance by adaptively focusing on hard-to-classify samples while maintaining strong generalization ability and resistance to overfitting. Moreover, it handles multiclass problems effectively and is robust to noise and class imbalance.
To optimize the key parameters of the RF-Adaboost model—namely, the number of trees (trees) and the minimum leaf size (minleaf) in the Random Forest base learner—we employed the Crested Porcupine Optimization (CPO) algorithm, a metaheuristic global optimizer. The search ranges were defined as [1, 200] for trees and [1, 40] for minleaf, based on prior experience and computational feasibility, and the selected number of iterations was K = 3.
The fitness function was defined as the negative classification accuracy on the test set to ensure maximization of predictive performance. The optimization was run for 100 iterations with a population size of 20, and the best-performing parameter set was selected as the final configuration. This approach enables automatic, data-driven hyperparameter tuning while reducing the risk of manual overfitting. The selected parameters are robust across multiple runs and lead to strong classification performance, as shown in the results.
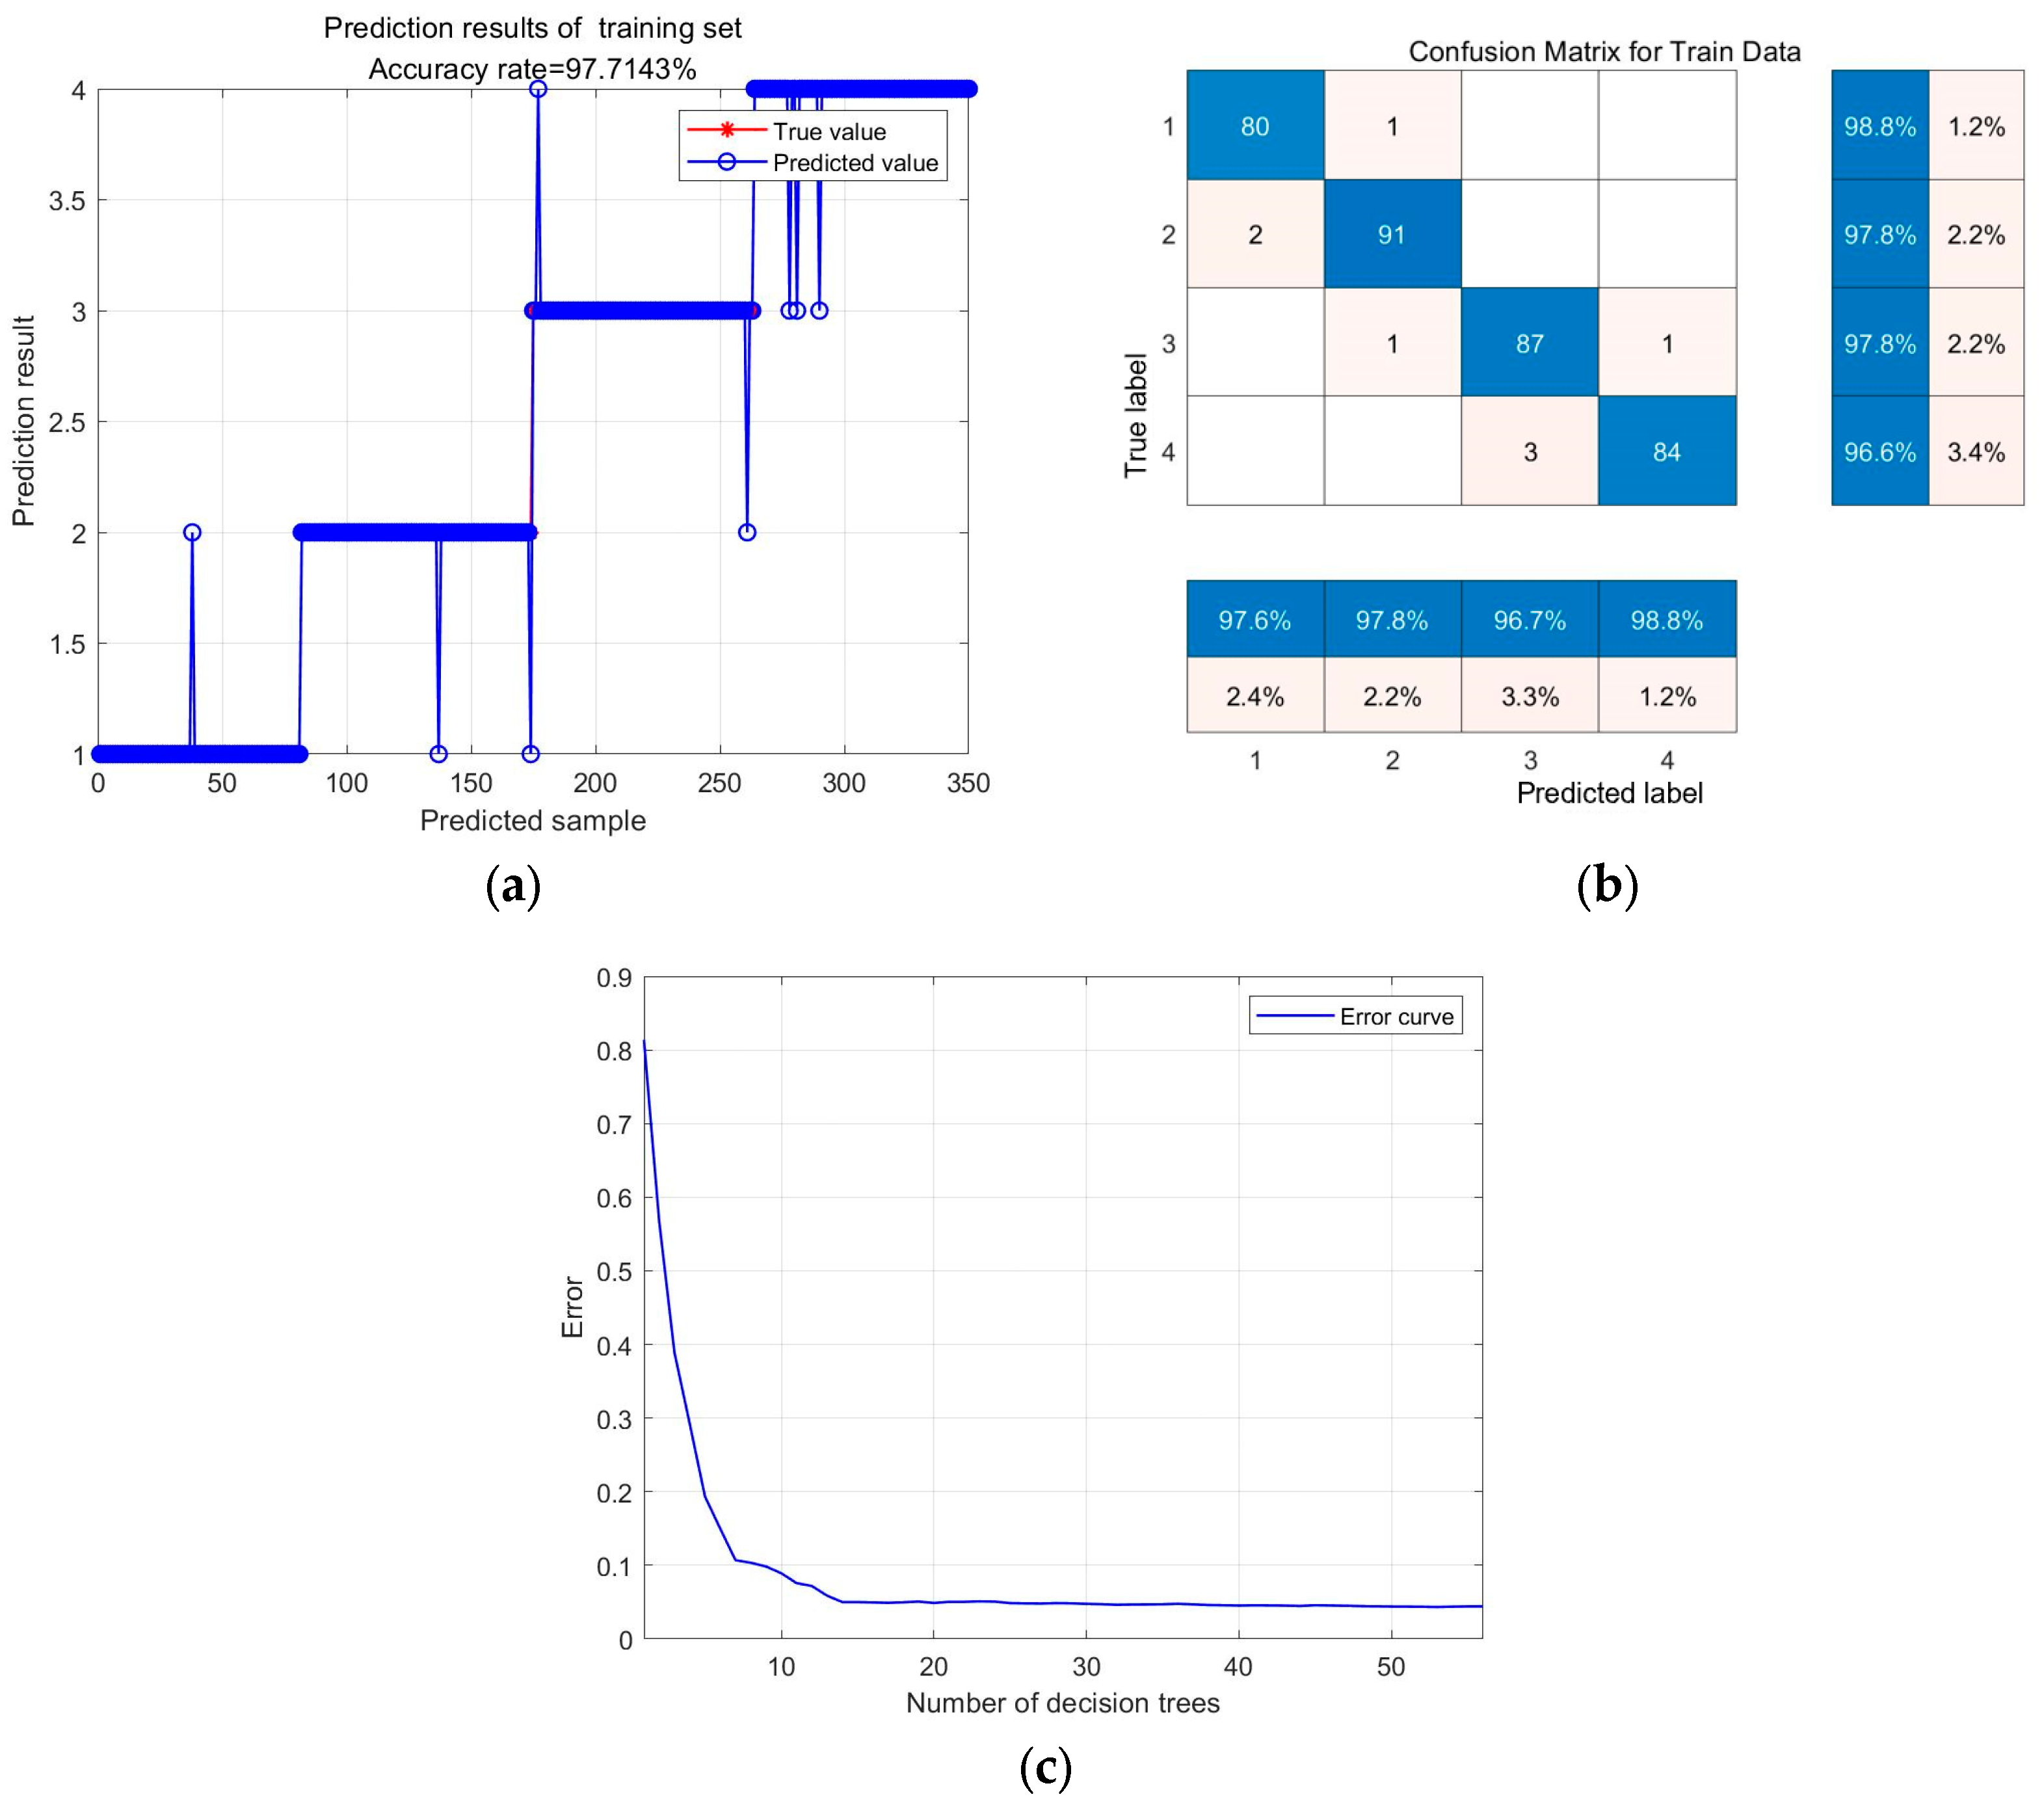
In model training, 350 sets of data were selected as the training set and the rest as the test set while ensuring that all types of samples were essentially balanced. The training results are shown in
Figure 10. Among them, categories 1 to 4 are, respectively, the voltage offset of the opening and closing coil, the fatigue of the reset spring of the opening and closing switch, the fatigue of the closing spring, and the normal state. It can be seen that, in the training results, the overall accuracy rate is 97.71%, and at the same time, the detection accuracy rate for each state remains above 96%, which is highly accurate. It can be observed from the error curve that with the increase in the number of decision trees, the training error decreases significantly.
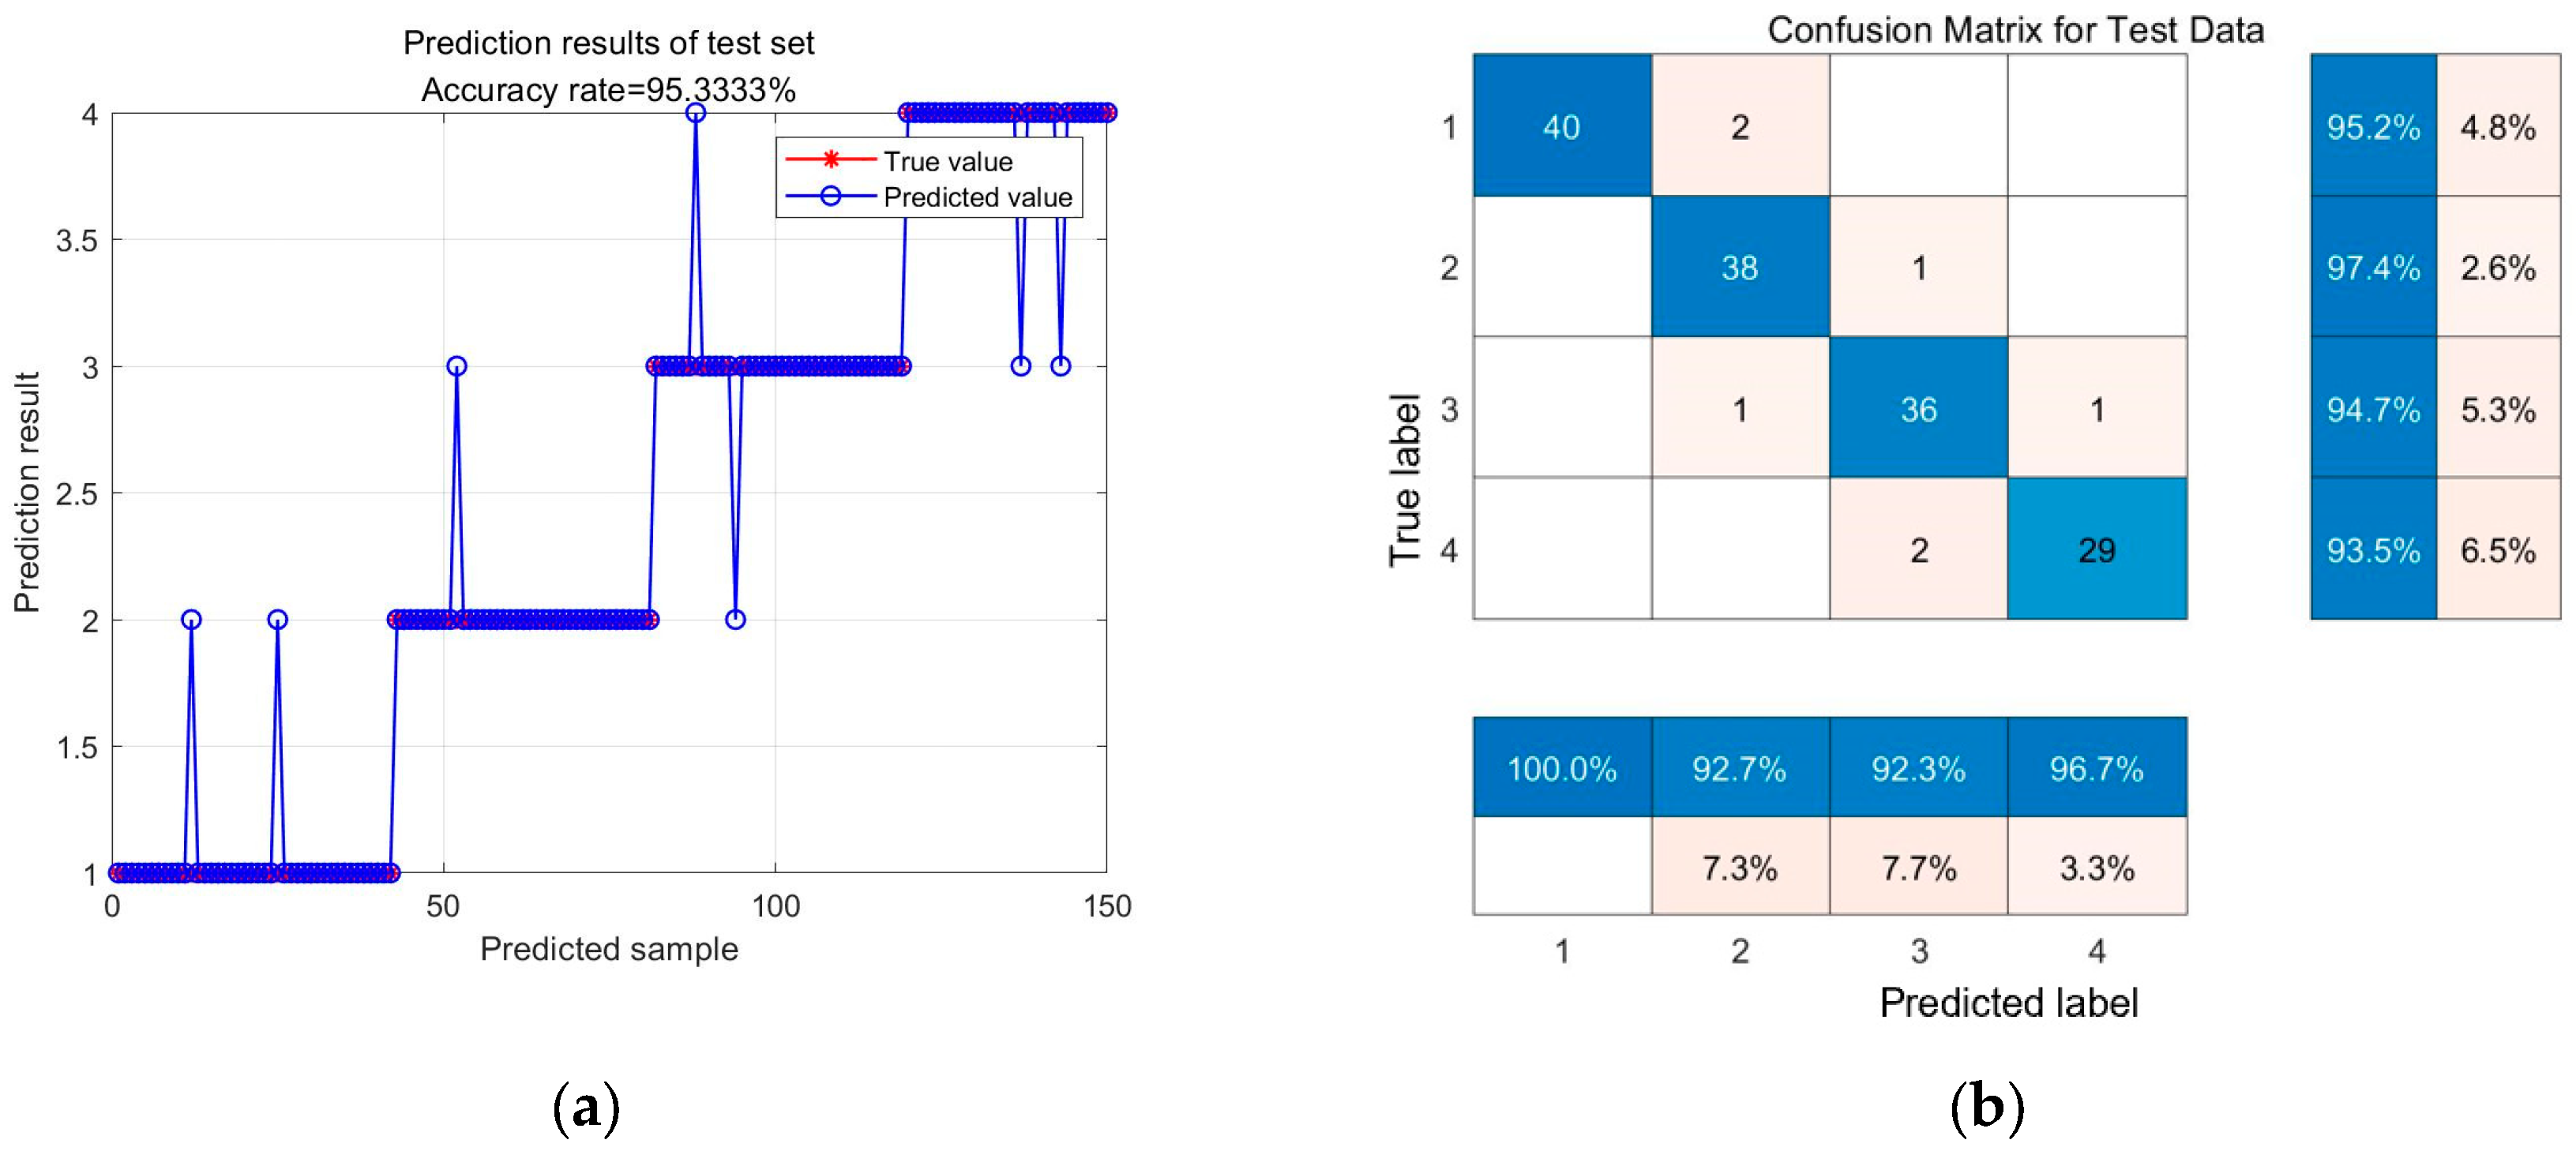
The remaining data were selected as the test set, and the training results are shown in
Figure 11. In the training results, the overall accuracy rate was 95.33%, still maintaining a very high level. Meanwhile, the detection accuracy rate for each state remained above 93%. For the test set confusion matrix, the classification accuracy was 93.8%, with a 95% CI of [91.2%, 96.0%], indicating statistically reliable performance. The McNemar test yielded a
p-value of 0.21, suggesting that misclassifications were not significantly biased or systematically distributed. The experimental results above indicate that the multi-sensor data fault detection method for spring circuit breakers based on the RF-Adaboost algorithm proposed in this paper has a high accuracy rate, can accurately identify the operating status of spring circuit breakers, and fully ensures the safe and stable operation of the power grid.
To ensure the rigor of the model, we outlined the conditions under which the RF-Adaboost model and its associated mathematical framework may become less effective or inapplicable. Specifically:
Insufficient or highly imbalanced training data: The ensemble classifier relies on sufficient representative samples per class. In cases of extreme class imbalance, the model may overfit or become biased.
Non-stationary signal conditions: The model assumes signal stationarity within a single operation cycle. If sensor signals exhibit strong time-varying drift or unstable baselines (e.g., due to aging or sensor degradation), feature extraction and classification accuracy may degrade.
Drastically different circuit breaker models: The model was trained on a specific type of spring-operated breaker. Applying the model to devices with different mechanical structures, control schemes, or actuation mechanisms may lead to domain mismatch unless transfer learning is applied.
4.5. Comparison with Traditional Classifier
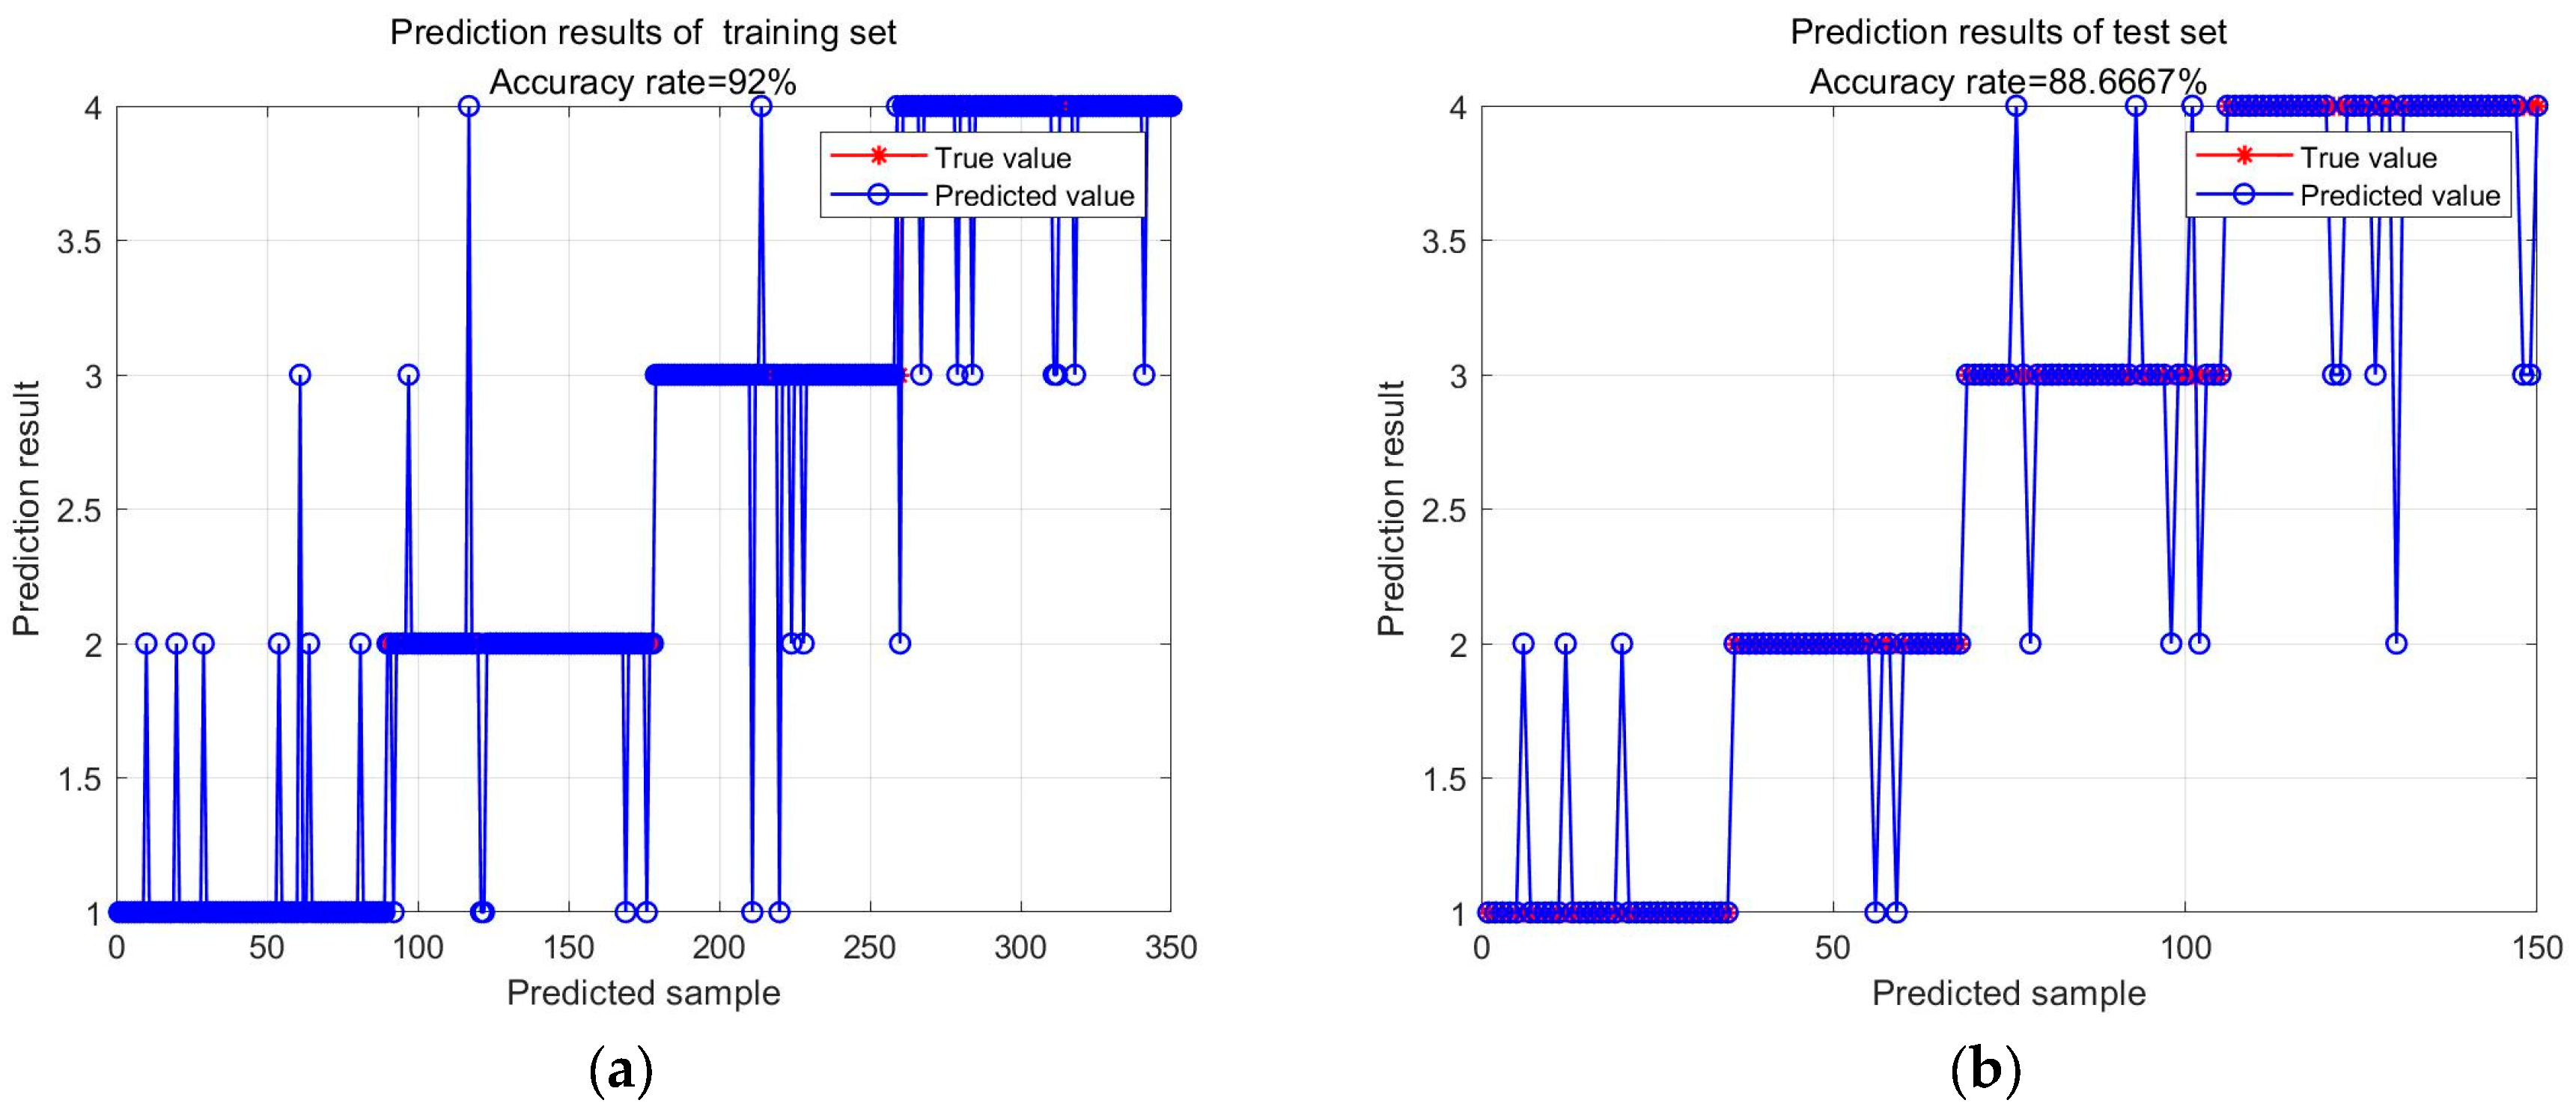
To further validate the effectiveness and robustness of the proposed RF-Adaboost method, a comparative experiment was conducted using a conventional Support Vector Machine (SVM) classifier. The SVM has been widely used in mechanical fault diagnosis due to its strong generalization capability in high-dimensional spaces and limited-sample scenarios.
In this experiment, the same dataset and extracted features described in
Section 3.3 were used. A radial basis function (RBF) kernel was adopted for the SVM, and hyperparameters (C and gamma) were tuned via grid search on the training set. The experimental results are shown in
Figure 12.
Based on the same experimental premise, the accuracy rates of the training set and test set of the SVM algorithm are 92% and 88.67%, respectively. Compared with the algorithm proposed in this paper, the accuracy rates are significantly lower, verifying the advantages of the method proposed in this paper.
5. Conclusions
This paper proposed a multi-sensor fault detection method for spring-operated circuit breakers based on the RF-Adaboost algorithm. By integrating pressure, speed, coil current, and energy storage motor sensors into the operating mechanism, comprehensive operational data were collected. After wavelet-based denoising and feature extraction, a robust RF-Adaboost multi-class classifier was developed. The experimental results show that the model achieved an overall classification accuracy of 97.71% on the training set and 95.33% on the testing set. Meanwhile, the method proposed in this paper was compared with the SVM algorithm to verify the advantages of the method proposed in this paper. These results demonstrate the model’s high effectiveness in identifying mechanical faults in circuit breakers under real-world conditions. The method exhibits strong generalization and robustness, providing practical support for condition-based maintenance and online monitoring in power systems.
Future research will focus on extending the model to field conditions, improving interpretability, and enabling deployment on embedded platforms. Additionally, expanding to more fault types and exploring transfer learning across device types will further enhance model applicability.


