Article

State-Aware Energy Management Strategy for Marine Multi-Stack Hybrid Energy Storage Systems Considering Fuel Cell Health

Logistics Engineering College, Shanghai Maritime University, Shanghai 201308, China
*
Author to whom correspondence should be addressed.
Energies 2025, 18(15), 3892; https://doi.org/10.3390/en18153892
Submission received: 17 June 2025 / Revised: 14 July 2025 / Accepted: 19 July 2025 / Published: 22 July 2025

Abstract

To address the limitations of conventional single-stack fuel cell hybrid systems using equivalent hydrogen consumption strategies, this study proposes a multi-stack energy management strategy incorporating fuel cell health degradation. Leveraging a fuel cell efficiency decay model and lithium-ion battery cycle life assessment, power distribution is reformulated as an equivalent hydrogen consumption optimization problem with stack degradation constraints. A hybrid Genetic Algorithm–Particle Swarm Optimization (GA-PSO) approach achieves global optimization. The experimental results demonstrate that compared with the Frequency Decoupling (FD) method, the GA-PSO strategy reduces hydrogen consumption by 7.03 g and operational costs by 4.78%; compared with the traditional Particle Swarm Optimization (PSO) algorithm, it reduces hydrogen consumption by 3.61 g per operational cycle and decreases operational costs by 2.66%. This strategy ensures stable operation of the marine power system while providing an economically viable solution for hybrid-powered vessels.

1. Introduction

International maritime transportation is the dominant mode of transportation in international logistics. Compared to air freight and other modes of transportation, shipping is the most economical and environmentally friendly method of transporting goods over long distances. However, with the increasing volume of shipments from all over the world in recent years, people are becoming more and more worried about the emission of pollution from ship shipping. Ships emit a wide variety of pollutants such as oily water, nitrous oxide, nitrogen monoxide, particulate matter, and greenhouse gases during their voyages. According to the International Maritime Organization (IMO), carbon dioxide emissions from international shipping may increase by 250% by 2050 [1]. In this context, proton exchange membrane fuel cells (PEMFCs) have been increasingly adopted in the shipbuilding field in recent years due to their high energy conversion efficiency and zero-pollution emissions of water and water vapor [2]. Furthermore, renewable energy sources have gained widespread recognition as viable alternatives to fossil fuels. However, their inherent intermittency and variability, stemming from the unpredictable nature of natural resources like sunlight and wind, pose significant challenges to ensuring stable energy supply and achieving large-scale deployment. Electrolysis for green hydrogen production offers a promising solution. It serves not only as a key pathway to obtain clean hydrogen energy but also as an effective means to mitigate the intermittency and fluctuation issues associated with renewables [3]. This dual benefit significantly enhances the appeal and practicality of fuel cells, further bolstering their adoption as power generation units and propulsion systems, particularly in transportation. Proton exchange membrane fuel cell (PEMFC) technology has undergone extensive research in maritime applications, and its practical implementation in modern ship-building has markedly accelerated in recent years. Global research teams are now actively investigating the integration of fuel cell hybrid energy storage systems for all-electric vessels [4].
While conventional fuel cell vessels predominantly employ single-stack fuel cell systems coupled with lithium-ion batteries, this configuration encounters critical power density limitations when scaled for large commercial vessels engaged in international trade routes. Specifically, the maximum continuous rated power of single-stack architectures becomes constrained under sustained heavy-load operations. Maritime fuel cell systems employing multi-stack architectures demonstrate superior operational flexibility compared to single-stack configurations. To satisfy propulsion and auxiliary power requirements in commercial-scale applications, contemporary marine designs increasingly adopt hybrid systems integrating multi-stack fuel cells with advanced energy storage units. For example, in Ref. [5], The authors propose a Particle Swarm Optimization algorithm for power allocation in multi-stack fuel cell powertrains, utilizing dual-stack fuel cells and lithium-ion batteries to minimize hydrogen consumption. In Ref. [6], the authors implemented a PSO-based equivalent consumption minimization strategy (ECMS) for real-time power allocation between dual-stack fuel cells and lithium-ion batteries, achieving enhanced hydrogen consumption minimization and improved state of charge (SOC) management.
Beyond power constraints, the lifespan and degradation of fuel cells are also critical factors. The state of health (SOH) of a fuel cell is a key indicator reflecting the degree of performance degradation of a fuel cell stack during long-term operation. It is generally defined as the ratio of the fuel cell’s maximum output performance (such as maximum output power, rated current density, etc.) under the current state to its initial performance in a brand-new state (SOH = current performance/initial performance × 100%). For PEMFCs, the degradation of SOH is mainly associated with the degradation processes of core components, including the aging of proton exchange membranes, the decline in catalyst activity, and the corrosion of carbon supports. This directly reflects the remaining service life and reliability of the fuel cell stack. The SOH of fuel cells exerts a significant impact on the development of energy management strategies for PEMFCs [7]. To address the challenge of low durability in PEMFCs and ensure their consistent and reliable performance throughout the operational cycle, it is essential to adopt necessary management measures and system maintenance during the use of fuel cells. This includes monitoring SOH and predicting the future aging trends of PEMFCs. During prolonged operation, their performance gradually deteriorates due to complex operating conditions and component aging, eventually dropping to the minimum acceptable threshold. As noted in research on proton exchange membrane fuel cell degradation prediction using Transformer models, such performance decline not only impairs efficiency and output power but also shortens service life and raises maintenance and replacement costs. To tackle how the limited lifespan of fuel cells hinders their commercialization, numerous researchers have been continuously exploring health indicators and prediction models for these cells. For example, in Ref. [8], The authors put forward the Virtual Relative Power Loss Rate (VRPLR) as a health indicator for fuel cells, which markedly reduces the correlation with current. To tackle the overfitting issue caused by the reversible voltage loss recovery phenomenon, they developed an LSTM model with a forced forgetting gate. This improved model achieves a prediction range of 472 h, 46% longer than that of traditional models, while cutting down the multi-step prediction error by around 50%. In Ref. [9], the authors employed both model-based methods and a combinatorial optimized data-driven approach integrating PSO and LSSVM to predict the remaining useful life of proton exchange membrane fuel cells. The results demonstrated that the combinatorial optimization algorithm achieved high prediction accuracy, offering a reference for fuel cell health management in terms of fault identification and life prediction.
Conventional energy management systems (EMS) for fuel cell-powered vessels primarily employ rule-based or proportional-integral (PI) control strategies. While these approaches offer straightforward implementation, they fail to deliver optimal energy distribution for multi-stack configurations or accommodate dynamic load variations characteristic of maritime operations, such as transient power requirements during vessel docking and anchorage maneuvers. Consequently, optimization-based energy management strategies demonstrate superior performance in large-scale marine fuel cell systems. Optimization-based energy management strategies adaptively regulate power distribution according to vessel operational profiles, effectively addressing excessive generation, frequent energy storage cycling, and auxiliary system inefficiencies inherent in conventional rule-based approaches. For example, in Ref. [10], the authors employed a two-dimensional dynamic programming algorithm to determine the global optimal policy and utilized a two-dimensional Pontryagin’s least-squares principle algorithm to acquire the optimal policy. In Ref. [11], the authors implemented stochastic dynamic programming to enhance fuel cell longevity while maintaining fuel efficiency in hybrid vehicle powertrains, achieving 14% extended fuel cell service life with merely 3.5% incremental hydrogen consumption. In Ref. [12], the authors develop a dictionary-order-augmented constraint optimization method for coordinated voyage planning and multi-objective scheduling of ship power systems with hybrid energy storage systems. In Ref. [13], the authors establish a distributed variable-slope control strategy with adaptive energy management to improve state-of-charge balancing in marine energy storage devices. In Ref. [14], the authors model time-varying hydrogen consumption and efficiency by incorporating fuel cell degradation rates, proposing a dual-mode energy management strategy for co-optimizing energy consumption and fuel cell performance. In Ref. [15], the authors formulate the original nonlinear problem as a mixed-integer linear programming model, solving it through an enhanced ε-constraint method to simultaneously reduce operational costs and emissions.
For large fuel cell vessels, energy management strategies and fuel cell lifespan hold equal importance. For example, in Ref. [16], the authors focus on hybrid fuel cell–electric ship energy management, proposing an optimization model that simultaneously considers fuel cell degradation costs and hydrogen consumption. The study transforms nonconvex voyage constraints into convex formulations while applying linearization techniques to address nonlinear degradation factors including start–stop cycles and power fluctuations. This mixed-integer programming approach minimizes total operational costs (fuel + degradation), with simulations showing the strategy reduces fuel cell aging costs to 13% of conventional methods, confirming its effectiveness in prolonging stack service life. In Ref. [17], the authors proposed an adaptive equivalent consumption minimization strategy (AECMS) for hybrid fuel cell marine power systems to address efficiency degradation. By establishing a time-varying efficiency model, this study quantitatively links efficiency degradation to operational conditions and dynamically adjusts the energy management objective function using degradation factors. The simulation results demonstrate 5.05% efficiency improvement and 3.32% equivalent hydrogen consumption reduction across degradation stages (slight, semi-degraded, severe), effectively mitigating performance decline impacts on system economy. In Ref. [18], the authors developed a deep learning-based energy management strategy for fuel cell hybrid ships, achieving multi-objective optimization of voyage cost, fuel cell lifespan, and battery state of charge through action space design optimization. This method converts fuel cell degradation into cost terms within the reward function. In Ref. [19], the authors implemented a dynamic programming-based optimization method to determine component sizing, baseline power control, and energy management strategies for engine–battery systems. The framework integrates real-time optimal control using extended Kalman filtering with model predictive control, accurately predicting propulsion power demand and battery health through operational data and degradation models.
Previous studies have mainly focused on two research priorities, such as integrating energy management strategies with fuel cell lifespan optimization, but have not addressed the challenges of multi-stack configurations. Building on previous research, this paper proposes a marine fuel cell hybrid power system that combines a dual-stack fuel cell system with a lithium battery system. Compared with single-stack fuel cells, the dual-stack configuration has a broader load power coverage and stronger fault tolerance—if one stack fails, the other can continue to operate. The experimental framework takes into account both fuel cell efficiency and lifespan and adopts a novel energy management strategy that integrates the Genetic Algorithm (GA) and Particle Swarm Optimization (PSO) algorithm, comparing it with the PSO algorithm and Frequency Decoupling (FD) algorithm. This hybrid approach is compared with the traditional PSO algorithm, aiming to synergize the global search capability of GA and the local search efficiency of PSO, thereby achieving faster convergence speed and better solution quality.

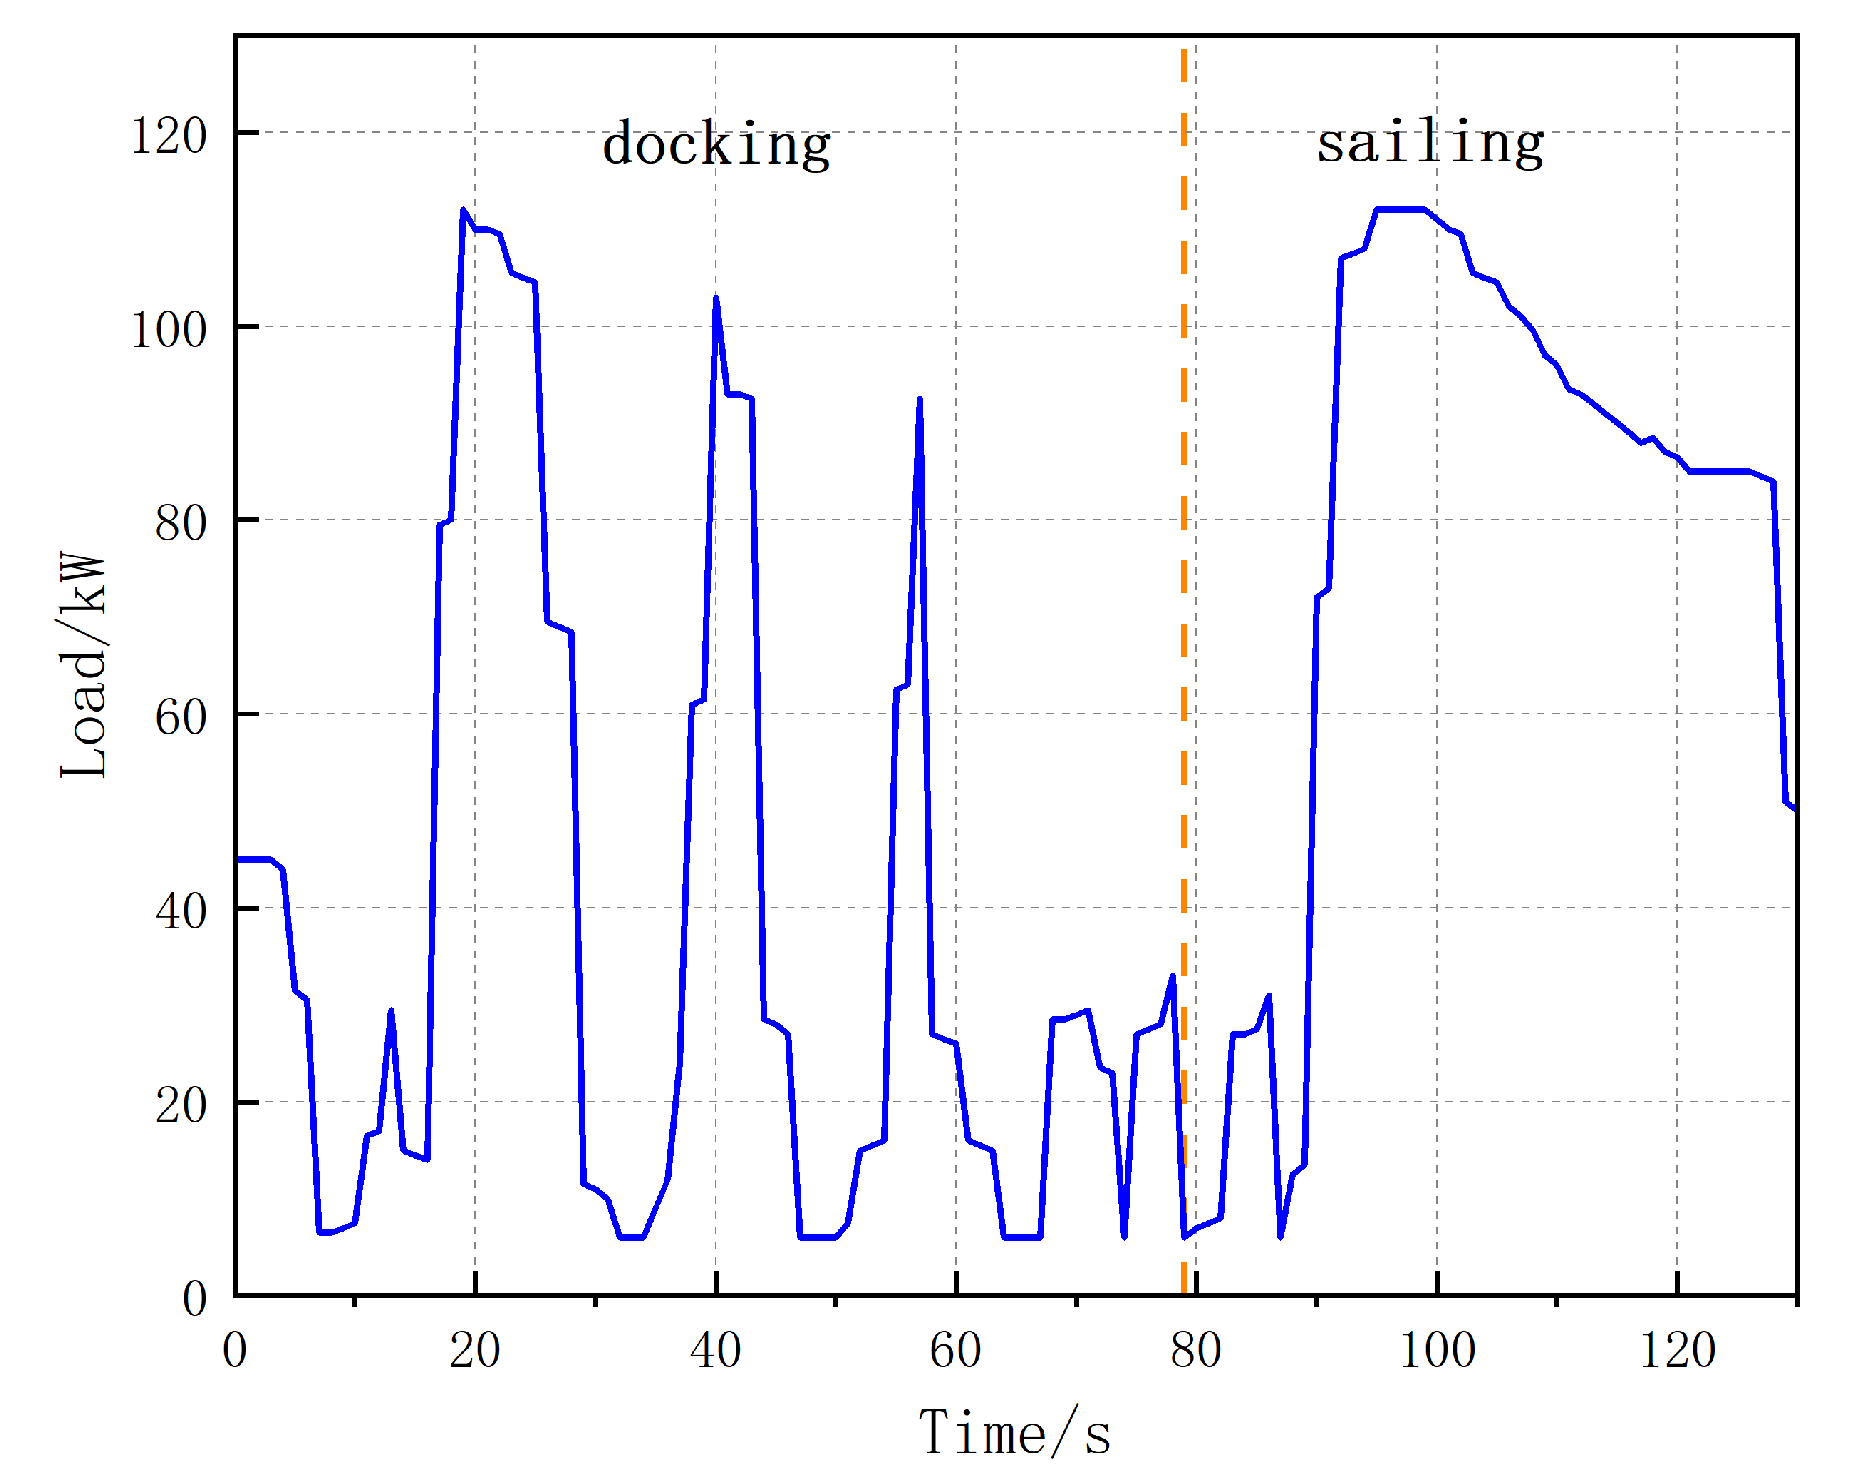
2. Ship Simulation Model

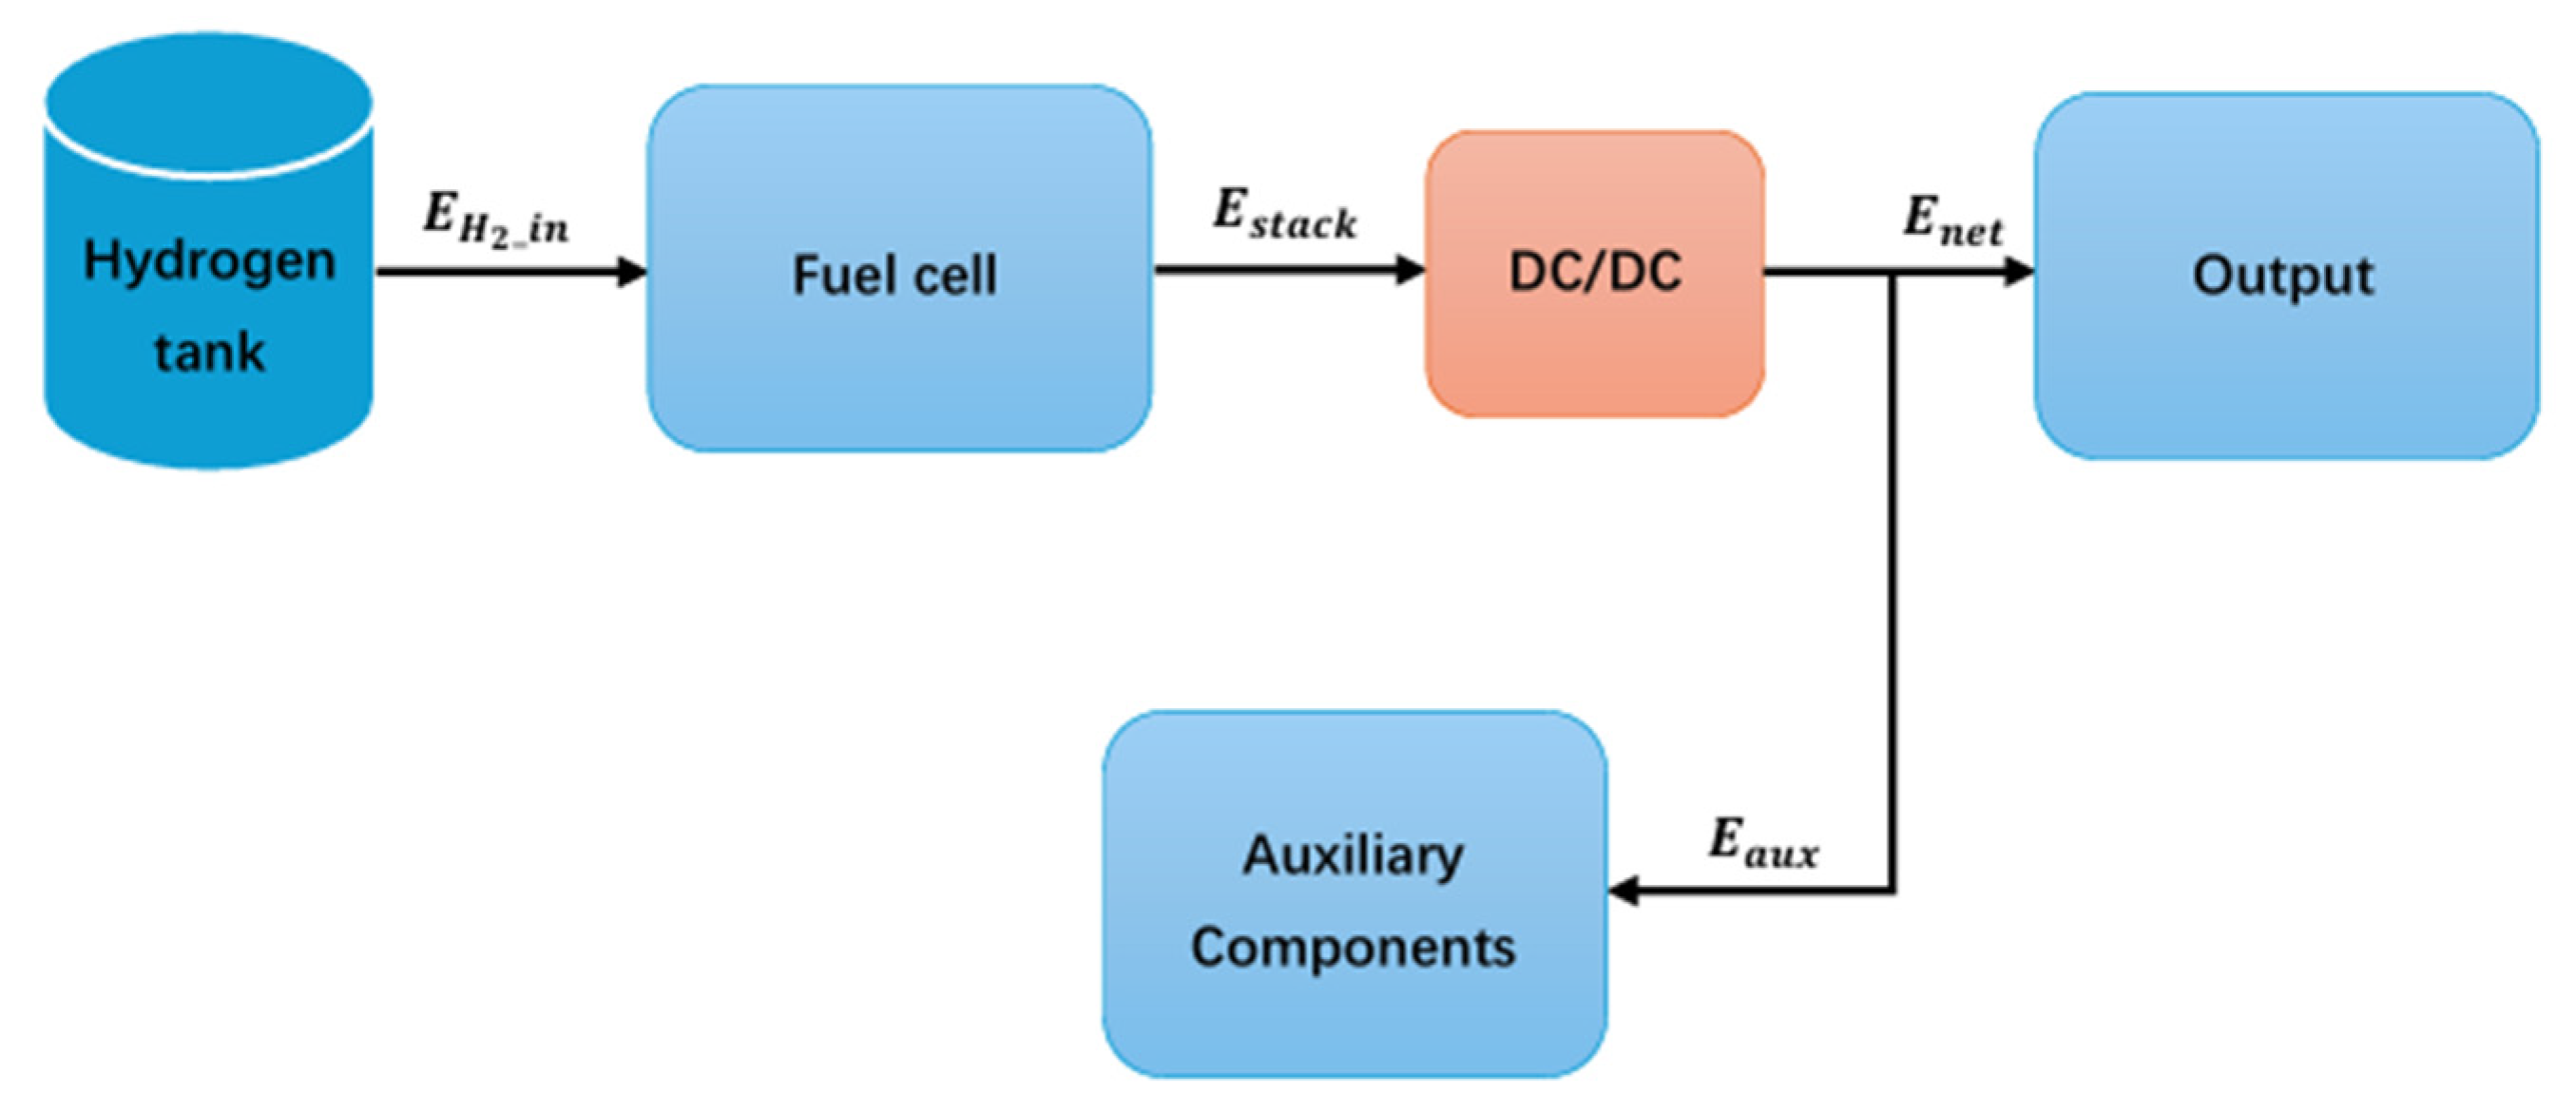
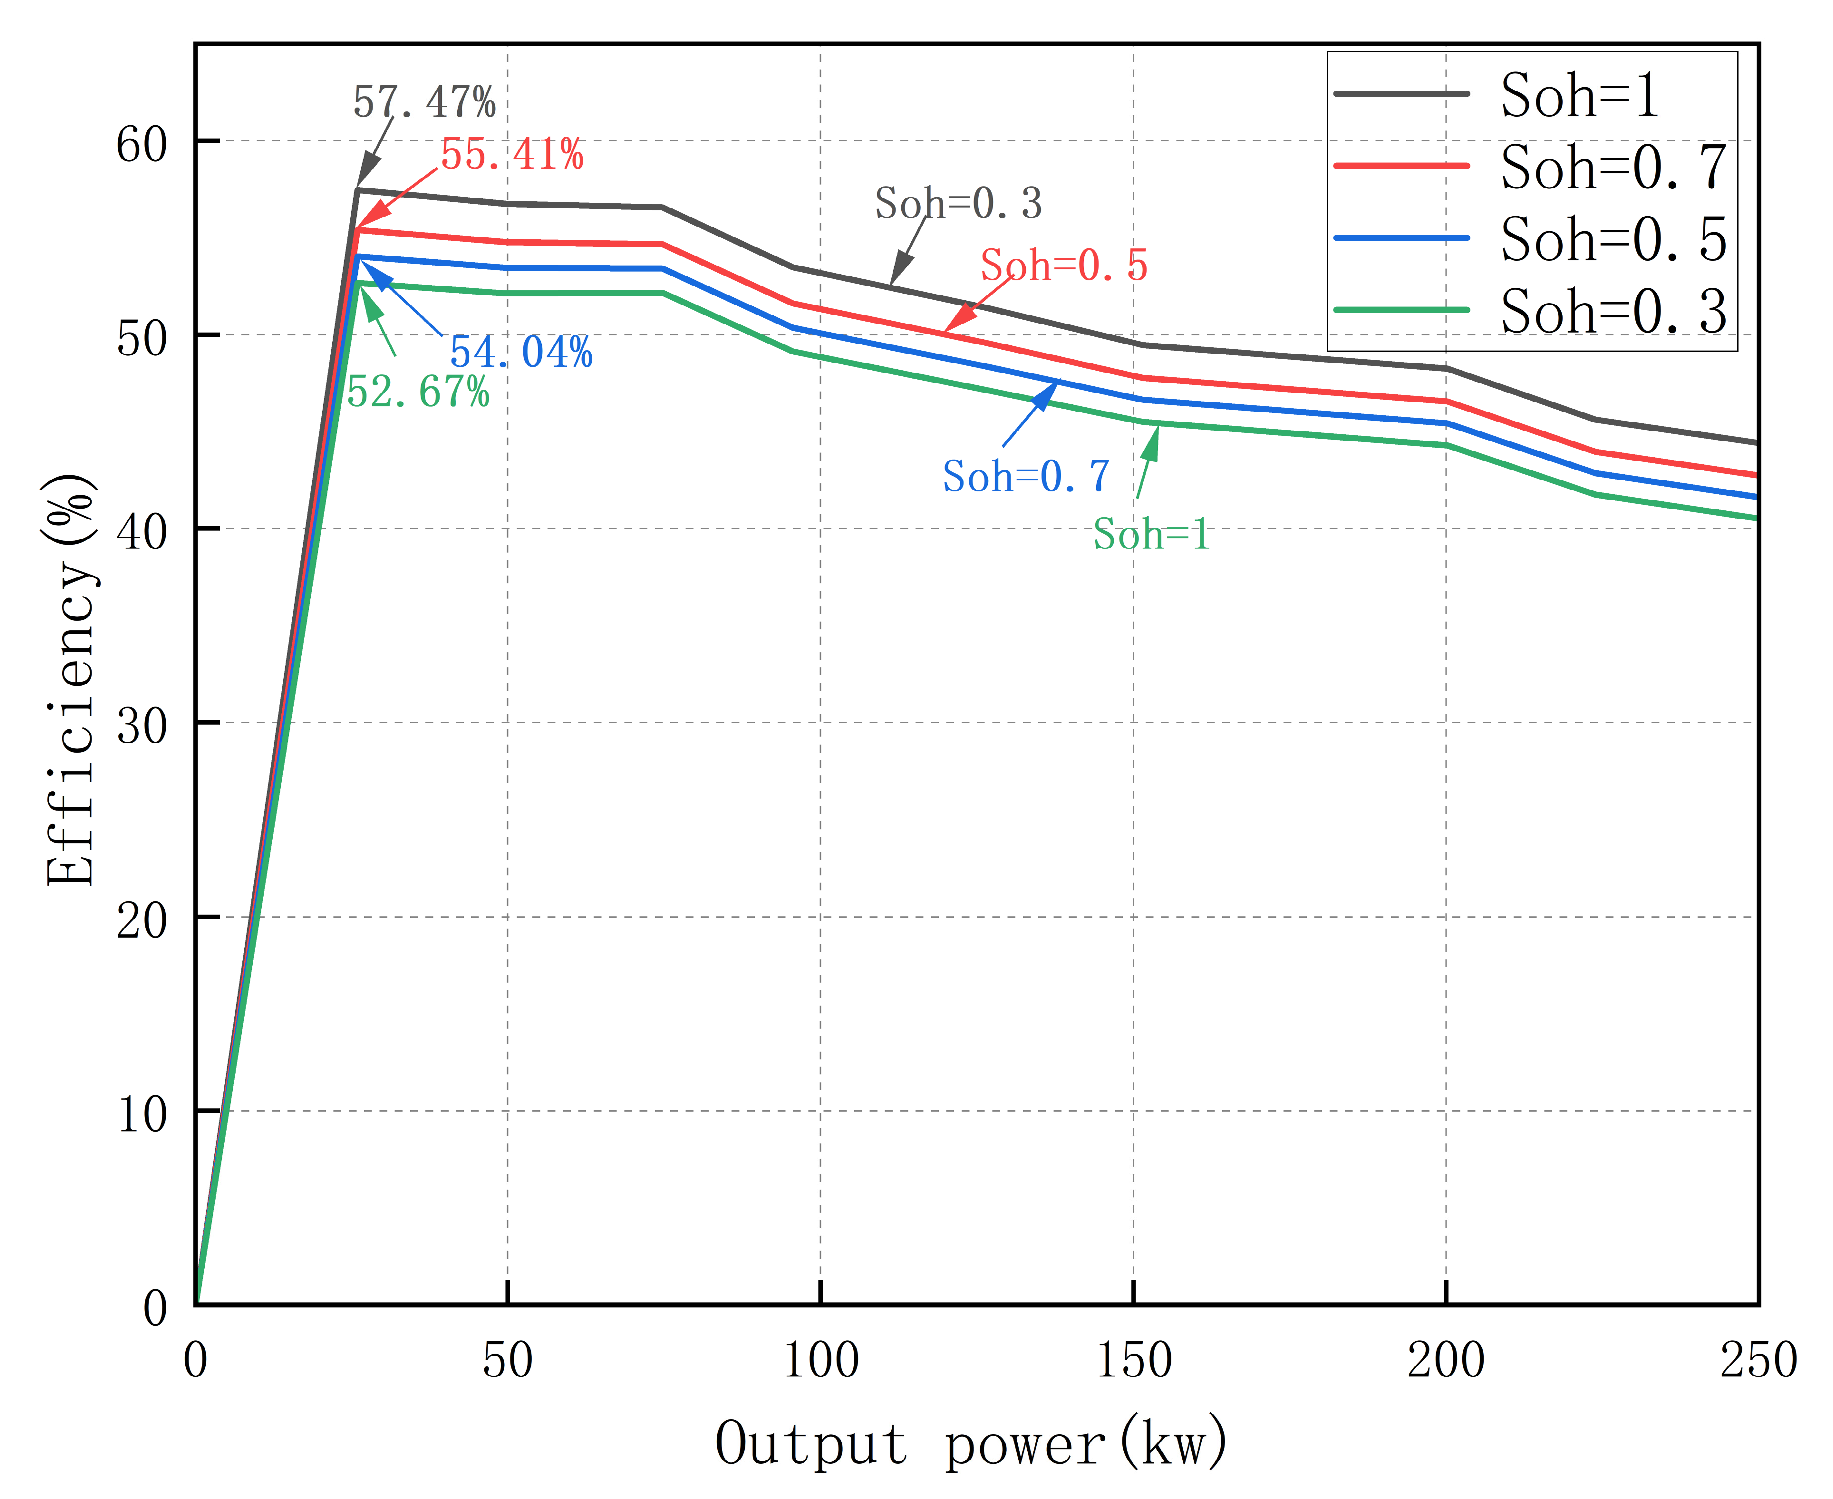
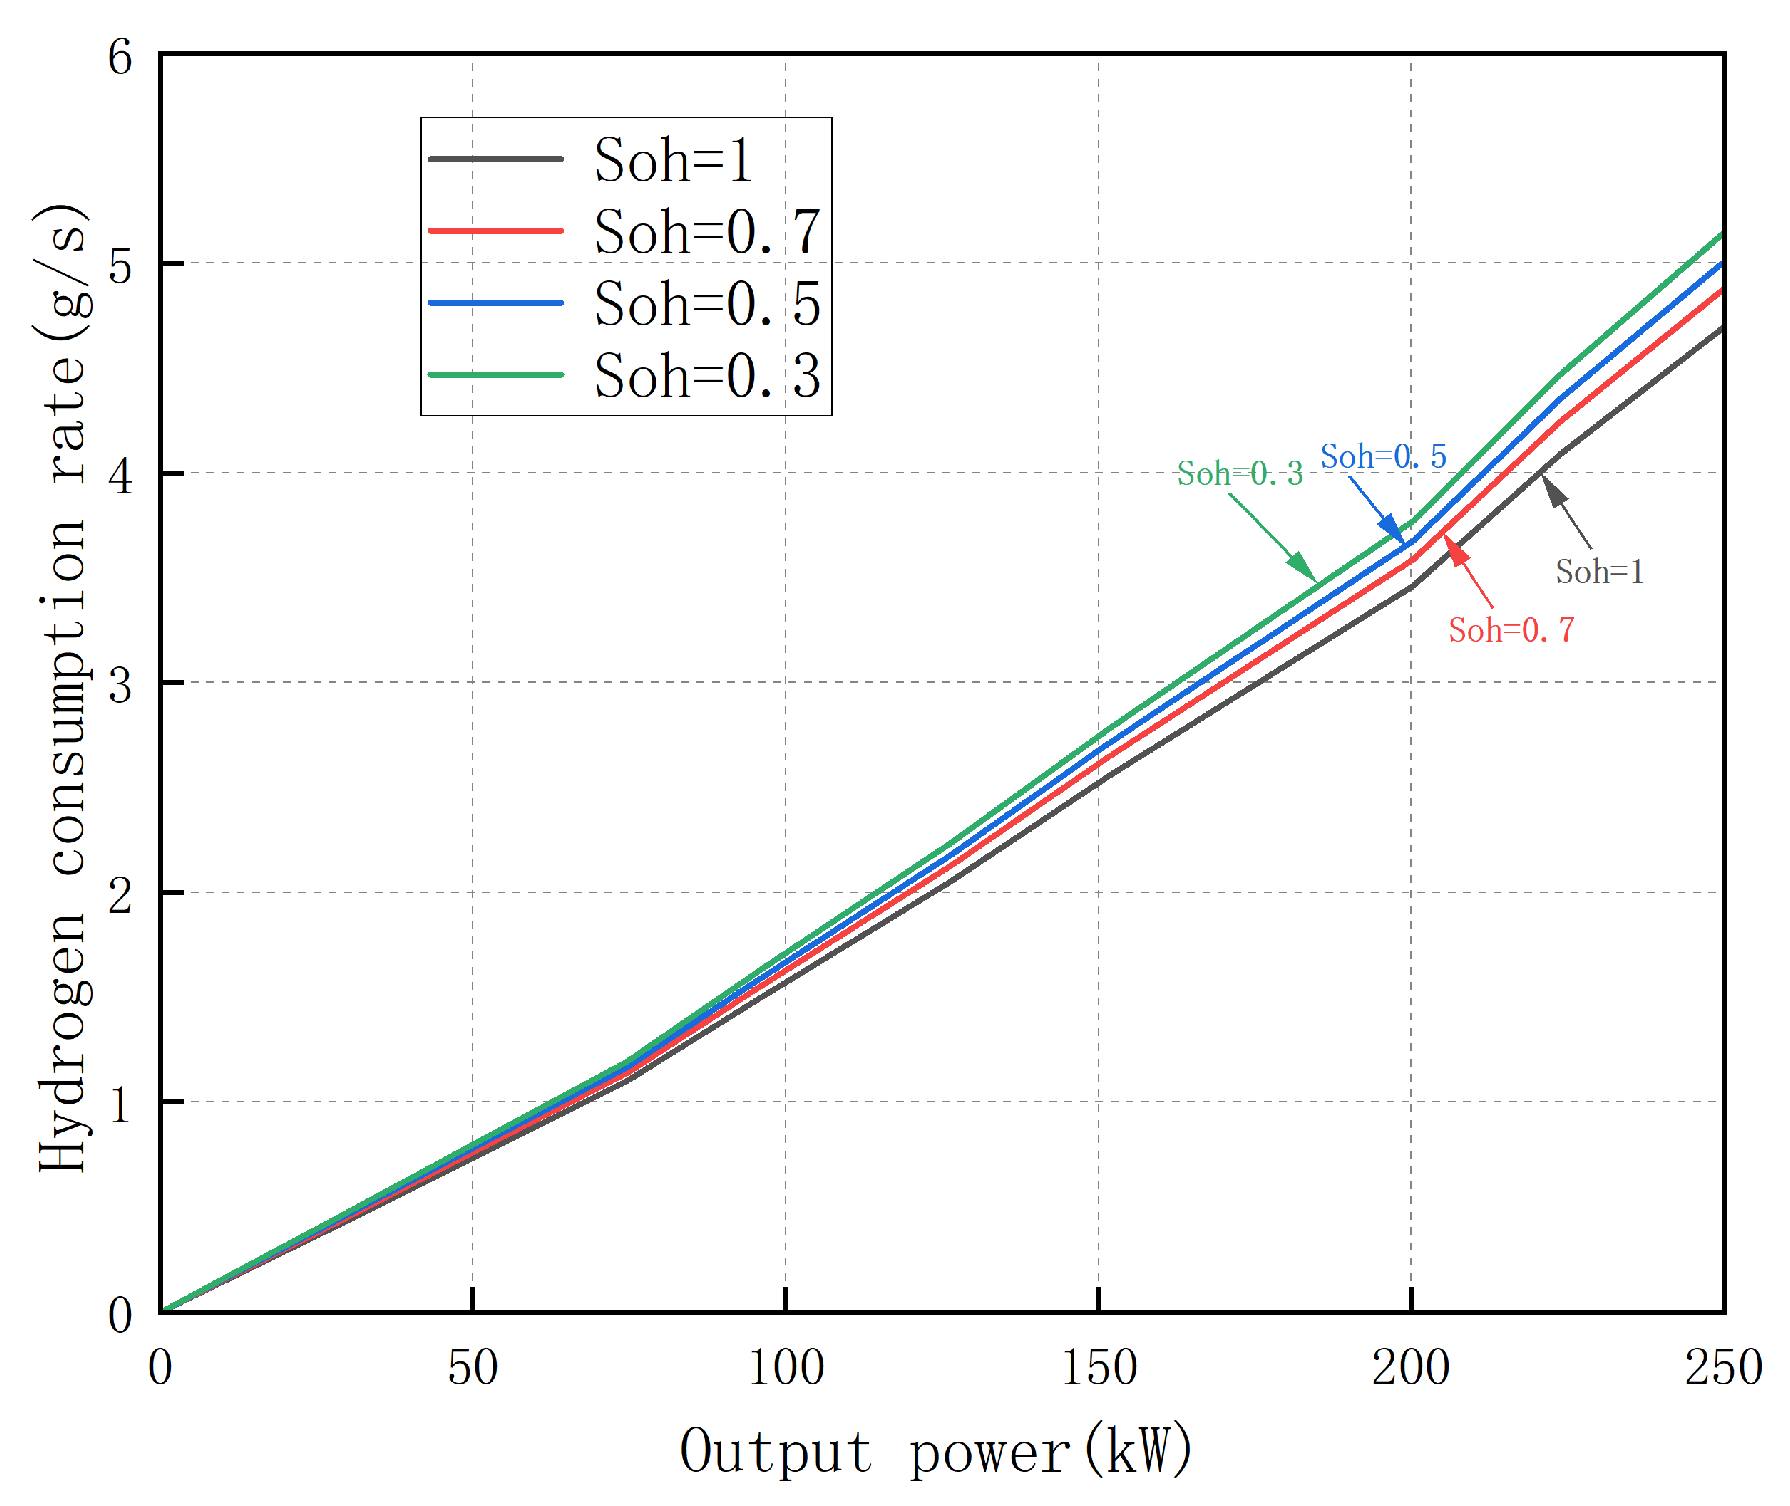
2.1. Fuel Cell Efficiency Modeling

The fuel cell model investigated in this paper is developed using experimentally derived polarization curves. During operation, dynamic variations in fuel cell output power caused by external conditions lead to inconsistent degradation levels among individual stacks. This study focuses on validating the hydrogen consumption optimization and stability enhancement effects of the proposed power allocation strategy, rather than analyzing transient fuel cell responses during prolonged aging. Consequently, fixed state of health (Soh) values are assigned to fuel cells to isolate dynamic aging interference and enable controlled performance evaluation at predetermined degradation thresholds. Considering different fuel cell aging degrees, this paper investigates four fuel cells with Soh values of 1, 0.7, 0.5, and 0.3, respectively. Soh is defined as the voltage degradation level based on the rated current, with the maximum allowable voltage drop specified as 10%.
Figure 1 shows the energy flow of the fuel cell system. The efficiency of the fuel cell system ( η f c s ) is defined as the ratio of the net electrical energy output ( E n e t ) to the input hydrogen ( E H 2 _ i n ). The system efficiency of a fuel cell system is defined as [20]
η f c s = η f u e l η c o n v η e l e c
where η f u e l is the fuel efficiency of the fuel cell, which is set to 1 and does not change in this study. η c o n v is the conversion efficiency of the fuel cell and η e l e c is the electrical efficiency of the fuel cell.
The conversion efficiency η c o n v is determined only by the voltage of the fuel cell:
η c o n v = E s t a c k E H 2 c o n s u m e d
where E s t a c k is the electrical energy generated by the fuel cell stack and E H 2 _ c o n s u m e d is the chemical energy of hydrogen consumed by the electrochemical reaction of the fuel cell.
The conversion efficiency of the fuel cell after degradation can be expressed by the coefficient of variation ζ c o n v :
  ζ c o n v = 0.9 + 0.1 S O H
The electrical efficiency η e l e c is defined as the ratio of the output energy to the energy produced by the fuel cell and is determined by the efficiency η D C / D C of the DC/DC converter and the power of the auxiliary components E a u x :
  η e l e c = E n e t E s t a c k = η D C / D C E a u x E s t a c k
In this study, it is assumed that E a u x starts at 15% of E s t a c k and increases during degradation. The decline of E a u x can be represented by E a u x ,    d e g r a d e d :
  E a u x ,    d e g r a d e d = E a u x ζ c o n v
So the efficiency of η e l e c after degradation can be expressed by the coefficient of variation ζ e l e c :
ζ e l e c = η e l e c ,    d e g r a d e d η e l e c
According to the above equation, the coefficient of variation in the system efficiency, ζ f c _ s y s , of the fuel cell can be calculated:
  ζ f c s y s = ζ e l e c ζ c o n v
  η f c s y s ,    d e g r a d e d = ζ f c s y s η f c s y s
According to Equations (1)–(8), the fuel cell efficiency decay curve (Figure 2) can be derived for a Soh of 1, 0.7, 0.5 and 0.3.

2.2. Li-Ion Battery Model

The state of charge (SOC) of lithium-ion batteries, as a core indicator for measuring remaining battery capacity, plays an irreplaceably critical role in optimizing the operational efficiency of energy management systems, extending battery service life, and ensuring the stability of battery performance. In practical applications, academia and industry have developed various SOC estimation methods, among which the more widely used ones include the voltage method, coulomb counting method, and Kalman filter method. The voltage method primarily relies on the corresponding relationship between battery terminal voltage and SOC for estimation; it is simple to operate but easily disturbed by factors such as temperature and aging degree, resulting in limited accuracy. The Kalman filter method, on the other hand, achieves dynamic estimation through establishing battery state equations and observation equations and using recursive algorithms. Although it can effectively suppress the impact of noise, it has higher requirements for model accuracy and relatively greater computational complexity.
Considering the application scenario of this study, computational costs, and actual needs for estimation accuracy, this paper ultimately selects the coulomb counting method for SOC analysis. Based on the principle of charge conservation, this method tracks changes in battery capacity through integral calculation of charge–discharge current, featuring clear principles, simple implementation, and high estimation accuracy in the short term. The relevant calculation formula is as follows [21]:
  S O C t = S O C 0 + S O C = S O C 0 100 0 τ η c o l i b a t t t d t Q b a t t
Lithium-ion battery cycle life is quantified through a degradation model accounting for charge–discharge cycles and depth of discharge ( D O D ) [22]. The process consists of three stages: data reconstruction, extraction of the number of cycles, and calculation of the D O D for each cycle. The equivalent cycle life of a Li-ion battery is given by Eq:
N n = m = 1 i N 1 N D O D m
where i is the number of cycles, N ( 1 ) represents the cycle life when D O D is 1, D O D m is the D O D in cycle m, and N ( D O D m ) is the cycle life when D O D m .
As shown in Table 1 and Figure 3, the rated cycle life at different D O D s can be derived from the above equation.
The cycle life function can be fitted as
N = 4375 × D O D 10,280 × D O D + 10,610
This equation enables estimation of lithium-ion battery remaining cycle life following individual maritime voyages.

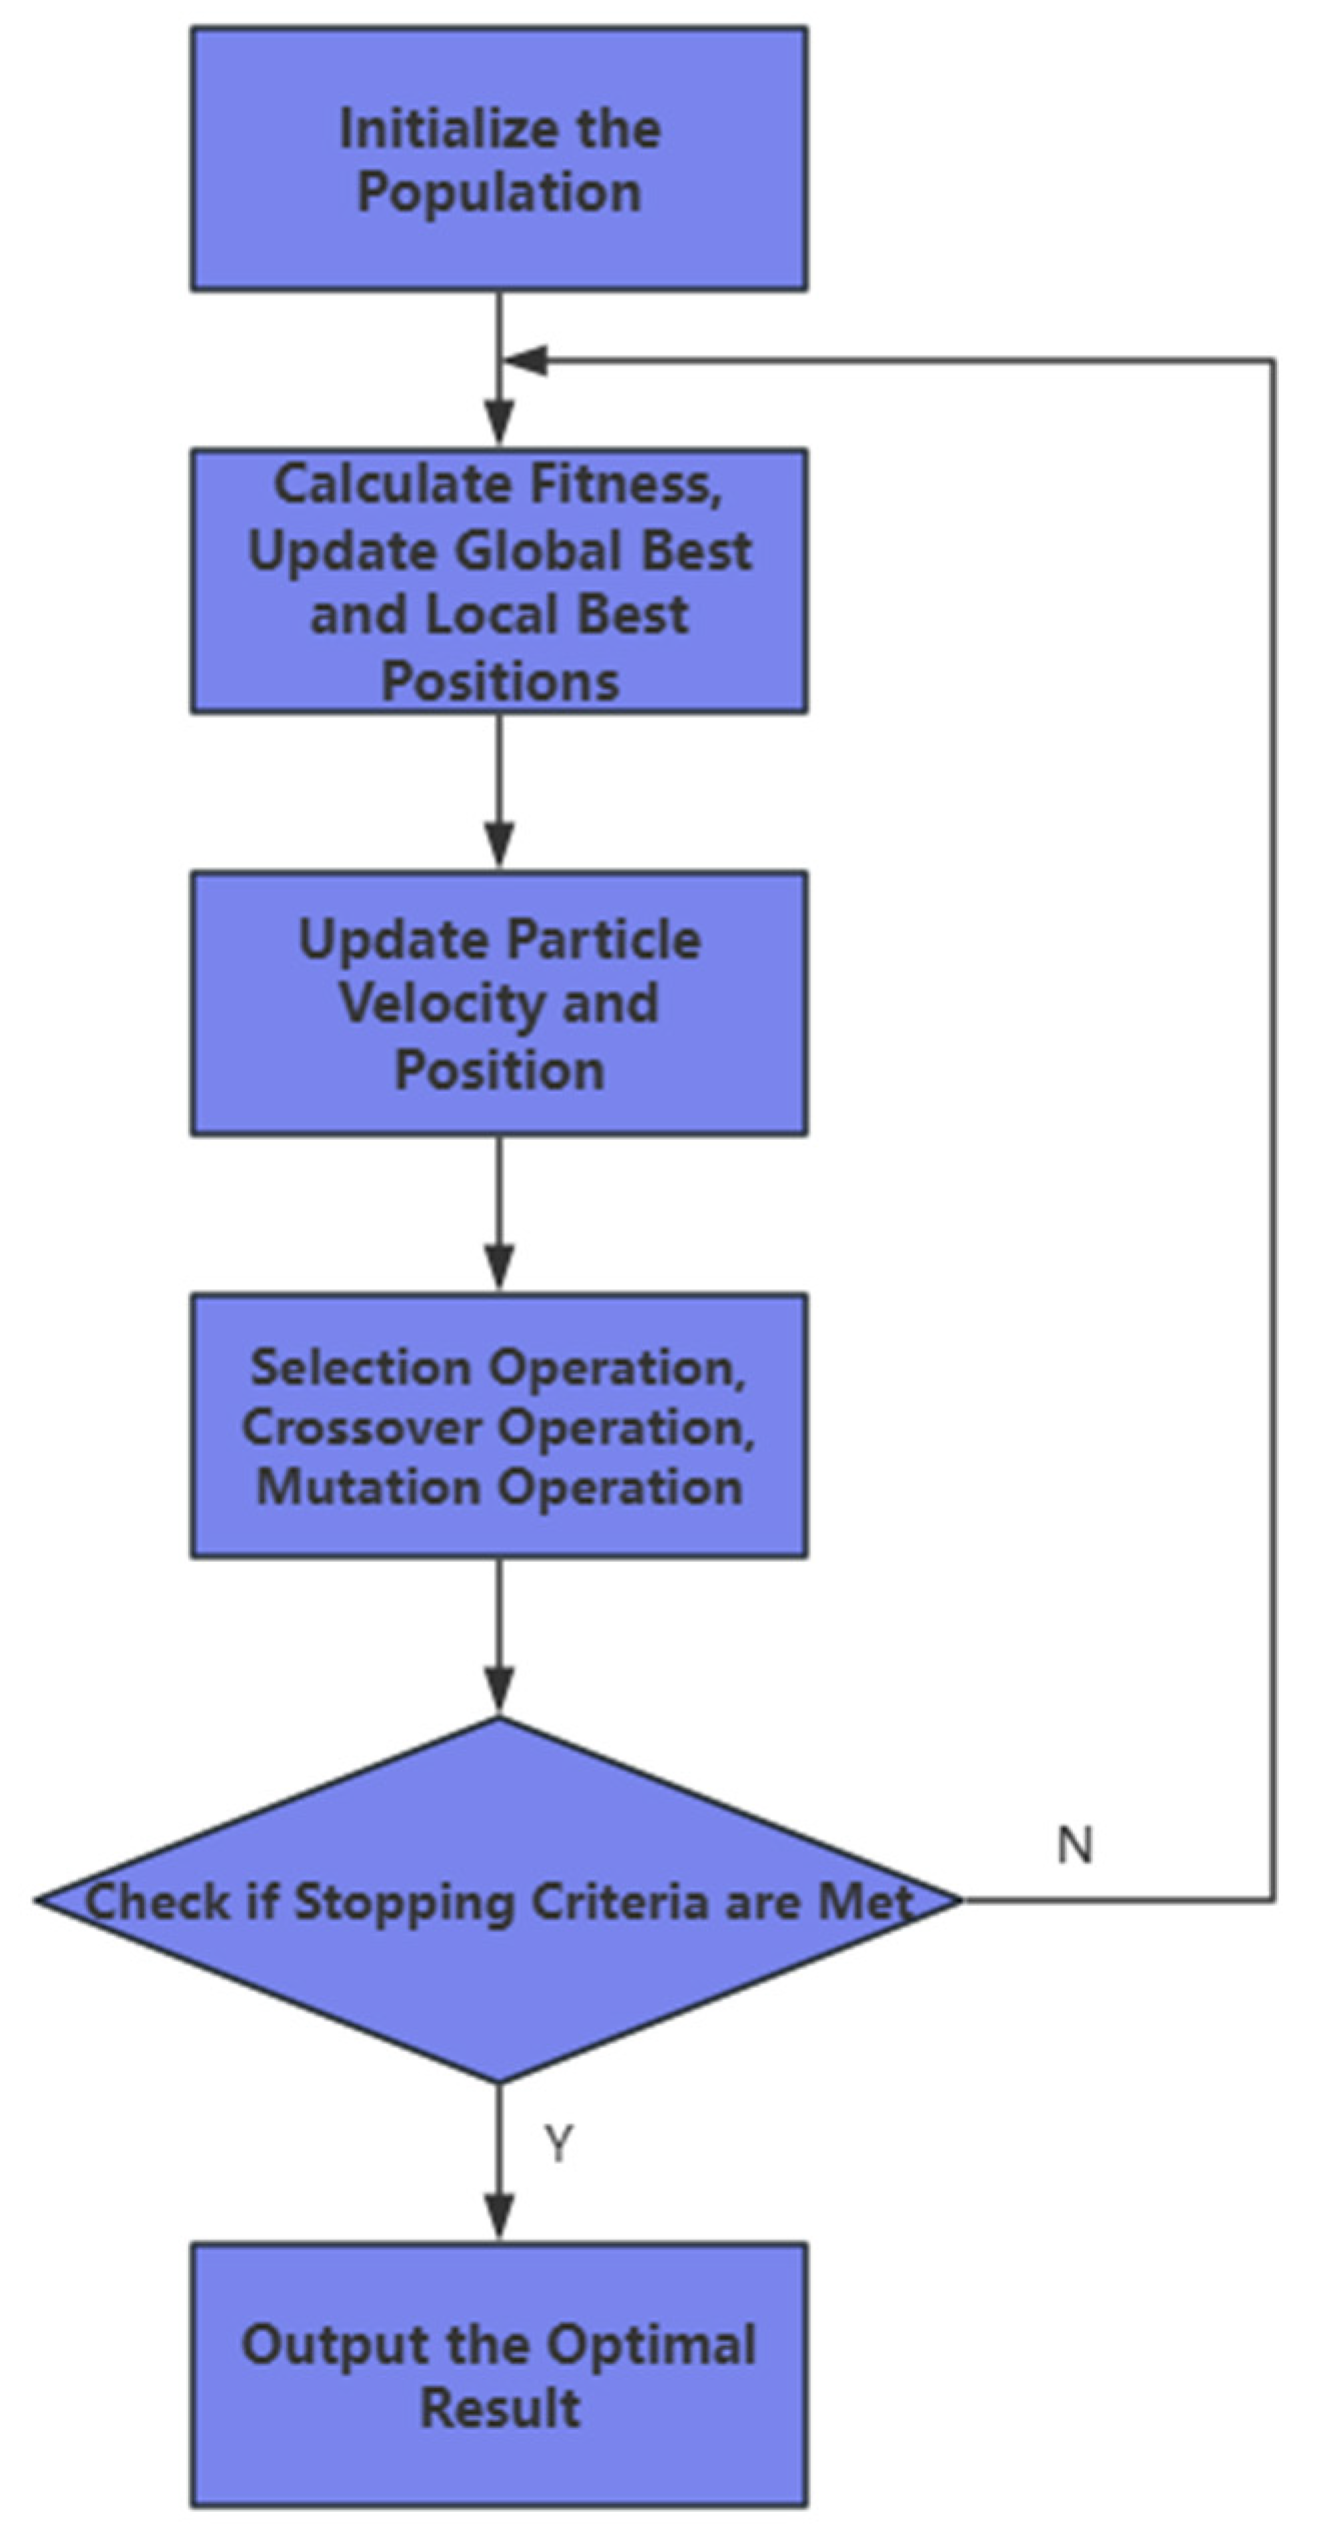
3. Energy Management Strategy

The core idea of ECMS is to equate the energy demand of the fuel cell and energy storage system to equivalent hydrogen consumption. In this paper, we propose an optimization algorithm that simultaneously optimizes the equivalent hydrogen consumption of FCS and lithium-ion batteries, aiming to minimize hydrogen consumption. Energy losses from power distribution and conversion are excluded to enable direct comparison of energy management strategies under the improved algorithm. The optimization process steps are shown below:
(1)
A possible Li-ion battery and fuel cell output power.
(2)
Define the scope of the variables P f c and P b a t t .
(3)
Calculate the optimized equivalent hydrogen consumption using the PSO or GAPSO algorithms.
(4)
Repeat steps 1–3 until an optimal solution is found.

3.1. Comparison of Intelligent Optimization Algorithms

Intelligent optimization algorithms, characterized by self-organization and adaptability, have demonstrated unique advantages in solving complex optimization problems. However, due to differences in their inspirational sources and core mechanisms, various algorithms exhibit significant disparities in terms of search capability, convergence speed, applicable scenarios, and other aspects. To intuitively compare the characteristics of different algorithms, Table 2 summarizes the core advantages and disadvantages of current mainstream intelligent optimization algorithms, including typical methods such as the Genetic Algorithm (GA), Particle Swarm Optimization (PSO), the Artificial Bee Colony Algorithm (ABC), the Firefly Algorithm (FA) and Ant Colony Optimization (ACO). The comparison is conducted from dimensions such as global search capability, local optimization accuracy, convergence efficiency, parameter sensitivity, and applicable problem types, providing a reference for subsequent algorithm selection and analysis of improvement directions.
Since this paper adopts the ECMS energy management strategy, which is a continuous problem, the PSO algorithm and GA-PSO algorithm are used for optimization after comprehensive consideration. Although the PSO algorithm may fall into local optimum, the advantage of the GA, having a strong global search capability, can help the PSO algorithm jump out of the local optimum.

3.2. Hybrid GAPSO Algorithm

GA-PSO is a hybrid optimization algorithm that incorporates the features of the Genetic Algorithm (GA) and Particle Swarm Optimization (PSO). Its main purpose is to achieve faster convergence and better solution quality by fusing the global search ability of the Genetic Algorithm with the local search capability of the Particle Swarm Optimization algorithm [23]. GA-PSO introduces crossover and mutation operations from Genetic Algorithms into the PSO framework, enhancing the algorithm’s global search capability while preventing convergence to local optima. The implementation flowchart is detailed in Figure 4.
The updating of the particles is carried out by the following equation:
(1) Speed update formula:
  v i t + 1 = ω · v i t + c 1 · r 1 · p b e s t i x i t + c 2 · r 2 · g b e s t x i t
(2) Position update formula:
x i t + 1 = x i t + v i t + 1
where v i t + 1 is the velocity of particle i in the t + 1 generation; x i t + 1 is the position of particle i in the t + 1 st generation; ω is the inertia weight, which is used for balancing the global search and the local search; c 1 , c 2 are the learning factors, which control the particle’s proximity to the local optimum and global optimum; r 1 , r 2 are the random numbers between [0, 1], which are used to introduce randomness; p b e s t i is the local optimal position of particle i ; and g b e s t is the global optimal position of all particles.
The Genetic Algorithm part is mainly used to optimize the particle swarm through the following steps:
(1) Selection operation
Selection operation is the most important step in Genetic Algorithms; it determines which individuals (particles) can proceed to the next generation. In GA-PSO, high-fitness particles are selected as parents for crossover and mutation based on their fitness (objective function value).
(2) Crossover operation
The crossover operation generates new particles through partial dimension exchange of solution vectors between parent particles. This mechanism simulates biological genetic recombination, thereby expanding the solution space exploration. The mathematical formulation is expressed as
x 1 , c h i l d = α · x 1 + 1 α · x 2
           x 2 , c h i l d = α · x 2 + 1 α · x 1
where   x 1 , x 2 are the positions of the two parent particles; α is the crossover factor, which usually takes values in the range [0, 1].
(3) Mutation operation
The mutation operation introduces stochastic perturbations to particle positions in Genetic Algorithms, enhancing solution space diversity and preventing premature convergence to local optima.
x i n e w = x i + δ · r a n d
where x i is the current position of the particle; δ is the magnitude of the variation, which is usually taken as a small positive number to control the degree of variation. r a n d is a random number between [0, 1], which is used to introduce randomness.
The parameters of the algorithms used in this paper are summarized below:
PSO :   N = 50 ,   c 1 = 2 ,   c 2 = 2 ,   ω = 1 ;
GA :   N = 50 ,   α = 0.8 ,   δ = 0.1 .

3.3. ECMS-Based Energy Management Strategies

3.3.1. Fuel Cell Equivalent Hydrogen Consumption

The hydrogen consumption rate of a fuel cell is related to the fuel cell output power and system efficiency as defined below [24]:
C f c = P f c L h v η f c s y s ,    d e g r a d e d
L h v is the low level calorific value of hydrogen, which is 119.96 MJ/kg.
By organizing Formulas (1)–(8) and substituting them into Formula (18), we deduced the relationship between hydrogen consumption characteristics and fuel cell output power under different health states. This leads to the fuel cell equivalent hydrogen consumption diagram shown in Figure 5:
A quadratic polynomial with Soh = 1 and Soh = 0.5 can be fitted to the fuel cell hydrogen consumption rate function based on the data in Fig:
C f c = a P f c 2 + b P f c + c
where a , b , and c are the fitting coefficients for the fuel cell. When Soh = 1, a = 2.12271 × 10⁻¹⁰, b = 1.3377 × 10⁻⁵, c = 0.00735; when Soh = 0.5, a = 2.33828 × 10⁻¹⁰, b = 1.40562 × 10⁻⁵, c = 0.01087.
Marine hybrid power systems commonly integrate new and aged fuel cell stacks to reflect real-world operational scenarios. Through extreme-condition testing of hybrid configurations combining fresh and degraded stacks, this research demonstrates energy management strategies’ power allocation optimization capabilities while quantifying hydrogen consumption and stability metrics. The experimental setup employs two fuel cells with Soh values of 1 (pristine) and 0.5 (degraded) to simulate operational extremes.

3.3.2. Li-Ion Battery Equivalent Hydrogen Consumption

The basic principle of the ECMS approach lies in the conversion of the energy demand of the ESS system into an equivalent hydrogen consumption (regarded as an indirect hydrogen consumption process), and the instantaneous hydrogen consumption equation of a Li-ion battery is related to the output power of the battery, P b a t t , and the S O C of the battery [25].
C b a t t = n t L h v P b a t t P s o c
n t = 1 2 μ S O C S O C m a x S O C m i n 0.5
P s o c = 1 S O C S O C t a r g e t S O C m a x S O C m i n 3
where P b a t t is the output power of the Li-ion battery at time t ; n t is the equivalent factor, which is used to convert the electrical energy consumed by ESS into the equivalent hydrogen consumption; P s o c is the penalty factor to ensure that the SOC of the Li-ion battery is in a reasonable range; μ is the balance coefficient, which is taken to be 0.6; and L h v is the low calorific value of hydrogen (120 MJ/KG). S O C m a x , S O C m i n , and S O C t a r g e t   are the maximum, minimum, and target values of SOC, respectively. S O C m a x   is 90%, S O C m i n is 20%, S O C t a r g e t is 80%; S O C m a x < SOC <   S O C m i n .

3.3.3. Power Allocation Strategy

In this system, the fuel cell serves as the primary power source while the energy storage system functions as the auxiliary power source. The output power allocation between these two components is primarily determined by minimizing total hydrogen consumption.
Figure 6 depicts the hybrid power system architecture for fuel cell-powered vessels, comprising two 250 kW fuel cell stacks and two lithium-ion battery banks (550 V, 100 Ah). To compensate for the inherent slow transient response of fuel cells, the energy storage system is integrated to ensure rapid load power tracking [26]. In this simulation model, the DC/DC converter control adopts PI control based on the DC bus voltage error. By real-time detection of bus voltage deviation, the PI controller generates PWM drive signals to adjust the duty cycle of switching transistors, achieving stable bus voltage and precise output of fuel cell power. For the DC/AC inverter control, a dual closed-loop structure is employed, consisting of an outer voltage loop and an inner current loop. The outer loop regulates the amplitude and frequency of the AC voltage, while the inner loop tracks current commands. Combined with SVPWM modulation technology, this setup ensures the stability of output voltage even under load fluctuations.
The power distribution of the hybrid system is dominated by hydrogen consumption, and the instantaneous hydrogen consumption of the system can be defined by the following equation:
C = min C f c 1 + C b a t t 1 + C f c 2 + C b a t t 2
Considering that the health of fuel cell 2 is 0.5, the coefficient β is introduced to adjust the power distribution of the hybrid energy storage system in order to slow down the degree of continued decline of fuel cell 2. The output power constraints of the fuel cell and Li-ion battery depend on the following equation:
β · P f c 1 + P b a t t 1 + 1 β · P f c 2 + P b a t t 2 = P l o a d P f c , m i n < P f c 1 , P f c 2 < P f c , m a x S O C m i n < S O C 1 , S O C 2 < S O C m a x
At low to medium load (<50 kW), β = 0.5; at high load (>=50 kW), β = S o h 1 S o h 1 + S o h 2 . In this way, the use of fuel cell 2 is reduced at high loads in order to prolong its life.

4. Results

This section evaluates the proposed method’s performance. The load profiles from the fuel cell passenger ship Alsterwasser [27]—equipped with two fuel cells and lithium-ion battery packs for power generation—are analyzed, consistent with the simulations conducted. The vessel Alsterwasser operates in four states: cruising, docking, anchoring, and sailing. Figure 7 indicates that cruising exhibits minimal power fluctuations, while docking primarily involves low-power variations. To analyze hydrogen consumption during dynamic load changes and observe fuel cell/lithium-ion battery output under high-load and peak conditions, this study focuses on mooring and sailing scenarios. Moreover, this paper introduces the equivalent consumption minimization strategy based on Frequency Decoupling (FD) from reference [28] to compare the pros and cons of the GA-PSO algorithm.
Key simulation parameters are listed in Table 3.

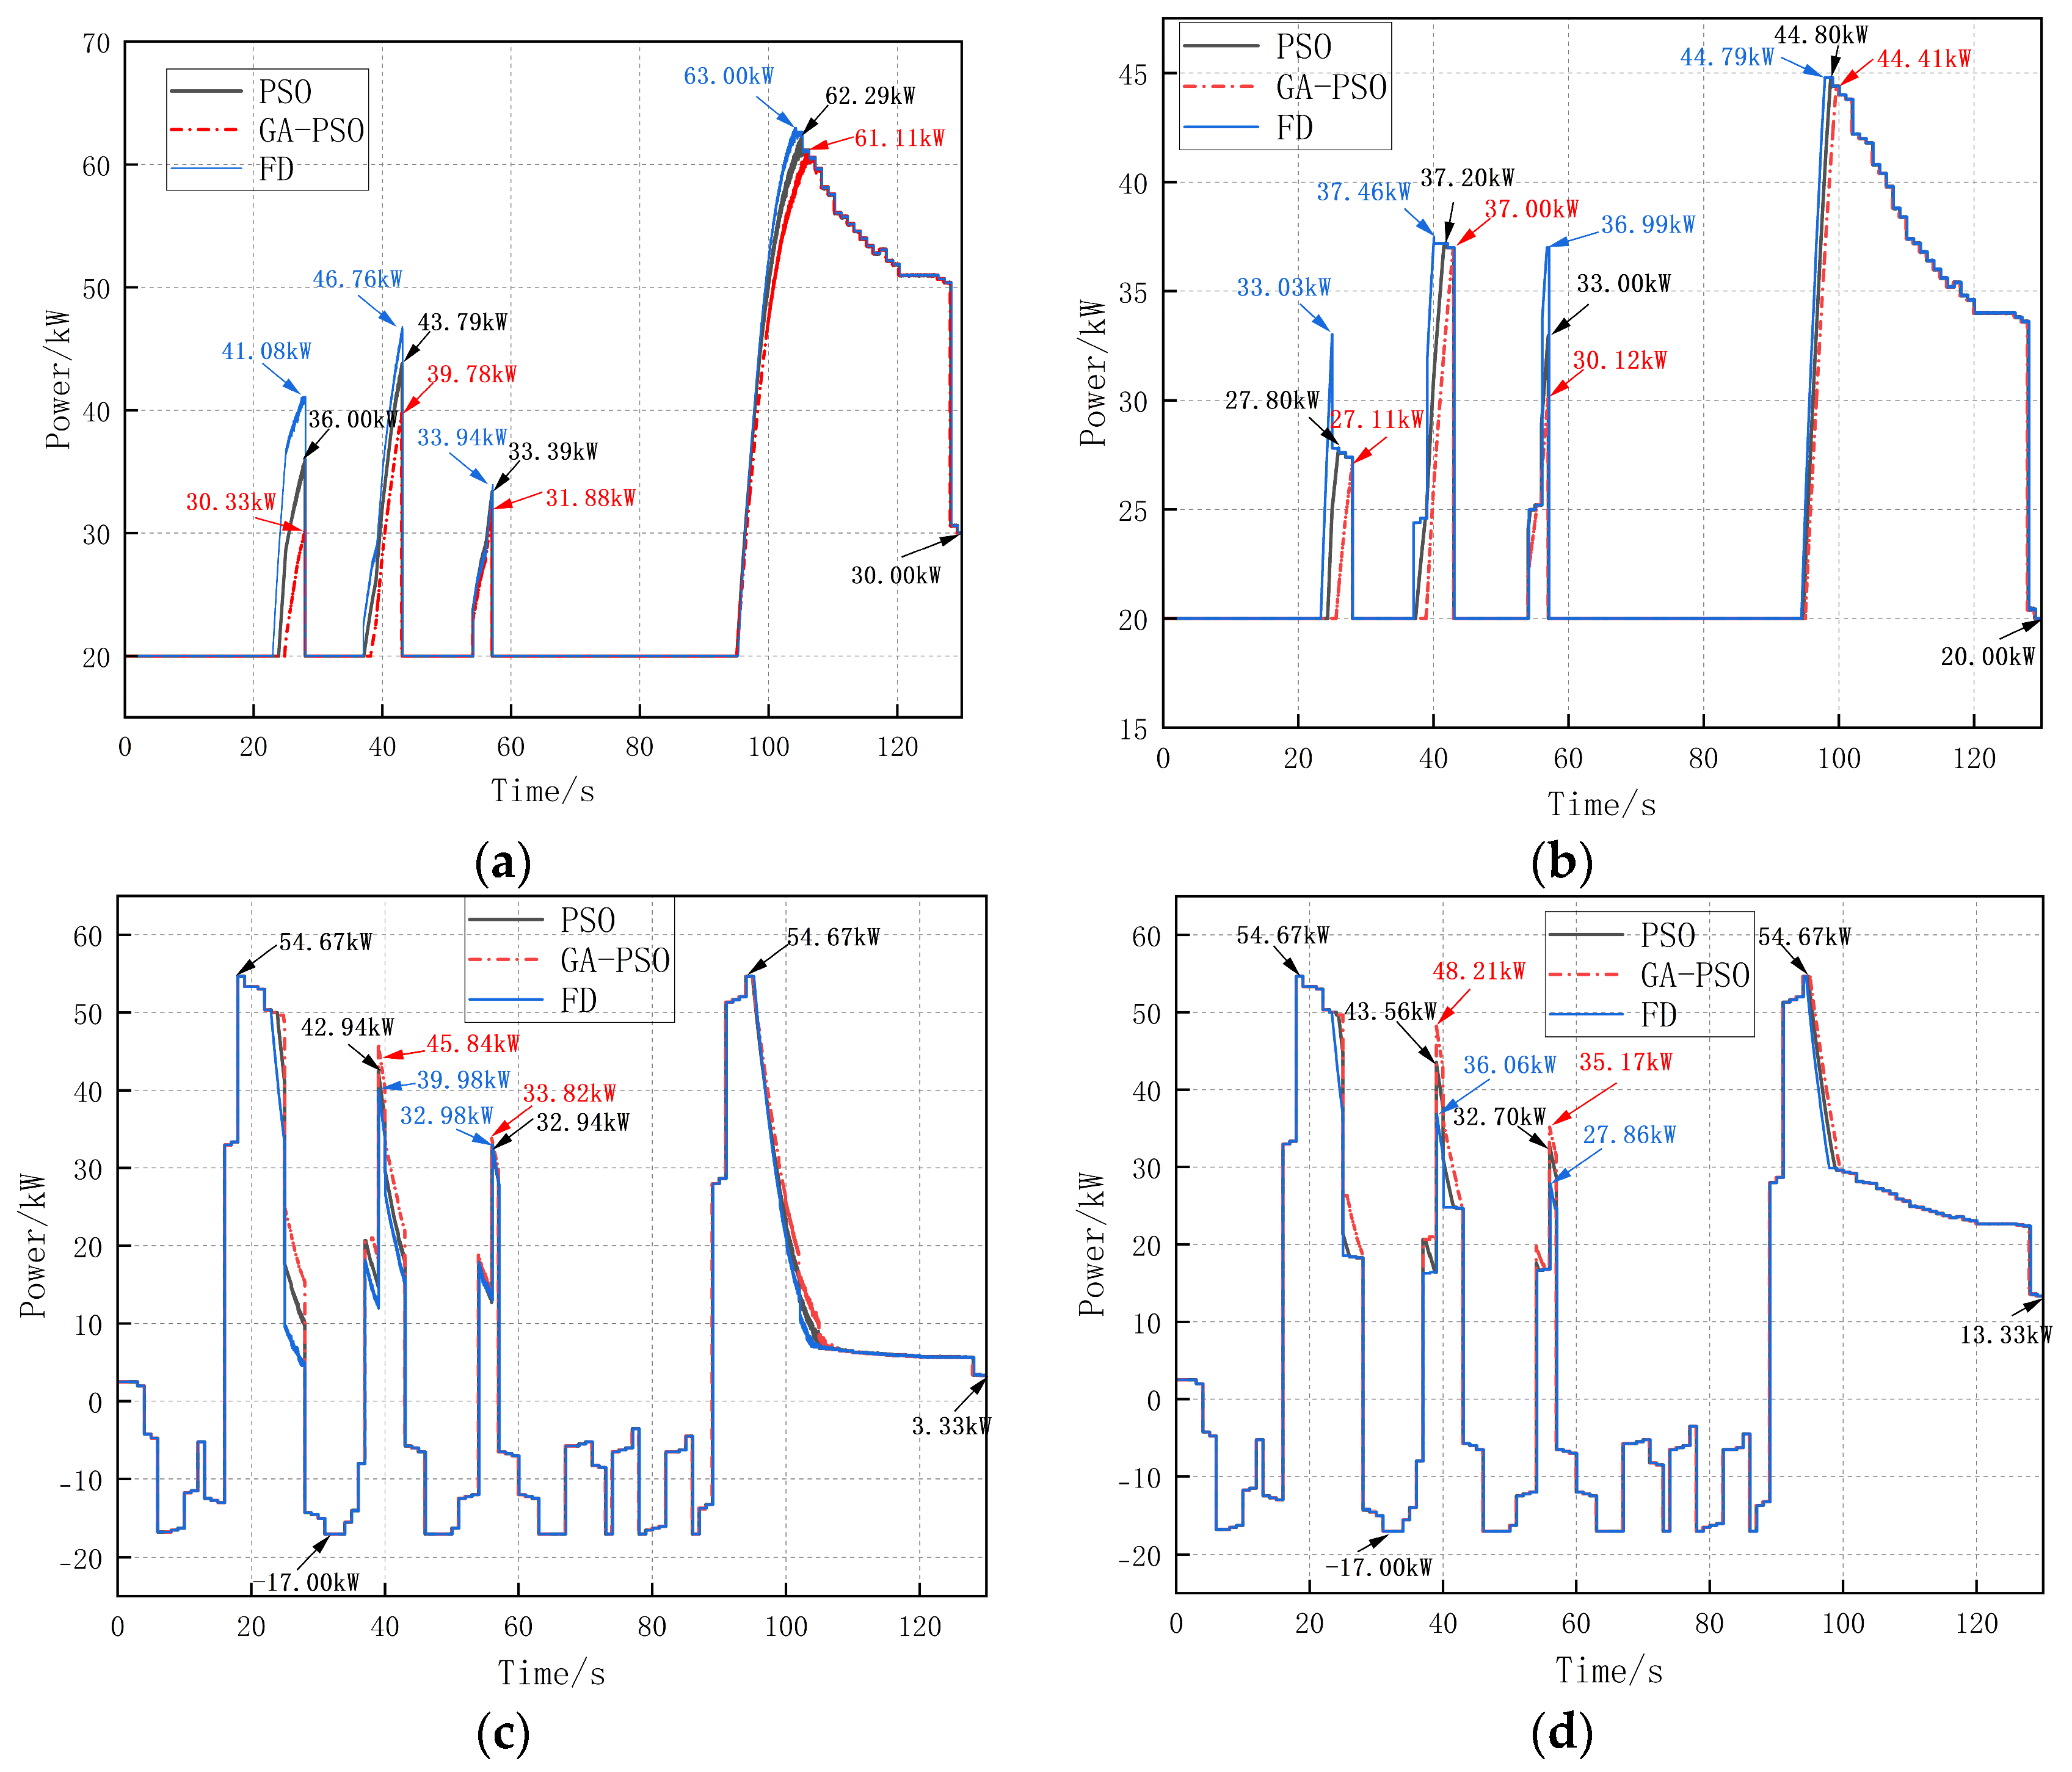
4.1. Comparison of Power Under Different Algorithms

The output power of the power source is shown in Figure 8a and Figure 8b, which are the output power graphs of fuel cell 1 and fuel cell 2, respectively, and Figure 8c and Figure 8d are the output power graphs of Li-ion battery 1 and Li-ion battery 2, respectively. The four diagrams demonstrate that fuel cell 2 consistently bears lower output power than fuel cell 1, intentionally slowing its degradation rate to preserve health. During medium–low load conditions with both fuel cells stabilized at 20 kW output, lithium-ion batteries primarily compensate for power fluctuations. In the interval of 24–43 s, the load fluctuation is larger, covering medium–low and high-load intervals. As shown in Figure 8a, the peak power using the FD strategy is the largest, and the peak power using the Particle Swarm Optimization (PSO) algorithm strategy is larger than that of the Genetic Algorithm–Particle Swarm Optimization (GA-PSO) algorithm strategy. This is because the PSO algorithm falls into local convergence and cannot effectively find the optimal value. During 65–106 s, the load power rises rapidly and reaches a peak value at 106 s. Among them, the peak value corresponding to the FD strategy is 63.00 kW, the peak value corresponding to the PSO algorithm is 62.29 kW, and the peak value corresponding to the GA-PSO algorithm is 61.11 kW. Finally, the total energy provided by both fuel cells is 30 kW, as shown in Figure 8b Compared to scenario (a), peak power magnitudes show reductions, especially at the 100 s mark. The peak output power under the FD strategy is 44.79 kW and the peak value corresponding to the PSO algorithm is 44.80 kW, while the peak value corresponding to the GA-PSO algorithm is 44.41 kW. Fuel cell 2 maintains a stable 20 kW output across all control strategies and operates consistently within the low-to-medium power range (20–50 kW) to reduce the degradation rate. Figure 8c shows that compared with the FD method and the PSO algorithm, the GA-PSO algorithm has a faster response speed and smoother power fluctuations. Notably, during the intervals of 25–27 s and 37–43 s, the GA-PSO algorithm can quickly adapt to load changes. All three methods maintain the final output power of the lithium-ion battery at 3.33 kW. The characteristics of (d) are similar to those of scenario (c). The GA-PSO algorithm shows faster response characteristics than the FD method and the PSO algorithm, and all three strategies converge to a final output power of 13.33 kW.

4.2. Comparison of Hydrogen Consumption

Figure 9 compares the hydrogen consumption of fuel cell 1 and fuel cell 2 under different control strategies. The hydrogen consumption profiles of the three methods are generally stable. However, due to the tendency of the Particle Swarm Optimization (PSO) algorithm to fall into local optima during power surges, the hydrogen consumption of the Genetic Algorithm–Particle Swarm Optimization (GA-PSO) algorithm is significantly lower than that of the PSO algorithm. Meanwhile, the Frequency Decoupling (FD) method performs the worst in searching for the optimal value because of its weak global optimization capability and susceptibility to frequency-related factors. The GA-PSO algorithm has stronger adaptability to the dynamic changes of the system and better ability to save hydrogen. Table 4 presents the hydrogen consumption values as follows: 153.33 g for the FD method, 149.91 g for the PSO algorithm, and 146.30 g for the GA-PSO algorithm. Compared with the traditional PSO algorithm, the GA-PSO strategy reduces hydrogen consumption by 3.61 g and the single-operation cost by 2.66%. Compared with the FD method, the GA-PSO strategy reduces hydrogen consumption by 7.03 g and the single-operation cost by 4.78%.
In Ref. [25], while the authors, who compared PSO with Support Vector Machine (SVM) methods, demonstrated a 2% reduction in hydrogen consumption, this study develops an enhanced PSO architecture. When implemented within the ECMS framework under identical operating conditions, the proposed GA-PSO achieves a 2.66% greater hydrogen consumption reduction than standard PSO. The findings demonstrate that hybrid algorithm strategies exhibit superior potential compared to conventional single-algorithm substitution approaches.

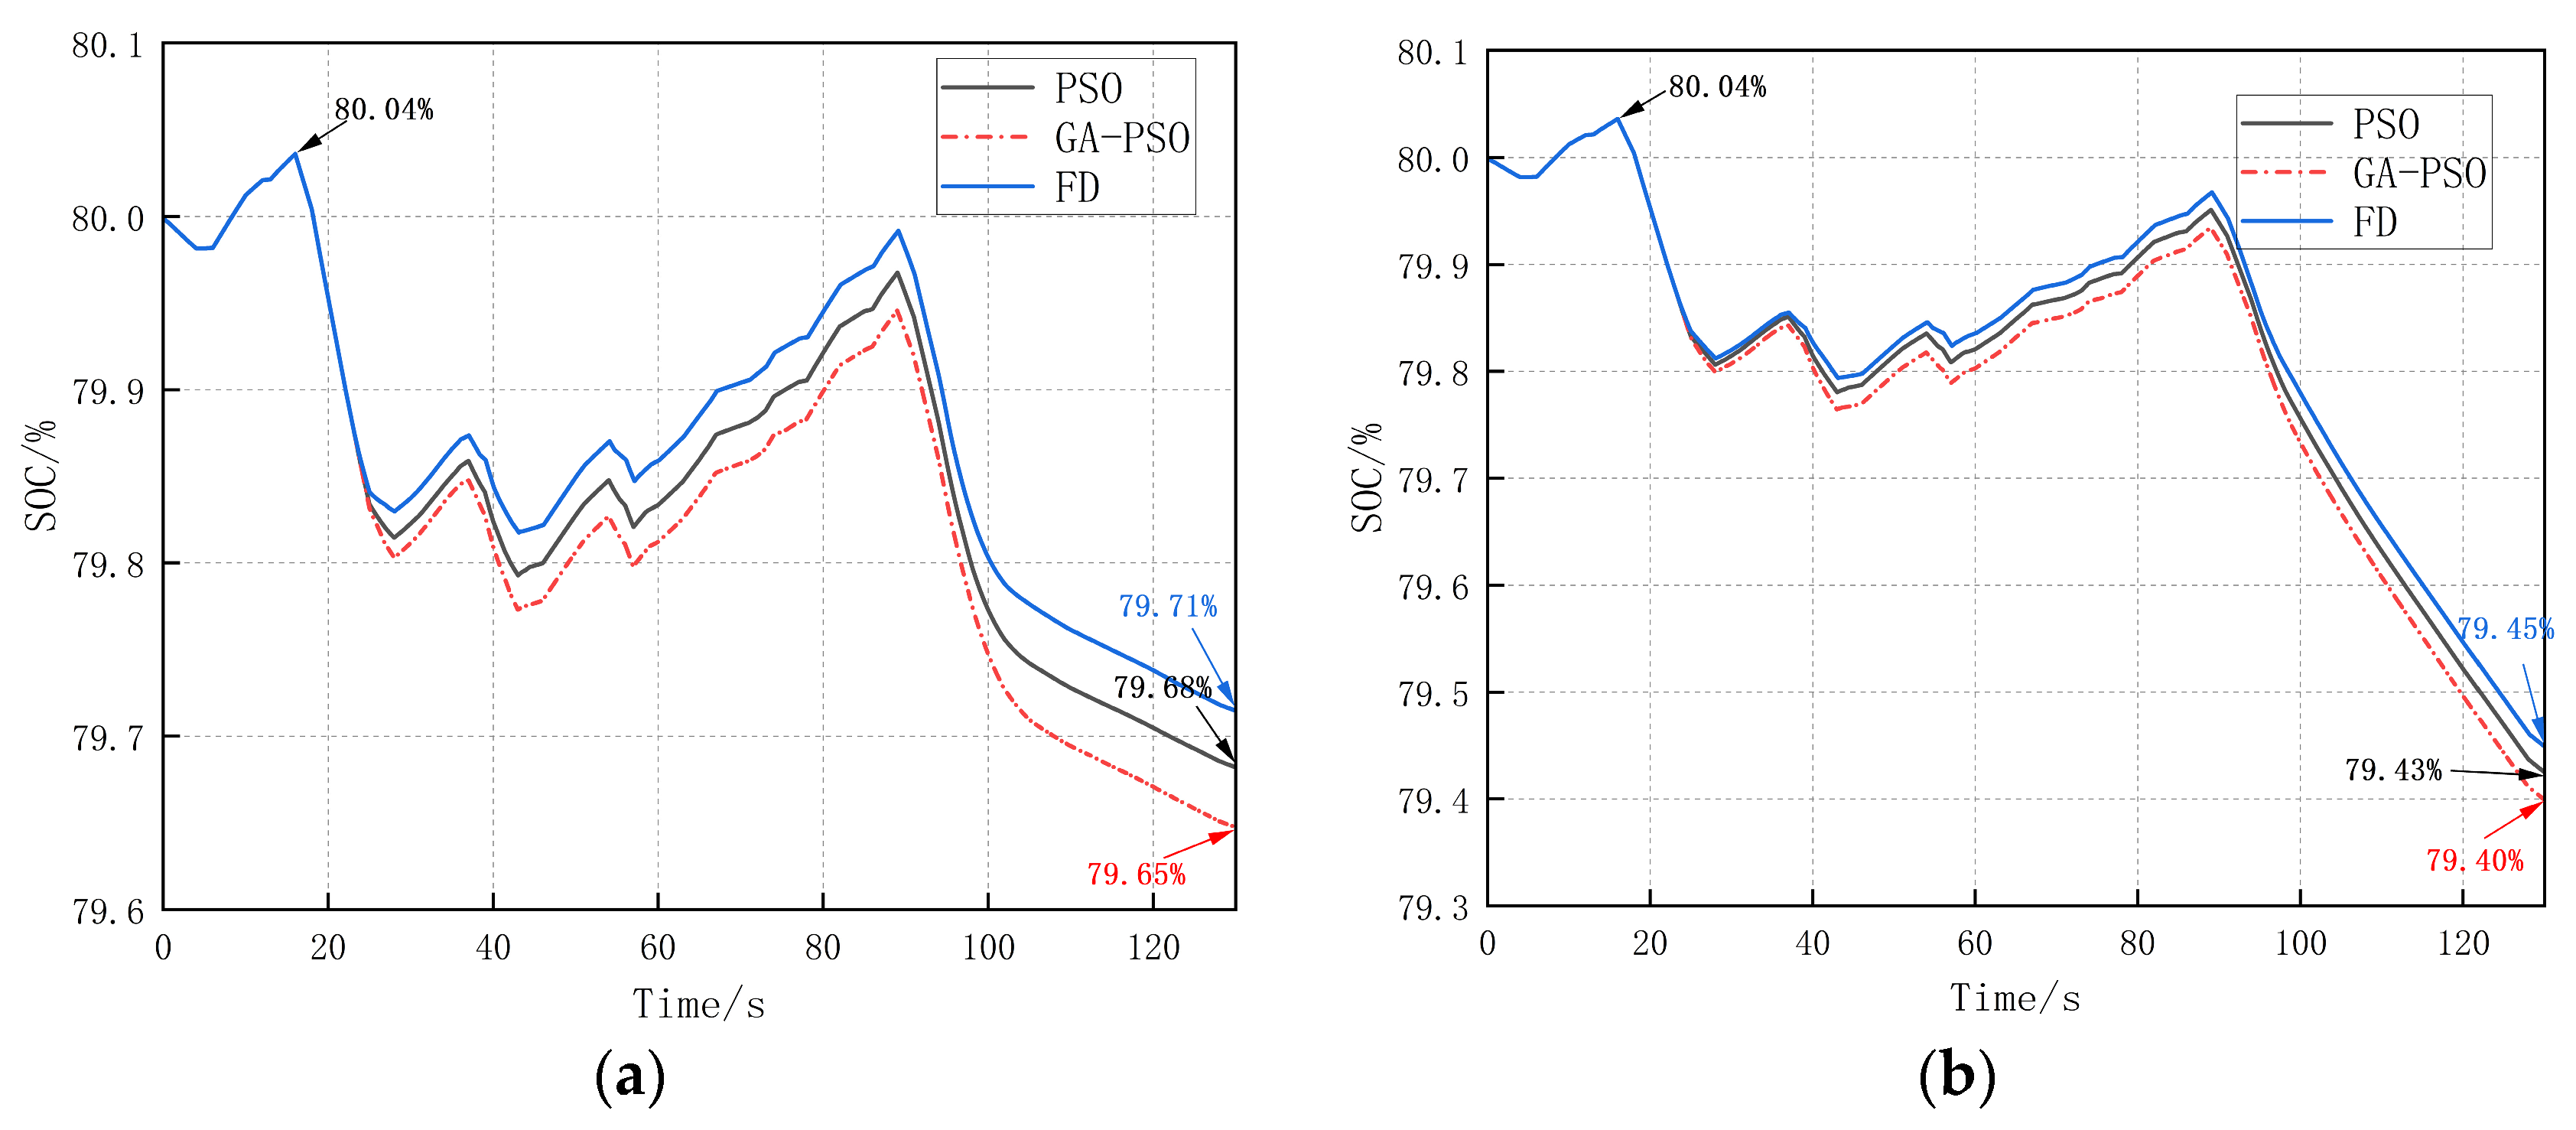
4.3. Battery SOC and Its Lifetime Prediction

The SOC variation in Li-ion batteries is shown in Figure 10. The final SOC values are shown in Table 5. Here, (a) shows the variation in SOC of Li-ion battery 1 and (b) shows the variation in SOC of Li-ion battery 2. The figure indicates that the SOC trajectories of the lithium-ion batteries under the three methods are basically consistent during the initial 24 s. After 24 s, the SOC decline rate of the Frequency Decoupling (FD) method is the slowest compared to the other two methods. In contrast, the SOC consumption rate under the Genetic Algorithm–Particle Swarm Optimization (GA-PSO) algorithm is accelerated compared to the Particle Swarm Optimization (PSO) algorithm, especially after 100 s. The final SOC under the FD method is 79.71% (battery 1) and 79.45% (battery 2); under the PSO algorithm, the final SOC levels reach 79.68% (battery 1) and 79.43% (battery 2); while under the GA-PSO algorithm, the final SOC levels are 79.65% (battery 1) and 79.40% (battery 2). The final state of charge (SOC) of both lithium-ion batteries 1 and 2 is close to the S O C t a r g e t . Analysis of the figure shows that the depth of discharge (DOD) of the FD method is the smallest, and the DOD under the GA-PSO strategy is larger than that under the PSO algorithm, which leads to a shorter cycle life of the lithium-ion batteries under the GA-PSO operation mode. As shown in Table 4, the cycle life of the fuel cell can be calculated using the provided formula. The cycle life of the FD method is the longest, and the cycle life of the lithium-ion battery under the PSO algorithm is slightly longer than that under the GA-PSO strategy.

5. Conclusions

This study focuses on fuel cell-powered passenger ships and adopts an equivalent hydrogen consumption methodology that incorporates fuel cell degradation, combined with a semi-empirical lithium-ion battery cycle life model. To minimize hydrogen consumption, an optimization algorithm based on Genetic Algorithm–Particle Swarm Optimization (GA-PSO) is developed for power allocation. For the 250 kW fuel cell system, compared with the Frequency Decoupling (FD) method, the GA-PSO strategy reduces hydrogen consumption by 7.03 g and operational costs by 4.78%; compared with the conventional Particle Swarm Optimization (PSO) algorithm, the GA-PSO strategy reduces hydrogen consumption by 3.61 g and operational costs by 2.66%.
The GA-PSO based power distribution strategy can effectively reduce hydrogen consumption, although the final results show that using the GA-PSO power distribution strategy leads to a lower number of cycle life times for the Li-ion batteries than using PSO, but the reduction is relatively small and negligible. Future work will further optimize the ECMS and take into account the cycle life of Li-ion batteries and use other ways to reduce Li-ion battery losses.
Moreover, in actual systems, as the number of integrated components increases, the number of required connectors, control loops, and protection elements will increase accordingly. This also raises higher requirements for system reliability. Furthermore, these system-level components themselves have a probability of failure and may even become a bottleneck for system reliability under certain circumstances. The article has insufficient research on system reliability, and we will conduct in-depth studies on such issues in future work.

Author Contributions

Conceptualization, P.G. and J.X.; Methodology, J.X.; Software, J.X.; Validation, J.X.; Formal analysis, J.X.; Investigation, J.X.; Resources, P.G.; Data curation, P.G.; Writing—original draft, J.X.; Writing—review & editing, P.G.; Supervision, P.G. All authors have read and agreed to the published version of the manuscript.

Funding

This research received no external funding.

Data Availability Statement

Data is contained within the article.

Conflicts of Interest

The authors declare no conflict of interest.

References

  1. Qazi, S.; Venugopal, P.; Rietveld, G.; Soeiro, T.B.; Shipurkar, U.; Grasman, A.; Watson, A.J.; Wheeler, P. Powering Maritime: Challenges and Prospects in Ship Electrification. IEEE Electrif. Mag. 2023, 11, 74–87. [Google Scholar] [CrossRef]
  2. Perčić, M.; Vladimir, N.; Jovanović, I.; Koričan, M. Application of Fuel Cells with Zero-Carbon Fuels in Short-Sea Shipping. Appl. Energy 2022, 309, 118463. [Google Scholar] [CrossRef]
  3. Li, X.; Ye, T.; Meng, X.; He, D.; Li, L.; Song, K.; Jiang, J.; Sun, C. Advances in the Application of Sulfonated Poly (Ether Ether Ketone) (Speek) and Its Organic Composite Membranes for Proton Exchange Membrane Fuel Cells (Pemfcs). Polymers 2024, 16, 2840. [Google Scholar] [CrossRef] [PubMed]
  4. Maaruf, M.; Khalid, M. Hybrid Solar/Pem Fuel Cell/and Water Electrolyzer Energy System for All-Electric Ship. In Proceedings of the 2022 IEEE Kansas Power and Energy Conference (KPEC), Manhattan, KS, USA, 25–26 April 2022. [Google Scholar]
  5. Bouisalmane, N.; Wang, T.; Breaz, E.; Doubabi, S.; Paire, D.; Oubraham, J.; Levy, M.; Gao, F. Hydrogen Consumption Minimization with Optimal Power Allocation of Multi-Stack Fuel Cell System Using Particle Swarm Optimization. In Proceedings of the 2021 IEEE Transportation Electrification Conference & Expo (ITEC), Chicago, IL, USA, 21–25 June 2021. [Google Scholar]
  6. Moghadari, M.; Kandidayeni, M.; Boulon, L.; Chaoui, H. Hydrogen Minimization of a Hybrid Multi-Stack Fuel Cell Vehicle Using an Optimization-Based Strategy. In Proceedings of the 2021 IEEE Vehicle Power and Propulsion Conference (VPPC), Gijon, Spain, 25–28 October 2021. [Google Scholar]
  7. Tang, X.; Shi, L.; Li, M.; Xu, S.; Sun, C. Health State Estimation and Long-Term Durability Prediction for Vehicular Pem Fuel Cell Stacks under Dynamic Operational Conditions. IEEE Trans. Power Electron. 2024, 40, 4498–4509. [Google Scholar] [CrossRef]
  8. Meng, X.; Sun, C.; Mei, J.; Tang, X.; Hasanien, H.M.; Jiang, J.; Fan, F.; Song, K. Fuel Cell Life Prediction Considering the Recovery Phenomenon of Reversible Voltage Loss. J. Power Sources 2025, 625, 235634. [Google Scholar] [CrossRef]
  9. Huang, W.; Liu, M.; Zhang, C.; Niu, T.; Fu, Z.; Ren, X.; Chin, C.S. Life Prediction for Proton Exchange Membrane Fuel Cell Based on Experimental Results and Combinatorial Optimization Algorithm. Int. J. Hydrogen Energy 2024, 79, 364–376. [Google Scholar] [CrossRef]
  10. Jiang, H.; Xu, L.; Li, J.; Hu, Z.; Ouyang, M. Energy Management and Component Sizing for a Fuel Cell/Battery/Supercapacitor Hybrid Powertrain Based on Two-Dimensional Optimization Algorithms. Energy 2019, 177, 386–396. [Google Scholar] [CrossRef]
  11. Fletcher, T.; Thring, R.; Watkinson, M. An Energy Management Strategy to Concurrently Optimise Fuel Consumption & Pem Fuel Cell Lifetime in a Hybrid Vehicle. Int. J. Hydrogen Energy 2016, 41, 21503–21515. [Google Scholar] [CrossRef]
  12. Hein, K.; Xu, Y.; Wilson, G.; Gupta, A.K. Coordinated Optimal Voyage Planning and Energy Management of All-Electric Ship with Hybrid Energy Storage System. IEEE Trans. Power Syst. 2020, 36, 2355–2365. [Google Scholar] [CrossRef]
  13. Ma, Z.; Chen, H.; Han, J.; Chen, Y.; Kuang, J.; Charpentier, J.-F.; Aϊt-Ahmed, N.; Benbouzid, M. Optimal Soc Control and Rule-Based Energy Management Strategy for Fuel-Cell-Based Hybrid Vessel Including Batteries and Supercapacitors. J. Mar. Sci. Eng. 2023, 11, 398. [Google Scholar] [CrossRef]
  14. Meng, X.; Li, Q.; Zhang, G.; Wang, T.; Chen, W.; Cao, T. A Dual-Mode Energy Management Strategy Considering Fuel Cell Degradation for Energy Consumption and Fuel Cell Efficiency Comprehensive Optimization of Hybrid Vehicle. IEEE Access 2019, 7, 134475–134487. [Google Scholar] [CrossRef]
  15. Li, Z.; Xu, Y.; Fang, S.; Wang, Y.; Zheng, X. Multiobjective Coordinated Energy Dispatch and Voyage Scheduling for a Multienergy Ship Microgrid. IEEE Trans. Ind. Appl. 2019, 56, 989–999. [Google Scholar] [CrossRef]
  16. Sun, Y.; Xu, Q.; Yuan, Y.; Yang, B. Optimal Energy Management of Fuel Cell Hybrid Electric Ships Considering Fuel Cell Aging Cost. In Proceedings of the 2020 IEEE/IAS Industrial and Commercial Power System Asia (I&CPS Asia), Weihai, China, 13–15 July 2020. [Google Scholar]
  17. Wang, N.; Song, B.; Gao, T.; Li, Y. Adaptive Equivalent Consumption Minimization Strategy for Fuel Cell Ships Suffering From Efficiency Degradation. In Proceedings of the 2024 36th Chinese Control and Decision Conference (CCDC), Xi’an, China, 25–27 May 2024. [Google Scholar]
  18. Zhu, L.; Liu, Y.; Zeng, Y.; Guo, H.; Ma, K.; Liu, S.; Zhang, Q. Energy Management Strategy for Fuel Cell Hybrid Ships Based on Deep Reinforcement Learning with Multi-Optimization Objectives. Int. J. Hydrogen Energy 2024, 93, 1258–1267. [Google Scholar] [CrossRef]
  19. Pang, B.; Liu, S.; Zhu, H.; Feng, Y.; Dong, Z. Real-Time Optimal Control of an Lng-Fueled Hybrid Electric Ship Considering Battery Degradations. Energy 2024, 296, 131170. [Google Scholar] [CrossRef]
  20. Song, K.; Ding, Y.; Hu, X.; Xu, H.; Wang, Y.; Cao, J. Degradation Adaptive Energy Management Strategy Using Fuel Cell State-of-Health for Fuel Economy Improvement of Hybrid Electric Vehicle. Appl. Energy 2021, 285, 116413. [Google Scholar] [CrossRef]
  21. Zhang, W.; Li, J.; Xu, L.; Ouyang, M. Optimization for a Fuel Cell/Battery/Capacity Tram with Equivalent Consumption Minimization Strategy. Energy Convers. Manag. 2017, 134, 59–69. [Google Scholar] [CrossRef]
  22. Cao, W.; Geng, P.; Xu, X. Optimization of Battery Energy Storage System Size and Power Allocation Strategy for Fuel Cell Ship. Energy Sci. Eng. 2023, 11, 2110–2121. [Google Scholar] [CrossRef]
  23. Ghorbani, N.; Kasaeian, A.; Toopshekan, A.; Bahrami, L.; Maghami, A. Optimizing a Hybrid Wind-Pv-Battery System Using Ga-Pso and Mopso for Reducing Cost and Increasing Reliability. Energy 2018, 154, 581–591. [Google Scholar] [CrossRef]
  24. Zhao, F.; Li, Y.; Zhou, M. Optimization of energy management strategy for marine multi-stack fuel cell hybrid power system. Ship Sci. Technol. 2024, 46, 134–140. [Google Scholar]
  25. Cao, W.; Geng, P.; Xu, X.; Tarasiuk, T. Energy Management Strategy Considering Energy Storage System Degradation for Hydrogen Fuel Cell Ship. Pol. Marit. Res. 2023, 30, 95–104. [Google Scholar] [CrossRef]
  26. Balsamo, F.; De Falco, P.; Mottola, F.; Pagano, M. Power Flow Approach for Modeling Shipboard Power System in Presence of Energy Storage and Energy Management Systems. IEEE Trans. Energy Convers. 2020, 35, 1944–1953. [Google Scholar] [CrossRef]
  27. Chen, H.; Zhang, Z.; Guan, C.; Gao, H. Optimization of Sizing and Frequency Control in Battery/Supercapacitor Hybrid Energy Storage System for Fuel Cell Ship. Energy 2020, 197, 117285. [Google Scholar] [CrossRef]
  28. Li, Y.; Guo, Y.; Zhang, Y. Equivalent Consumption Minimization Energy Management Strategy Based on Frequency Decoupling for Unmanned Surface Vehicle. In Proceedings of the 2023 3rd International Conference on Energy, Power and Electrical Engineering (EPEE), Wuhan, China, 15–17 September 2023. [Google Scholar]
Figure 1. Energy flow of the fuel cell system.
Energies 18 03892 g001
Figure 2. Fuel cell efficiency decay curves.
Energies 18 03892 g002
Figure 3. Relationship between number of cycles and depth of discharge (DOD).
Energies 18 03892 g003
Figure 4. Flowchart of GA-PSO algorithm.
Energies 18 03892 g004
Figure 5. Relationship between fuel cell output power and hydrogen consumption rate under different Sohs.
Energies 18 03892 g005
Figure 6. Fuel cell vessel power system topology.
Energies 18 03892 g006
Figure 7. Load power.
Energies 18 03892 g007
Figure 8. (a) Fuel cell 1 output power, (b) fuel cell 1 output power, (c) Li-ion battery 1 output power, (d) Li-ion battery 2 output power.
Energies 18 03892 g008
Figure 9. (a) Fuel cell 1 hydrogen consumption, (b) fuel cell 2 hydrogen consumption.
Energies 18 03892 g009
Figure 10. (a) SOC of Li-ion battery 1, (b) SOC of Li-ion battery 2.
Energies 18 03892 g010
Table 1. Rated cycle life at different DODs.
DODCycle Life (Day)
010,610
0.28720
0.47200
0.65200
14700
Table 2. Comparison of advantages and disadvantages of different intelligent optimization algorithms.
AlgorithmsAdvantageDisadvantage
GAStrong global search capability, robust performance, and broad applicabilityLow local search precision, slow convergence, and complex parameter tuning
PSOSimple implementation, fast convergence, and minimal parametersProne to local optima and ineffective for discrete optimization problems
ABCExhibits strong robustness and possesses powerful global search capabilityInsufficient local search precision and low late-stage convergence efficiency
FAStrong global exploration capability, particularly suitable for multimodal functionsExhibits slow convergence speed and high sensitivity to parameters (e.g., light absorption coefficient
ACOStrong global search capability, making it well-suited for discrete optimization problemsSuffers from slow convergence, is prone to local optima, and is parameter-intensive
Table 3. Main parameters of the model.
ParameterValue
FCS P f c , m i n 20 kW
P f c , m a x 85 kW
P f c , r a t e 85 kW
Power ramp rate limit of FCS±4.24 kW/s
ESSNominal voltage/capacity550 V/100 Ah
P b a t t , m a x 110 kW
S O C m a x 90%
S O C m i n 30%
S O C t a r g e t 80%
Table 4. Total hydrogen consumption and costs under the same algorithm.
The Hydrogen Consumption (g)Cost (USD)
FD153.330.691
PSO149.910.676
GA-PSO146.300.658
Table 5. Li-ion battery SOC and its cycle life under different algorithms.
AlgorithmBatt1 SOC (%)Batt2 SOC (%)Batt1 Cycle Life (Day)Batt2 Cycle Life (Day)
FD79.7179.4587048683
PSO79.6879.4387028680
GA-PSO79.6579.4087008678
Disclaimer/Publisher’s Note: The statements, opinions and data contained in all publications are solely those of the individual author(s) and contributor(s) and not of MDPI and/or the editor(s). MDPI and/or the editor(s) disclaim responsibility for any injury to people or property resulting from any ideas, methods, instructions or products referred to in the content.

