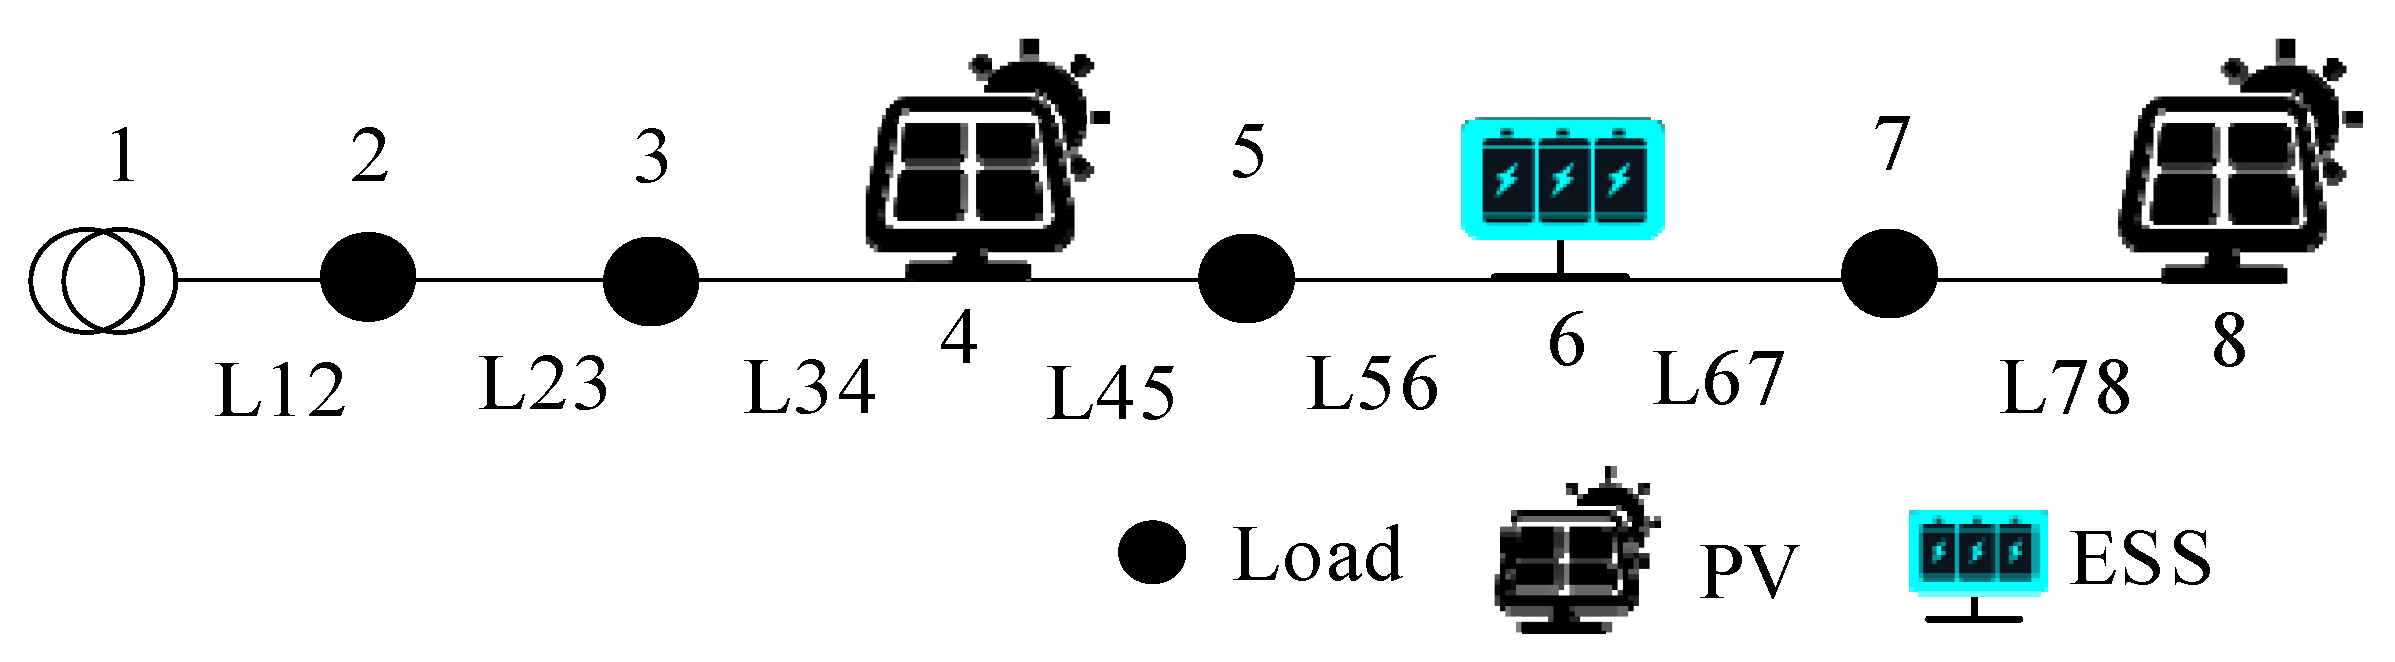
Figure 1.
Diagram of a simple distribution network.
Figure 1.
Diagram of a simple distribution network.
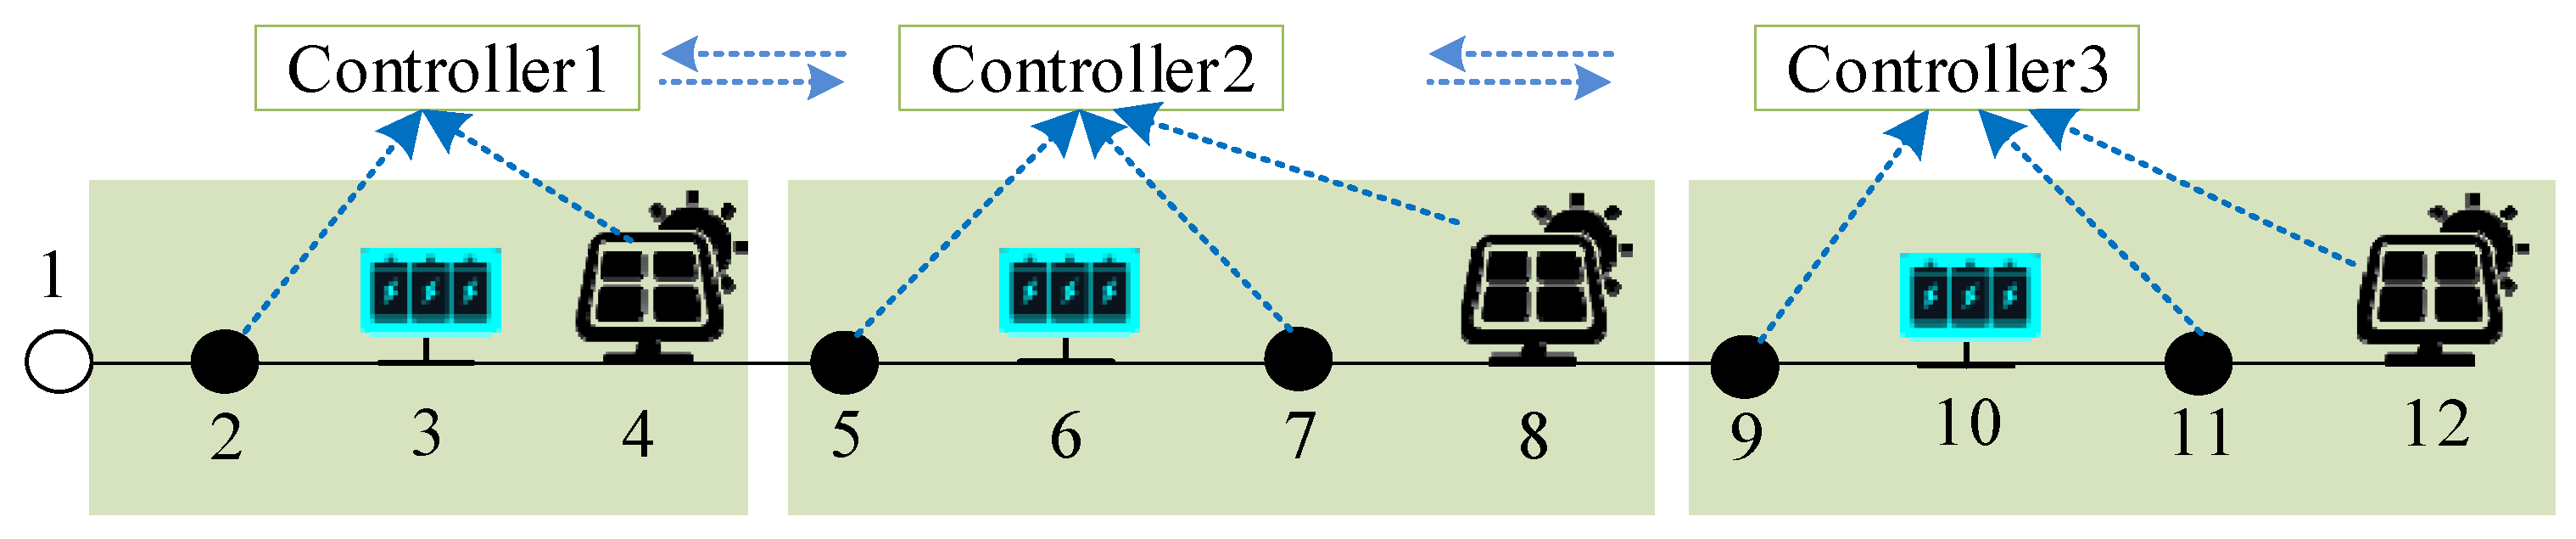
Figure 2.
Diagram of distribution network cluster division.
Figure 2.
Diagram of distribution network cluster division.
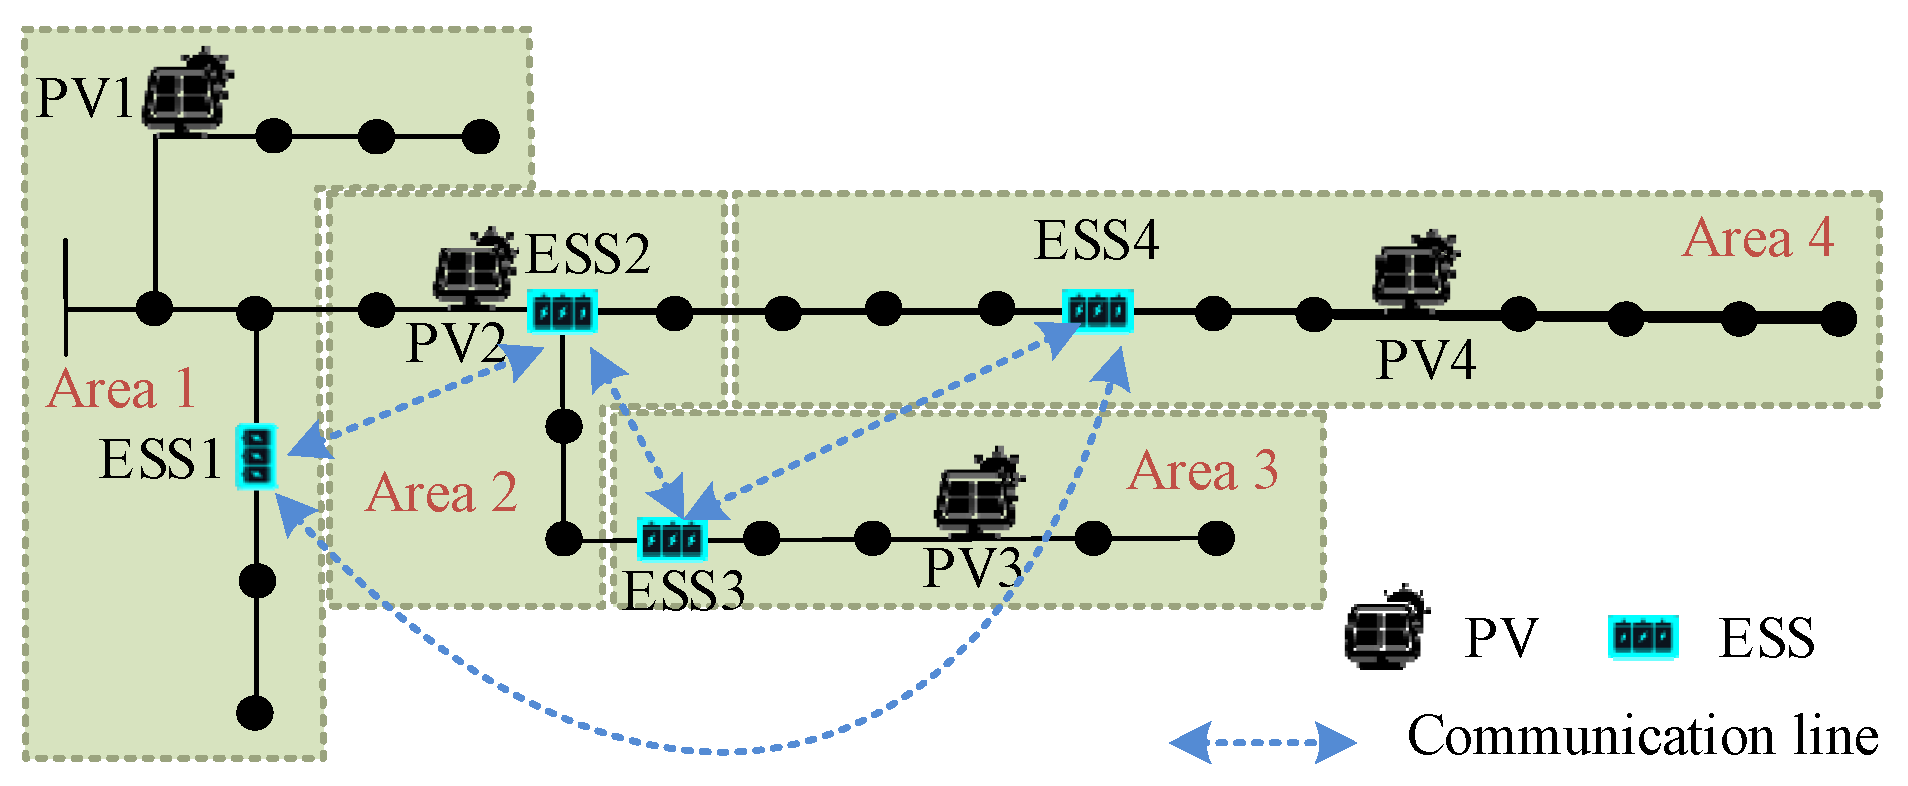
Figure 3.
Cluster division results of IEEE33 bus system.
Figure 3.
Cluster division results of IEEE33 bus system.
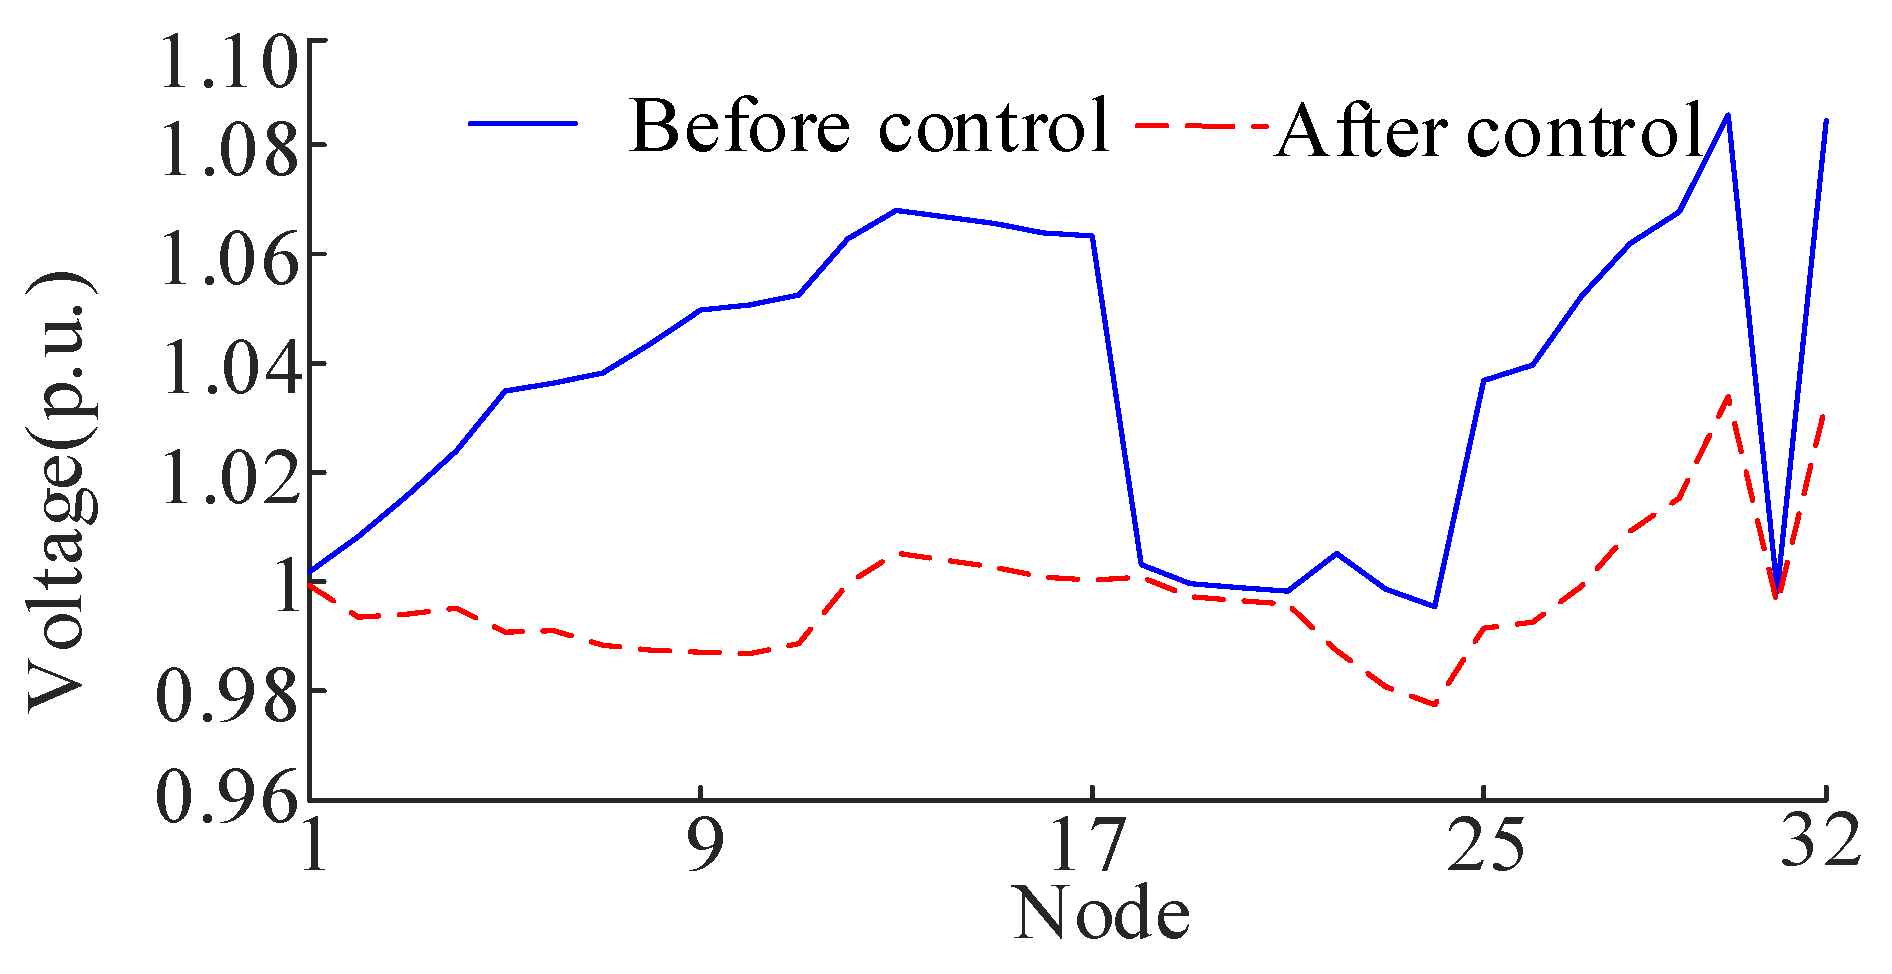
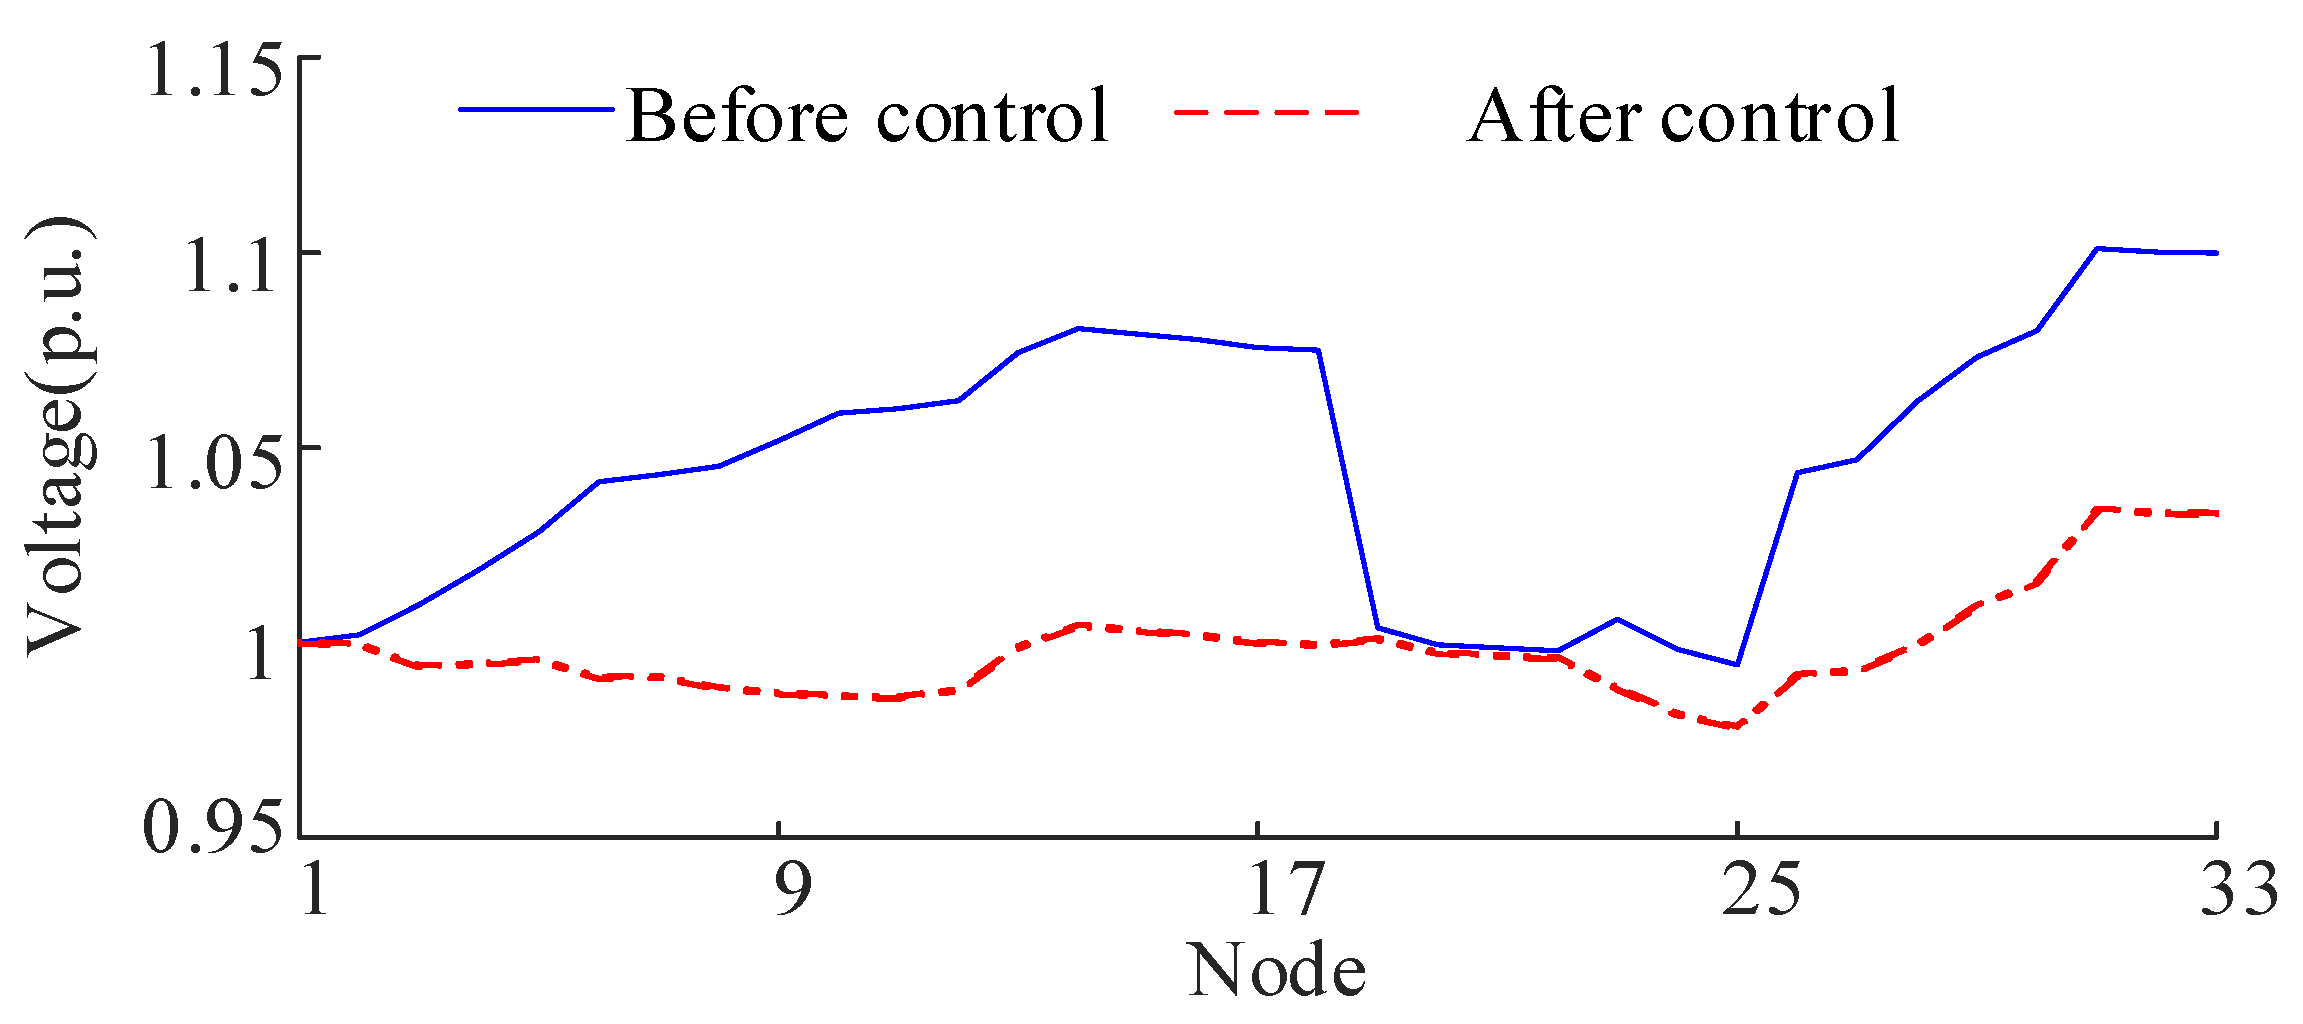
Figure 4.
Nodal voltage of IEEE33 before and after control.
Figure 4.
Nodal voltage of IEEE33 before and after control.
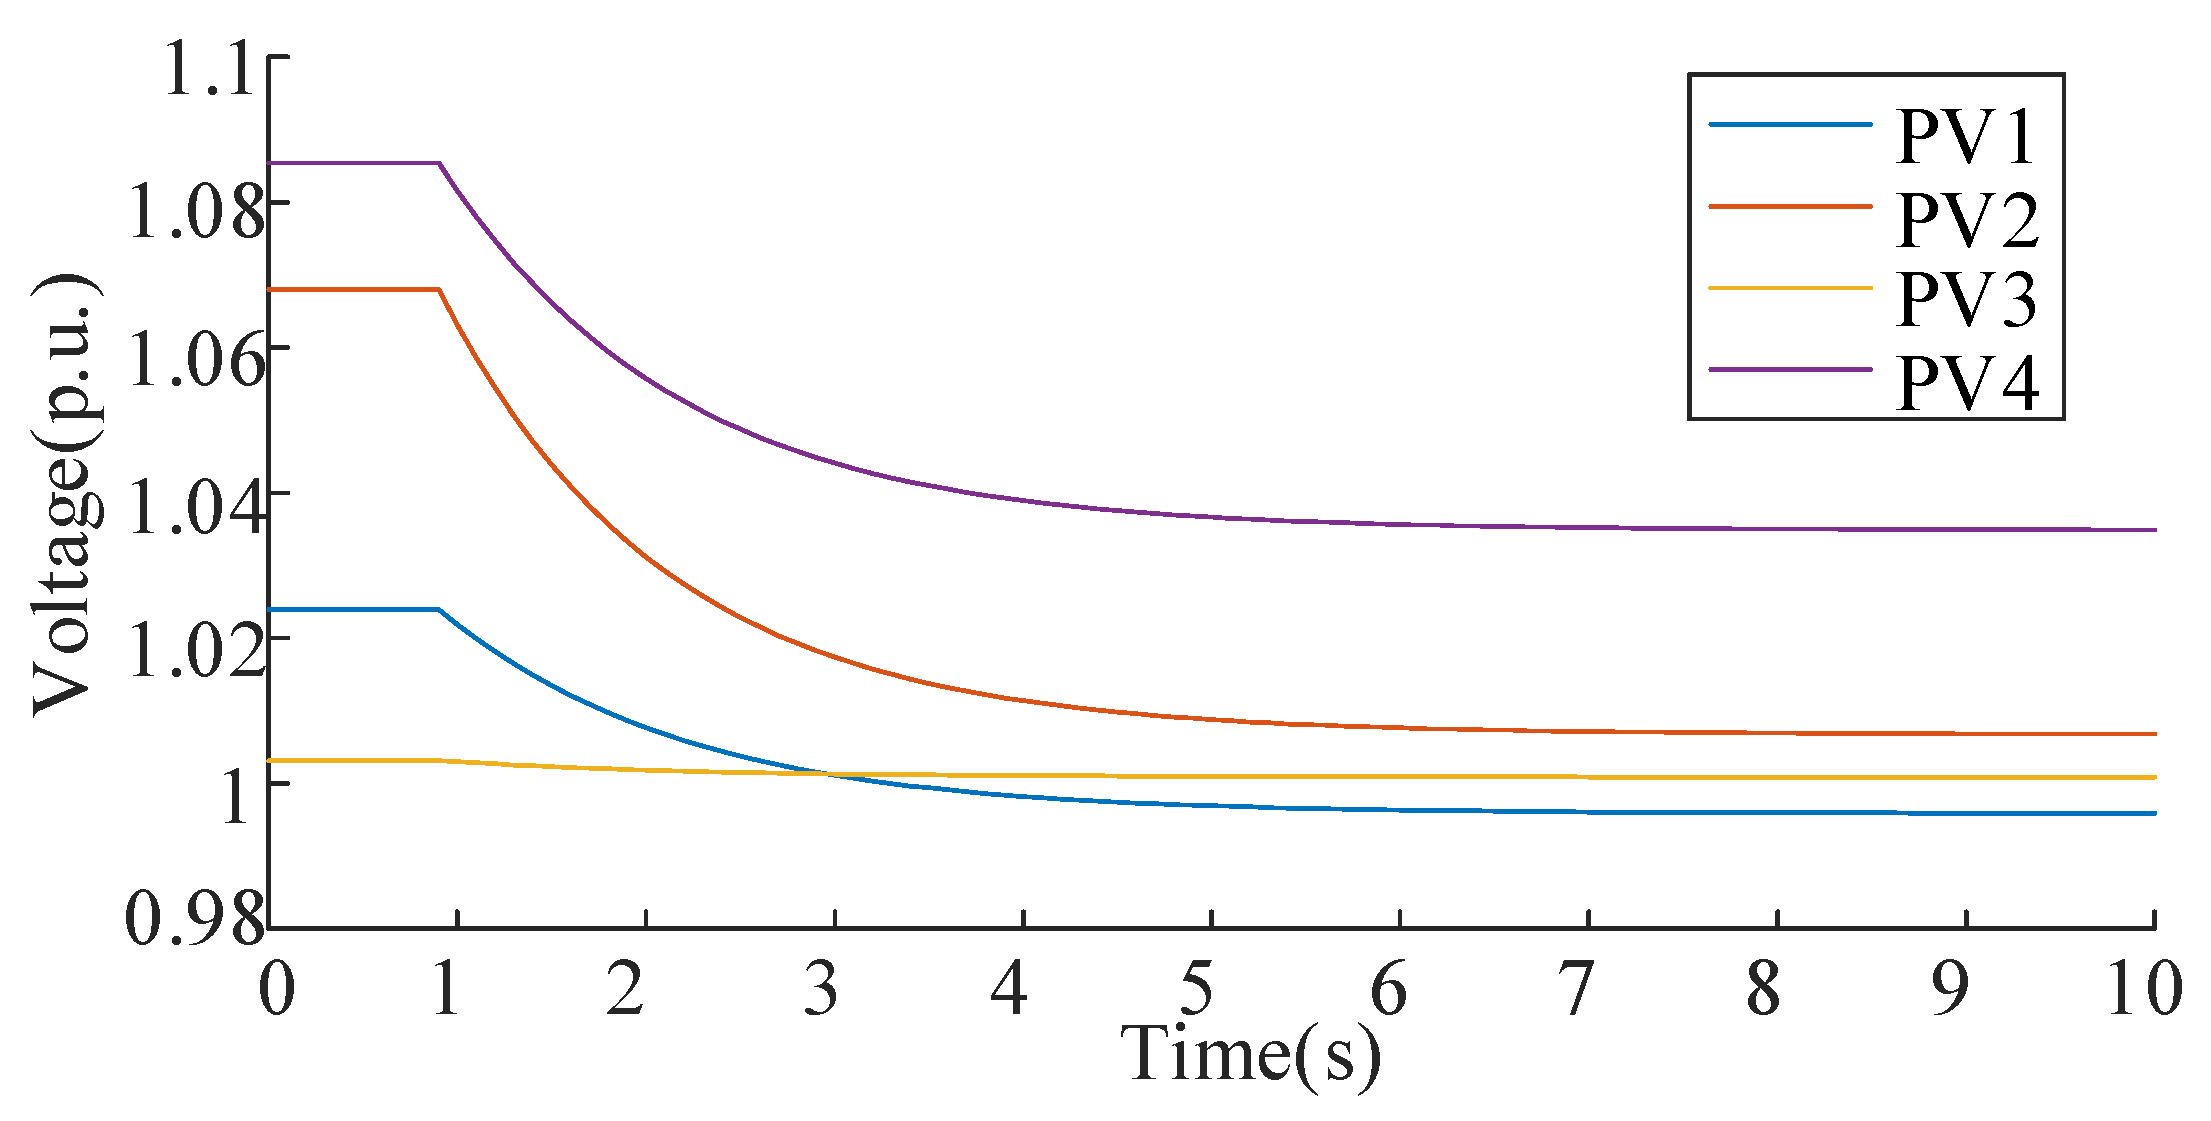
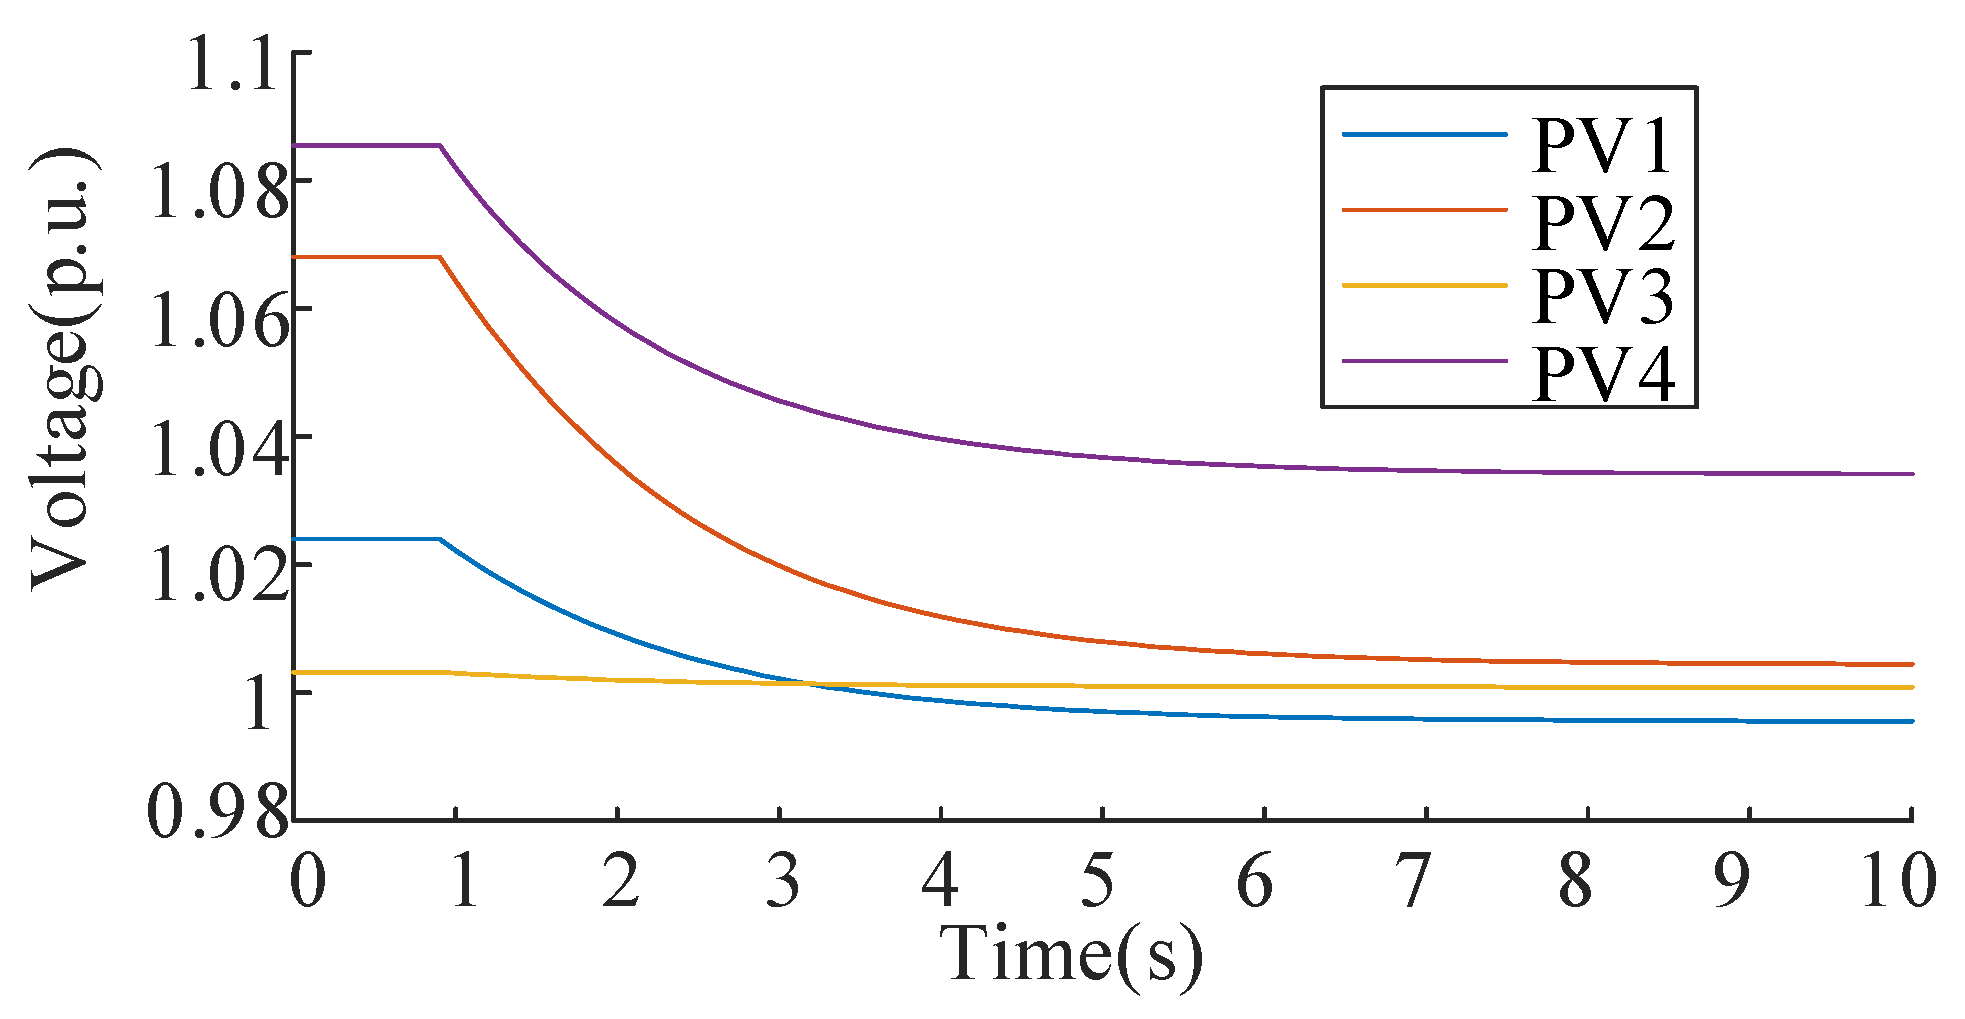
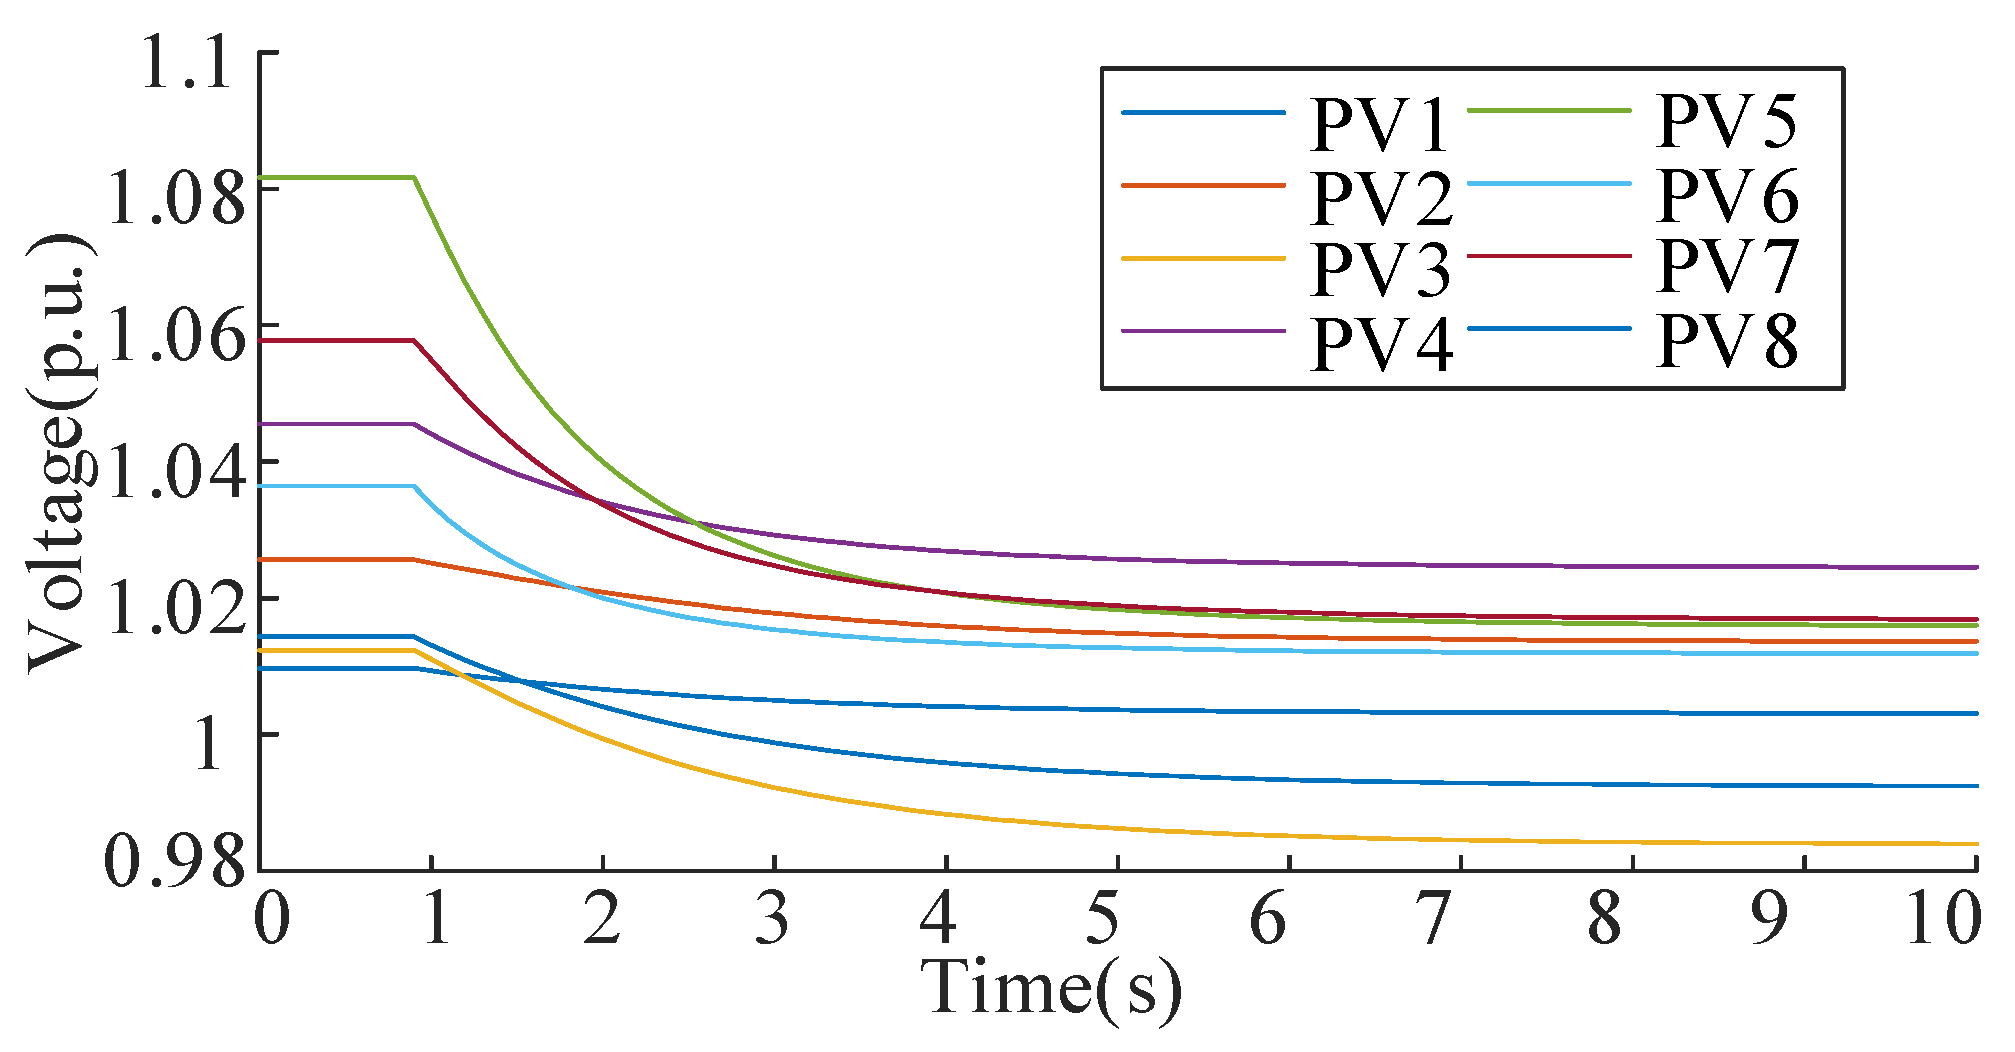
Figure 5.
Nodal voltage variation at PV buses of IEEE33 during the control process.
Figure 5.
Nodal voltage variation at PV buses of IEEE33 during the control process.
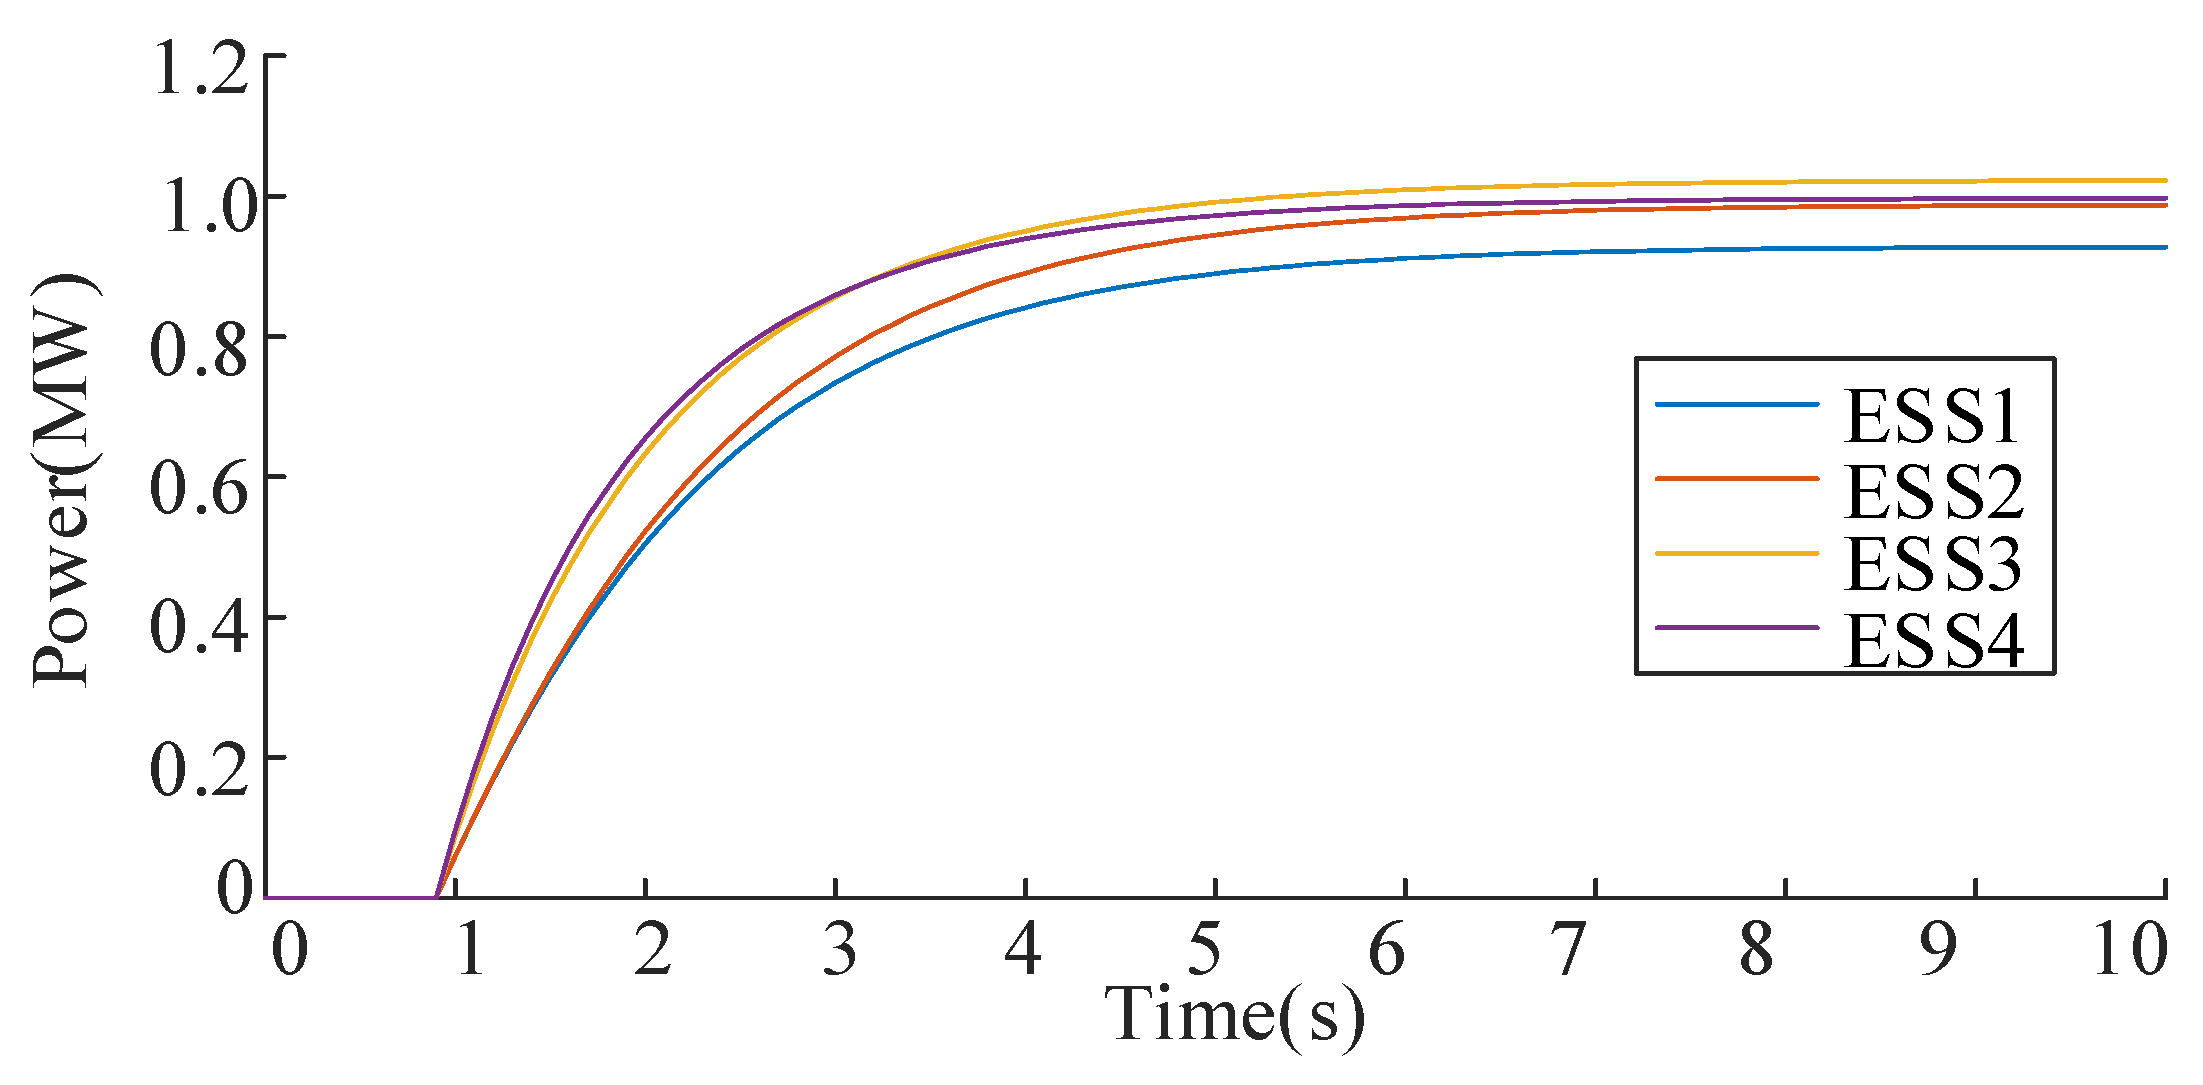
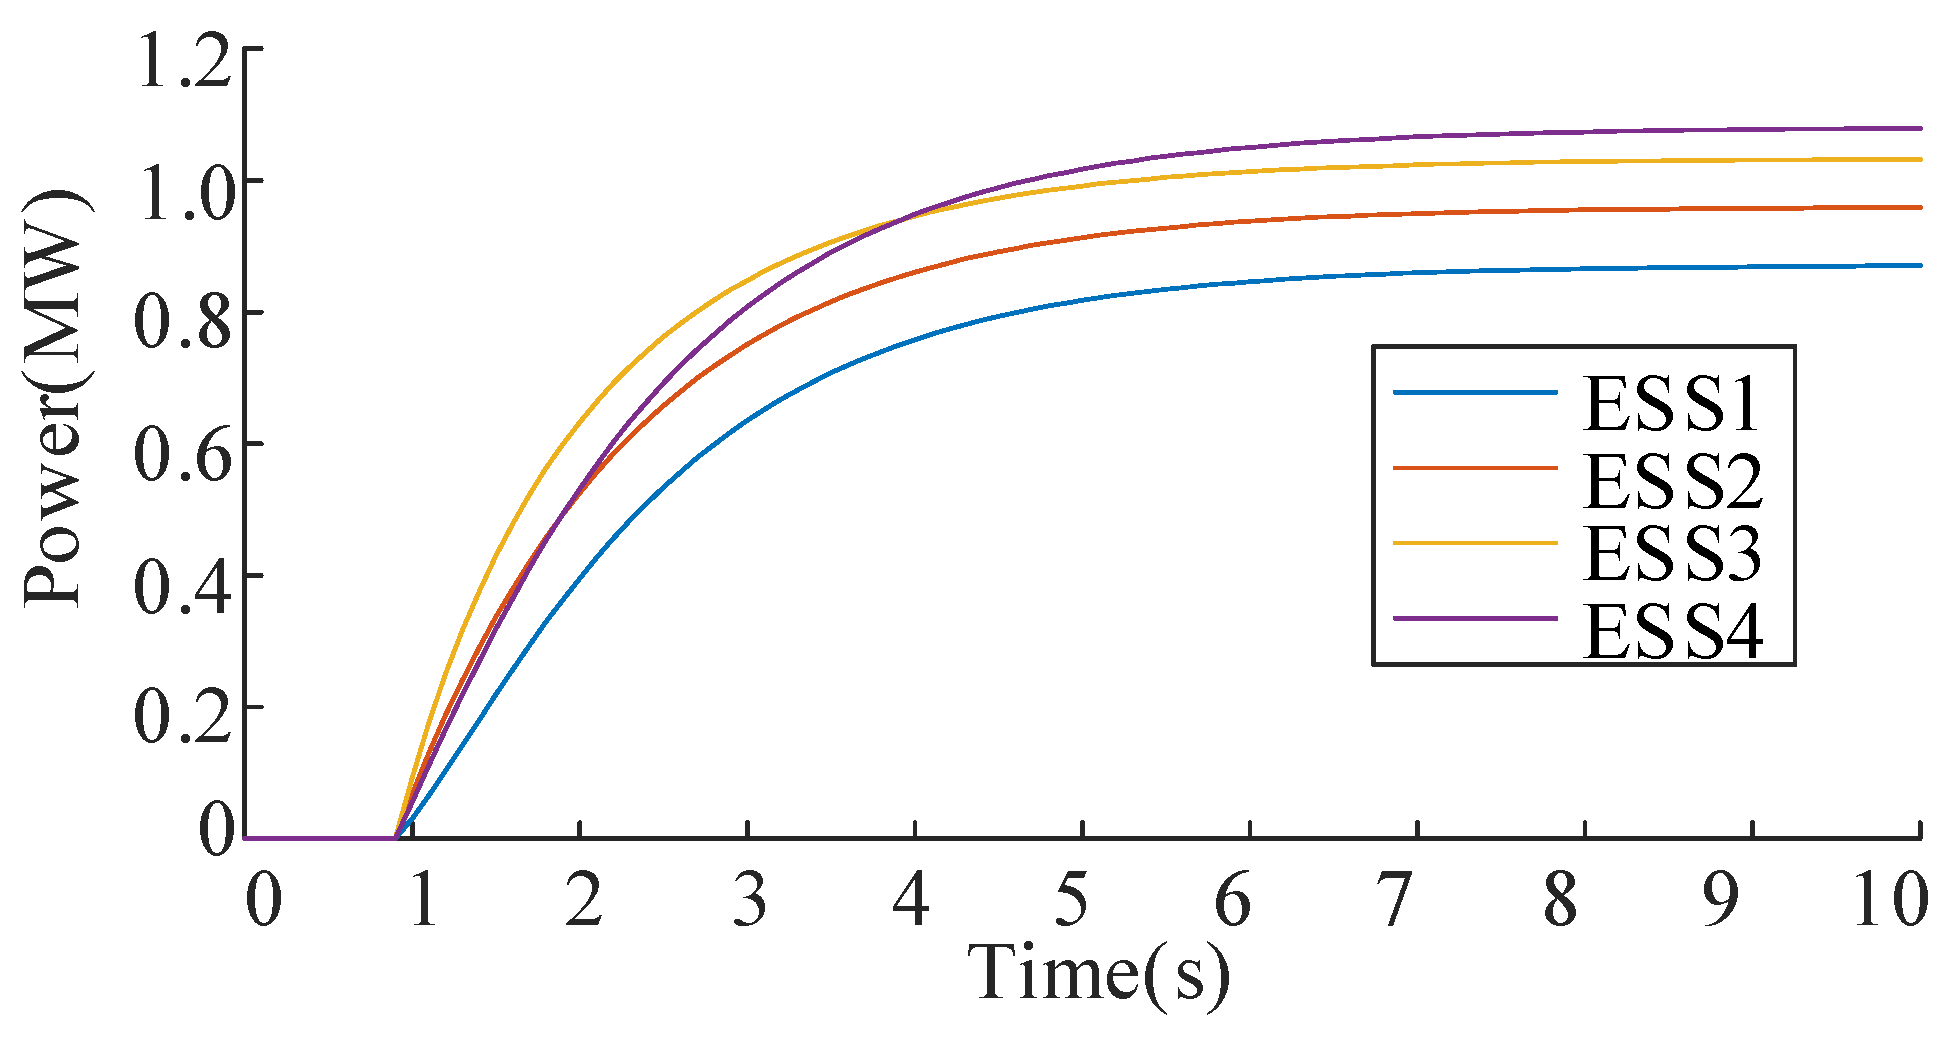
Figure 6.
ESS output powers of IEEE33 bus system during the control process.
Figure 6.
ESS output powers of IEEE33 bus system during the control process.
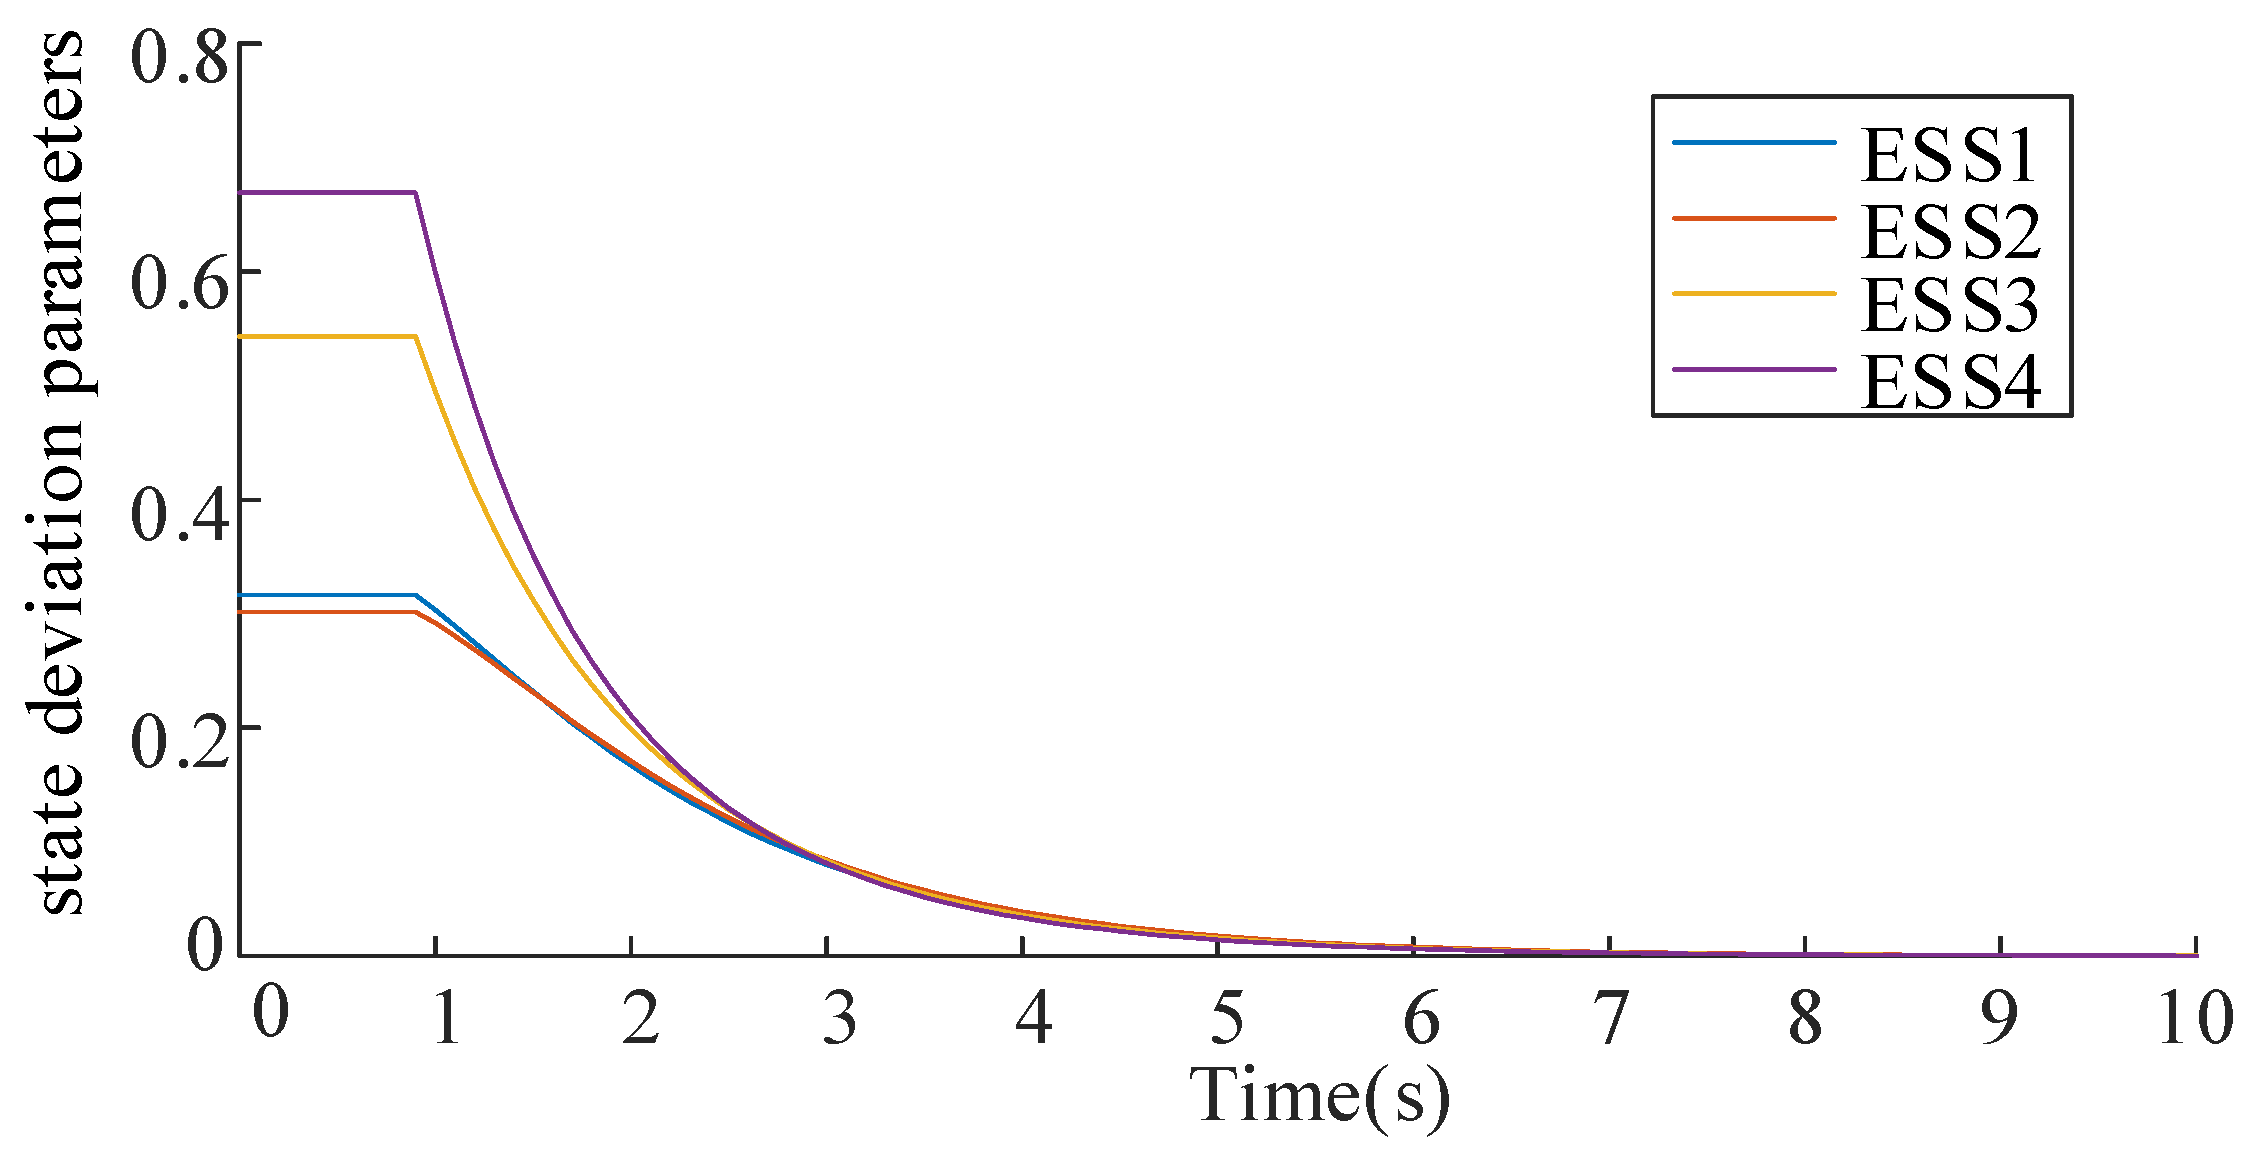
Figure 7.
ESS state deviation parameters of IEEE33 during the control process.
Figure 7.
ESS state deviation parameters of IEEE33 during the control process.
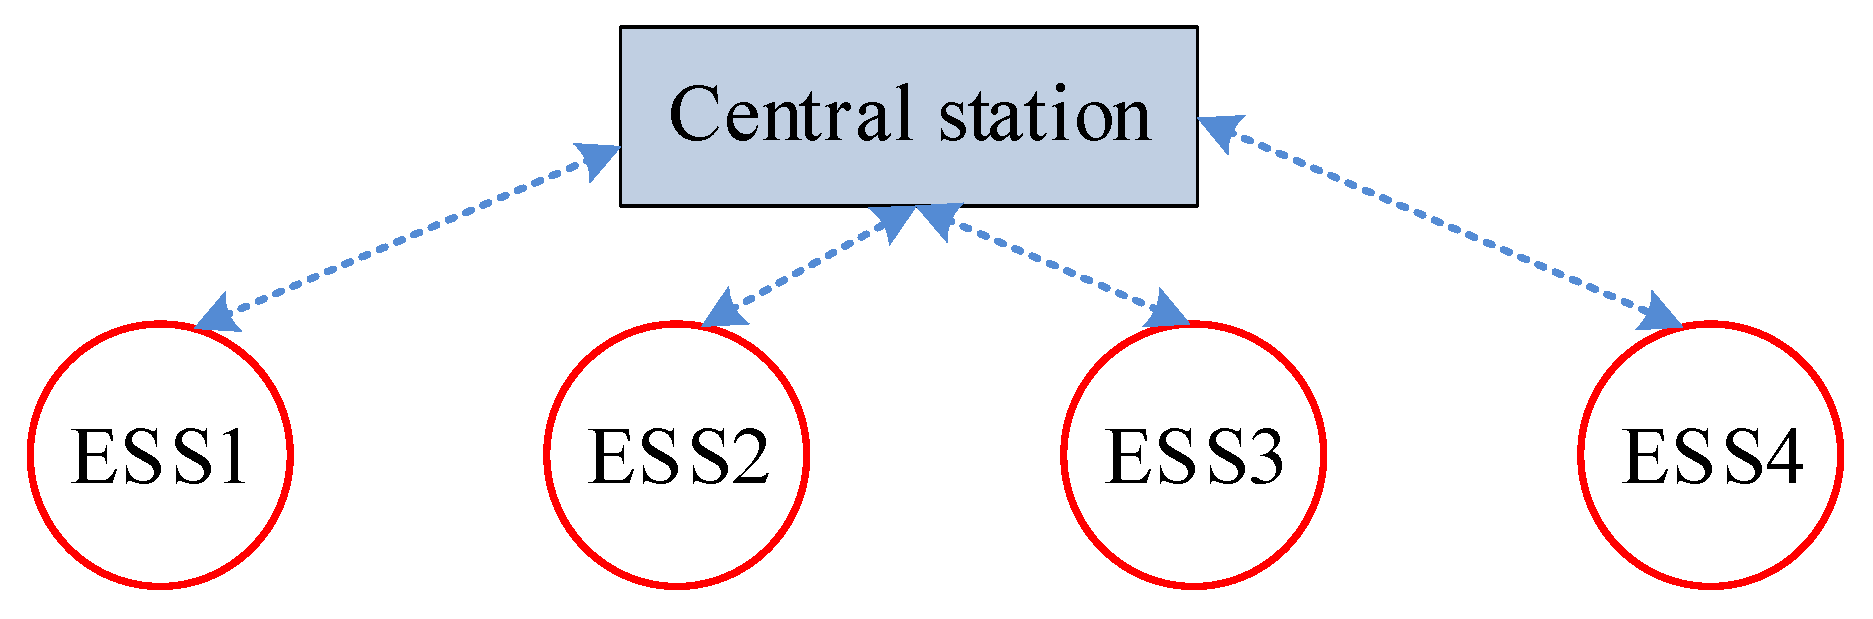
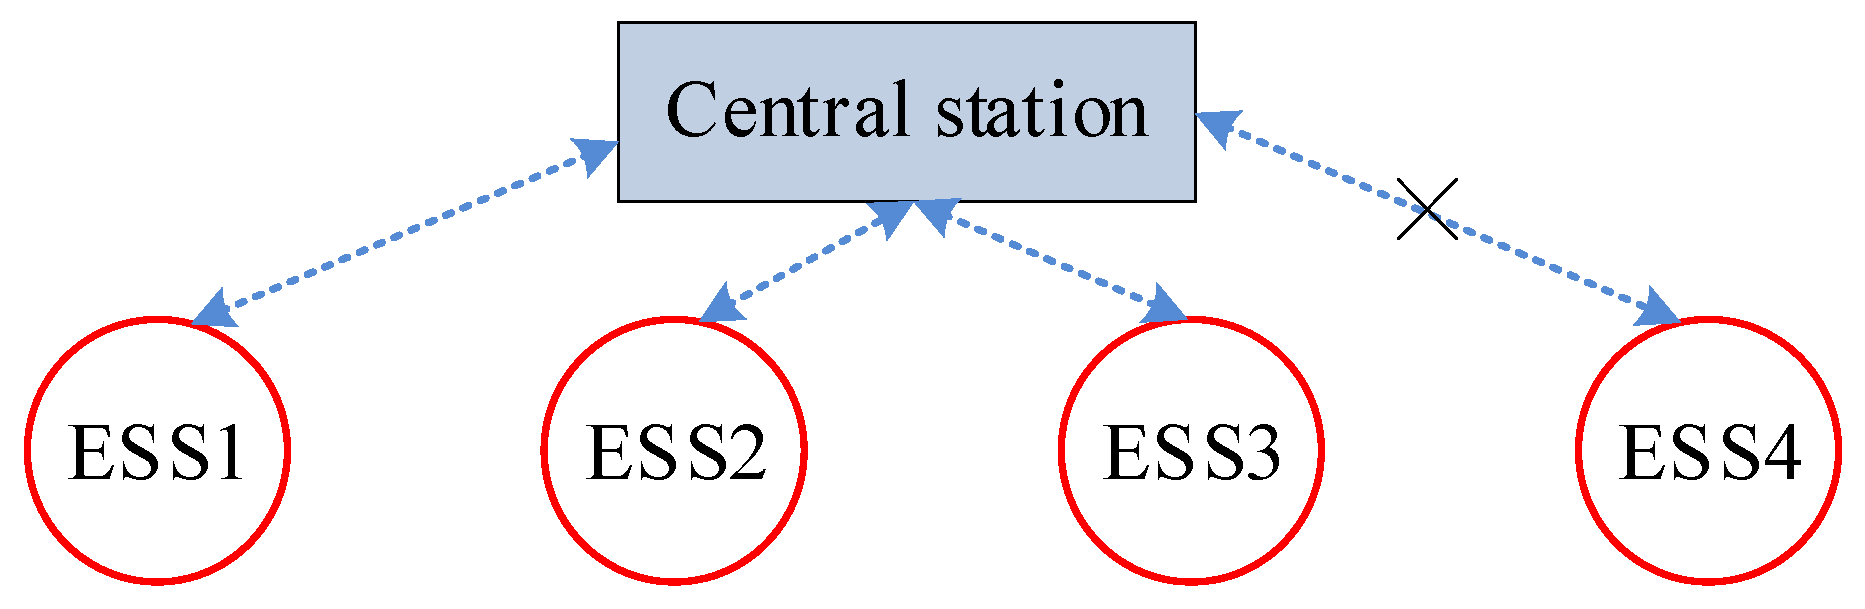
Figure 8.
Communication framework under centralized control.
Figure 8.
Communication framework under centralized control.
Figure 9.
The charging power of ESS under distributed control and centralized control.
Figure 9.
The charging power of ESS under distributed control and centralized control.
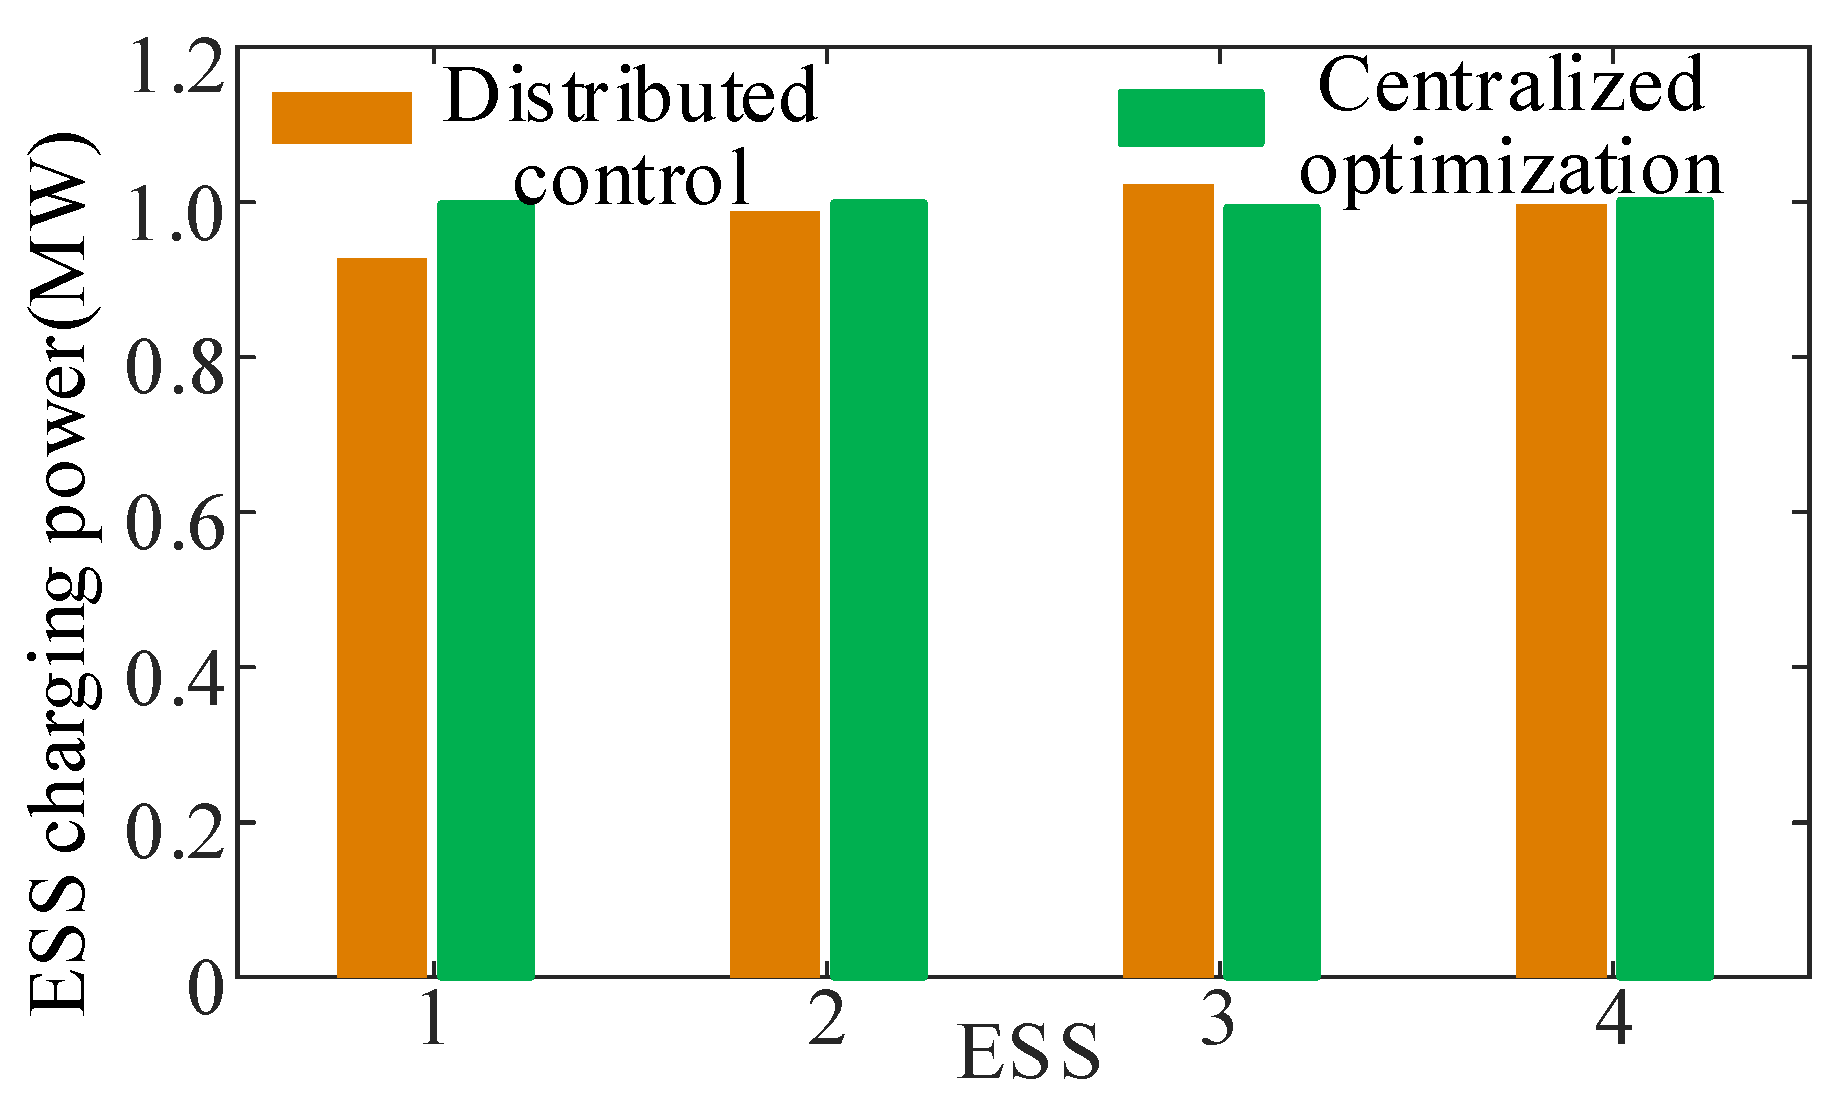
Figure 10.
The charging power of ESS under distributed control and centralized optimization.
Figure 10.
The charging power of ESS under distributed control and centralized optimization.
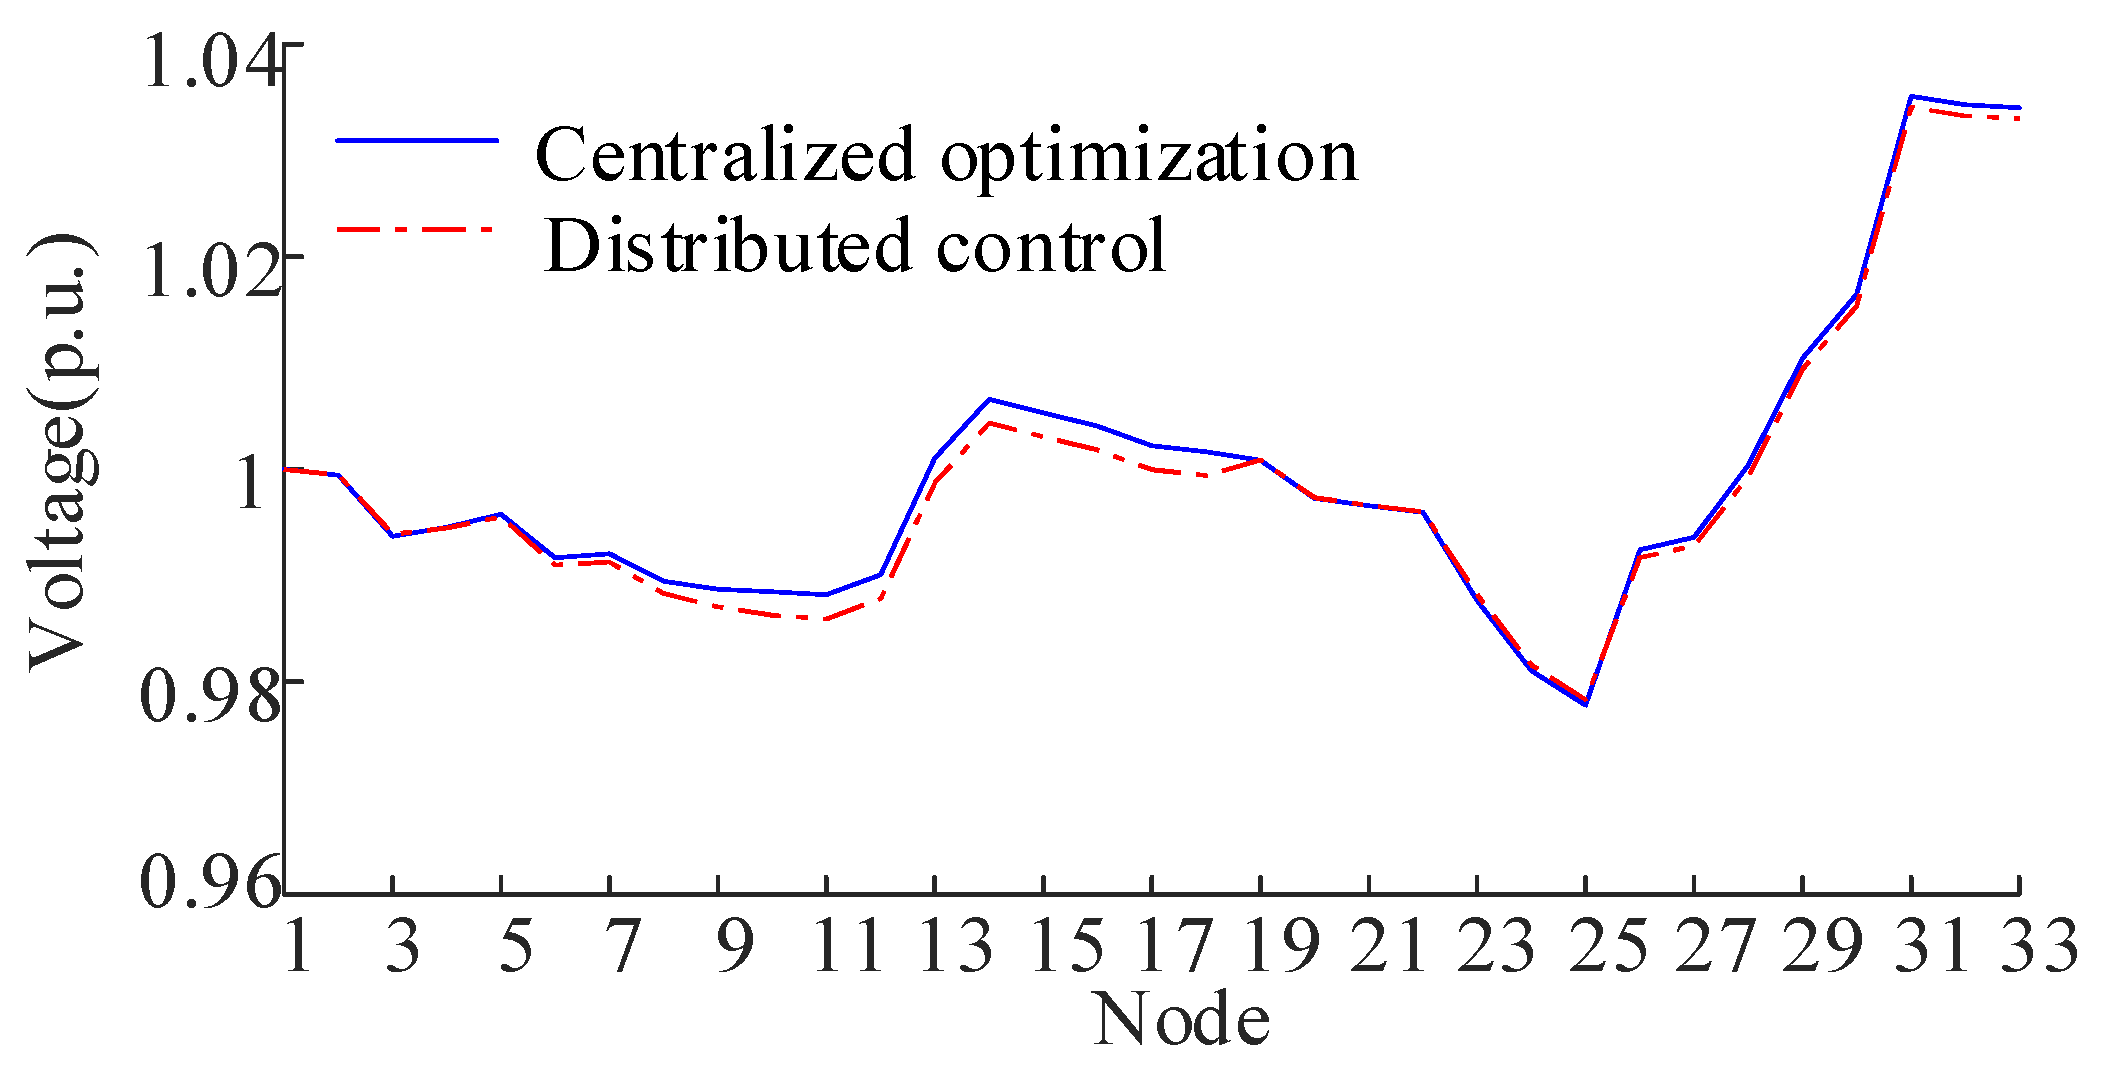
Figure 11.
Nodal voltage of IEEE33 under distributed control and centralized optimization.
Figure 11.
Nodal voltage of IEEE33 under distributed control and centralized optimization.
Figure 12.
Nodal voltage before and after control in the case considering line impedance variation.
Figure 12.
Nodal voltage before and after control in the case considering line impedance variation.
Figure 13.
Diagram of communication failure in distributed control.
Figure 13.
Diagram of communication failure in distributed control.
Figure 14.
Nodal voltage variation at PV buses under communication failure.
Figure 14.
Nodal voltage variation at PV buses under communication failure.
Figure 15.
ESS discharging powers under communication failure.
Figure 15.
ESS discharging powers under communication failure.
Figure 16.
Diagram of communication failure in centralized control.
Figure 16.
Diagram of communication failure in centralized control.
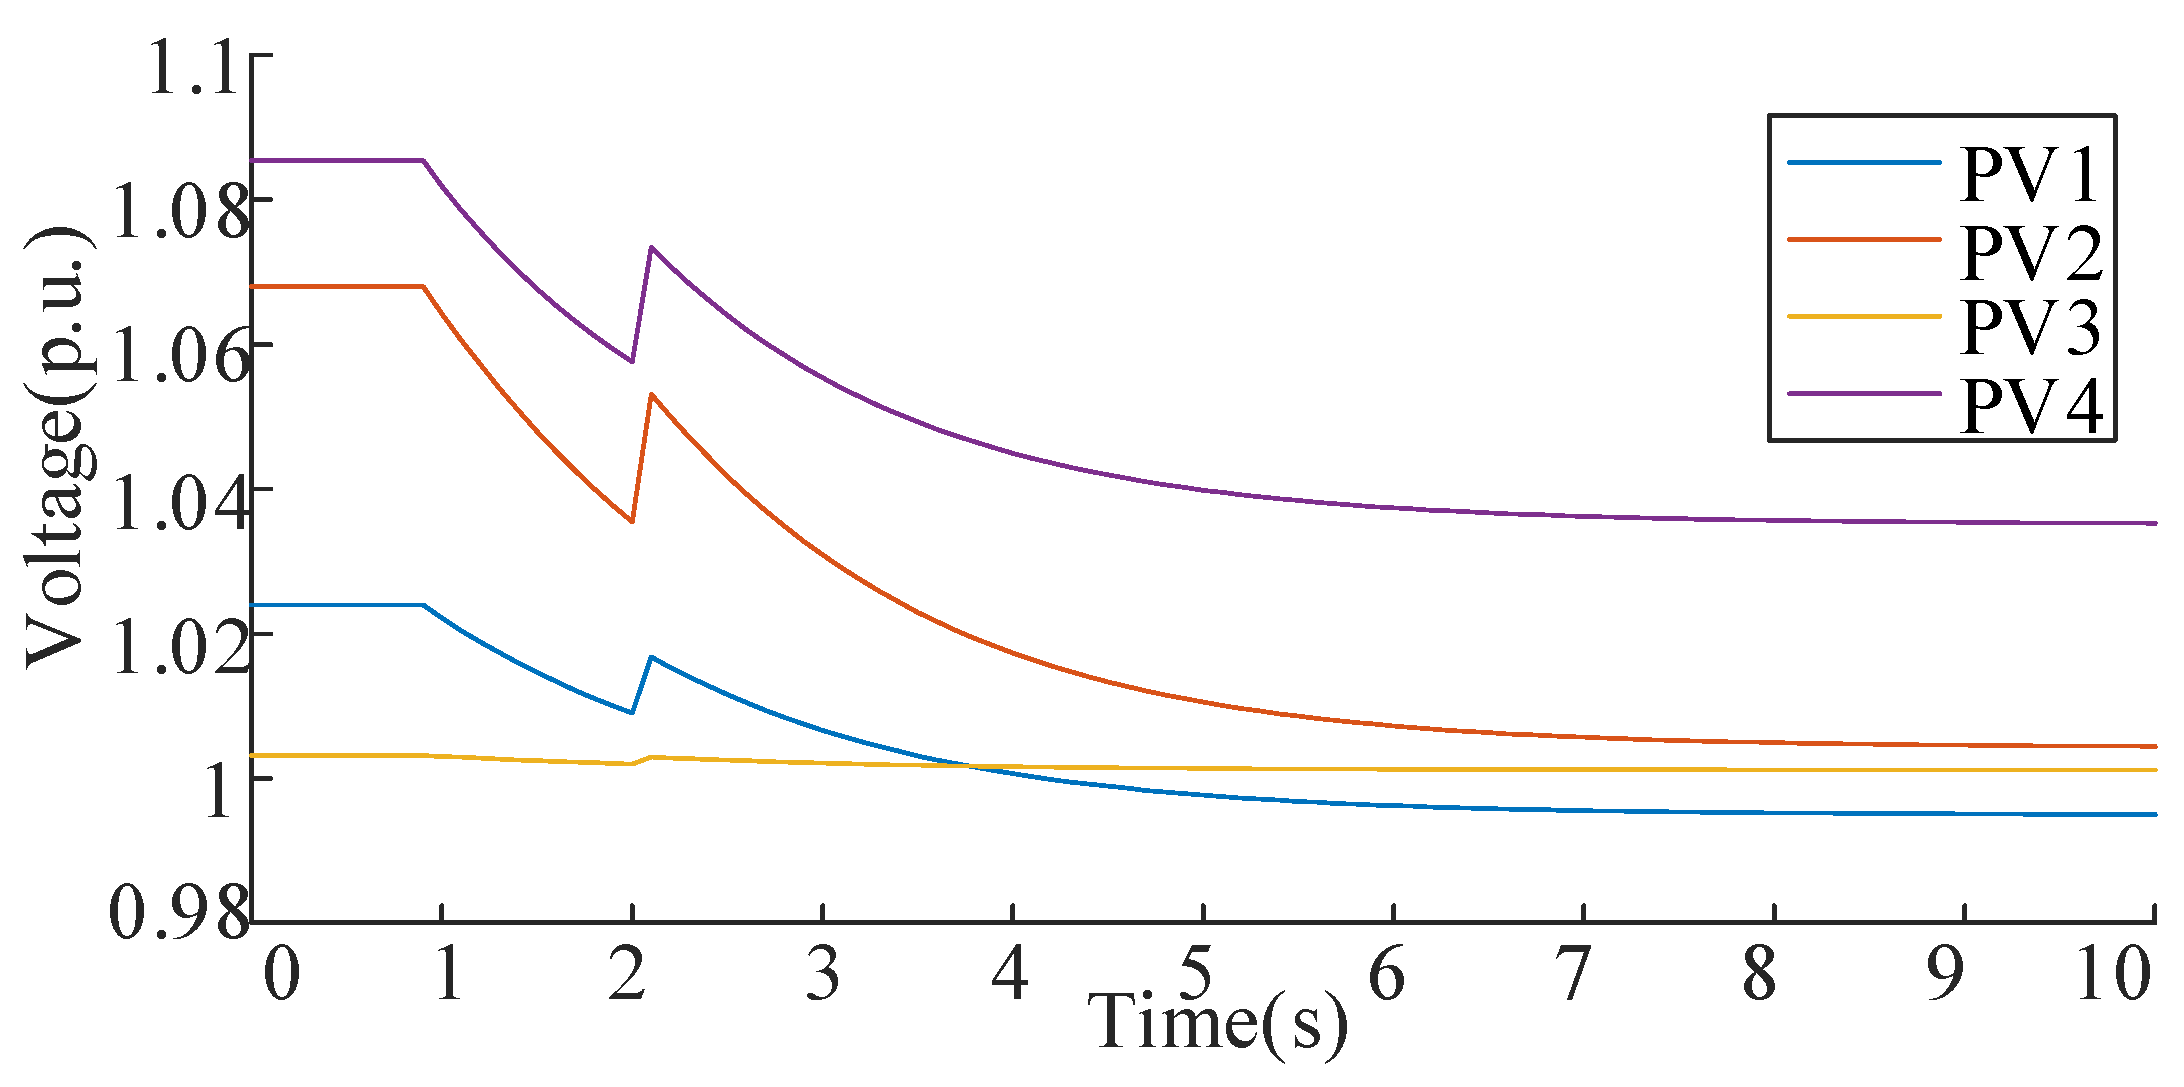
Figure 17.
Nodal voltage variation at PV buses of IEEE33 in disturbance conditions.
Figure 17.
Nodal voltage variation at PV buses of IEEE33 in disturbance conditions.
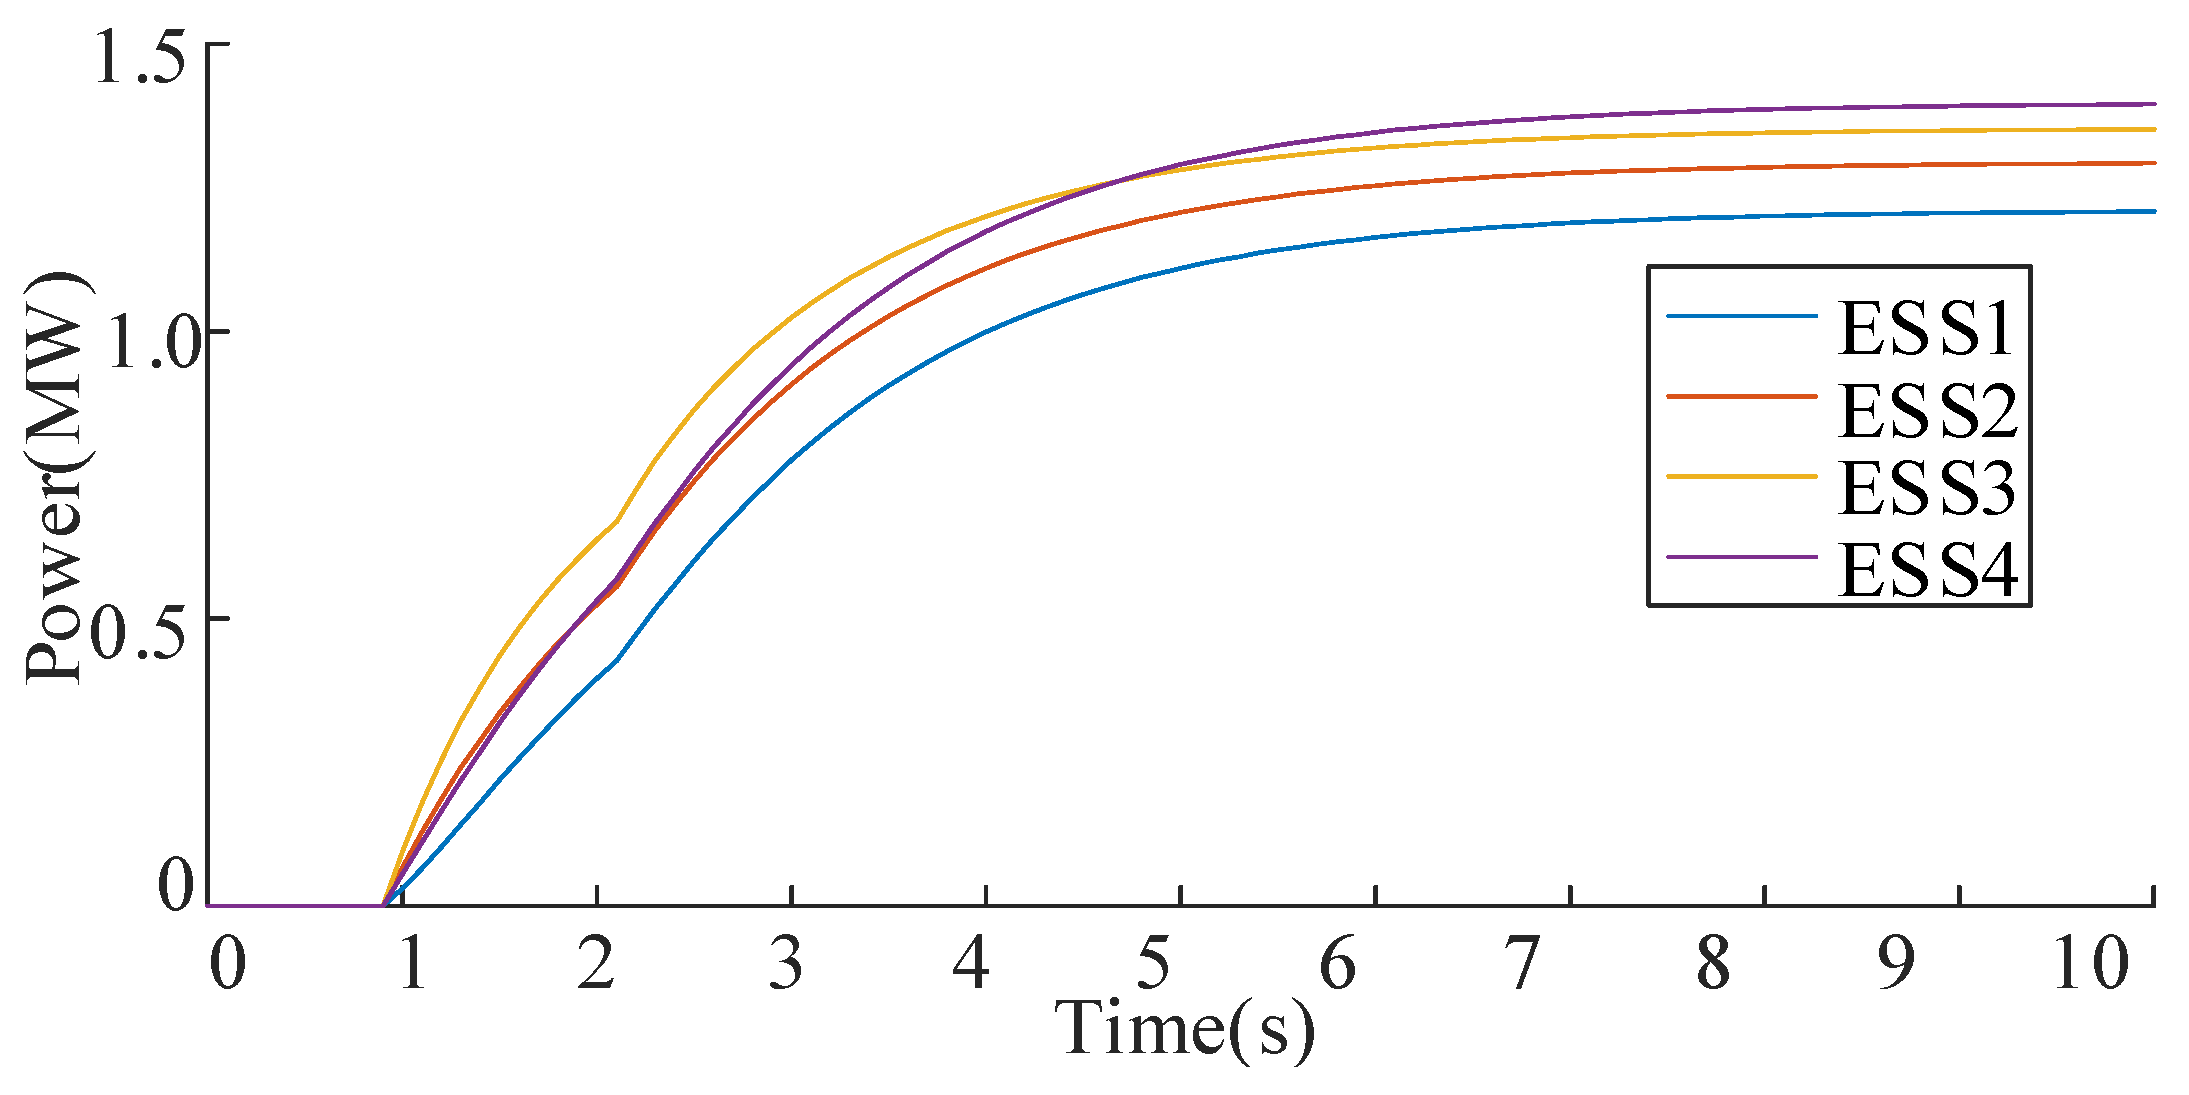
Figure 18.
ESS output powers of IEEE33 bus system in disturbance conditions.
Figure 18.
ESS output powers of IEEE33 bus system in disturbance conditions.
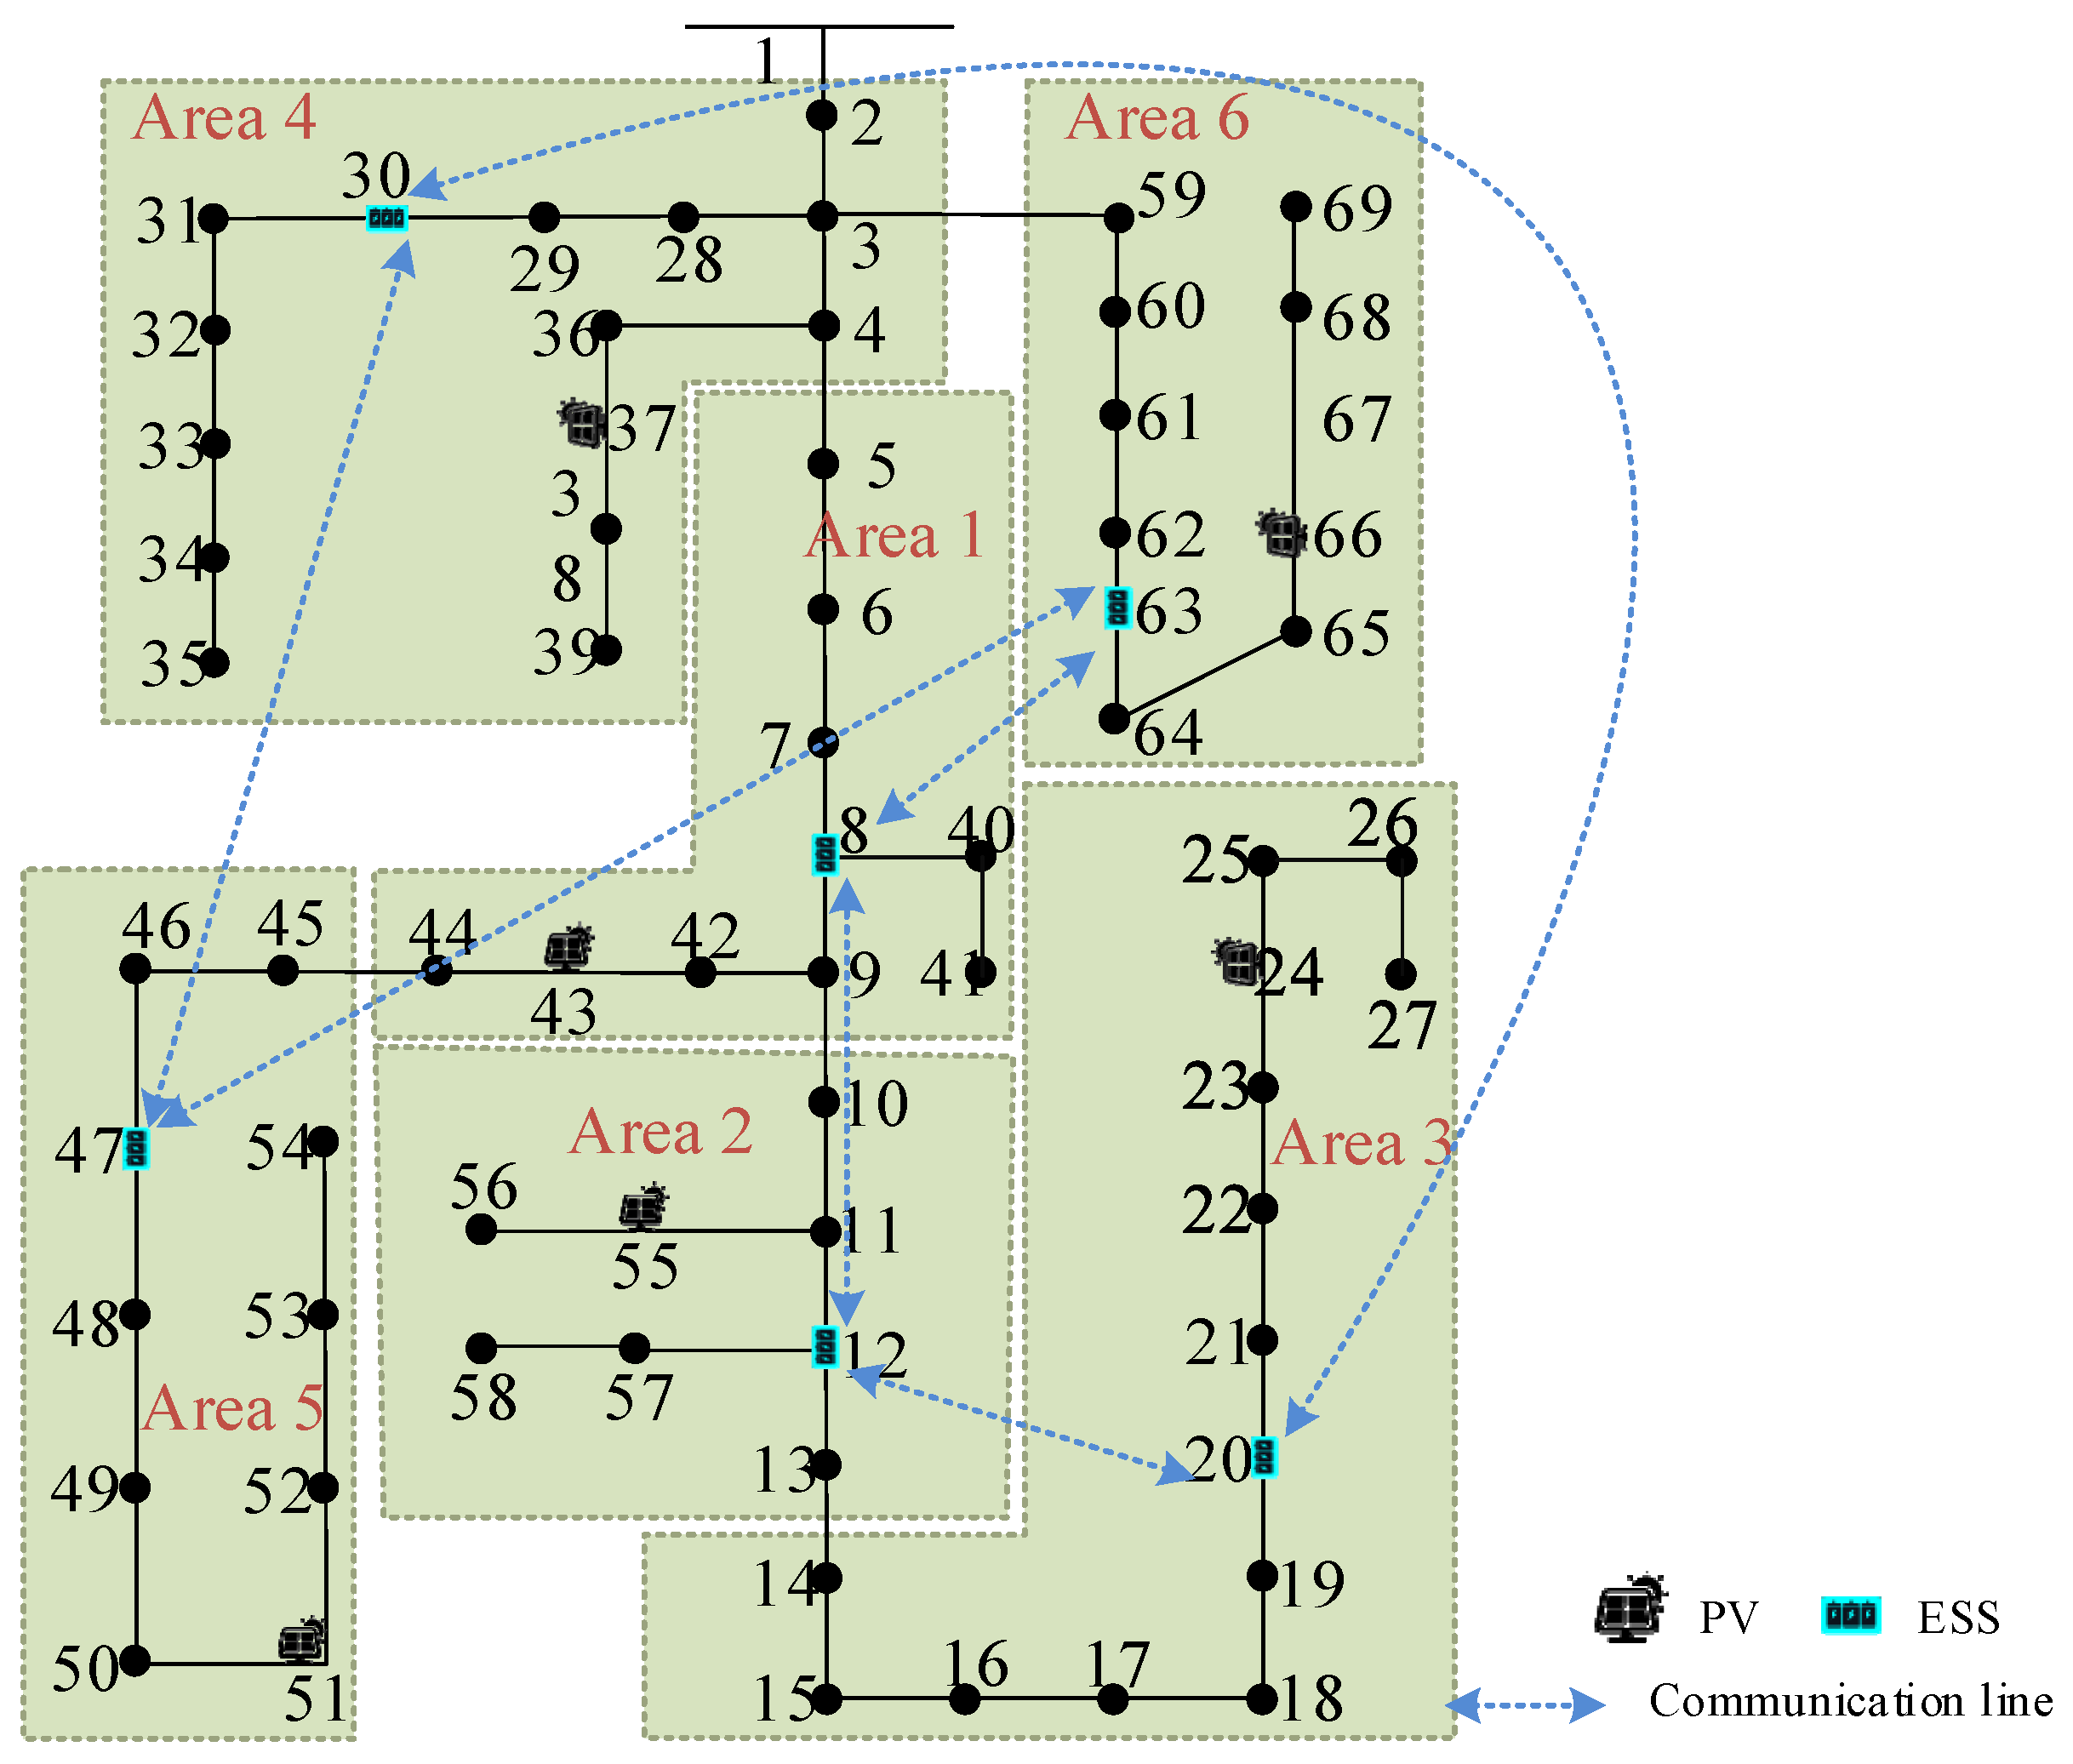
Figure 19.
Cluster division results of IEEE69 bus system.
Figure 19.
Cluster division results of IEEE69 bus system.
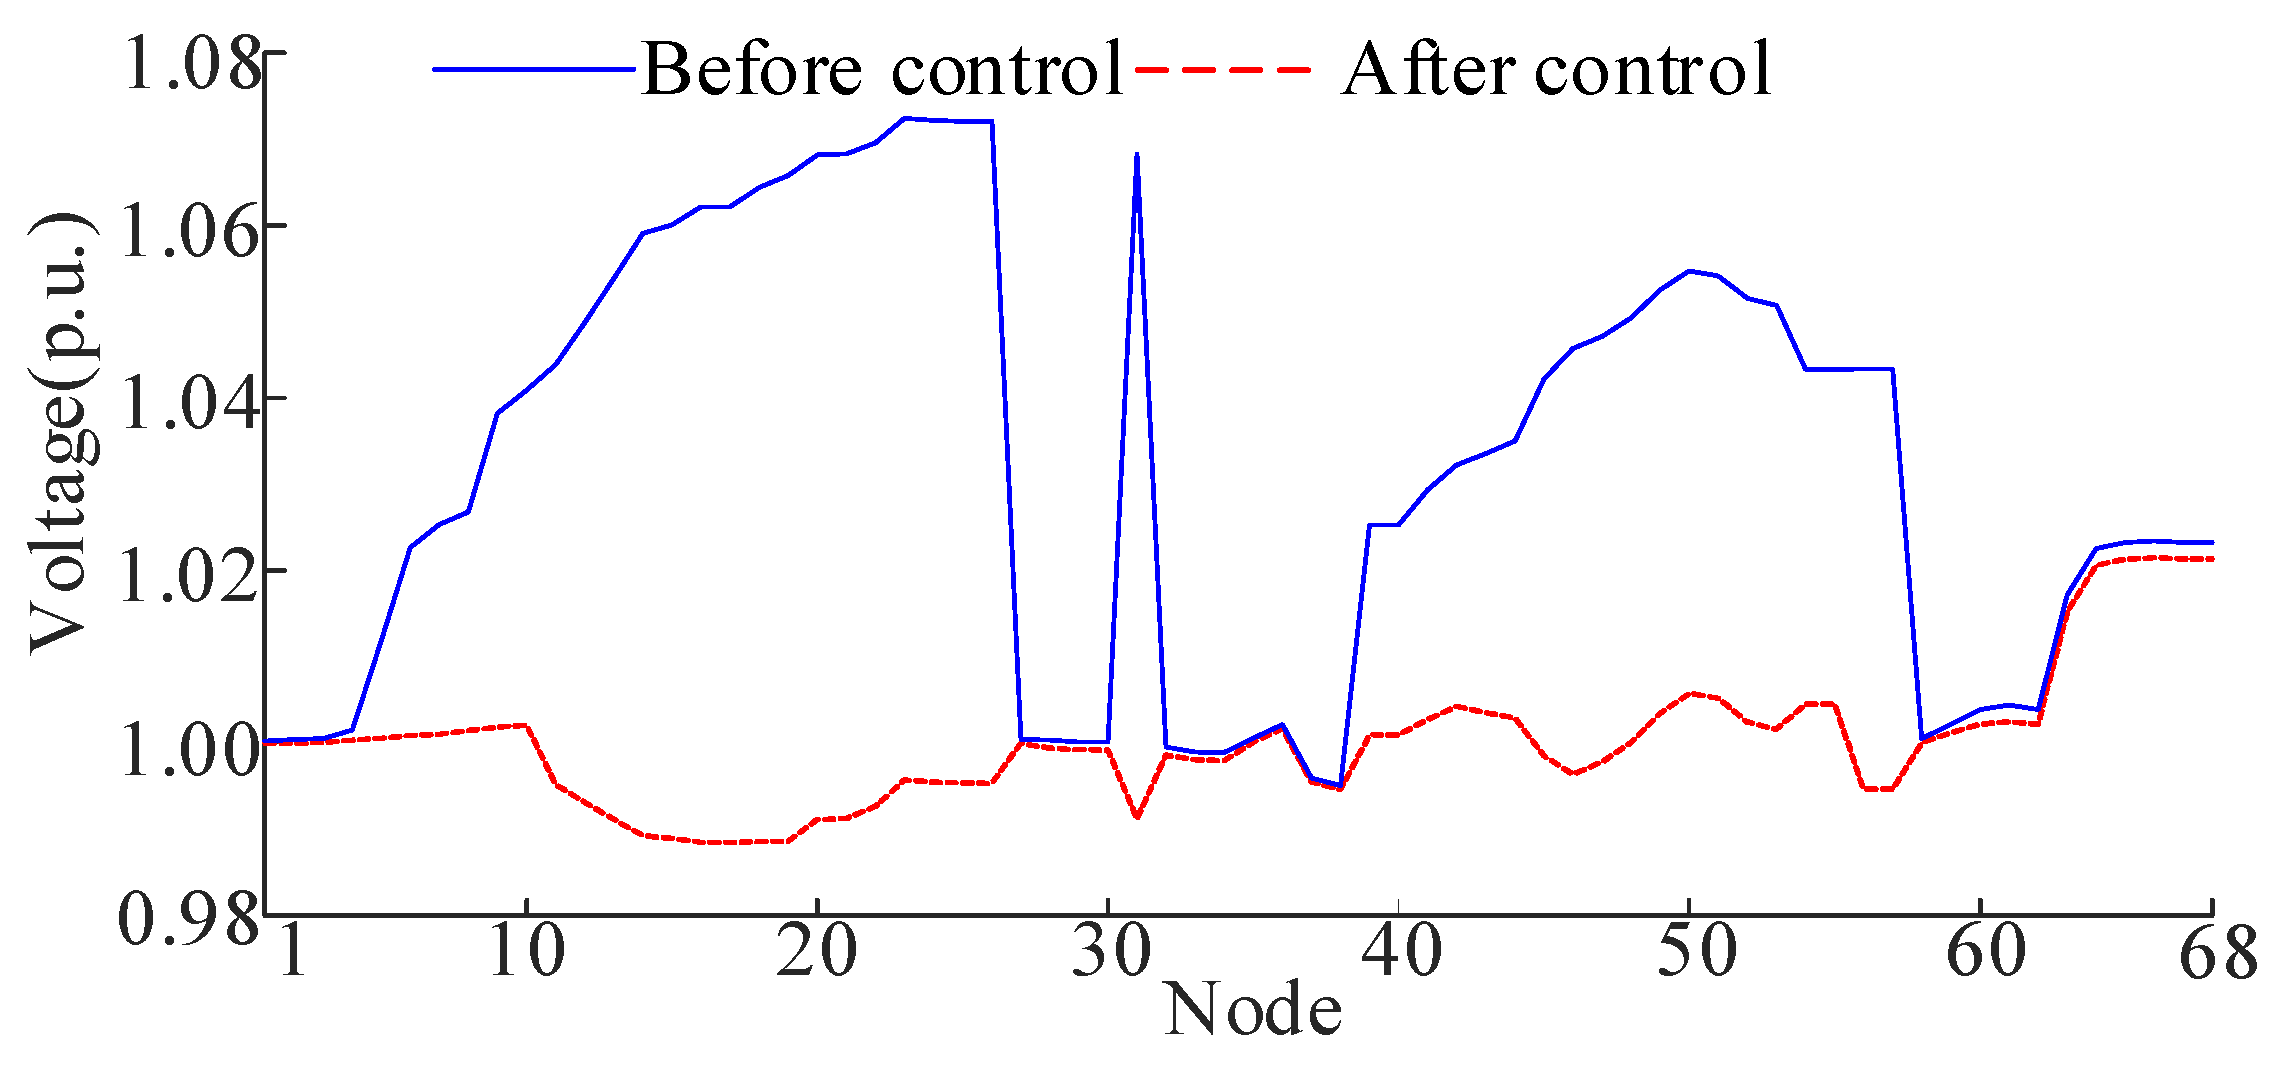
Figure 20.
Nodal voltage of IEEE69 before and after control.
Figure 20.
Nodal voltage of IEEE69 before and after control.
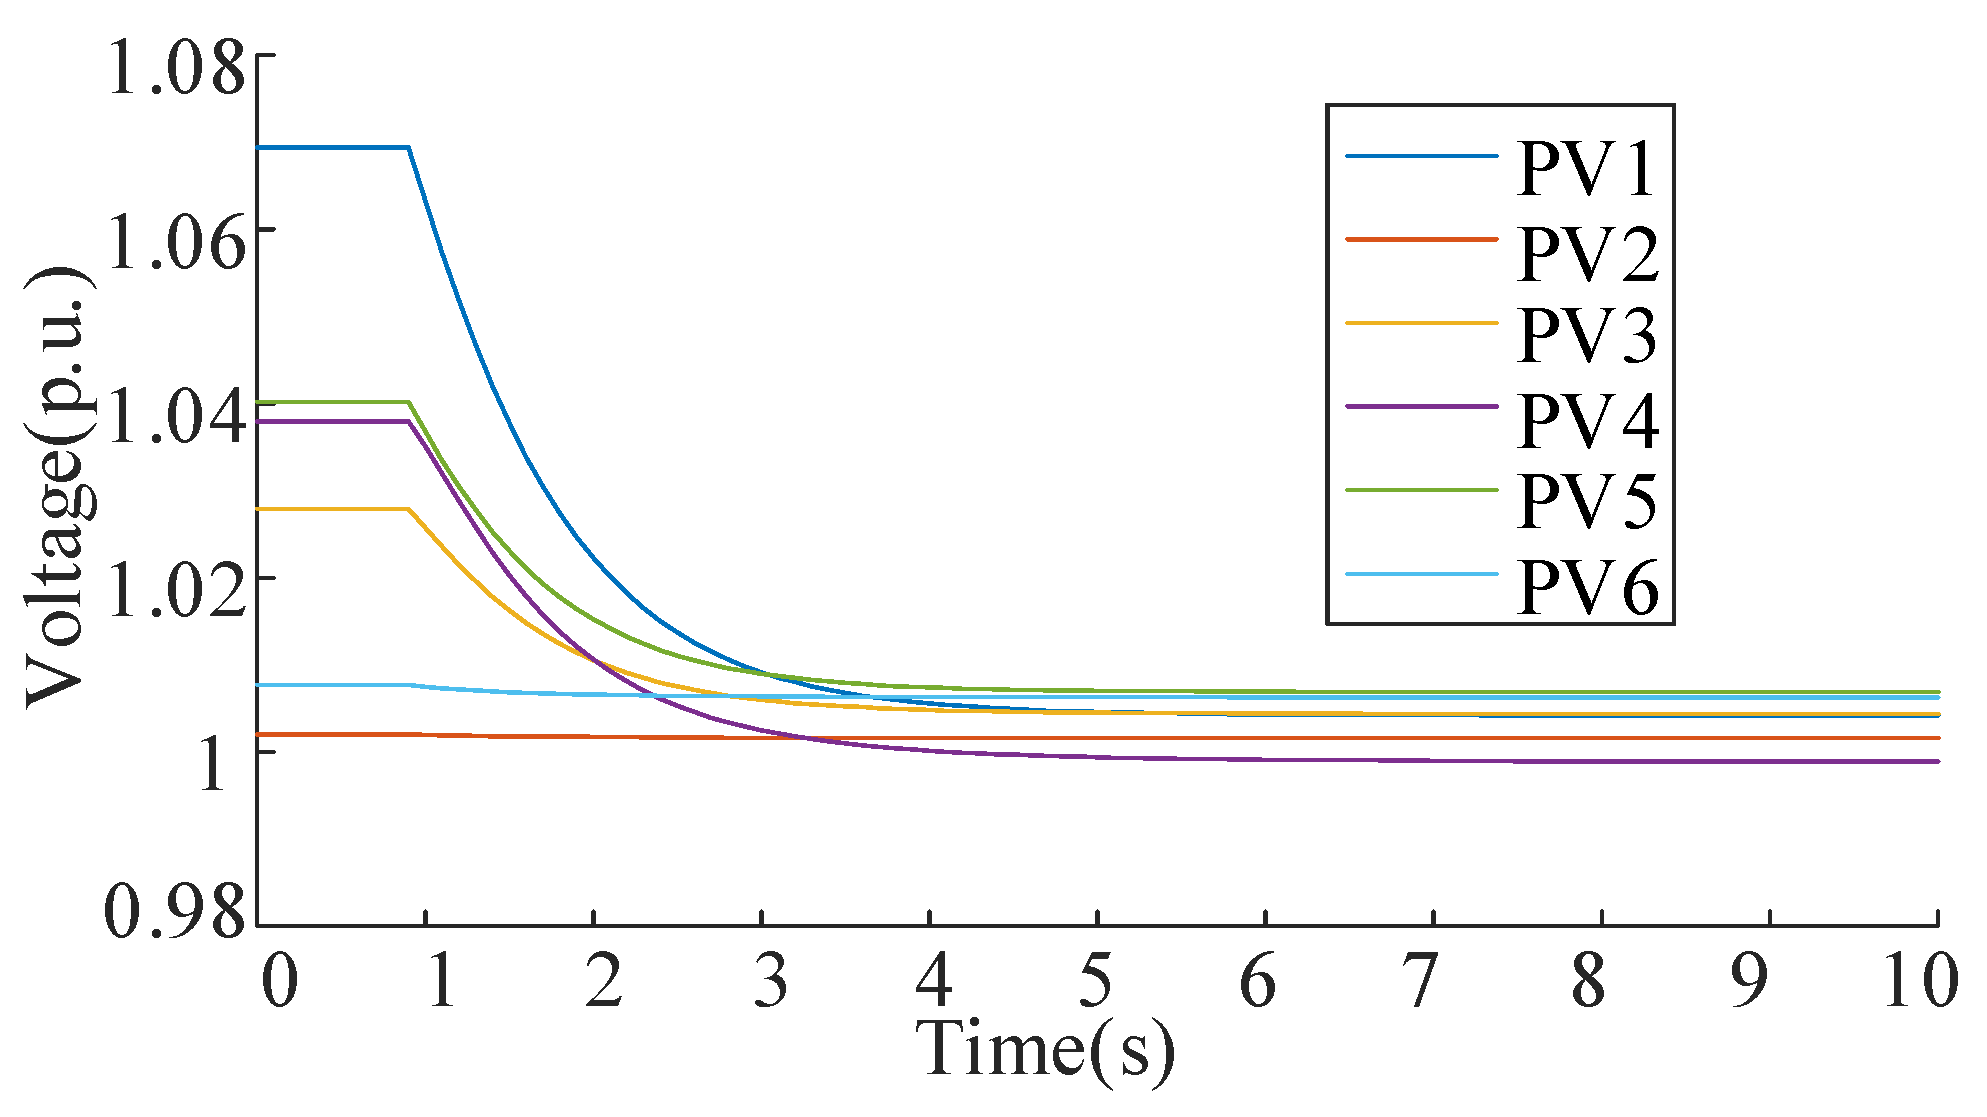
Figure 21.
Nodal voltage variation of IEEE69 bus system during the control process.
Figure 21.
Nodal voltage variation of IEEE69 bus system during the control process.
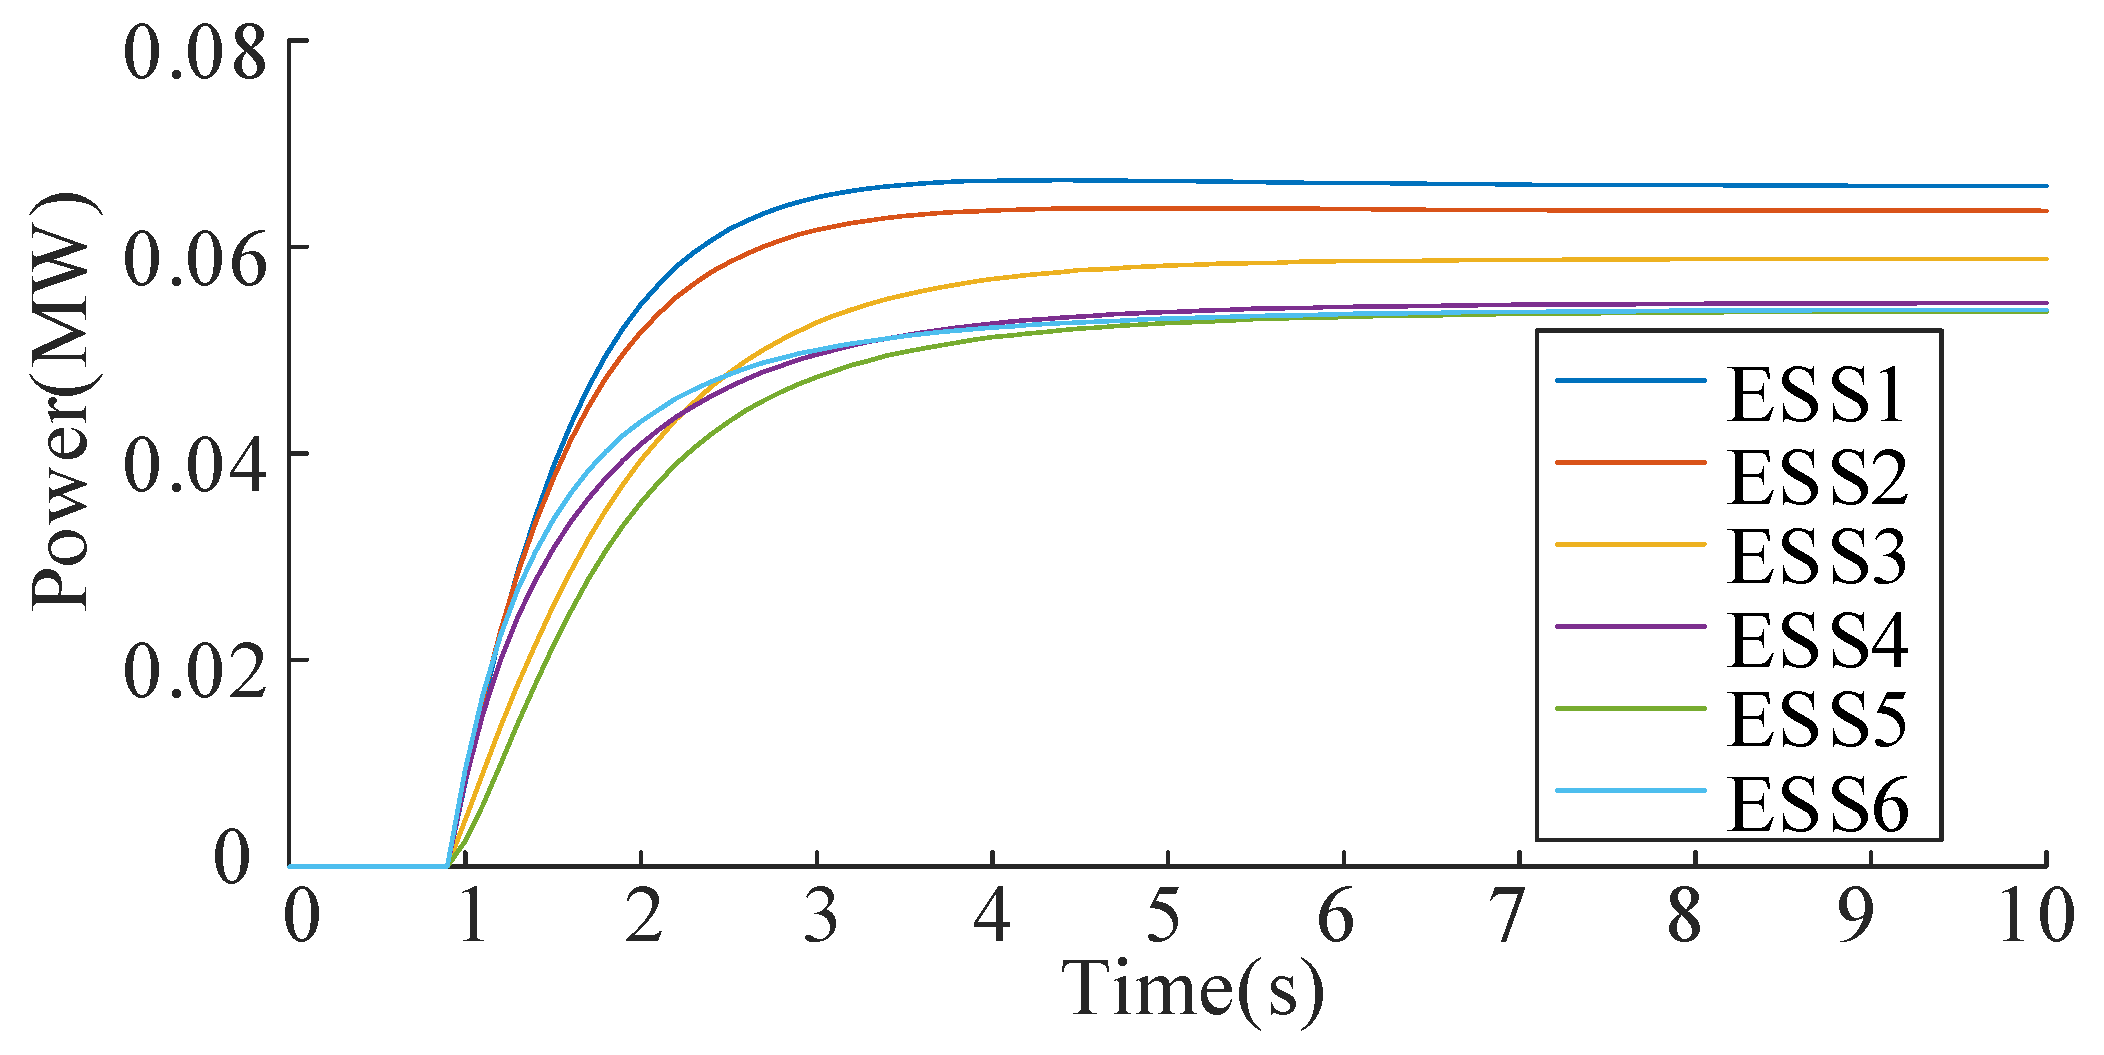
Figure 22.
ESS discharging powers of IEEE69 bus system during the control process.
Figure 22.
ESS discharging powers of IEEE69 bus system during the control process.
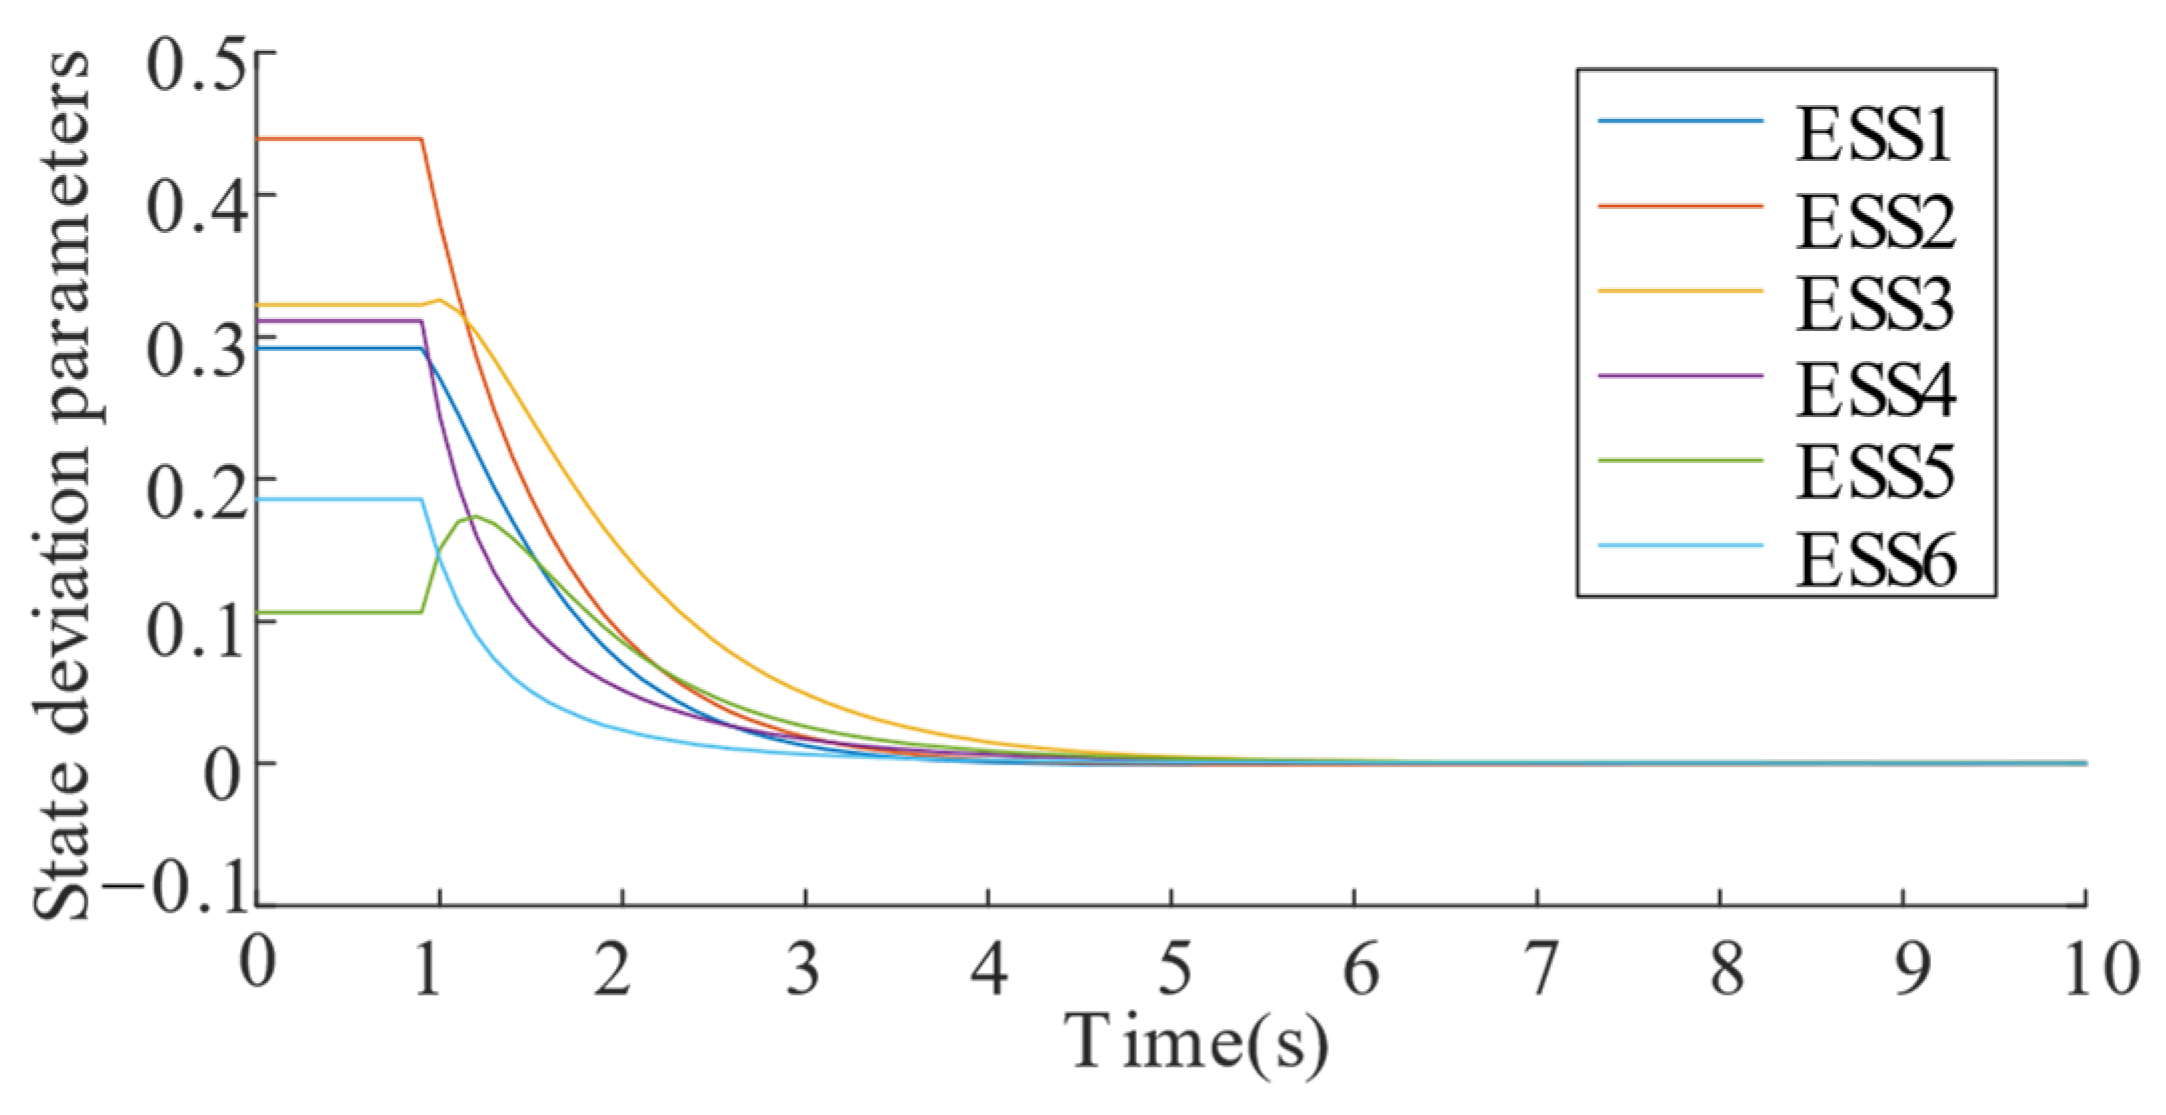
Figure 23.
ESS state deviation parameters of IEEE69 during the control process.
Figure 23.
ESS state deviation parameters of IEEE69 during the control process.
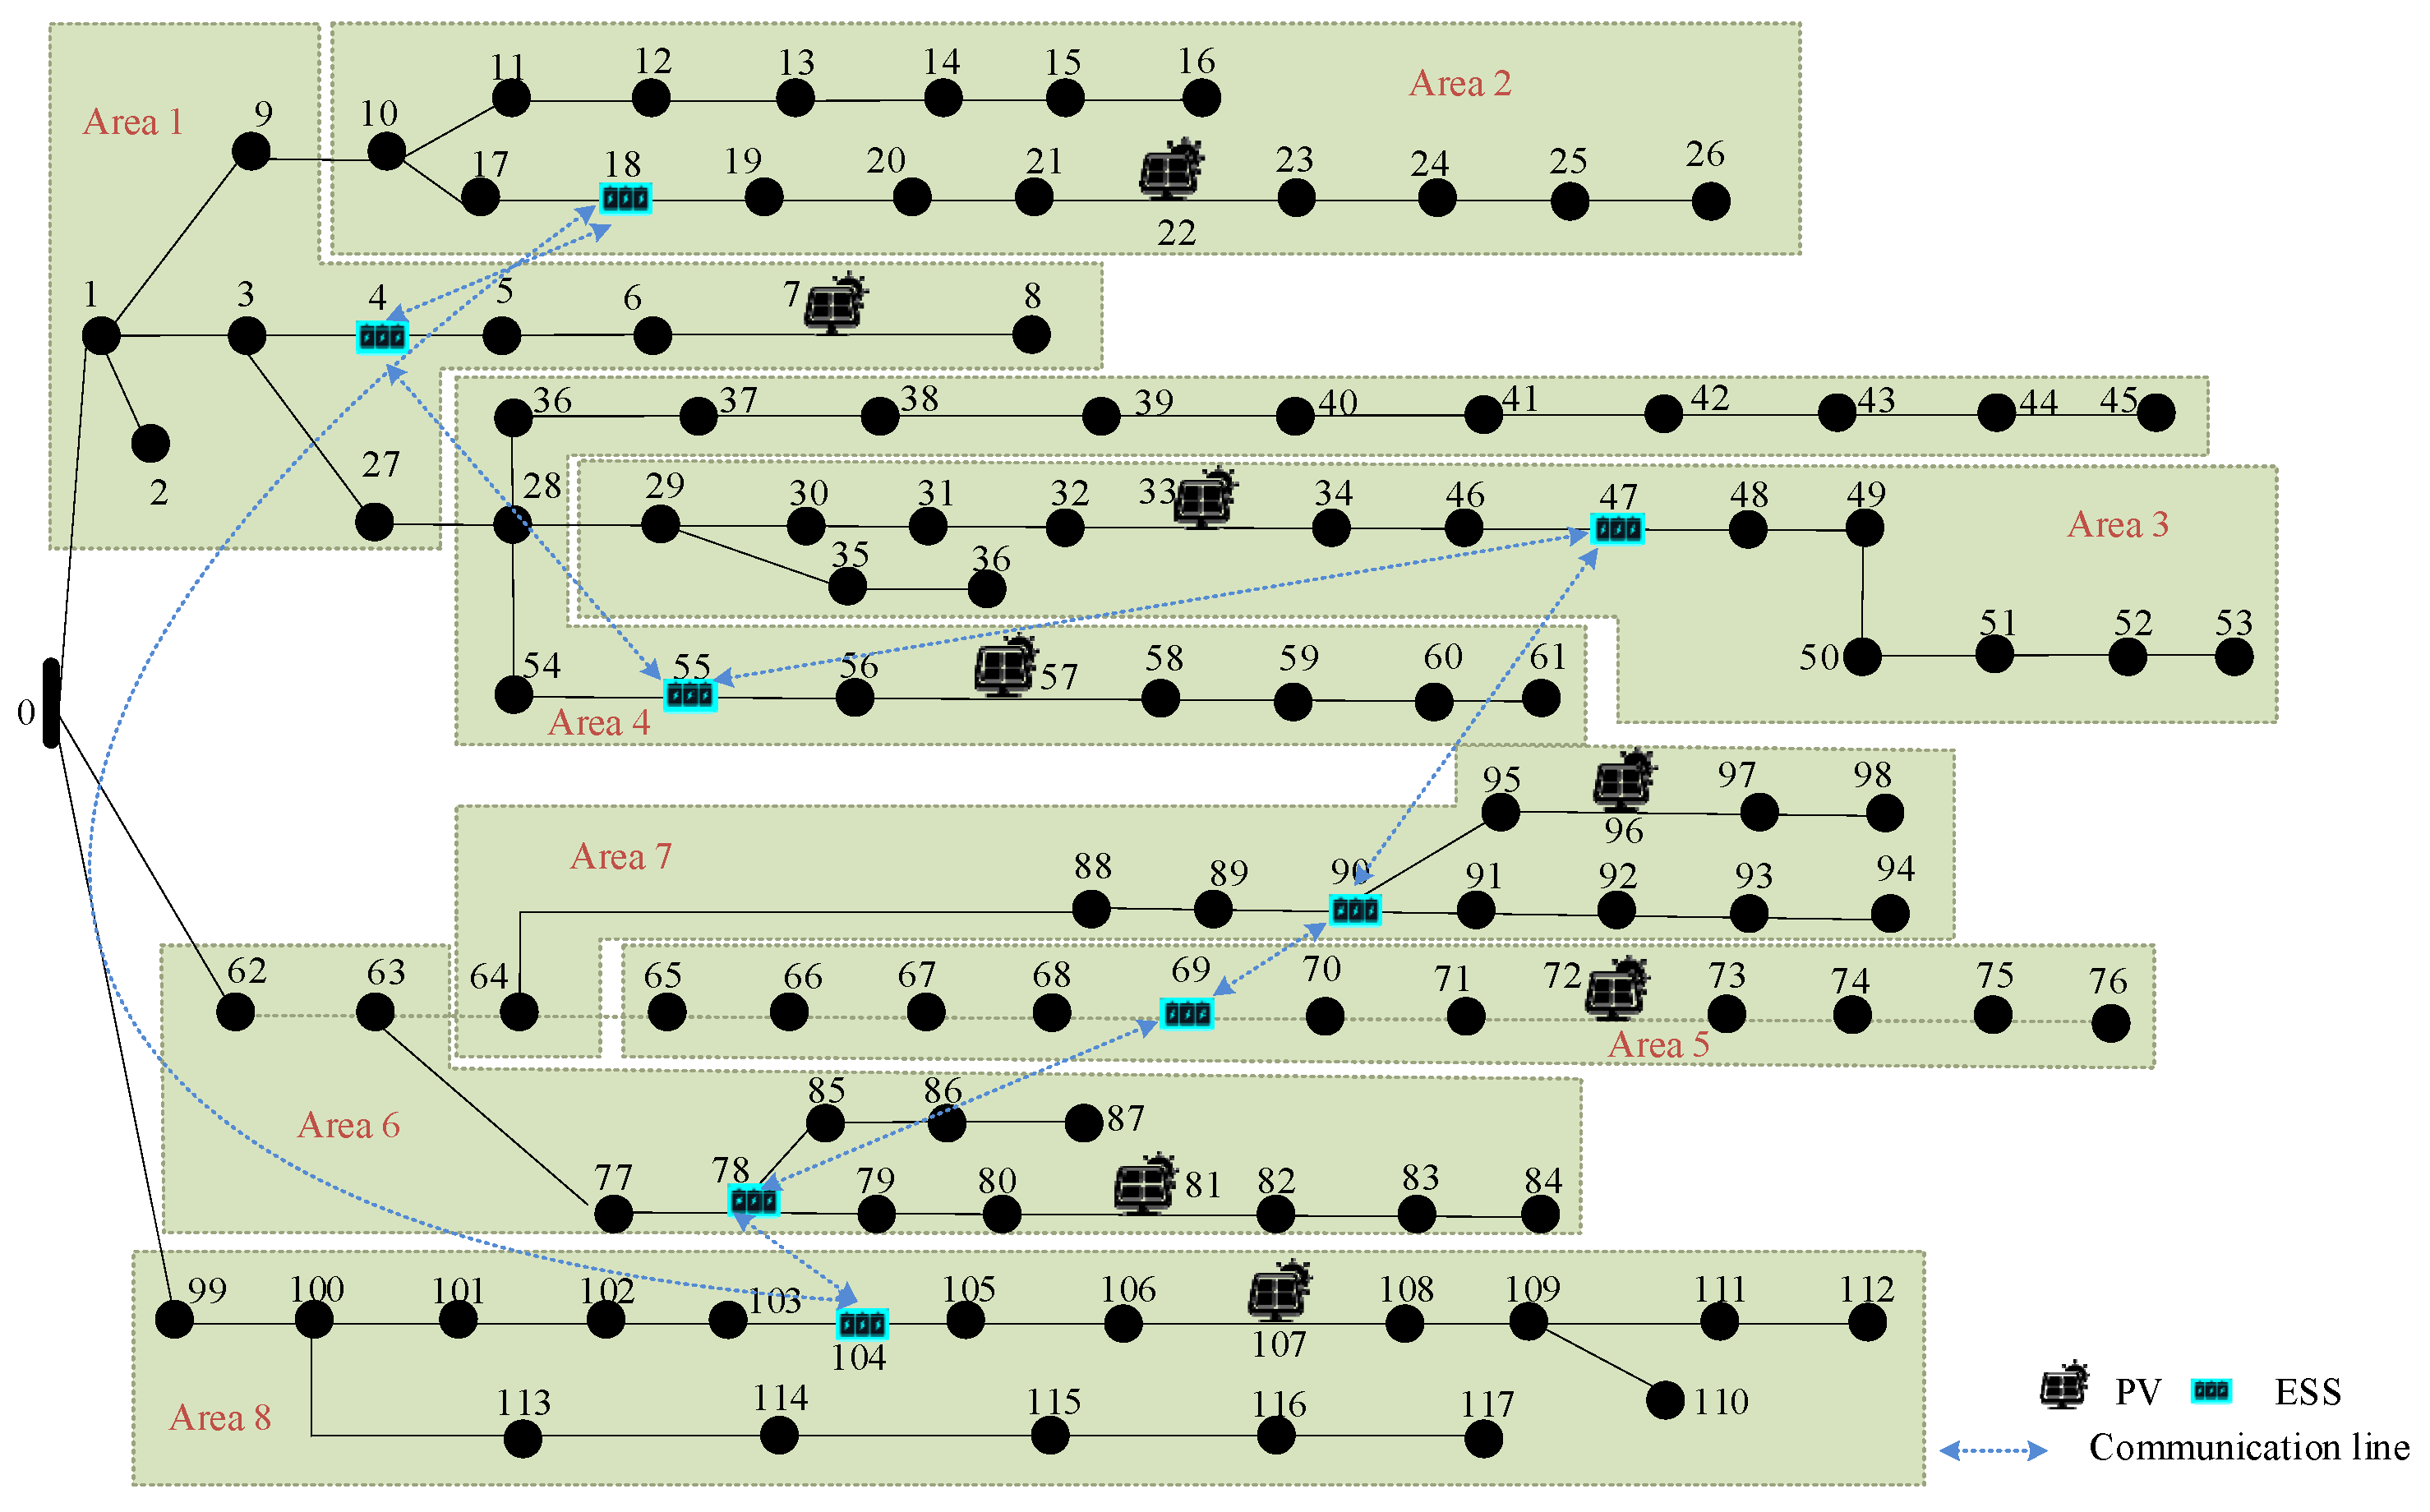
Figure 24.
Cluster division results of IEEE118 bus system.
Figure 24.
Cluster division results of IEEE118 bus system.
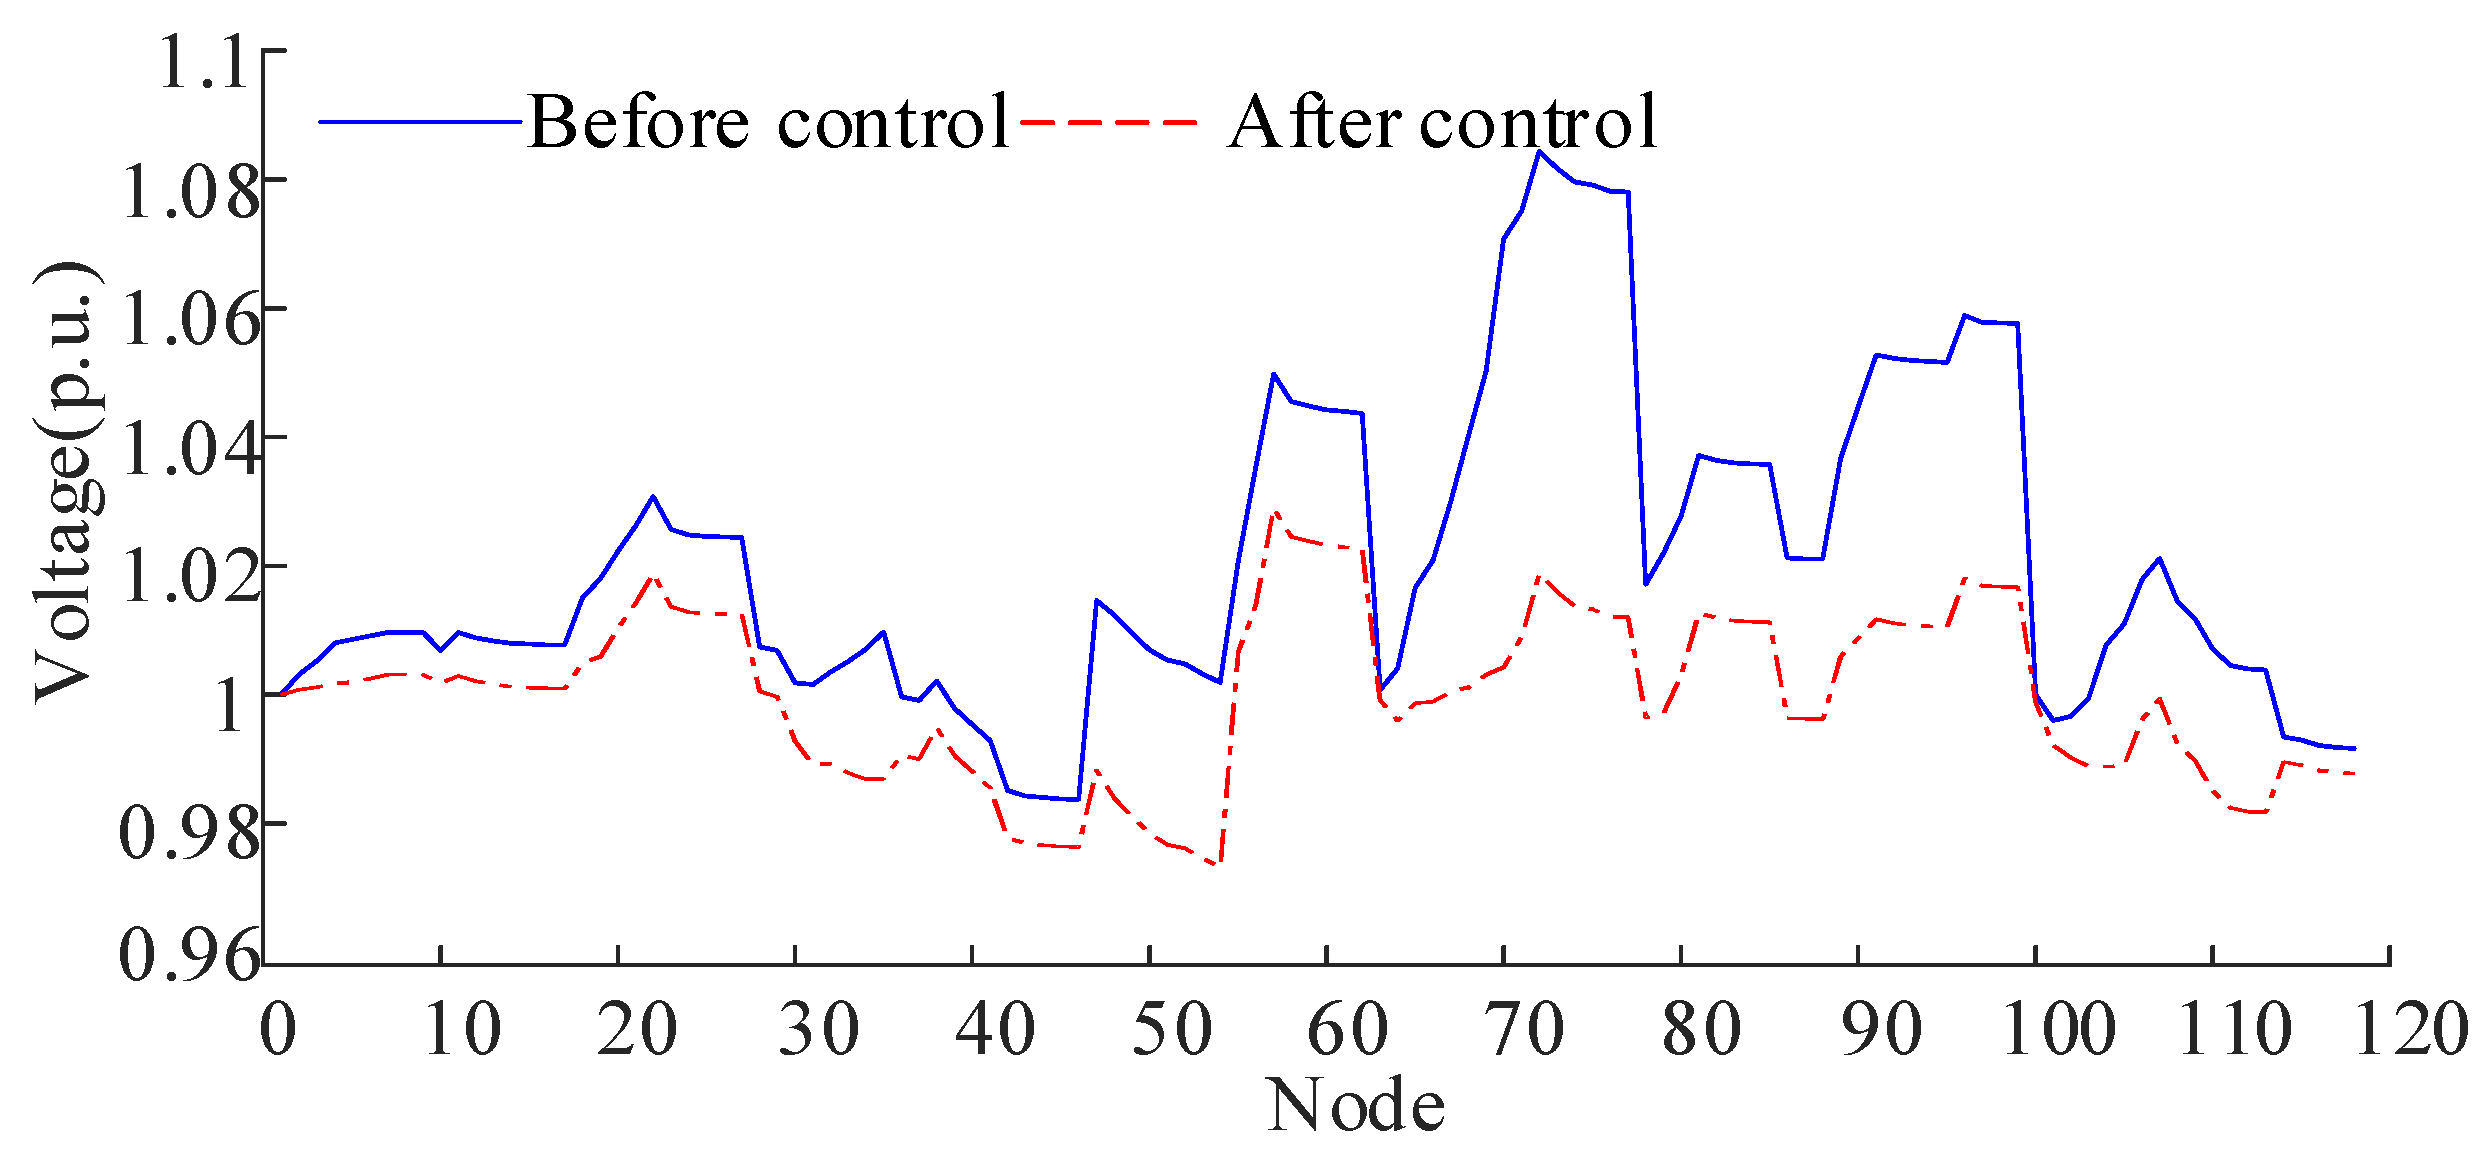
Figure 25.
Nodal voltage of IEEE118 before and after control.
Figure 25.
Nodal voltage of IEEE118 before and after control.
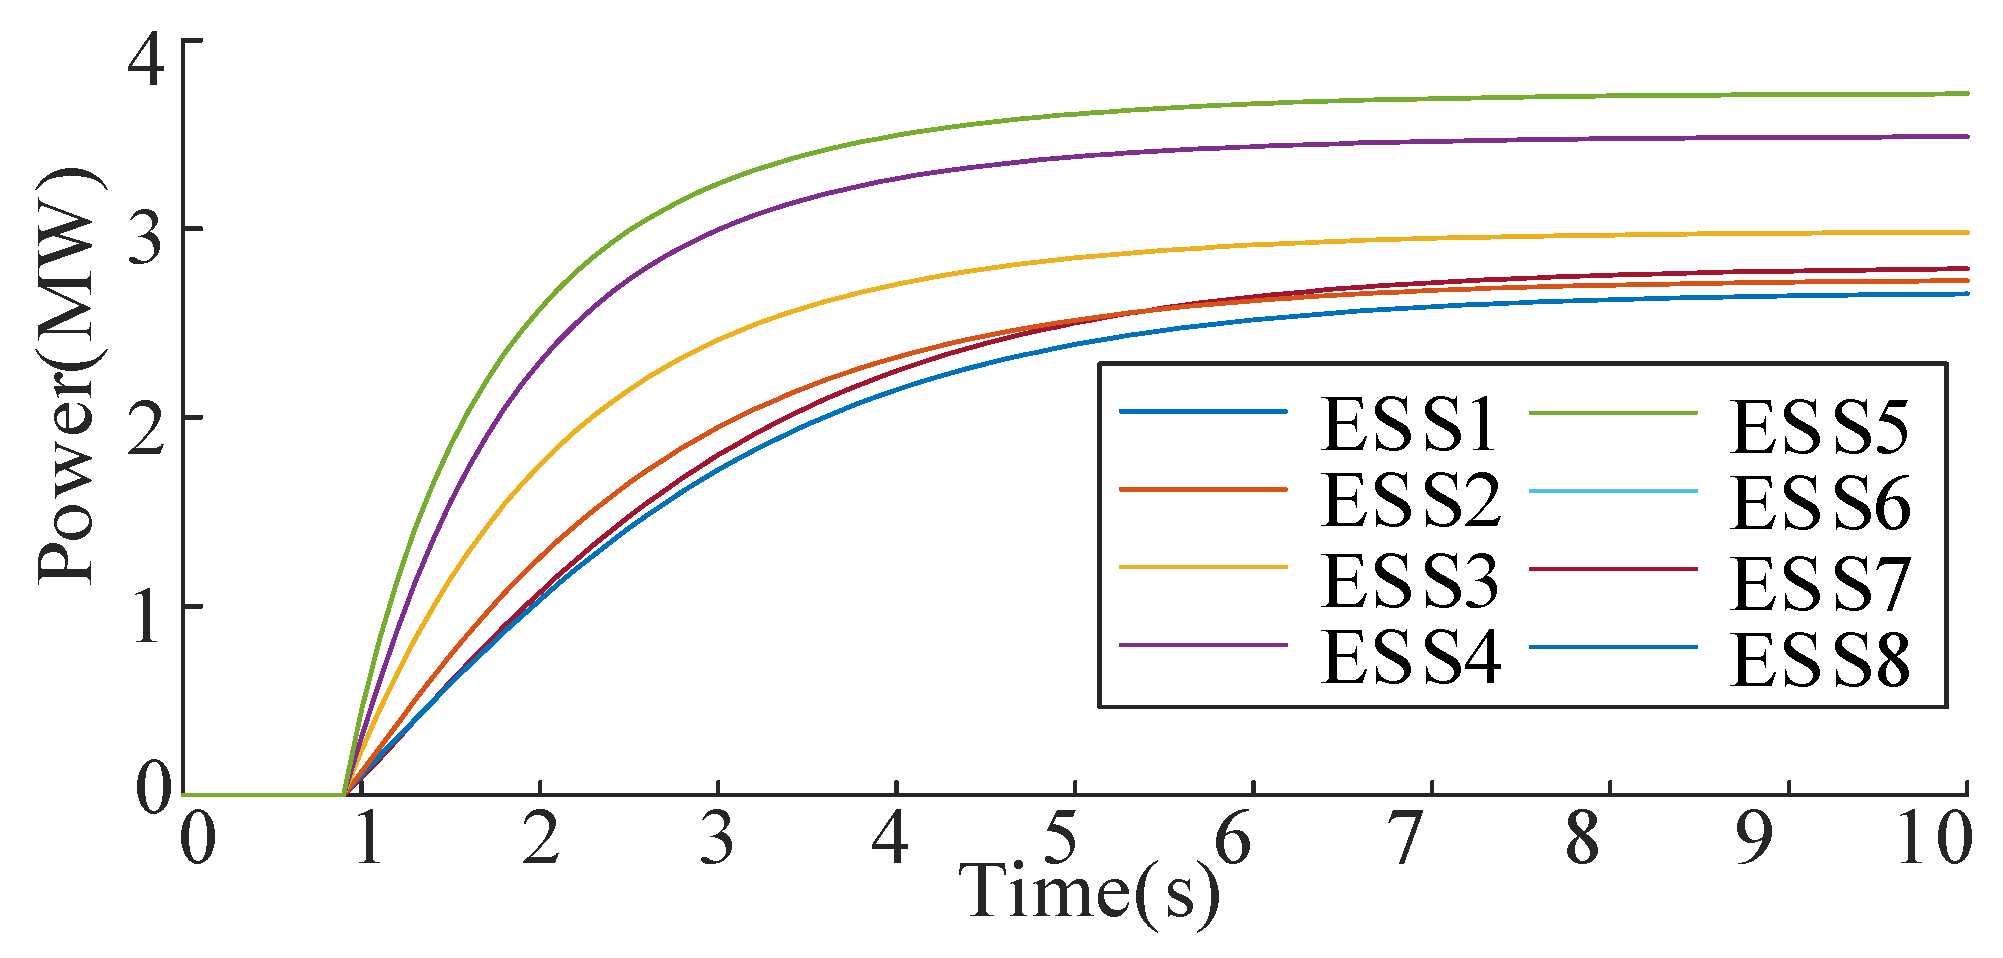
Figure 26.
ESS discharging powers of IEEE118 bus system during the control process.
Figure 26.
ESS discharging powers of IEEE118 bus system during the control process.
Figure 27.
Nodal voltage variation of IEEE118 bus system during the control process.
Figure 27.
Nodal voltage variation of IEEE118 bus system during the control process.
Table 1.
ESS control gains.
Table 1.
ESS control gains.
| ESS1 | ESS2 | ESS3 | ESS4 |
|---|
| −0.0185 | −0.0195 | −0.0161 | −0.0144 |
Table 2.
ESS power rates after control.
Table 2.
ESS power rates after control.
| ESS1 | ESS2 | ESS3 | ESS4 |
|---|
| 0.7734 | 0.8232 | 0.8522 | 0.8310 |
Table 3.
Convergence speed of the gradient method under different step sizes.
Table 3.
Convergence speed of the gradient method under different step sizes.
| Control gain | −0.1 × D | −0.01 × D | −0.002 × D | −0.001 × D |
| Convergence cycles | Unstable | Unstable | 54 | 112 |
Table 4.
ESS power rates after control in the case considering line impedance variation.
Table 4.
ESS power rates after control in the case considering line impedance variation.
| ESS1 | ESS2 | ESS3 | ESS4 |
|---|
| 0.7535 | 0.8126 | 0.8474 | 0.8223 |
Table 5.
PV voltage comparisons.
Table 5.
PV voltage comparisons.
| PV | PV1 | PV2 | PV3 | PV4 |
|---|
| Normal | 0.9963 | 1.0076 | 1.0009 | 1.0356 |
| Communication failure | 0.9953 | 1.0086 | 1.0011 | 1.0418 |
Table 6.
ESS power rate comparisons.
Table 6.
ESS power rate comparisons.
| ESS | ESS1 | ESS2 | ESS3 | ESS4 |
|---|
| Normal | 0.7734 | 0.8232 | 0.8522 | 0.8310 |
| Communication failure | 0.7535 | 0.8126 | 0.8474 | 0.8223 |
Table 7.
PV voltage comparisons under communication failure.
Table 7.
PV voltage comparisons under communication failure.
| PV | PV1 | PV2 | PV3 | PV4 |
|---|
| Communication failure under distributed control | 0.9953 | 1.0086 | 1.0011 | 1.0418 |
| Communication failure under centralized control | 1.0048 | 1.0404 | 1.0014 | 1.0507 |
Table 8.
ESS power rate comparisons under communication failure.
Table 8.
ESS power rate comparisons under communication failure.
| ESS | ESS1 | ESS2 | ESS3 | ESS4 |
|---|
| Communication failure under distributed control | 0.7535 | 0.8126 | 0.8474 | 0.8223 |
| Communication failure under centralized control | 0.8796 | 0.8892 | 0.6974 | 0 |
Table 9.
PV voltage comparisons under different weight coefficients.
Table 9.
PV voltage comparisons under different weight coefficients.
| | PV1 | PV2 | PV3 | PV4 |
|---|
| c = 0 | 0.9963 p.u. | 1.0076 p.u. | 1.0009 p.u. | 1.0356 p.u. |
| c = 1 | 0.9958 p.u. | 1.0070 p.u. | 1.0009 p.u. | 1.0345 p.u. |
| c = 5 | 0.9955 p.u. | 1.0082 p.u. | 1.0009 p.u. | 1.0333 p.u. |
Table 10.
ESS power rate comparisons under different weight coefficients.
Table 10.
ESS power rate comparisons under different weight coefficients.
| | ESS1 | ESS2 | ESS3 | ESS4 |
|---|
| c = 0 | 0.7734 | 0.8232 | 0.8522 | 0.8310 |
| c = 1 | 0.7557 | 0.8440 | 0.8660 | 0.8122 |
| c = 5 | 0.6856 | 0.9261 | 0.9212 | 0.7373 |
Table 11.
ESS control gains in IEEE69 bus system.
Table 11.
ESS control gains in IEEE69 bus system.
| ESS1 | ESS2 | ESS3 | ESS4 | ESS5 | ESS6 |
|---|
| −0.0241 | −0.0224 | −0.0136 | −0.0268 | −0.0232 | −0.0494 |
Table 12.
ESS load rates after control.
Table 12.
ESS load rates after control.
| ESS1 | ESS2 | ESS3 | ESS4 | ESS5 | ESS6 |
|---|
| 0.5494 | 0.5292 | 0.4903 | 0.4548 | 0.4481 | 0.4495 |


