Article

Multi-Objective Optimization of Distributed Generation Placement in Electric Bus Transit Systems Integrated with Flash Charging Station Using Enhanced Multi-Objective Grey Wolf Optimization Technique and Consensus-Based Decision Support

by
Yuttana Kongjeen
1,
Pongsuk Pilalum
1,
Saksit Deeum
2,
Kittiwong Suthamno
1,
Thongchai Klayklueng
1,
Supapradit Marsong
2,
Ritthichai Ratchapan
2,
Krittidet Buayai
1,
Kaan Kerdchuen
1,
Wutthichai Sa-nga-ngam
1,* and
Krischonme Bhumkittipich
2,*
1
Intelligent Power System and Energy Research (IPER), Department of Electrical Engineering, Faculty of Engineering and Technology, Rajamangala University of Technology Isan, Nakhon Ratchasima 30000, Thailand
2
Department of Electrical Engineering, Faculty of Engineering, Rajamangala University of Technology Thanyaburi (RMUTT), Pathum Thani 12110, Thailand
*
Authors to whom correspondence should be addressed.
Energies 2025, 18(14), 3638; https://doi.org/10.3390/en18143638
Submission received: 30 May 2025 / Revised: 23 June 2025 / Accepted: 7 July 2025 / Published: 9 July 2025

Abstract

This study presents a comprehensive multi-objective optimization framework for optimal placement and sizing of distributed generation (DG) units in electric bus (E-bus) transit systems integrated with a high-power flash charging infrastructure. An enhanced Multi-Objective Grey Wolf Optimizer (MOGWO), utilizing Euclidean distance-based Pareto ranking, is developed to minimize power loss, voltage deviation, and voltage violations. The framework incorporates realistic E-bus operation characteristics, including a 31-stop, 62 km route, 600 kW pantograph flash chargers, and dynamic load profiles over a 90 min simulation period. Statistical evaluation on IEEE 33-bus and 69-bus distribution networks demonstrates that MOGWO consistently outperforms MOPSO and NSGA-II across all DG deployment scenarios. In the three-DG configuration, MOGWO achieved minimum power losses of 0.0279 MW and 0.0179 MW, and voltage deviations of 0.1313 and 0.1362 in the 33-bus and 69-bus systems, respectively, while eliminating voltage violations. The proposed method also demonstrated superior solution quality with low variance and faster convergence, requiring under 7 h of computation on average. A five-method compromise solution strategy, including TOPSIS and Lp-metric, enabled transparent and robust decision-making. The findings confirm the proposed framework’s effectiveness and scalability for enhancing distribution system performance under the demands of electric transit electrification and smart grid integration.

1. Introduction

The global transition toward sustainable transportation systems has accelerated the adoption of electric buses (E-buses) as a key component of urban mobility infrastructure. According to the International Energy Agency, the global electric bus fleet exceeded 670,000 units in 2022, with projections indicating continued exponential growth [1]. This rapid deployment of electric transit systems introduces unique challenges to distribution networks, particularly regarding power quality, system reliability, and operational efficiency. The integration of high-power flash charging stations, which can demand up to 600 kW per charging event, creates significant loading variations that conventional distribution systems were not originally designed to accommodate [2,3,4].

1.1. Background and Motivation

Electric bus transit systems present a paradigm shift in distribution network planning and operation. Unlike traditional residential or commercial loads, E-bus charging infrastructure exhibits distinct characteristics: (i) high instantaneous power demands during flash charging events, (ii) predictable spatiotemporal loading patterns following fixed transit routes, (iii) concentrated charging locations at strategic stops along bus corridors, and (iv) synchronized charging events that can create severe demand peaks [5,6,7]. These characteristics necessitate innovative approaches to maintain power quality while ensuring reliable service to both transit operations and conventional customers.
The deployment of distributed generation (DG) units represents a promising solution to address these challenges. Strategic placement and optimal sizing of DG units can effectively mitigate power losses, improve voltage profiles, reduce peak demand from the grid, and enhance system resilience [8,9,10]. However, the optimization of DG integration in electric bus networks involves multiple conflicting objectives that cannot be adequately addressed through traditional single-objective approaches. Power loss minimization may conflict with voltage regulation requirements, while economic considerations must be balanced against technical performance metrics [11,12].

1.2. Liturature Review and Research Gaps

1.2.1. DG Optimization in Distribution Networks

Extensive research has been conducted on DG placement and sizing optimization in distribution networks. Traditional approaches have predominantly focused on single-objective optimization, typically minimizing power losses [13,14,15] or maximizing voltage stability margins [16]. Genetic algorithms (GA) [17], particle swarm optimization (PSO) algorithms [18], and artificial bee colony (ABC) algorithms [19] have been widely applied to solve these problems. However, these methods require careful parameter tuning and often converge with local optima in complex search spaces.
Recent advances have introduced multi-objective formulations to capture the inherent trade-offs in DG integration. Non-dominated Sorting Genetic Algorithm II (NSGA-II) [20,21] and Multi-Objective Particle Swarm Optimization (MOPSO) [22,23] have shown promising results in generating Pareto-optimal solutions. However, these approaches typically rely on weighted-sum methods or subjective preference articulation, which may not adequately represent decision-maker preferences or capture the full spectrum of trade-offs [24].

1.2.2. Electric Bus Charging Infrastructure Optimization

The optimization of charging infrastructure for electric transit systems has emerged as a distinct research area. Studies have focused on charging station placement [25,26,27], charging scheduling optimization [28,29], and grid impact assessment [30,31]. However, most existing work treats the distribution network as a passive entity, failing to leverage the predictable nature of E-bus operations for proactive network optimization through DG integration.
A recent study by Bi et al. [32] proposed a spatial decision-making framework for electric vehicle charging station expansion, combining the Geographic Information System (GIS), Fuzzy Analytic Hierarchy Process (FAHP), and the Multi-Attributive Border Approximation Area Comparison (MABAC) methods. This approach enables systematic evaluation of multiple spatial and socio-economic criteria but does not incorporate electrical network constraints or optimization algorithms such as PSO or GWO.
Figure 1 illustrates the topology of the electric bus flash charging station, comprising the flash charger system, roof-mounted pantograph, and electric bus (E-bus). When the E-bus arrives at the charging station, the system initiates an automated charging process. A high-power supply is rapidly delivered from the charger to the E-bus battery system via the pantograph, ensuring quick and efficient energy transfer. The power demand of the charger for the E-bus is presented in Table 1.

1.2.3. Grey Wolf Optimizer Applications Optimization

The Grey Wolf Optimizer (GWO), introduced by Mirjalili et al. [37], has gained significant attention for the optimization of power systems due to its simple implementation, robust convergence characteristics, and effective exploration–exploitation balance. Applications in power systems include optimal power flow [38], economic dispatch [39], and renewable energy integration [40]. Multi-objective variants of GWO (MOGWO) have been developed for various engineering applications [41,42], but their application for the optimization of DG in electric transit networks remains limited.

1.2.4. Research Gaps and Motivation

Despite the extensive research on both DG optimization and electric bus systems, several critical gaps remain, as illustrated in Table 2 and as follows:
  • Limited multi-objective approaches: most DG optimization studies rely on weighted-sum methods, which may not adequately capture trade-offs and require subjective weight selection.
  • Static loading assumptions: traditional DG optimization assumes static or simplified loading patterns, failing to account for the dynamic nature of E-bus charging.
  • Insufficient decision support: current multi-objective approaches often provide Pareto fronts without adequate guidance for practical solution selection.
  • Limited validation: many studies lack comprehensive validation with realistic E-bus operational data and detailed network modeling.
Key Advantages of the proposed methodology:
  • Methodological Innovation: first application of Euclidean distance-based MOGWO eliminating subjective weight selection while maintaining solution diversity.
  • Comprehensive Integration: seamless integration of realistic E-bus operational dynamics with power system optimization, 31-stop routes, flash charging, and multi-bus coordination.
  • Advanced Decision Support: five-method consensus approach (TOPSIS, Euclidean distance, weighted sum, compromise programming, hypervolume) for robust solution selection.
  • Practical Implementation Focus: automated report generation, multi-stakeholder considerations, and comprehensive implementation guidance, bridging the gap between research and practice.
  • Real-world Validation: uses actual E-bus specifications, realistic charging patterns, and comprehensive constraint modeling rather than simplified theoretical scenarios.
The comparison clearly demonstrates that while existing research has made significant contributions in individual areas, the proposed methodology represents the first comprehensive approach that effectively integrates multi-objective DG optimization with realistic electric bus system dynamics while providing practical decision support for implementation.

1.2.5. Research Objectives

The primary objectives of this research are as follows:
  • Develop an enhanced multi-objective grey wolf optimization: create a robust MOGWO variant that eliminates subjective weight selection through Euclidean distance-based fitness evaluation.
  • Integrate E-Bus dynamics: incorporate realistic electric bus operational patterns, including route modeling, charging schedules, and dynamic loading scenarios.
  • Provide comprehensive decision support: develop multiple compromise solution selection methods to support practical implementation decision.
  • Validate performance: demonstrate the effectiveness of the proposed approach through extensive simulation studies and comparative analysis.
  • Enable practical implementation: generate actionable insights and recommendations for power system operators and transit agencies.

1.3. Main the Contibutions

This paper makes several significant contributions to the field of power systems optimization and electric transportation infrastructure:
  • The proposed MOGWO uses Euclidean distance-based fitness to eliminate weight tuning, enhance Pareto diversity, and adapt reference points dynamically. It includes efficient archive management for non-dominated solutions.
  • Compromise selection framework is adapted by five methods as TOPSIS, Euclidean distance, equal-weighted Sum, L2-metric, and hypervolume contribution. They are applied to select balanced solutions from the Pareto front.
  • Consensus-based decision support: the framework employs a voting mechanism across all five methods to identify consensus solutions, providing.
  • Integrated E-bus and DG model with a 31-stop, 62 km route, 600 kW flash charging, and multi-bus coordination with staggered trips and grid interaction.
  • Performance evaluation framework Introduces multi-dimensional metrics including hypervolume, diversity, convergence rate, and trade-off analysis, supported by 2D/3D Pareto plots, radar charts.
  • Advances multi-objective optimization, sets benchmarks for DG in E-bus systems, and validates nature-inspired methods for smart grid studies.
  • Supports utilities in DG planning, transit agencies in flash charging strategies, regulators in performance assessment and advancing sustainable transport.

2. Theory Background

The aim of multi-objective optimization is to identify the most effective solution that satisfies competing objectives under given constraints. Achieving such an optimal solution requires a comprehensive understanding of the underlying theoretical foundations. These theories are essential for analyzing the problem structure and guiding the development of suitable solution strategies. Accordingly, the proposed methods are systematically adapted from established theoretical models to ensure accurate and efficient optimization outcomes.

2.1. Power Flow Analysis and Related Modeling of Simulation

2.1.1. Power Flow Equation

The complex power injection of each bus in the electrical power system can be expressed as Equation (1). The power flow of the bus is represented by the active and reactive power as Equations (2) and (3), respectively [43].
S i = P i + j Q i = V i · j = 1 N V j Y i j ;       i 1,2 , , N
P i = V i · j = 1 N V j G i j c o s θ i j + B i j s i n θ i j
Q i = V i · j = 1 N V j G i j s i n θ i j + B i j c o s θ i j

2.1.2. Power Balance of the Electrical Power System

Maintaining power balance between generation and load in an electrical power system is essential and can be expressed as follows:
                    i = 1 N P G , i , t + P D G , i , t = i = 1 N P D , i , t + P c h , i , t + P L , i , t
                                                i = 1 N Q G , i , t + Q D G , i , t = i = 1 N Q D , i , t + Q L , i , t

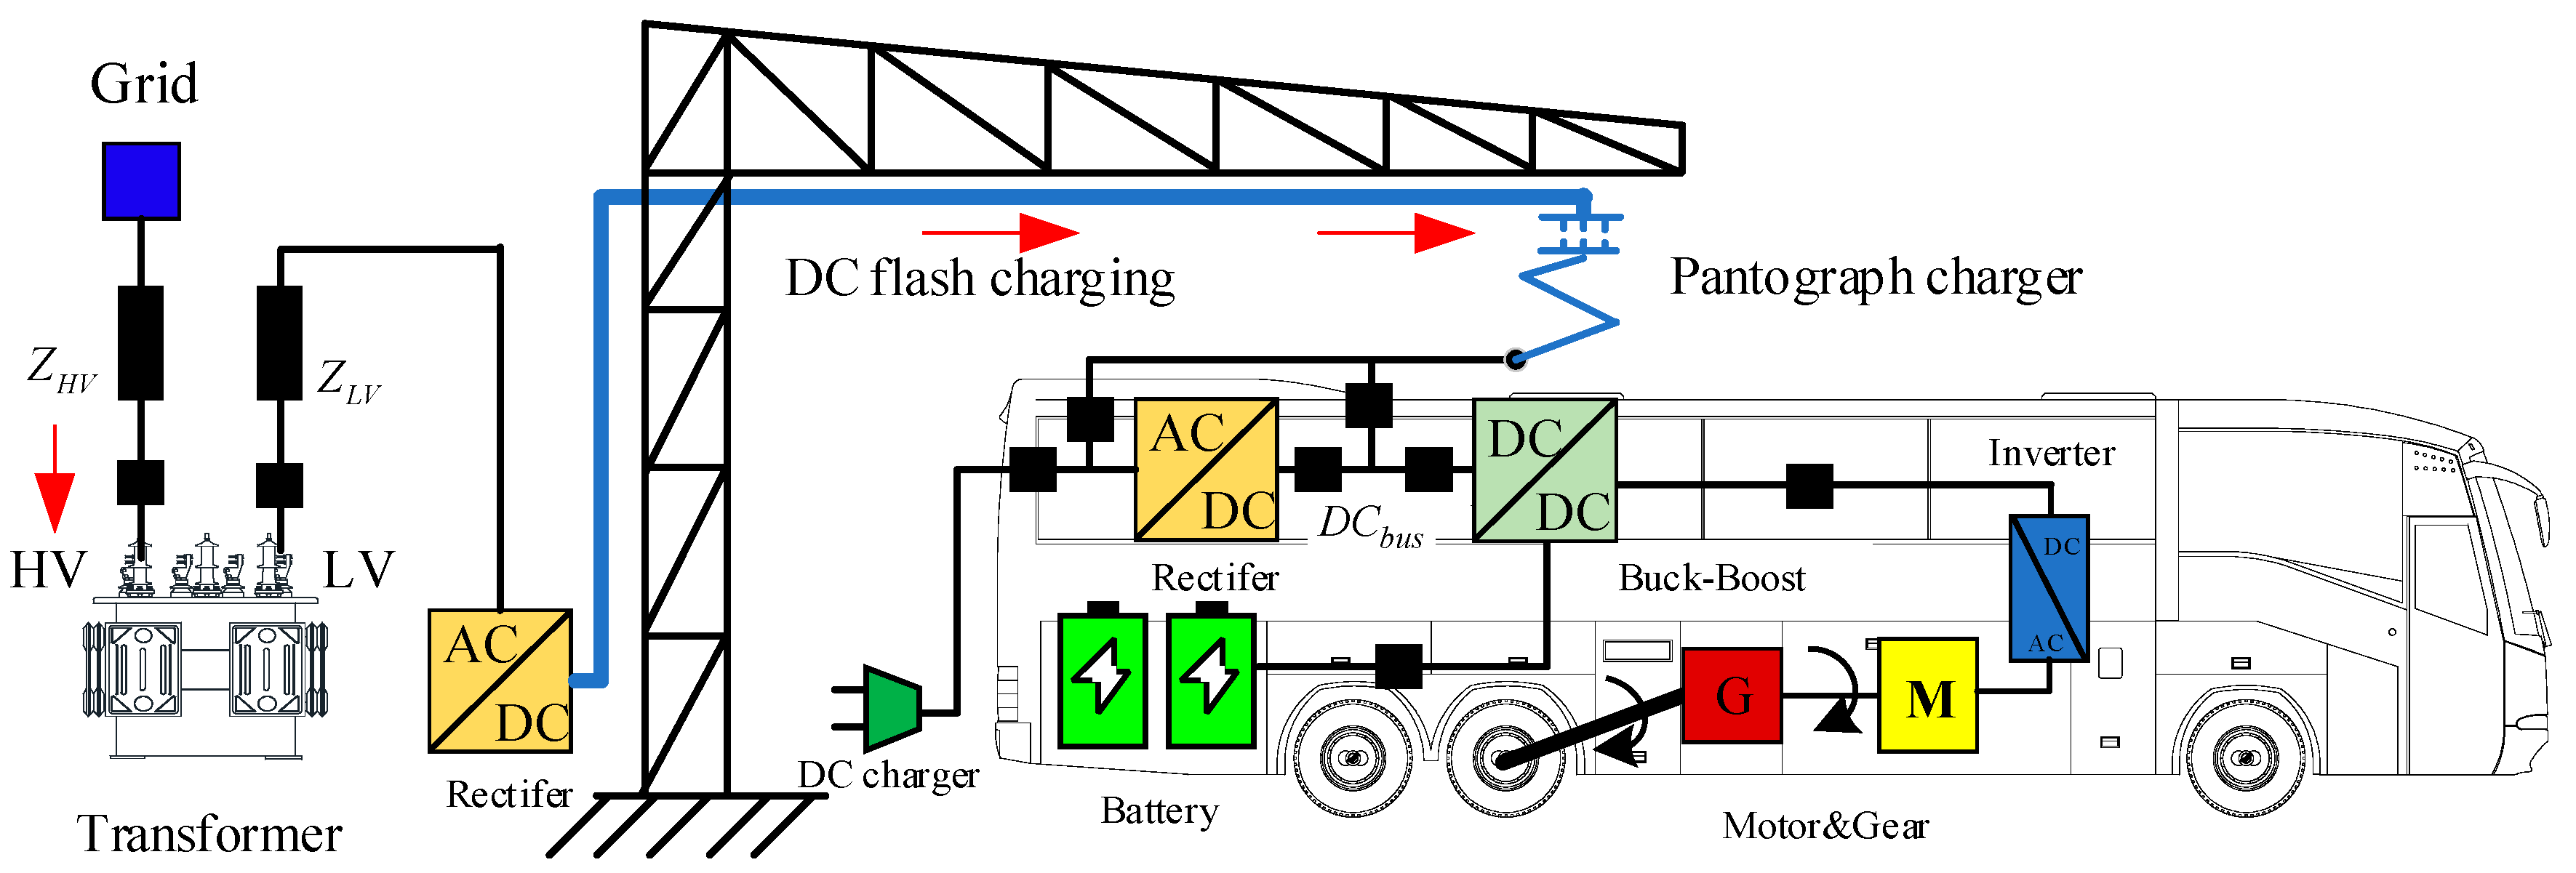
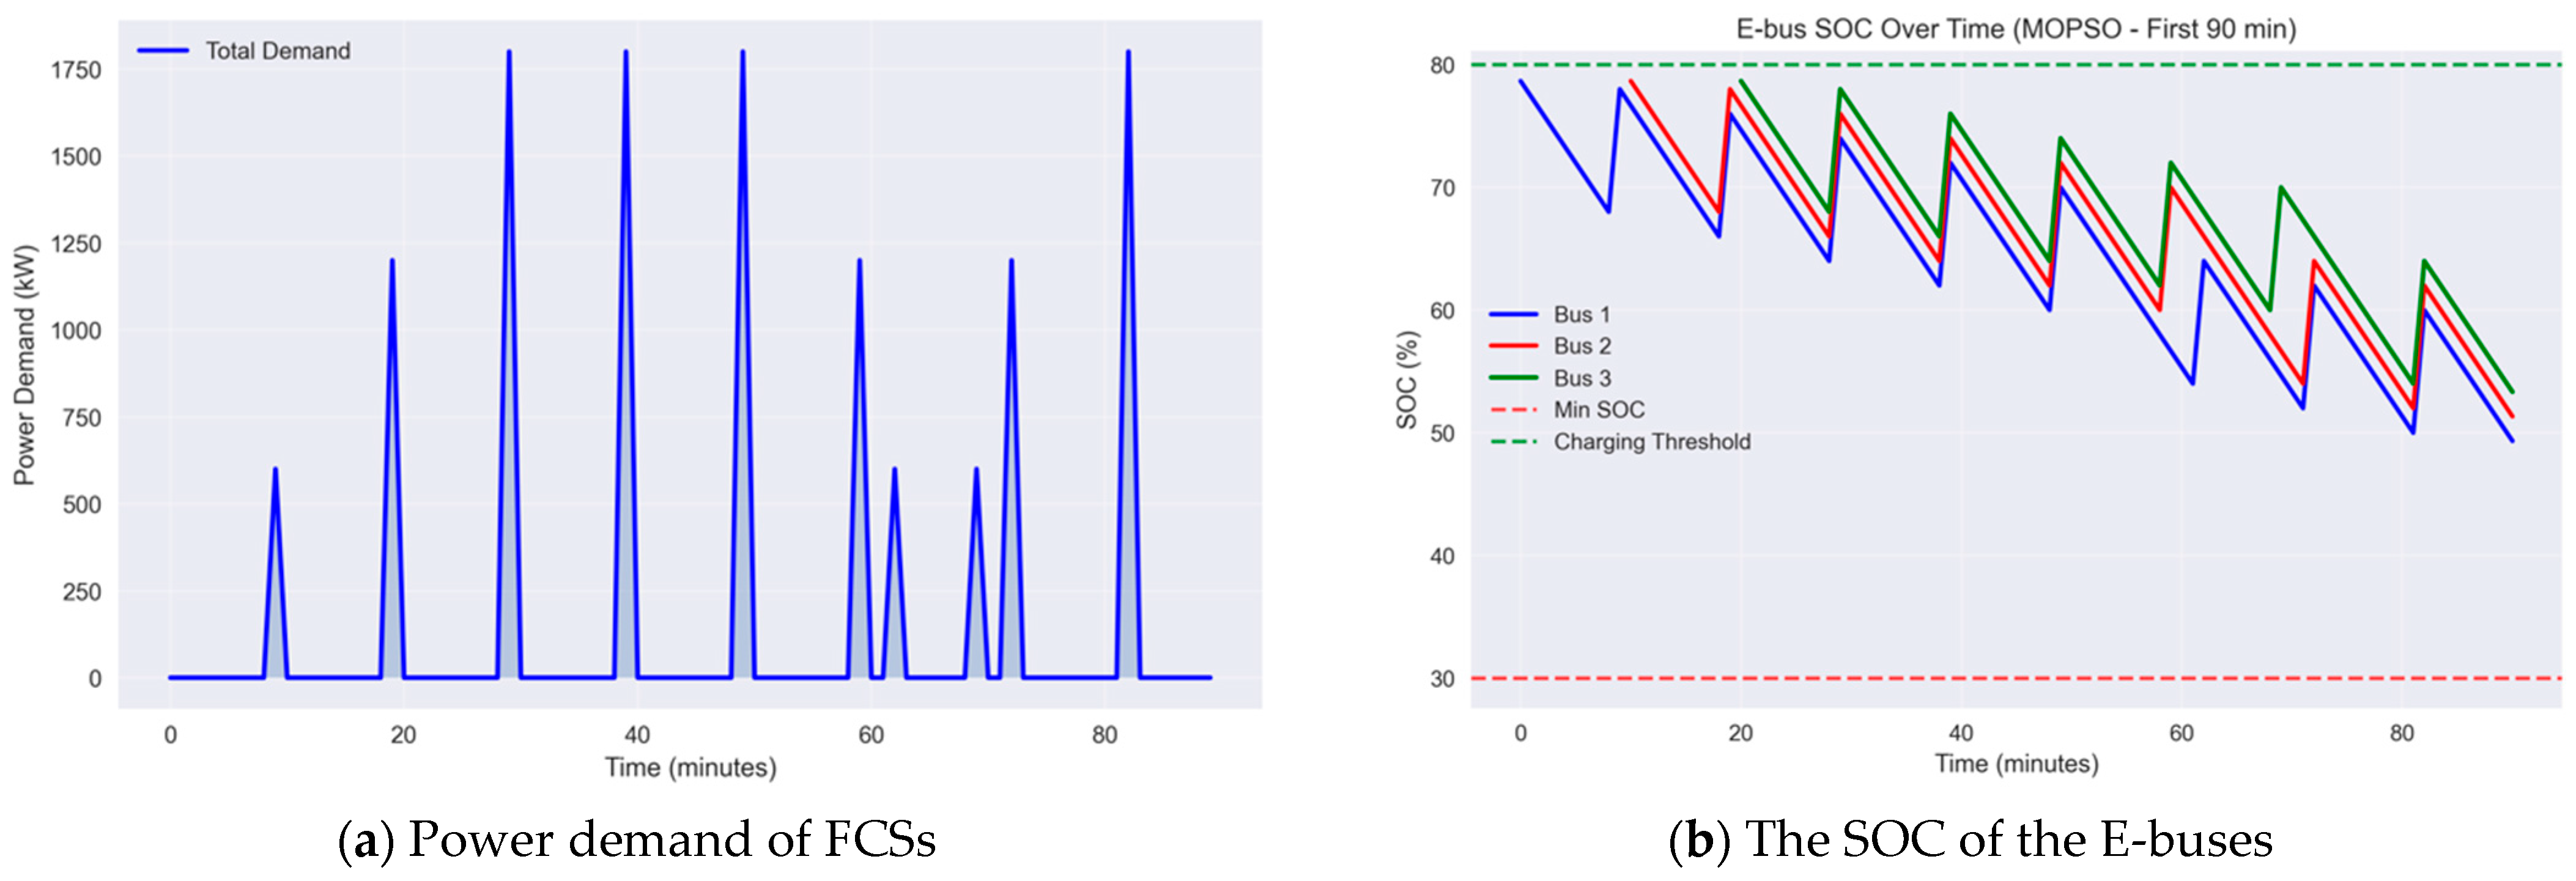
2.1.3. E-Bus Flash Charging Modeling

E-bus travel through a routed sequence of bus stops B S that associated with a physical node of electrical power systems can be expressed as.
B S = B S 0 , B S 1 , , B S n
The distance between consecutive stops and total route distance can be expressed as.
d i = D i s t a n c e S i , S i + 1 ;   i o , , n 1
D t o t a l = i = 0 n 1 d i
E-bus consumes energy while traveling and apparatus inside the passenger room E t r a v e l can be expressed as.
E t r a v e l i = d i · ϵ
To calculate the energy used during motion and the energy added during flash charging at a flash charging station, the power charged to the E-bus at time t while it is at the station is defined by Equation (10).
P F C , i , j = P F C , t m a x i f   b i , t B u s e s F C   a n d   τ i , j > 0 0 o t h e r w i s e
The charging duration τ i , j   depends on the travel distance and the stop time of the E-bus, updated according to Equation (11).
τ i , j = τ F C A r r i v e d ,   n o t   y e t   c h a r g e d τ i , j 1 1 D u r i n g   c h a r g i n g 0 O t h e r s
The energy stored in the E-bus battery E i , j for bus i at time t changes depending on whether the bus is moving or charging, according to Equation (12):
E i , j = E i , j 1 E t r a v e l A r r i v e d ,   n o t   y e t   c h a r g e d E i , j 1 + P c h , i , j · t 60 D u r i n g   c h a r g i n g E s t a r t O t h e r s
The State of Charge (SOC) of the battery updates as:
S O C t + 1 = S O C t E t r a v e l i E b a t t e r y + P c h a r g e ( t ) · t E b a t t e r y
Therefore, charging of E-bus is allowed only at buses the set of charging station b i B . nodes.

2.1.4. Distributed Generator (DG) Power Injection Model

The net injected complex power is:
S D G , k = P D G , k + j Q D G , k

2.1.5. Voltage Deviation Index (VDI)

The Voltage Deviation Index (VDI) is commonly used to evaluate the overall voltage profile quality across a distribution network. It quantifies the average deviation of bus voltages from the nominal value of 1.0 per unit over a specified time horizon, thus serving as a performance metric for voltage stability and regulation.
  V D I = f 1 = 1 T t = 1 T i = 1 N V i t 1.0  

2.1.6. Total Real Power Loss ( T l o s s )

To evaluate line losses, the total real power loss is calculated based on the power flow through each transmission line over the defined time intervals, as detailed below.
  T l o s s = f 2 = 1 T t = 1 T l = 1 L R L · P L t 2 + Q L t 2 V L t 2

2.1.7. Voltage Violations (Vv)

Voltage violation is an index used to measure the extent to which voltage magnitudes deviate from the acceptable tolerance range, as described below.
Vv = f 3 = t = 1 T i = 1 N δ i t ,     w h e r e   δ i t = 1 , i f   V i t < 0.95   o r   V i t > 1.05 0 , o t h e r w i s e

2.2. Energy Management Using Optimization Techniques

2.2.1. Multi-Objective Grey Wolf Optimizer (MOGWO)

The Grey Wolf Optimizer (GWO) is a nature-inspired metaheuristic algorithm, which mimics the leadership hierarchy and hunting behavior of grey wolves in the wild. The wolves are divided into four types: Alpha α is best solution (leader). Beta β is second-best solution (advisor). Delta δ is third-best solution (scout). Omega ω   is the remaining candidate solutions (followers).
GWO updates each solution based on its distance from α , β , and δ wolves using a balance between exploration (global search) and exploitation (local convergence). In Multi-Objective GWO (MOGWO), the original GWO is adapted to handle multiple conflicting objectives is not just a single cost function. MOGWO. They consist of Maintains a Pareto archive of non-dominated solutions, uses Euclidean distance from a reference point to rank solutions and applies GWO’s update mechanism to all decision variables simultaneously. Therefore, the step in MOGWO is initialization, pareto dominance check, fitness assignment, update α , β , and δ , position update and archive update and convergence.
The wolf’s position is updated using:
X t + 1 = 1 3 X α A 1 · D α + X β A 2 · D β + X δ A 3 · D δ
Moreover, the proposed optimization framework’s MOGWO is a contrast between two prominent multi-objective optimization strategies: the traditional weighted sum (WS) method (Equation (19)) and the enhanced Multi-Objective Grey Wolf Optimizer (MOGWO) with Euclidean distance-based fitness evaluation.
F x = i = 1 m w i · f i x
This approach, although simple, is constrained by subjective weight selection and its failure to represent non-convex areas of the Pareto front, which may result in overlooking globally optimal trade-offs.
The proposed enhanced MOGWO utilizes a fitness evaluation based on Euclidean distance, which measures the proximity of each solution to an ideal (utopia) point in the normalized objective space. The ideal point, represented as Z , is characterized by the minimum value of each objective function recorded within the current population.
Z = z 1 , z 2 , , z m ,         w h e r e     z i = min f i x
The Euclidean distance   d E x   of a solution x to this ideal point is represented as:
d E x = i = 1 m f i x z i z i m a x z i 2
This formulation guarantees automatic normalization and objective evaluation of multi-objective solutions, eliminating the need for subjective preference information. Solutions that produce smaller d E x   values are deemed superior, as they concurrently approach optimality across all objectives.
Therefore, in contrast to the WS method, which linearly aggregates objectives and may miss Pareto-optimal solutions in non-convex scenarios, the Euclidean distance-based MOGWO maintains the dominance structure and facilitates the creation of a diverse and well-distributed Pareto front. The proposed method is thus more appropriate for addressing complex power system issues. However, this method may be highly varied under the number of variables and turbulence values in each computation iteration.

2.2.2. Compromised Solution and Normalization

  • Objective Normalization
    The difference in the objective function f i , before applying compromise solution methods, the objective values are normalized. This scales all the objective values into the range [0,1] to ensure comparability across different units.
    f ~ i , j = f i , j f j m i n f j m a x f j m i n   ,   i = 1 , , m ;       j = 1 , , k
  • Compromise Solution Methods
    From the generated Pareto optimal set, the need arises to select a single compromise solution that performs well across all objectives. Five advanced methods are employed:
    1
    Technique for Order Preference by Similarity to Ideal Solution (TOPSIS) that prefers solutions closest to the ideal and farthest from the worst [44,45]. The TOPSIS is consistent with three functions for applications as distance to idea D i + , distance to anti-idea D i and finding the maximum score of the TOPSIS can expressed in Equations (23)–(25) as follows:
    D i + = j = 1 k f ~ i , j f ~ j i d e a l 2
    D i = j = 1 k f ~ i , j f ~ j a n t i i d e a l 2
    maximize C i = D i D i + + D i
    2
    Euclidean distance from ideal point use chooses the solution closest to the ideal objective vector and selected by minimum of E i   from each solution and can be expressed as Equation (26) [46].
    m i n i m i z e   E i = j = 1 k f ~ i , j f ~ j i d e a l 2
    3
    Weighted sum (WS) is adapted by aggregating normalized objectives f ~ i , j assuming equal or user-defined priority that can be expressed the WS as Equation (27) [47].
    W S i = j = 1 k ω j ·   f ~ i , j ;       ω j = 1
    4
    Compromise programming (Lp-metric, p = 2) is used by minimizing the L2-norm from the ideal point [48].
    m i n i m i z e   L i p = j = 1 k f ~ i , j f ~ j i d e a l max f ~ i , j min f ~ i , j   p 1 / p c o m m o n l y   p = 2
    5
    Hypervolume contribution is used by selecting solutions with the largest added area/volume in objective space [49].
    m a x i m i z e     H V i = j = 1 k r j f ~ i , j ;         r j = 1.1 · max i f ~ i , j
  • Consensus-Based Decision Support
    The system assesses all five compromise solution techniques and documents the optimal option determined by each. A consensus-based decision support strategy is used to ascertain the optimal compromise. Within this structure, each method casts a single “vote” v i for its chosen optimal solution as Equation (30). The option that garners the most votes is chosen by most methods is deemed the ultimate compromise answer as Equation (31). Voting in the context of consensus-based compromise solution selection is based on the solution that each method identifies as its most preferred choice from the set of all non-dominated solutions obtained through multi-objective optimization (Pareto front). This voting-based aggregate guarantees equity and reduces the prejudice inherent in any single approach. The consensus procedure selects the final compromise solution by maximizing the number of votes received, as defined in Equation (32).
    m a x i m i z e   v i = m M I s m = i
    I s m = i =     1 i f   m e t h o d   m   s e l e c t s   s o l u t i o n   i     0 o t h e r w i s e
    i = arg max i v i

3. Methodology of the Multi-Objective Optimization of Distributed Generation Placement in Electric Bus Transit Systems Integrated with Flash Charging Station

There are four subsections in this section. First, it describes the modifications made to the IEEE 33-bus system and IEEE 69-bus system to support the electric bus (E-bus) flash charging concept, and parameter setup can be presented in Table 3. Second, it introduces the objective function of the Multi-Objective Grey Wolf Optimizer (MOGWO) in power distribution systems and constraints for optimal DGs placement. Third, it presents the complete pseudocode for multi-objective optimization involving E-bus flash charging and distributed generator (DG) placement. Finally, the defined case studies and comparison results used for evaluation are outlined. The proposed problem was analyzed and solved using Python version 3.12 under PyCharm 2024.3.6. based on numerical algorithms.

3.1. Modified of IEEE 33 Bus and IEEE 69 Bus Testing System

The IEEE 33-bus distribution test system is employed to evaluate the impact of flash charging station (FCS) integration on the power grid. The original system operates under a total load demand of 3.72 MW and 2.30 MVar and comprises 32 radial distribution lines configured in a typical radial topology [50]. This paper modifies the IEEE 33 bus by integrating together the E-bus for the roof-mounted pantograph charger as shown in Figure 2.
Figure 2 illustrates the modified IEEE 33-bus radial distribution system integrated with electric bus (E-bus) flash charging infrastructure. The system is divided into two conceptual layers as follows: Layer 1 represents the E-bus transit route and associates flash charging stations. Layer 2 consists of the electrical power distribution network. The E-bus route is depicted with a dashed orange line, highlighting the travel path connecting 31 stops (S0 to S30). Along this route, specific nodes are equipped with flash charging stations, marked by yellow lightning icons and blue square indicators (e.g., S0, S3, S6, S9, S12, S18, S21, S25, and S28). These locations correspond to buses in the IEEE 33 bus system where high-power flash charging infrastructure is installed. The red squares indicate where the flash chargers are electrically connected to the main distribution system from Figure 1. The black lines represent existing radial transmission lines, while green lines denote tie switches that are not used for reconfiguration in this work.
The IEEE 69-bus distribution test system is employed to evaluate the impact of flash charging station (FCS) integration on the power grid. The original system operates under a total load demand of 3.802 MW and 2.695 MVar and comprises 68 radial distribution lines configured in a typical radial topology [51,52]. In the IEEE 69-bus system, 46 buses are load buses and 23 are no-load buses. In this study, the flash charging stations (FCS) are installed at selected no-load buses based on the optimization framework. This paper modifies the IEEE 69 bus by integrating together the E-bus for the roof-mounted pantograph charger as shown in Figure 3.
Figure 3 illustrates the effective incorporation of E-bus flash charging infrastructure into the IEEE 69-bus system using a dual-layer modeling methodology. Flash charging stations (FCS) are deployed at ten designated no-load buses to prevent interfering with current loads. Layer 2 (Upper Section) represents the electrical distribution network, with radial topology, transmission lines, tie switches, load and no-load buses, FCS locations and distributed generators (DGs). Layer 1 (Lower Section) illustrates the E-bus transit system, including stations S0–S30, FCS-equipped sites, power connection lines, and bus routing pathways. This arrangement facilitates synchronized study of electricity and transportation networks, allowing fast charging (600 kW) to the grid. The model employs roof-mounted pantograph chargers linked by short-range distribution wires, mirroring actual installations.
Table 3 shows that the proposed model incorporates real-world operational parameters of E-bus systems, specifically those associated with flash charging infrastructure. The charging dynamics are represented through a discrete-time state of charge update mechanism, incorporating the E-bus route, speed, energy consumption rate (2 kWh/km), and battery capacity (100 kWh). Each bus operates along a specified route comprising 31 bus stops (S0–S30), with stops occurring at intervals of 2 km, in accordance with conventional urban transit spacing standards. Flash charging stations are positioned at strategic locations within the IEEE 33-bus and IEEE 69-bus systems. The charger is designated as a 600 kW roof-mounted pantograph system designed to provide a 1 min high-power charge, illustrating the practical application of fast charging in urban transit at terminal stops or significant interchange locations. The simulation accommodates 10 stations, with the state of charge (SOC) being updated at each stop according to the presence of a charging station, the remaining energy, and the energy requirements for the subsequent segment. This study excludes inductive and wireless power transfer technologies. However, such methods could be considered in future work, particularly with respect to thermal assessments of wireless electric vehicle charging systems and the evaluation of over-temperature risks in ground-side assemblies, as discussed in [53]. The focus is pantograph-based conductive charging, which is more widely adopted due to its efficiency, infrastructure readiness, and compatibility with high-power flash charging.

3.2. Definition of Objective Function and Constraints for MOGWO

The multi-objective function is consistent with the voltage deviation index, total power loss and voltage violation index. However, the current study primarily focuses on the technical aspects of multi-objective optimization, specifically targeting power loss reduction, voltage deviation minimization, and voltage violation mitigation. The economic trade-off, such as distributed generation (DG) investment costs, flash charging station infrastructure expenses, and potential system revenue that are indeed critical for comprehensive planning and decision-making. Although these economic factors are beyond the scope of the present work, we fully recognize their relevance and intend to incorporate a detailed techno-economic analysis in future research. This will include evaluating capital expenditure, operational costs, and financial returns associated with DG and charging infrastructure deployment to support more holistic and practical optimization strategies.
The all-objective functions will be adapted to solve the integration of DGs, high demand of flash charging station and system constraint as voltage limits, state of charge of the battery, active and reactive power limits of DGs and Consensus-Based decision support can be presented as follows.
The possible DG placement and size can be generated by using Equation (33).
x = b 1 , b 2 , b k ,   P D G , 1 , P D G , 2 , , P D G , k ,   Q D G , 2 , , Q D G , k   ,   b k B , b i b j , i i
The objective function of the multi-objective function consists of voltage deviation index f 1 , total power loss f 2 and voltage violation f 3 can be expressed as follows:
min F x x Ω = f 1 x , f 2 x , f 3 x , ,         x R n
Subject to:
g x 0 ,                 h x = 0
The inequality and equality constraints:
P m i n P D G , k P m a x
Q m i n Q D G , k Q m a x
S O C m i n S O C F C , t S O C m a x
0.95 V i 1.05 ,   i
P c h a r g e , i ( t ) P c h a r g e , m a x

3.3. Algorithm for Solving the MOGWO for DGs Placement in E-Bus Transit System Integrated with Flash Charging Station

The algorithm overview, this paper has been adapted to multi-objective Grey Wolf optimization (MOGWO) for DG placement in electric bus networks uses Euclidean distance-based fitness evaluation to find Pareto-optimal solutions without requiring subjective weight assignments. The complete pseudocode can be found as Algorithm 1.
Algorithm 1: Multi-Objective Grey Wolf Optimizer (MOGWO) for complete pseudocode.
Main Algorithm: Multi-Objective Grey Wolf Optimizer (MOGWO)
Input data and network (IEEE 33 bus and IEEE 69 bus)
Begin main algorithm
//Step 1: Initialize MOGWO parameters
    CALL Initialize_MOGWO_Parameters ()
//Step 2: Initialize wolf population
CALL Initialize_Population ()
//Step 3: Main optimization loop
FOR iter = 1 TO max_iter DO
//Step 3.1: Evaluate objectives for all wolves
CALL Evaluate_Objectives ()
//Step 3.2: Update reference point for Euclidean distance
CALL Update_Reference_Point ()
//Step 3.3: Update alpha, beta, delta wolves
CALL Update_Alpha_Beta_Delta ()
//Step 3.4: Update Pareto archive
CALL Update_Pareto_Archive ()
//Step 3.5: Record convergence
CALL Record Convergence (iter)
//Step 3.6: Update wolf positions (except last iteration)
If iter < max_iter Then
CALL Update_Wolf_Positions(iter)
END IF
//Step 3.7: Display progress
PRINT “Iteration”, iter, “: Pareto solutions =”, |pareto_archive
End for
//Step 4: Post-processing and analysis
CALL Generate_Visualizations ()
CALL Perform_Compromise_Selection () from Section 2.2.2
CALL Export_Results ()
RETURN pareto_positions, pareto_powers, pareto_reactive_powers, pareto_objectives
End Main Algorithm

3.4. Scenarios of the MOGWO for Distributed Generation Placement Under Flash Charging of E-Bus

In this study, six scenarios are developed to investigate the optimal placement of distributed generators (DGs) using the Multi-Objective Grey Wolf Optimizer (MOGWO). The objective is to alleviate the negative impact of flash charging stations on the distribution grid. The E-bus transit system and flash charging infrastructure are simulated to represent realistic operational conditions closely. MOGWO is applied in conjunction with compromise solution techniques and advanced decision-making methods to determine the optimal configuration in each scenario. The scenario is divided into six study cases as follows:
Scenario 1: Optimal placement of a single DG unit for the IEEE 33 bus.
Scenario 2: Optimal placement of a single DG unit for the IEEE 69 bus.
Scenario 3: Optimal placement of two DG units for the IEEE 33 bus
Scenario 4: Optimal placement of two DG units for the IEEE 69 bus
Scenario 5: Optimal placement of three DG units for the IEEE 33 bus.
Scenario 6: Optimal placement of three DG units for the IEEE 69 bus.
All scenarios are evaluated by comparing the number of Distributed Generators (DGs) used in optimal placement across two test systems: the IEEE 33-bus and IEEE 69-bus radial distribution networks. The comparison framework consists of 16 analytical aspects per electrical power system, outlined as follows:
  • 2D visualization of simulation results of the objective functions.
  • Comparison of the total power loss and voltage violation.
  • Comparison of the total voltage deviation and voltage violation.
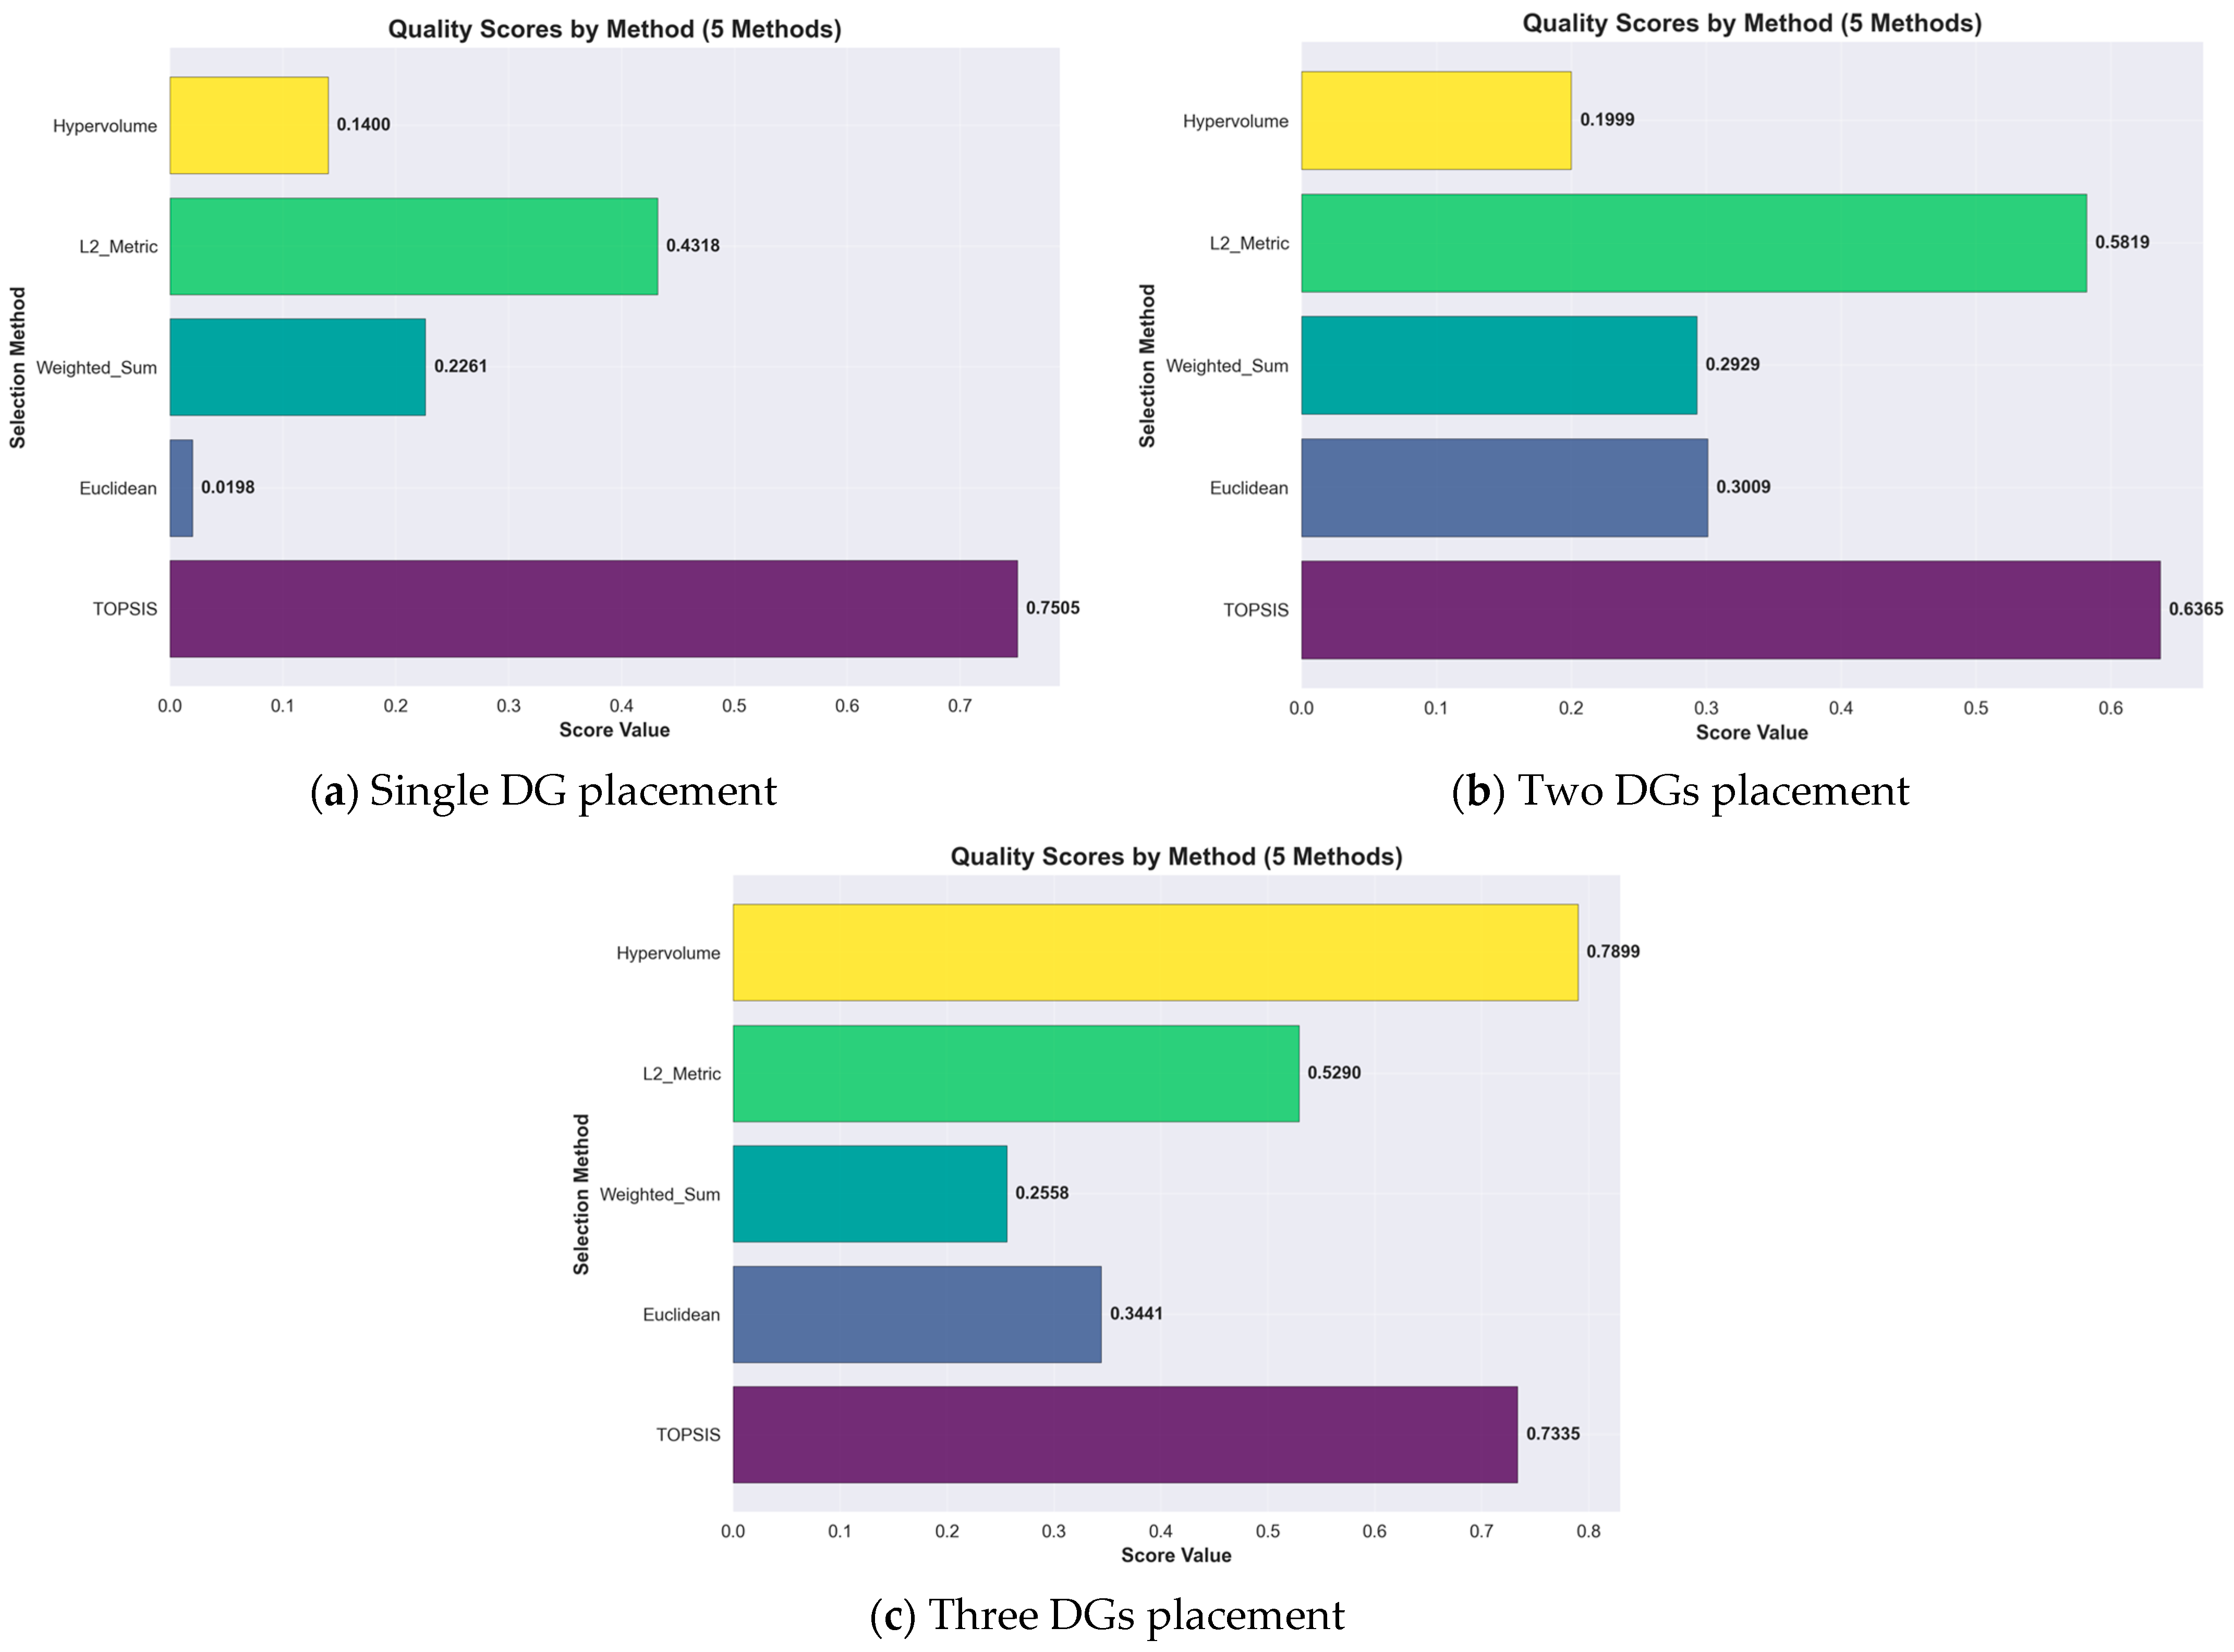
  • Comparison of the quality scores by each method for compromise solution.
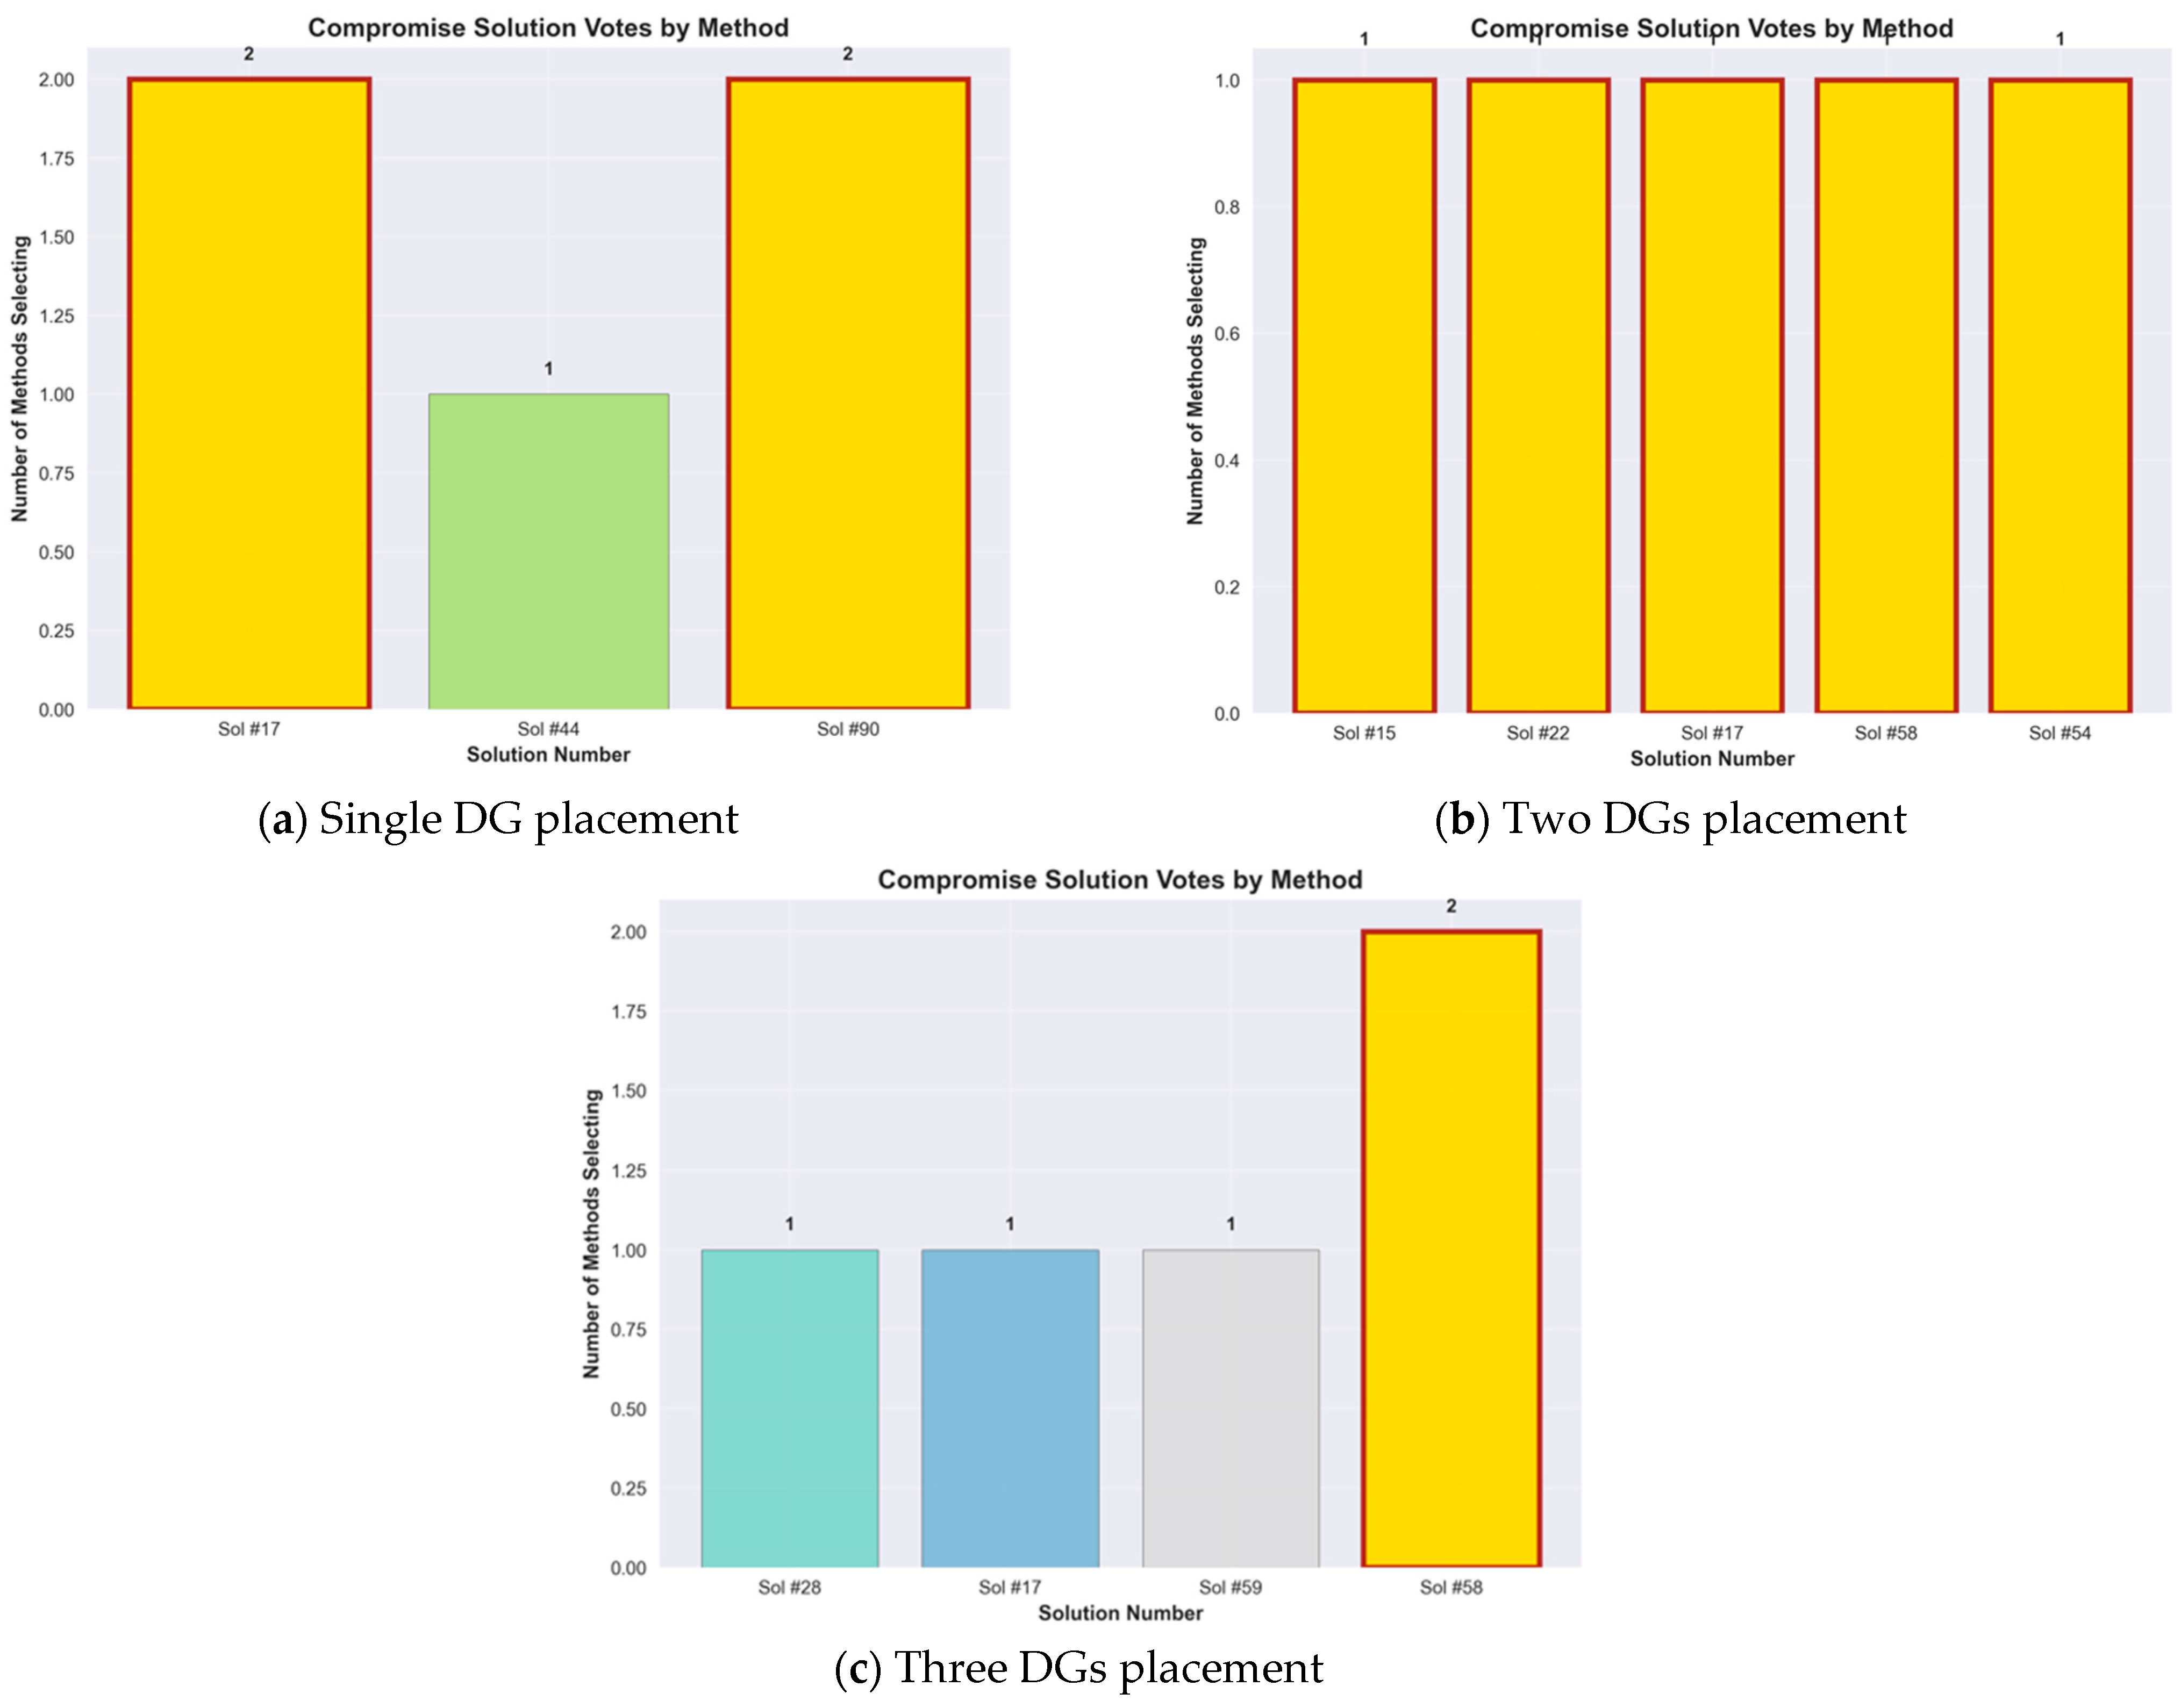
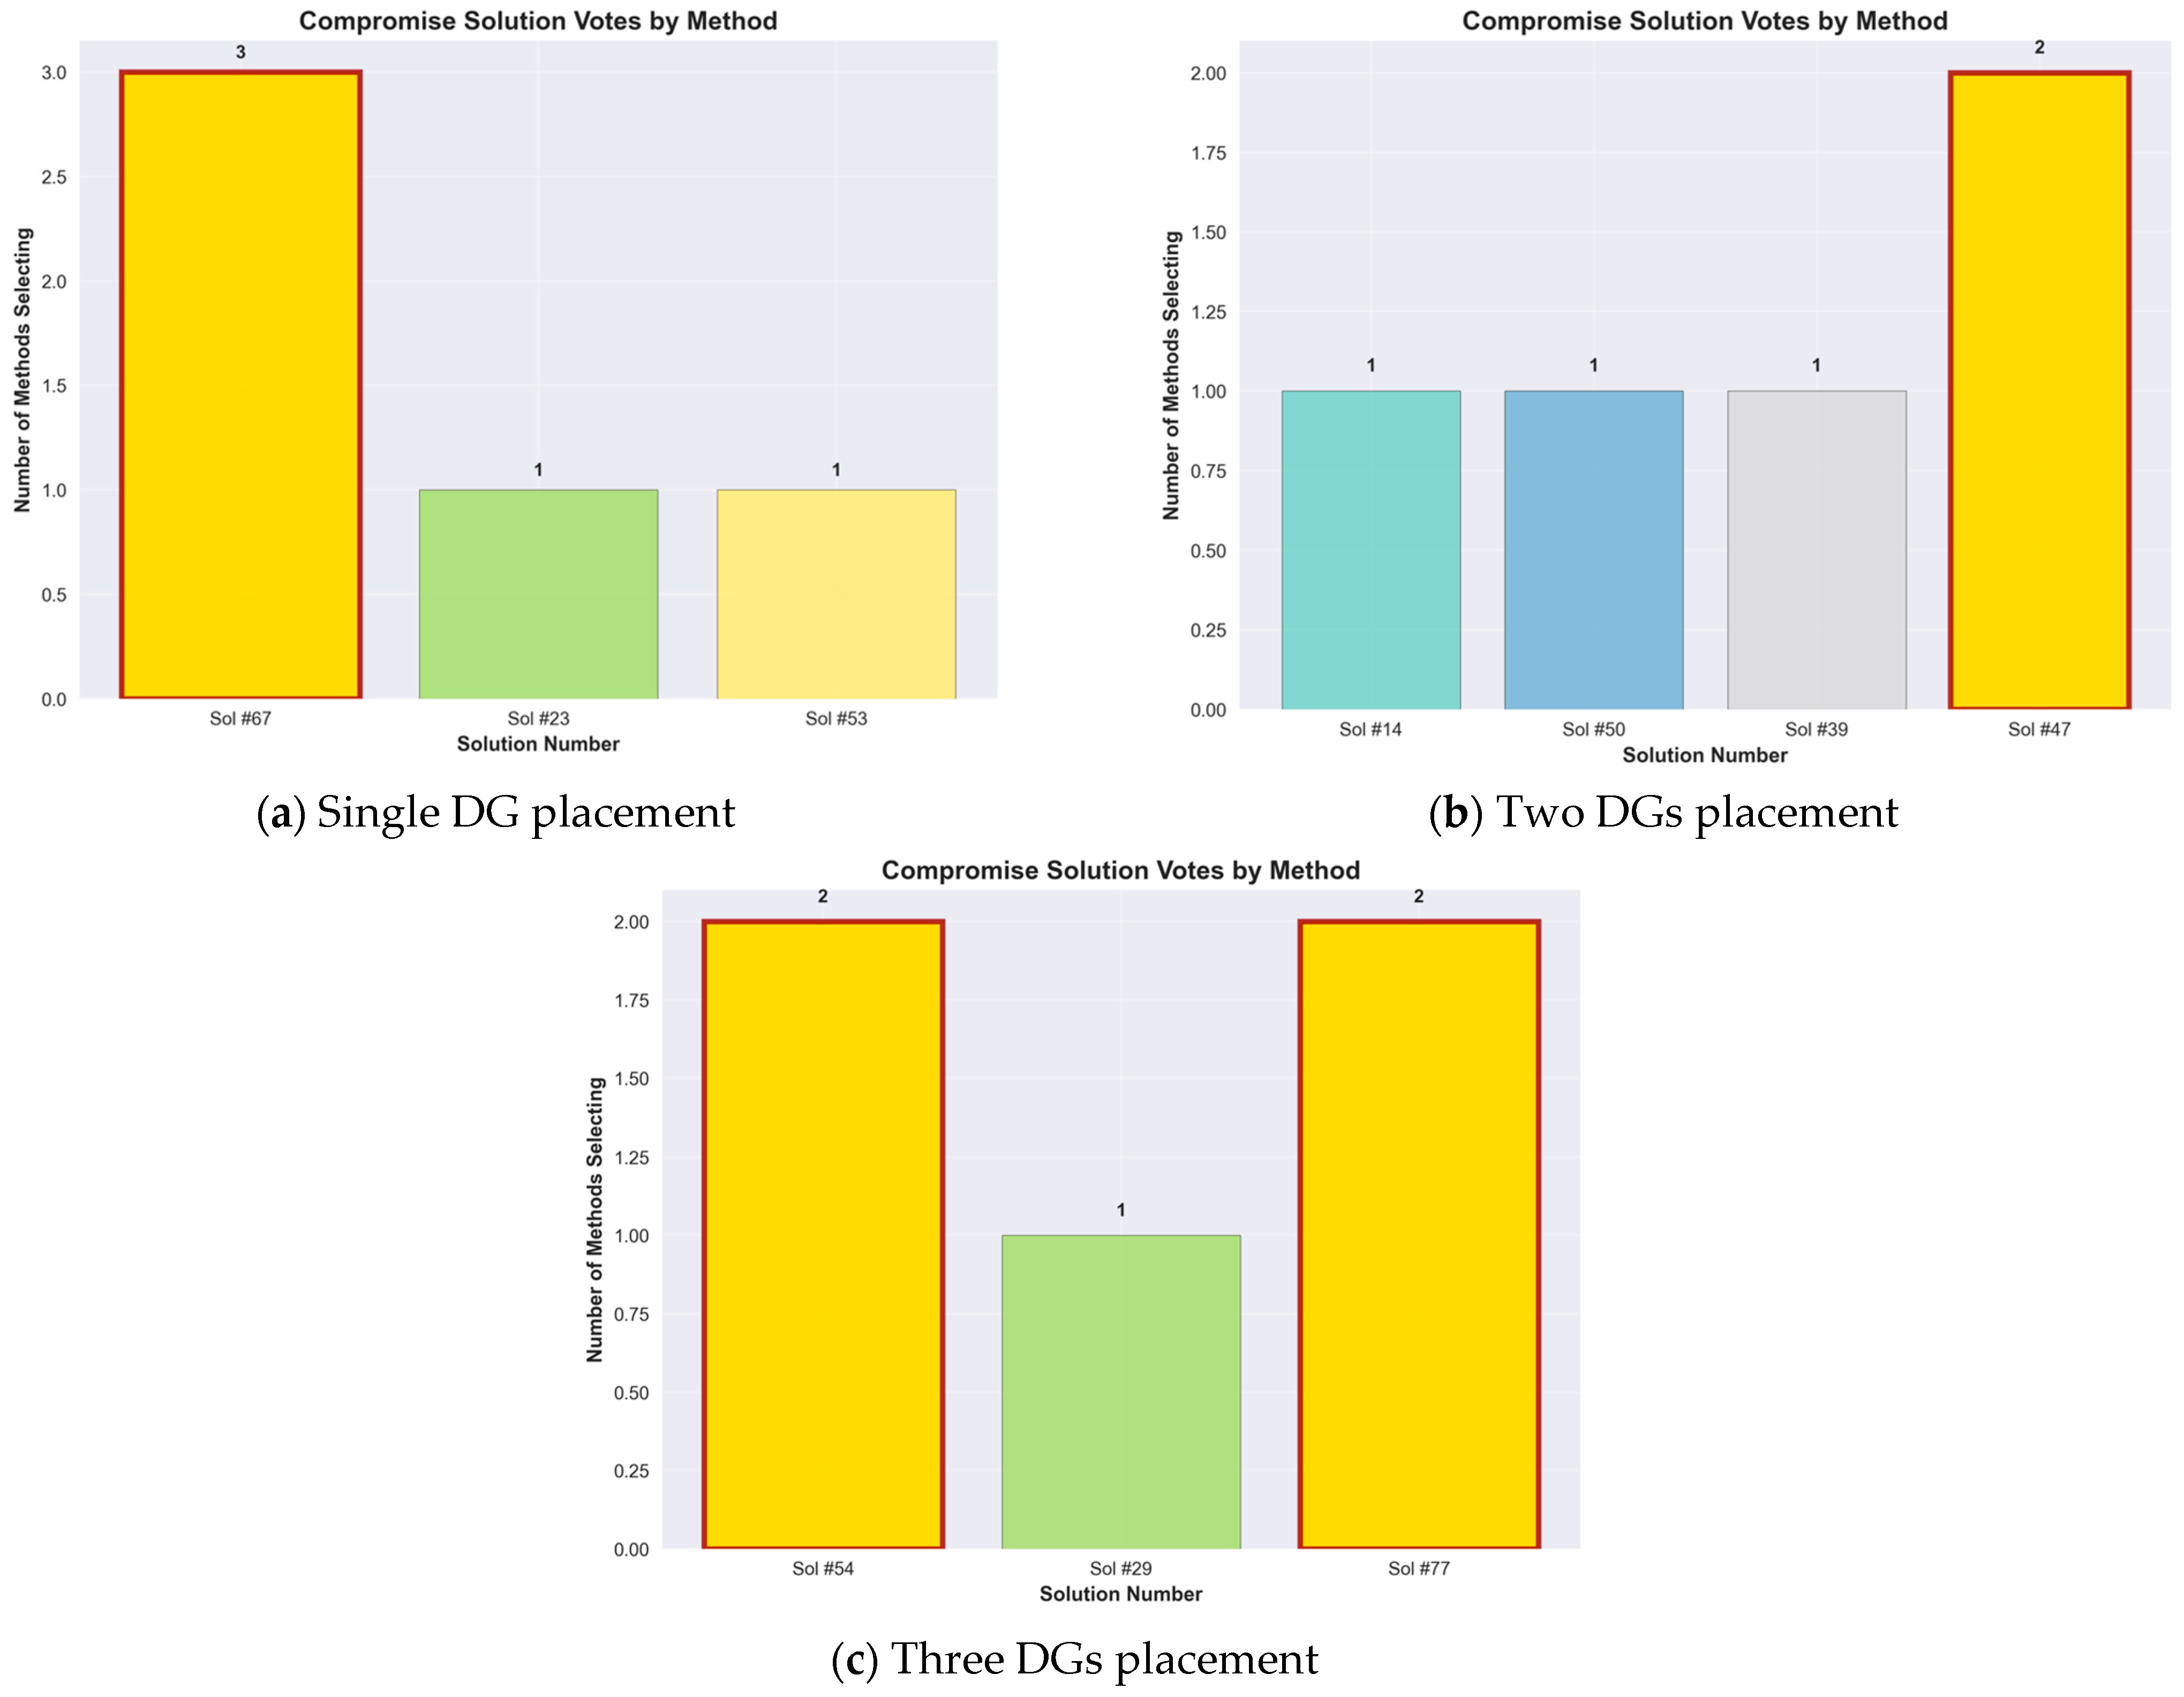
  • Comparison of the compromise solution votes by each method for consensus-based decision support.
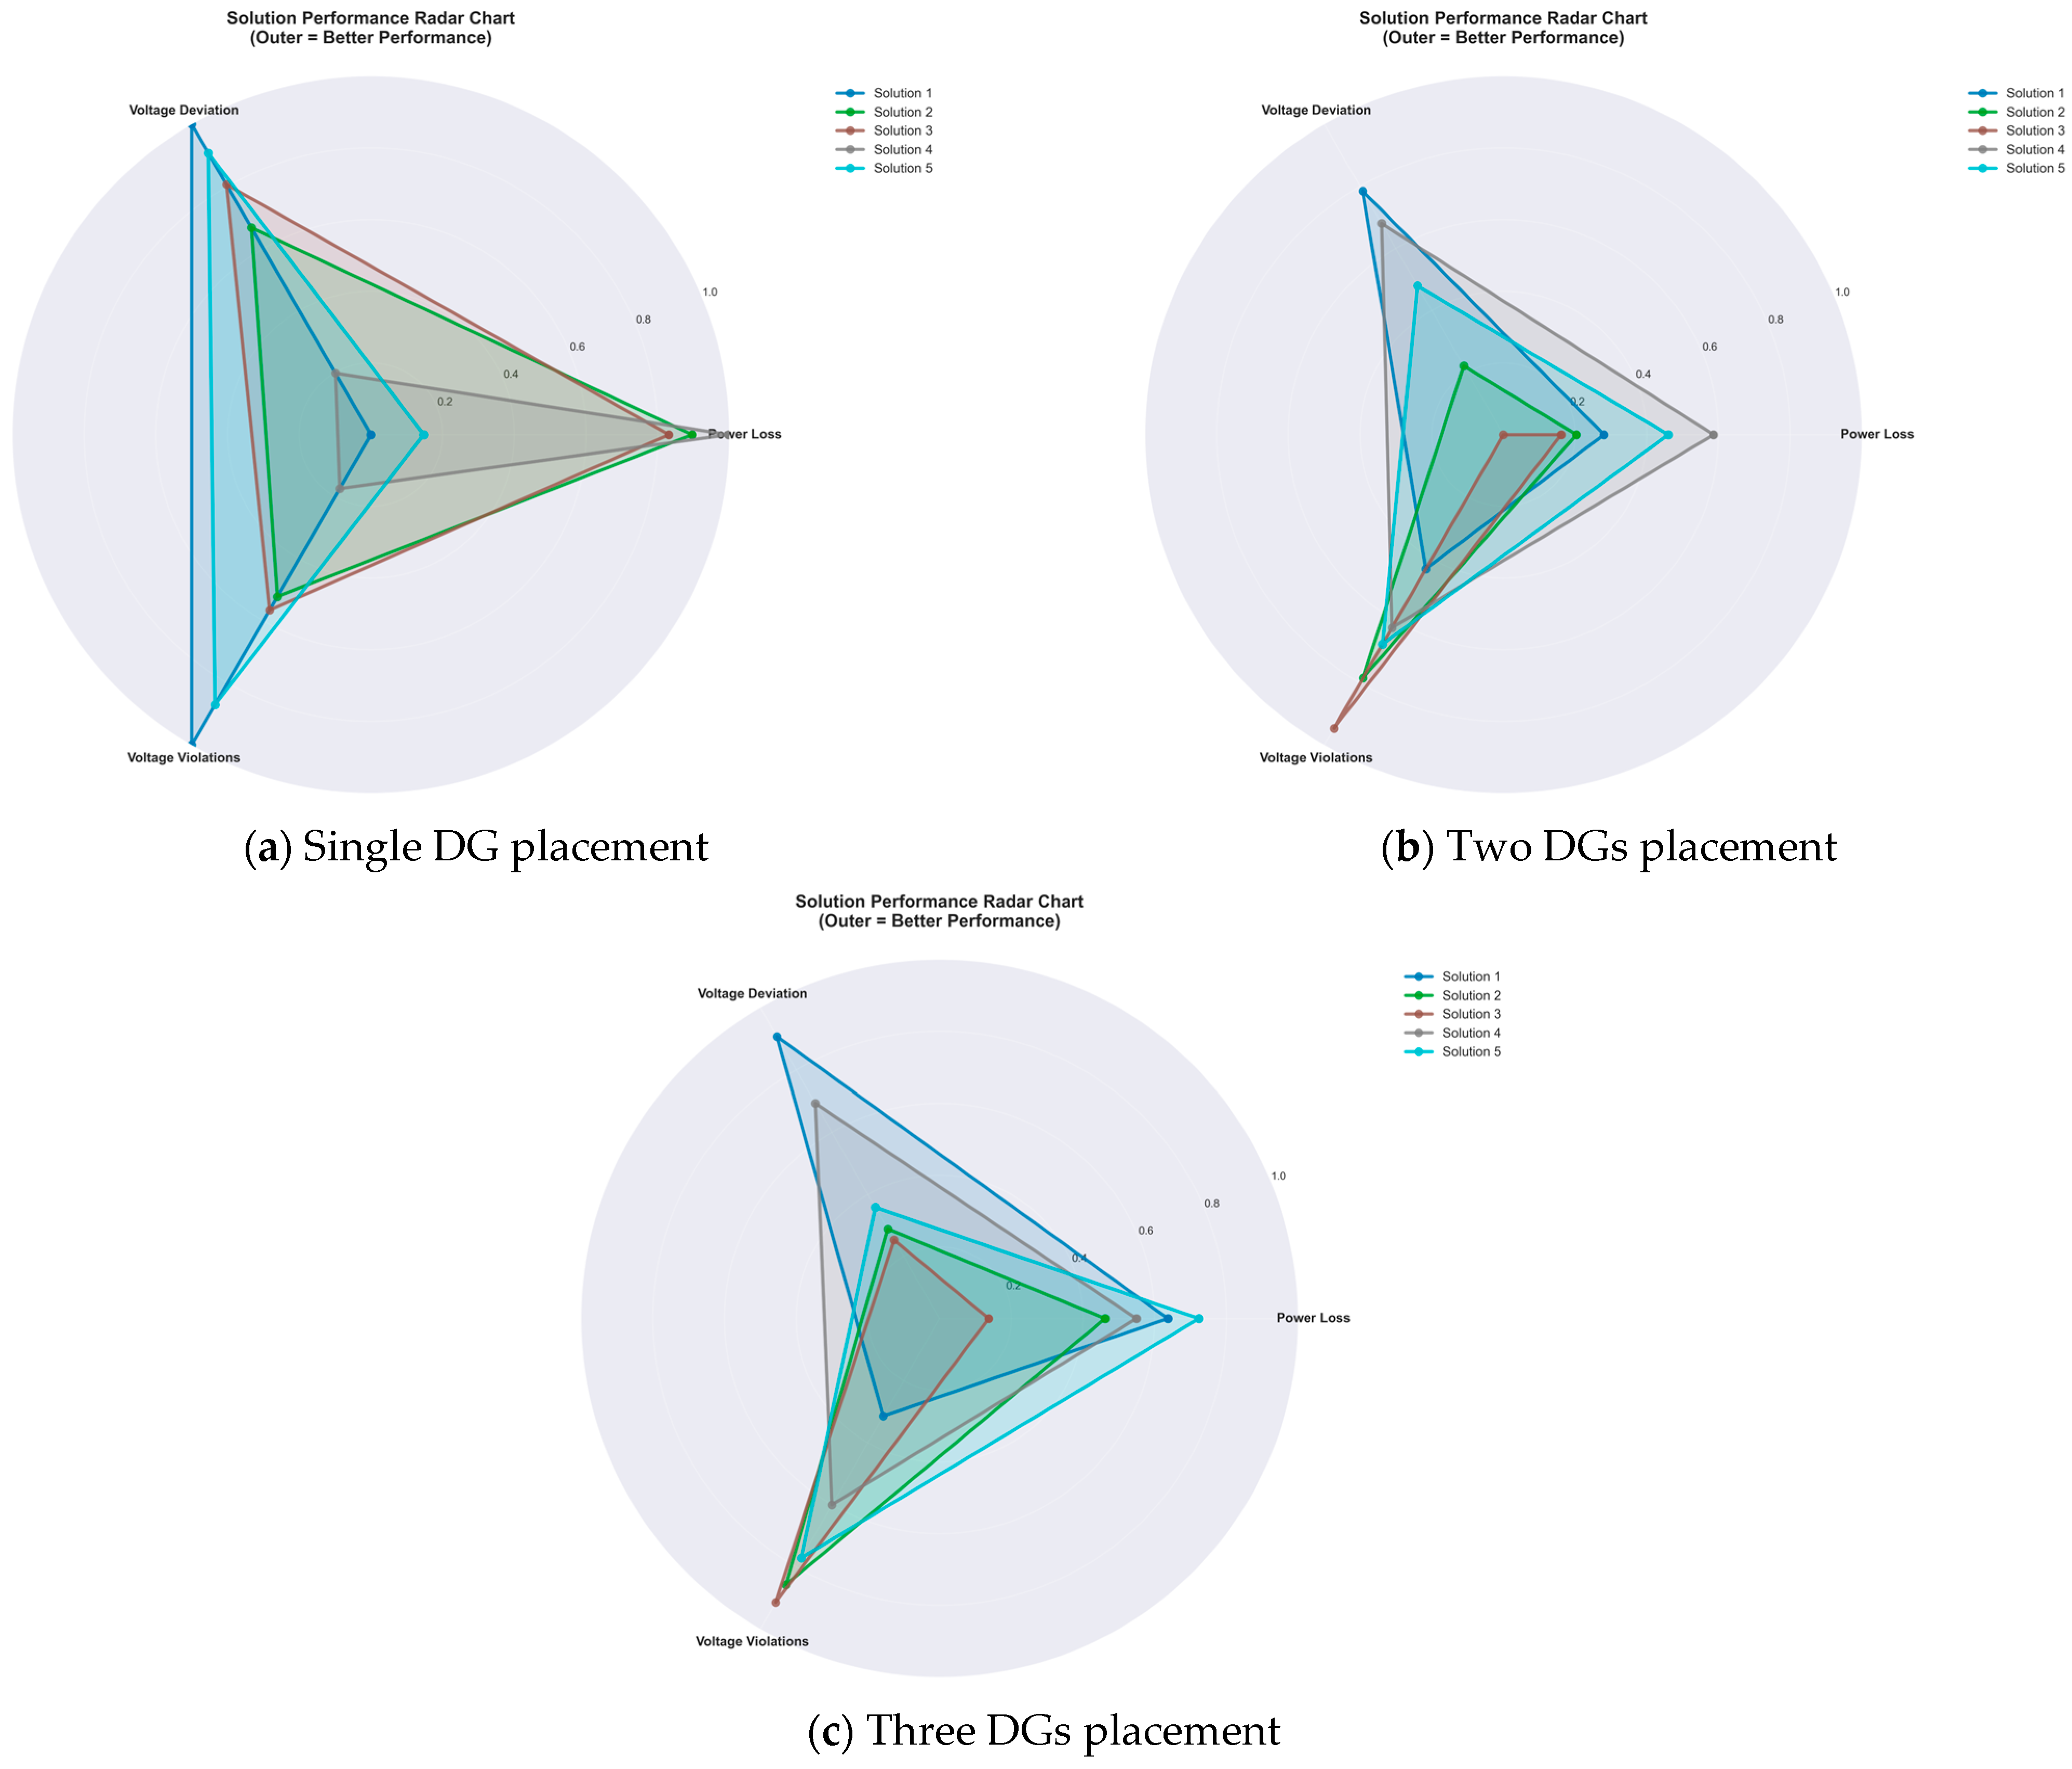
  • Comparison of the normalized performance comparison (Radar plot).
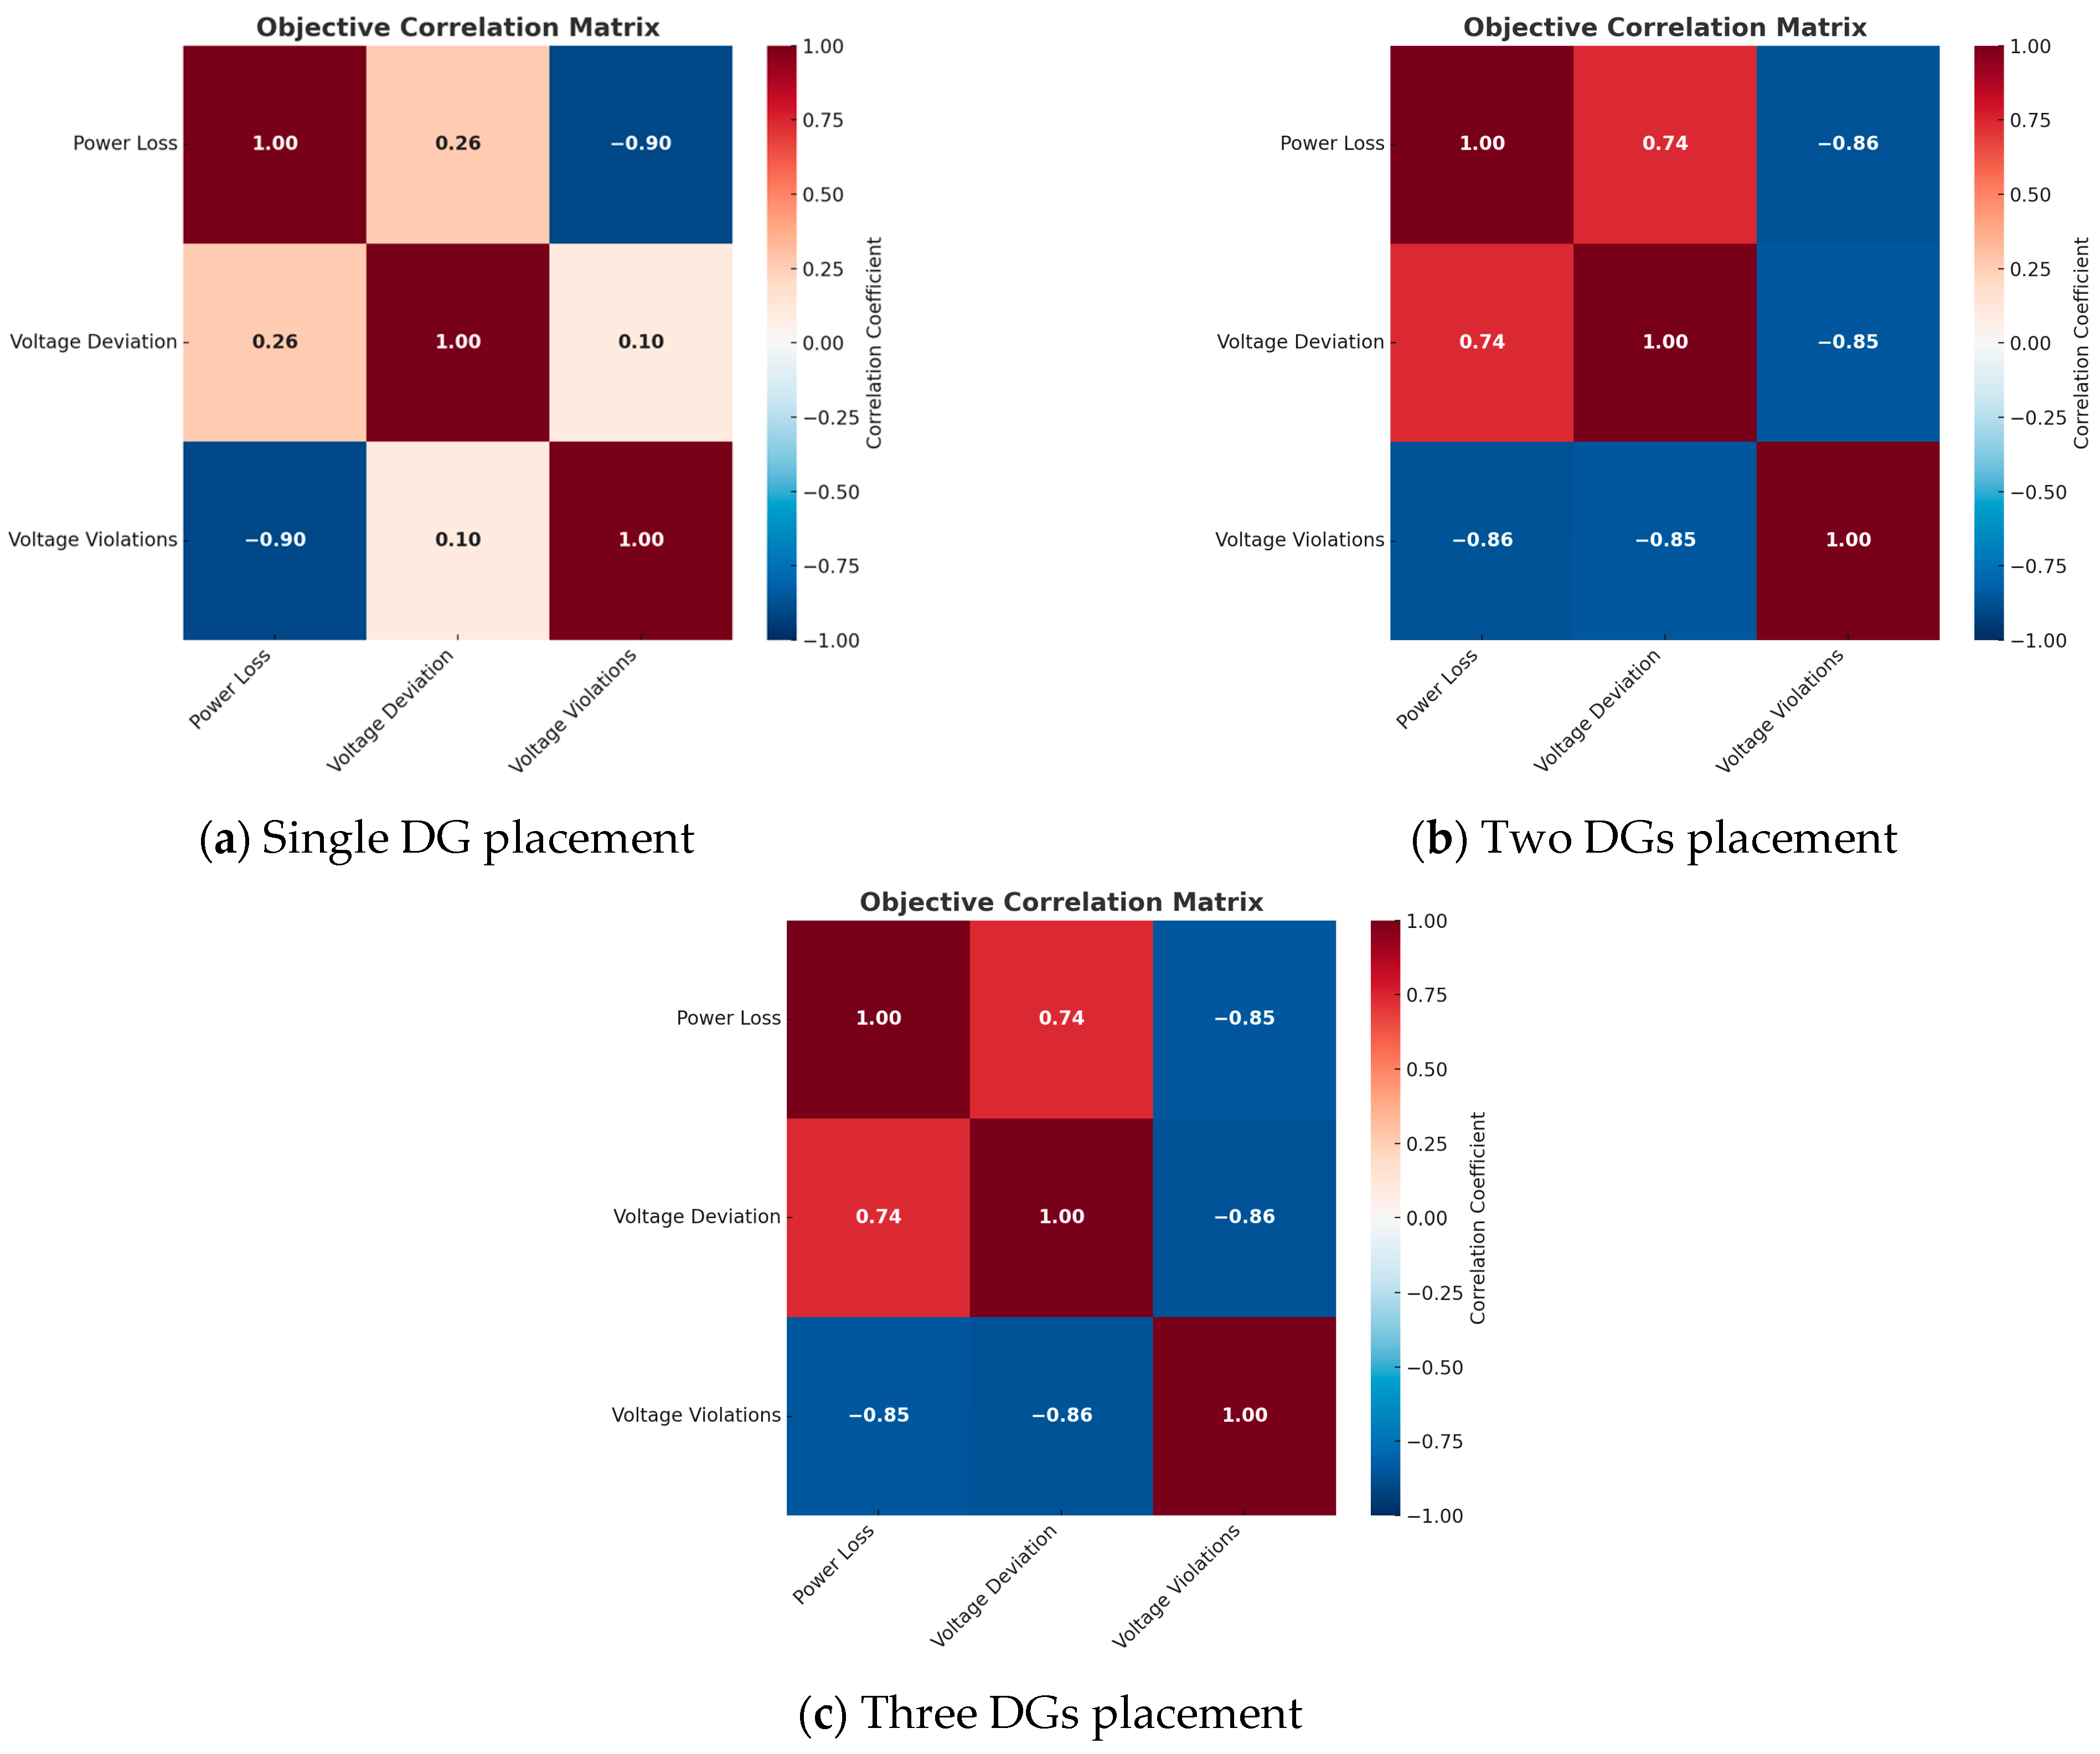
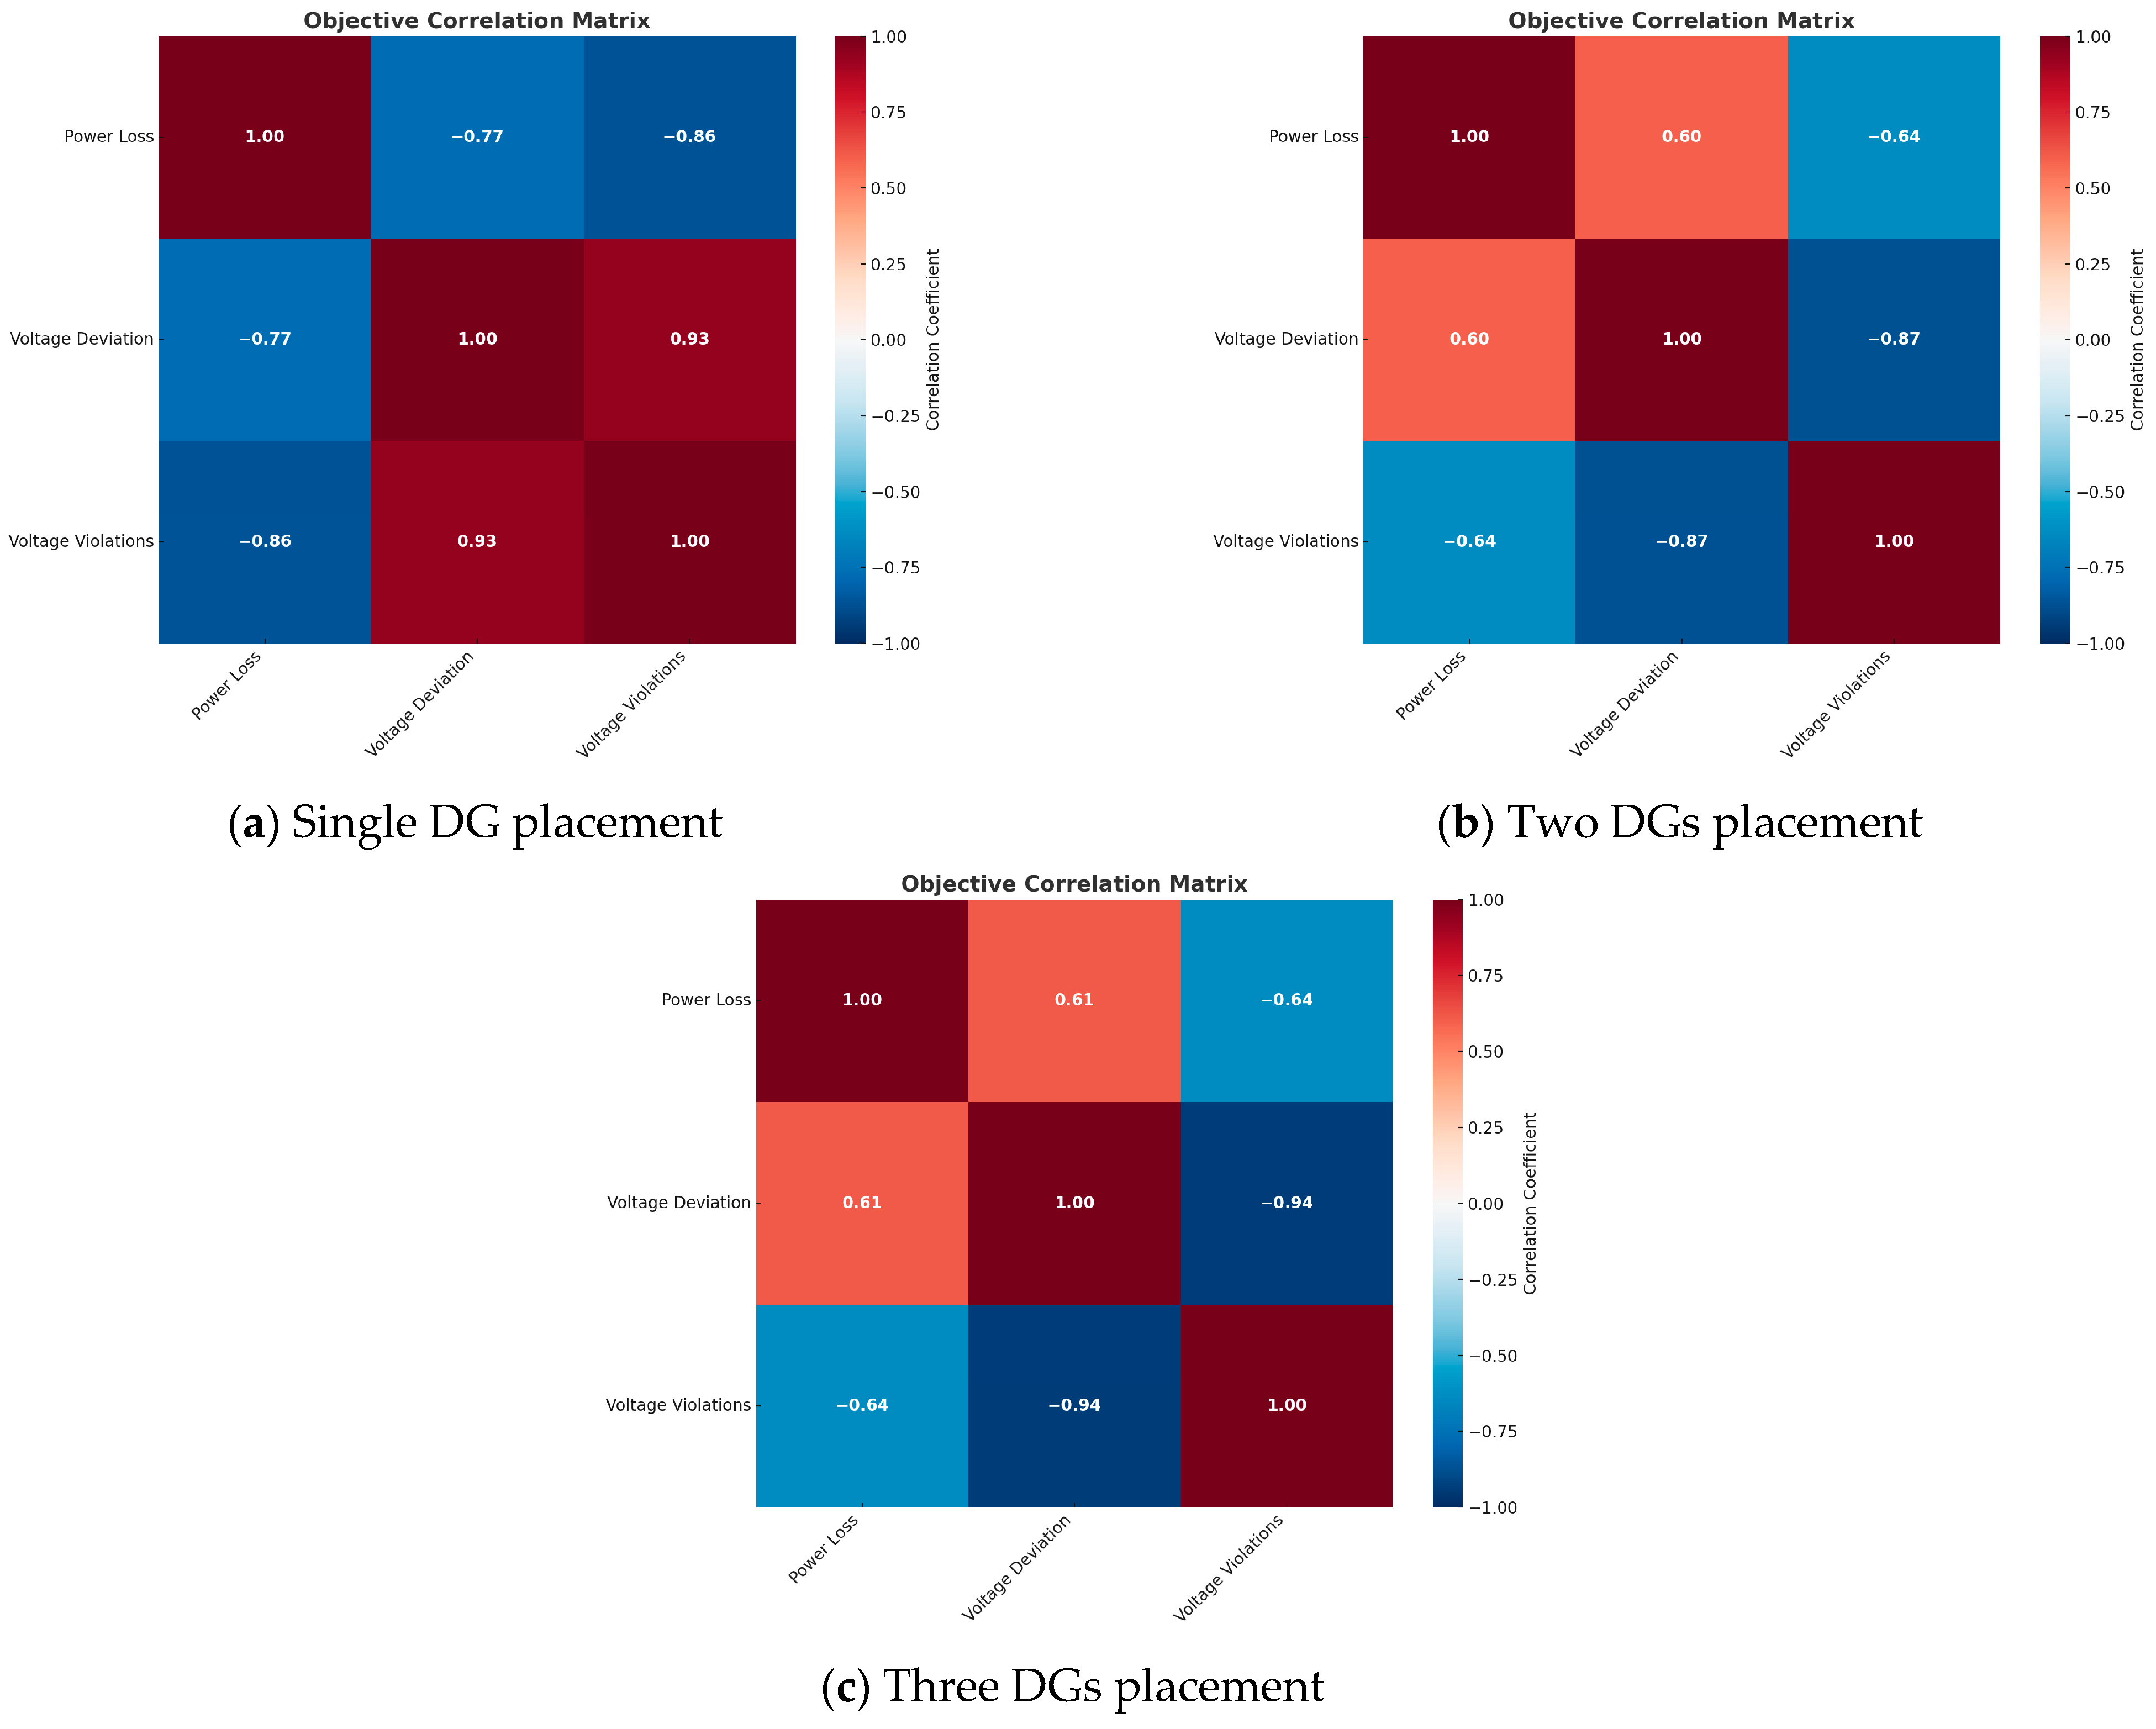
  • Comparison of the objective function correlation matrix.
  • Comparison of all performances and results.

4. Simulation Results

This section is organized into subheadings for clarity. It presents a concise and precise analysis of the simulation results, including their interpretation and the conclusions drawn. The results have been processed using normalization techniques to align all metrics such as voltage deviation, total power loss, and voltage violation. They are on a common base scale, ensuring accurate comparison. The FCS power demand and SOC of the battery of E-bus are presented by Figure 4. The scenario-based comparisons are presented as follows.
Figure 4 shows the interaction between the power demand of flash charging stations (FCSs) and the state of charge (SOC) of electric buses (E-buses) over a 90 min period in the radial distribution systems. Figure 4a shows the aggregate power usage of all-flash charging stations (in kW). Each sharp spike signifies a rapid charging event when an E-bus interfaces with the charger. These sporadic occurrences vary in time and intensity, illustrating the fluidity of on-route charging activity. Figure 4b shows the state of charge (SOC) characteristics of three electric buses (E-Bus 1, E-Bus 2, E-Bus 3) during a concurrent 90 min interval. The State of Charge (SOC) decreases as each bus expends energy during transit and escalates suddenly after each rapid charge, producing a sawtooth pattern. This graphic shows how flash charging sustains a state of charge within operating parameters while generating significant but controllable peaks in power consumption at the charging stations.

4.1. Comparison of the Simulation Results in 2D Plot

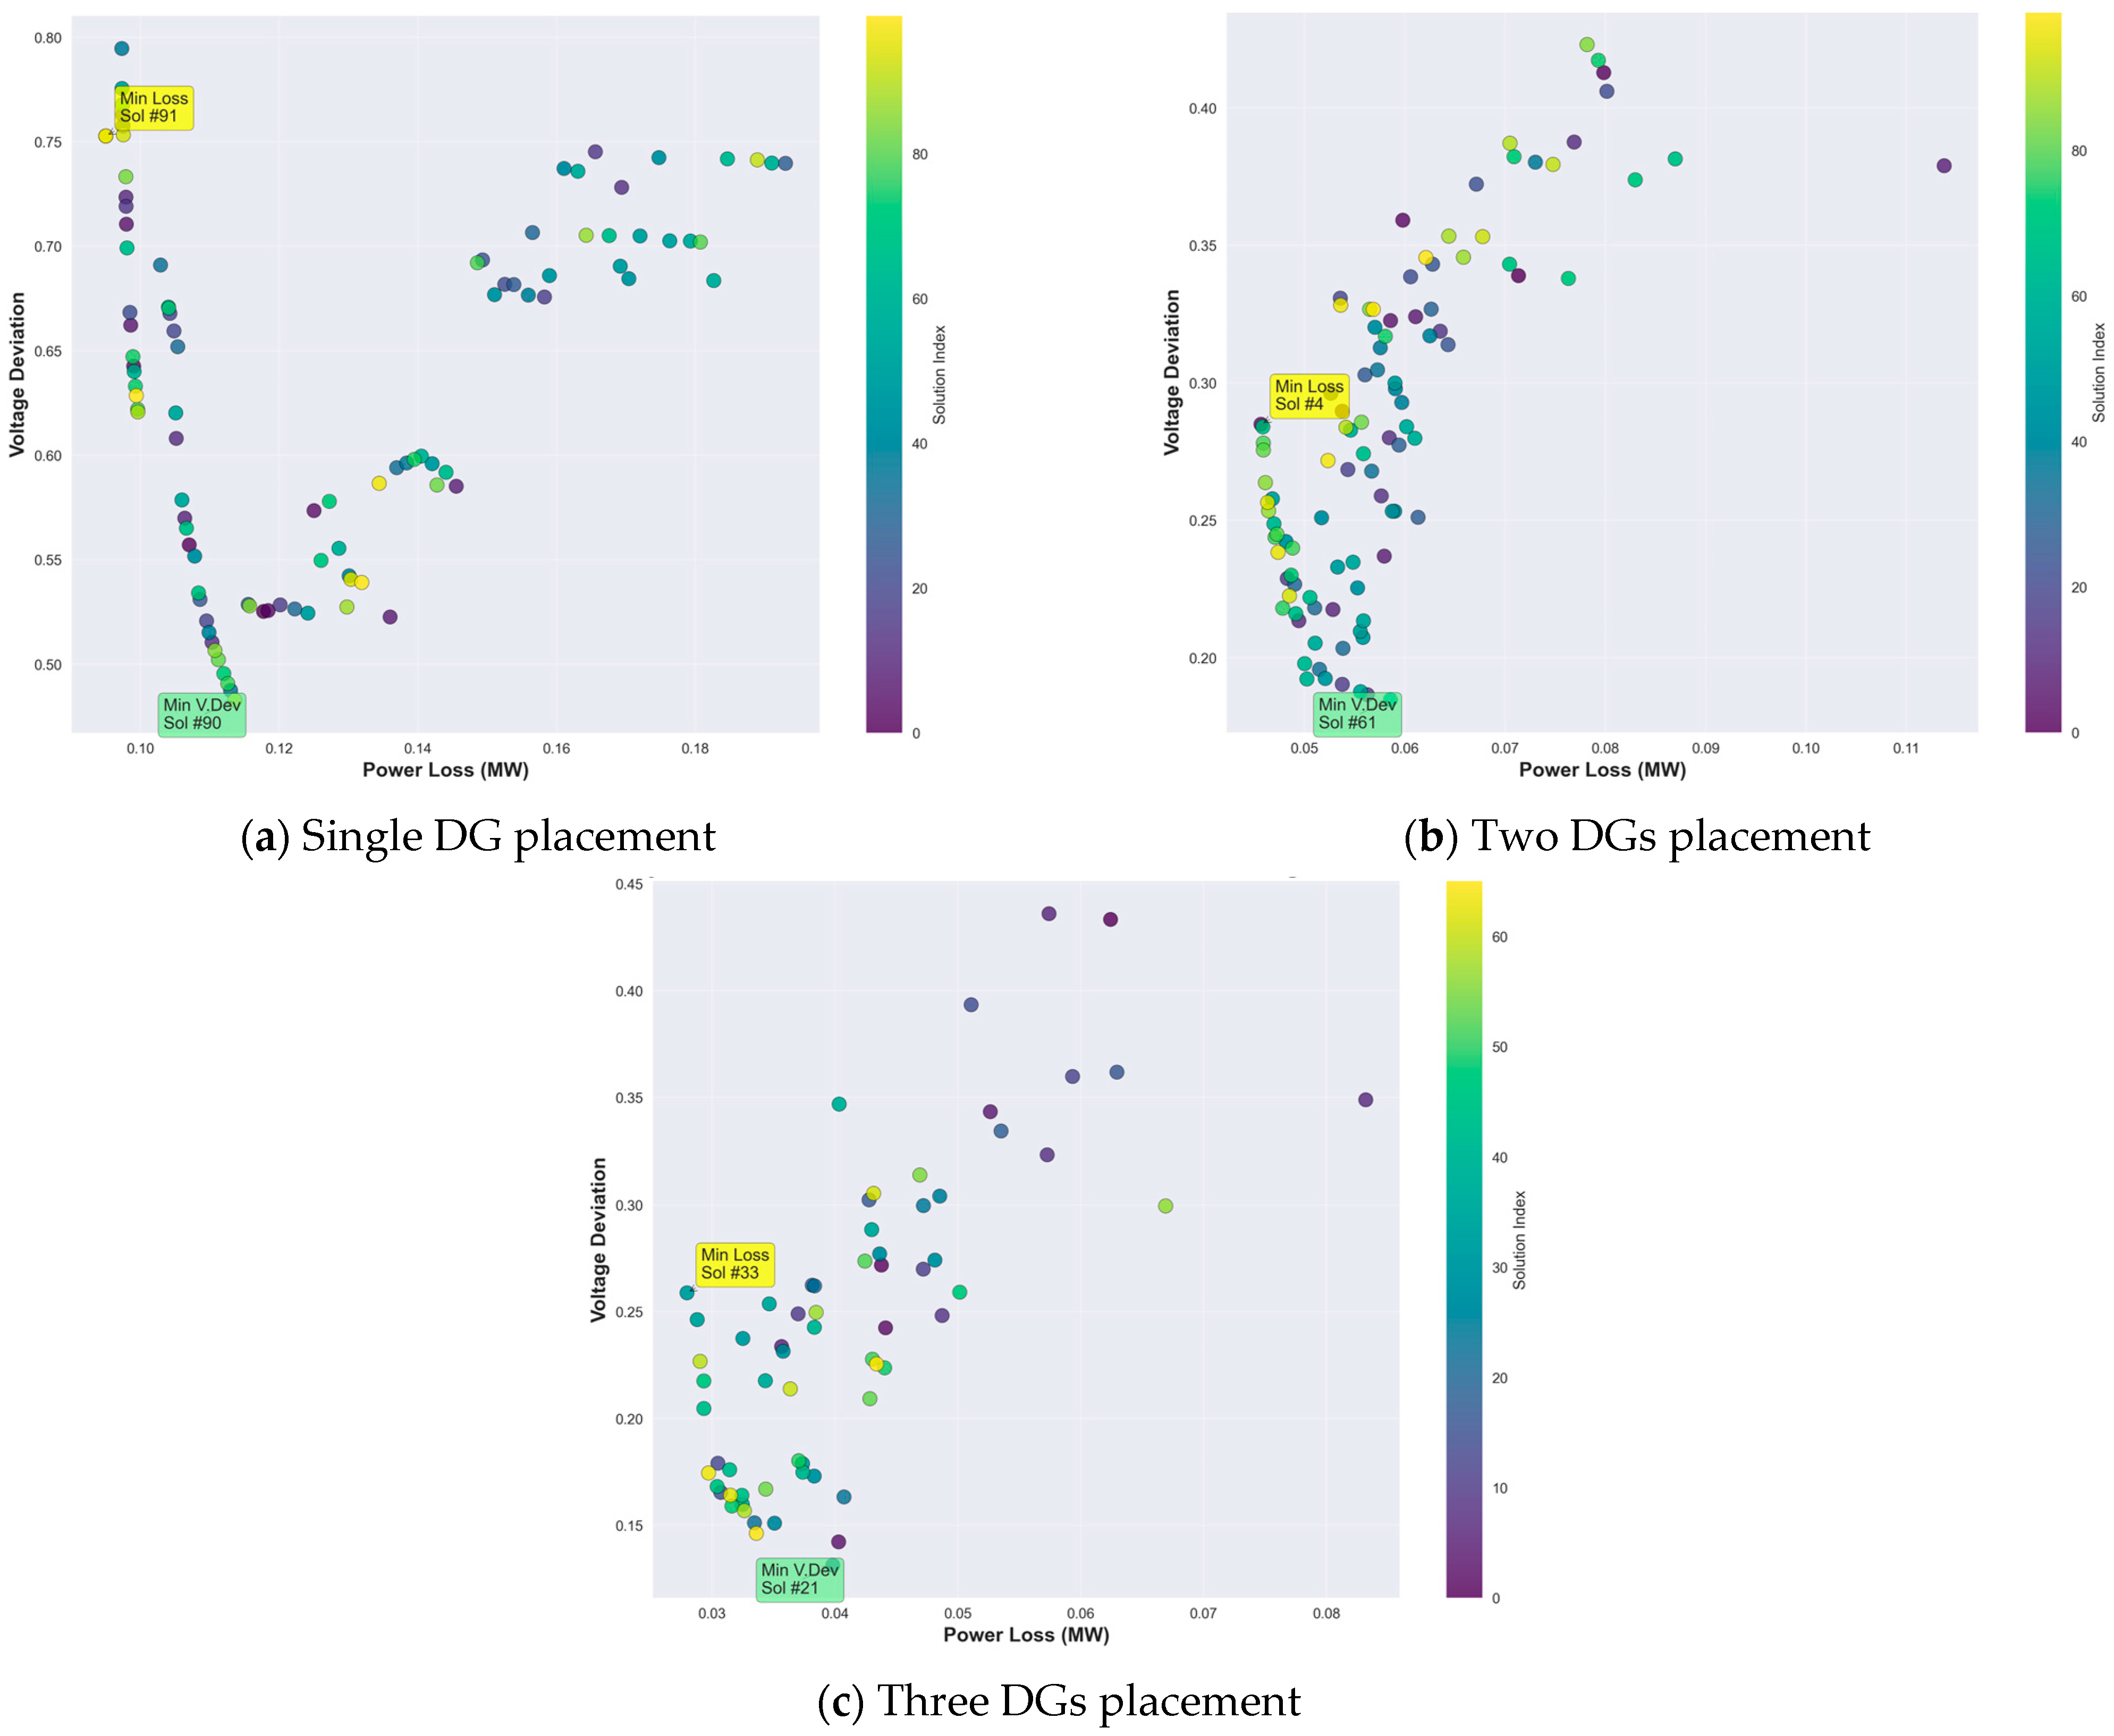
4.1.1. Comparison of the Total Power Loss and Voltage Deviation of the IEEE 33 Bus and IEEE 69 Bus Testing System

Figure 5 presents the Pareto front solutions in terms of total power loss and voltage deviation for the IEEE 33-bus distribution system under three DG placement scenarios: (a) single DG, (b) two DGs, and (c) three DGs. The comparison among MOGWO, MOPSO, and NSGA-II highlights the performance trade-offs between the two objectives. In all scenarios, MOGWO consistently outperformed the other algorithms by producing Pare-to-optimal solutions that exhibited lower power losses and voltage deviations. As the number of DGs increased from one to three, the solution sets improved in both metrics, with the three-DG case (Figure 5c) showing the most compact and optimal front. MOPSO resulted in a wider distribution of solutions, indicating less consistency and suboptimal performance. NSGA-II showed moderate behavior, but its solutions were dominated by those from MOGWO in most cases. These observations confirm the robustness of MOG-WO in generating high-quality multi-objective solutions for DG planning in unbalanced distribution systems.
Figure 6 shows the 2D Pareto front comparison between total power loss and voltage deviation for the IEEE 69-bus system under single, two, and three DG placement scenarios. As the number of DGs increases, the Pareto front shifts closer to the origin, indicating improved trade-offs. In the single DG case, the front is narrow with limited diversity, while the two and three DG scenarios show denser and more optimal distributions. Notably, the three DG cases achieve the lowest values in both objectives, confirming that multi-DG placement significantly enhances voltage profile and reduces system losses.

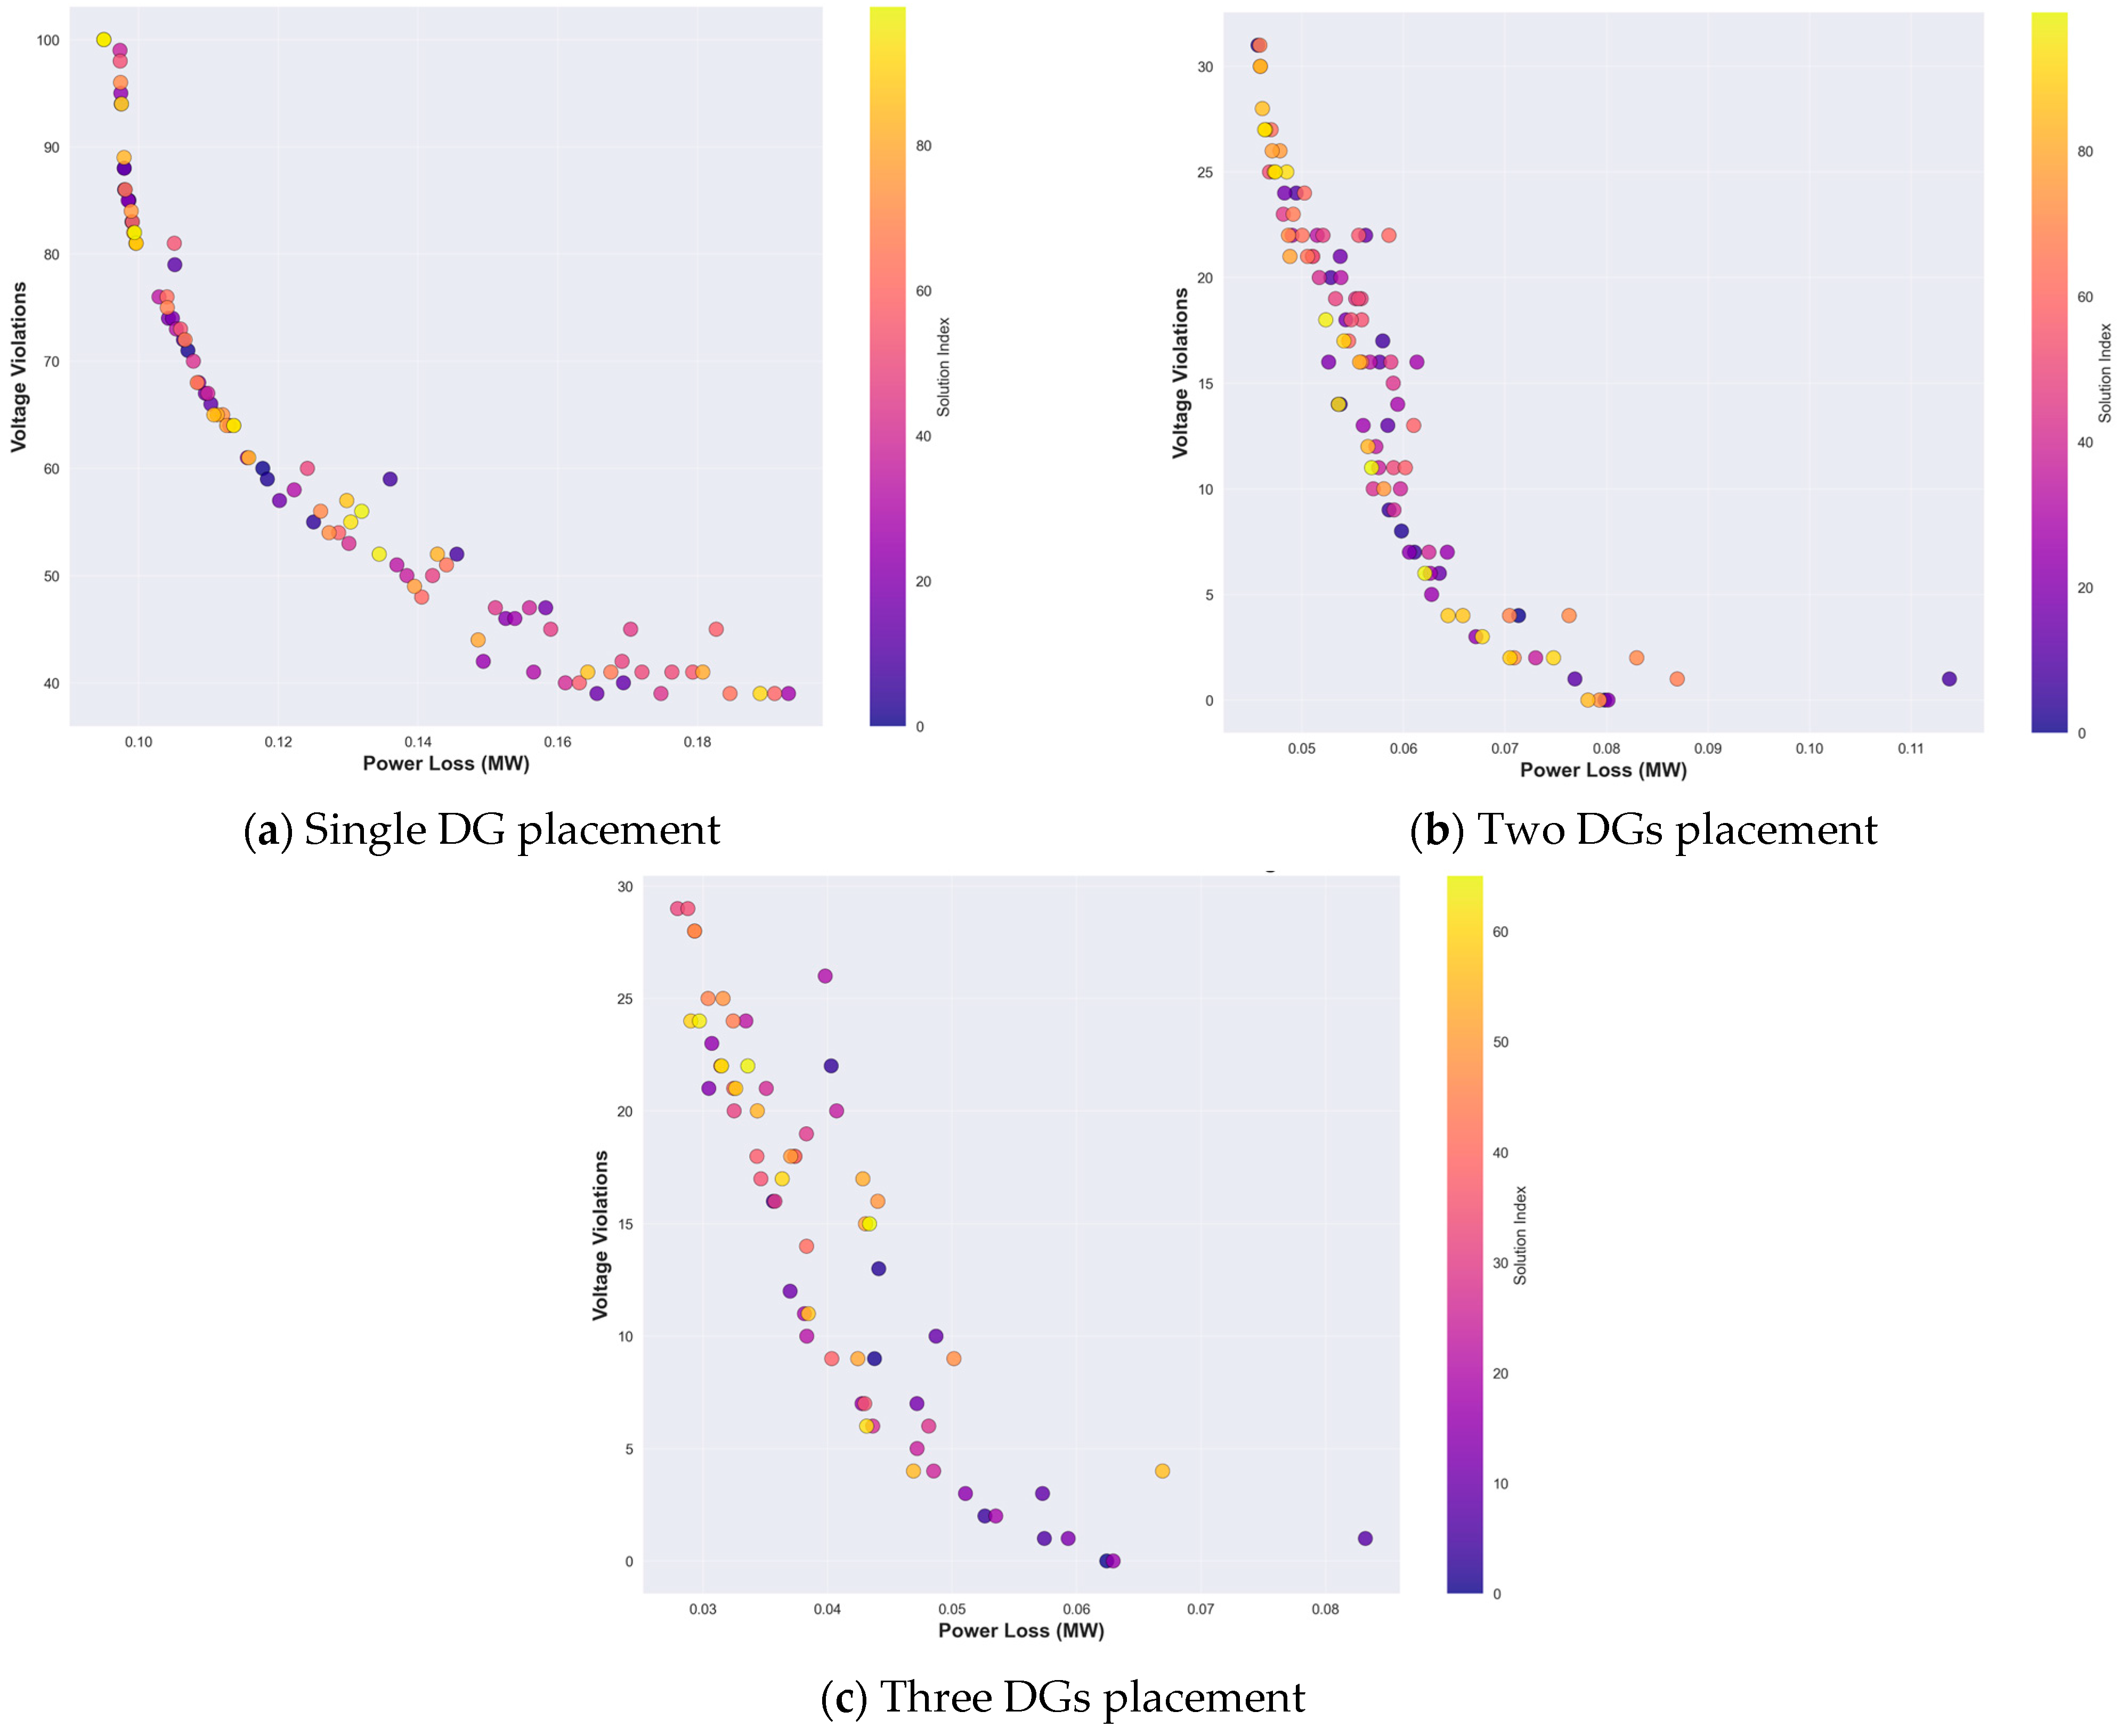
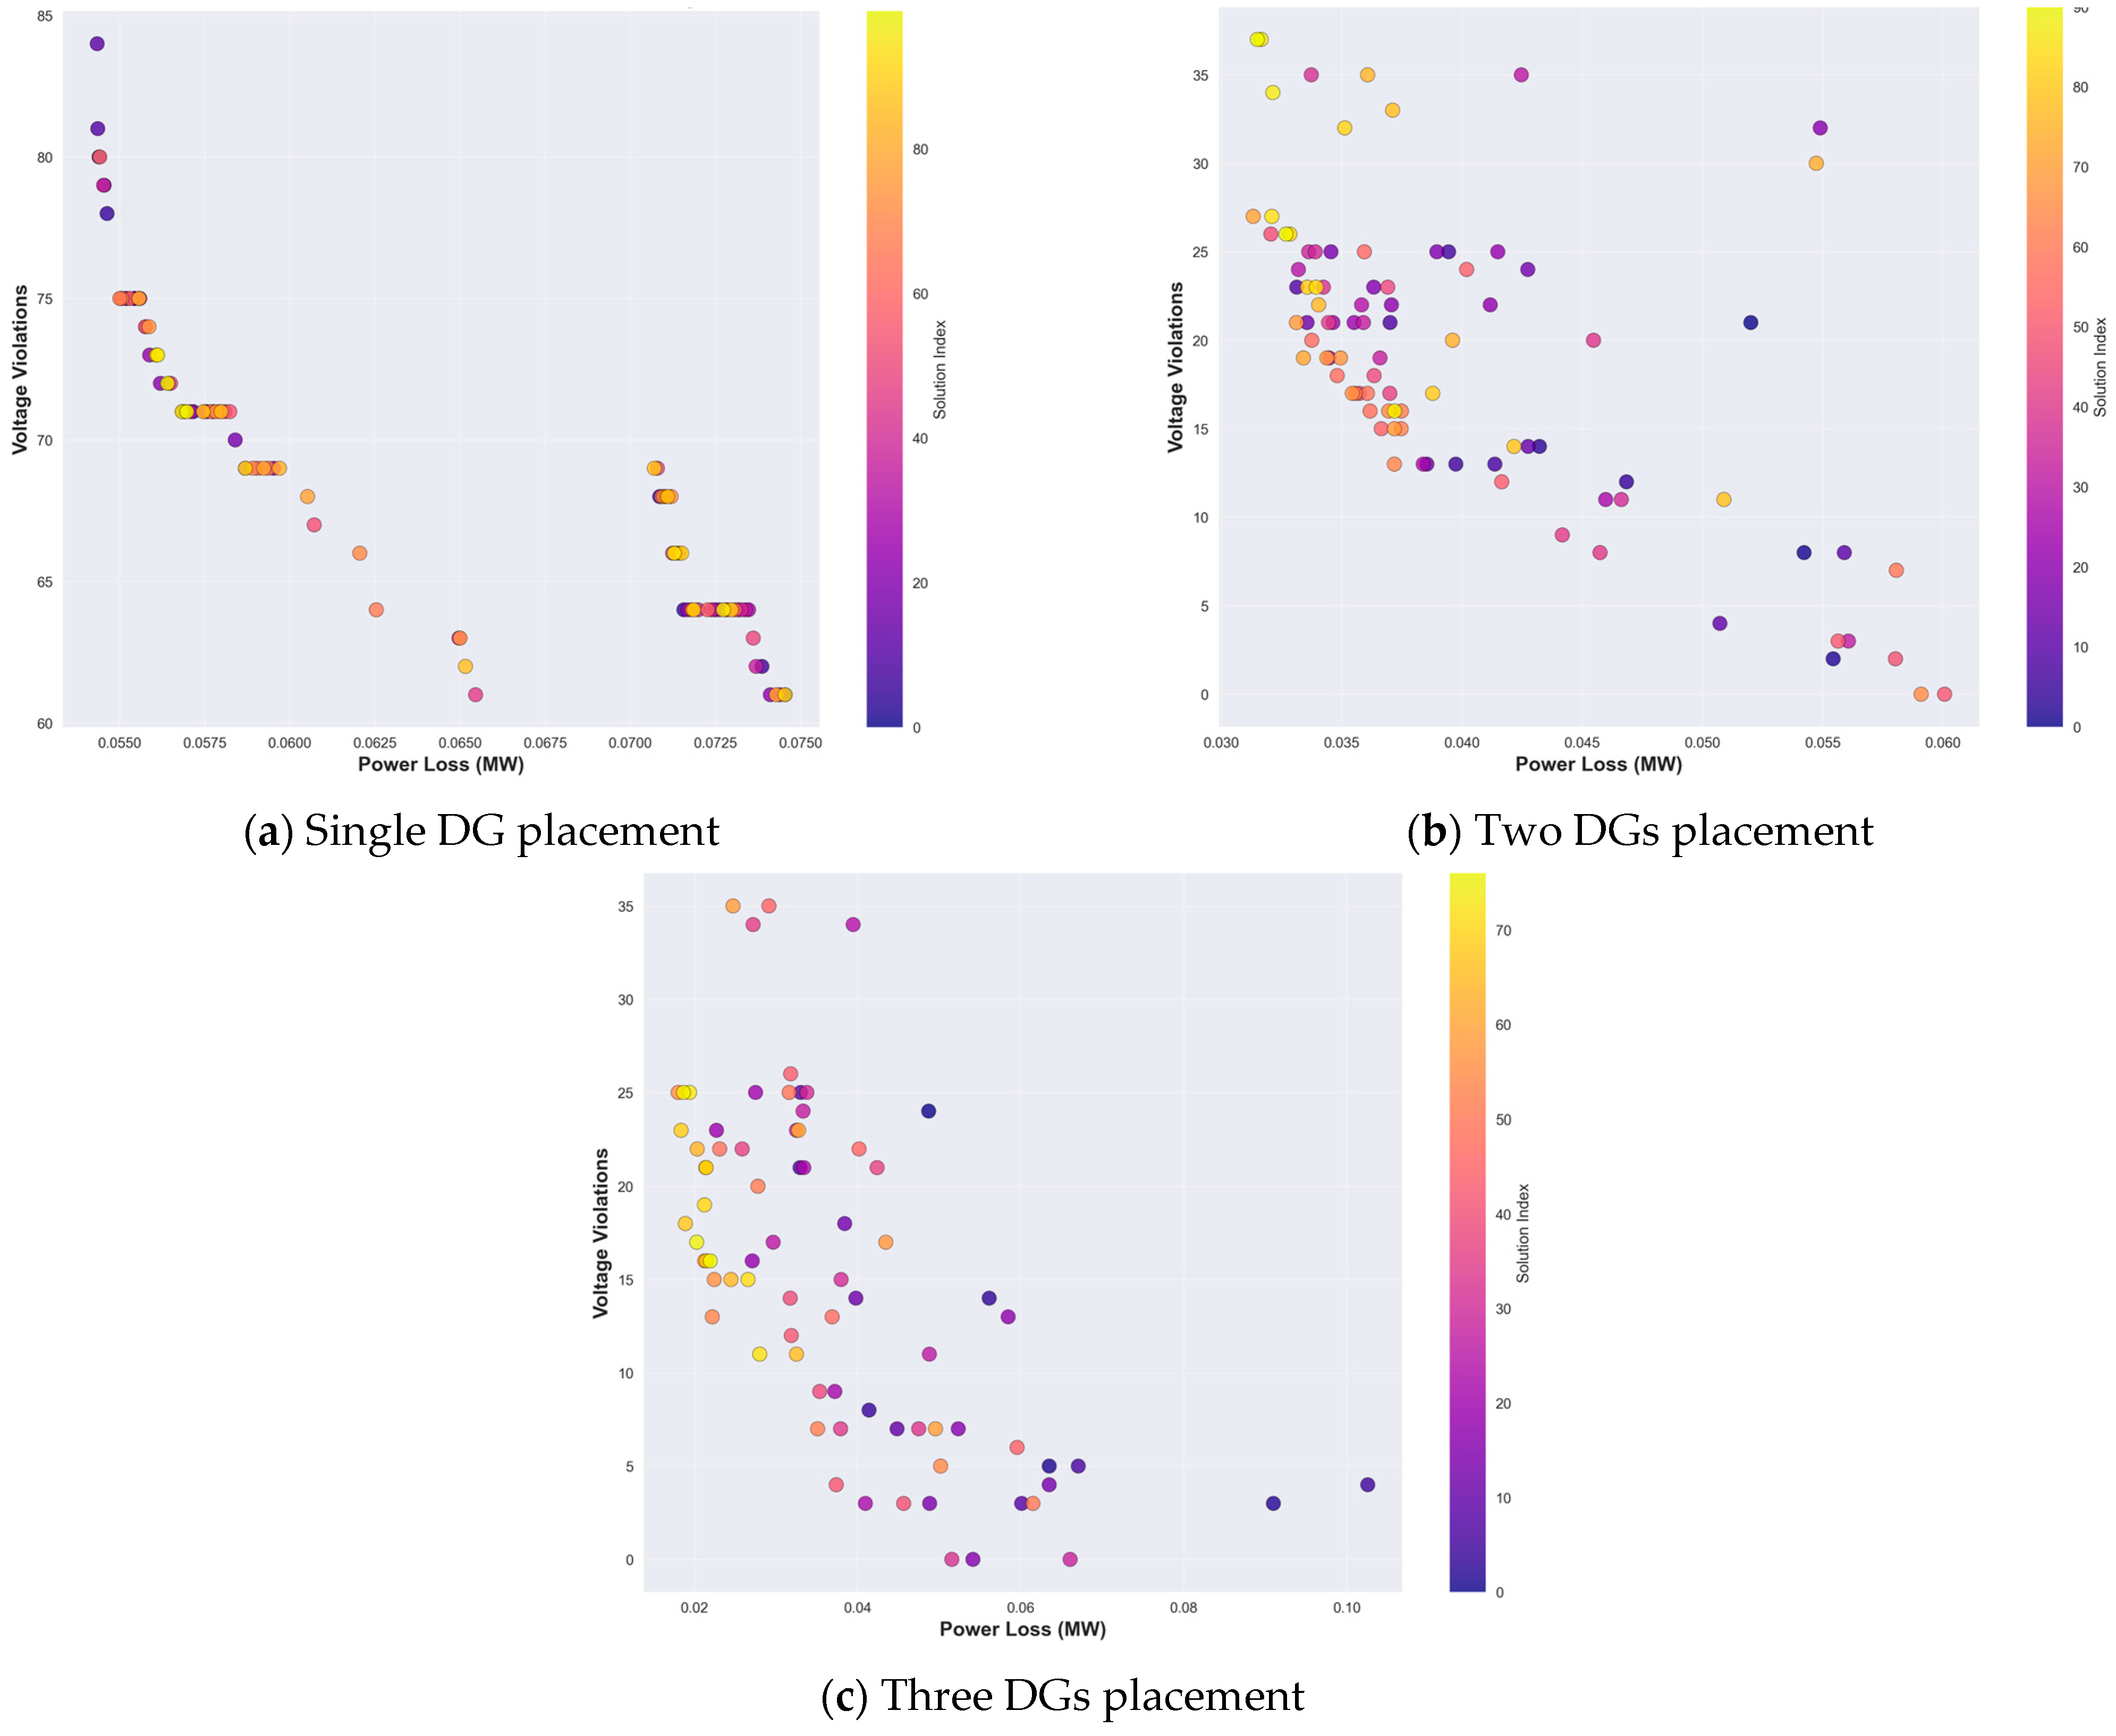
4.1.2. Comparison of the Total Power Loss and Voltage Violation

Figure 7 presents the Pareto front distributions of total power loss versus voltage violations for the IEEE 33-bus system under different DG placement scenarios: (a) single DG, (b) two DGs, and (c) three DGs. In the single DG case, solutions are clustered in the higher range of both power loss (0.20–0.22 MW) and voltage violations (58–70), indicating limited improvement due to insufficient reactive support. With two DGs, the Pareto front shifts significantly left and downward, reducing power loss to 0.11–0.13 MW and violations to 7–18, showing improved optimization flexibility. The three DG case offers the best performance, with power loss reaching 0.10 MW and violations reduced below 5. The expanded front in this case demonstrates enhanced trade-off diversity, allowing operators to balance efficiency and reliability based on operational priorities.
Figure 8 shows the 2D Pareto fronts comparing total power loss and voltage violations in the IEEE 69-bus distribution system for single, two, and three DG placement scenarios. In the single DG case (Figure 8a), solutions are concentrated in the higher range of both power loss (0.065–0.075 MW) and voltage violations (60–85), indicating limited effectiveness. With two DGs (Figure 8b), the Pareto front improves notably, reducing power loss to 0.040–0.060 MW and violations to below 35, showing more flexible trade-offs. The three DG cases (Figure 8c) exhibit the best performance, with power loss as low as 0.020 MW and voltage violations reduced to below 5. This progression confirms that increasing DG units enhances network reliability, voltage compliance, and optimization diversity.

4.1.3. Comparison of the Total Voltage Deviation and Voltage Violation

Figure 9 shows the 2D Pareto fronts comparing total power loss and voltage violations in the IEEE 69-bus distribution system for single, two, and three DG placement scenarios. In the single DG case (Figure 8a), solutions are concentrated in the higher range of both power loss (0.065–0.075 MW) and voltage violations (60–85), indicating limited effectiveness. With two DGs (Figure 8b), the Pareto front improves notably, reducing power loss to 0.040–0.060 MW and violations to below 35, showing more flexible trade-offs. The three DG case (Figure 8c) exhibit the best performance, with power loss as low as 0.020 MW and voltage violations reduced to below 5. This progression confirms that increasing DG units en-hances network reliability, voltage compliance, and optimization diversity.
Figure 10 presents the 2D Pareto fronts comparing voltage deviation and voltage violations for the IEEE 69-bus distribution system under single, two, and three DG placement scenarios. In the single DG case (Figure 10a), solutions are concentrated in a narrow range with high violations (65–85) and elevated voltage deviations, highlighting limited capability to enhance voltage quality. The two DG scenarios (Figure 10b) demonstrate a wider spread of trade-off solutions, reducing violations to below 35 and achieving better deviation control, indicating enhanced system flexibility. In the three DG cases (Figure 10c), the Pareto front shifts further left and downward, showing clear performance improvements with voltage violations reduced to near zero and voltage deviations significantly mini-mazed. These results confirm that increasing the number of DGs improves voltage regulation and violation mitigation, while expanding the decision space for network planning under high EV penetration conditions.

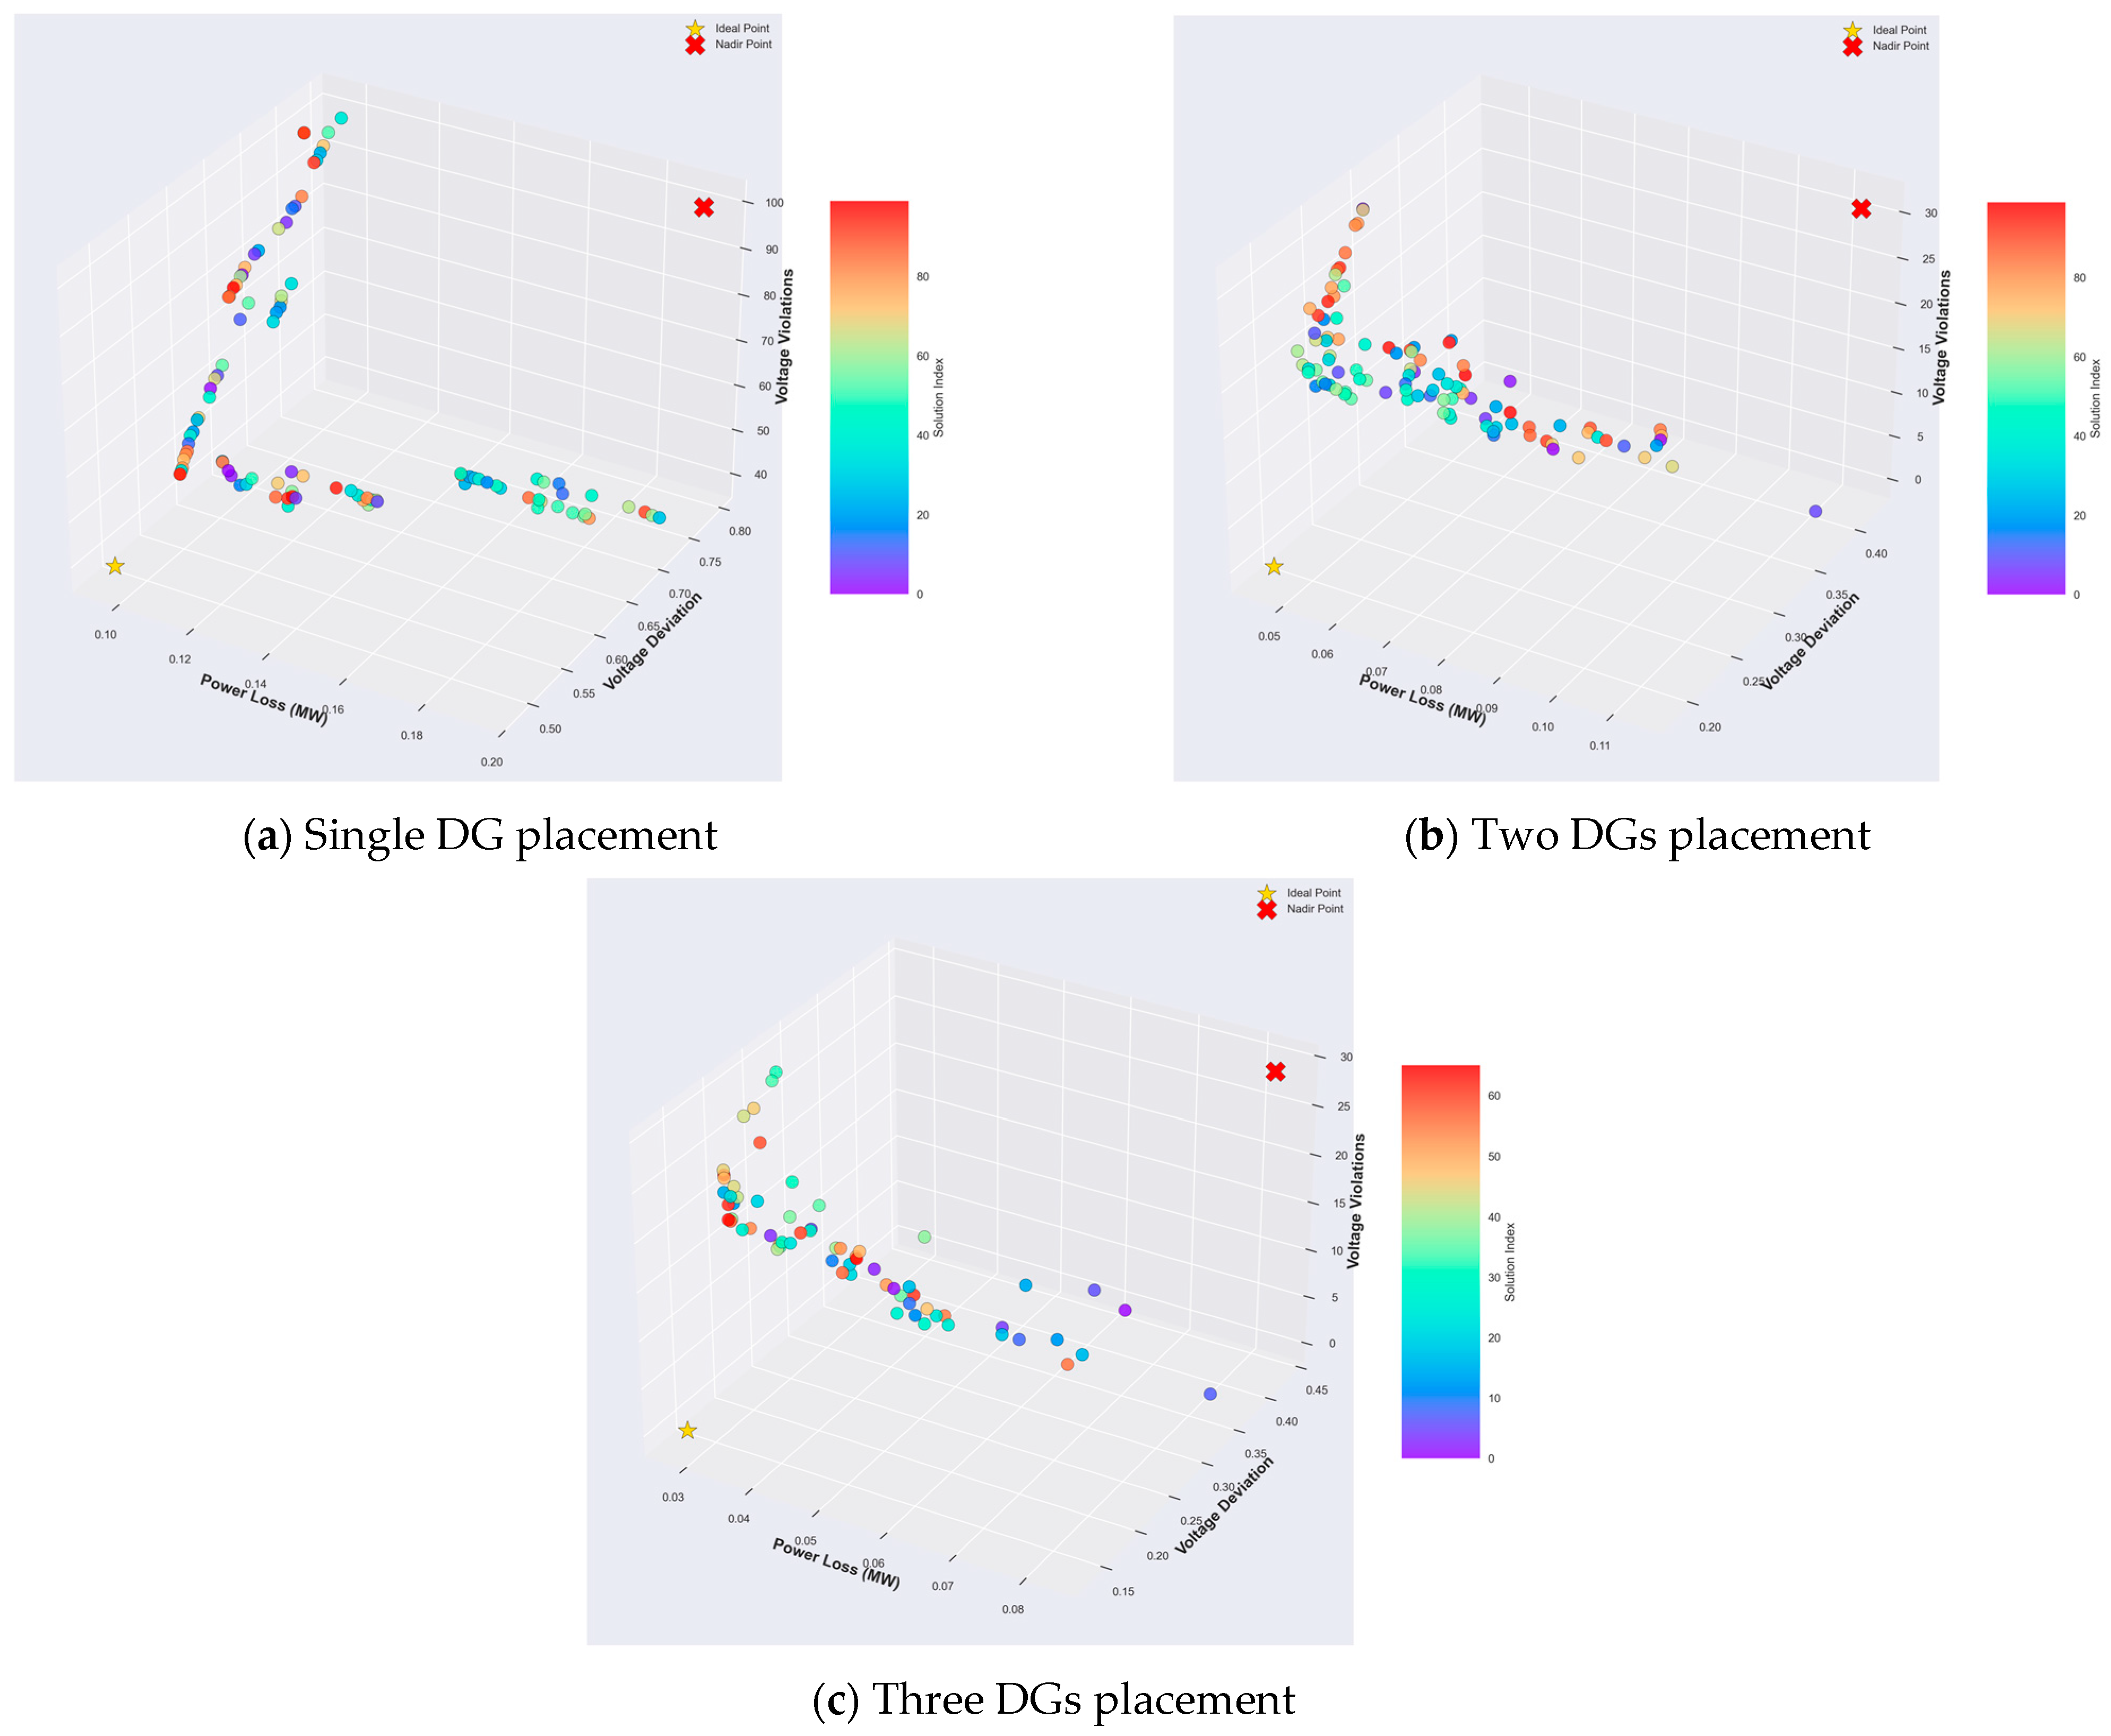
4.2. Comparison of the Simulation Results in 3D Plot

Figure 11 displays the 3D Pareto fronts of total power loss, voltage deviation, and voltage violations for the IEEE 33-bus system under single, two, and three DG placement scenarios. In the single DG case (Figure 11a), solutions cluster along a linear path with high values across all objectives, reflecting limited trade-off capability and inadequate optimization flexibility. This indicates that a single DG lacks the degrees of freedom needed to improve system performance meaningfully. In contrast, the two DG scenario (Figure 11b) expands the Pareto front and reduces all objective values, revealing a clear trade-off surface that allows operators to prioritize efficiency and voltage quality. With three DGs (Figure 11c), the Pareto front shifts closer to the ideal point, with several solutions achieving simultaneous minimization of power loss, voltage deviation, and violations. This configuration offers the most balanced and diverse solution set, enhancing overall system re-salience and enabling greater control in multi-objective planning. These results confirm that increasing the number of DG units significantly improves technical performance and operational flexibility in complex distribution networks.
Figure 12 presents the 3D Pareto fronts of total power loss, voltage deviation, and voltage violations for the IEEE 69-bus system under single, two, and three DG placement scenarios. In the single DG case (Figure 12a), solutions are concentrated along a narrow surface with high values in all objectives, showing limited flexibility and poor alignment with the ideal point. This suggests insufficient optimization capacity for resilience or voltage control. In the two DG scenario (Figure 12b), the Pareto front expands and shifts toward the ideal region, with a noticeable reduction in all objectives and greater trade-off diversity, enabling more informed operational decisions. The three DG configurations (Figure 12c) yield the most compact and optimal solution cluster, with several points located near the ideal point, representing simultaneous minimization of power loss, deviation, and violations. This confirms that multi-DG placement significantly improves system resilience, operational efficiency, and optimization flexibility in complex distribution networks.

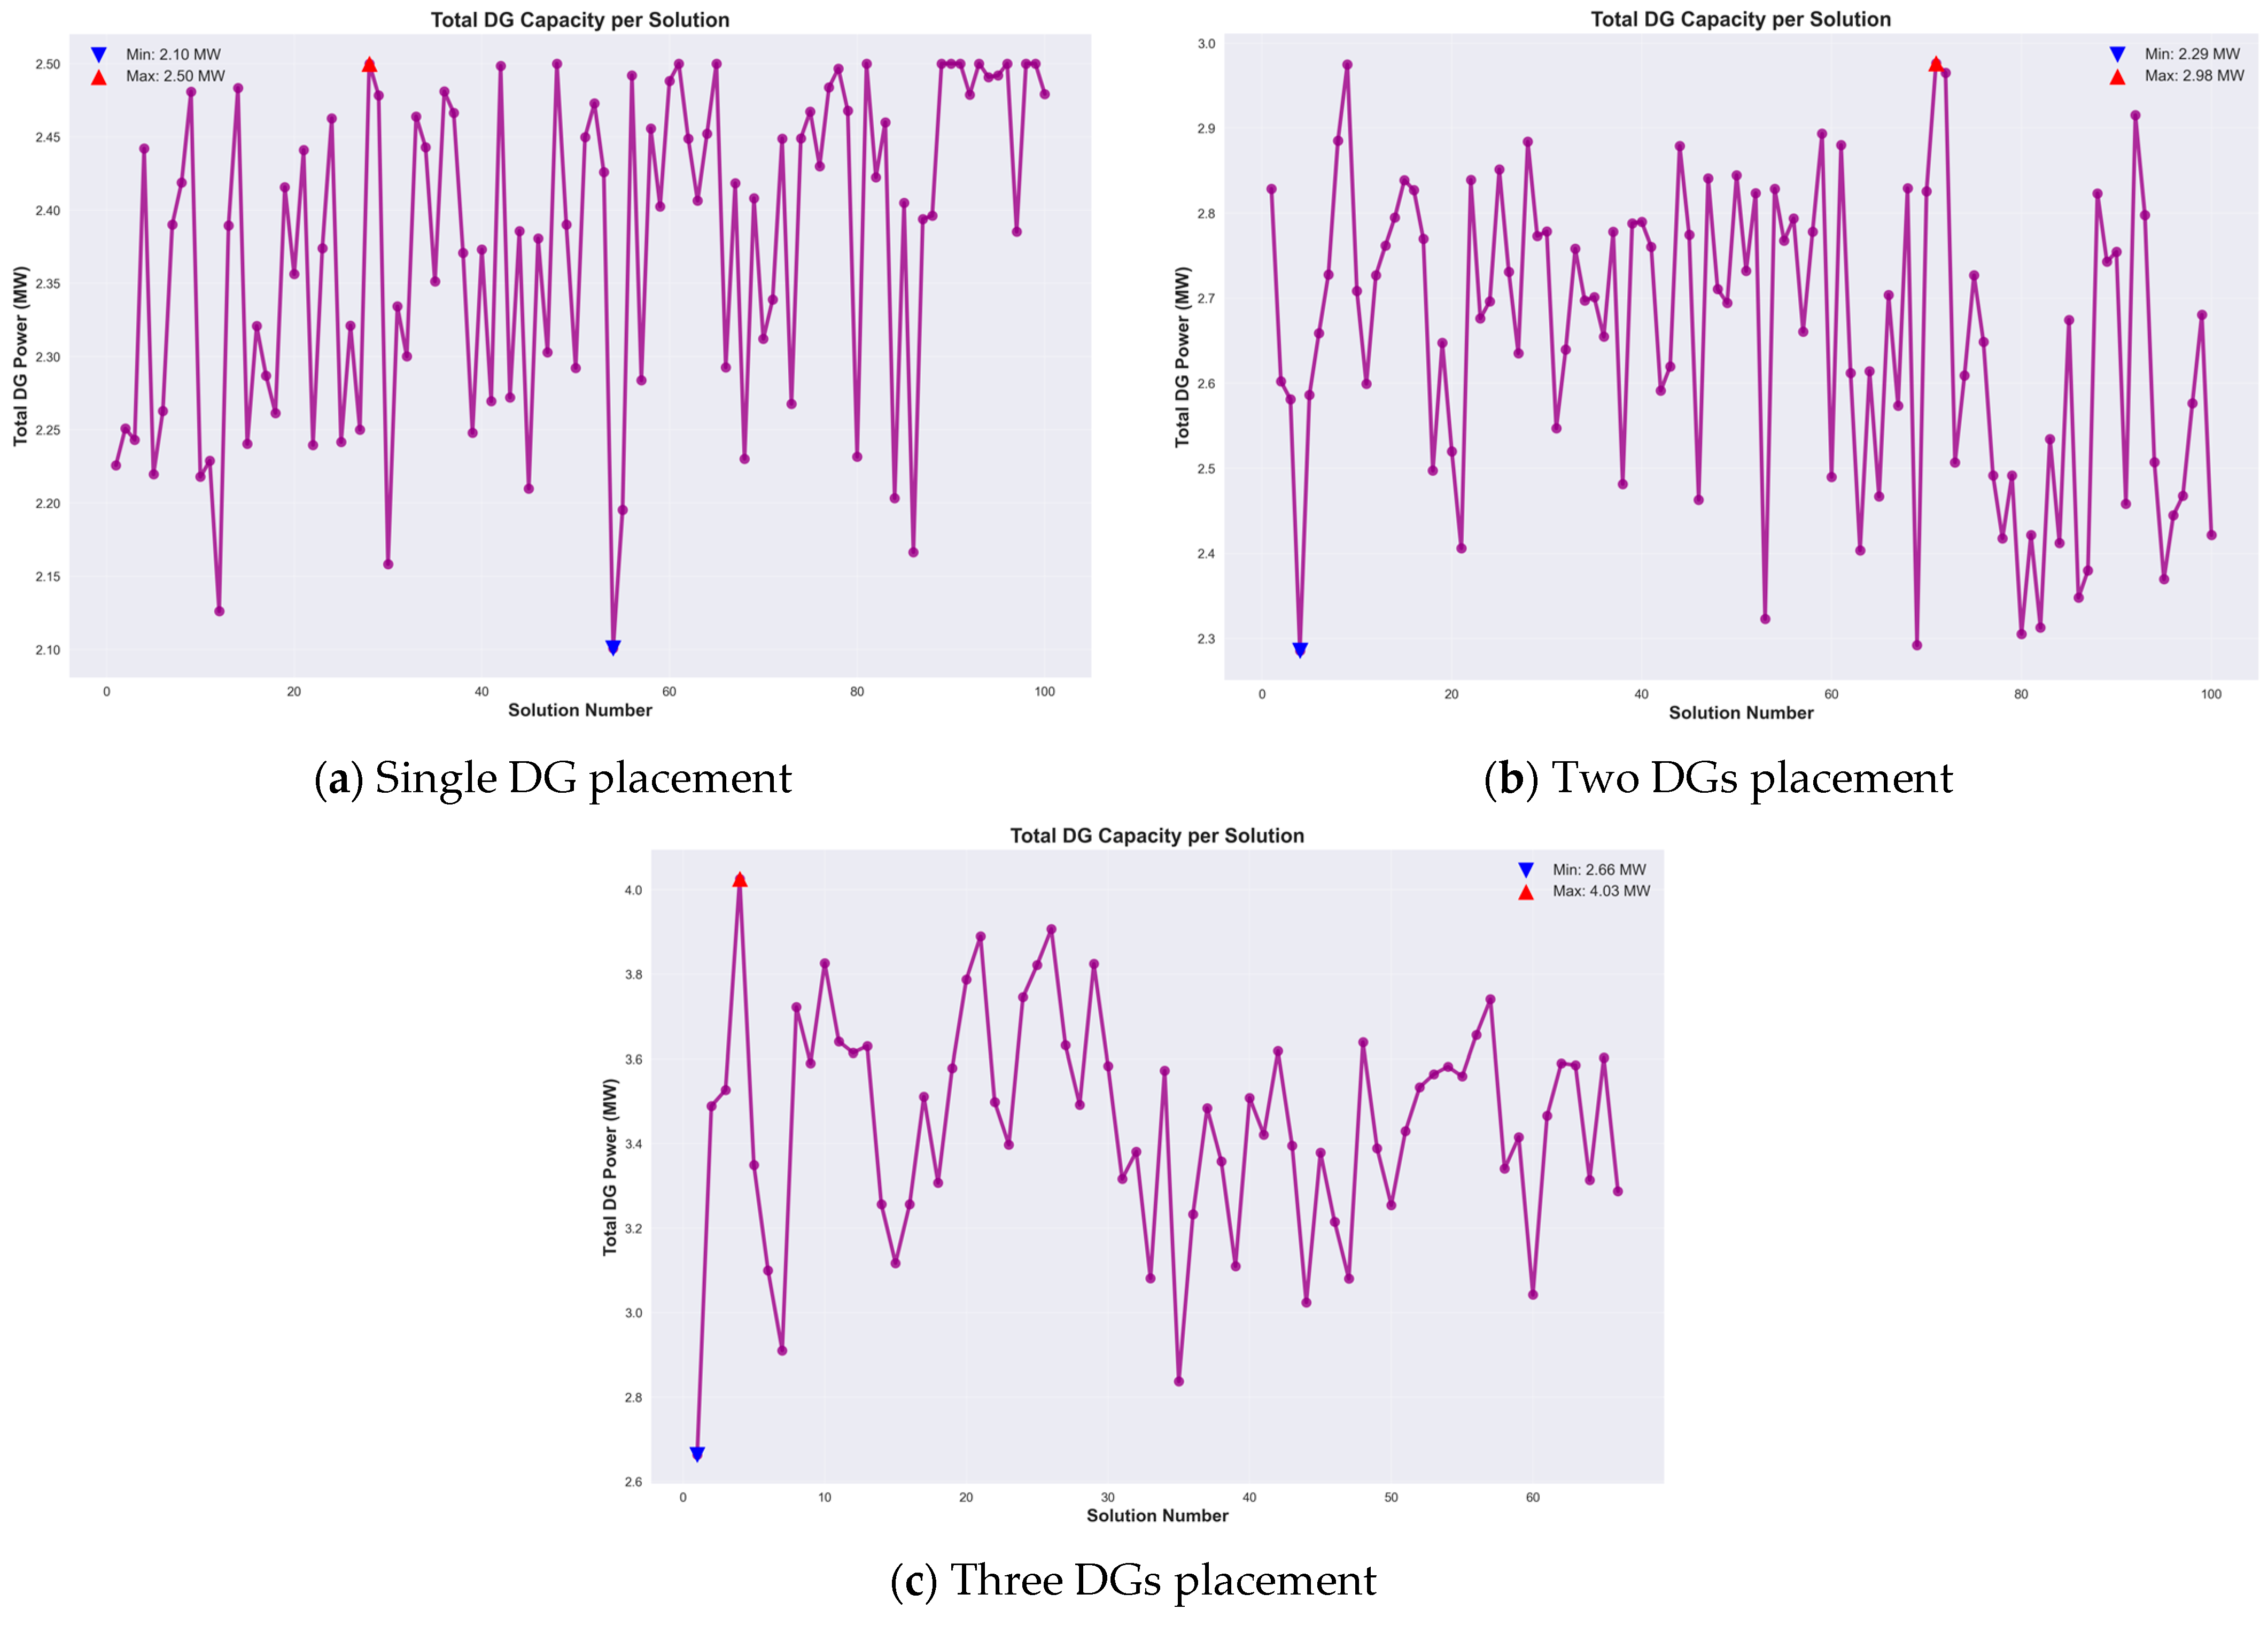
4.3. Comparion the Total DGs Capacity per Solution

Figure 13 compares the total DG capacity across single, two, and three DG placement scenarios in the IEEE 33 bus system. In the single DG case (Figure 13a), capacities range from 2.32 to 2.50 MW, clustering near the upper bound, indicating a tendency to favor larger units for improving voltage profile and reducing losses. For two DGs (Figure 13b), total capacities increase to 3.35–4.30 MW, with most solutions concentrated around 4 MW, reflecting improved trade-offs between power loss mitigation and voltage control. In the three DG scenarios (Figure 13c), capacities range from 4.07 to 5.98 MW, though most solutions cluster between 4.2 and 4.7 MW. While higher capacities appear, they are less frequent, suggesting diminishing returns or operational constraints. Overall, multi-DG configurations favor moderate capacity levels, balancing technical performance with constraints satisfaction. This indicates that optimal configurations are not those with maxi-mum capacity but those that achieve a balanced multi-objective outcome, contributing to a more resilient and efficient distribution system.
Figure 14 compares the total DG capacity across single, two, and three DG placement scenarios in the IEEE 69 bus system. In the single DG case (Figure 14a), capacities range from 2.50 to 2.86 MW, with most solutions clustering near the upper limit, indicating re-liance on a single large unit to meet system demands. In the two DG scenario (Figure 14b), total capacity expands to 3.56–5.00 MW, with solutions centering around 4.3 MW, offering improved flexibility in loss reduction and voltage regulation. The three DG cases (Figure 14c) show capacities from 5.02 to 7.13 MW, though most solutions concentrate between 5.5 and 6.2 MW. While some high-capacity outliers appear, they are less dominant, suggesting optimization favors balanced capacities over maximum sizing. Overall, the trend confirms that multi-DG setups enhance adaptability, enabling better trade-offs across technical objectives while maintaining system reliability and operational constraints.

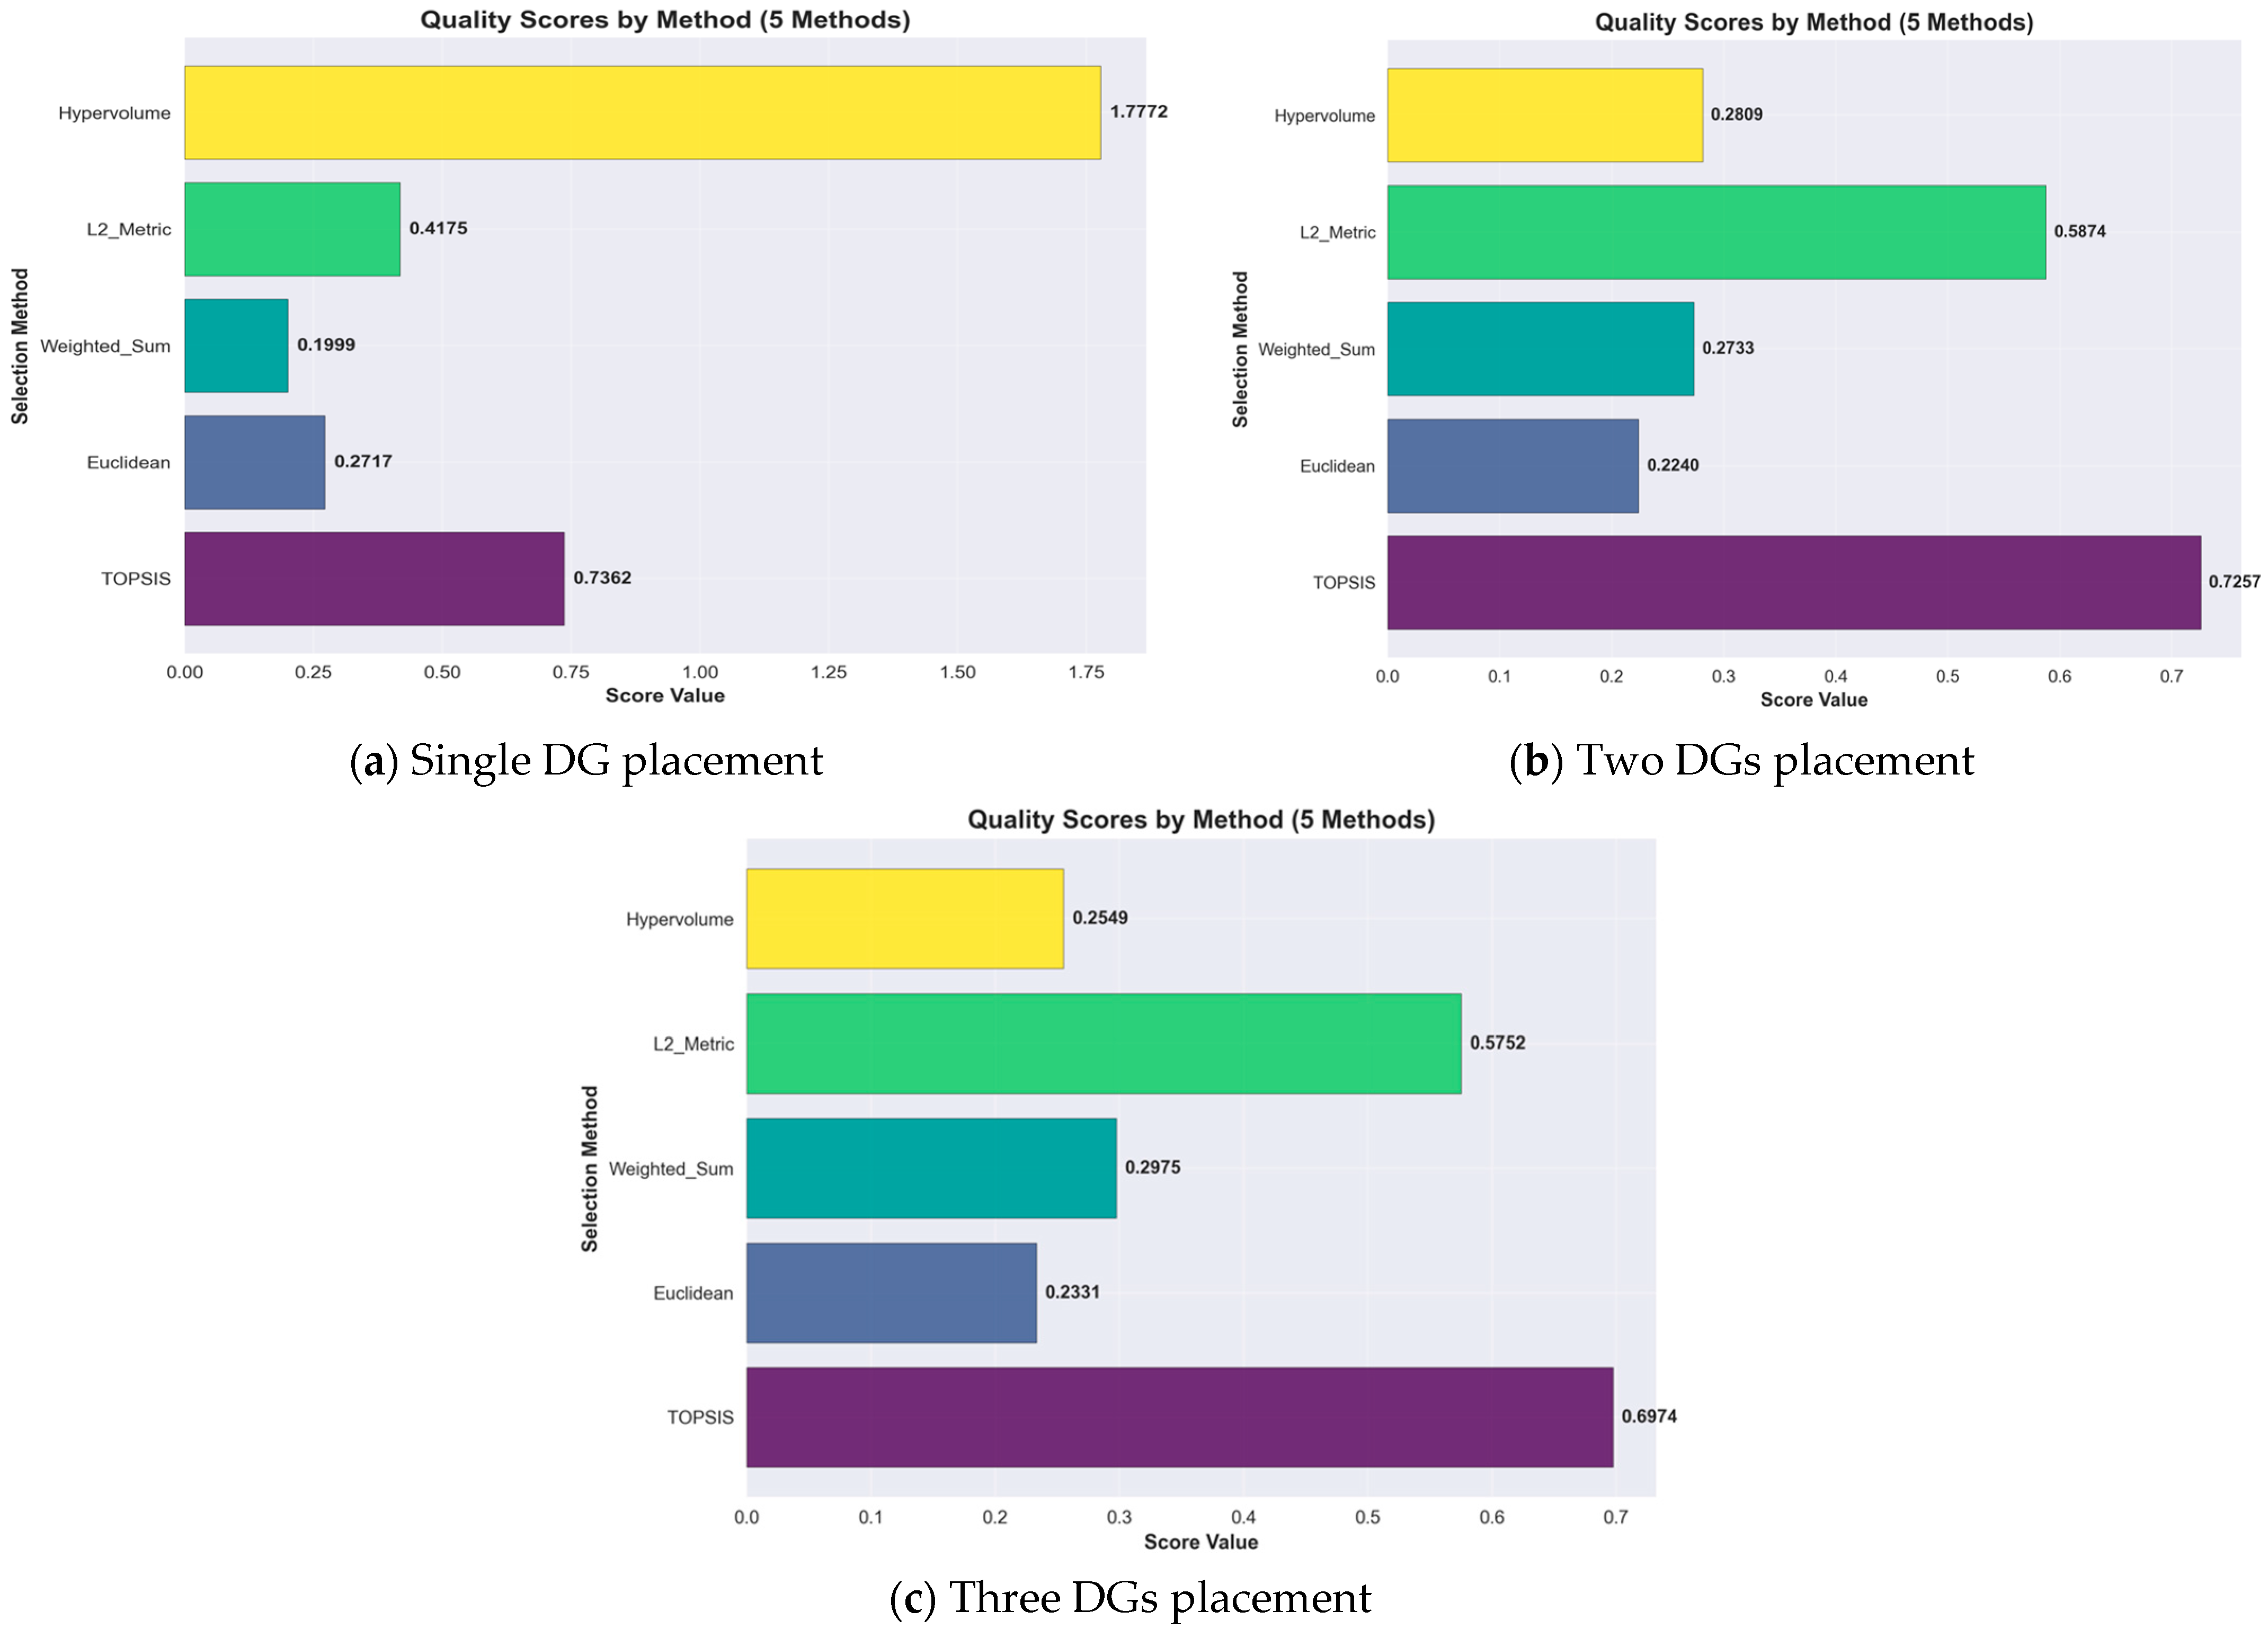
4.4. Comparison of the Quality Scores by Each Method for Compromise Solution

Five methods for determining the compromise solution are applied by computing score values used to select the optimal DG placement. These score values are then evaluated using a consensus-based decision support algorithm.
Figure 15 presents a comparative assessment of five compromise solution meth-ods—TOPSIS, L2 Metric, Weighted Sum, Hypervolume, and Euclidean—for multi-objective DG placement in the IEEE 33-bus system across single, two, and three DG scenarios. TOPSIS consistently achieves the highest scores, identifying solutions closest to the ideal point across all objectives. L2 Metric ranks second, indicating strong compromise quality, while Weighted Sum produces moderate scores, reflecting average performance. Hypervolume and Euclidean methods yield lower scores, particularly in single and two DG cases, likely due to sensitivity to front shape and outliers. Score values increase with the number of DGs, especially for TOPSIS and L2 Metric, suggesting improved trade-off flexibility in multi-DG configurations. Among all methods, TOPSIS proves most robust for selecting well-balanced solutions in terms of power loss, voltage deviation, and violations, making it the recommended approach for multi-objective DG planning.
Figure 16 presents a comparison of the quality scores using five compromise solution methods for the IEEE 69 bus system under single, two, and three DG placement scenarios. TOPSIS consistently achieved the highest scores across all cases, with values of 0.7505, 0.6365, and 0.7335, indicating strong alignment with ideal multi-objective solutions. L2 Metric ranked second in each scenario, confirming its ability to identify well-balanced compromises. Weighted Sum and Euclidean methods produced moderate scores. Hyper-volume showed a low score in the single and two DG cases but performed well in the three DG scenario, reaching 0.7899, reflecting sensitivity to Pareto front shape. Overall, solution quality improved with additional DG units. TOPSIS remains the most effective method for selecting optimal configurations, followed by L2 Metric, while Hypervolume provides useful diversity insight in multi-DG scenarios.

4.5. Comparison of the Compromise Solution Votes by Each Method for Consensus-Based Decision Support

Figure 17 shows the number of methods selecting each compromise solution for single, two, and three DG placements in the IEEE 33-bus system. In the single DG scenario (Figure 17a), solutions #17 and #90 each received two votes, while solution #44 received one. This suggests some alignment among methods in identifying high-quality solutions. In the two DG case (Figure 17b), five different solutions each received one vote, indicating greater variation across methods and less consensus on the optimal compromise. For the three DG cases (Figure 17c), solution #58 received two votes, while solutions #28, #17, and #59 were selected by one method each. These results highlight how the increase in DG units leads to a broader and more diverse solution space, which can reduce overlap among methods. Nonetheless, solutions with multiple votes represent more robust and reliable compromises, making them strong candidates for practical implementation. of alternatives. These results affirm that applying multiple selection methods yields consistent, consensus driven recommendations for optimal DG placement.
Figure 18 presents the number of compromise solution votes from different methods for the IEEE 69-bus system under single, two, and three DG placements. In the single DG case (Figure 18a), solution #67 received the highest consensus, selected by three methods, while solutions #23 and #53 were each selected by one. This suggests stronger agreement on a preferred solution when DG flexibility is limited. In the two DG scenarios (Figure 18b), solution #47 was selected by two methods, while three other solutions received one vote each, indicating increased solution diversity but some convergence. For the three DG cases (Figure 18c), solutions #54 and #77 were each chosen by two methods, while solution #29 received one vote. This shows that while the solution space expands with additional DGs, certain solutions consistently emerge as preferred compromises. Overall, these results confirm that cross-method agreement improves solution robustness and that voting helps identify consistently high-quality configurations in multi-objective DG planning.

4.6. Comparion the Normalized Performance Comparison (Radar Plot)

Figure 19 presents a comparative analysis of DG placement scenarios with one, two, and three distributed generators in the IEEE 33-bus system, based on normalized radar plots of power loss, voltage deviation, and voltage violations. In the single DG case (Figure 19a), performance trade-offs are evident. Solution #1 minimized power loss but showed poor voltage performance, while solutions #1475 and #1212 improved voltage metrics at the expense of higher losses. In the two DG scenarios (Figure 19b), solutions #20, #238, and #262 demonstrated more balanced outcomes. Solution #20 achieved the lowest power loss, while #238 and #262 performed slightly better in voltage violations and deviation, respectively. The three DG configurations (Figure 19c) showed the most favorable overall performance. Solution #61 excelled in power loss and violations, Solution #10 in voltage deviation, and Solution #135 offered the most balanced results across all objectives. These findings confirm that increasing the number of DGs enhances the system’s ability to achieve well-rounded optimization across multiple criteria.
Figure 20 presents normalized radar plots comparing power loss, voltage deviation, and voltage violations for selected compromise solutions under single, two, and three DG placements in the IEEE 69-bus system. In the single DG case (Figure 20a), solution per-formance shows clear trade-offs, with some solutions excelling in voltage quality while others minimize losses. The two DG configurations (Figure 20b) demonstrate more diverse and improved performance profiles, though trade-offs remain between objectives. In the three DG scenarios (Figure 20c), several solutions approach the outer boundary of the plot, indicating balanced and strong performance across all metrics. Overall, increasing the number of DGs enhances the system’s ability to meet multiple objectives simultaneously, resulting in more robust and well-rounded solutions.

4.7. Comparison of the Objective Function Correlation Matrix

Figure 21 illustrates the objective function correlation matrices for the IEEE 33-bus system under single, two, and three DG placement scenarios. In the single DG case (Figure 21a), the correlations between objectives are weak, with values of 0.26 between power loss and voltage deviation, and near-zero correlation with voltage violations. This indicates limited interaction among objectives, suggesting that improvements in one objective have minimal influence on the others. As shown in Figure 21b, the two DG scenarios introduce stronger correlations. Power loss and voltage deviation exhibit a high positive correlation (0.74), and voltage deviation and voltage violations also correlate strongly (0.85). These relationships suggest that improvements in one objective can simultaneously benefit others. However, power loss and voltage violations show a moderate negative correlation (−0.36), highlighting trade-offs. In the three DG case (Figure 21c), the correlation between voltage deviation and violations increases further to 0.96, while power losses remain strongly correlated with voltage deviation (0.74) and moderately negatively correlated with violations (−0.65). This indicates that as more DGs are integrated, objectives become more interdependent, and optimization becomes more coordinated. Overall, the results confirm that multi-DG placement enhances structural relationships among objectives, enabling more effective multi-objective optimization. As system flexibility increases, planners gain greater control in balancing loss reduction, voltage improvement, and violation mitigation.
Figure 22 shows the objective function correlation matrices for single, two, and three DG placements in the IEEE 69-bus system. In the single DG case (Figure 22a), power loss and voltage deviation exhibit a strong correlation (0.77), while voltage violations are weakly correlated with the other objectives, indicating limited interdependence. In the two DG scenarios (Figure 22b), correlations become stronger. Power loss and voltage deviation correlate at 0.60, and both show stronger alignment with voltage violations (0.64 and 0.67, respectively), suggesting improved interaction across objectives. In the three DG configurations (Figure 22c), all objectives are strongly correlated, with values of 0.64 across all pairs. This indicates a more unified optimization space were improving one objective is likely to benefit the others. Overall, the results confirm that increasing the number of DGs enhances the correlation among objectives, facilitating coordinated optimization and enabling more effective system-level planning.

4.8. Comparison of All Performances and Results

Table 4 presents a comparative analysis of multi-objective DG placement in IEEE 33-bus and IEEE 69-bus systems with 1 to 3 DG units. As the number of DG units increases, the total DG capacity also increases, reaching 33,407 MW for the IEEE 33-bus and 2.8094 MW for the IEEE 69 bus system. The optimization time remains relatively consistent across all cases, ranging from 24,231 to 24,375 s for the 33-bus and 24,928 to 24,961 s for the 69-bus system. However, the number of Pareto-optimal solutions decreases with more DG units, indicating reduced solution diversity. The IEEE 69 bus system retains higher diversity, as reflected by a greater average inter-solution distance. These results highlight a trade-off between increased DG capacity and the complexity and diversity of optimal solutions.
Table 5 shows that increasing the number of DG units from 1 to 3 significantly improves system performance in both IEEE 33bus and 69bus systems. Power loss is reduced by over 67%, and voltage deviation improves by more than 72%, with the IEEE 69-bus achieving up to 78.32% improvement. Additionally, all voltage violations are eliminated (100%) when 2 or more DGs are installed. These results confirm the effectiveness of multi-DG placement in enhancing power quality and operational reliability.
Table 6 summarizes consensus-based compromise solutions for DG placement in IEEE 33-bus and IEEE 69-bus systems with 1 to 3 DG units. The results show that increasing the number of DGs significantly enhances technical performance. In the IEEE 33-bus system, total power loss is reduced by 67.96% (from 0.1202 MW to 0.0385 MW), voltage deviation is improved by 52.77% (from 0.5284 to 0.2496), and voltage violations drop from 57 to 11 buses. In the IEEE 69-bus system, total power loss decreases by 63.55% (from 0.0607 MW to 0.0221 MW), while voltage deviation improves by 53.84% (from 0.6554 to 0.3026), and violations are reduced from 67 to 13 buses. Although the technical metrics show substantial improvement, the quality score exhibits a more nuanced trend. In the IEEE 33-bus system, the quality score decreases by 10.03% (from 0.7055 to 0.6348), while in the IEEE 69-bus system, the score slightly decreases by 6.36% (from 0.6984 to 0.6540). This suggests that while more DGs improve system reliability and performance, the quality score also reflects trade-offs related to complexity, or other practical constraints. These findings reinforce the role of consensus-based decision-making in balancing multi-objective performance and operational feasibility in distribution networks. However, the consensus-based decision-making approach can be tailored to select the optimal compromise solution by incorporating various methods, helping to minimize conflicts between different methodological choices.

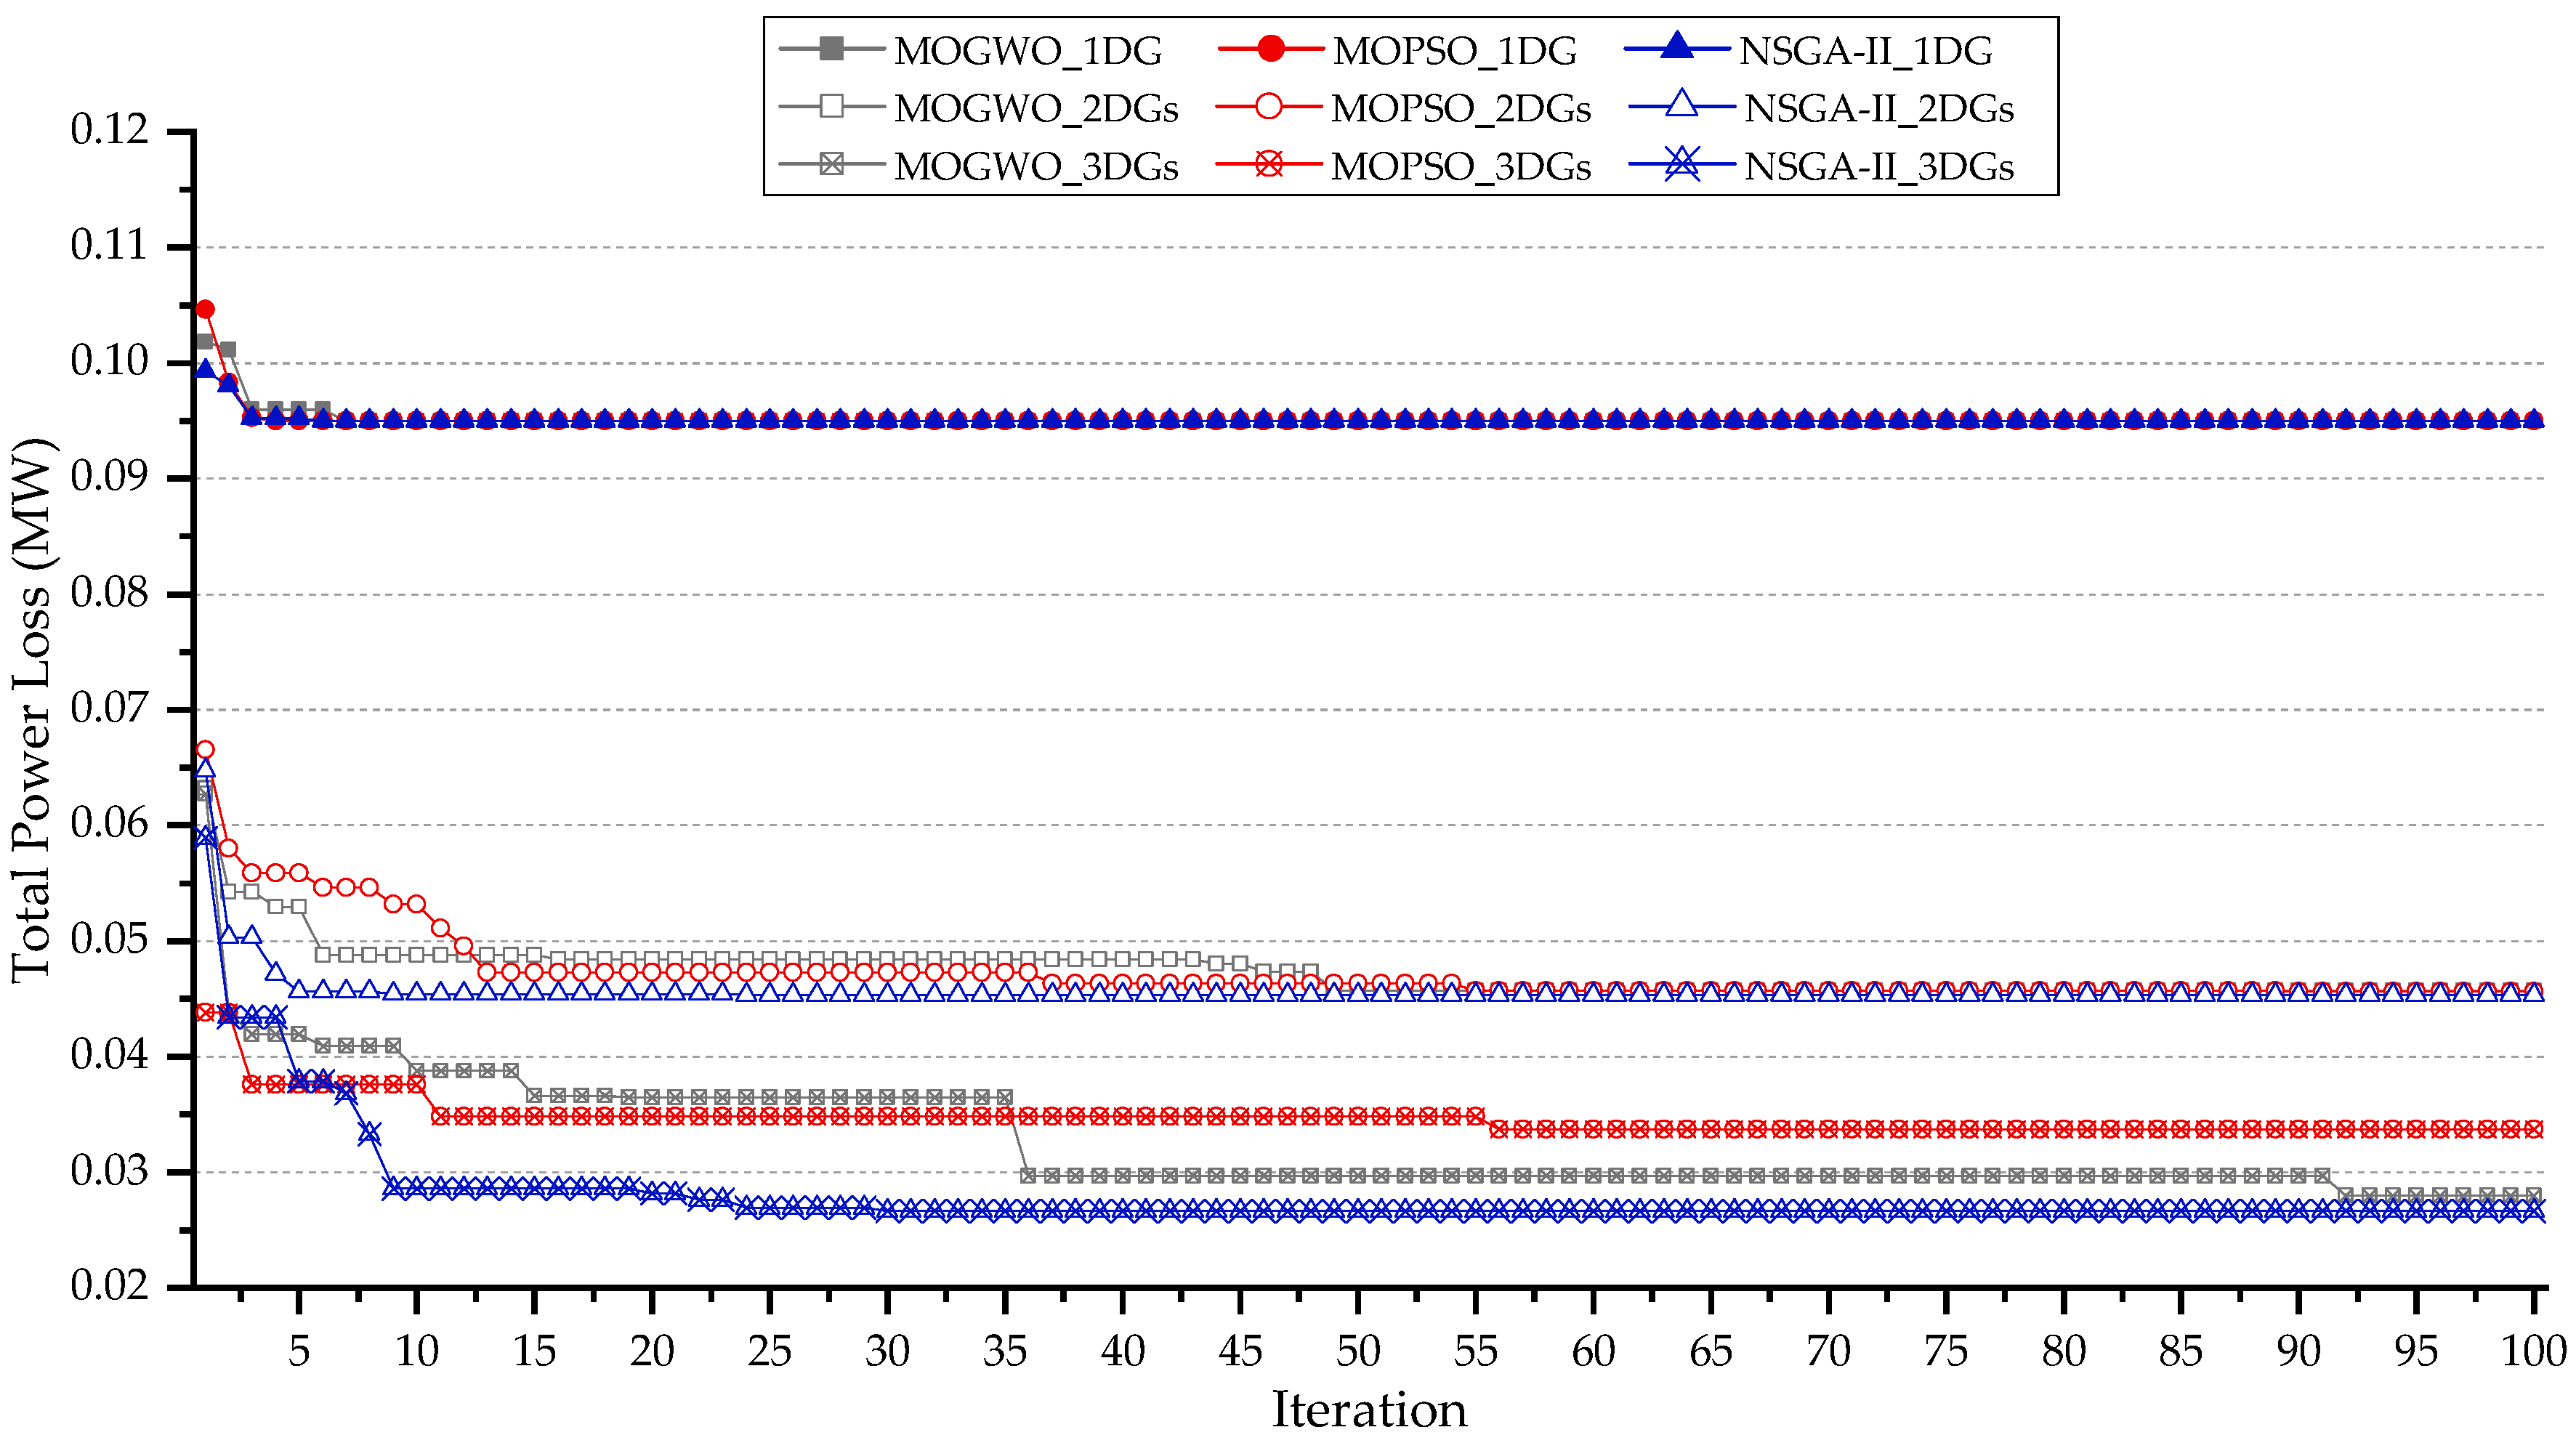
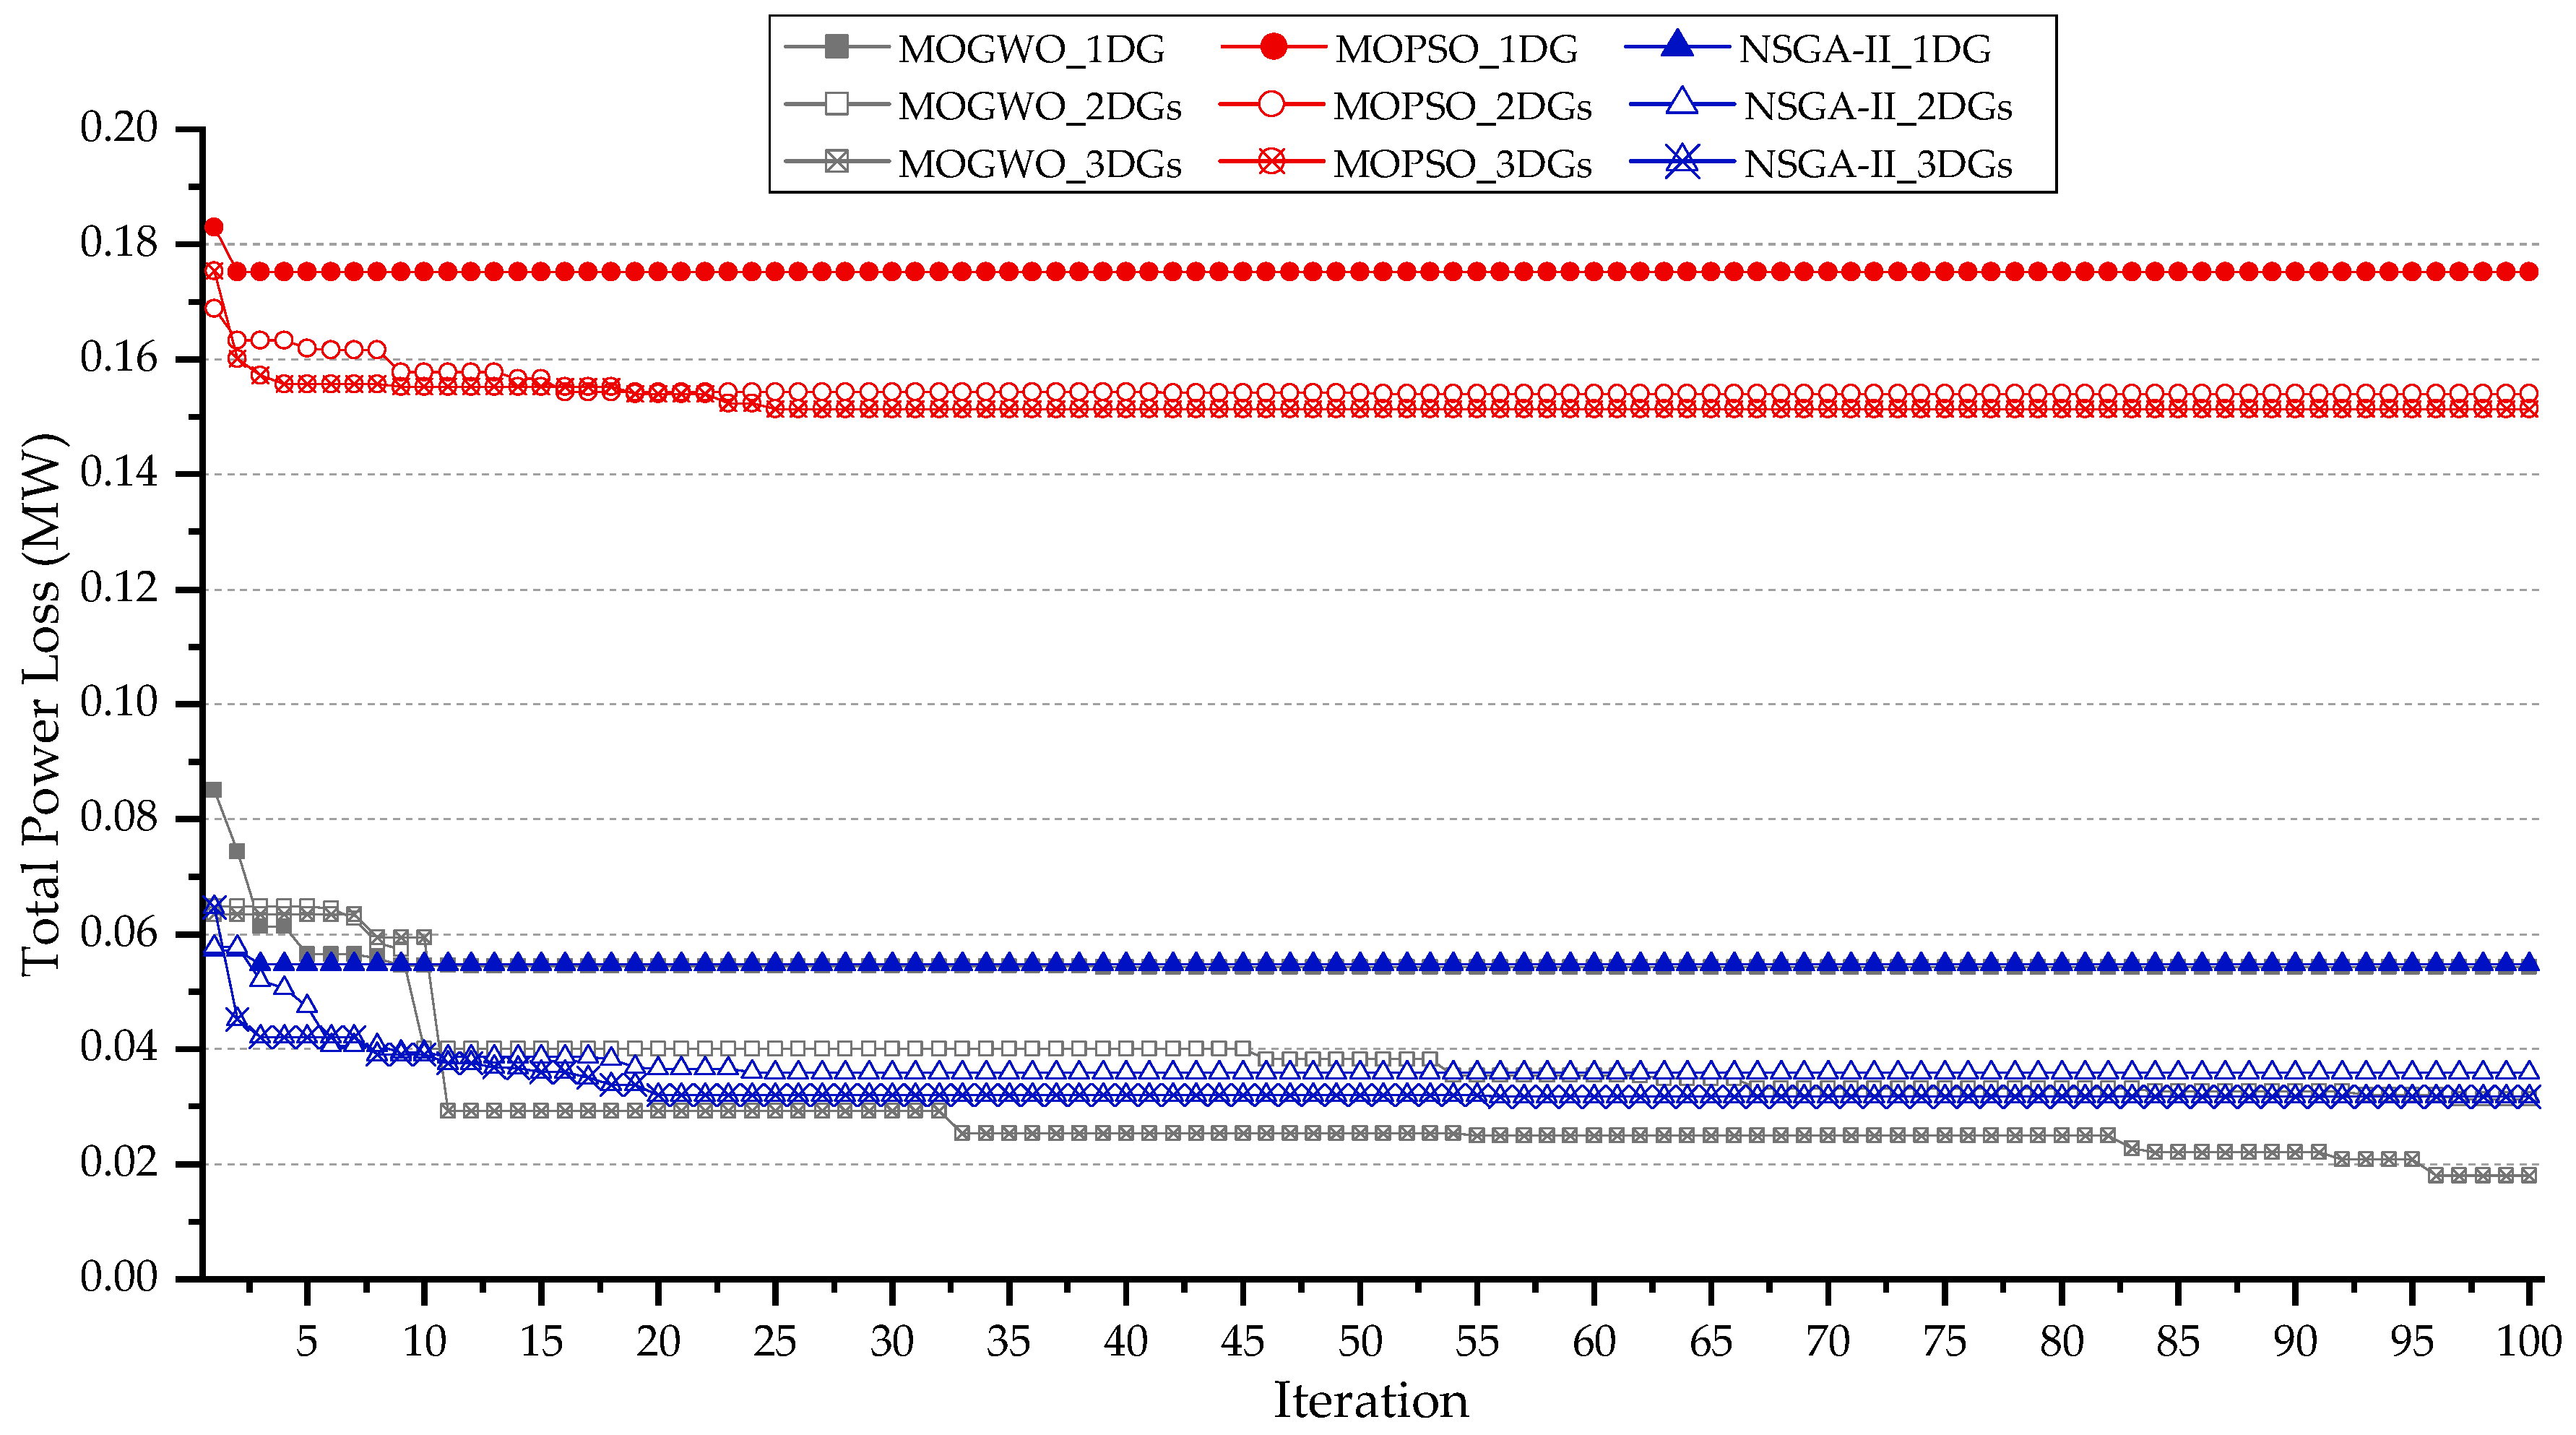
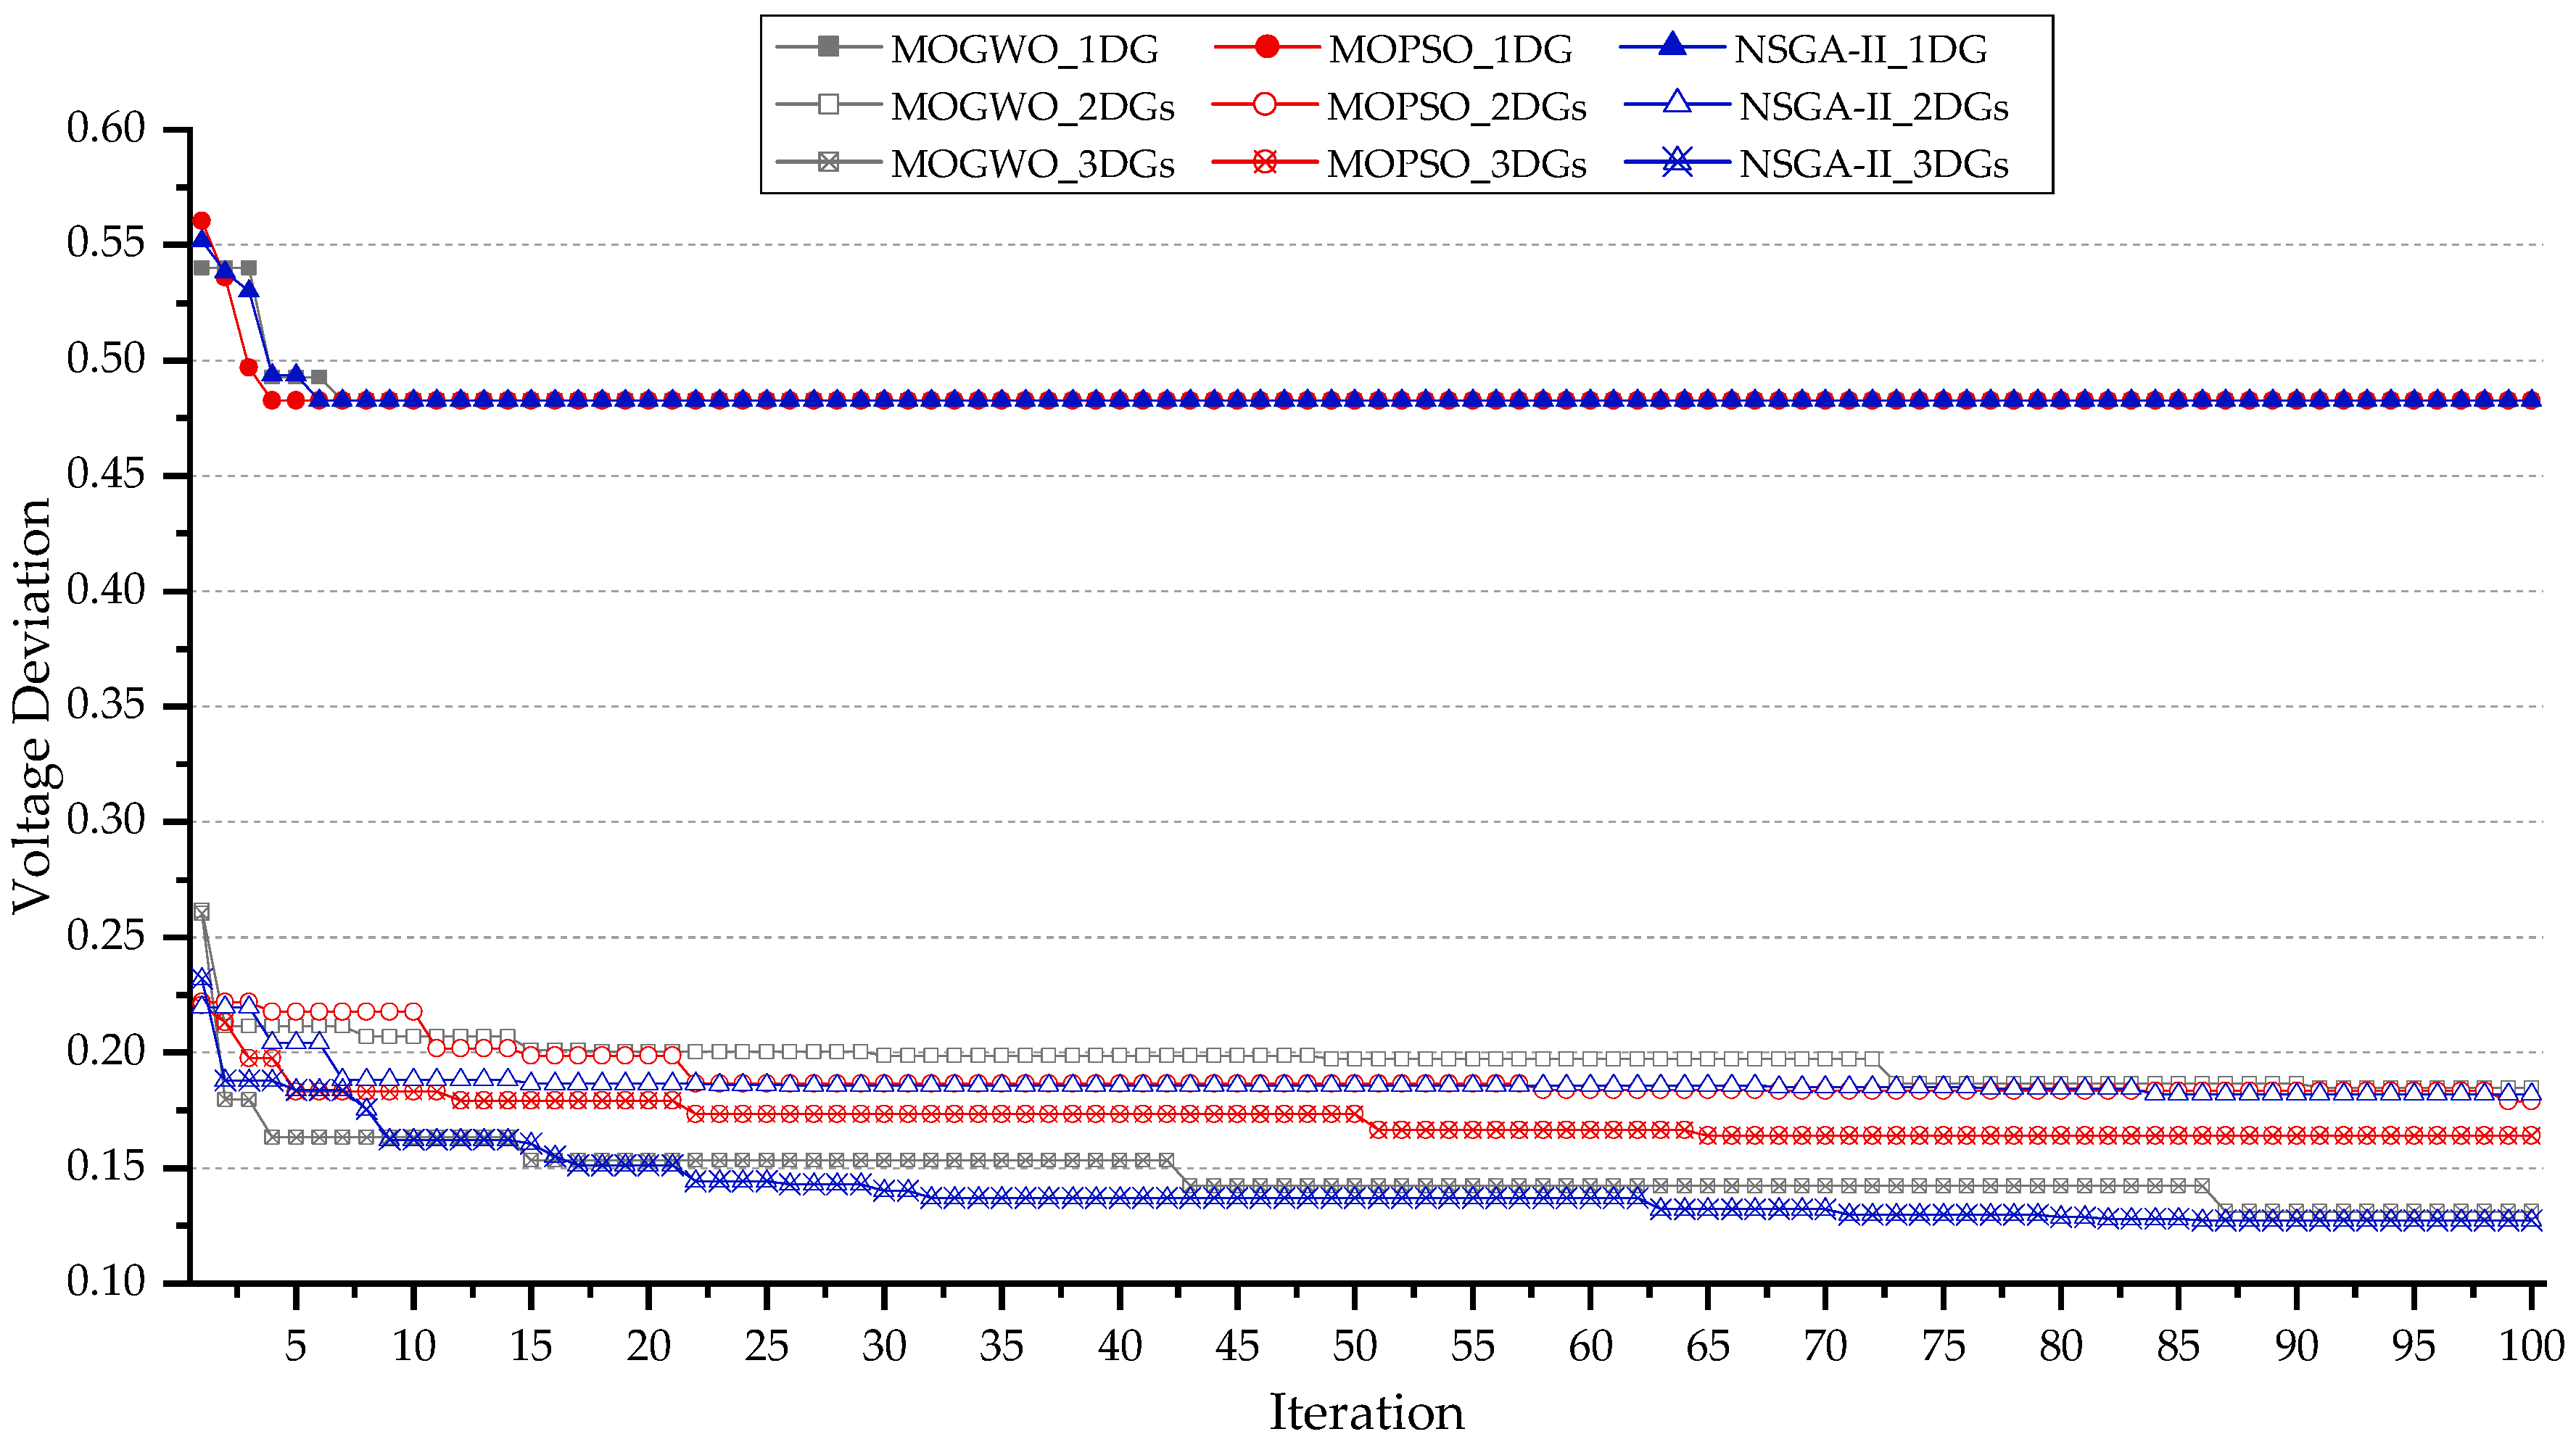
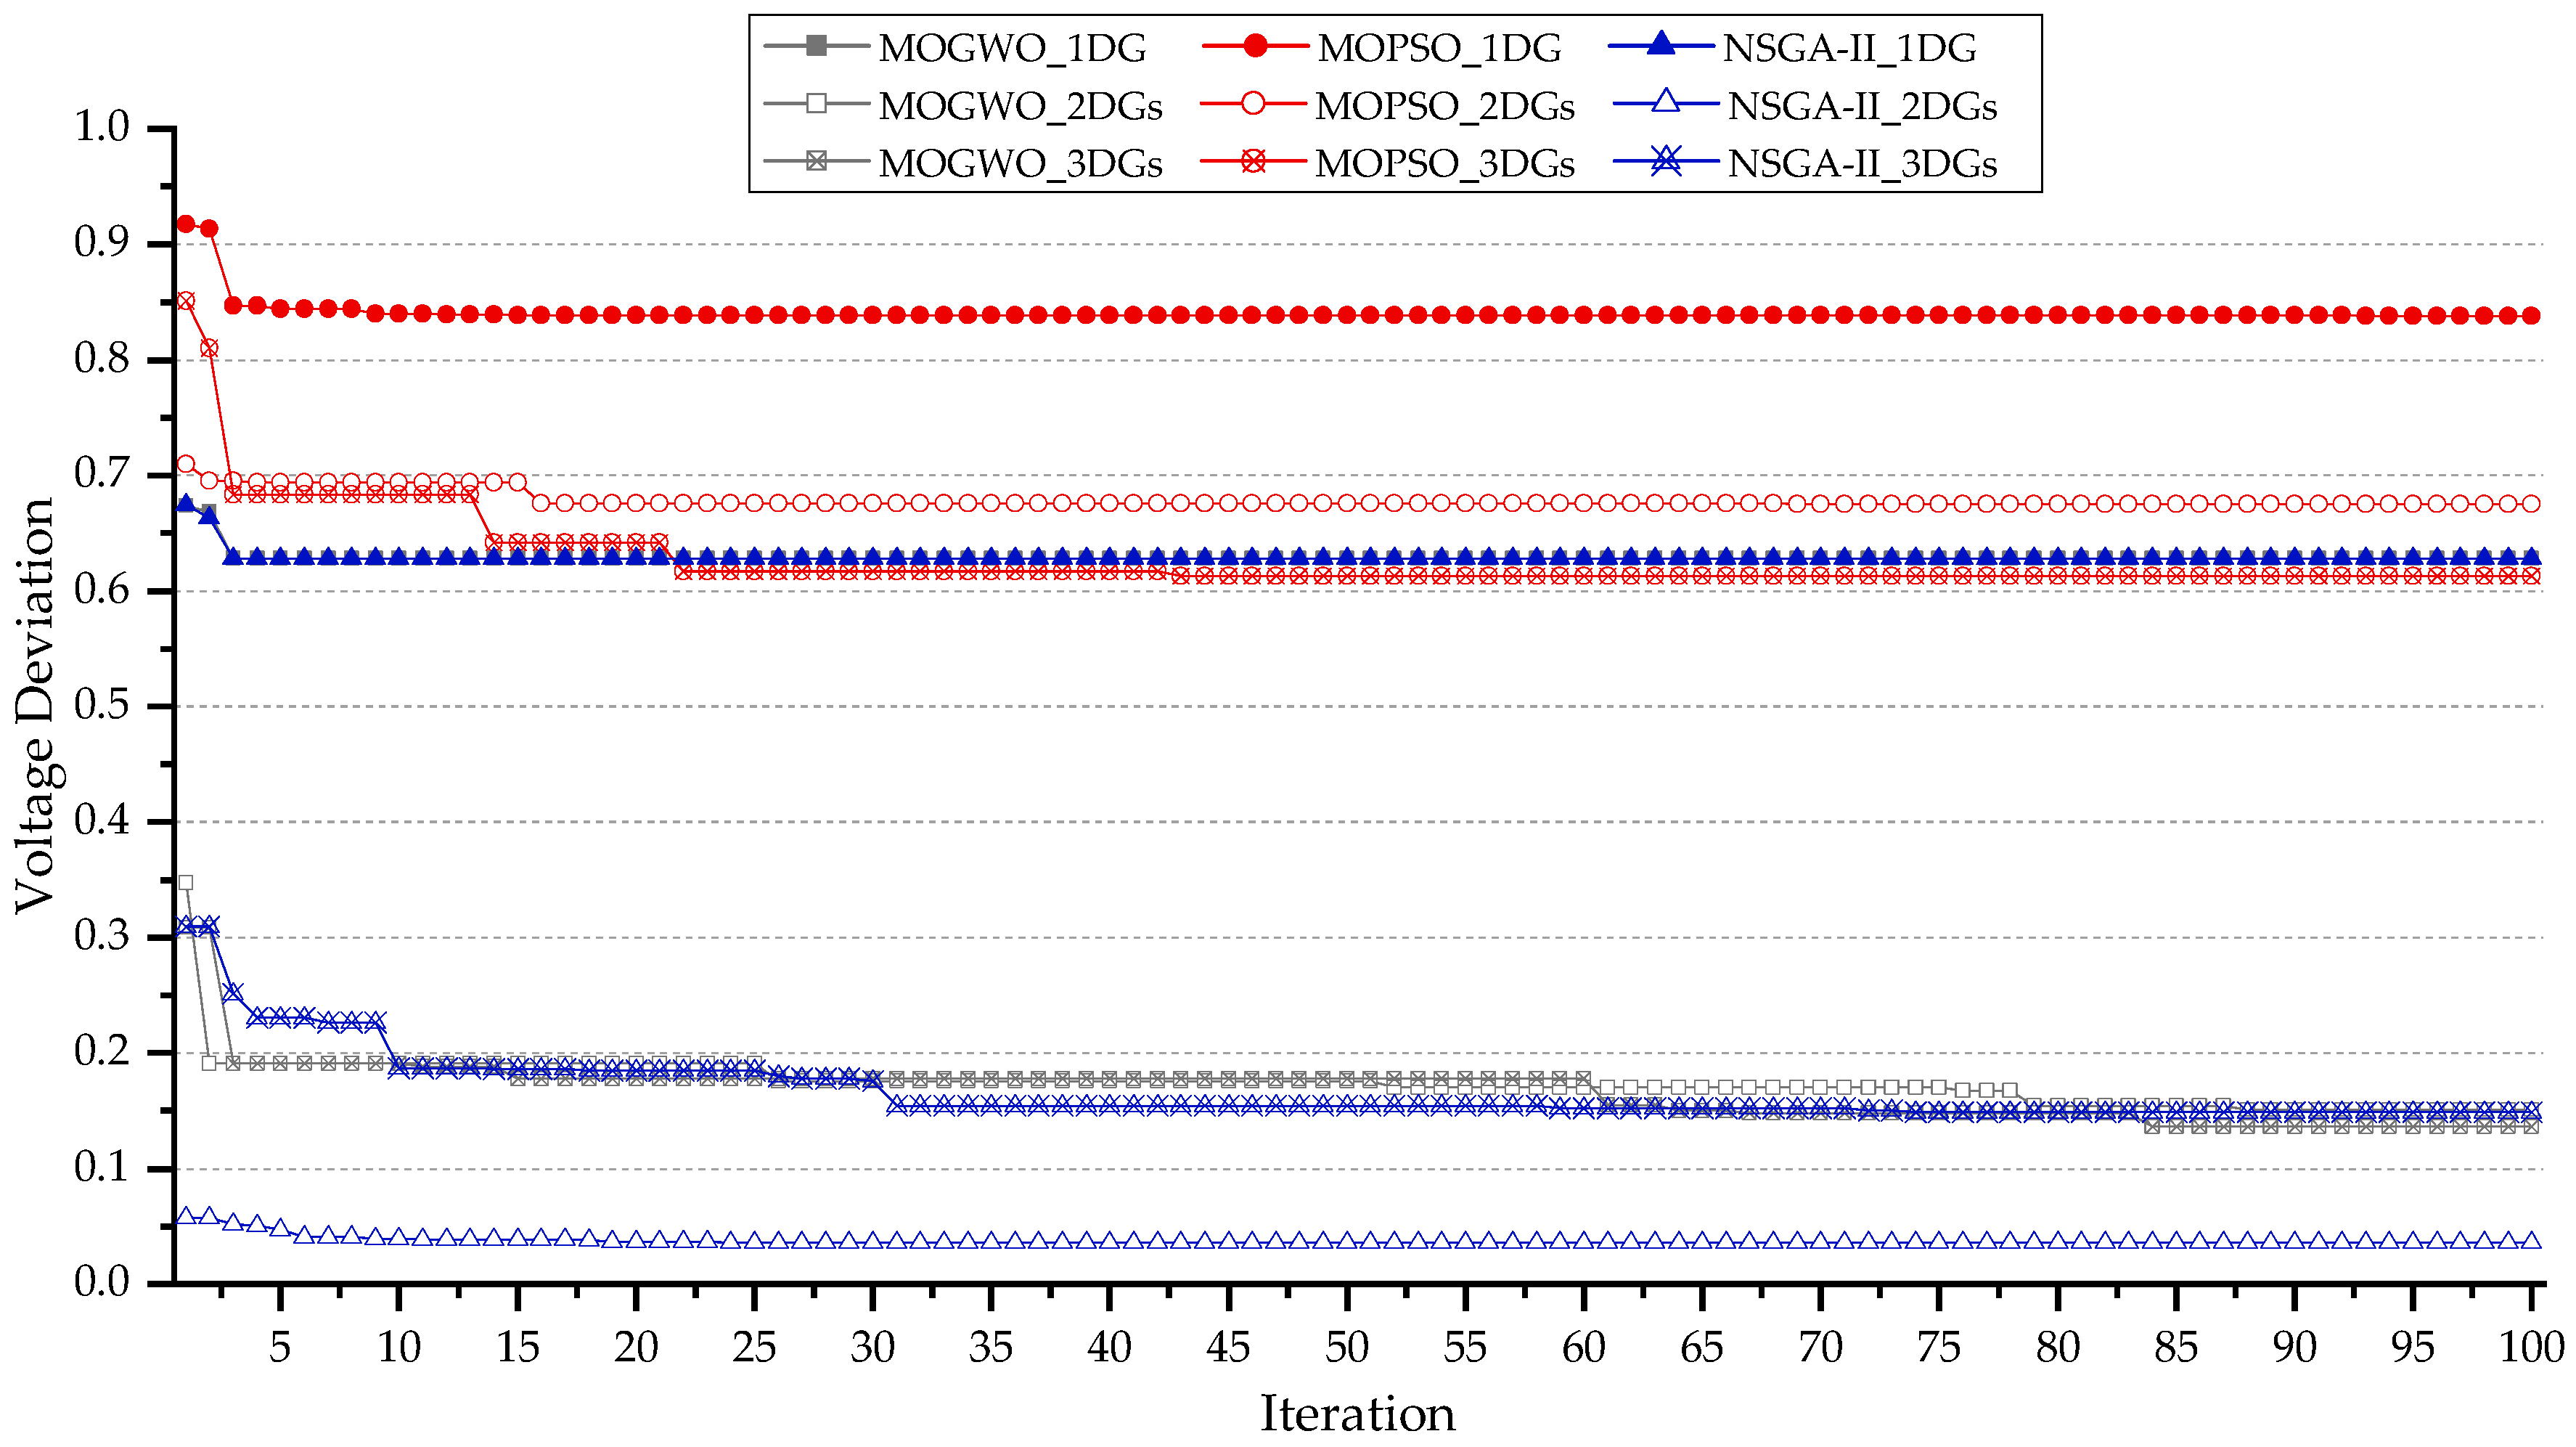
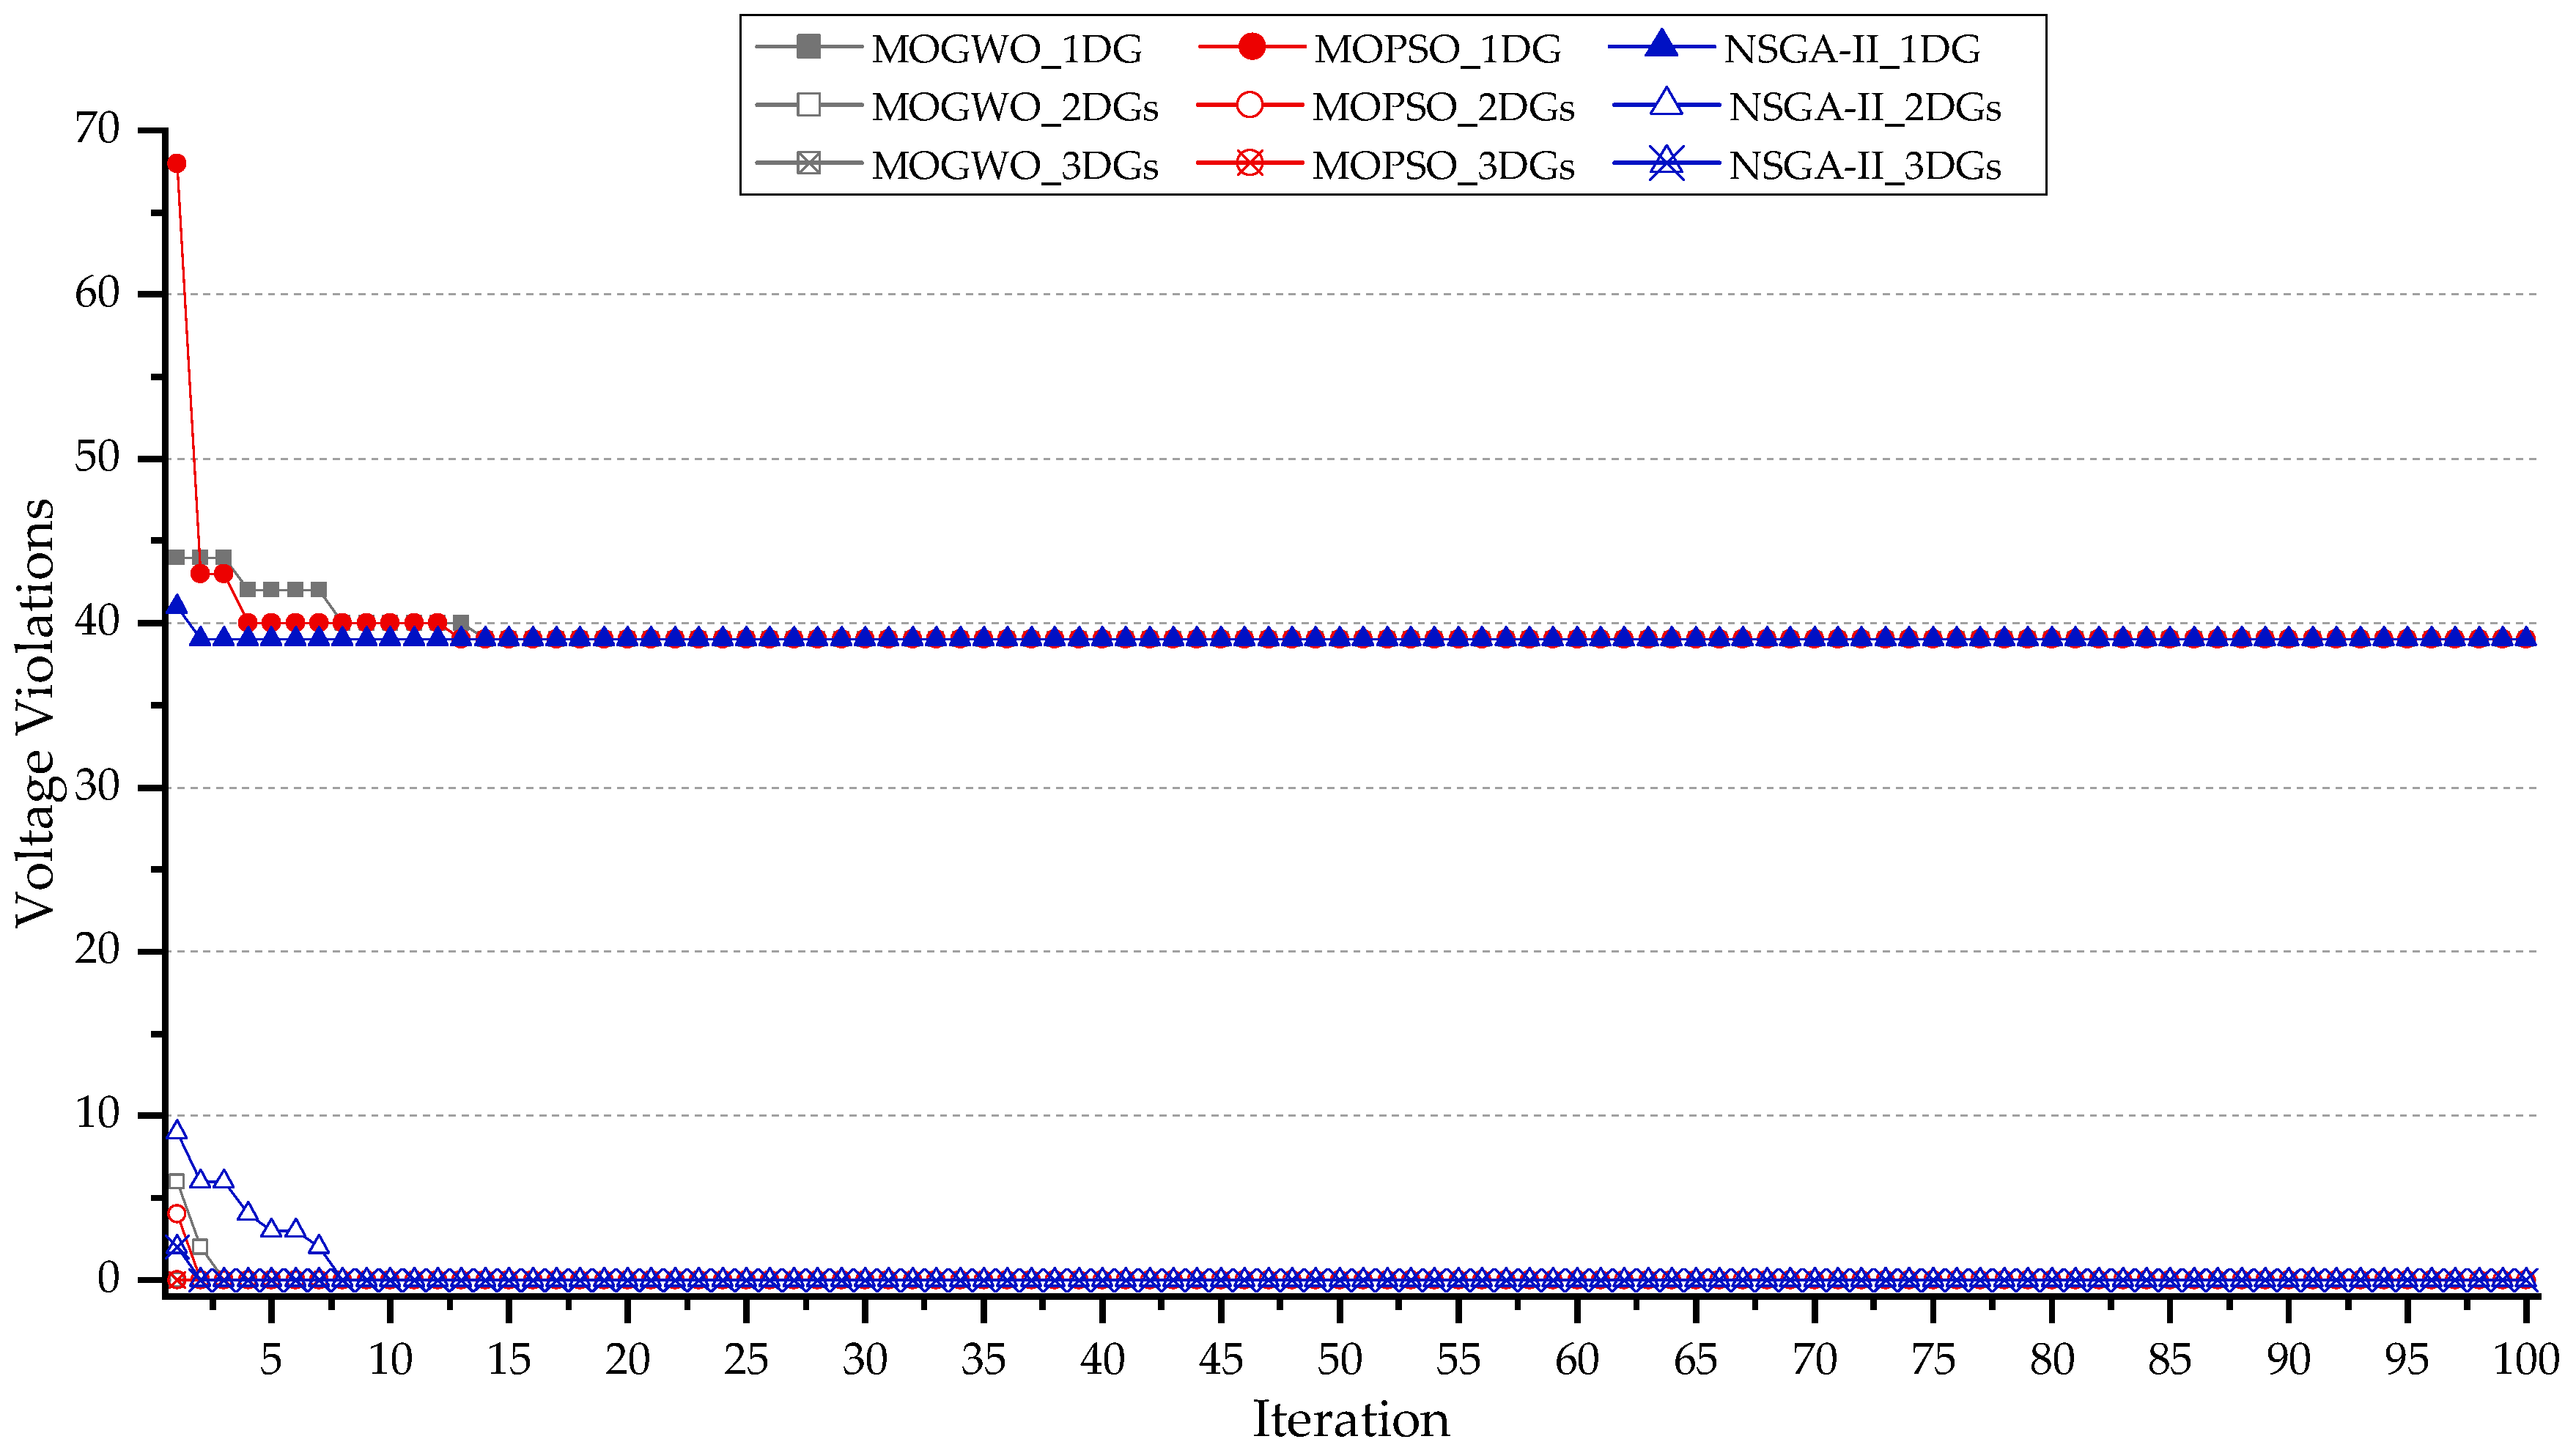
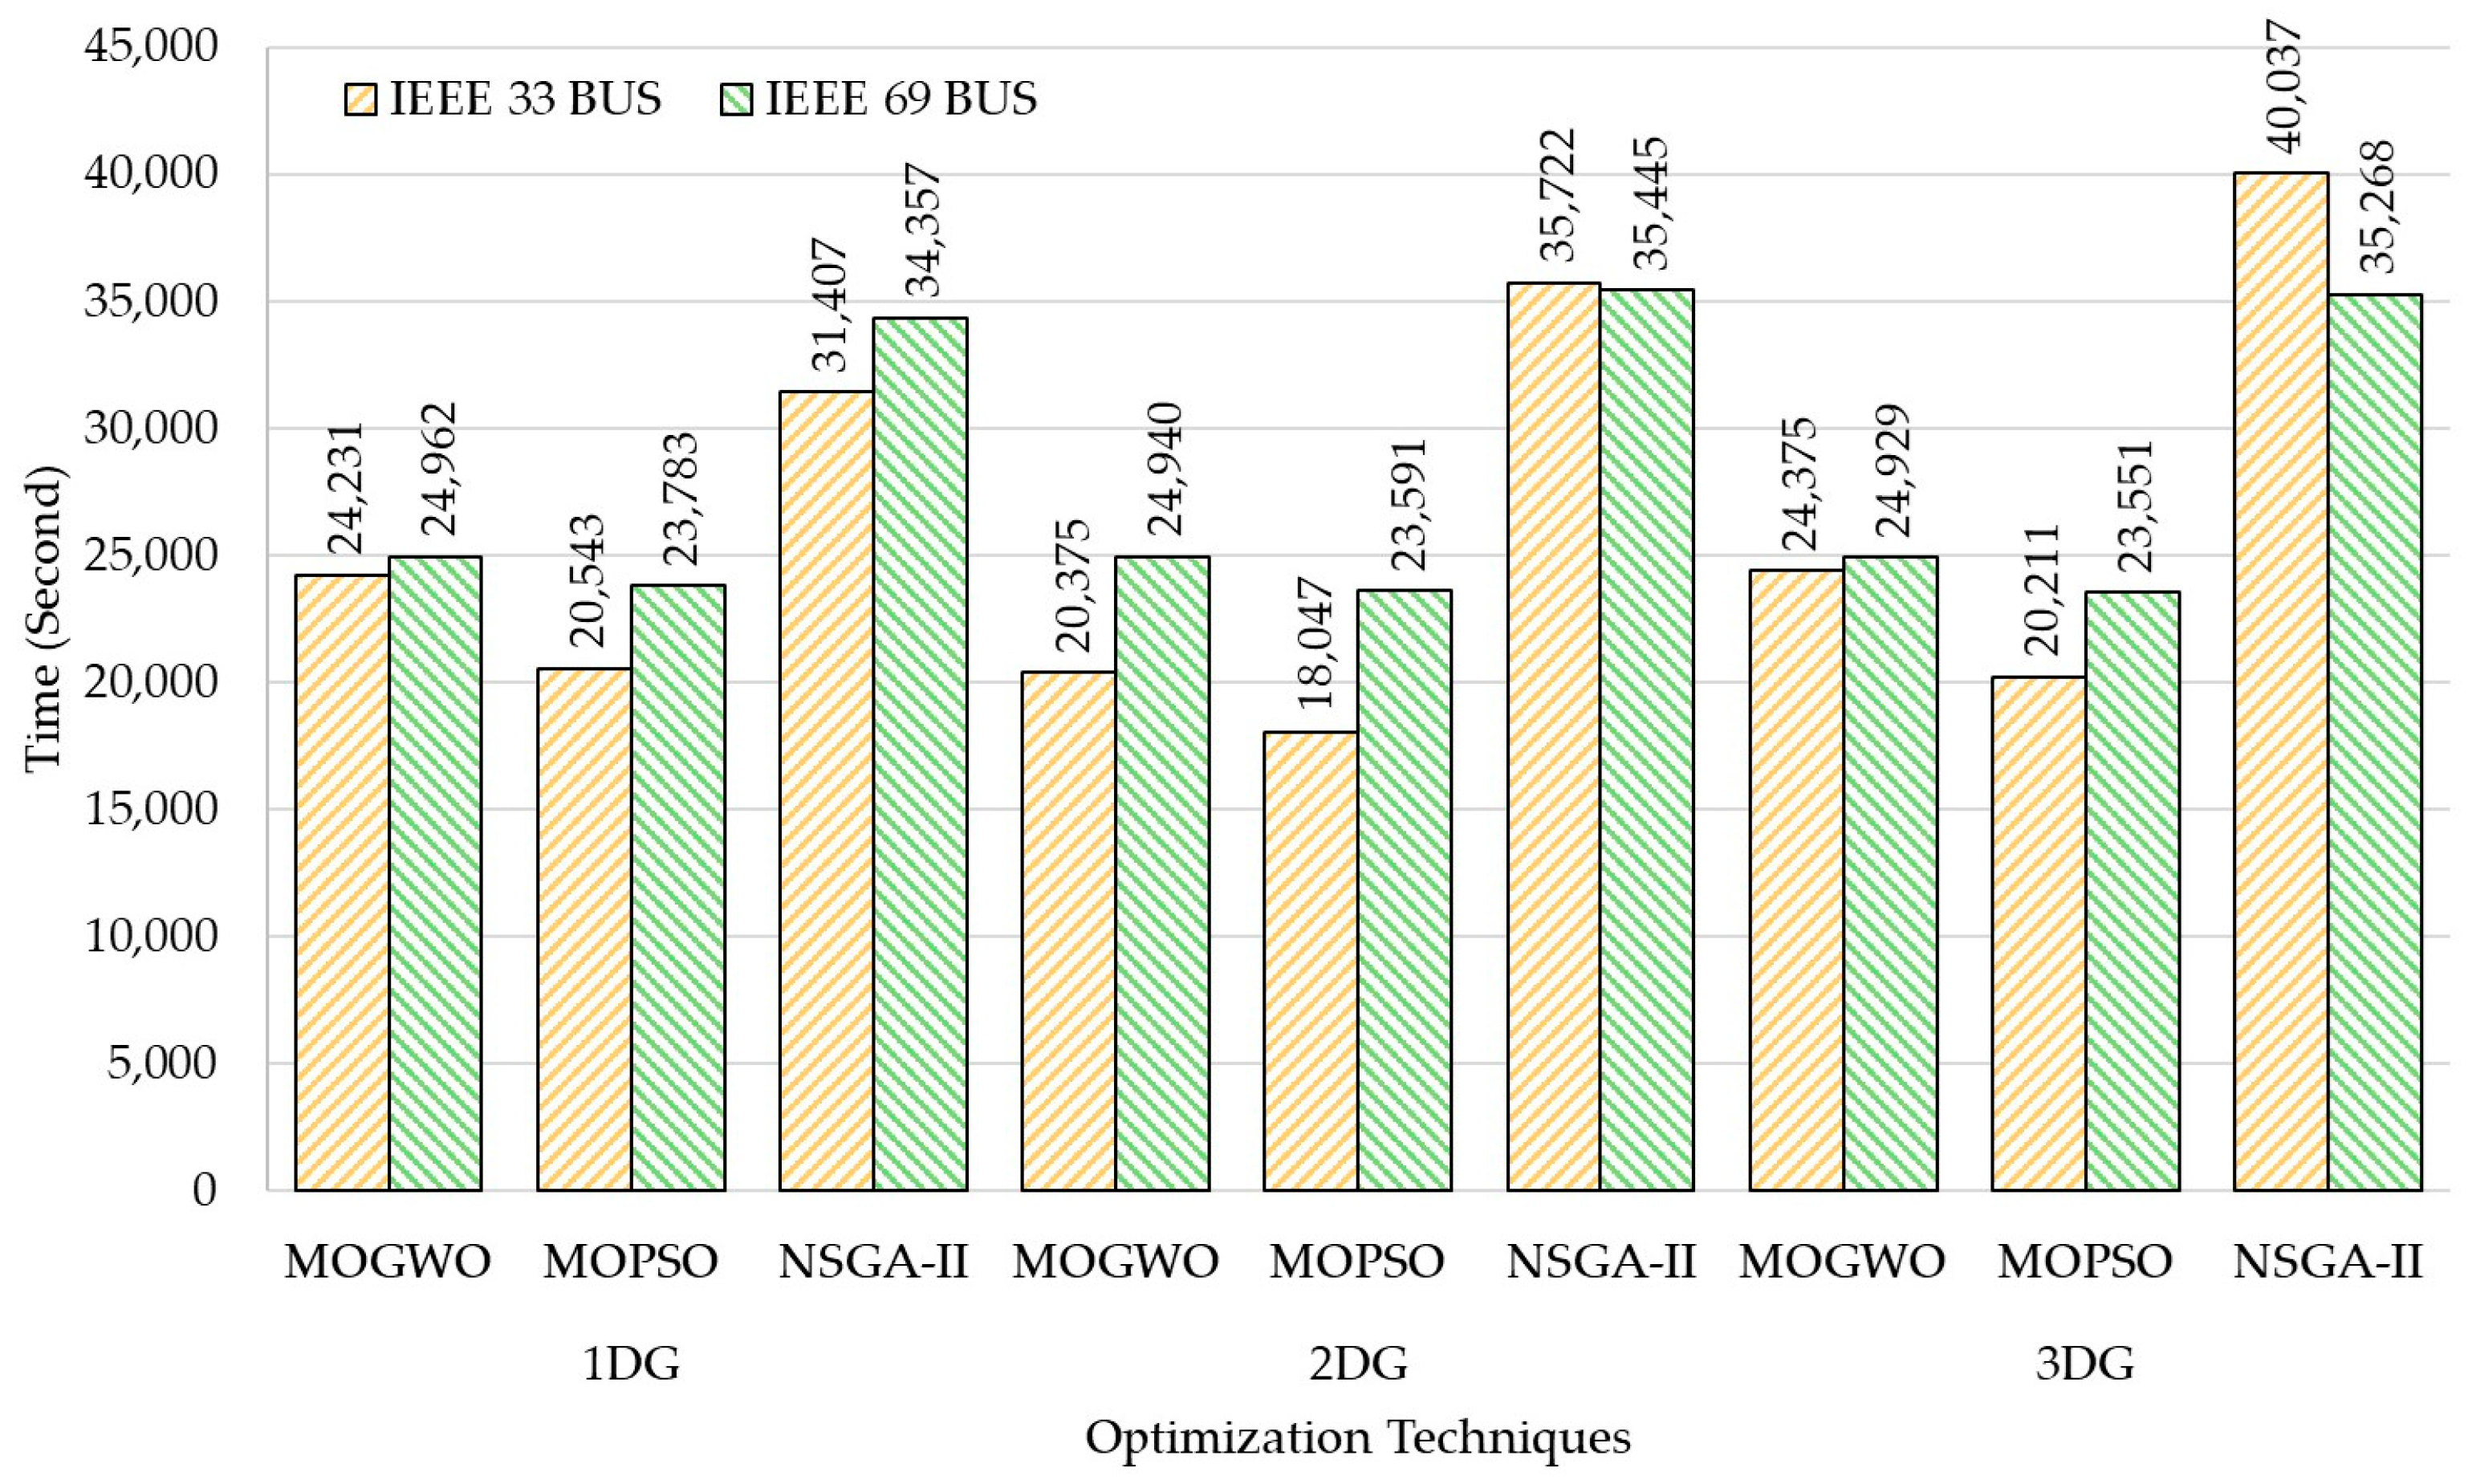
4.9. Performance Comparison of Convergence Behavior and Optimization Results Between MOGWO, MOPSO and NSGA-II

The multi-objective NSGA-II, Multi-particle swarm optimization (MOPSO) are used to compare the performance of MOGWO. The number of populations, swarms, and generations are determined the same as MOGWO. The NSGA-II has set up the crossover probability and mutation probability of 0.9 and 0.1, respectively. The MO-PSO has set up the inertia weight   w , cognitive parameter   c 1 and social parameter c 1 of 0.9, 0.2 and 0.2, respectively.
Figure 23 presents the power loss convergence for IGWO, PSO, and NSGA-II across 1DG, 2DG, and 3DG scenarios. IGWO achieved the fastest and lowest power loss reduction, particularly in the 3DG case, where convergence occurred within the first 10 iterations. PSO showed slower convergence, while NSGA-II consistently exhibited the highest residual losses and early stagnation. These results highlight IGWO’s superior performance in minimizing power losses, making it the most effective algorithm for optimal DG placement and sizing in the IEEE 33-bus network.
Figure 24 illustrates power loss convergence over 100 iterations for IGWO, PSO, and NSGA-II under 1DG, 2DGs, and 3DGs scenarios applied to the IEEE 69-bus distribution system. IGWO consistently achieved the lowest final power losses, particularly in the 3DG case, where rapid convergence occurred within the first 20 iterations. PSO exhibited higher loss values and slower convergence across all scenarios, while NSGA-II showed moderate performance but remained less effective than IGWO in the results. These outcomes affirm the robustness of IGWO in handling large-scale optimization problems, delivering superior power loss reduction compared to PSO and NSGA-II in the IEEE 69-bus network.
Figure 25 shows 69 busnvergence of voltage deviation over 100 iterations using IGWO, PSO, and NSGA-II for 1DG, 2DGs, and 3DGs cases. The IGWO algorithm achieved the lowest final voltage deviation in all scenarios, with rapid convergence particularly notable in the 3DG case. PSO provided moderate performance, while NSGA-II exhibited slower convergence and higher final deviation values. The results confirm that IGWO effectively minimizes voltage deviation with faster convergence and greater stability compared to PSO and NSGA-II, enhancing voltage quality across the IEEE 33-bus network.
Figure 26 displays the convergence behavior of voltage deviation using IGWO, PSO, and NSGA-II across 1DG, 2DGs, and 3DGs scenarios for the IEEE 69-bus system. The IGWO method achieved the lowest deviation values with faster convergence, particularly evident in the 3DG case. NSGA-II showed acceptable performance with consistent convergence but slightly higher steady-state deviations. PSO lagged in both convergence speed and final deviation magnitude. These findings demonstrate the effectiveness of IGWO in enhancing voltage profile quality in large-scale dis-attribution networks, outperforming PSO and marginally surpassing NSGA-II in the IEEE 69-bus context.
Figure 27 shows the voltage violation trends over 100 iterations for IGWO, PSO, and NSGA-II under 1DG, 2DGs, and 3DGs scenarios. The IGWO algorithm achieved the fastest and most effective reduction, especially in the 3DG case, where violations reached near-zero by iteration 10. PSO exhibited delayed convergence, and a higher violation count in the 1DG and 2DG scenarios. NSGA-II showed the slowest reduction, maintaining the highest steady-state violations across all configurations. These findings confirm the superior capability of IGWO in mitigating voltage violations within the IEEE 33-bus network, reinforcing its suitability for distributed generator placement problems under multi-objective constraints.
Figure 28 shows the voltage violation convergence for IGWO, PSO, and NSGA-II under 1DG, 2DGs, and 3DGs cases. IGWO significantly outperformed the other methods, achieving the lowest voltage violations with fast convergence, especially in the 3DG configuration. PSO failed to reduce violations effectively, maintaining high violation counts across all DG levels. NSGA-II performed moderately, showing better results than PSO but inferior to IGWO. These results confirm that IGWO is the most effective algorithm for mitigating voltage violations in the IEEE 69-bus system, offering faster convergence and improved voltage compliance.
Figure 29 presents a comparison of total optimization time for MOGWO, MOPSO, and NSGA-II applied to the IEEE 33- and 69-bus systems with 1 to 3 DG units. Among the three techniques, MOGWO demonstrates a strong balance between computational efficiency and robustness, consistently achieving faster convergence than NSGA-II while maintaining competitive performance. While MOPSO yields the shortest optimization time, MOGWO offers more stable scalability as the number of DGs increases. In contrast, NSGA-II shows the highest computational burden, especially in multi-DG scenarios. These results highlight MOGWO as an effective compromise solution and offer reduced optimization time without significantly sacrificing solution quality.

5. Discussion

This study presents a comprehensive evaluation of distributed generation (DG) placement strategies within electric bus (E-bus) transit systems under high-demand flash charging conditions. The application of the enhanced Multi-Objective Grey Wolf Optimizer (MOGWO), combined with consensus-based decision-making, provides both optimal technical solutions and practical decision support. The findings across scenarios with one, two, and three DG units reveal significant improvements in power quality, loss minimization, and network stability.

5.1. Impact of DG Quantity on System Performance

Simulation results demonstrate that increasing the number of DG units from one to three leads to substantial technical improvements in both IEEE 33-bus and IEEE 69-bus systems. As shown in Table 5, power loss was reduced from:
  • 0.0950 MW to 0.0279 MW (a 70.6% reduction) in the 33-bus system, and
  • 0.0543 MW to 0.0179 MW (a 67.0% reduction) in the 69-bus system.
Similarly, voltage deviations improved by:
  • 72.8% in the 33-bus system (from 0.4827 to 0.1313), and
  • 78.3% in the 69-bus system (from 0.6282 to 0.1362).
Voltage violations were eliminated in both systems when two or more DG units were deployed, decreasing from 39 and 61 violations, respectively, to zero in each case. These improvements, especially in the three-DG case, are reflected in more compact Pareto fronts (Figure 11 and Figure 12), closer to the origin in 3D plots, indicating better overall trade-off performance across all objectives.

5.2. Quality and Selection of Compromise Solutions

Evaluation of compromise solutions using five multi-objective decision-making techniques revealed that TOPSIS consistently produced the highest quality scores. For example, the TOPSIS score for the 1-DG scenario in the 33-bus system was 0.7055, compared to 0.6348 in the 3-DG case, suggesting more challenging trade-off dynamics in higher-DG configurations. In the IEEE 69-bus system, the quality scores improved from 0.6984 (1 DG) to 0.6540 (3 DGs). While higher DG counts enhance technical performance, these scores suggest that solution complexity increases, affecting interpretability and decision confidence. The consensus-based decision support framework confirmed these trends, with solution #58 in the 33-bus system (3 DGs) and solution #60 in the 69-bus system (3 DGs) receiving the majority of votes across selection methods (Figure 17 and Figure 18), highlighting their reliability as optimal configurations.

5.3. Correlation Evolution Among Objectives

The objective function correlation matrices (Figure 21 and Figure 22) show a transition from loosely coupled to highly correlated objectives as more DGs are added. In the IEEE 33 bus system, the correlation between voltage deviation and voltage violations increased from 0.26 in the 1-DG case to 0.96 in the 3-DG case, indicating stronger mutual influence. Similarly, power loss and voltage deviation correlations strengthened from 0.26 to 0.74, while power loss and voltage violations exhibited an increasingly negative relationship (–0.65 in 3-DG), suggesting effective trade-off resolution. This trend demonstrates that increased DG deployment not only improves performance but also enhances inter-objective predictability.

5.4. Optimal DG Sizing and Placement Patterns

Analysis of DG capacity distributions (Figure 13 and Figure 14, Table 6) reveals that optimal configurations do not necessarily rely on maximum available capacity. In the IEEE 33-bus system, total DG capacity increased from 2.2869 MW (1 DG) to 3.3407 MW (3 DGs), and from 2.3317 MW to 2.8094 MW in the 69-bus system. However, the quality of compromise solutions did not correlate directly with capacity alone, emphasizing the importance of strategic sizing and spatial diversity.
For example, the best 3-DG solution in the IEEE 33-bus system was distributed across buses 23, 13, and 30, with individual active powers of 0.9154, 1.2387, and 1.1866 MW, demonstrating how dispersed moderate-sized DGs can outperform centralized large units in complex distribution environments.

5.5. Comparative Algorithm Performance

Convergence analysis (Figure 23, Figure 24, Figure 25, Figure 26, Figure 27, Figure 28 and Figure 29) confirms that MOGWO consistently outperforms NSGA-II and MOPSO in both convergence speed and solution quality. In the 33-bus system, MOGWO achieved optimal power loss reduction within the first 10 iterations in the 3-DG case, while NSGA-II stagnated early and PSO converged slower with higher residual loss. Voltage deviation and violation minimization followed a similar trend, further validating MOGWO’s superiority for computational efficiency and solution robustness.
Optimization time remained nearly constant across DG scenarios, averaging around 24,300 s for the 33-bus system and 24,940 s for the 69-bus system (Table 4), showing scalability even in multi-DG configurations.

5.6. Practical Implications and Future Direction

Results underscore the viability of the proposed MOGWO-based framework for real-world utility applications. By integrating realistic E-bus travel profiles, SOC behavior, and flash charging patterns, the model reflects urban transit dynamics with high fidelity. The deployment of moderate-sized DGs at strategically selected buses not only enhances voltage stability and reduces losses but also reduces infrastructure strain caused by high-power flash charging events.
This integrated approach enables distribution system operators and transport planners to collaboratively design smart, resilient, and low-carbon mobility ecosystems. Future research may incorporate battery storage systems (BESS), time-series uncertainties in load demand, and adaptive controls to further optimize grid performance and resilience.

6. Conclusions

This study introduced a comprehensive multi-objective optimization framework for the optimal placement and sizing of distributed generation (DG) units in electric bus (E-bus) transit systems integrated with high-power flash charging infrastructure. The proposed approach, based on an enhanced Multi-Objective Grey Wolf Optimizer (MOGWO) with Euclidean distance-based Pareto ranking, successfully addressed key distribution system challenges including power loss, voltage deviation, and voltage violations.
The framework’s effectiveness was validated through extensive simulations on modified IEEE 33-bus and 69-bus test systems, incorporating realistic E-bus operational parameters such as a 62 km route with 31 stops and dynamic 90 min load profiles. In the three-DG deployment scenario, MOGWO achieved minimum power losses of 0.0279 MW (IEEE 33-bus) and 0.0179 MW (IEEE 69-bus), with corresponding voltage deviations of 0.1313 and 0.1362, while eliminating voltage violations entirely. Compared to benchmark algorithms, MOGWO consistently delivered superior solution quality, lower variance, and faster convergence, with computation times remaining under 7 h.
In addition, the integration of five compromise solution methods, including TOPSIS and Lp-metric, provided robust and transparent decision support for selecting balanced solutions. The results confirm that the proposed framework is both scalable and practical for modern smart grid applications, especially under the growing electrification demands of urban transit networks. Future work will explore integration with battery storage systems, real-time adaptive control, and stochastic demand modeling to further improve system flexibility and resilience.

Author Contributions

Conceptualization, Y.K., S.M., K.K., W.S.-n.-n. and K.B. (Krischonme Bhumkittipich); methodology, Y.K., P.P., S.D., K.S., T.K., S.M., R.R. and K.B. (Krittidet Buayai); software, Y.K., P.P., S.D., K.S., T.K., S.M. and W.S.-n.-n.; validation, Y.K., P.P., S.D., K.S., T.K., S.M., R.R. and K.B. (Krittidet Buayai); formal analysis, Y.K., S.M., R.R. and K.B. (Krittidet Buayai); investigation, Y.K., P.P., S.D., K.S., T.K., S.M., R.R. and K.B. (Krittidet Buayai); resources, Y.K.; data curation, P.P., S.M. and K.K.; writing—original draft preparation, Y.K., P.P., S.M., K.K. and W.S.-n.-n.; writing—review and editing, writing, Y.K., S.M., W.S.-n.-n. and K.B. (Krischonme Bhumkittipich); visualization, Y.K., P.P., S.M. and W.S.-n.-n.; supervision, Y.K., S.M., K.K. and W.S.-n.-n.; project administration, Y.K., K.K., W.S.-n.-n. and K.B. (Krischonme Bhumkittipich); funding acquisition, K.B. (Krischonme Bhumkittipich). All authors have read and agreed to the published version of the manuscript.

Funding

This research was funded by the High-performance post-doctoral and post-master level research personnel development project in leading-edge research in materials technology to drive the clean energy industry [Contract code: B13F680080].

Data Availability Statement

The authors implemented the work on the simulator. No data set was used.

Acknowledgments

All authors are grateful for the financial support from the High-performance post-doctoral and post-master level research personnel development project in leading-edge research in materials technology to drive the clean energy industry [Contract code: B13F680080] and Intelligent Power System and Energy Research (IPER), Department of Electrical engineering, Faculty of Engineering and Technology, Rajamangala University of Technology Isan, Nakhon Ratchasima 30000, Thailand.

Conflicts of Interest

The authors declare no conflicts of interest.

Abbreviations

The following abbreviations are used in this manuscript:
N Total number of buses in the system
S i Apparent power or complex power injection at bus i
P i Active power or real power
Q i Reactive power or reactive power
i , j From bus i   and To bus j
V i , V j the voltage magnitudes at bus i and j .
θ i j The phase angle difference between bus i and bus j
G i j The conductance between buses i and j
B i j The susceptance between buses i and j
P G , i , t The real power from the main generator at bus i
P D G , i , t The real power from the distributed generator at bus i
P D , i , t The real power demand/load at bus i
P c h , i , t The flash charging power of batteries at bus i
P L , i , t The power loss in the transmission lines
Q G , i , t The reactive power from the main generator at bus i
Q D G , i , t The reactive power from the distributed generator at bus i
Q D , i , t The reactive power demand/load at bus i
Q L , i , t The reactive loss in the transmission lines
t Time interval
T Total time periods
B S routed sequence of bus stops
n The E-bus stop for services
d i Distance between consecutive stops i
D t o t a l The total route distance
ϵ Energy consumption per kilometer
B u s e s F C Set of bus locations where flash charging stations are installed
τ Remaining charging time duration
b i , t Current bus stop of E-bus i at time t
P F C m a x Maximum power rating of the flash charging station
E t r a v e l Energy consumed during movement (depends on speed/distance)
E s t a r t Initial energy when the simulation starts
P c h , i , j Charging power of the E-bus
t Time step (in minutes)
S O C The State of Charge (SOC) of the battery
The set of charging station nodes
B The set of buses in the electrical power system
R L Resistance of line L .
P L t   The real power flows at line t .
Q L t The real power flows at line t .
P D G , k Active power of DG power injection model (in MW)
Q D G , k Reactive power of DG power injection model (in MVar)
S D G , k Comlex power of DG power injection model (in MVA)
A i 2 a · r i a , w i t h   a   2,0   l i n e a r l y   d e c r e a s i n g
D i C i · X i X
r i a random vector
C i 2 · r i
f i x represents the i t h objective function
w i The corresponding user-defined weight
f i , j Value of the j -th objective for the i -th solution
Z The ideal point
d E x The Euclidean distance d E x of a solution x to this ideal point
f j m i n ,   f j m a x Minimum and maximum of objective j
M Set of methods
I The indicator function
v i A vote counter for each solution i 1 , m
s m Solution index selected by method m M
r j A reference point beyond the worst values
i Select the consensus solution
b k Bus index k t h where the DG is installed
x R n The vector of decision variables (e.g., DG locations and capacities)
Ω The feasible solution space
f i x The objective functions to be minimized
g , h Represent inequality and equality constraints.
n The number of generators

References

  1. International Energy Agency. Global EV Outlook 2023: Catching up with Climate Ambitions; International Energy Agency: Paris, France, 2023. [Google Scholar]
  2. Rogge, M.; Wollny, E.; Sauer, D.U. Fast charging battery buses for the electrification of urban public transport—A feasibility study focusing on charging infrastructure and energy storage requirements. Energies 2015, 8, 4587–4606. [Google Scholar] [CrossRef]
  3. Kunith, A.; Mendelevitch, R.; Goehlich, D. Electrification of a city bus network—An optimization model for cost-effective placing of charging infrastructure and battery sizing for large-scale fleets. Appl. Energy 2017, 197, 323–331. [Google Scholar]
  4. Basma, S.; Mansour, S.; Zgheib, D.; Jammal, T.; Bitar, M. Coordination between autonomous electric buses and power distribution networks. In Proceedings of the IEEE Power & Energy Society General Meeting, Portland, OR, USA, 7–9 August 2018; pp. 1–5. [Google Scholar]
  5. Zhang, R.; Cheng, X.; Yang, L. Flexible charging strategies for electric bus systems considering traffic and grid constraints. IEEE Trans. Transp. Electrific. 2020, 6, 262–276. [Google Scholar]
  6. Liu, H.; Zhang, Y.; Ge, S.; Gu, C.; Li, F. Day-ahead scheduling for an electric bus system with battery degradation cost consideration. IEEE Trans. Transp. Electrific. 2019, 5, 982–995. [Google Scholar]
  7. Liu, W.; Liang, S.; Zhang, H.; Liu, X. Distributed charging strategy for electric bus fleet based on dynamic programming. J. Energy Storage 2021, 34, 102112. [Google Scholar]
  8. Adefarati, T.; Bansal, R.C. Integration of renewable distributed generators into the distribution system: A review. IET Renew. Power Gener. 2016, 10, 873–884. [Google Scholar]
  9. Ghosh, S.; Ghoshal, S.P.; Ghosh, S. Optimal sizing and placement of distributed generation in a network system. Int. J. Electr. Power Energy Syst. 2010, 32, 849–856. [Google Scholar]
  10. Moradi, M.H.; Abedini, M. A combination of genetic algorithm and particle swarm optimization for optimal DG location and sizing in distribution systems. Int. J. Electr. Power Energy Syst. 2012, 34, 66–74. [Google Scholar]
  11. Hung, D.Q.; Mithulananthan, N.; Bansal, R.C. Analytical expressions for DG allocation in primary distribution networks. IEEE Trans. Energy Convers. 2010, 25, 814–820. [Google Scholar]
  12. Georgilakis, P.S.; Hatziargyriou, N.D. Optimal distributed generation placement in power distribution networks: Models, methods, and future research. IEEE Trans. Power Syst. 2013, 28, 3420–3428. [Google Scholar]
  13. Das, D. A fuzzy multiobjective approach for network reconfiguration of distribution systems. IEEE Trans. Power Del. 2006, 21, 202–209. [Google Scholar]
  14. Acharya, N.; Mahat, P.; Mithulananthan, N. An analytical approach for DG allocation in primary distribution network. Int. J. Electr. Power Energy Syst. 2006, 28, 669–678. [Google Scholar]
  15. Aman, M.M.; Jasmon, G.B.; Bakar, A.H.A.; Mokhlis, H. A new approach for optimum simultaneous multi-DG distributed generation units placement and sizing based on maximization of system loadability using HPSO (hybrid particle swarm optimization) algorithm. Energy 2014, 66, 202–215. [Google Scholar]
  16. Kaur, S.; Kumbhar, G.; Sharma, J. A MINLP technique for optimal placement of multiple DG units in distribution systems. Int. J. Electr. Power Energy Syst. 2014, 63, 609–617. [Google Scholar]
  17. Sedighizadeh, M.; Rezazadeh, A. Using genetic algorithm for distributed generation allocation to reduce losses and improve voltage profile. World Acad. Sci. Eng. Technol. 2008, 37, 251–256. [Google Scholar]
  18. Tan, W.S.; Hassan, M.Y.; Majid, M.S.; Rahman, H.A. Optimal distributed renewable generation planning: A review of different approaches. Renew. Sustain. Energy Rev. 2013, 18, 626–645. [Google Scholar]
  19. El-Zonkoly, A.M. Optimal placement of multi-distributed generation units including different load models using particle swarm optimization. Swarm Evol. Comput. 2011, 1, 50–59. [Google Scholar]
  20. Deb, K.; Pratap, A.; Agarwal, S.; Meyarivan, T. A fast and elitist multiobjective genetic algorithm: NSGA-II. IEEE Trans. Evol. Comput. 2002, 6, 182–197. [Google Scholar]
  21. Viral, R.; Khatod, D.K. Optimal planning of distributed generation systems in distribution system: A review. Renew. Sustain. Energy Rev. 2012, 16, 5146–5165. [Google Scholar]
  22. Coello, C.A.C.; Pulido, G.T.; Lechuga, M.S. Handling multiple objectives with particle swarm optimization. IEEE Trans. Evol. Comput. 2004, 8, 256–279. [Google Scholar]
  23. AlRashidi, M.R.; El-Hawary, M.E. A survey of particle swarm optimization applications in electric power systems. IEEE Trans. Evol. Comput. 2009, 13, 913–918. [Google Scholar]
  24. Tran, T.T.; Muttaqi, K.M.; Sutanto, D. Multi-objective optimisation of solar power system integration in distribution networks. IET Gener. Transm. Distrib. 2020, 14, 1–12. [Google Scholar]
  25. Jian, L.; Xueliang, H.; Jianqiu, Y.; Yongjiang, B.; Ruoli, W. Optimal siting and sizing of electric vehicle charging stations. Int. J. Electr. Power Energy Syst. 2015, 72, 62–70. [Google Scholar]
  26. Wang, Y.; Chau, K.T.; Chan, C.C.; Li, W. Post-fault operation of redundant flux-switching permanent-magnet motor drive for electric vehicles. IEEE Trans. Magn. 2011, 47, 3051–3054. [Google Scholar]
  27. Gao, C.; Zhang, L.; Zhou, X.; Chen, Y. Location and capacity optimization of electric vehicle charging stations based on user travel patterns. Energies 2019, 12, 1149. [Google Scholar]
  28. Yilmaz, M.; Krein, P.T. Review of the impact of vehicle-to-grid technologies on distribution systems and utility interfaces. IEEE Trans. Power Electron. 2013, 28, 5673–5689. [Google Scholar]
  29. Ahmad, F.; Iqbal, A.; Ashraf, I.; Marzband, M.; Khan, I. Optimal location of electric vehicle charging station and its impact on distribution network: A review. Energy Rep. 2022, 8, 2314–2333. [Google Scholar]
  30. Li, Z.; Guo, Q.; Sun, H.; Wang, Y.; Xin, S. Emission-concerned wind-EV coordination on the transmission grid side with network constraints: Concept and case study. IEEE Trans. Smart Grid 2013, 4, 1692–1704. [Google Scholar]
  31. Richardson, P.; Flynn, D.; Keane, A. Local versus centralized charging strategies for electric vehicles in low voltage distribution systems. IEEE Trans. Smart Grid 2012, 3, 1020–1028. [Google Scholar]
  32. Bi, H.; Gu, Y.; Lu, F.; Mahreen, S. Site Selection of Electric Vehicle Charging Station Expansion Based on GIS-FAHP-MABAC. J. Clean. Prod. 2025, 507, 145557. [Google Scholar]
  33. Kumar, A.; Bhatti, S.K.; Singh, N.P. A review on electric vehicle technologies. J. Electr. Eng. Technol. 2020, 15, 1497–1531. [Google Scholar]
  34. ABB Group. ABB’s Flash Charging e-Bus Solution in Geneva. 2020. Available online: https://new.abb.com/news/detail/17282/abb-flash-charging-ebus-solution-reaches-a-new-milestone-of-half-a-million-km. (accessed on 30 May 2025).
  35. Hitachi Energy. Grid-eMotion® Flash: Fast Charging for e-Mobility. 2022. Available online: https://www.hitachienergy.com/news-and-events/customer-stories/tosa-flash-charging-e-bus-geneva-switzerland (accessed on 30 May 2025).
  36. ABB Group. Public Transportation Is Electrified. 2020. Available online: https://new.abb.com/news/detail/55599/public-transportation-electrified#:~:text=Revolutionary%20TOSA%20technology&text=They%20are%20charged%20via%20a,charging%20technology%20in%20the%20world (accessed on 30 May 2025).
  37. Mirjalili, S.; Mirjalili, S.M.; Lewis, A. Grey wolf optimizer. Adv. Eng. Softw. 2014, 69, 46–61. [Google Scholar]
  38. El-Shorbagy, M.A.; El-Refaey, A.A. Hybridization of grasshopper optimization algorithm with genetic algorithm for solving system of non-linear equations. IEEE Access 2020, 8, 220944–220961. [Google Scholar]
  39. Naderi, E.; Narimani, H.; Fathi, M.; Narimani, M.R. A novel fuzzy adaptive configuration of particle swarm optimization to solve large-scale optimal reactive power dispatch. Appl. Soft Comput. 2017, 60, 441–457. [Google Scholar]
  40. Faris, H.; Aljarah, I.; Al-Betar, M.A.; Mirjalili, S. Grey wolf optimizer: A review of recent variants and applications. Neural Comput. Appl. 2018, 30, 413–435. [Google Scholar]
  41. Heidari, A.A.; Mirjalili, S.; Faris, H.; Aljarah, I.; Mafarja, M.; Chen, H. Harris hawks optimization: Algorithm and applications. Future Gener. Comput. Syst. 2019, 97, 849–872. [Google Scholar]
  42. Qais, M.H.; Hasanien, H.M.; Alghuwainem, S. Enhanced grey wolf optimizer for grid-connected PV system. IEEE Access 2020, 8, 143692–143705. [Google Scholar]
  43. Chitgreeyan, N.; Marksan, P.; Kongjeen, Y.; Sa-Nga-Ngam, W.; Buayai, K.; Kerdchuen, K.; Marsong, S.; Noppakant, A. An Analysis of the Dg Placement for Primary Radial Distribution System Using Q-Leaning Algorithm. In Proceedings of the 2024 International Conference on Power, Energy and Innovations (ICPEI), Nakhon Ratchasima, Thailand, 16–18 October 2024. [Google Scholar]
  44. Hwang, C.L.; Yoon, K. Multiple Attribute Decision Making: Methods and Applications; Springer: Berlin, Germany, 1981. [Google Scholar]
  45. Sankar, M.M.; Chatterjee, K. A posteriori multiobjective approach for techno-economic allocation of PV and BES units in a distribution system hosting PHEVs. Appl. Energy 2023, 351, 121851. [Google Scholar]
  46. Opricovic, S.; Tzeng, G.H. The compromise solution by MCDM methods: A comparative analysis of VIKOR and TOPSIS. Eur. J. Oper. Res. 2004, 156, 445–455. [Google Scholar]
  47. Marler, R.T.; Arora, J.S. Survey of multi-objective optimization methods for engineering. Struct. Multidiscip. Optim. 2004, 26, 369–395. [Google Scholar]
  48. Zeleny, M. Compromise programming. In Multiple Criteria Decision Making; University of South Carolina Press: Columbia, SC, USA, 1973; pp. 262–301. [Google Scholar]
  49. Zitzler, E.; Thiele, L. Multiobjective evolutionary algorithms: A comparative case study and the strength Pareto approach. IEEE Trans. Evol. Comput. 1999, 3, 257–271. [Google Scholar]
  50. Ishibuchi, H.; Pang, L.M.; Shang, K. Solution subset selection for final decision making in evolutionary multi-objective optimization. arXiv 2006, arXiv:2006.08156. [Google Scholar]
  51. Chitgreeyan, N.; Pilalum, P.; Kongjeen, Y.; Kongnok, R.; Buayai, K.; Kerdchuen, K. Modified MATPOWER for Multi-Period Power Flow Analysis with PV Integration. GMSARN Int. J. 2025, 19, 165–174. [Google Scholar]
  52. Soliman, I.A.; Tulsky, V.; Abd el-Ghany, H.A.; ElGebaly, A.E. Efficient allocation of capacitors and vehicle-to-grid integration with electric vehicle charging stations in radial distribution networks. Appl. Energy 2025, 377, 124745. [Google Scholar]
  53. Niu, S.; Yu, H.; Niu, S.; Jian, L. Power loss analysis and thermal assessment on wireless electric vehicle charging technology: The over-temperature risk of ground assembly needs attention. Appl. Energy 2020, 275, 115344. [Google Scholar]
Figure 1. Electric bus (E-bus) flash charging station connected by a roof-mounted pantograph charger.
Energies 18 03638 g001
Figure 2. Modified the IEEE 33 bus radial distribution system integrated by flash charging station under E-bus route line.
Energies 18 03638 g002
Figure 3. Modified the IEEE 69 bus radial distribution system integrated by flash charging station under E-bus route line.
Energies 18 03638 g003
Figure 4. Power demand of flash charging stations (FCS) and the state of charge (SOC) profiles of electric bus (E-bus) batteries over a 90 min period. (a) Power demand of FCSs (b) The SOC of the E-buses.
Energies 18 03638 g004
Figure 5. Comparison of the total power loss and voltage deviation in 2D solution of IEEE 33 bus testing system: (a) Single DG placement; (b) Two DGs placement; (c) Three DGs placement.
Energies 18 03638 g005
Figure 6. Comparison of the total power loss and voltage deviation in 2D solution of IEEE 69 bus testing system: (a) Single DG placement; (b) Two DGs placement; (c) Three DGs placement.
Energies 18 03638 g006
Figure 7. Comparison of the total power loss and voltage violation in 2D solution of IEEE 33 bus testing system: (a) Single DG placement; (b) Two DGs placement; (c) Three DGs placement.
Energies 18 03638 g007
Figure 8. Comparison of the total power loss and voltage violation in 2D solution of IEEE 69 bus testing system: (a) Single DG placement; (b) Two DGs placement; (c) Three DGs placement.
Energies 18 03638 g008
Figure 9. Comparison of the voltage deviation and voltage violation in 2D solution of IEEE 33 bus testing system: (a) Single DG placement; (b) Two DGs placement; (c) Three DGs placement.
Energies 18 03638 g009
Figure 10. Comparison of the voltage deviation and voltage violation in 2D solution of IEEE 69 bus testing system: (a) Single DG placement; (b) Two DGs placement; (c) Three DGs placement.
Energies 18 03638 g010
Figure 11. Comparison of the total power loss, voltage deviation and voltage violation in 3D solution of IEEE 33 bus testing system: (a) Single DG placement; (b) Two DGs placement; (c) Three DGs placement.
Energies 18 03638 g011
Figure 12. Comparison of the total power loss, voltage deviation and voltage violation in 3D solution of IEEE 69 bus testing system: (a) Single DG placement; (b) Two DGs placement; (c) Three DGs placement.
Energies 18 03638 g012
Figure 13. Comparison of the total capacity of DGs placement from three scenarios of IEEE 33 bus testing system: (a) Single DG placement; (b) Two DGs placement; (c) Three DGs placement.
Energies 18 03638 g013
Figure 14. Comparison of the total capacity of DGs placement from three scenarios of IEEE 69 bus testing system: (a) Single DG placement; (b) Two DGs placement; (c) Three DGs placement.
Energies 18 03638 g014
Figure 15. Comparison of the quality scores by each method of IEEE 33 bus testing system: (a) Single DG placement; (b) Two DGs placement; (c) Three DGs placement.
Energies 18 03638 g015
Figure 16. Comparison of the quality scores by each method of IEEE 69 bus testing system: (a) Single DG placement; (b) Two DGs placement; (c) Three DGs placement.
Energies 18 03638 g016
Figure 17. Comparison of compromise solution votes by each method of IEEE 33 bus testing system: (a) Single DG placement; (b) Two DGs placement; (c) Three DGs placement.
Energies 18 03638 g017
Figure 18. Comparison of compromise solution votes by each method of IEEE 69 bus testing system: (a) Single DG placement; (b) Two DGs placement; (c) Three DGs placement.
Energies 18 03638 g018
Figure 19. Comparison of the performance comparison from the compromise solution votes by each Method of IEEE 33 bus testing system: (a) Single DG placement; (b) Two DGs placement; (c) Three DGs placement.
Energies 18 03638 g019
Figure 20. Comparison of the performance comparison from the compromise solution votes by each Method of IEEE 69 bus testing system: (a) Single DG placement; (b) Two DGs placement; (c) Three DGs placement.
Energies 18 03638 g020
Figure 21. Comparison of the objective function correlation matrix of IEEE 33 bus testing system: (a) Single DG placement; (b) Two DGs placement; (c) Three DGs placement.
Energies 18 03638 g021
Figure 22. Comparison of the objective function correlation matrix of IEEE 69 bus testing system: (a) single DG placement; (b) two DGs placement; (c) three DGs placement.
Energies 18 03638 g022
Figure 23. Comparative convergence behavior of MOGWO, MOPSO, and NSGA-II in minimizing total power loss for the IEEE 33-bus distribution system.
Energies 18 03638 g023
Figure 24. Comparative convergence behavior of MOGWO, MOPSO, and NSGA-II in minimizing total power loss for the IEEE 69-bus distribution system.
Energies 18 03638 g024
Figure 25. Comparative convergence behavior of MOGWO, MOPSO, and NSGA-II in minimizing voltage deviation for the IEEE 33-bus distribution system.
Energies 18 03638 g025
Figure 26. Comparative convergence behavior of MOGWO, MOPSO, and NSGA-II in minimizing voltage deviation for the IEEE 69-bus distribution system.
Energies 18 03638 g026
Figure 27. Comparative convergence behavior of MOGWO, MOPSO, and NSGA-II in minimizing voltage violation for the IEEE 33-bus distribution system.
Energies 18 03638 g027
Figure 28. Comparative convergence behavior of MOGWO, MOPSO, and NSGA-II in minimizing voltage violation for the IEEE 69-bus distribution system.
Energies 18 03638 g028
Figure 29. Comparative Analysis of Total Optimization Time and Convergence Behavior of MOGWO, MOPSO, and NSGA-II for the IEEE 33- and IEEE 69-Bus Distribution Systems with 100 iterations.
Energies 18 03638 g029
Table 1. Charging power levels and charging time of E-bus.
Charger TypePower Charger Level (kW)Charging TimeApplication/Use CaseRef.
Depot Charger40–150 kW4–6 h.E-bus depot, end-of-line, high-demand E-buses[33,34]
Flash Charger (Pantograph for E-bus)600 kW20 s–2 minOn-route ultra-fast top-up[35,36]
Fast Charger100–600 kW (less common)5–10 min (Gas refueling)Certain bus stop[33]
Table 2. Comparative analysis of optimization frameworks for DG and E-bus integration.
CriteriaTraditional Single-Multi-Objective MethodsE-Bus Charging StudiesRecent Integrated ApproachesProposed MOGWO
Ref.[13,14,15,16,17,18,19][20,21,22,23,24][25,26,27,28,29,30,31][32]
Optimization ApproachSingle objectiveMultiple objectives withSingle objective (charging optimization)Site selection using spatial MCDATrue multi-objective with Pareto
Objective Functions1 (Power loss OR2–3 (Weighted combination)1–2 (Cost/time minimization)Land use, demand, traffic, grid distance3 (Power loss + Voltage deviation + Violations)
Weight SelectionNot applicableManual/subjective weight assignmentNot applicableFAHP (fuzzy AHP) weightingAutomatic (Euclidean distance-based)
E-Bus IntegrationNot consideredStatic load assumptionsDetailed charging modelingLocation-based demand assumptionComprehensive dynamic modeling
Charging DynamicsNo charging
consideration
No charging patternsStatic charging schedulesNot modeledReal-time flash charging (600 kW)
Route ModelingNot applicableNot consideredSimplified routesIntegrated via GIS layers31-stop, 62 km realistic route
Battery ModelingNot applicableNot consideredBasic SOC trackingNot applicableDynamic SOC with constraints
Network ConstraintsBasic voltage limitsLimited constraint handlingNetwork treated as passiveDistance to substations onlyComprehensive constraint integration
Solution SelectionSingle solutionPareto front providedSingle solutionMABAC method for best site5-method consensus selection
Decision SupportMinimalLimited guidanceProblem-specificStructured MCDA rankingComprehensive decision framework
Algorithm TypeNot applicableManual selectionNot applicableGIS + FAHP + MABACTOPSIS, Euclidean, L2-metric, etc.
Optimization TechniquesGA, PSO, ABCNSGA-II, MOPSOHeuristic/MathematicalMulti-Criteria Decision Analysis (MCDA)Enhanced Grey Wolf Optimizer
Convergence50–100100–200Not applicableDeterministic MCDA100 (Speed up more NSGA-II 31.87%)
ScalabilityModerateSlow (high computational cost)Fast (simplified problem)VariableFast (50–70 iterations)
Validation ScopeIEEE 33/69-busIEEE 33/69-busCustom networksNational urban planning model (China)IEEE 33/69-bus with realistic E-bus
Real-world DataPower flow analysisMulti-objective metricsCharging performanceGIS, population, traffic dataComprehensive (Power + E-bus)
Time HorizonSynthetic loadsTheoretical scenariosLimited real dataLong-term planningActual E-bus specifications
Fleet CoordinationStatic/Peak hourStatic snapshotsDaily schedulingNot included90 min. dynamic simulation
Charging TechnologyNot applicableNot consideredLimited coordinationPlanning-level assumptionsMulti-bus fleet optimization
Performance MetricsNot applicableNot consideredGeneric chargingGIS scores, distance, land useFlash charging (1 min. cycles)
VisualizationSingle metric
(loss/voltage)
Multiple but aggregatedCharging-specific metricsGIS maps + site score layersComprehensive multi-dimensional
Table 3. Parameter setup for solving the MOGWO for DGs placement in E-bus transit system integrated with flash charging station.
ParameterValue
E-bus system
Battery capacity100 kWh
Consumption2 kWh/km
Flash charger600 kW (1 min duration)
Charger topologyRoof-mounted pantograph charger
SOC range30–100%
Speed60 km/h
Model typeDiscrete-time SOC update based on route and power flow
E-bus transits3 (E-bus no.1 starts 0 min, E-bus no.2 starts 10 min, E-bus no.2 starts @ 15 min, respectively)
Distance per bus stop station2 km
Flash charging station (Bus no.)5, 8, 11, 14, 17, 30, 27, 24, 2 and 20 (10 Station) of IEEE 33 bus
5, 15, 19, 25, 63, 57, 38, 31, 47 and 42 (10 Station) of IEEE 69 bus
Bus stop terminalS0–S30 (31 Station)
Simulation time90 min
MOGWO
Number of wolves100
Max iterations100
Possible DG bus No. position [min max]IEEE 33 bus [2 33] and IEEE69 bus [2 69]
Possible DG size [min max]Active power [0.2 2.5], Reactive power [0.1 0.5]
Number of DGs1, 2, 3
Table 4. Comparative Performance Metrics for Multi-Objective DG placement with varying numbers of DG units of IEEE 33 bus and IEEE 69 Bus testing system.
CriteriaIEEE 33 BusIEEE 69 Bus
1 DG Unit2 DG Units3 DG Units1 DG Unit2 DG Units3 DG Units
Total DG Capacity (Compromise) (MW)2.28692.77823.34072.33172.76572.8094
Optimization Time (s)24,231.2624,328.3724,374.6224,961.6024,940.0024,928.99
Pareto Solutions Found100100661009177
Average Inter-Solution Distance20.987910.01899.84515.89739.449610.2396
Table 5. Performance comparison of the best values by objective function.
ObjectiveIEEE 33 BusIEEE 69 Bus
1 DG Unit2 DG Units3 DG Units1 DG Unit2 DG Units3 DG Units
Power Loss (MW)0.09500.04510.02790.05430.03130.0179
Voltage Deviation0.48270.18470.13130.62820.15090.1362
Voltage Violations39006100
Table 6. Summary of compromise solutions with consensus-based decision support.
Testing SystemNo. of DGs PlacementLocations
(Bus No.)
Active Powers (MW)Reactive Powers (MVar)Total Power Loss (MW)Voltage DeviationViolationsQuality Score
IEEE 33 bus1 DG92.28690.50000.12020.5284570.7055
2 DG14, 281.1254, 1.65280.4971, 0.50000.06020.2840110.6300
3 DG23, 13, 300.9154, 1.2387, 1.18660.4774, 0.5000, 0.48170.03850.2496110.06348
IEEE 69 bus1 DG602.33170.50000.06070.6554670.6984
2 DG21, 600.6993, 2.06640.3420, 0.49590.0363510.241040180.6322
3 DG60, 64, 171.6766, 0.2000, 0.93270.4537, 0.4460, 0.38920.02210.3026130.6540
Disclaimer/Publisher’s Note: The statements, opinions and data contained in all publications are solely those of the individual author(s) and contributor(s) and not of MDPI and/or the editor(s). MDPI and/or the editor(s) disclaim responsibility for any injury to people or property resulting from any ideas, methods, instructions or products referred to in the content.

