1. Introduction
Nuclear energy currently holds the position of the world’s second-largest contributor to low-carbon electricity generation, after hydropower, with approximately 440 reactors in operation, generating approximately 2600 TWh of electricity in 2023. This corresponds to about 9% of the global electricity supply, according to the World Nuclear Association [
1] and the International Energy Agency (IEA) data [
2]. This performance highlights the strategic importance of nuclear power as a dispatchable, low-emission source that complements the intermittent nature of renewables such as wind and solar power. While many countries increasingly rely on nuclear energy to meet decarbonization goals and enhance energy security, Brazil presents a different trajectory.
Therefore, global nuclear energy remains a significant contributor to low-carbon electricity generation, with several countries expanding their nuclear capacity and flexibility to meet decarbonization goals. By contrast, in Brazil, nuclear energy accounted for only 2% of the electricity generation matrix in 2023, according to the 2024 Brazilian Energy Balance [
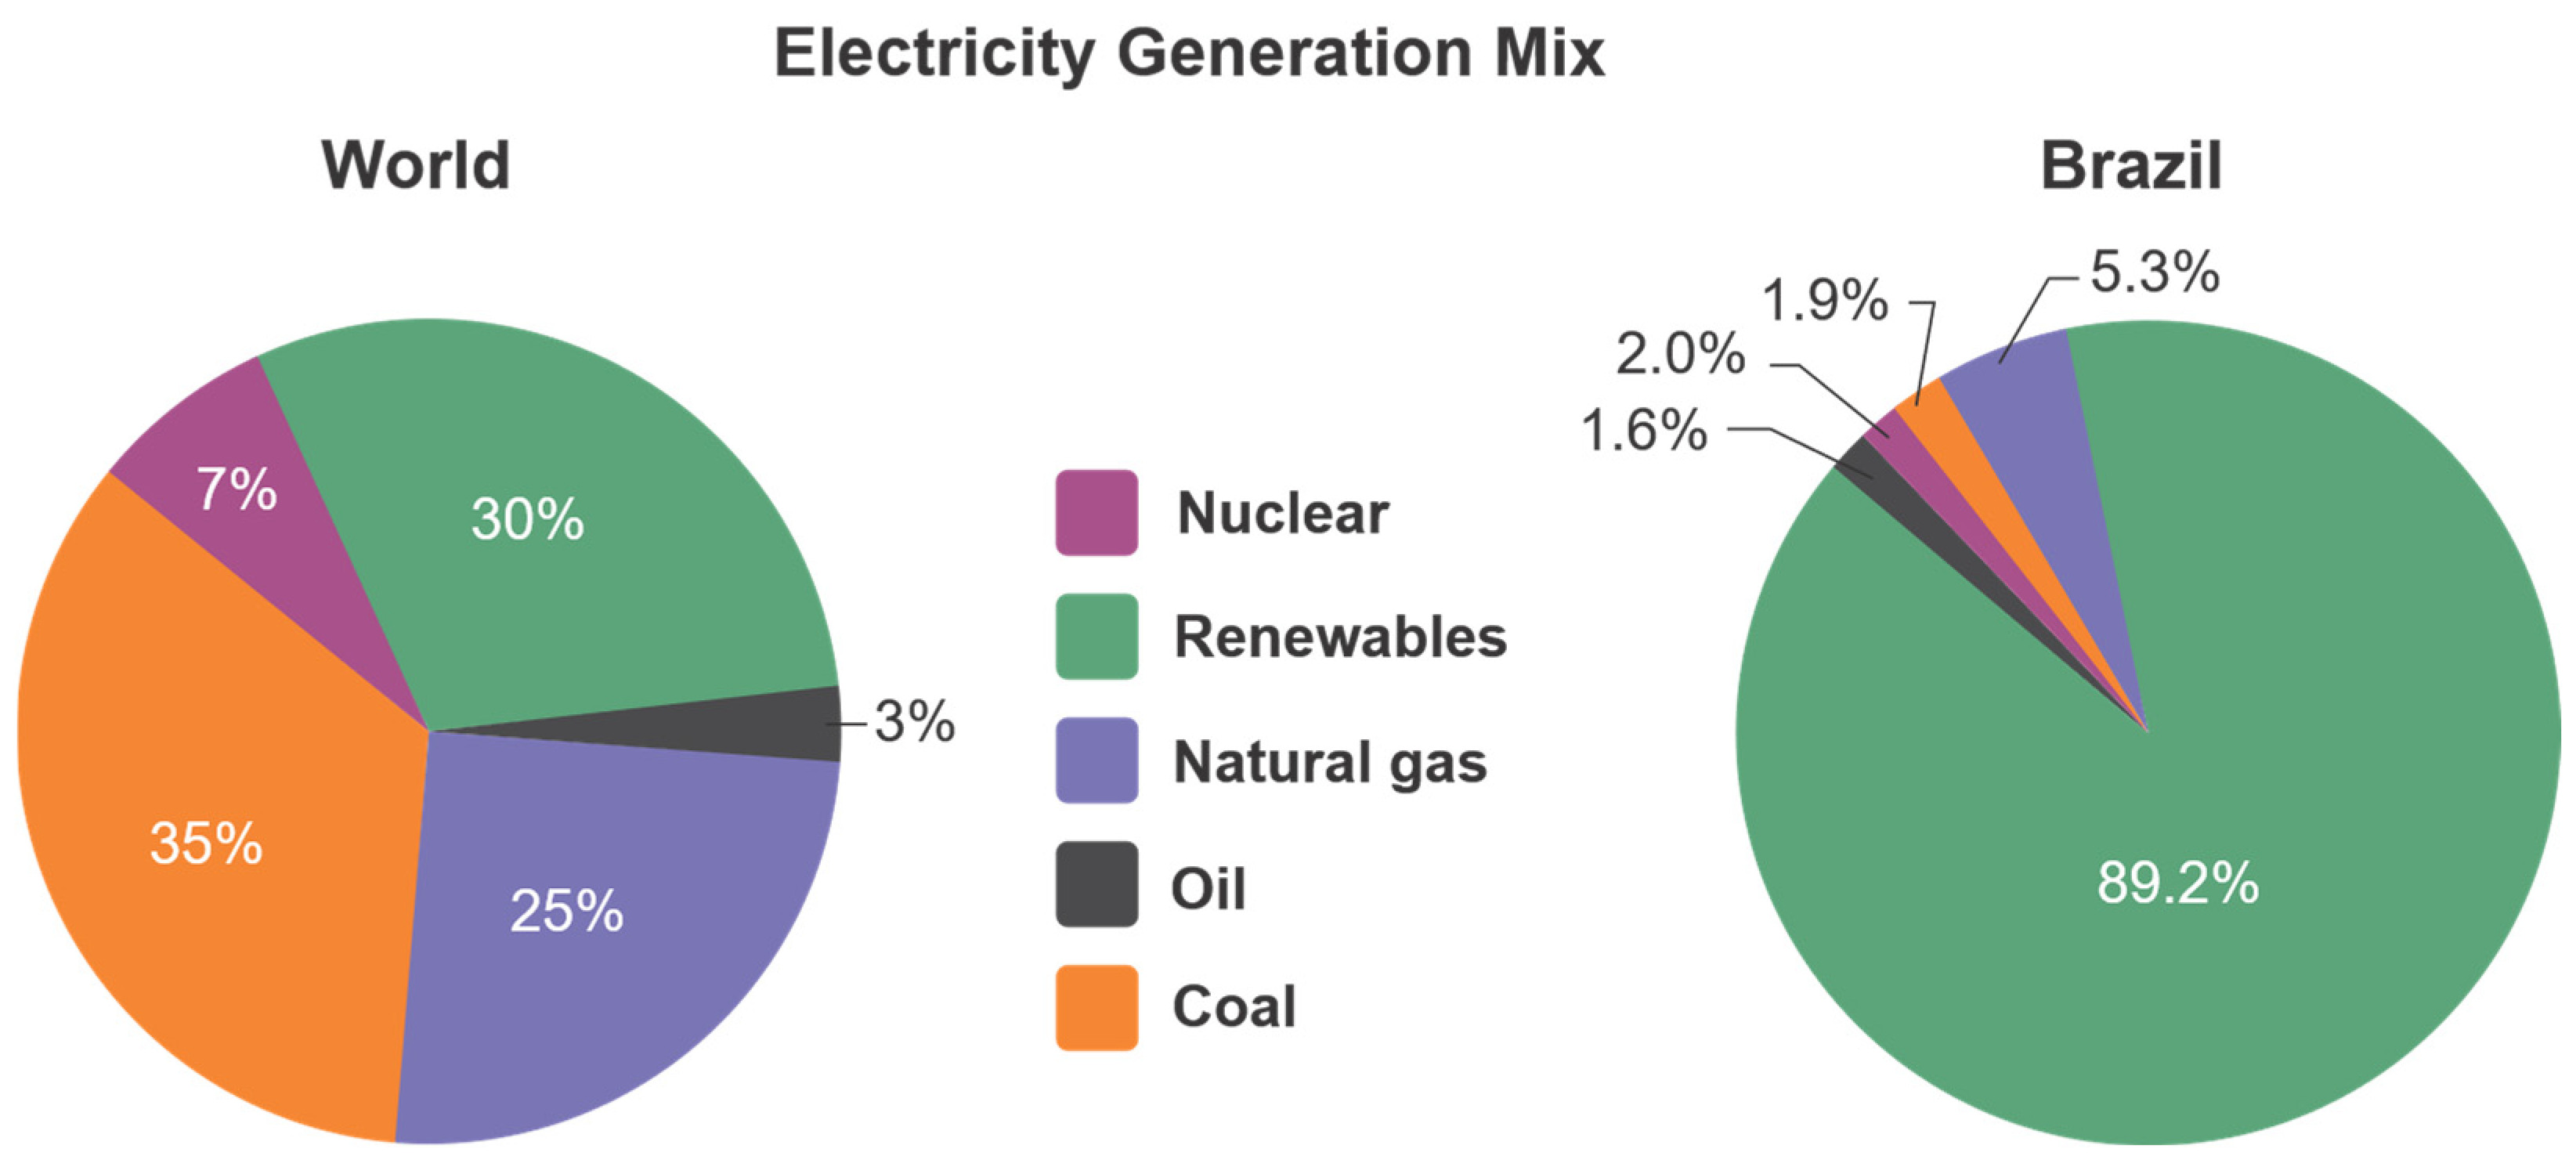
3]. The country operates just two reactors—Angra 1 and Angra 2—while the long-delayed Angra 3 remains under construction. This modest contribution contrasts sharply with Brazil’s overwhelming reliance on renewables, which comprised 89.2% of total electricity generation, most of which comes from hydropower. Fossil fuels—including natural gas, coal, and oil—constitute the remaining 8.8% of the national mix.
Figure 1 shows the electricity generation mix for the world (left) and Brazil (right), based on 2023/2024 data. In the global scenario, fossil fuels dominate, with coal (35%), natural gas (25%), and oil (3%) totaling 63% of total generation. Renewables account for 30% of global electricity, with nuclear power contributing 7%, confirming its rank as the second-largest source of low-carbon electricity after hydropower.
By contrast, Brazil’s electricity profile is strikingly different, marked by a predominant share of renewable sources (89.2%), minimal fossil fuel use (under 9%), and a limited nuclear presence (2%). This disparity underscores Brazil’s historical dependence on its vast hydroelectric potential, unlike the more distributed and fossil-reliant global electricity landscape.
The limited nuclear insertion in Brazil can be attributed to a combination of factors. The historical abundance of hydropower resources reduced the urgency of investing in nuclear alternatives. Additionally, the nuclear sector in Brazil is state controlled, heavily regulated and has faced persistent challenges related to public acceptance, licensing complexity, and high capital costs. Meanwhile, the growing competitiveness of wind and solar, particularly in the northeast, has redirected much of the investment and policy focus in recent years.
Meanwhile, the global nuclear fleet continues to expand in several regions. France, China, South Korea, and the United States exemplify how nuclear power can be a backbone for decarbonized, resilient grids. Countries like China are aggressively building new reactors as part of their strategy to replace coal and meet rising electricity demand. Furthermore, the global rise in Small Modular Reactors (SMRs) offers new prospects for safer, more flexible nuclear deployment. This could benefit countries with dispersed demand or limited grid infrastructure—conditions applicable to large portions of Brazil.
However, the global nuclear sector also faces uncertainty. While new builds are underway in some regions, others are phasing out nuclear due to political decisions, aging infrastructure, or competition with cheaper renewables. Even so, the IEA’s Net Zero by 2050 Scenario [
4] includes a significant increase in nuclear capacity as part of the strategy to eliminate carbon emissions from the power sector by mid-century.
For Brazil, revisiting its nuclear strategy could enhance the resilience of its electricity system, particularly given risks to hydropower, such as prolonged droughts. Nuclear offers a firm, non-intermittent source of generation that could support deeper electrification of other sectors like industry and transport. Realizing this potential will require public investment and a long-term national strategy aligning with financing, regulation, technological innovation, and public trust.
The government and society have a national consensus on a transition toward energy sustainability that reduces environmental impacts, addresses climate change, and promotes social and economic growth by incorporating renewable and low-carbon sources into the national energy matrix. In this context, nuclear energy contributes to reducing carbon and greenhouse gas emissions, improving air and water quality [
5]. However, technological, regulatory, environmental, and economic challenges must be addressed to ensure the long-term integration of nuclear energy into the power generation mix, especially when combined with renewable and hydropower sources, which still represent the largest share of generation in the country.
While the energy transition has increased diversity in generation mixes, it has also intensified vulnerability. The need for flexibility is growing at different rates depending on the electricity system, the penetration level of Variable Renewable Energy Sources (VRES), the degree to which the demand profile matches supply side characteristics, and the system size. Output from wind and photovoltaic sources fluctuate significantly with wind speed and sunlight, making such generation unreliable, unpredictable, and non-dispatchable. Moreover, climate change impacts will increasingly affect renewable electricity generation, further exacerbating its unpredictability [
5].
According to the IEA Power Systems in Transition Report [
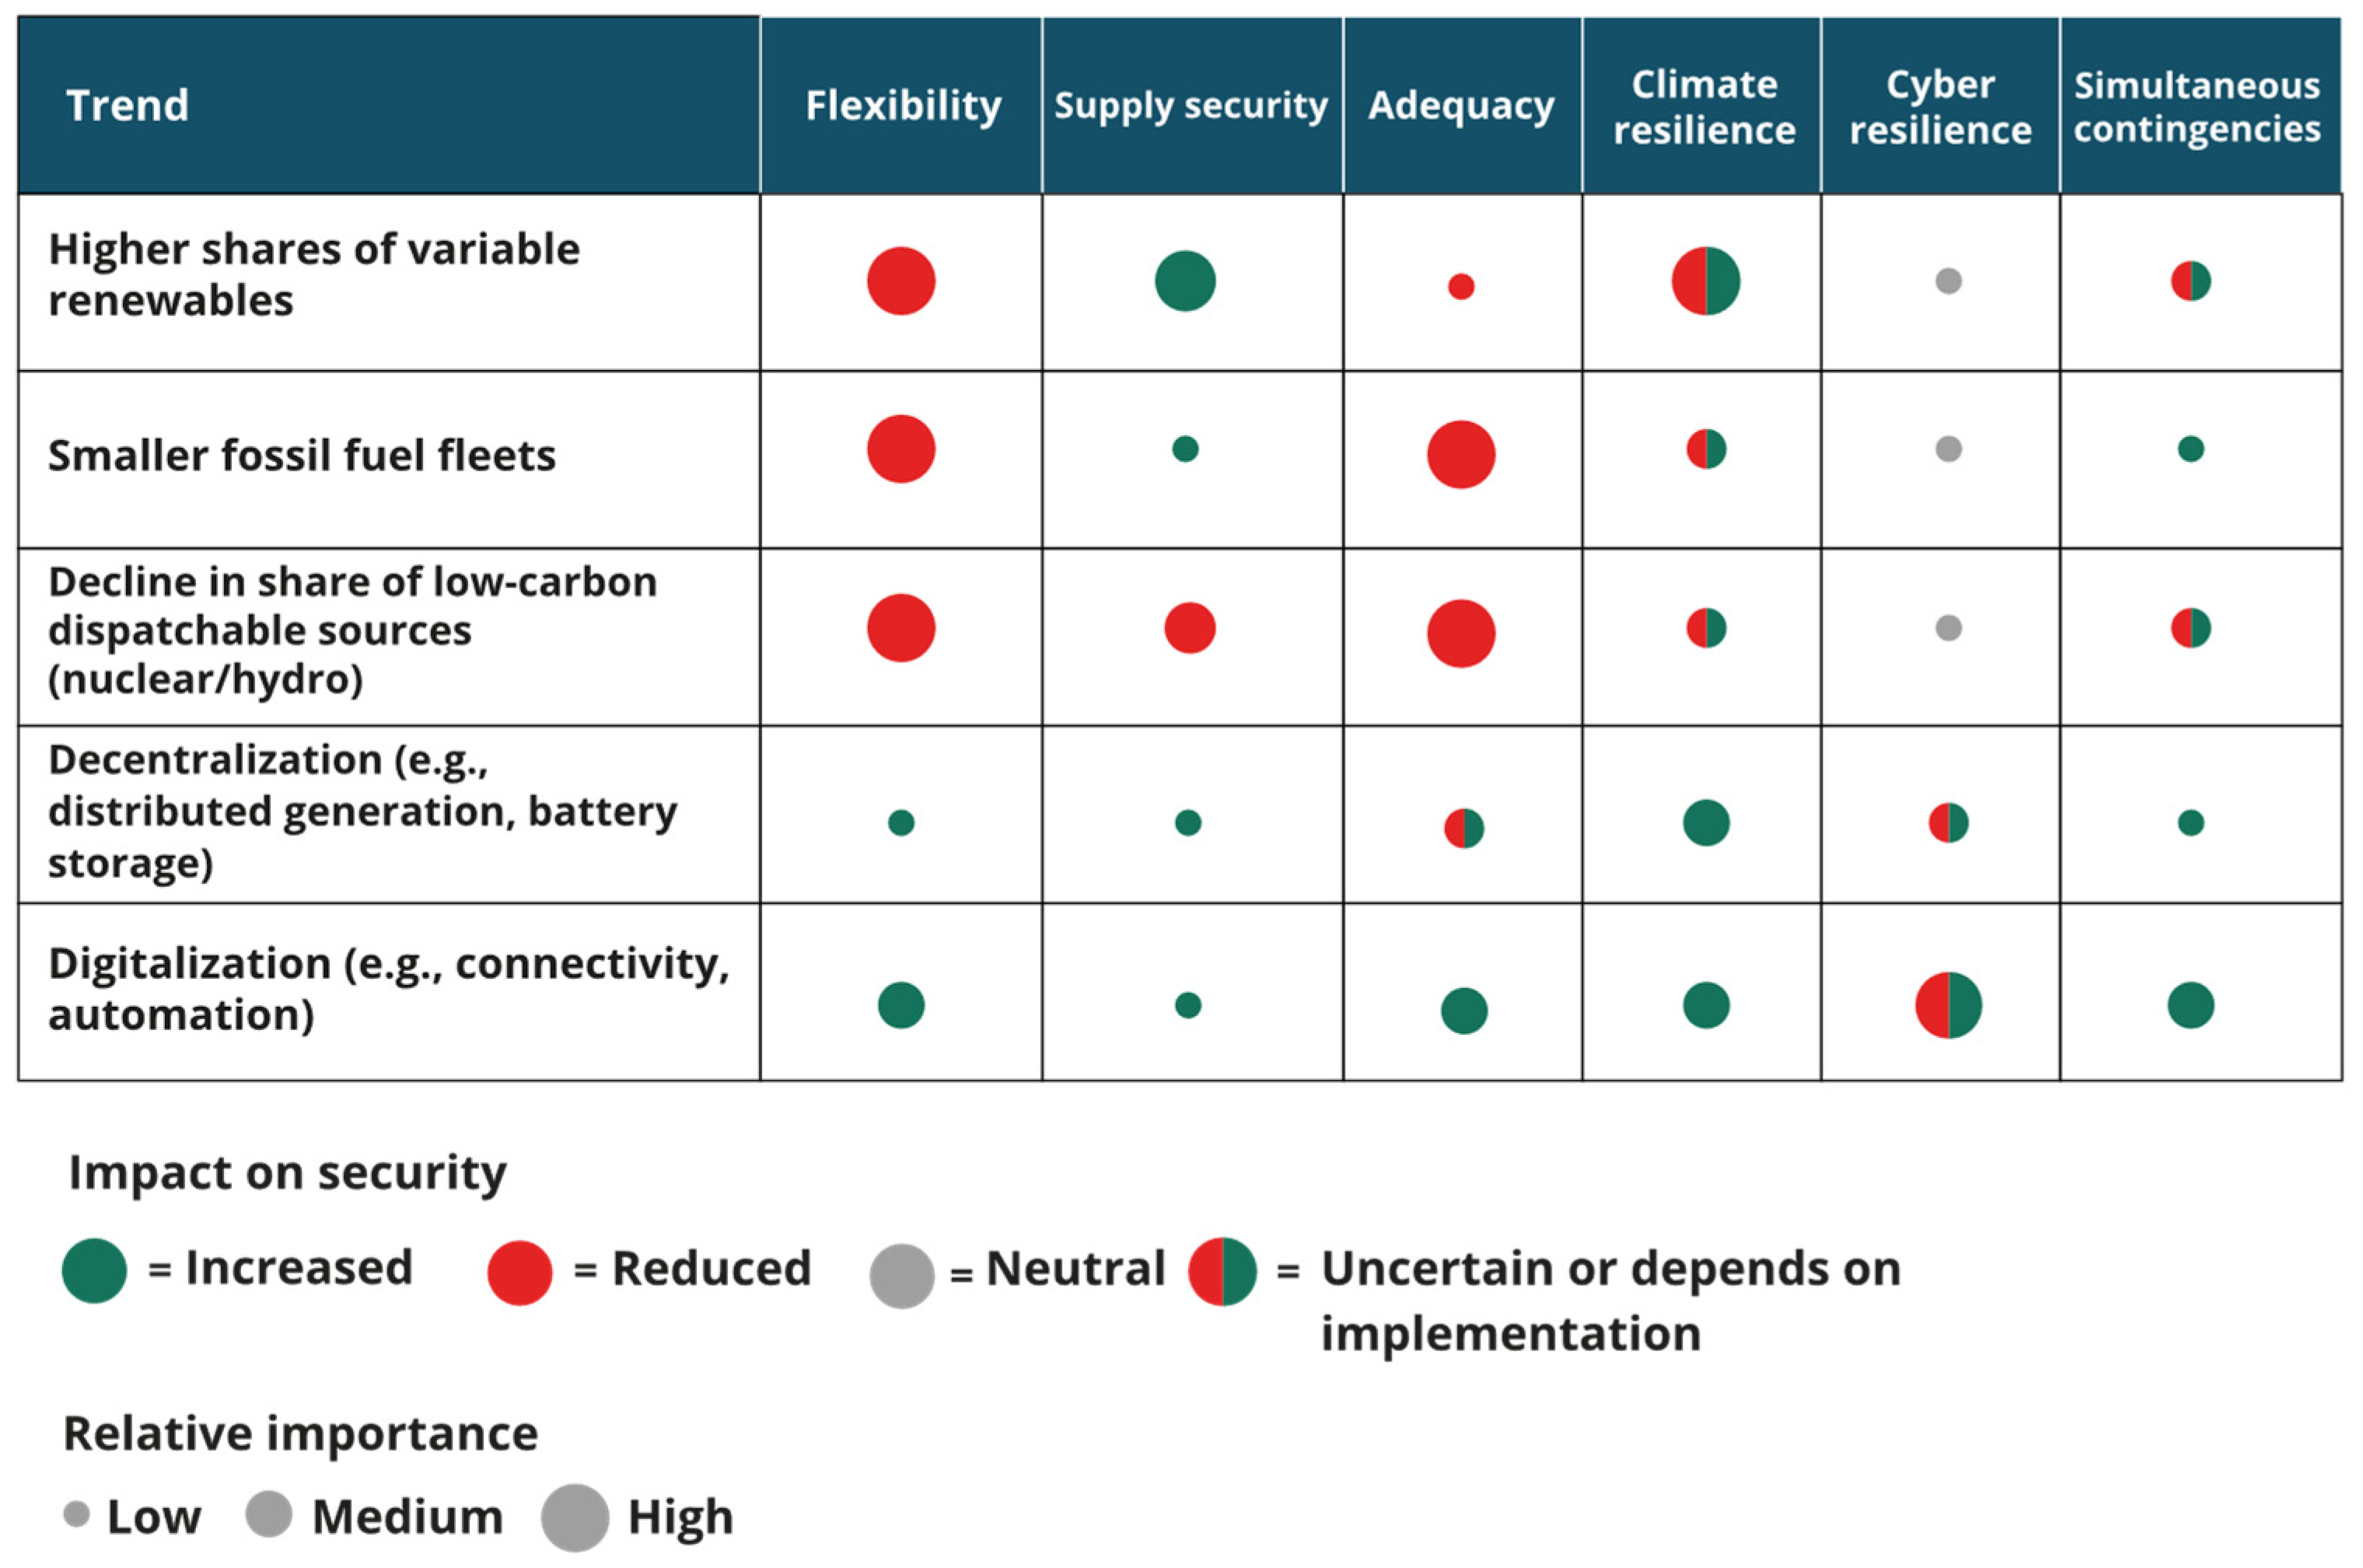
6], these potential impacts affect various dimensions of system security, mainly flexibility.
Figure 2 illustrates these impacts across multiple contexts and circumstances as follows: high renewable penetration, fossil fuel-based generation, the decline in dispatchable low-emission sources, distributed generation, and increasing system digitalization. Through the symbol coding (color and circle size), the severity of security risks becomes evident, especially under high VRES penetration and a reduction in dispatchable sources. Simultaneous contingencies refer to multiple generation or transmission assets failing due to a common sudden event, like an earthquake.
A key strategy for improving security is integrating small-scale distributed generation and large hydro and thermal plants, which can mitigate risks associated with supply interruptions and the inherent intermittency of primary energy sources like wind and solar [
7]. Nevertheless, the growing demand for system flexibility due to increased VRES penetration presents a strategic opportunity for nuclear power plants. Operating in baseload mode, they can be complemented by other flexible low-carbon resources, including interconnections with neighboring grids, demand-side management (utility programs to reduce peak consumption), and storage solutions (e.g., batteries or expanded hydropower storage) [
6].
An interconnected subsystem configuration—linking hydro and renewable sources with a focus on low-emission energy systems —could consider the nuclear power plants’ expansions for the “water storage” role under the concept of “Nuclear Energy = Water.” These units would also supply inertia and stability to an increasingly intermittent power grid.
Brazil has faced climate-related challenges with significant hydrological shortages, particularly from 2011 to 2015 and 2018 to 2021, during which hydropower reservoirs fell below safe levels and inflows drastically reduced hydroelectric generation capacity [
3,
8].
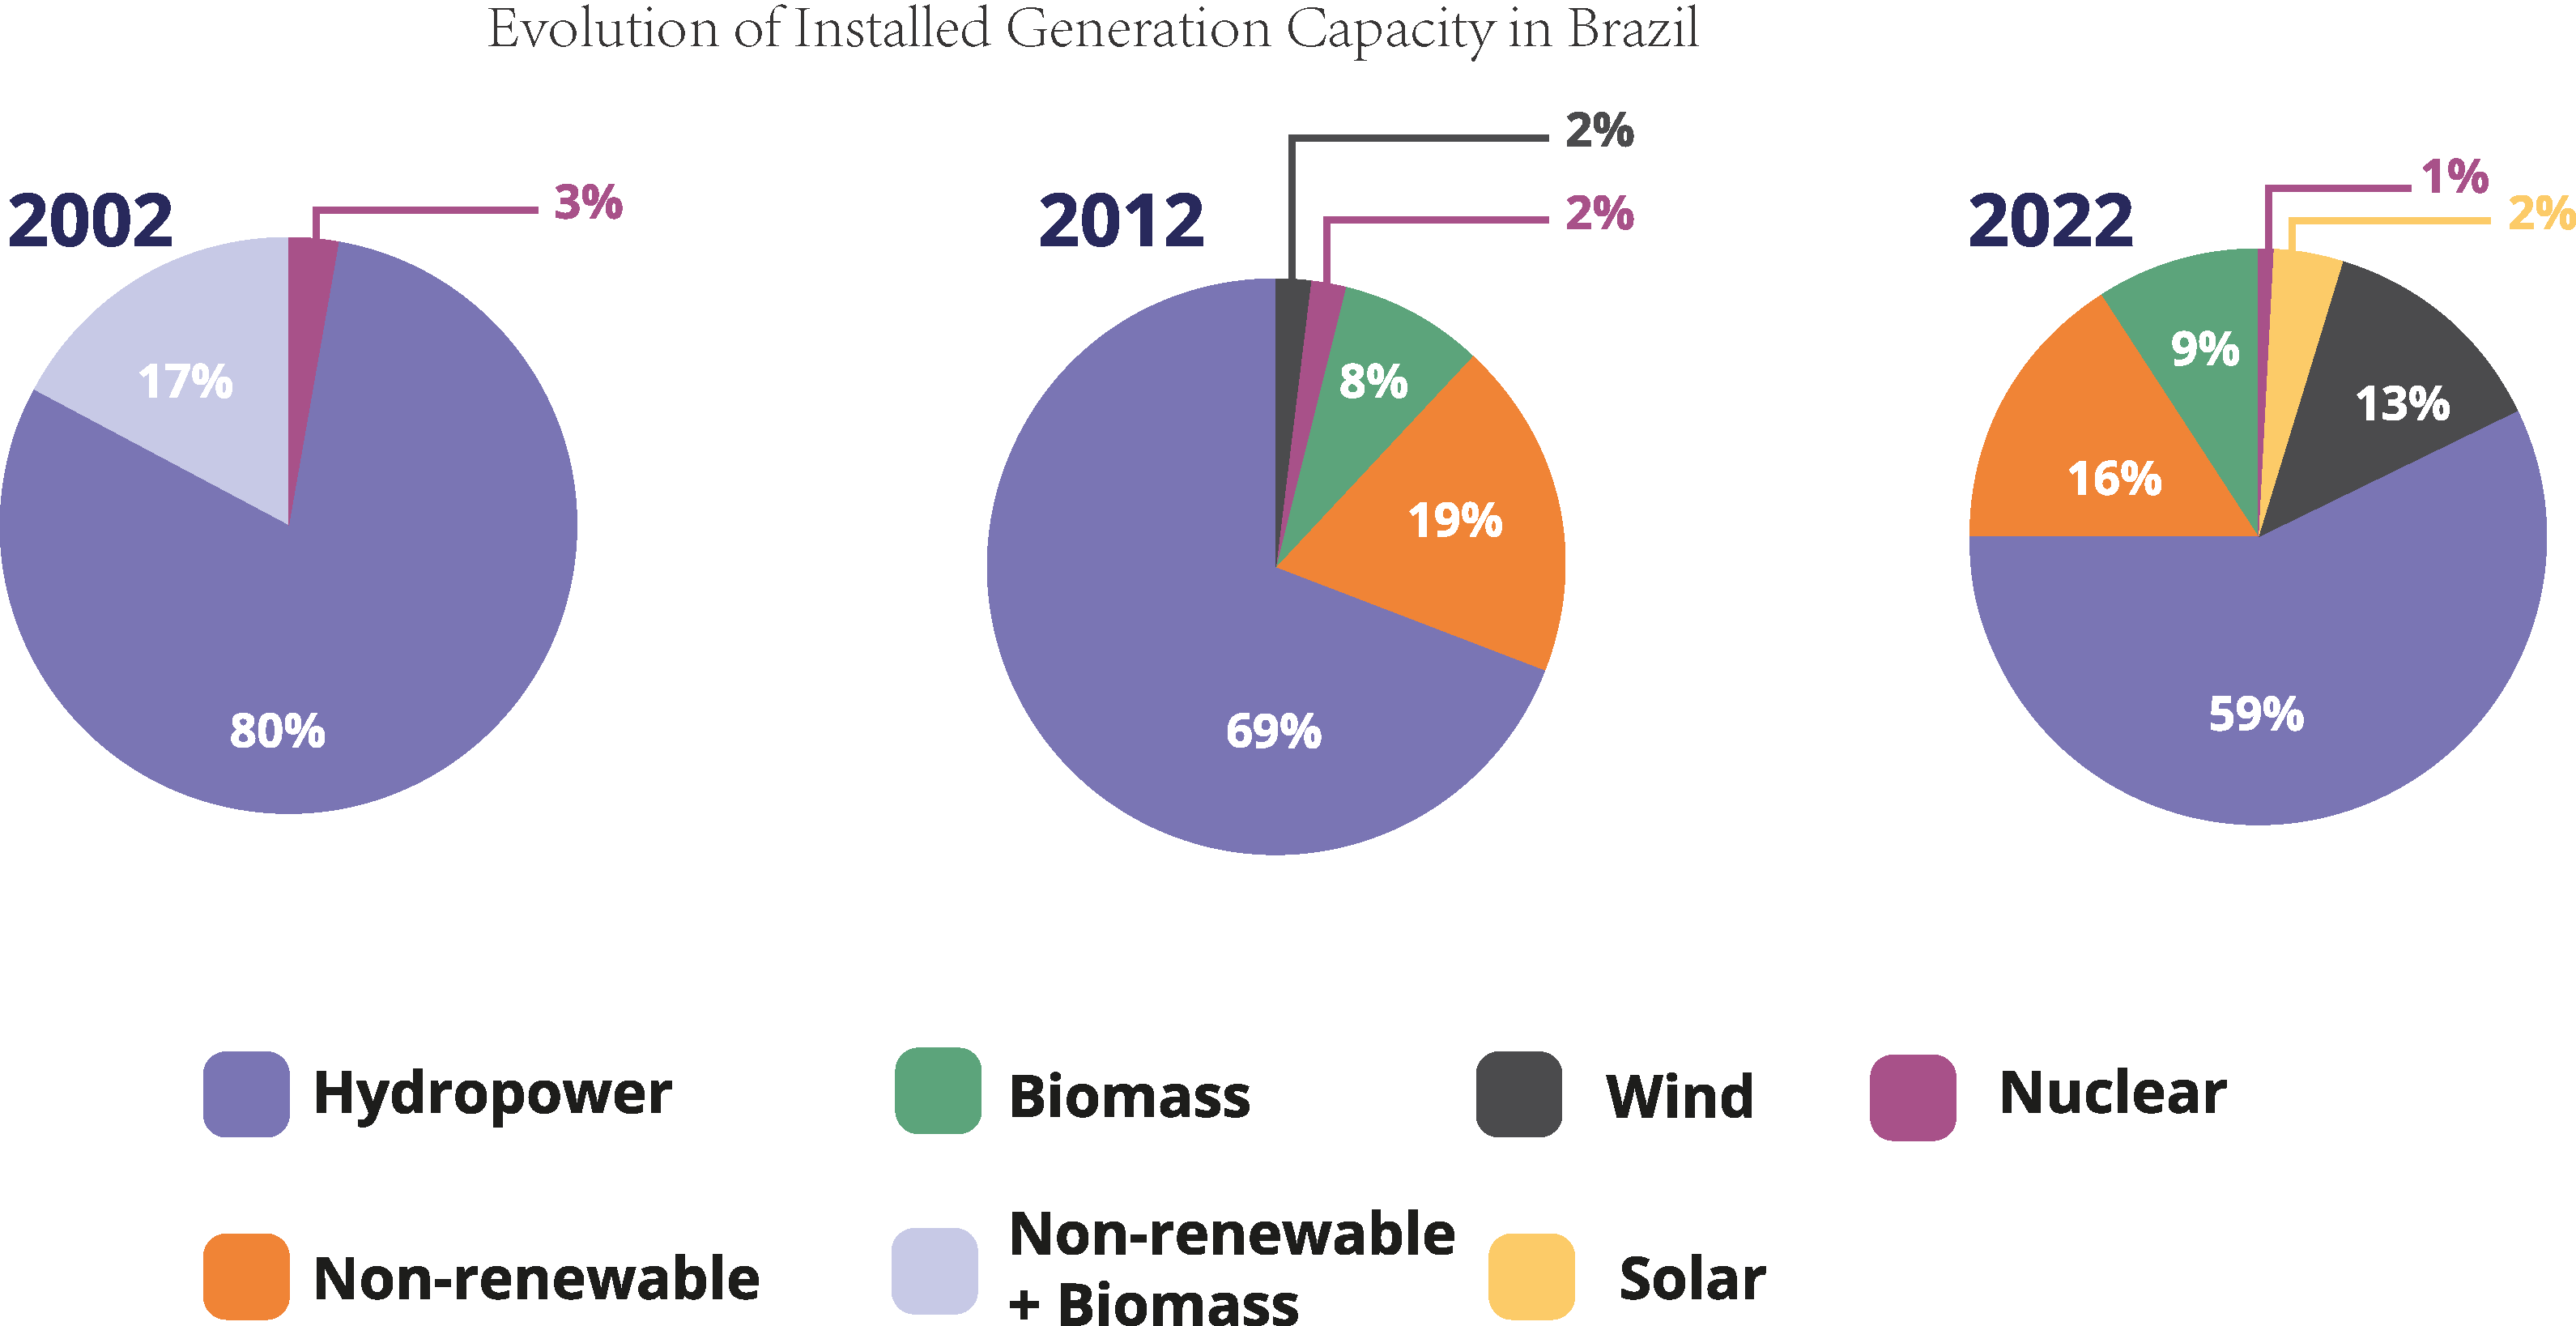
These events occurred within the context of a Brazilian electrical system that was predominantly hydro-based until twenty years ago—a scenario that is no longer the case due to major transformations expected to deepen over the medium and long term. The reduction in the development of new hydropower plants with regulatory capacity and the large-scale integration of VRES have reshaped the Brazilian power matrix over the years, as shown in
Figure 3.
Despite Brazil’s vast hydropower potential, several obstacles hinder the development of new hydro projects. According to the Brazilian Energy Research Office [
9], 42% of the potential hydropower sites studied remain inactive due to (i) denial of preliminary licensing, (ii) environmental infeasibility, (iii) public hearings held over eight years ago, (iv) environmental licensing risks, and (v) lack of economic viability. Additionally, 11% of the sites under study were abandoned by developers, mainly due to environmental infeasibility, local opposition, and legal challenges. Two of these sites alone account for 21 GW of potential capacity.
Concurrently, as the share of renewables in the power matrix continues to expand, a thorough analysis of electromechanical inertia in power systems becomes imperative. This parameter is fundamental to the dynamic response of the grid to frequency disturbances and transient stability events. Nuclear power plants assume a strategic role because they operate with large rotating masses directly coupled to the grid, substantially contributing to the system’s total inertia, and acting as stabilizing agents during large-scale contingencies.
Thus, the aspects discussed in this study aim to establish a “regulatory thermal capacity” as a kind of buffer to mitigate the hydrological uncertainty associated with the reservoirs of hydroelectric plants, benefiting the entire integrated system of dispatchable and non-dispatchable sources and, to some extent, complementing the system’s power requirements. However, this discussion does not extend to structural and structuring measures, which will be addressed in future studies, as a contribution to the ten-year planning process and its criteria for ensuring energy and power supply for system expansion.
2. The Equivalence “Nuclear Energy = Water”
The medium- and short-term planning of energy system operations in Brazil is essentially a stochastic problem since the future availability of inflows—the “fuel” for the primary generation source of the National Interconnected System (SIN)—is inherently uncertain [
10,
11].
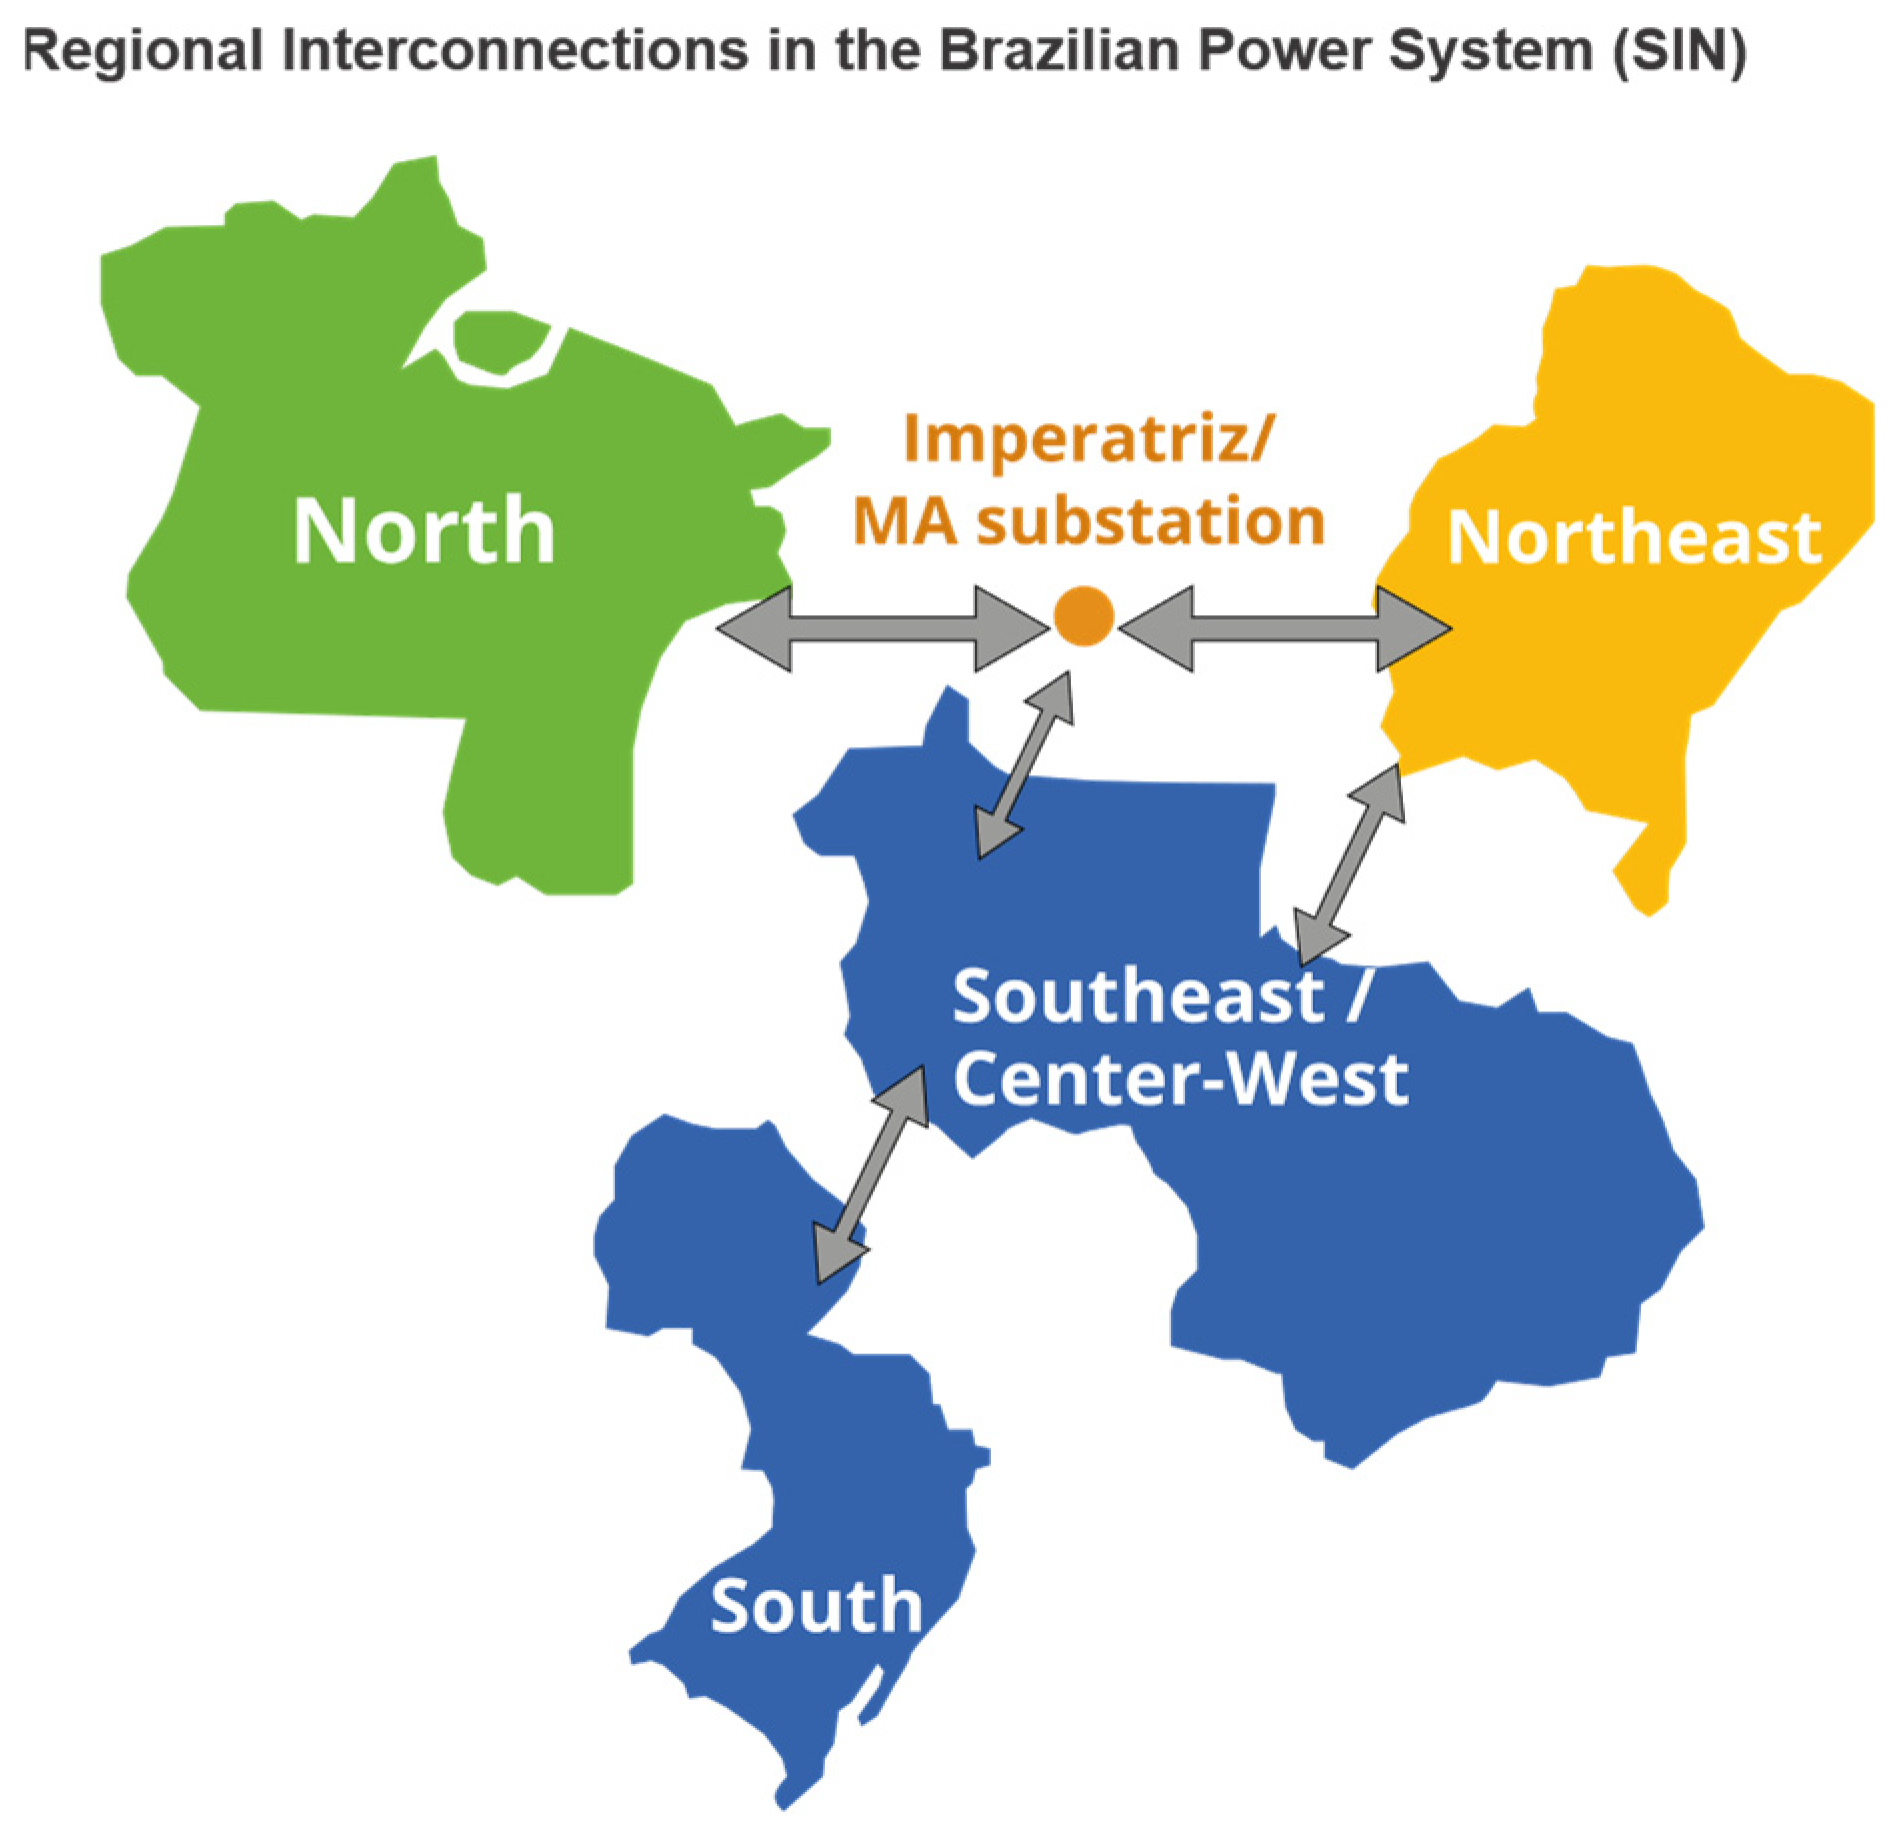
To address this, the Brazilian electrical system relies on an interlinked subsystem strategy supported by the Stochastic Dual Dynamic Programming (SDDP) method. This technique employs an optimization model that simultaneously considers four equivalent energy reservoirs and is used by the National Electric System Operator (ONS) for operational planning.
As shown in
Figure 4, each region is represented by aggregating all its hydro reservoirs into a single equivalent energy reservoir.
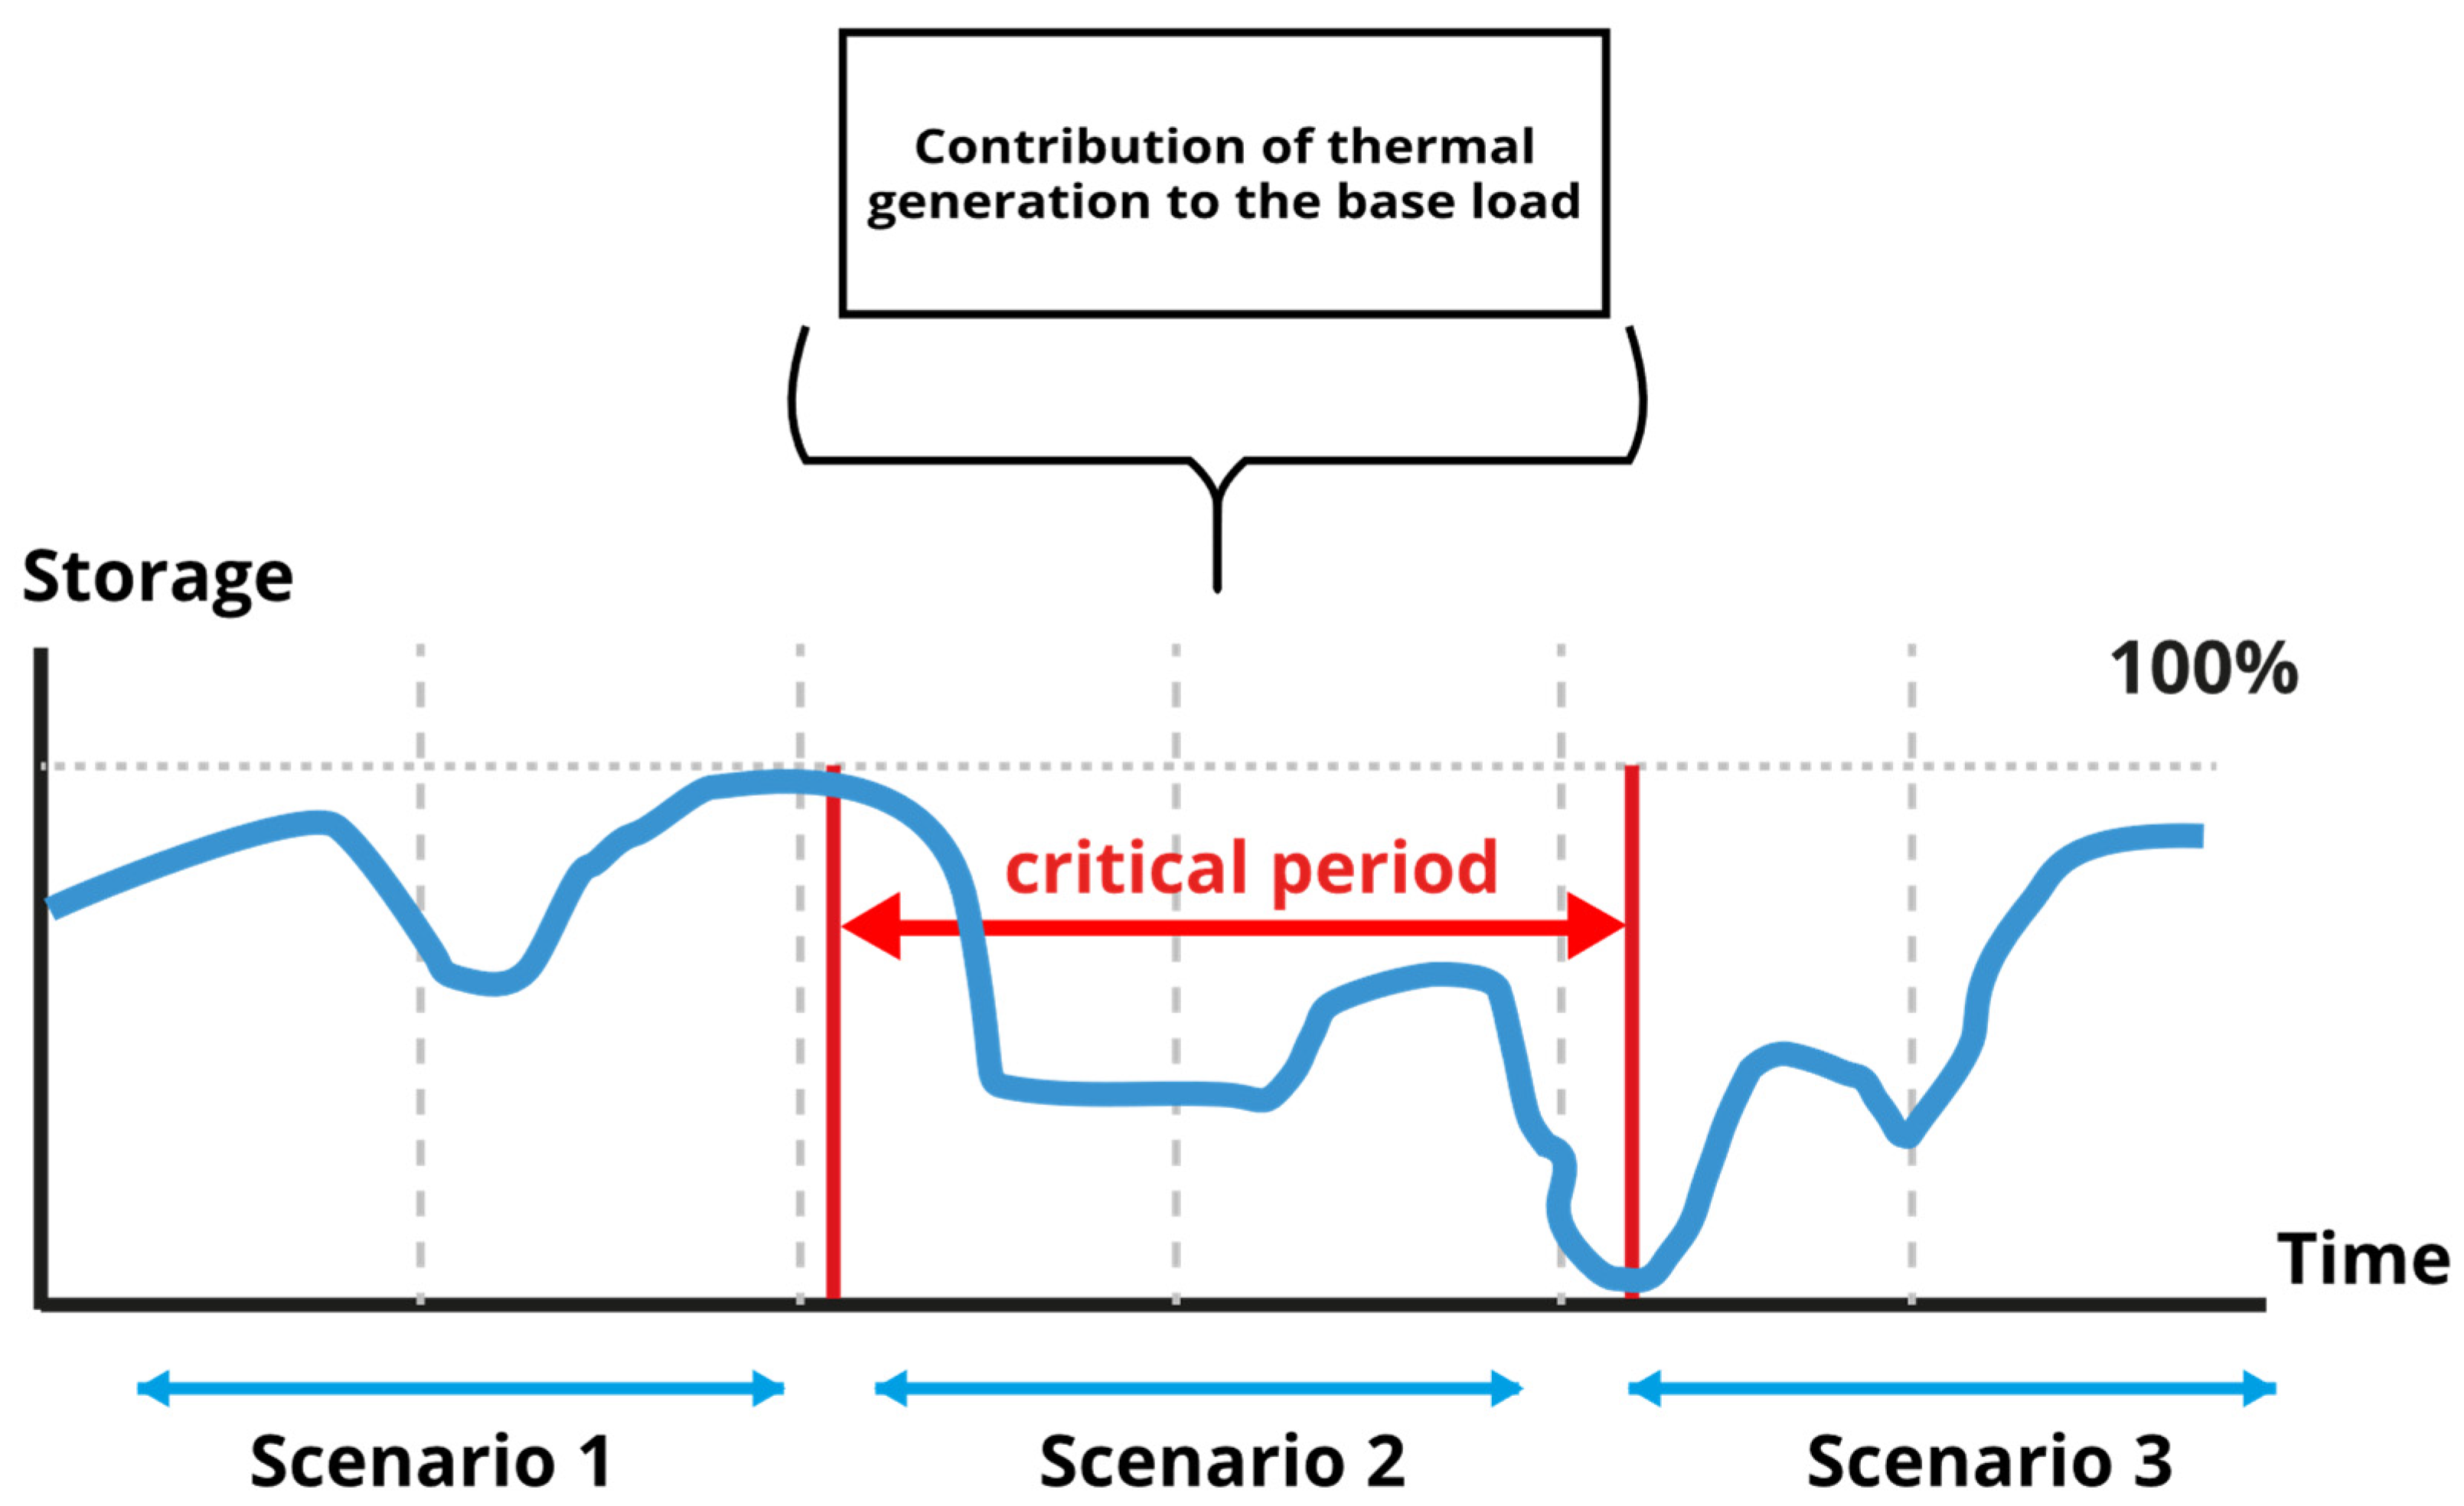
In this system, hydrological uncertainty and demand are among the main variables. The formulation of the Stochastic Dual Dynamic Programming (SDDP) method considers the temporal correlation of inflows to the reservoirs, considering the risk aversion related to supply security. This approach determines the amount of thermal energy to be generated, especially during critical periods of low inflow, as illustrated in
Figure 5.
The curve illustrates multiple scenarios, each comprising various stages with available supply alternatives that depend on the system’s current state. Within this model, the SDDP method determines the balance between the present cost of hydro and thermal generation at the current stage and the future cost from the subsequent stage onward. Although the Brazilian system is based on a recursive optimization procedure, the discussion regarding the use of nuclear energy as an equivalent to hydroelectric generation involves evaluating a firm energy source for power supply that balances demand reliability with improved utilization of stored energy in reservoirs, without compromising the criterion of tariff affordability.
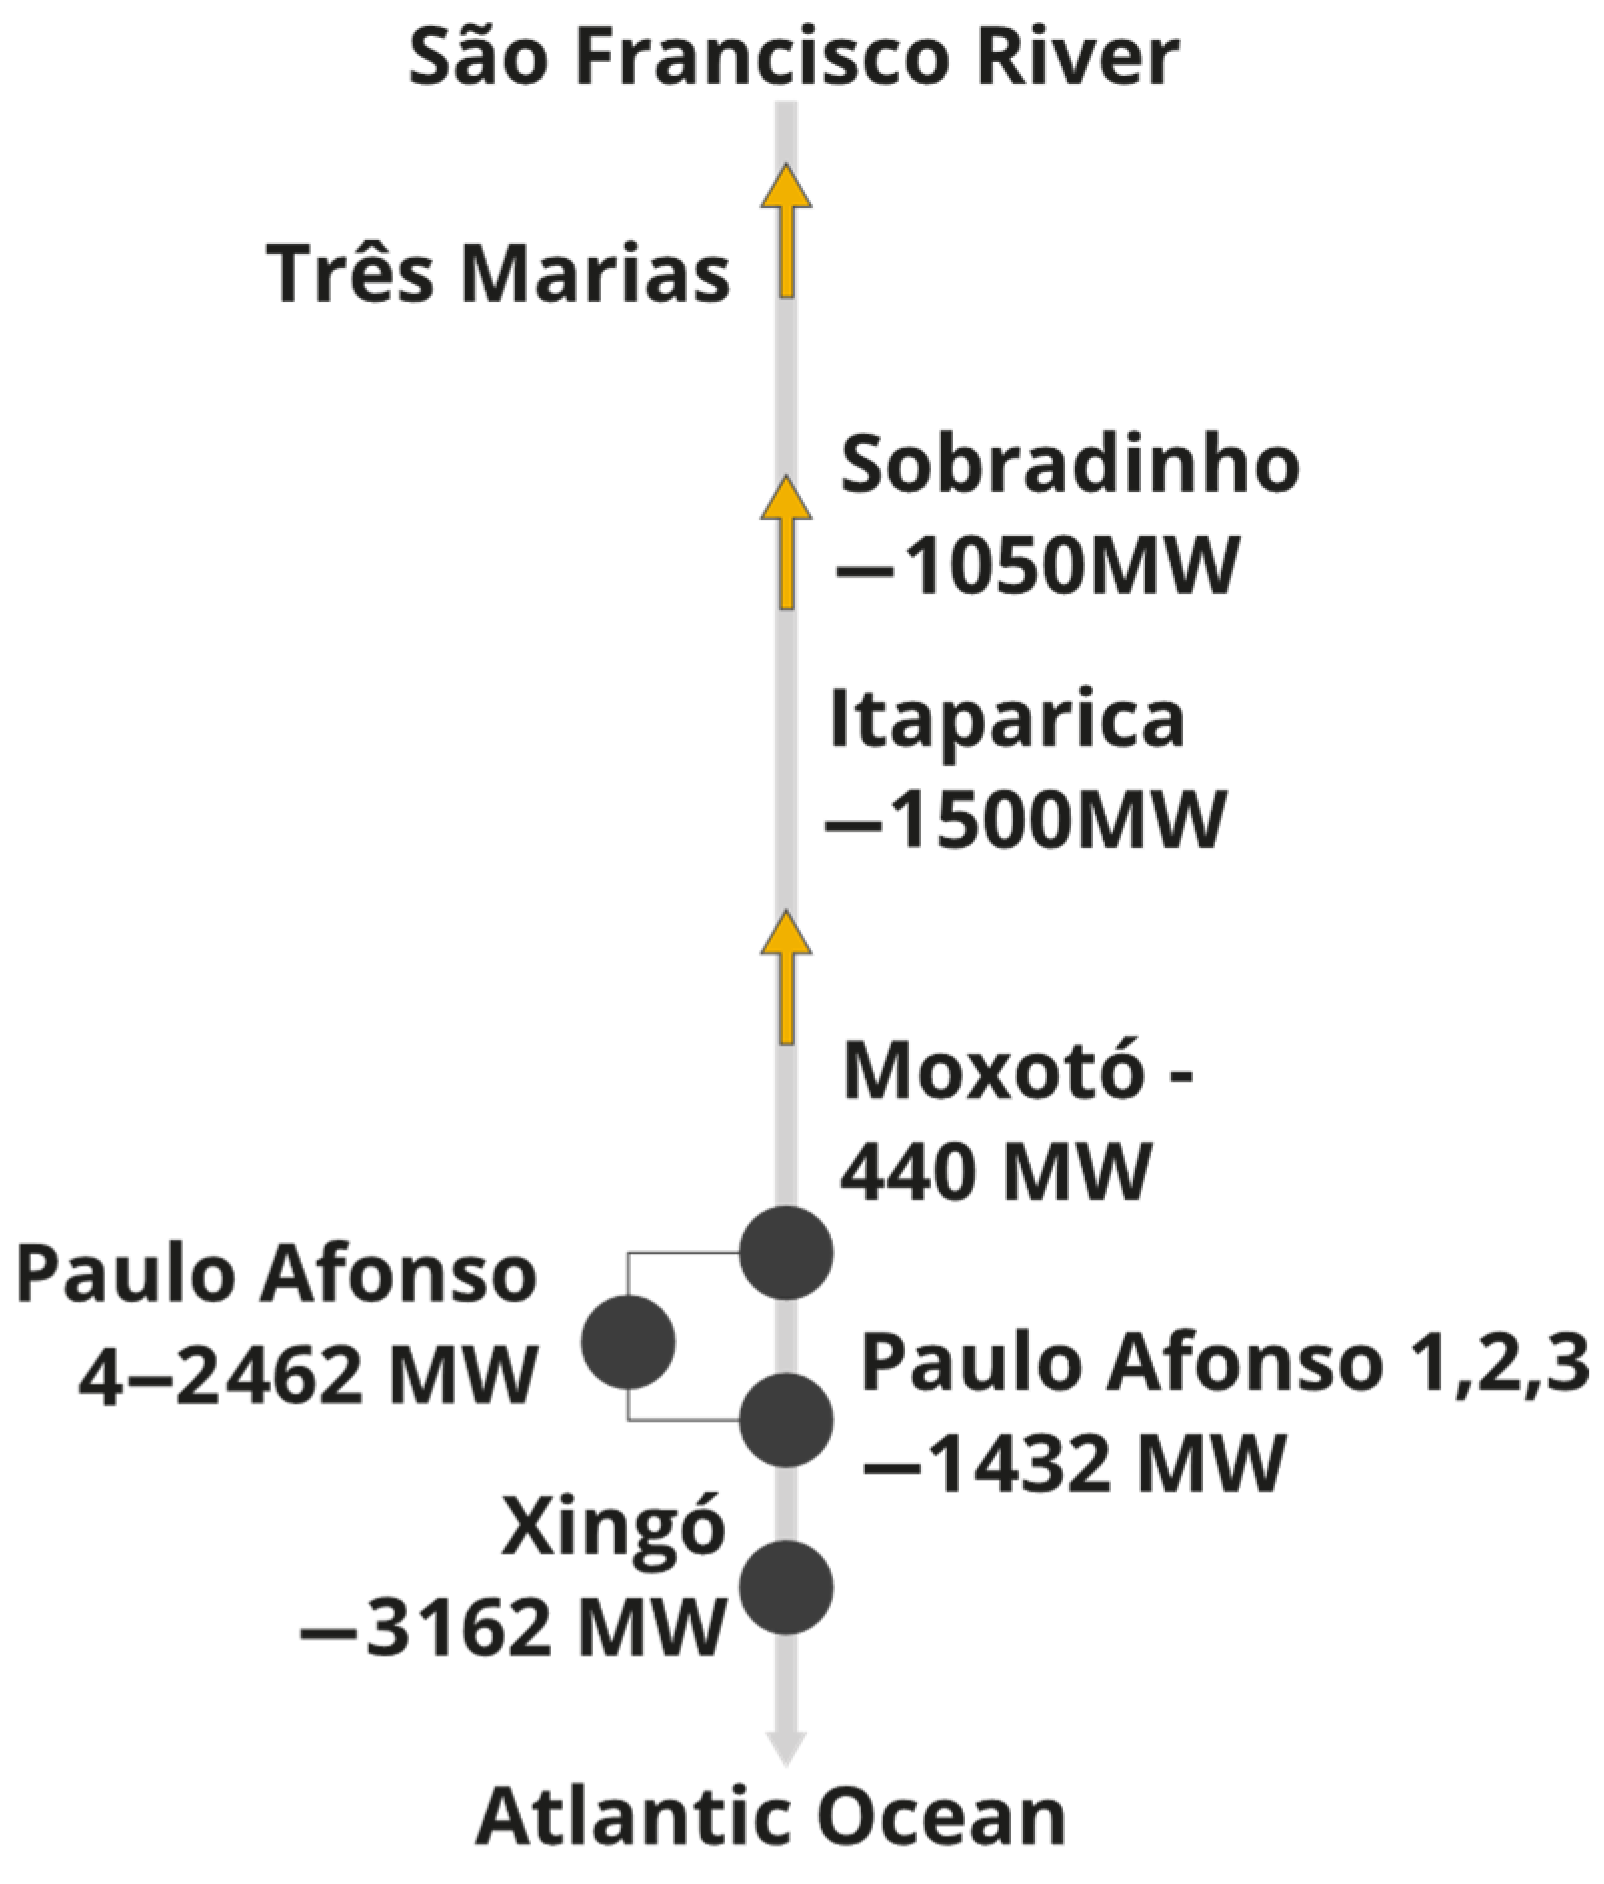
To establish a parameter for the equivalence “Nuclear Energy = Water,” a case study is presented that correlates the energy generated by nuclear power plants with the variation in stored water volume in the reservoirs of the São Francisco River basin over a defined hydro generation period. The São Francisco River basin was selected due to its logical sequence of hydroelectric plants supported by two key accumulation and regulation reservoirs: Três Marias and Sobradinho. From the useful design storage volumes of major Brazilian reservoirs, a conversion factor (i.e., the relationship between stored water volume and average power generation) was calculated to determine the equivalence between nuclear energy output and stored water for Brazilian nuclear plants, establishing a correlation between plant output and reservoir volume.
2.1. Calculation of the “Nuclear Energy = Water” Equivalence Factor
Table 1 presents the design values of the actual active storage volume for the main hydroelectric reservoirs in Brazil [
12], which serve as the basis for analyzing the equivalence between nuclear generation and water storage capacity.
The São Francisco River Basin includes a sequence of hydroelectric plants with a total installed capacity of 10,037 MW, as illustrated in
Figure 6.
The 2010s were marked by severe droughts affecting different regions of Brazil, with a “possible shift in the critical period of inflows into plants in the north, northeast, and parts of the southeast/central-west subsystems” [
13]. Using long-term trend verification tests, such as the Mann–Kendall (MK) test, for the periods 1931–2010 and 1932–2020, these authors found a significant trend in either increased or reduced inflows in hydroelectric plants. Among 77 UHEs (48% of all plants in Brazil), 24 (31%) showed reduced flows, including all in the northeast, and notable reductions in the São Francisco River basin [
14].
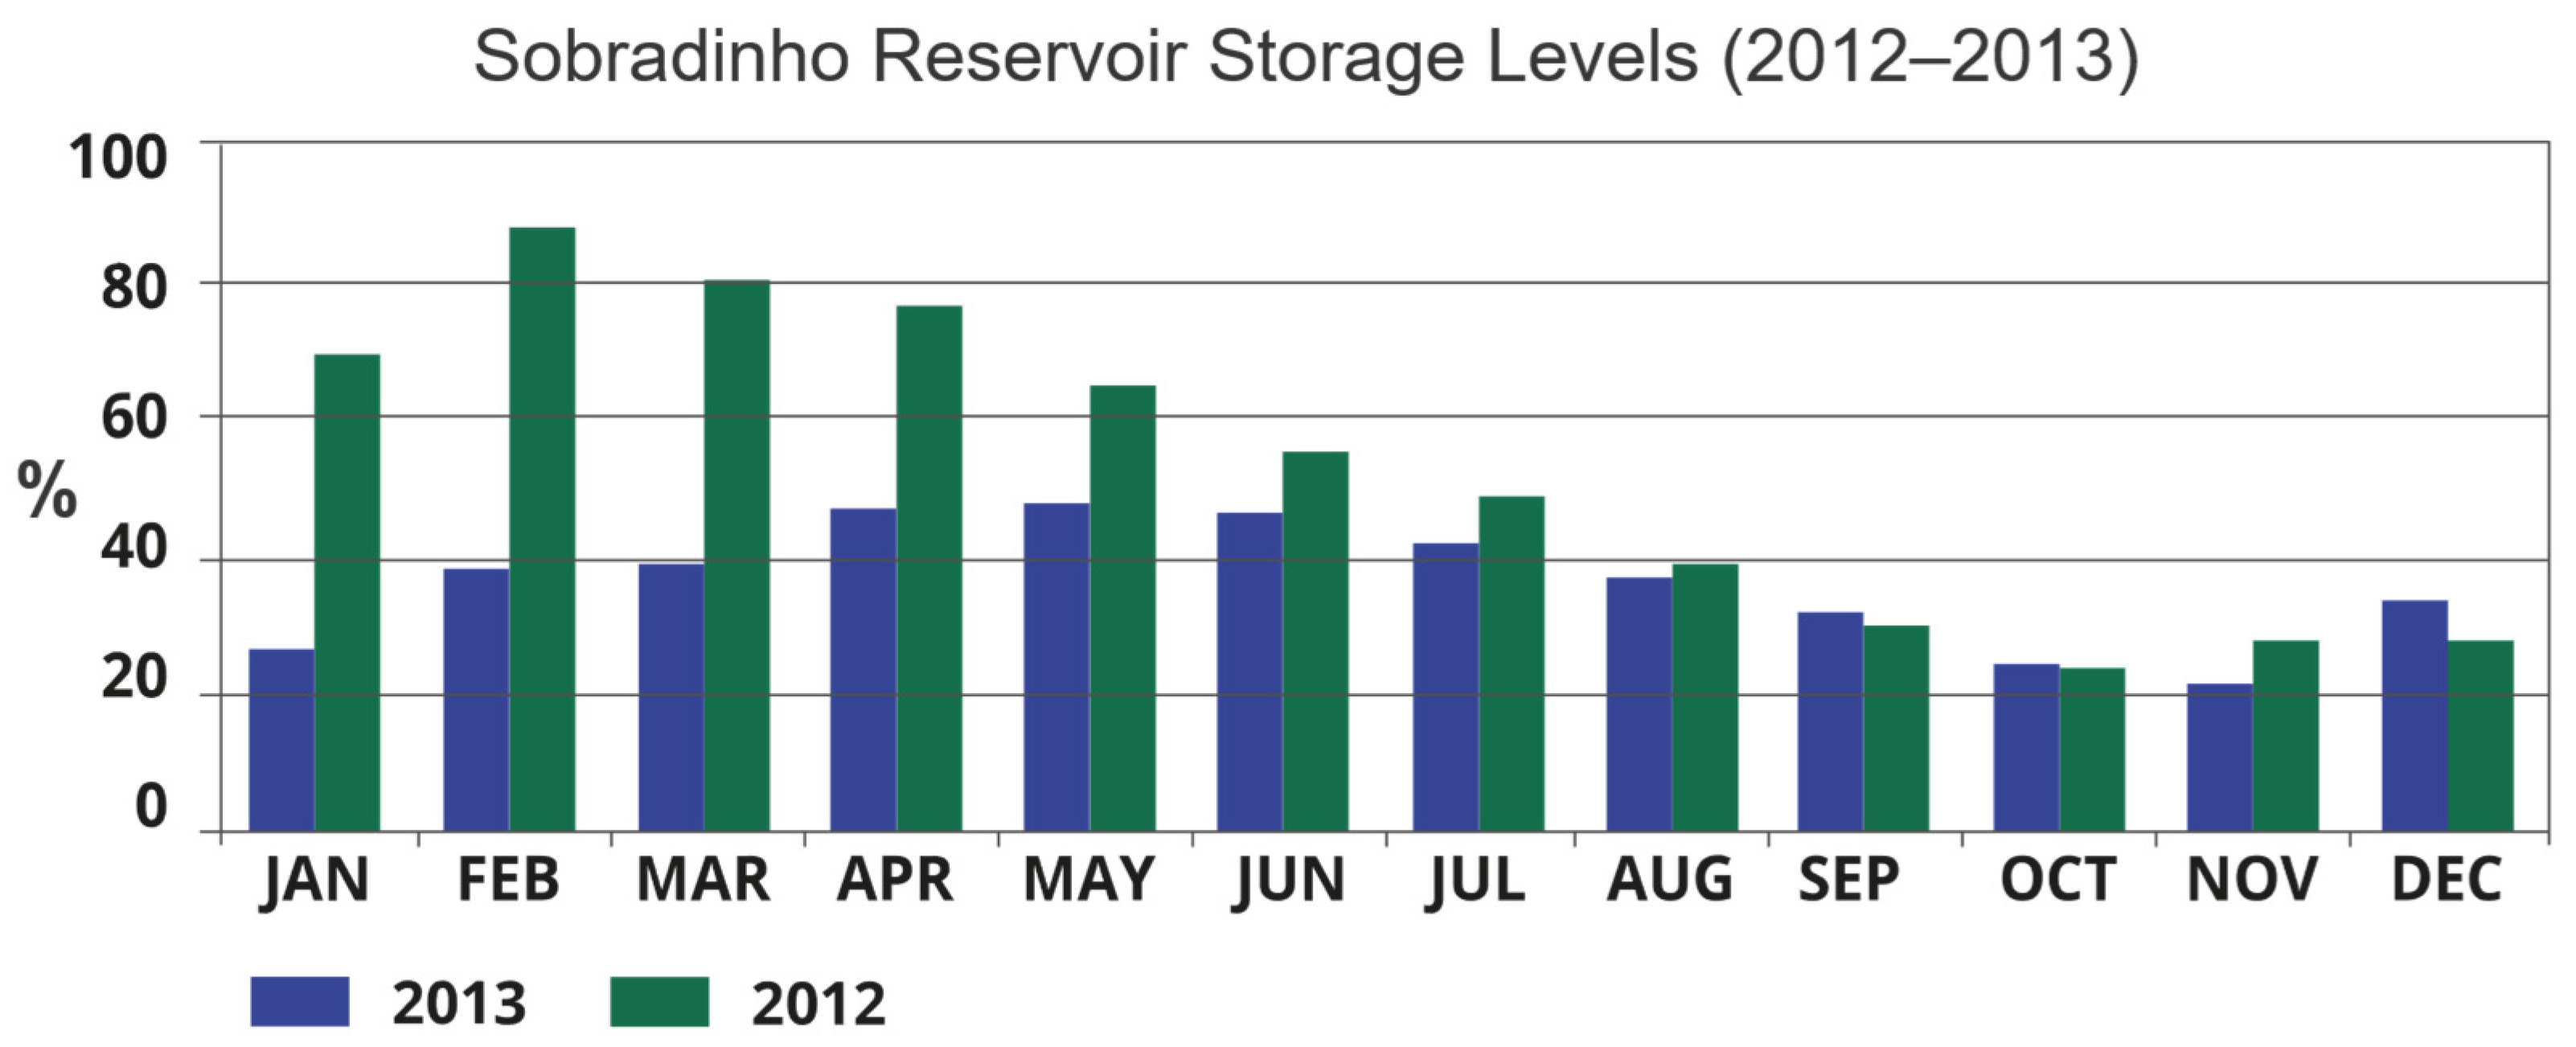
To evaluate the equivalence “Nuclear Energy = Water,” the variation in the Sobradinho Reservoir over the years 2012 and 2013 was selected as representative of this reservoir’s behavior during a period of hydrological scarcity. These years reflect relevant operational stress on the Brazilian hydrothermal system, as shown in
Figure 7.
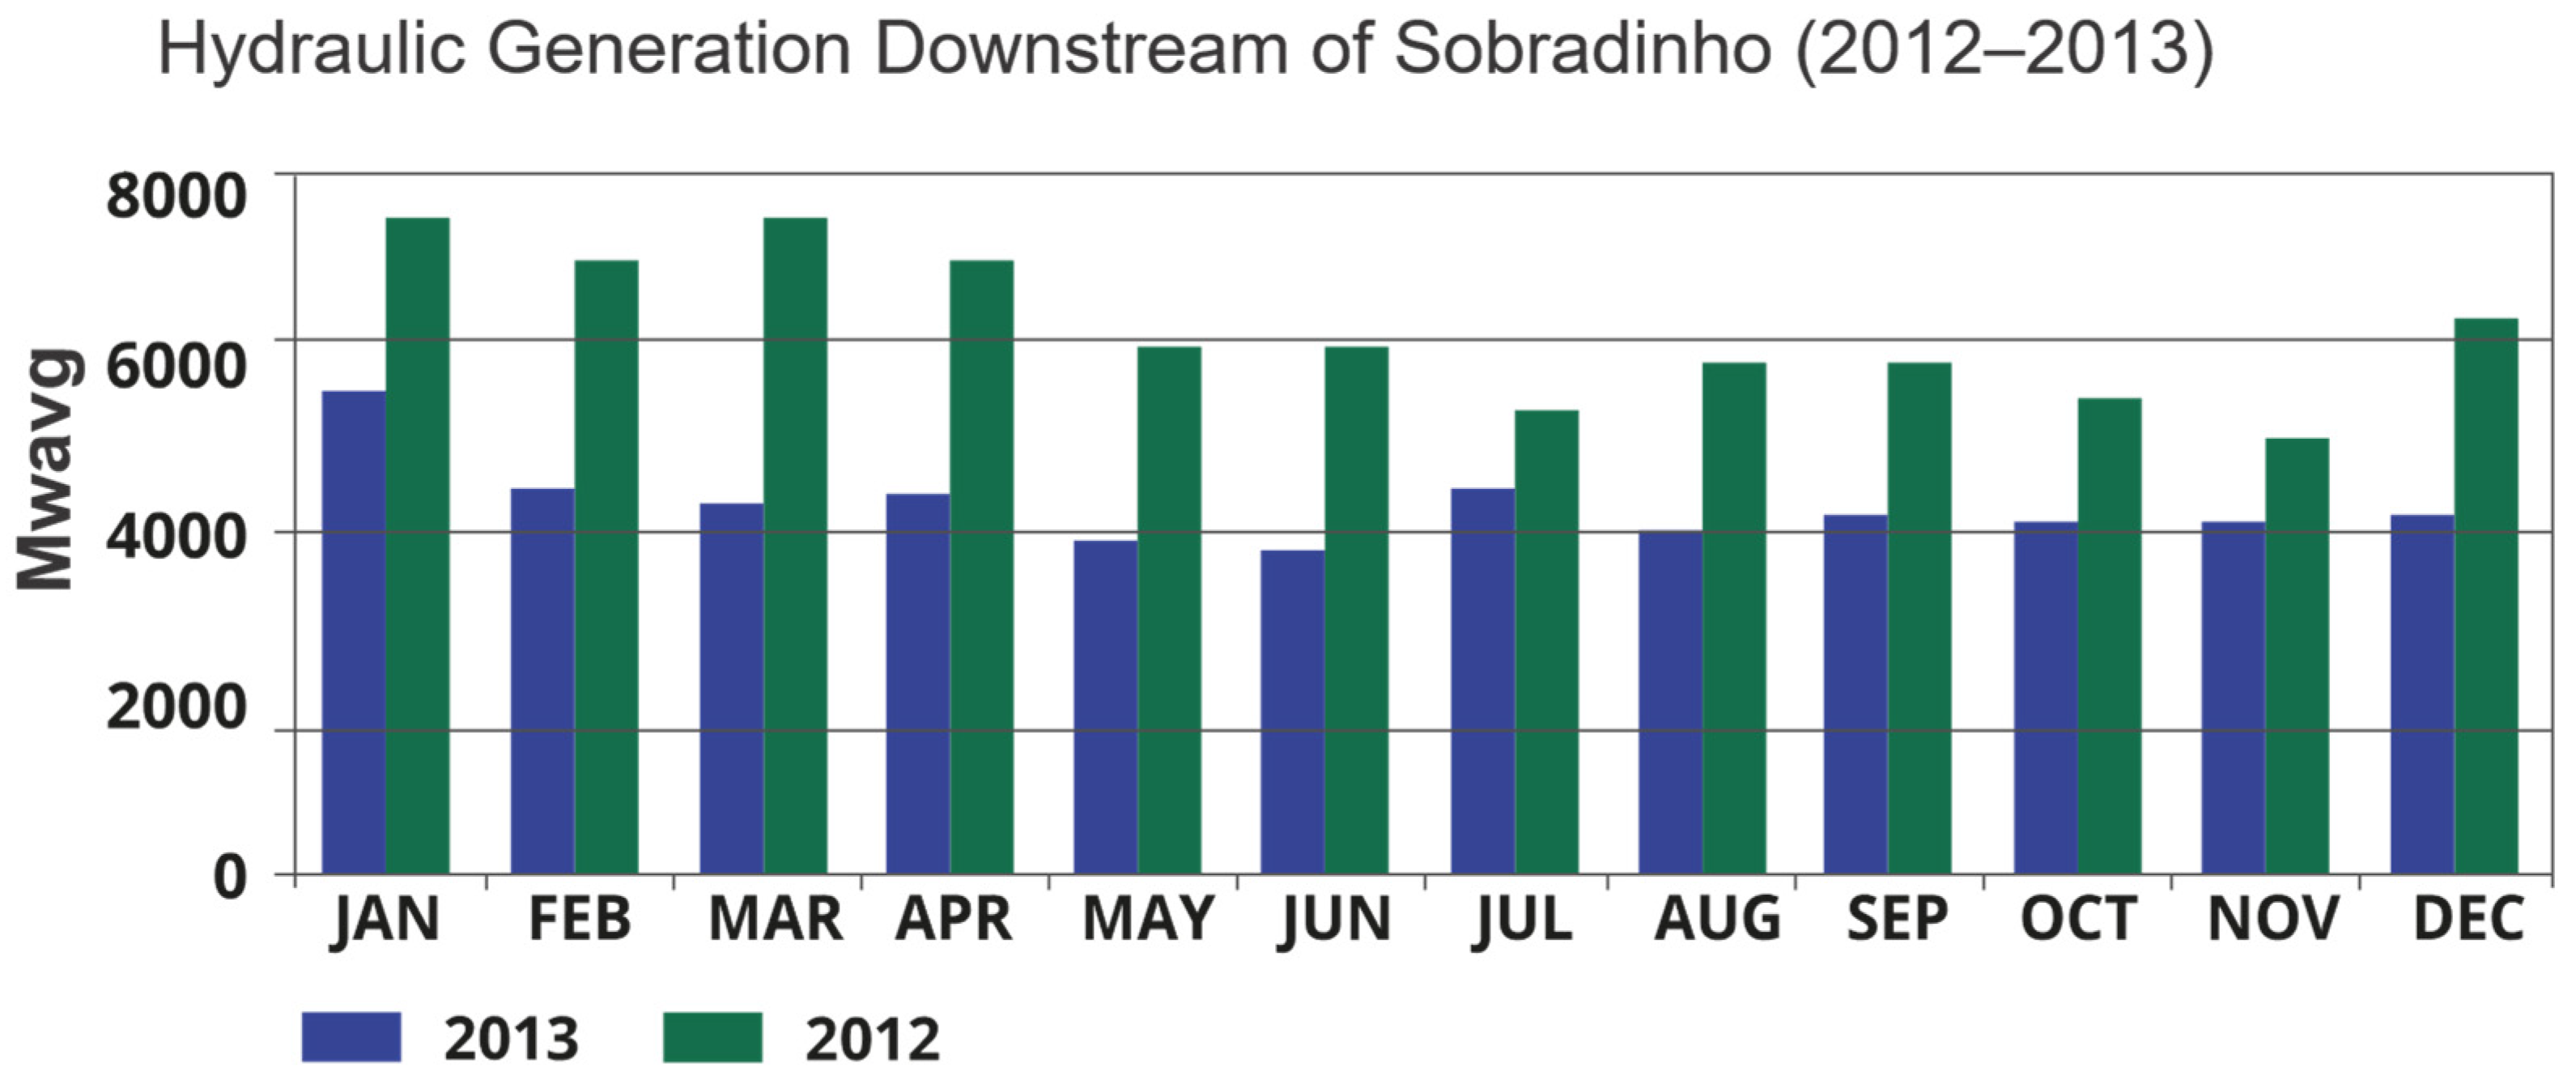
To establish the equivalence with hydroelectric generation, the annual energy outputs of the hydro plants located downstream of Sobradinho were calculated as average power values (MWavg), as presented in
Figure 8.
The relationship between energy output and reservoir volume variation is expressed through a Conversion Factor (CF), defined as:
where
is the variation in active storage volume of the Sobradinho Reservoir (in cubic meters, m3) and,
is the average hydraulic generation by the downstream plants during the same period (in megawatts, MW).
Using historical data from the National Electric System Operator (ONS), the total variation in storage and the corresponding generation were obtained.
Based on these values, the average conversion factor was:
This means that each 1 MW of average nuclear generation, sustained over one year, is equivalent to 882,300 cubic meters of active water storage in the Sobradinho reservoir. This metric allows nuclear generation to be interpreted as a virtual reservoir volume in energy planning, contributing to the restoration of long-term regulatory capacity in the Brazilian grid.
2.2. Thermal Generation and Reservoir Variability in Power Systems
Brazil’s thermoelectric generation fleet encompasses both renewable and non-renewable fuel sources. Thermoelectric power plants fueled by petroleum derivatives, natural gas, coal, and nuclear fuel account for 15% of the total installed capacity, providing 31,443 MW of baseload generation. Biomass-fired thermoelectric plants contribute an additional 17,638 MW [
15]. Nevertheless, Brazil’s hydrothermal power system demands an optimized allocation of hydro and thermal resources. Baseload thermal dispatch is managed by the National System Operator (ONS) to ensure the electricity supply required to meet national demand, following technical and economic system conditions and regulatory guidelines as follows:
- (i)
Cost Merit Order Dispatch: Dispatch is conducted based on the least total system cost, considering generation availability and projected future demand conditions.
- (ii)
Out-of-Merit Order Dispatch: This dispatch modality compensates for fuel unavailability at plants otherwise dispatched according to cost merit order.
- (iii)
Dispatch Subject to Electrical Constraints: Applied in scenarios requiring enhanced system reliability and stability. Plants may be dispatched (constrained-on) to increase generation due to system needs or curtailed (constrained-off) due to system-imposed limitations.
- (iv)
Complementary Dispatch for Operational Reserve Maintenance: Centralized thermal dispatch is conducted to preserve operational reserve margins in hydroelectric plants.
- (v)
Mandatory Energy Supply Dispatch: Undertaken to ensure long-term energy supply security to maintain adequate reservoir levels.
The nuclear power plants located in Angra dos Reis, Rio de Janeiro (Angra 1 and Angra 2), operate as baseload facilities with an average load factor of approximately 90%. Angra 1 and Angra 2 have installed capacities of 657 MW and 1350 MW, respectively, both maintaining capacity factors above 90%. The third unit, Angra 3, currently under construction and expected to be completed by the end of the decade, has a declared capacity of 1405 MW and a firm energy certification of 1214 average MW, accounting for the plant’s own consumption and transmission losses up to the connection with the main transmission grid. This additional capacity will augment the existing conventional thermal generation considered part of the system’s baseload supply. With the commissioning of Angra 3, the thermal base of the system will expand to 32,848 MW, corresponding to approximately 12,900 average MW, equivalent to 14% of the total generation capacity of the Brazilian Interconnected System (SIN), whose total firm energy is currently certified at 91,291 average MW [
16].
Given the near depletion of hydroelectric reservoir regulation capacity, a gradual expansion of the thermal base is required to provide a “regulatory thermal capacity,” effectively acting as a buffer against hydrological uncertainty. Considering the volatility of the natural gas market and the progressive phase out of petroleum-based thermal plants, nuclear power emerges as a reliable alternative for significantly increasing the thermal base in the medium and long term.
Brazil stands out for its extensive uranium reserves, estimated at approximately 309,000 tonnes of U
3O
8 [
17], with additional areas under exploration potentially qualifying as new reserves within the next 15 years [
18], positioning the country among those with the largest reserves worldwide, according to the World Nuclear Association. This volume grants Brazil a strategic position for the sustainable development of nuclear power generation.
Considering Pressurized Water Reactors (PWRs), a nuclear power plant of approximately 1000 MW of electric output consumes, on average, between 230 and 250 tons of U
3O
8 per year, assuming high-capacity factors and periodic refueling of about one-third of the core [
19]. Given this consumption profile, the uranium reserves currently identified in Brazil would be sufficient to supply approximately 20 to 22 reactors of 1000 MW each over six decades of continuous operation. In summary, the country possesses sufficient mineral resources to support a significant long-term expansion of its nuclear energy portfolio, with no limitations on uranium availability.
In this context, Brazil already possesses 60% of the technology needed for the entire nuclear fuel cycle, although full enrichment capability is still under development. A significant portion of the nuclear fuel production costs are expected to be nationalized. Brazil is rich in fissile minerals such as thorium and uranium, specifically, the U
3O
8 concentrate, or “yellowcake”—ranking sixth globally in uranium reserves, according to the Brazilian Nuclear Industries (INB). National efforts have been advancing the uranium enrichment process for energy purposes [
20].
Using a conversion factor (CF = 0.8823 × 10⁶ m3 per average MW), it is possible to estimate the “Nuclear Energy = Water (ENA)” equivalence, where ENA refers to the Natural Inflow Energy for Brazilian nuclear power plants.
Assuming a capacity factor of 90%, the equivalent reservoir volumes for the installed capacities of Angra 1 and Angra 2, including the projected addition of Angra 3, are shown in
Table 2.
Assuming a hypothetical 50% increase in the current thermal base using nuclear plants, the resulting nuclear capacity would correspond to a hydrological reserve (a buffer for mitigating hydrological risks) whose equivalent ENA volume would represent approximately 42% of the active storage volume of the Sobradinho Reservoir and 70% of the active storage volume of the Furnas Reservoir, as expressed by Equation (2).
These volumes can absorb a significant portion of the hydrological uncertainties observed in the Brazilian hydrothermal power system.
3. Inertia and Power System Stability: The Essential Role of Nuclear Energy
The transition towards power systems predominantly composed of Variable Renewable Energy Sources (VRES), such as wind and solar, has introduced significant challenges to maintaining grid stability. Among these challenges, reducing system inertia is a fundamental technical concern. This section explores the role of inertia in system dynamics, observable consequences of its reduction, events demonstrating its possible correlated criticality, mitigation strategies, and the essential contribution of nuclear power plants to preserving grid resilience.
Historically, the abundance of continuously operating, large synchronous generators ensured a significant inertia reserve, often taken for granted in system planning and operation strategies. Nuclear power plants are notable sources of inertia due to their massive turbines and stable baseload operation. The continuous rotation of their rotors provides a valuable energy cushion that helps contain frequency drops immediately after a disturbance, allowing time for primary frequency controls to act and stabilize the system.
In power systems, inertia refers to the kinetic energy held in the spinning masses of synchronous machines—like turbines in hydroelectric, thermal, and nuclear power plants—that naturally oppose sudden changes in rotational speed. This stored kinetic energy is vital in maintaining grid frequency stability when sudden imbalances occur between generation and consumption. The system frequency (50 Hz or 60 Hz, depending on the region) represents the balance between generation and load. Any imbalance causes frequency deviations, for example, an excess load results in a frequency drop, while an excess of generation leads to a frequency rise. The magnitude of these excursions depends on the amount of system inertia present. High-inertia systems experience slower and smaller deviations, while low-inertia systems are vulnerable to sharp, rapid fluctuations [
21,
22].
However, many power systems face reduced inertia levels with the growing adoption of inverter-based technologies like wind and solar power replacing synchronous generators [
23], complicating system protection and making fault events more severe [
24]. Maintaining a stable frequency in power systems requires a careful equilibrium between electricity supply and demand. When this balance is disturbed, frequency variations occur, with their severity directly linked to the size of the imbalance. If left unmanaged, these fluctuations can lead to cascading failures, emphasizing the vital role of frequency reserves, also known as frequency ancillary services.
Inertia provides a natural “shock absorber” for the system, slowing the Rate of Frequency Change (RoCoF) immediately after disturbances. This delay is critical, buying time for primary frequency control mechanisms to act and restore balance before more severe consequences, such as under-frequency load shedding or cascading blackouts.
Physically, the inertia constant (H) quantifies the system’s ability to resist frequency changes. Higher H values mean a greater ability to absorb disturbances without large frequency deviations. Typically, hydroelectric plants exhibit H values around 1.75–4.75 s, thermal plants around 2–10 s, and nuclear plants approximately 4 s [
25].
However, the increasing penetration of VRES, which interfaces through power electronics without inherent rotating mass, drastically reduces the available system inertia. This shift transforms the dynamic behavior of power grids, making them more sensitive to disturbances and less capable of withstanding sudden losses of generation or load.
3.1. Observed Events Possibly Related to Inertia Reduction
The reduction in system inertia has been linked to several significant grid disturbances worldwide. Lower inertia results in faster RoCoF and deeper frequency nadirs, increasing the risk of widespread blackouts. Multiple case studies provide critical insights into this phenomenon.
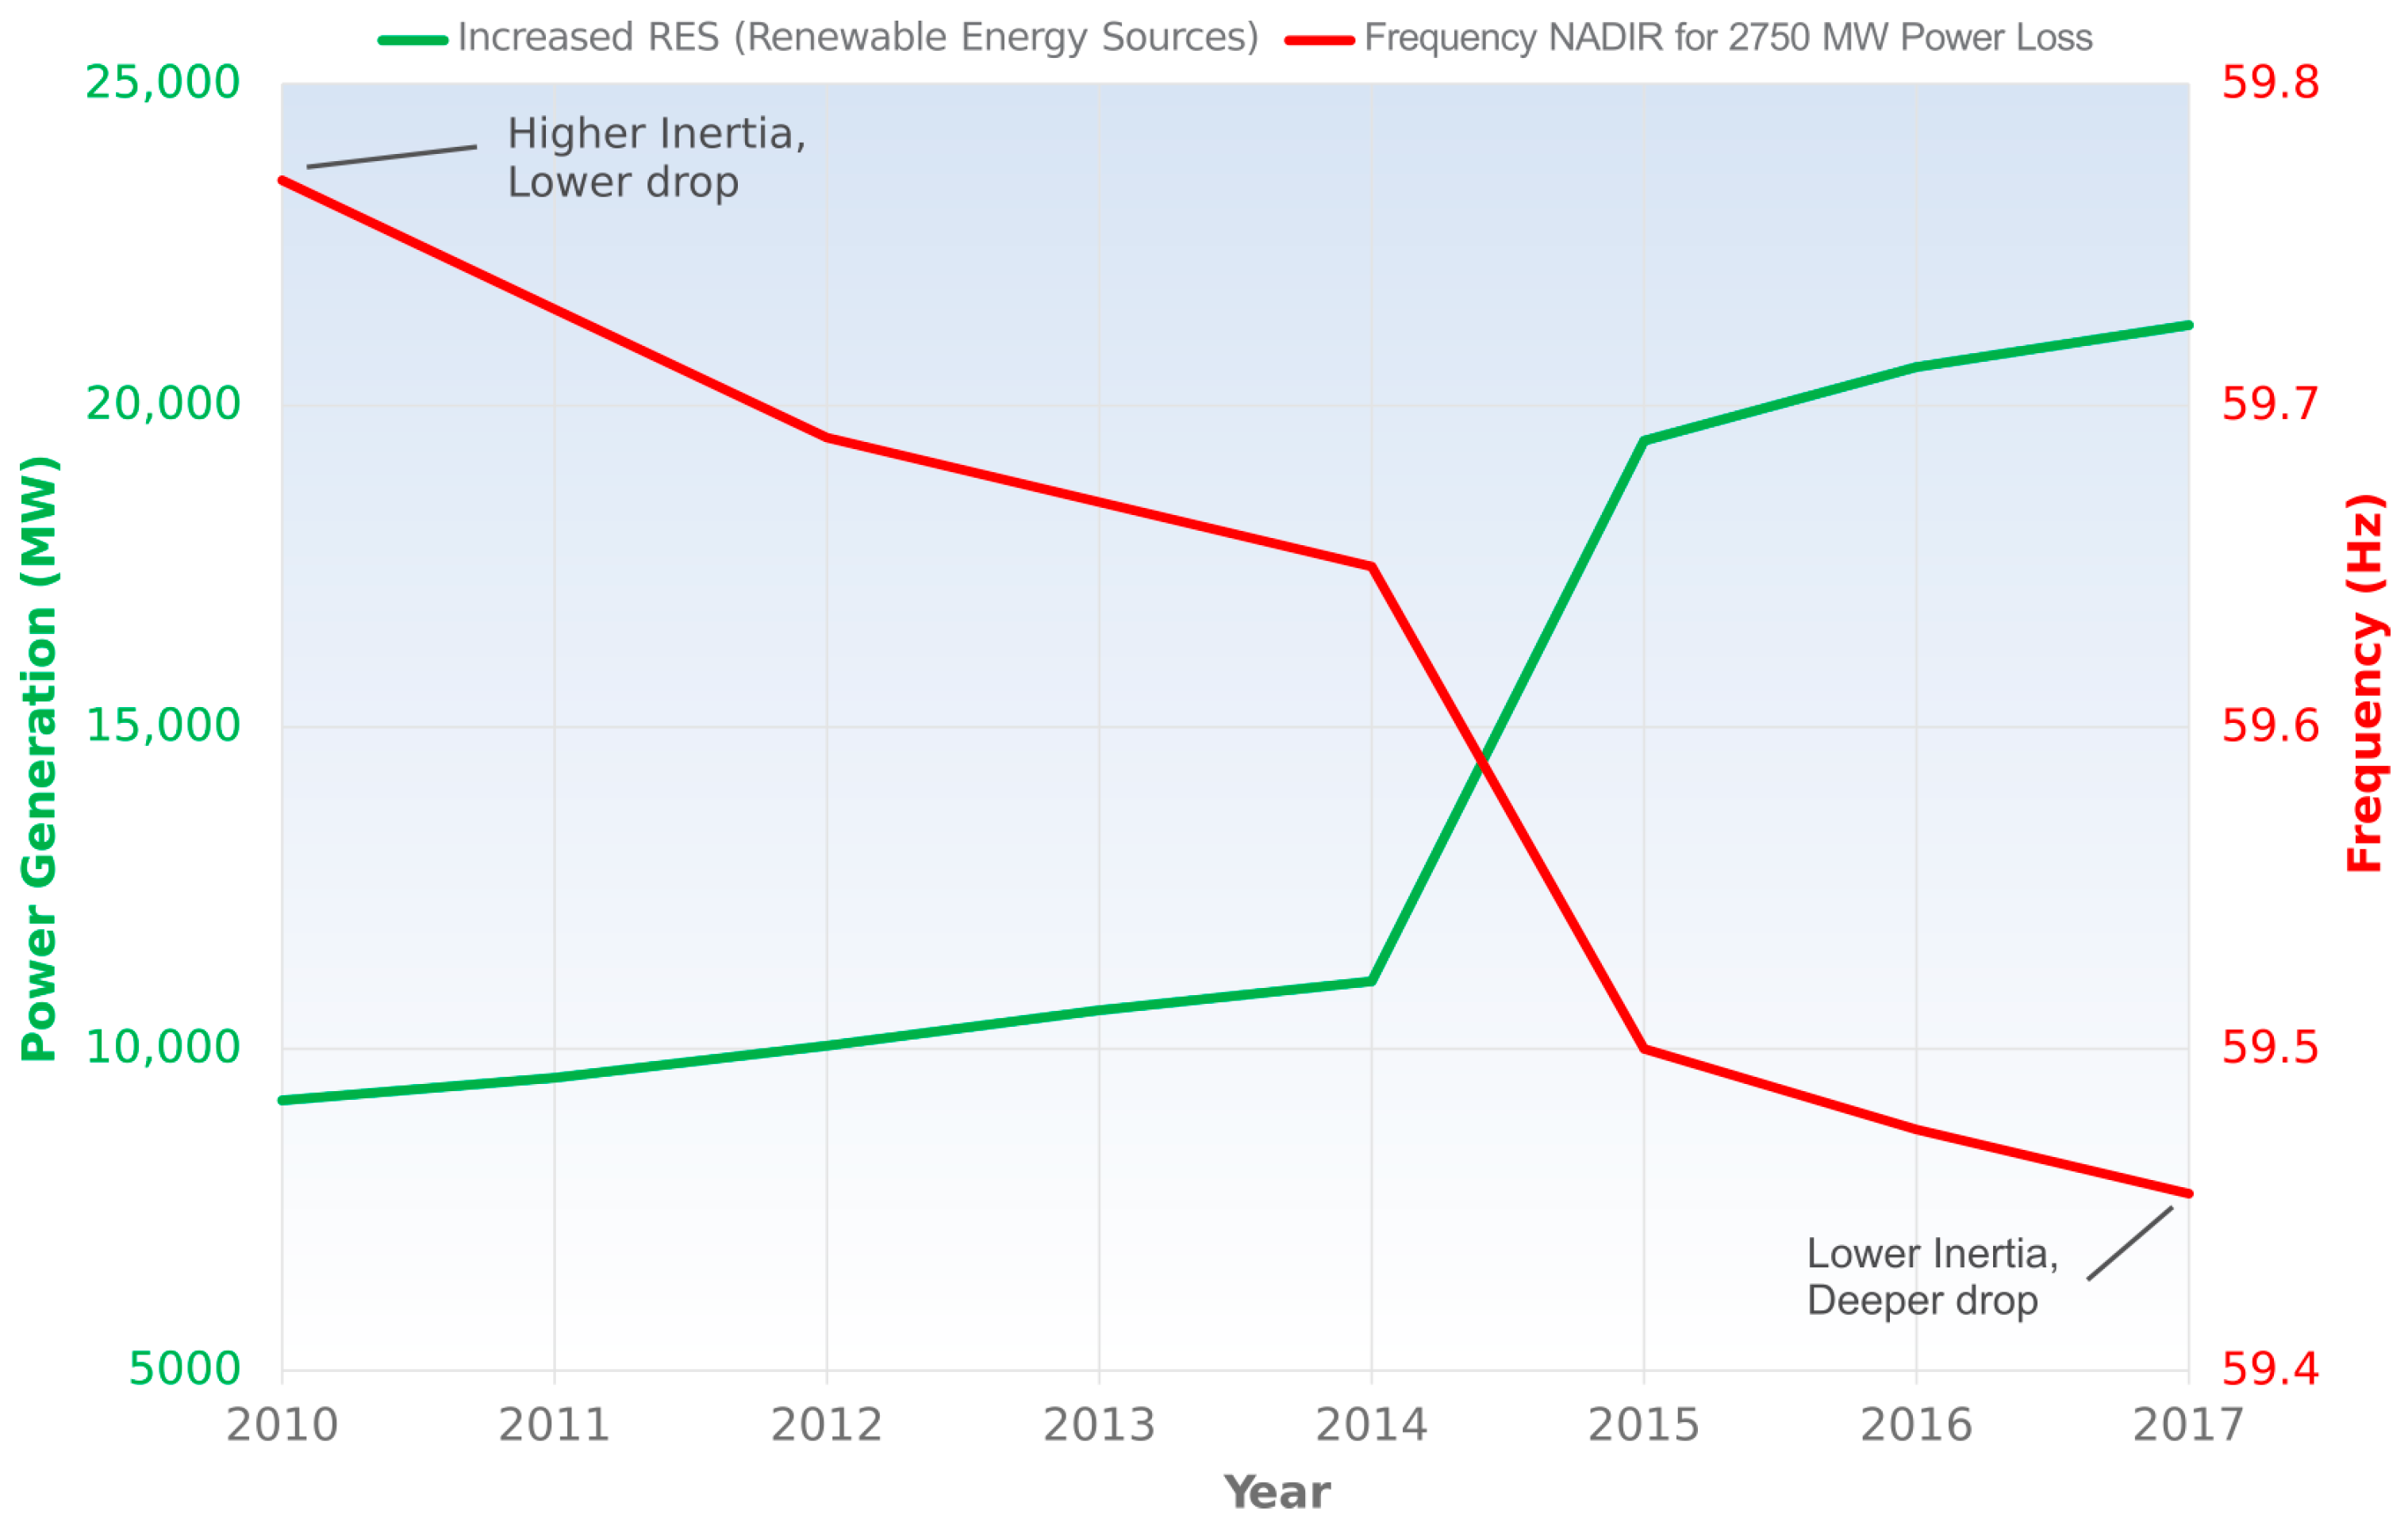
Between 2010 and 2017, the ERCOT system witnessed a steady rise in renewable penetration alongside a notable decline in system inertia. During this period, contingency events involving the sudden loss of 2750 MW of generation highlighted a progressive worsening of dynamic frequency response. As shown in
Figure 9, the frequency nadir after such disturbances declined substantially, with an increasing share of RES, indicating a heightened risk of under-frequency protection activation and system collapse [
25].
In September 2016, there was a blackout in South Australia. The wind power generation reached 883 MW, accounting for approximately 48% of the total generation immediately before the event. Following the disturbance, the system experienced a loss of 456 MW of generation capacity within just 8 s, and the frequency dropped sharply to 47 Hz. The worst observed Rate of Change in Frequency (RoCoF) reached 6.25 Hz/s, a value that made it impossible to maintain system stability under the prevailing conditions [
26].
A similar scenario occurred in the United Kingdom in 2019, where a blackout was triggered by a rare combination of near-simultaneous failures as follows: a lightning strike impacted a 400 kV transmission line, causing a sudden loss of 737 MW from the Hornsea offshore wind farm and 244 MW from the Little Barford thermal power station. This sequence resulted in a generation shortfall beyond the forecasted security margin at a time when approximately 30% of the system’s electricity generation was sourced from renewables [
27].
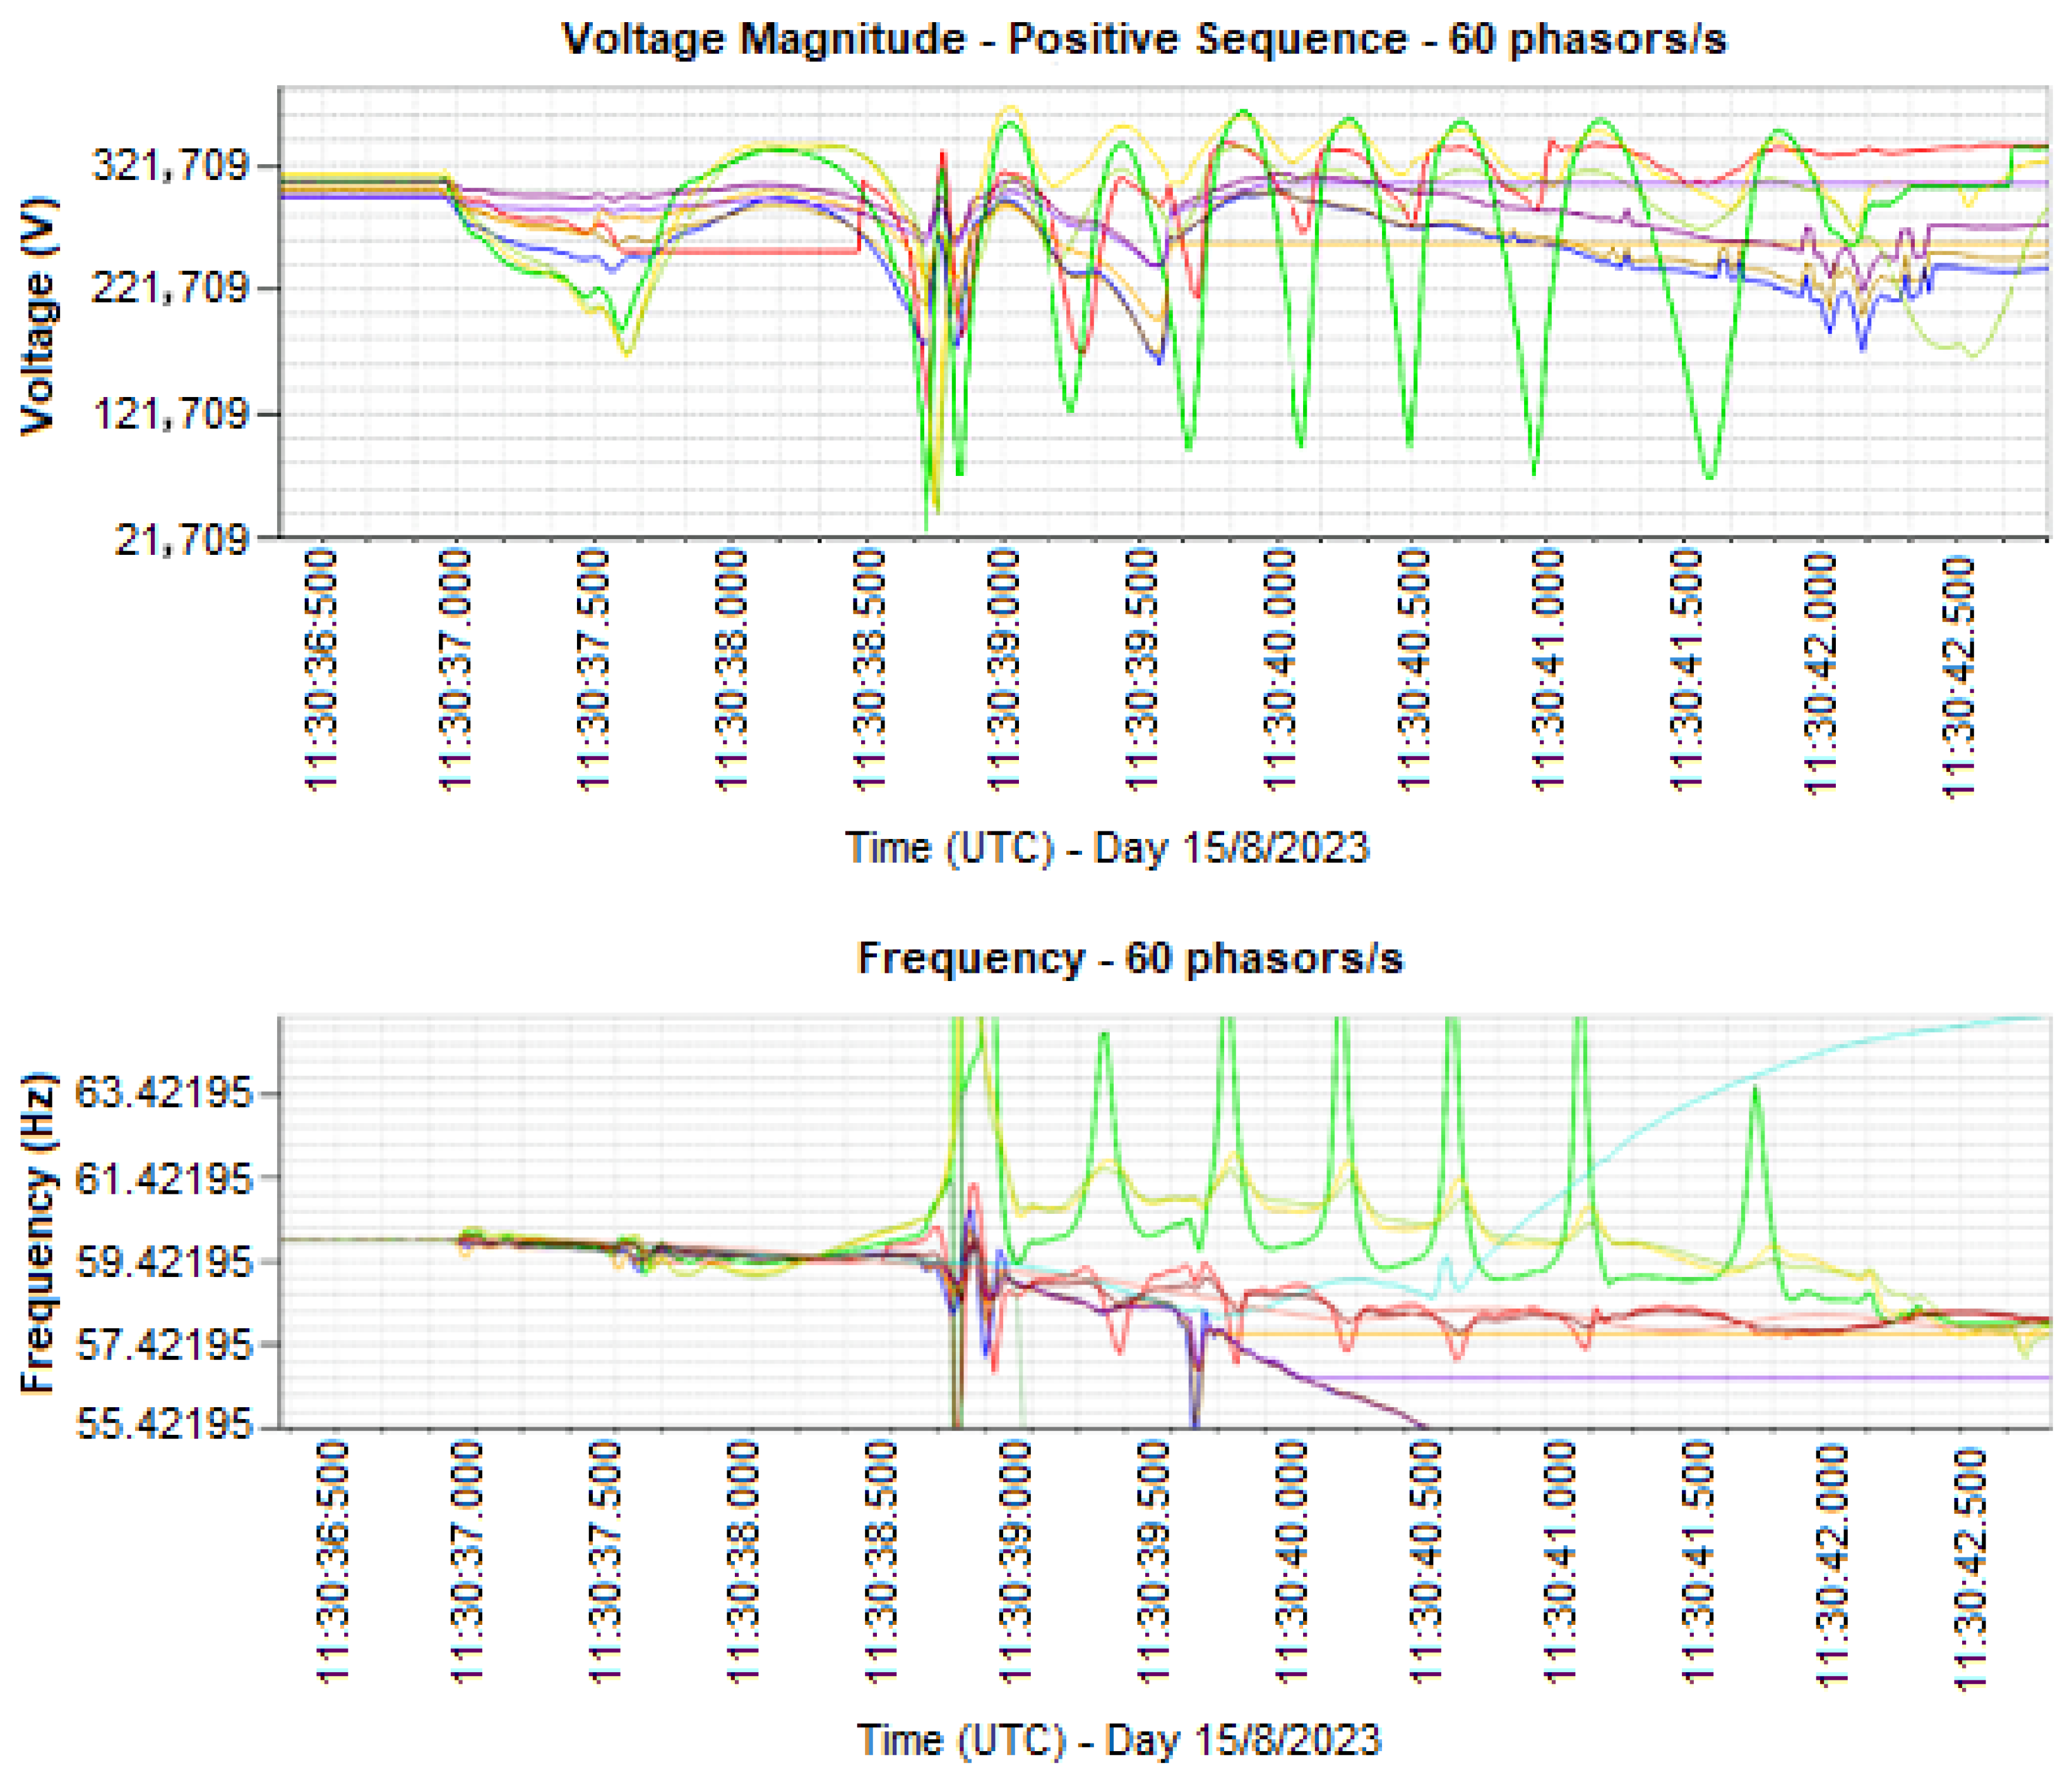
In Brazil, in August 2023, a massive power disruption totaling 22,547 MW triggered a nationwide blackout. At the time of the event, according to the National Electric System Operator (ONS), the National Interconnected System (SIN) had an estimated inertia of 265 GW·s for a load of approximately 73 GW, resulting in an inertia-to-load ratio higher than those observed in many international power systems. According to the official disturbance report [
27,
28], the initial event was the unintended opening of a transmission line carrying 1950 MW in a region with high solar and wind generation.
This incident set off a series of cascading events involving localized voltage and frequency collapses, ultimately leading to the shutdown of the entire interconnected system. Immediately following the line opening, there was a sharp voltage drop (with local values around 0.54 pu) and significant frequency oscillations, with frequency dropping to 57.66 Hz. The northeast subsystem, which was directly involved in the triggering event, initially experienced overfrequency due to excess generation and loss of power export capability. However, soon after, its frequency also began to decline rapidly.
Figure 10, extracted from the blackout report, illustrates the event’s recorded voltage and frequency waveforms. The pre-disturbance condition showed that approximately 33% of total generation came from renewable sources (solar and wind). The observed dynamic behavior, marked by the rapid deterioration of voltage and frequency following the initial fault, was exacerbated by the limited inertial response of the renewable generation facilities, which could not sustain transient system stability effectively.
Although the technical report indicated that the system was operating with global inertia levels higher than those observed in many international power systems—around 265 GW·s for a load of approximately 73 GW—the underperformance of wind and photovoltaic plants in the field, compared to the behavior predicted by their mathematical models, led the Brazilian System Operator to immediately implement new operational limits for renewable generation on the day of the event. Since then, it has adopted ongoing curtailment actions as part of its control strategy.
On April 28, 2025, at 10:33 am UTC, a massive blackout affected Spain and Portugal with a total zero in the electricity system of the Iberian Peninsula, disrupting power supply to millions of users and raising serious concerns about grid stability under high shares of renewable generation. The power collapse of more than 15 GW took less than five seconds [
29]. The operation required a black start, restoring power from a total system shutdown. The event caused cascading disconnections across the transmission systems of both countries. It was widely reported by European media and grid operators, including Red Eléctrica de España (REE) and Redes Energéticas Nacionais (REN) of Portugal.
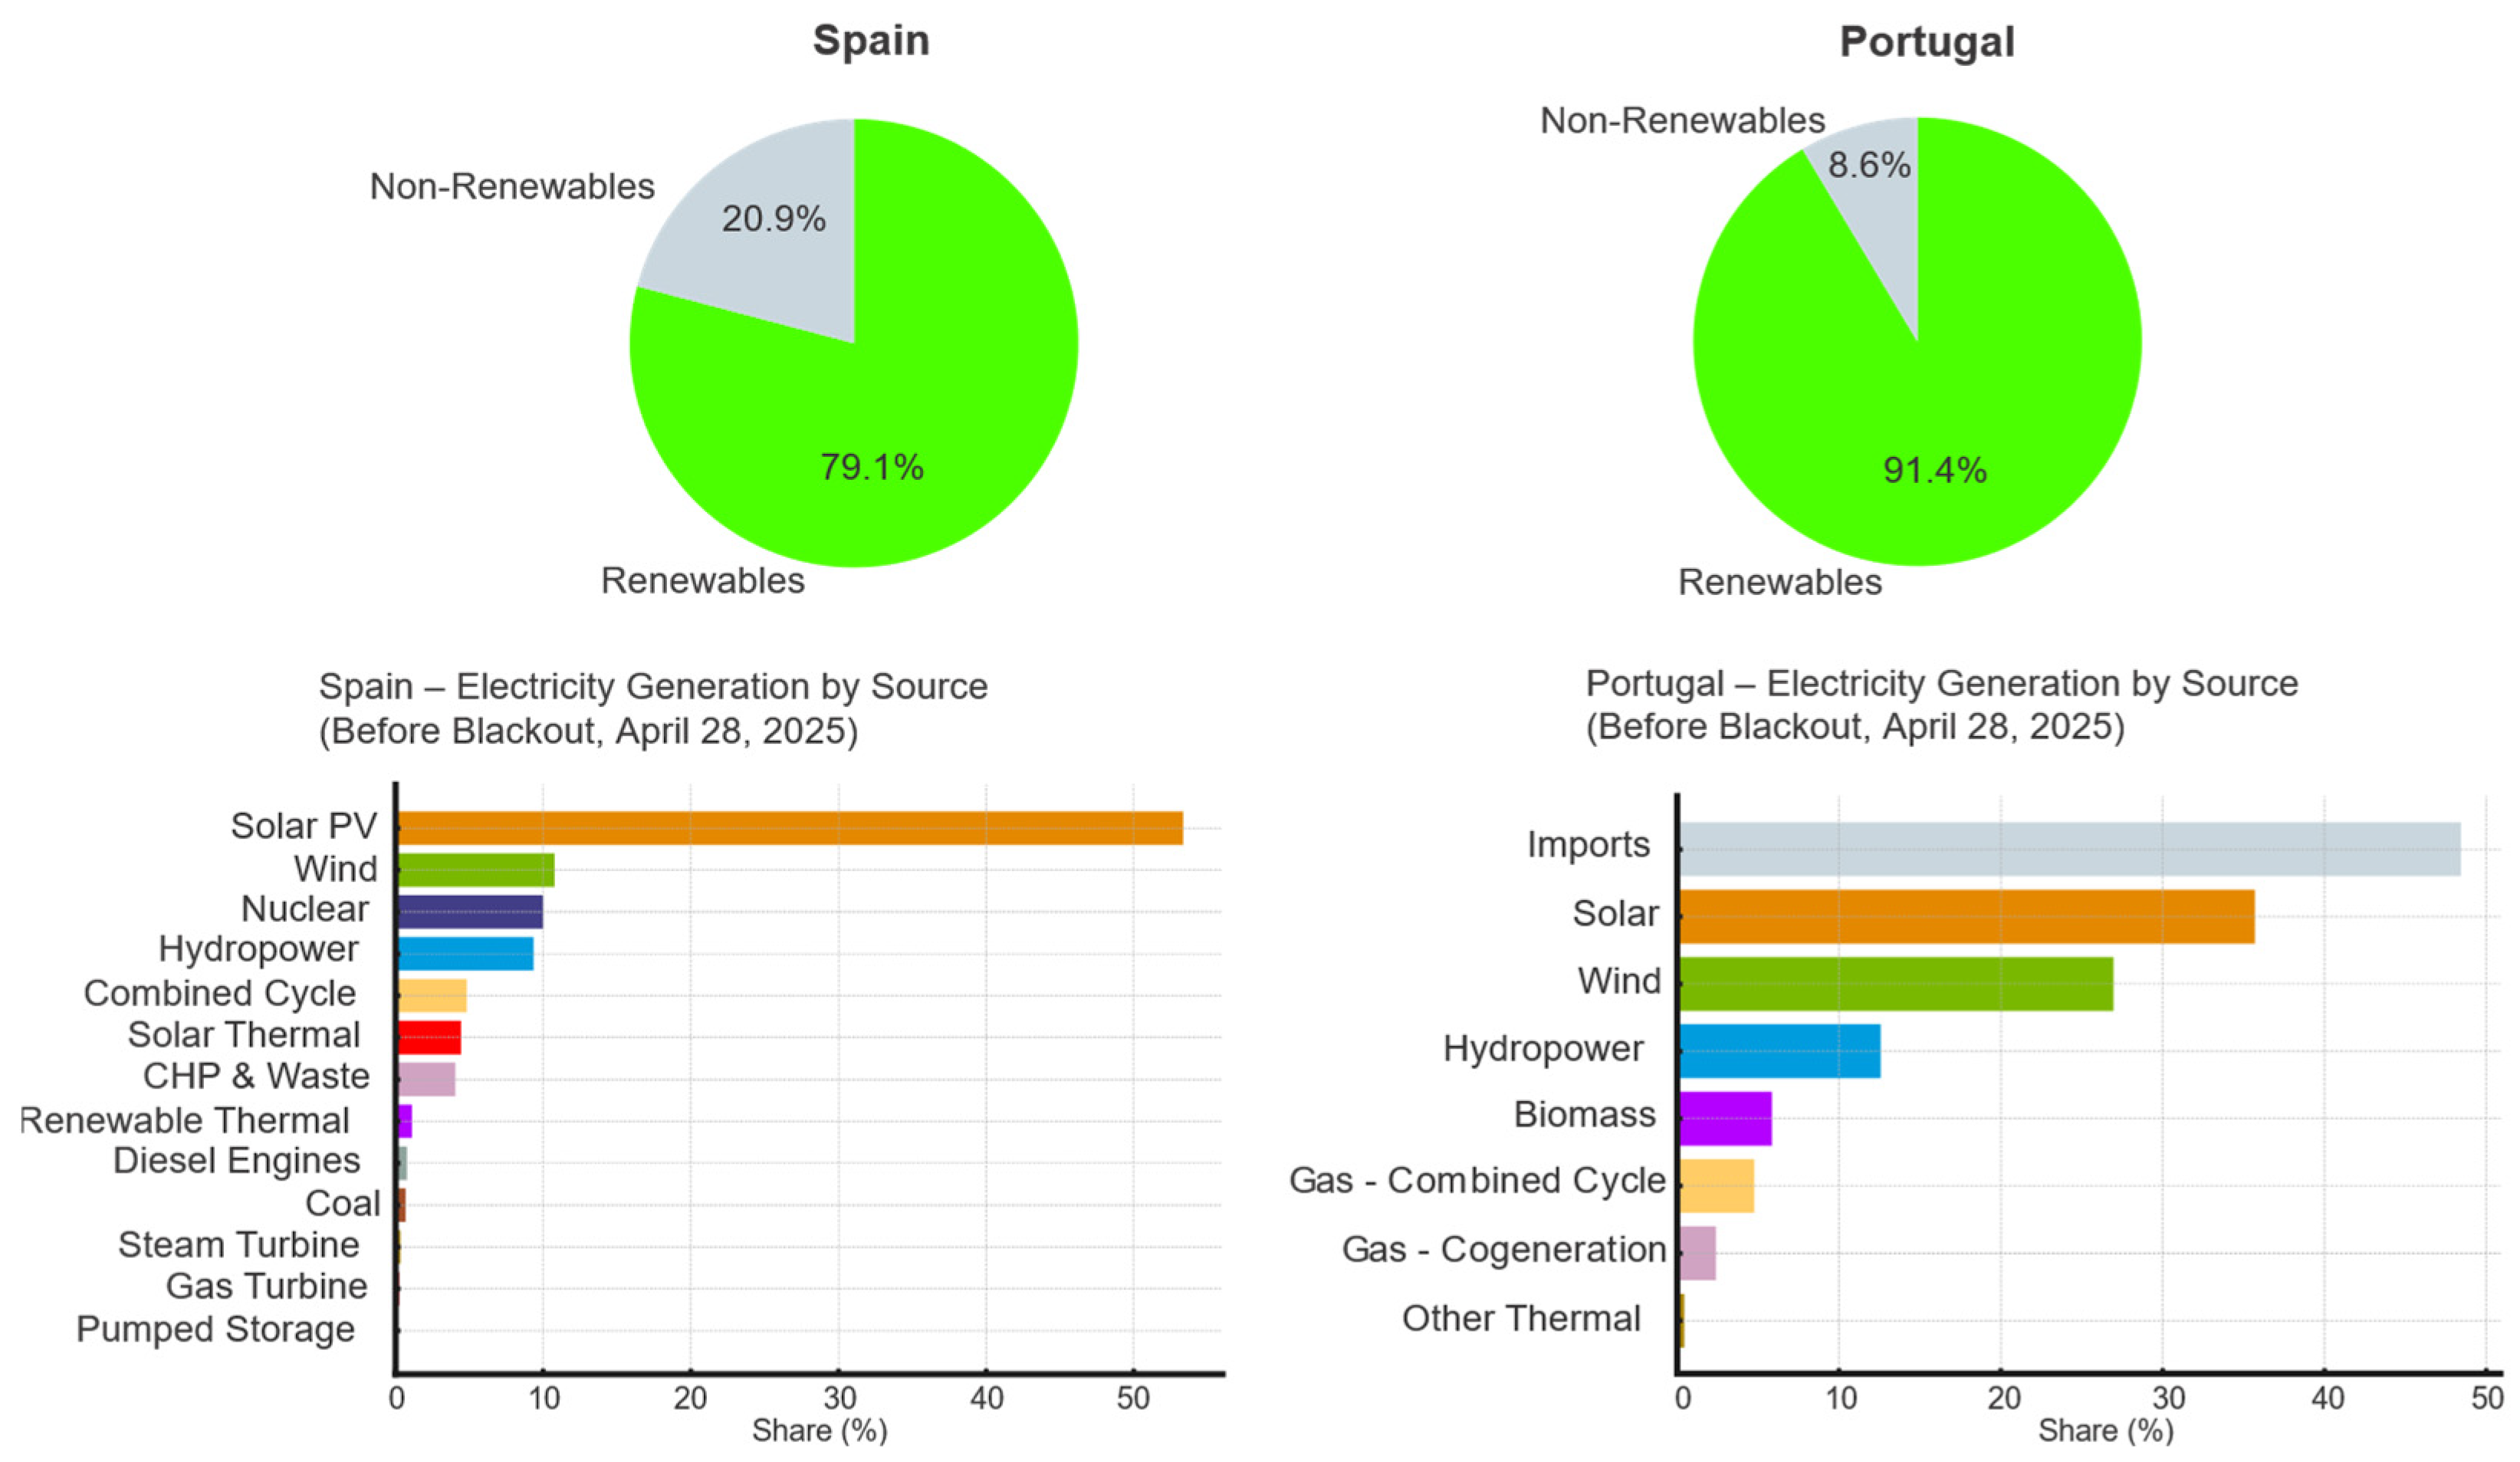
According to official dashboards from REE [
30], the Spanish power system at the moment of the failure was heavily dominated by renewable energy sources, particularly solar. The generation mix comprised approximately 79.07% from renewable sources—including solar PV, solar thermal, wind, hydro, renewable thermal, and pumped storage—and 20.93% from non-renewable sources. This configuration reflects the operational challenges of maintaining real-time system balance under high renewable penetration.
The blackout was triggered by an instability in the transmission network, possibly due to a mismatch between real-time generation and load or a malfunction in protection systems. While essential for reducing greenhouse gas emissions, the predominance of non-synchronous generation technologies, such as solar PV and wind, reduces system inertia and increases the grid’s vulnerability to frequency and voltage disturbances.
In Portugal, data from REN [
31] confirm that nearly half of the country’s electricity demand—approximately 48.5%—was being met through imports from Spain prior to the incident. Following the collapse of the Spanish grid, these interconnections failed, and only a small portion of domestic generation—about 600 MW—remained available, supported by thermal and hydropower plants.
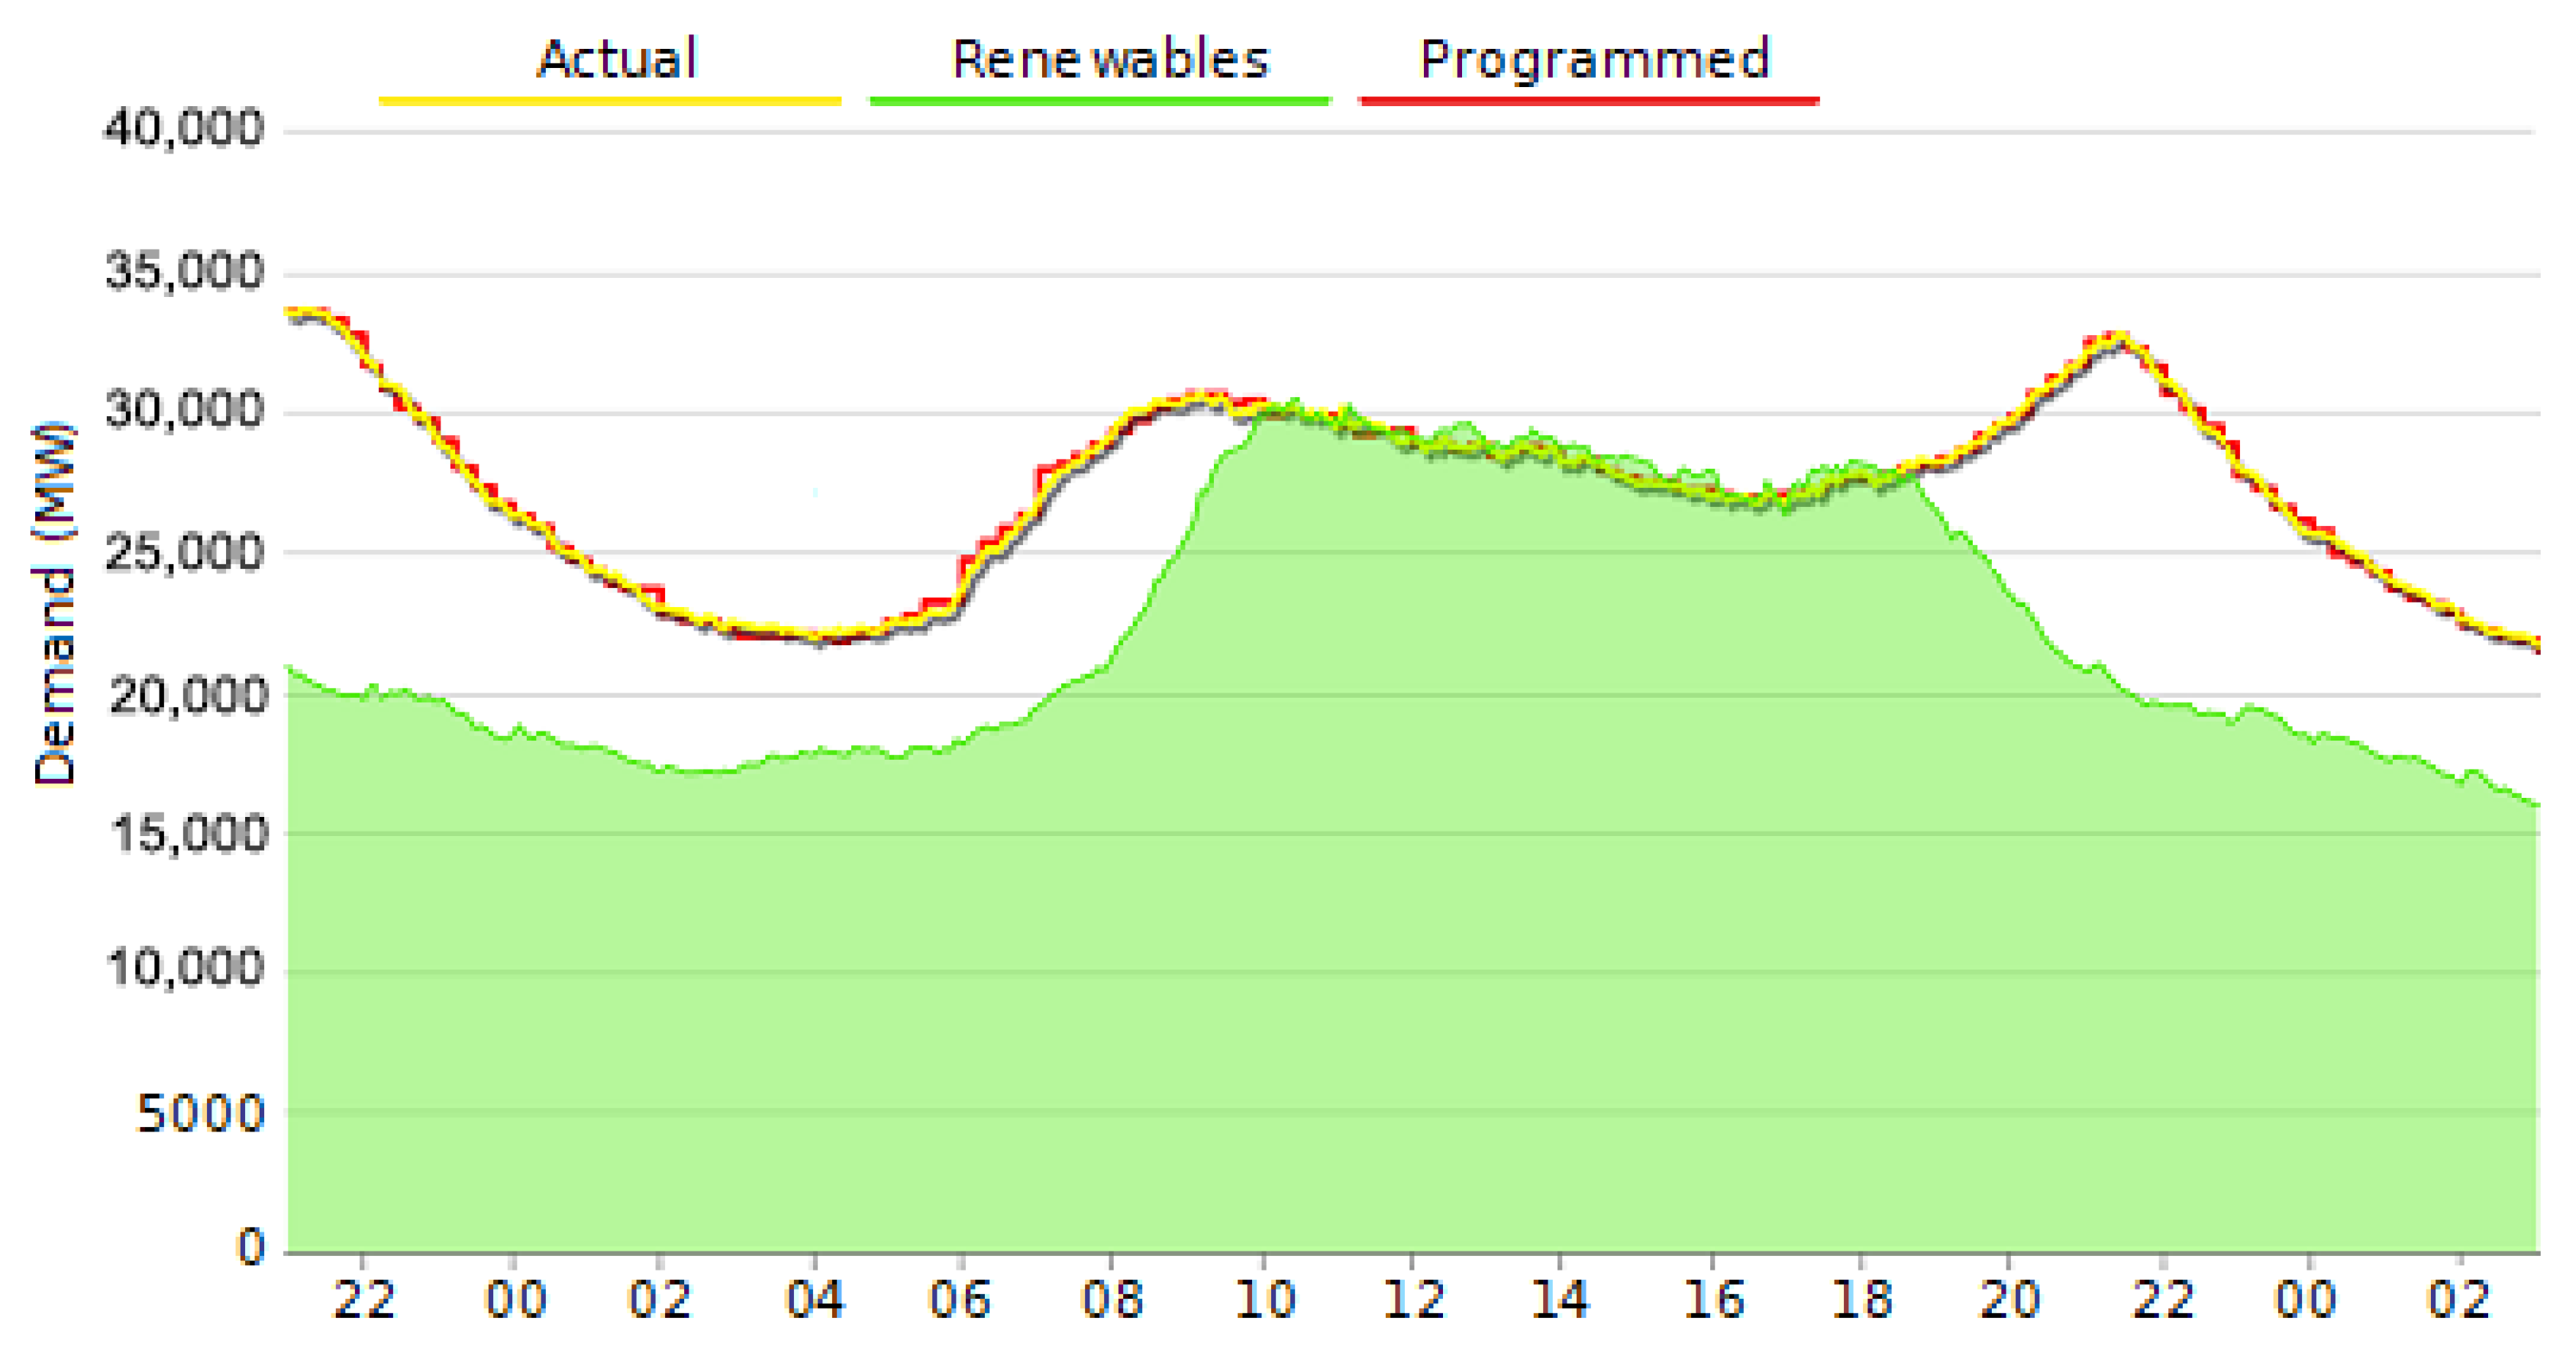
Figure 11 illustrates the share of total renewables and the sources’ corresponding contribution three minutes before the blackout event.
Following the release of the full technical report on the April 28 Iberian blackout, it has been confirmed that the event was triggered by a combination of overvoltage, insufficient dynamic voltage control, and widespread generator disconnections due to misconfigured protections. To reduce the likelihood of similar events, the report underscores the need for enhanced voltage support capabilities across all generation technologies, the provision of both synchronous and synthetic inertia, smarter frequency-responsive HVDC interconnection control, and stricter operational compliance with real-time voltage regulation requirements [
32].
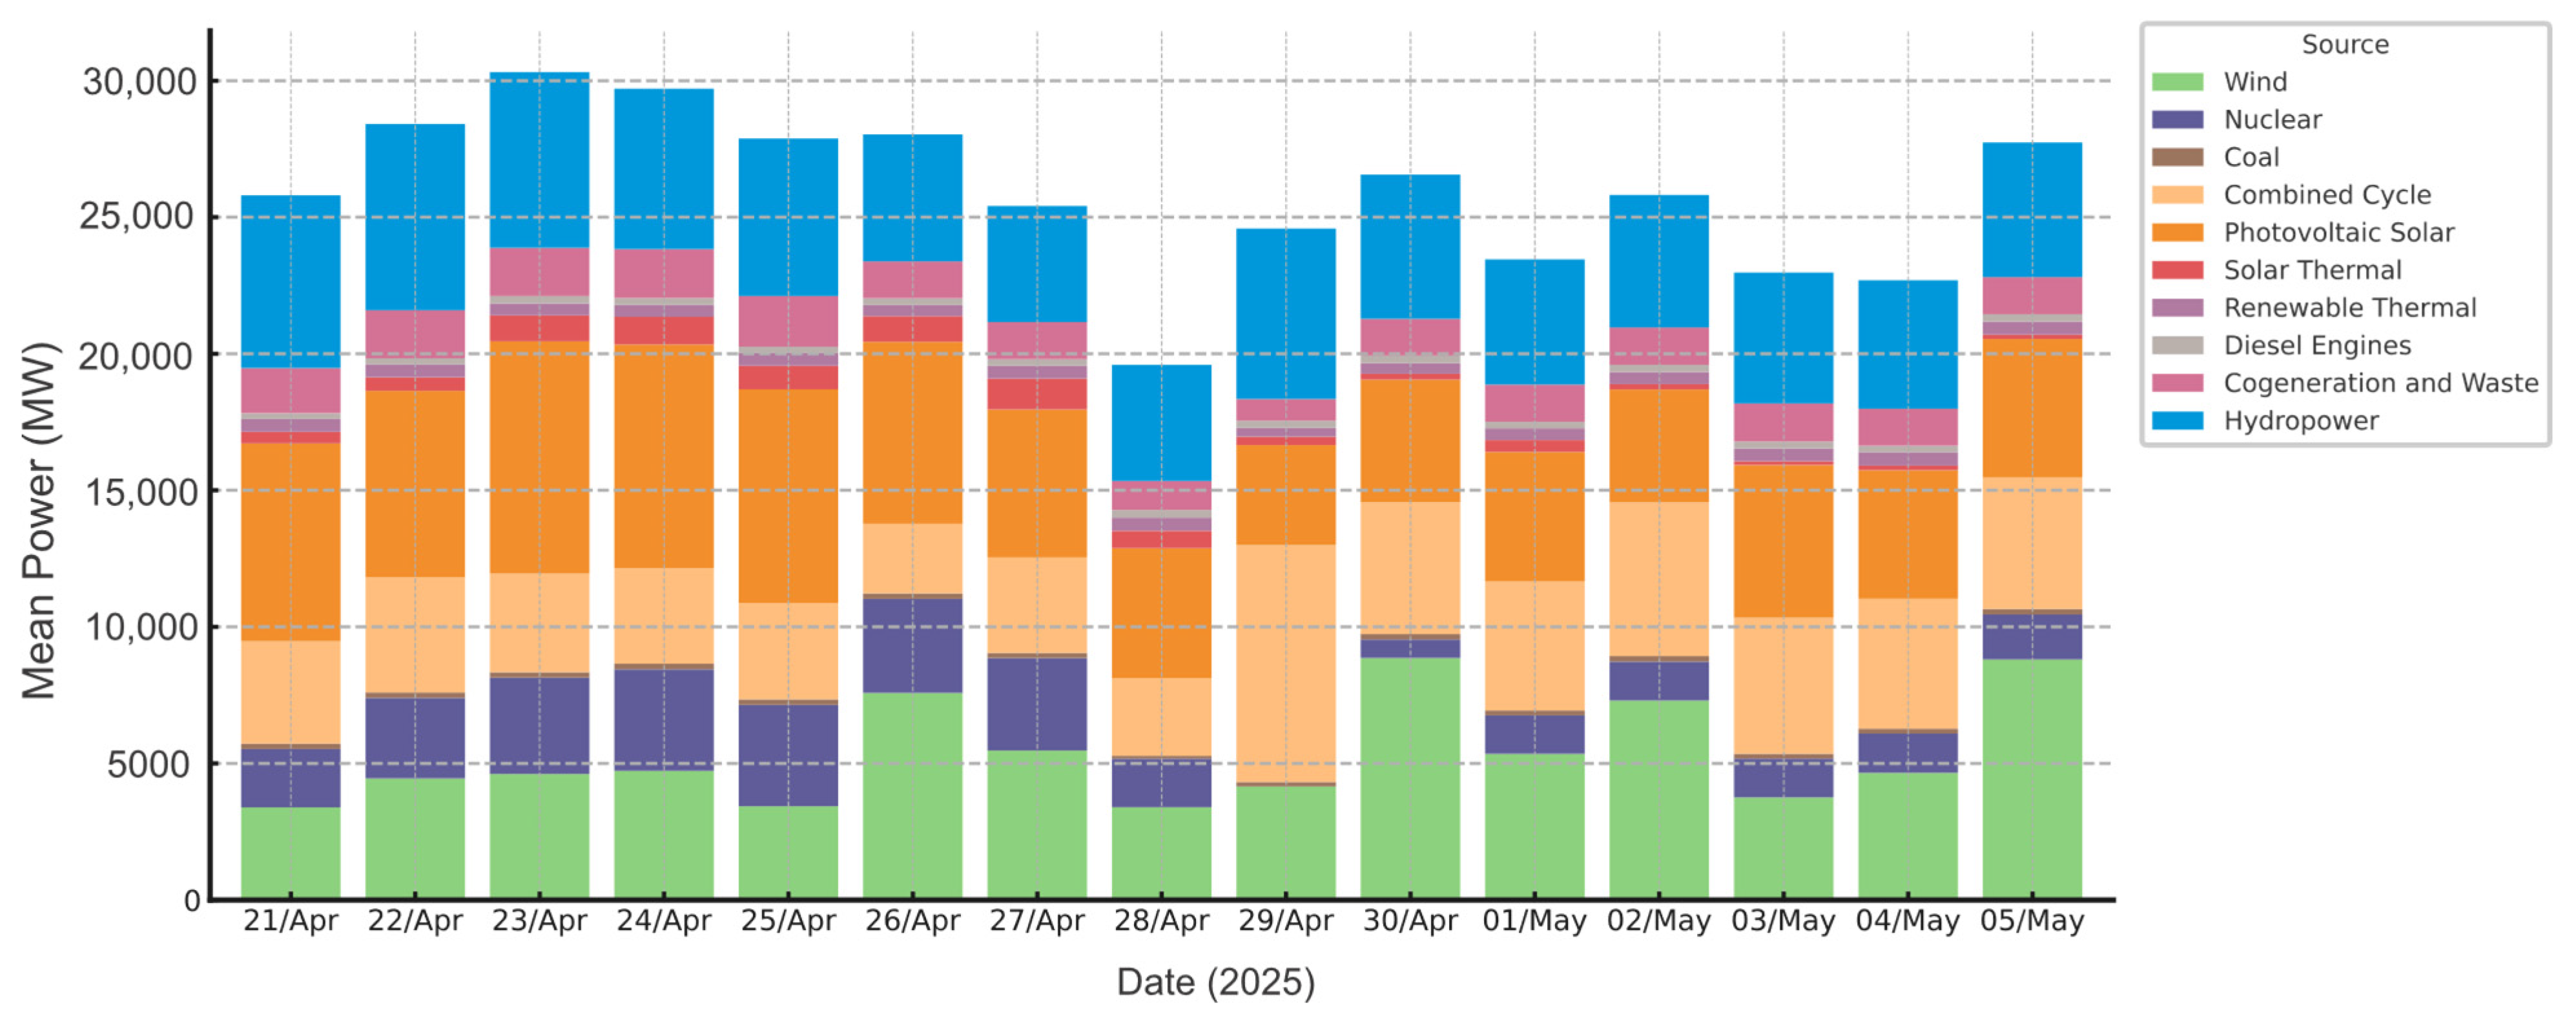
The analysis of the daily average power generation in Spain during the week before and the week after the 28 April 2025, blackout reveals significant structural changes in the country’s electricity matrix, shown in
Figure 12. Between April 21 and 27, nuclear energy played a critical baseload role, averaging 3134 MW per day, while photovoltaic solar generation stood out with 7228 MW, reflecting a substantial renewable contribution. However, from April 28 to May 4, following the blackout, nuclear generation experienced an abrupt drop of −62.5%, falling to 1179 MW, indicating a possible prolonged shutdown of generating units. Photovoltaic solar generation was also heavily affected, with a −35.8% reduction, averaging 4636 MW per day—likely due to deliberate curtailment. To offset these losses, combined cycle (natural gas) generation increased by +46.7%, rising from 3520 MW to 5164 MW, taking a central role in meeting the load. Wind generation also rose by +20.3%, from 4806 MW to 5568 MW. Other sources showed moderate variations.
The operation of the electricity system with a 100% renewable energy supply is now a reality. Germany reached this milestone on January 1, 2018 [
33]. Since then, it has frequently met all its demands with renewable sources, consistently exceeding 100% of local demand, with the excess energy either being exported or stored. Spain also recently achieved a significant milestone on April 16, 2025, when its electricity grid operated entirely on renewable sources for eight consecutive hours during an entire day for the first time, as plotted in
Figure 13.
The experience of electrical systems operating with high generation shares from non-synchronous sources, such as solar and wind, is relatively recent. While integrating these renewable sources is progressing significantly, the learning process of managing these systems’ operations at a large scale is still ongoing.
Insufficient inertia could have played a key role in aggravating the disturbances in all these cases. The systems experienced faster frequency deviations, shorter timeframes for corrective actions, and higher risks of widespread disruptions.
3.2. Strategies to Mitigate Inertia Reduction
To respond to the challenges posed by reduced inertia, various strategies have been developed to preserve system stability.
3.2.1. Synthetic or Virtual Inertia
Synthetic inertia devices emulate the inertial response of synchronous machines using fast-acting power electronics. Technologies such as flywheels, batteries, and supercapacitors can inject or absorb active power in response to frequency deviations. Shobug et al. [
34] demonstrated that appropriately controlled wind turbine generators could provide synthetic inertia, substantially improving frequency nadirs following disturbances. In a similar approach, Kheshti et al. [
35] proposed an inertial control method for wind turbines based on a Gaussian distribution, aiming to optimize power response and effectively reduce RoCoF during disturbances.
3.2.2. Grid-Forming Inverters
Unlike conventional grid-following inverters, grid-forming inverters actively regulate voltage and frequency, emulating the behavior of synchronous machines. Zhou et al. [
36] and Guo et al. [
37] proposed hierarchical control schemes for these inverters, demonstrating their effectiveness in enhancing system resilience, even in the presence of communication delays. Grid-forming inverters are capable of delivering fast frequency support and, when deployed at scale, can partially offset the loss of inherent system inertia. However, despite progress in synthetic inertia and grid-forming technologies, these systems still fall short of replicating the robust and intrinsic dynamic response of traditional synchronous generators.
3.2.3. Fast Frequency Response (FFR) and Frequency Containment Reserve (FCR)
To counteract rapid frequency deviations, markets have been developed for Fast Frequency Response (FFR) and Frequency Containment Reserve (FCR) services, enabling resources to provide ultra-fast active power injections immediately after disturbances. Studies [
38,
39,
40] emphasize that integrating FFR and FCR markets has become essential in Europe, particularly in countries such as Germany, Great Britain, Portugal, and Sweden [
41,
42,
43]. These market mechanisms incentivize resources to deliver fast frequency services. Experience from European markets shows that coordinated ancillary service markets can significantly enhance system resilience. However, integrating synthetic inertia into these markets requires careful consideration of procurement, pricing, and system coordination challenges.
3.2.4. Other Approaches
Synchronous condensers have resurged as a solution to provide both reactive power and rotational inertia without active generation. Although they require substantial investment and spatial footprint [
44], they offer reliable inertia sources independent of weather or fuel availability.
Innovative control strategies, such as virtual synchronous machine (VSM) implementations [
45,
46] and adaptive hybrid inertia controllers combining kinetic emulation and fuzzy logic adaptation [
47], further enhance system frequency stability.
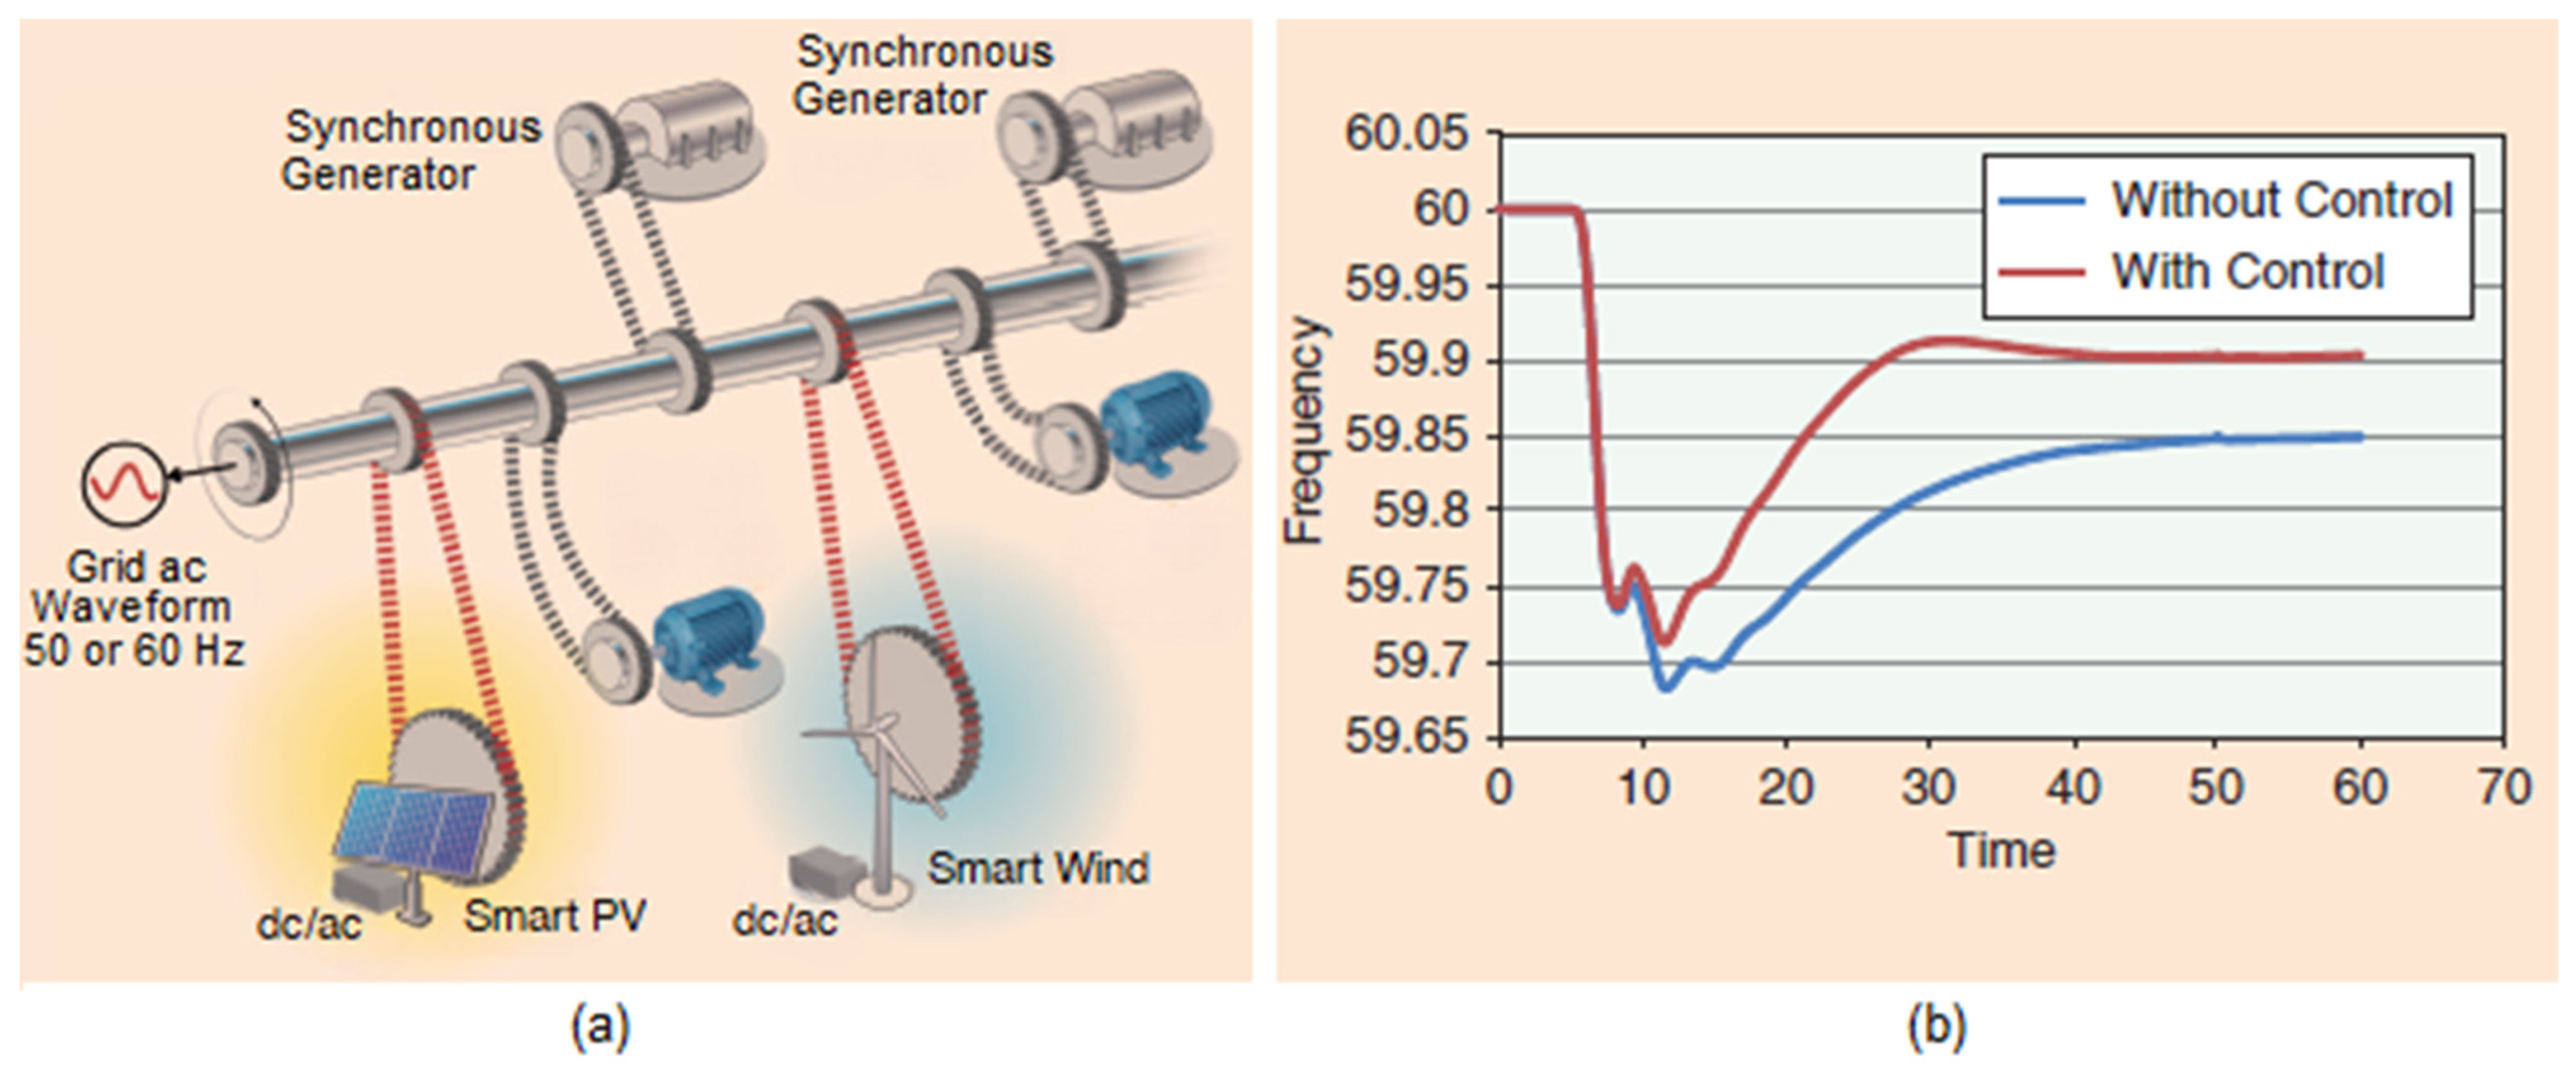
Figure 14 illustrates the layout differences between conventional synchronous machine-dominated and modern VRES-dominated grids. Also, it shows an overall perspective of the impact of inertial controls on frequency drops [
45].
Declining synchronous generation, while generation from non-synchronous machines or inverter- or HVDC-connected sources (high-voltage direct current technology) is expected to increase proportionally, creating challenges for grid stability. An often-overlooked aspect is that even HVDC-based systems, which enable the interconnection of different regions and the transmission of large amounts of energy, do not contribute to system inertia. Although HVDC systems are connected to rotating machines, the energy transmitted through these systems does not exhibit the inherent damping provided by synchronous machines. This means that grid frequency may fluctuate more abruptly in case of faults or disturbances than in systems without HVDC, increasing the risk of outages [
48,
49].
Energy storage systems, particularly large-scale batteries, have been explored for their ability to deliver fast frequency support. However, duration constraints and cost challenges limit their role to supplementary support rather than complete inertia replacement [
50].
Grid-forming technologies and synthetic inertia offer promising pathways, but sustaining long-term system reliability will likely require a hybrid approach, such as combining VRES with strategic retention of synchronous inertia from sources such as nuclear power.
3.3. The Strategic Role of Nuclear Power
Amidst emerging technologies, nuclear power plants remain unparalleled inertia providers. Unlike inverter-based sources, their substantial rotating masses inherently contribute significant kinetic energy to the system.
Studies by Peakman et al. [
51] and Samaan et al. [
52] emphasize that nuclear turbines represent critical inertia contributors. In the Eastern Interconnection of North America, nuclear units account for approximately 10% of total system inertia. Their continuous baseload operation ensures a steady and predictable inertial buffer, unlike intermittent VRES.
Beyond inertia provision, modern nuclear plants have been designed with increasing operational flexibility. Mazauric et al. [
53] and Boudot et al. [
54] showed that Small Modular Reactors (SMRs) can offer fast frequency support, improving dynamic responses to disturbances. SMRs distributed across a grid exhibited enhanced frequency resilience compared to centralized large reactors, reducing peak frequency deviations by 14% while enhancing system responsiveness, with a 21% increase in RoCoF.
Johnson et al. analyzed scenarios in which the retirement of nuclear plants led to increased reliance on fossil fuel generators to maintain system inertia, resulting in higher emissions and operational costs. Their findings underscore the strategic importance of retaining nuclear units within the generation portfolio to support grid resilience during the clean energy transition. Specifically, they showed that in Texas, system inertia remained stable with approximately 30% renewable penetration only when nuclear plants were kept online. When nuclear units were retired in simulations, inertia levels dropped significantly, requiring coal and gas plants to operate at minimum loads to preserve frequency stability. These results highlight the critical role of nuclear generators in providing inherent inertia and damping frequency deviations in grids with high shares of renewable energy sources [
55,
56].
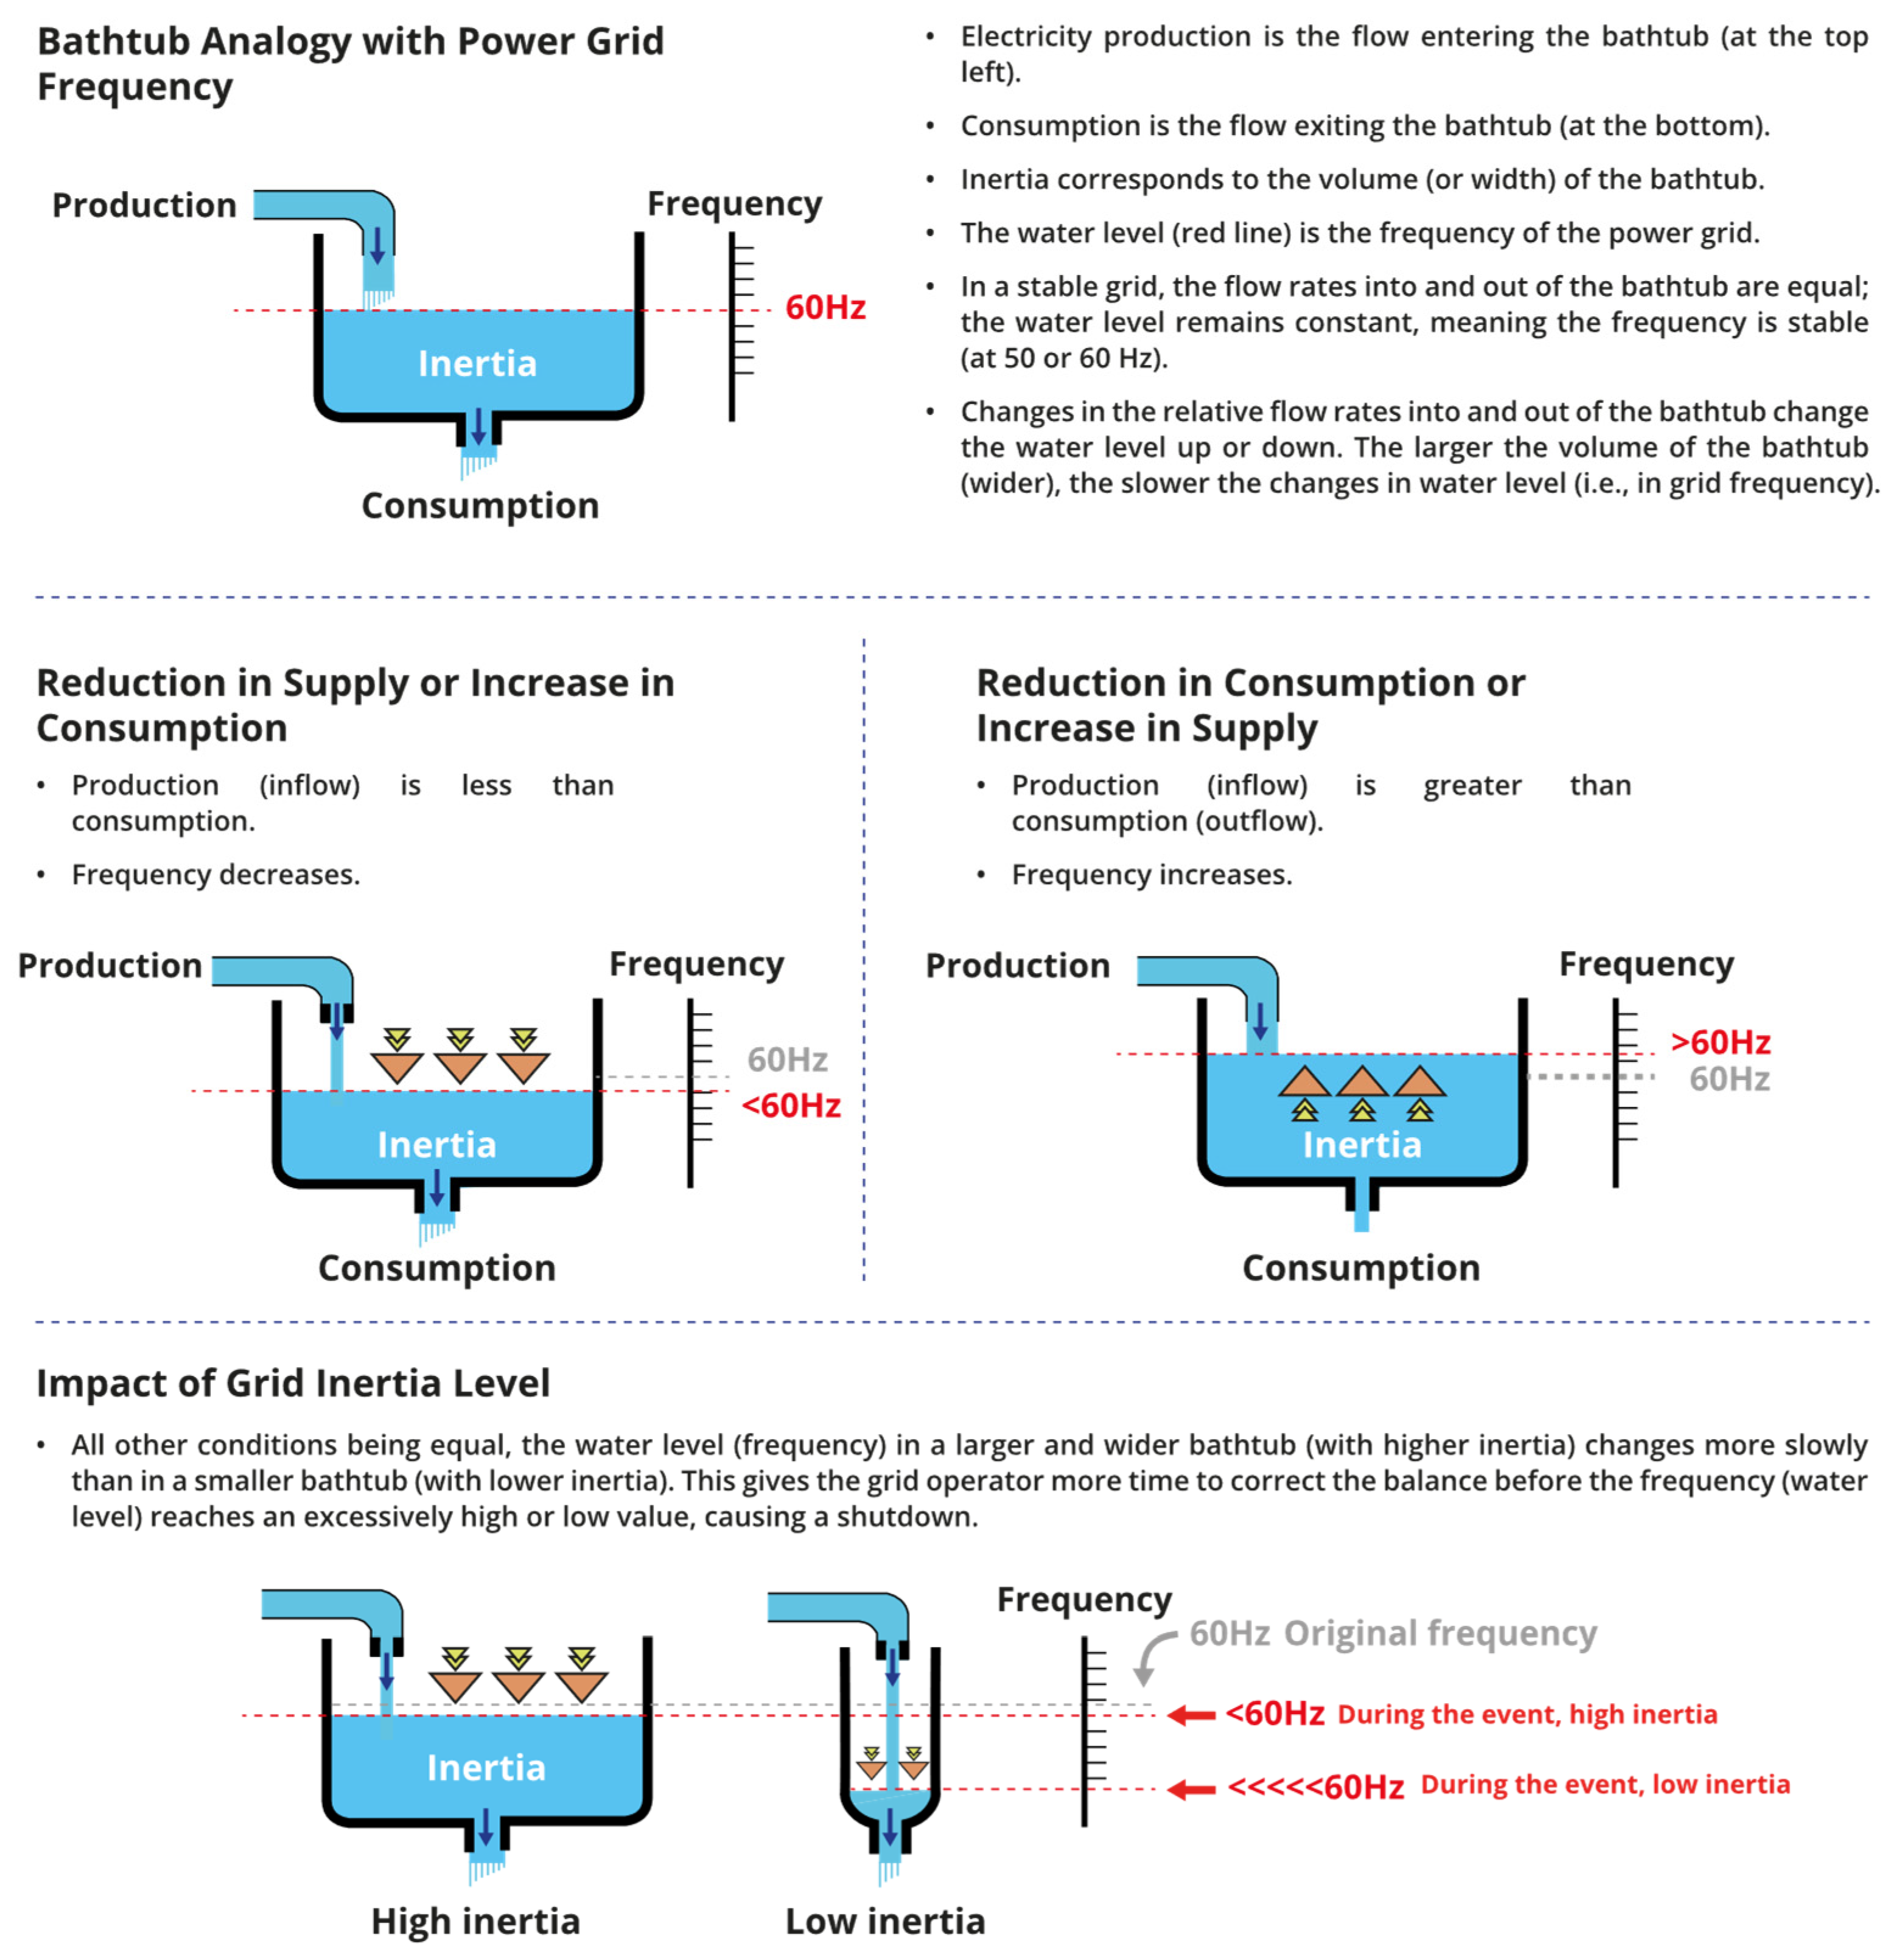
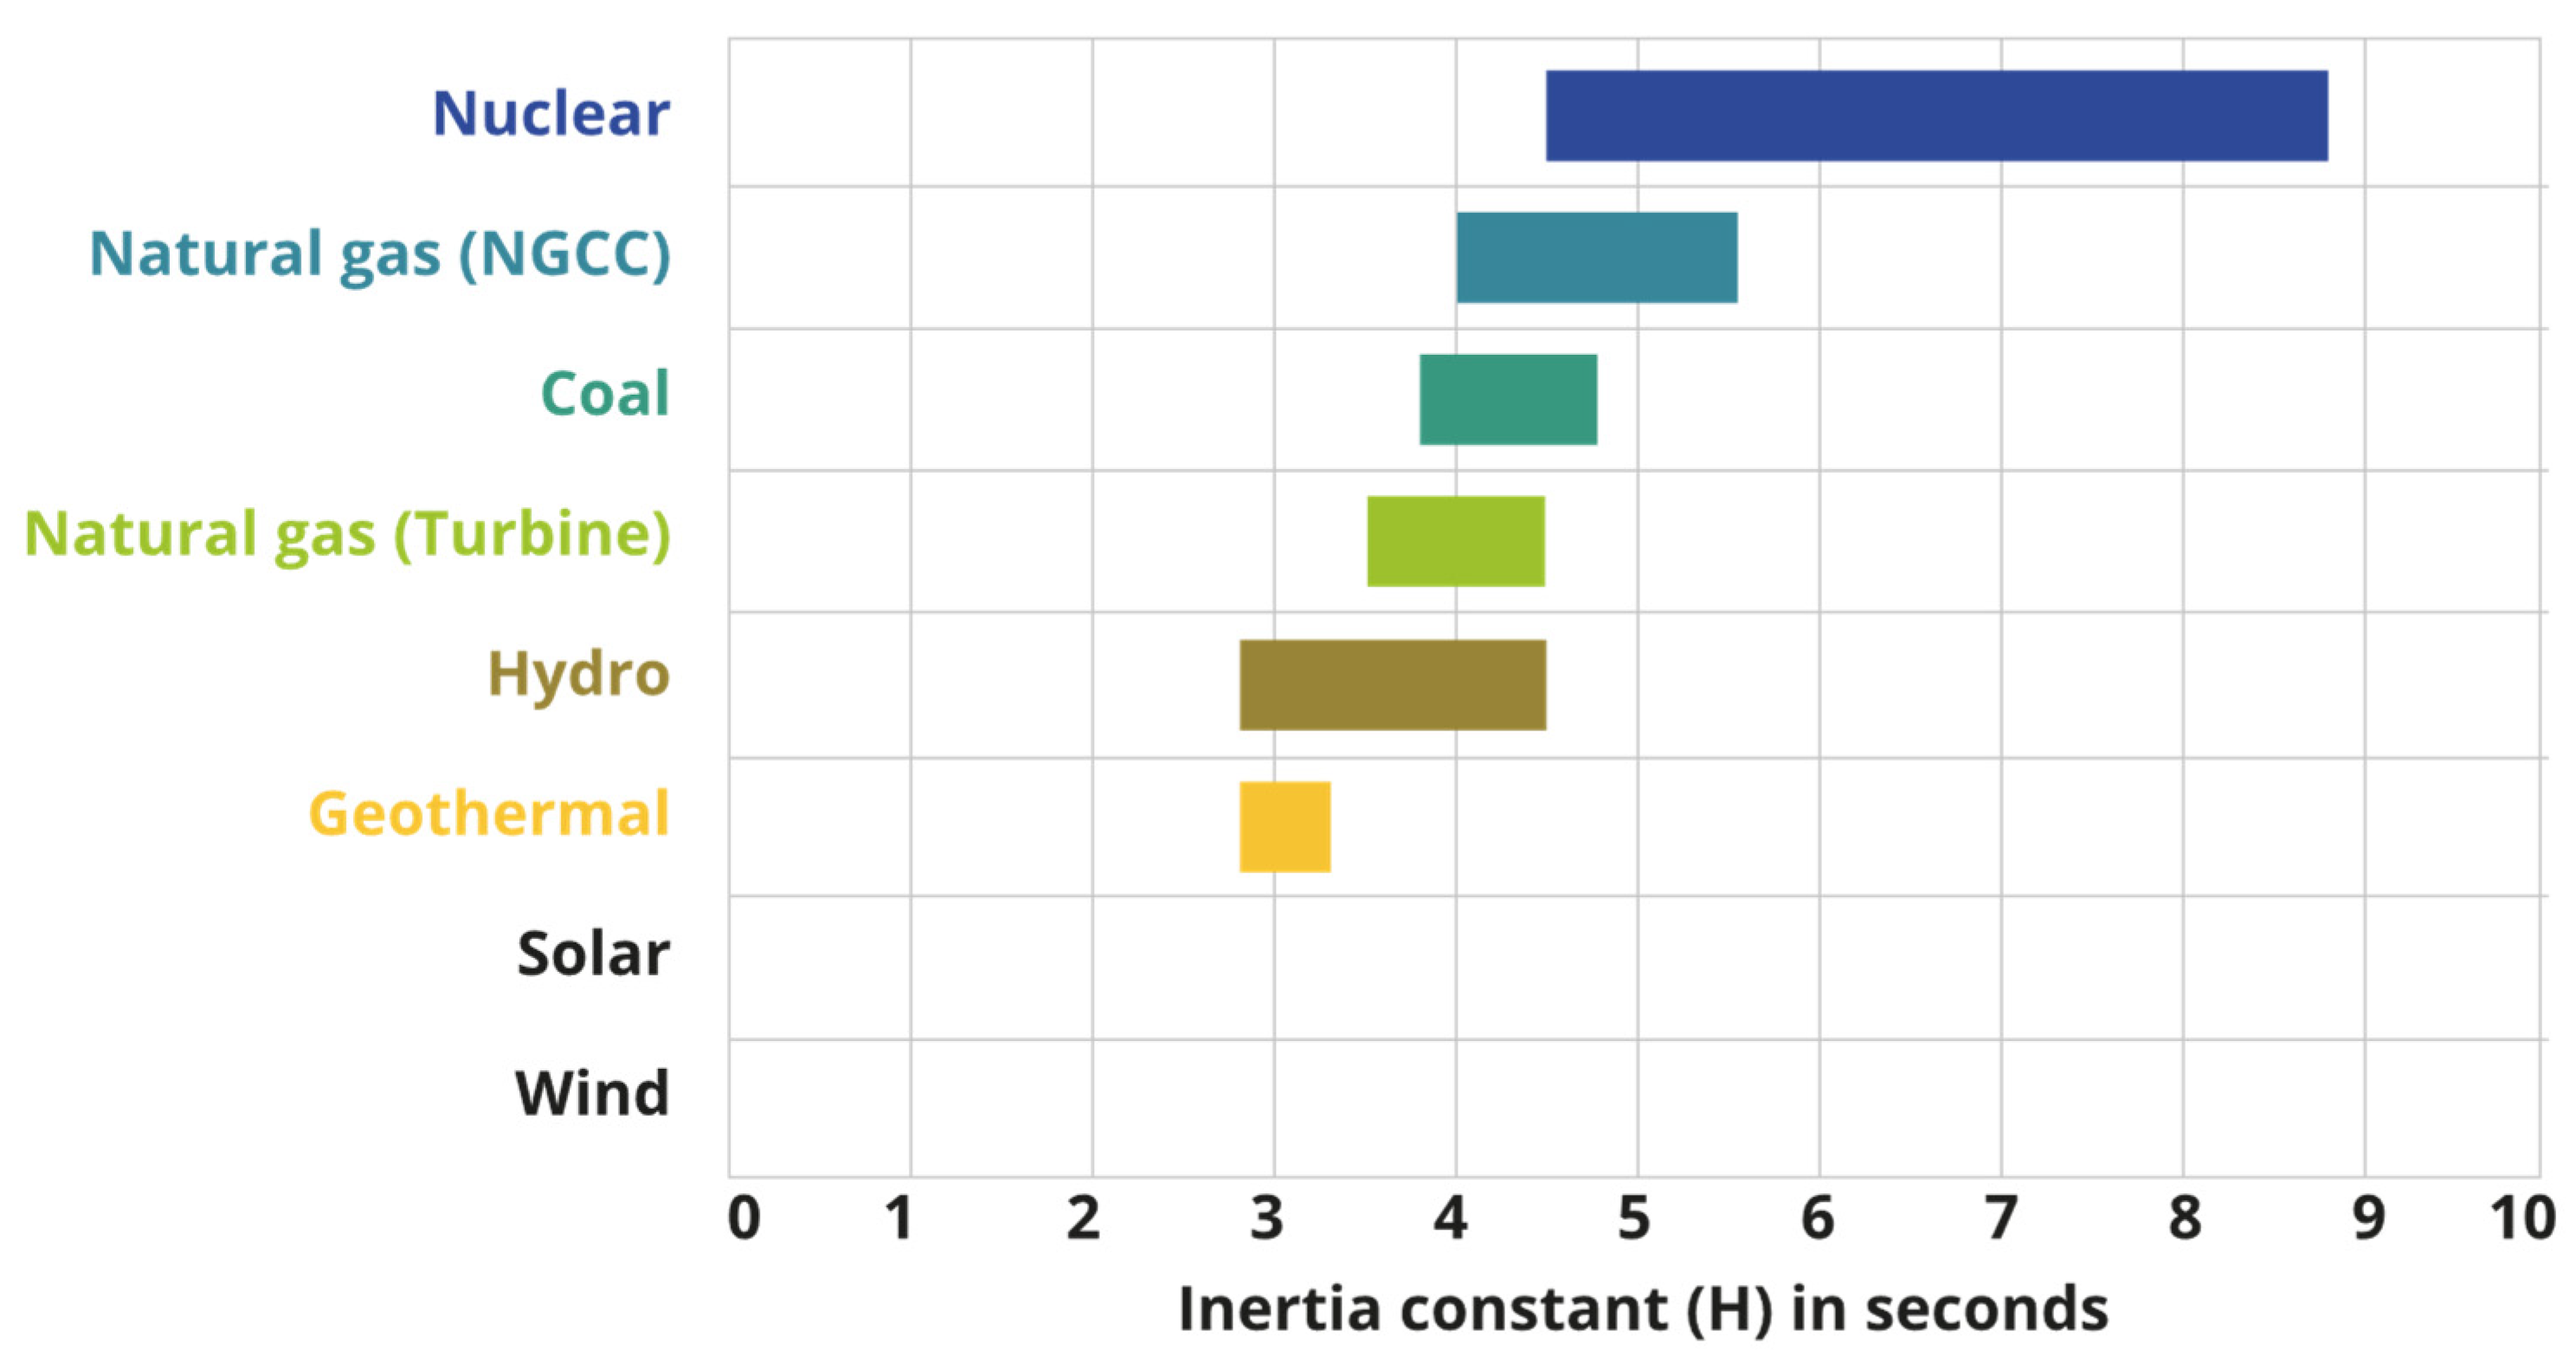
Figure 15 and
Figure 16 further elucidate the critical role of inertia.
Figure 15 presents a hydraulic analogy, comparing inertia to the size of a water reservoir, buffering inflow and outflow variations.
Figure 16 displays typical inertia constants (H) across generation types, highlighting nuclear energy’s leading role.
The transition to a power system dominated by renewable energy sources presents profound technical challenges beyond replacing energy generation technologies. Among these challenges, the preservation of system inertia emerges as one of the most critical and least replaceable elements for ensuring grid stability and operational reliability.
Traditionally supplied by the rotating masses of synchronous machines, inertia acts as a fundamental buffer against sudden imbalances between generation and load. Its presence slows the rate of frequency deviation, providing essential time for protective actions and corrective mechanisms to operate effectively. As inverter-connected renewable resources displace conventional synchronous generators, this inherent stabilizing mechanism is reduced, increasing the grid’s vulnerability to rapid and severe frequency excursions.
Systems characterized by low inertia inherently become more fragile. The increased speed and severity of frequency deviations in these environments reduce the operational margin for interventions, escalating the likelihood of load shedding, equipment disconnections, and cascading failures. Consequently, inertia must be understood not simply as a physical characteristic but as a strategic resource indispensable to the resilience of modern and future energy systems.
Addressing the decline in inertia requires a multipronged approach. Synthetic and virtual inertia technologies offer valuable support by enhancing the dynamic response of the grid, and grid-forming converters provide increasingly sophisticated control capabilities. Fast frequency reserves and other ancillary services have been developed to inject rapid active power following disturbances. While these innovations contribute meaningfully to system resilience, they do not fully replace the inherent stabilizing properties of natural inertia. Moreover, they depend on complex coordination strategies, specialized infrastructure, and sustained investment to deliver their intended performance reliably.
In this context, nuclear energy emerges as a pivotal pillar for ensuring grid stability. Beyond its role as a source of low-carbon, dispatchable generation, nuclear plants inherently provide substantial inertia through the kinetic energy stored in their massive turbine-generator assemblies. This contribution is passive, immediate, and independent of external controls, offering stability that current synthetic solutions cannot entirely replicate. In grids increasingly dominated by converter-based resources, the intrinsic inertia provided by nuclear power becomes even more valuable, serving as a foundational element of dynamic security.
Nonetheless, the strategic importance of inertia must be understood within the context of the prevailing power system architecture. As long as alternating current (AC) transmission is the global standard and power systems continue to rely on tightly regulated frequency and voltage parameters, inertia will remain indispensable for system stability, as established throughout the 20th century.
However, some long-term visions suggest a paradigm shift toward power systems with widespread direct current (DC) distribution and fully electronically controlled loads and drives. In such configurations, wider operational bandwidths and greater control flexibility may diminish the need for inertia in its classical form. While this scenario is still speculative, it underscores the importance of aligning inertia-related strategies with the structural evolution of power system infrastructure.
It is important to note that the challenges posed by reduced system inertia due to the increasing penetration of variable renewable energy sources (VRES) are not isolated from the hydrological uncertainties the Brazilian power system faces. On the contrary, the decline in synchronous generation places additional operational stress on hydroelectric plants, which have historically provided both frequency regulation and firm energy supply.
This dual pressure—frequency instability due to inverter-based sources and the depletion of water reservoirs due to recurring droughts—reveals the system’s growing vulnerability. As hydroelectric plants can no longer be solely relied upon to fulfill both roles, there is a growing need for a regulatory thermal capacity that simultaneously provides inertial response and long-term reliability.
In this context, nuclear power emerges as a unique asset. Its synchronous operation contributes to grid stability by supplying inertia and frequency support, while its firm generation profile can act as a “virtual reservoir,” complementing hydro in times of scarcity. This dual capability positions nuclear energy not as a substitute but as a structural complement to hydroelectricity within a resilient and decarbonized power system.
4. Conclusions
The ongoing energy transition presents significant challenges to the reliability and stability of power systems, mainly due to the increasing penetration of variable renewable energy sources (VRES), such as solar and wind. The reduction in system inertia resulting from replacing synchronous generators with power electronic inverters undermines the resilience of the electric grid, making it more susceptible to abrupt frequency deviations and systemic failures. In this context, the adoption of strategic solutions becomes essential to ensure the security of energy supply.
This study highlights the contribution of nuclear energy in maintaining the stability of Brazil’s power system. In addition to providing a continuous and reliable baseload supply, nuclear power plants exhibit high inertia capability, acting as stabilizing elements in the interconnected grid. The concept of “Nuclear Energy = Water” underscores the equivalence between nuclear generation and hydropower storage capacity, showing that nuclear energy can compensate for the declining regulatory capacity of hydropower reservoirs. Thus, its expansion represents a robust alternative to mitigate the effects of hydrological variability and ensure long-term system stability. The water crises of recent decades have exposed the vulnerability of Brazil’s electricity model, which is genuinely reliant on hydroelectricity.
The case of the São Francisco River Basin, in this investigation, illustrates the growing need for complementary alternatives. The progressive depletion of the regulatory capacity of reservoirs, such as Sobradinho, compromises the predictability of hydroelectric generation, making it essential to strengthen firm and dispatchable energy sources alongside a robust expansion plan for solar and wind renewables.
The analysis of the conversion factor between nuclear energy and hydropower storage indicates that expanding nuclear generation may offer a strategic solution to offset hydrological variability and conserve water resources for multiple uses. In discussions surrounding the choice of primary energy sources for power generation, it is also important to emphasize that preserving system inertia is a fundamental technical requirement for maintaining grid stability. Reliable power systems are essential for economic and social development, and significant disruptions can have severe consequences for industries, hospitals, and other critical infrastructure.
Therefore, ensuring that electric grids continue operating with high stability levels must be a top priority in any energy transition strategy. Moreover, implementing complementary strategies, such as synchronous condensers, synthetic inertia, and fast frequency reserve markets, can help mitigate the impacts of inertia reduction. However, these solutions still face technical and economic challenges and require ongoing investments to enable large-scale deployment. International experience shows that the diversification of the energy mix must be carried out in a balanced manner, ensuring integration between renewable sources and dispatchable, high-inertia technologies.
Countries that have rapidly pursued power sector decarbonization without adequately considering the need for system stability have faced operational difficulties and rising grid operation costs. Accordingly, Brazil must recognize the importance of strategic energy planning, including nuclear power as a foundational pillar in transitioning toward a low-carbon energy matrix.
It is also necessary to consider that the importance of inertia is closely tied to the current architecture of power systems, which are based on alternating current (AC) with historically narrow operational tolerances for frequency and voltage. In the long term, should a migration toward direct current (DC) systems occur, featuring electronically controlled loads and more tolerant operating ranges, the role of inertia could be redefined. Nevertheless, such a scenario remains speculative and distant from the current reality of most power grids. Whilst the AC paradigm prevails, inertia will remain a non-negotiable cornerstone of operational stability, and resources that provide it robustly, such as nuclear generation, must be treated as strategic assets.
In conclusion, this study demonstrates that expanding nuclear power generation in Brazil can compensate for the declining regulatory capacity of hydropower reservoirs and enhance grid stability. The established equivalence between nuclear energy and hydropower storage highlights the potential of nuclear power as a reliable baseload source.
Future research should focus on developing detailed planning models and assessing the economic and environmental impacts of such expansions.
The formulation of public policies, regulatory frameworks, and operational procedures that acknowledge the technical, economic, and operational balance among energy sources and end-use demands will be essential to consolidating a modern, robust, and future-ready power matrix for the 21st century.


