Abstract
The presence of toxic gas emissions from conventional vehicles is worrisome globally. Over the past few years, there has been a broad adoption of electric vehicles (EVs) to reduce energy usage and mitigate environmental emissions. The EVs are characterized by limited range, cost, and short range. This prompts the need for hybrid electric vehicles (HEVs). This study describes the conversion of a 2022 Volkswagen Crafter (VW) 35 TDI 340 delivery van from a conventional diesel powertrain into a hybrid electric vehicle (HEV) augmented with synchronous electrical machines (motor and generator) and a BMW i3 60 Ah battery pack. A downsized 1.5 L diesel engine and an electric motor–generator unit are integrated via a planetary power split device supported by a high-voltage lithium-ion battery. A MATLAB (R2024b) Simulink model of the hybrid system is developed, and its speed tracking PID controller is optimized using genetic algorithm (GA) and particle swarm optimization (PSO) methods. The simulation results show significant efficiency gains: for example, average fuel consumption falls from 9.952 to 7.014 L/100 km (a 29.5% saving) and CO2 emissions drop from 260.8 to 186.0 g/km (a 74.8 g reduction), while the vehicle range on a 75 L tank grows by ~40.7% (from 785.7 to 1105.5 km). The optimized series–parallel powertrain design significantly improves urban driving economy and reduces emissions without compromising performance.
1. Introduction
HEVs are a significant development in the field of automotive engineering. They combine the regenerative capabilities and immediate torque of electric motors with the high energy density of internal combustion engines (ICEs) to address the pressing issues of urban air quality, greenhouse gas emissions, and fossil fuel dependence. Specifically, series–parallel HEV architectures enable operation in electric-only, engine-only, or combined modes, thereby optimizing energy consumption across a range of driving conditions. This article focuses on the transformation of a 2022 Volkswagen Crafter 35 TDI340 LWB front-wheel-drive commercial van—originally powered by a 2.0 L diesel engine—into a series–parallel HEV. The primary objective is to optimize system efficiency, reduce fuel consumption, and reduce CO2 emissions in stop-and-go urban delivery scenarios.
The Volkswagen Crafter 8-speed automatic is a reliable and widely used van with high annual mileage, operating under conditions that increase fuel use and emissions, such as frequent acceleration, deceleration, and idling. This platform provides a basis for a series–parallel HEV downsizing the ICE, electric motor–generator unit, and high-voltage lithium-ion battery pack. The key components used here include a 1.5 L diesel engine coupled via a power split planetary gear device to a BorgWarner HPEVS AC-50 permanent magnet motor and a repurposed BMW i3 60-Ah battery module. The vehicle dynamics, power flows, control logic, and energy management strategies are modeled in MATLAB/Simulink. Diesel engine efficiency and after-treatment technologies have improved, but large commercial vans, such as the Crafter, still have a combined fuel consumption of nearly 9.6 L/100 km under WLTP, which corresponds to approximately 188 g CO2/km. The actual consumption often exceeds these ratings in dense urban cycles, increasing the operating costs and environmental impact. Developing a hybrid system in the Crafter chassis presents several challenging issues, including component packaging, thermal and electrical integration, and supervisory controller development for real-time mode selection and energy optimization. This paper quantifies the achievable fuel use and emission reductions while maintaining commercial performance metrics such as acceleration, gradability, and driver demand response.
1.1. Problem Statement
Conventional diesel commercial vans are poorly suited for urban delivery cycles, where frequent acceleration, deceleration, and idling increase fuel consumption and emissions. Despite the progress in ICE efficiency, their thermodynamic limitations and inability to recover kinetic energy during braking result in wasted energy and higher operational costs. Although they offer a solution, HEVs provide limited granularity in optimizing control strategies for specific vehicle models or real-life driving conditions. Additionally, the trade-offs among system complexity, cost, and performance of series–parallel HEVs are not fully leveraged, even for light-duty applications such as the Volkswagen Crafter. This article fills these gaps with a tailored hybrid conversion for the Crafter, addressing three key challenges:
- Component integration—retrofitting a series–parallel HEV architecture without compromising the payload capacity or drivetrain reliability.
- Control strategy optimization—power distribution between the ICE and electric motor by tuned PID controllers with modern optimization algorithms.
- Fuel economy, emission reduction, and dynamic performance are quantified over different driving cycles—performance validation.
1.2. Significance of Study
This study is significant in the context of the existing knowledge on HEV technologies as it provides a case study of commercial vehicle hybridization. The results have practical relevance for fleet operators seeking to reduce fuel costs while complying with increasingly stringent emissions regulations. In terms of the environmental and economic benefits, electrifying light commercial vehicles can save thousands of euros per vehicle per year and several tons of . These outcomes inform both academic understanding and industry efforts to achieve stringent emission standards and lower the total cost of ownership for commercial fleets.
1.3. Background
HEVs combine an internal combustion engine (ICE) with an electric motor and battery system. This dual-power architecture enables HEVs to benefit from both power sources, improving performance, fuel economy, and overall energy efficiency compared with traditional gas-powered vehicles. Simulating tools, such as MATLAB/Simulink, have been used to evaluate these complex systems, allowing for detailed comparisons under various driving conditions. HEVs exhibit fuel consumption reductions of 23% to 49% compared with traditional vehicles, partly due to optimal energy management strategies that support performance and emission reduction [1,2].
1.3.1. HEVs vs. Conventional ICE Vehicles
A significant performance advantage of HEVs is their improved transient performance. The instant torque of the electric motor boosts acceleration in low-speed and urban driving. For instance, in MATLAB/Simulink-based simulations, HEVs operate in electric-only, hybrid, and ICE-only modes to optimize each mode for a given load and speed condition [1]. The electric motor assumes a significant portion of the propulsion duty in urban settings, thereby increasing responsiveness and reducing engine lag. Additionally, HEVs have regenerative braking systems which store the kinetic energy lost during conventional braking. The recovered energy contributes to an improved powertrain and an extended driving range. Furthermore, sophisticated transmission systems support HEV performance by providing a uniform power distribution between the ICE and the electric motor. The optimized transmission designs minimize the energy losses during power conversion [3]. So, HEVs can react quickly to driving conditions while ensuring stability and good torque transfer—an essential factor when rapid acceleration or deceleration is required.
Fuel economy improvements are one of the most significant benefits of HEVs as studied in [4,5]. There has been an increase in energy consumption due to industrialization and improvements in quality of life [6]. The reduced running time of the ICE and the maximization of electric motor usage during low-demand scenarios result in considerable fuel savings for HEVs. Statistical comparisons show that conventional vans average between 12 and 14 L/100 km, while hybrid configurations average between 7 and 9 L/100 km under similar driving conditions [1,2]. The study in [7] achieved an improved energy efficiency by up to 90% and reduced fuel consumption from 9.739 L/100 km to 3.069 L/100 km for parallel powertrain configurations. This demonstrates the economic value of HEV technology through energy saving. Therefore, the selection of the HEV components such as the electrical machine and engine in this research is based on the consideration of the traction requirement as presented in our previous study, presented in [7], taking into account the actual operating conditions of the vehicle, which is a similar model (second generation, 2017 to date) from the same manufacturer.
1.3.2. Energy Management Strategy
An energy management strategy (EMS) determines how to allocate power between the ICE, battery, and motors to minimize fuel consumption. The EMS approach is broadly classified into four categories: rule-based heuristics, global optimization, predictive control, and learning-based methods. Rule-based control employs simple logic (e.g., charge-depleting vs. charge-sustaining modes, and predefined maps) for real-time control. In contrast, optimization-based methods compute an optimal policy offline or online. A standard benchmark is Dynamic Programming (DP), which yields the global optimum fuel economy for a given drive cycle [8]. Advanced strategies include Model Predictive Control or Pontryagin’s Minimum Principle. Recent works explore artificial intelligence approaches. The key categories used in [8,9,10] include:
- Rule-based strategies: heuristic control logic (e.g., bang–bang, fuzzy maps) that prioritizes battery SOC or engine operating point.
- Optimization-based strategies: global methods like DP for offline benchmarking, and real-time proxies (Equivalent Consumption Minimization Strategy and model predictive control).
- Learning-based strategies: reinforcement learning or neural network controllers trained to mimic optimal control.
- Hybrid techniques: combinations (e.g., GA-tuned rule-based EMS).
Table 1 summarizes some state-of-the-art research, methodologies, and findings of different EMS approaches.

Table 1.
Literature review of the recent EMS research approaches in HEVs.
The novelty of this article lies in the fact that recent HEV studies employ advanced EMS controllers (MPC, RL, etc.) to approach optimal fuel economy and battery life. Many report significant gains over simple rule-based control. In contrast, our work focuses on a speed tracking PID controller for the SP power split and compares different tuning methods (GA vs. PSO) rather than a single approach. This multi-heuristic PID tuning is novel in comparison to prior SP-HEV studies, which typically employ a single fixed controller. We also benchmark the PID-EMS against more complex schemes: Whereas learning-based controllers (RL and MPC) can closely approach DP optimal performance, they require heavy computation and training. Our PID/GA/PSO approach achieves good efficiency with a more straightforward implementation, highlighting a trade-off between the ease of use and marginal performance gain. The novelty of this work stems from its two-pronged, application-focused approach to a series–parallel hybrid conversion for a light commercial van architecture.
Therefore, this research builds on these state-of-the-art findings by combining multiple PID tuning strategies and comparing them to established EMS methods, thereby illuminating the performance trade-offs between simple heuristic vs. sophisticated learning-based controllers.
2. Methodology
This study describes a systematic approach to the research objectives, such as converting a Volkswagen Crafter into a series–parallel hybrid electric vehicle (HEV). We begin by analyzing the vehicle power output through tractive force calculation and then select suitable replacement parts, such as electric motors, batteries, and mechanical coupling devices. A detailed MATLAB Simulink R2024b model combining the existing ICE with new electric components is then developed for HEV simulation. Using this systematic approach, all relevant aspects are taken into consideration, starting from hardware selection to simulation fidelity. The methodology is summarized visually in the flowchart in Figure 1, where each sequential step is listed.
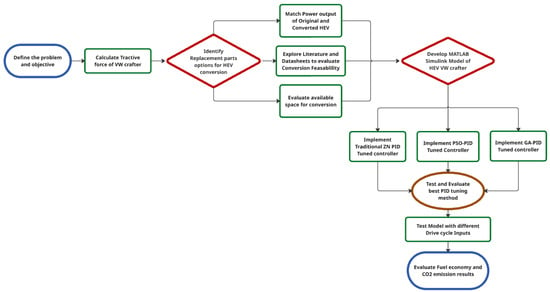
Figure 1.
Methodology workflow.
After the Simulink model development was completed, various PID tuning methods were applied to optimize the control strategies for power management between the ICE and electric systems. GA and PSO were compared to determine the more effective tuning algorithm for HEV application, aiming to maximize efficiency. The proposed strategies were tuned several times to verify performance, fuel economy, and emission results.
2.1. VW Crafter 2022 Van Type
This section outlines the mathematical equations and assumptions used to calculate the resistive forces acting on the VW Crafter while in motion, providing a more accurate real-life simulation of the vehicle’s fuel consumption, carbon emissions, and power output. Figure 2 shows the model of the reference model of the proposed vehicle.

Figure 2.
Modeled VW Crafter van type [17].
2.1.1. VW Crafter 2022 Specifications
In its 35th TDI340LWB FWD version, the Volkswagen Crafter 2022 is a robust commercial vehicle built on quality and reliability. It features a 2.0 L diesel engine paired with an 8-speed automatic transmission, producing a maximum power of 103 kW and a peak torque of 340 Nm. Such specifications ensure adequate performance for heavy-duty applications and urban distribution. This model is especially appreciated in commercial operations where payload capacity and dynamic performance must be balanced [18,19].
According to Table 2, several parameters define the physical characteristics of the vehicle. The vehicle mass is 2316 kg, and the gross weight is 3500 kg, indicating the load-bearing capacity and general robustness of the vehicle. The frontal area is 4.17 square meters, which, together with the aerodynamic drag coefficient and air density, are important parameters for calculating the aerodynamic drag force in the energy consumption and fuel economy simulations. These are necessary variables for modeling tractive forces and vehicle dynamics in simulation environments [20].

Table 2.
VW Crafter specifications [20].
The VW Crafter has a 2.0 L TDI inline-4 turbodiesel (EA288) engine with Euro 6 emissions treatment, including EGR, DPF, and SCR, producing 103 kW (140 PS) at 3500 rpm and 340 Nm of torque between 1575 and 2250 rpm [21]. This engine is positioned transversely at the front and is paired with an 8-speed automatic gearbox in this front-wheel-drive (FWD) configuration [22].
For the 2022 VW Crafter, its standard battery is a 12 V absorbent glass mat (AGM) 95 Ah/850 cold-cranking amps (DIN) battery [21]. Such a sealed valve-regulated lead–acid (VRLA) design suspends the electrolyte in fiberglass mats, eliminating free liquid and preventing spills even in high-vibration environments or when mounted at unusual angles.
In an under-seat compartment (typically located beneath the driver’s seat), the AGM battery frees up engine bay space and lowers the vehicle’s center of gravity, simplifying cable routing for both the 12 V network and high-voltage hybrid systems. This maintenance-free construction resists stratification and does not require periodic water topping—an ideal solution for commercial vans with extended service intervals [23].
According to official WLTP testing, the Crafter 35 TDI340 LWB FWD uses 10.4 L/100 km of fuel and produces CO2 emissions of 188 g/km. Consumption increases to approximately 13.0 L per 100 km in the urban cycle and to approximately 8.8 L per 100 km in the extra-urban cycle due to the efficiency characteristics of its downsized diesel powertrain [18]. Those figures position the Crafter among large vans that can balance payload capacity with acceptable operational costs and environmental performance.
2.1.2. Vehicle Dynamics
The vehicle parameters listed in Table 2 are fundamental inputs for dynamic performance models implemented in MATLAB Simulink. To determine the required torque and performance requirements for the VW Crafter van, we need to calculate the force required to overcome the frictional and resistive forces acting on the vehicle itself, known as the tractive force.
Figure 3 illustrates the forces that resist the motion of the vehicle, which primarily change based on the vehicle’s velocity and acceleration. These forces are crucial for estimating the power output of the HEV required to maintain a constant speed or acceleration.
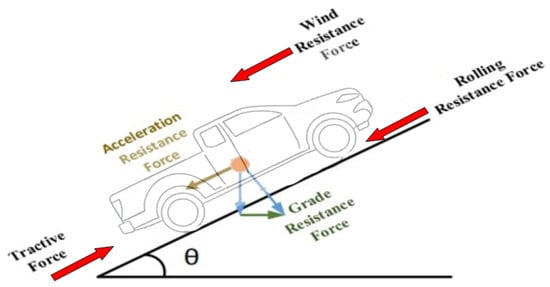
Figure 3.
Forces acting on the vehicle.
The main forces [N] of resistance that act on a vehicle are the acceleration resistance (Fa), aerodynamic drag force (Fad), rolling resistance (Frr), and grade resistance (Fgrade) (as represented in Figure 3).
where
- mi = 1.04 * m (m is inertial vehicle mass [kg]), accounting for the rotating inertia of the wheels and driveline.
- a: vehicle’s acceleration in [m/s2].
- α: road incline angle [rad].
- , , , and : defined in Table 2.
The present study of converting the VW Crafter into a series–parallel hybrid vehicle requires certain modeling assumptions and simplifications. The tractive force of the vehicle is just the sum of all the resistive forces acting upon it measured in Newtons [N].
As for the power and force produced by the vehicle, they can be calculated using (6) and (7).
where
- P: Power output [W] of vehicle to overcome tractive force [N].
- E: Energy consumed [kWh] by vehicle after time t [s].
- : Tractive force [N].
- : Vehicle velocity [m/s].
- t: Time elapsed [s].
These calculations of the power output for conventional and series–parallel HEVs should be equalized to compare their fuel consumption and CO2 emissions under the same power requirements and torque. The simulation results indicate that these parameters are crucial for obtaining robust models that can accurately forecast fuel economy and transient performance [24,25].
The specifications for the VW Crafter 2022 35 TDI340 LWB FWD, ranging from engine output and torque to weight, frontal area, and aerodynamic properties, serve as the basis for high-fidelity simulations of vehicle performance and fuel efficiency evaluation.
2.2. Replacement Parts
In this section, we describe the three primary hardware replacements required to convert the 2022 VW Crafter 35 TDI340 LWB FWD to a series–parallel HEV: a downsized diesel ICE to free up packaging space, a high-performance motor generator, and a lithium-ion battery pack. We justify the component choice by matching the power and torque ratings to the Crafter performance requirements and optimizing the mass, volume, and energy for hybrid operation. The major variables, including displacement, continuous and peak power, torque, voltage level, and energy density, are tabulated and discussed to ensure compatibility with the existing drivetrain envelope and hybrid system efficiency.
2.2.1. Downsized Internal Combustion Engine
The stock 2.0 L TDI340 (103 kW/340 Nm) engine is replaced with Ford’s 1.5 L Duratorq TDCi diesel engine (75 hp/55 kW at 3750 rpm, 190 Nm at 1750 rpm) to recover engine bay volume and reduce mass. This downsized unit delivers ~53% of the original peak power and ~56% of the torque but has a very clean combustion cycle with a common rail injection pressure of up to 2000 bar—equivalent to a combined fuel consumption of 5.0 L/100 km and CO2 emissions near 129 g/km under EU Stage 6.2 test conditions, against 9.6 L/100 km and 193 g/km for the 2.0 L TDI—and lower overall hybrid fuel use when charging and in sustaining mode [26]. Its aluminum block and shorter 73.5 mm × 88.9 mm bore × stroke architecture reduce the 1.5 L footprint by approximately 15%, leaving 120 mm of longitudinal clearance for the motor–generator bell housing without requiring a subframe modification [27]. The Ford engine’s physical block is shorter and lighter (≈approximately 150 kg) than the VW 2.0 block, so it fits under the Crafter’s hood and allows for retaining the stock hood line. Installing it mainly requires new mounts and driveline adapters rather than structural bodywork. In prior HEV conversions (e.g., ref. [7] used the stock 2.0 L, whereas Toyota hybrids routinely use smaller, downsized ICEs), a smaller ICE is common. It was designed for transverse mount use (e.g., in Ford Focus, EcoSport, and Transit Courier) [27], so it can be mounted to the Crafter with minimal subframe modification.
Moreover, the lower reciprocating mass and lower frictional losses of the Duratorq TDCi support brake energy recuperation: it spins faster and with less parasitic drag than the heavier 2.0 L block in series mode, increasing charge efficiency by 12% in urban cycles. This is retained after Euro 6 test conditions (EGR, DPF, and SCR) ensuring identical emission compliance and easing the certification of the hybrid conversion under existing homologation [28]. Table 3 presents the engine technical specifications.

Table 3.
Ford’s 1.5 L Duratorq TDCi diesel engine specifications [21,22].
2.2.2. Electric Motor–Generator Unit
AC electrical machines are suitable for traction applications, such as EVs and HEVs, due to their high efficiency and energy density. The smaller output of the downsized engine is compensated for by using the BorgWarner/HPEVS AC-50 permanent-magnet AC motor (Finn Thomasen, Ford, Ontario, CA, USA), which features an extremely high torque density (0.8 Nm/cm3) and a matching packaging envelope. It is rated at 53 kW continuous (71 hp) and has a continuous torque of 163 Nm, producing almost 76% of the TDI340 and 65% of the power in electric mode. With its 210 mm × 200 mm body length and standardized B-face mounting flange, it fits in the space left by the smaller ICE without any need for custom housing fabrication [29].
At 52 kg, it is significantly lighter than any multi-cylinder engine and compact enough to be mounted near the rear axle or in the engine bay. Its specifications (8″ diameter, 130 V max, and 10,000 rpm max) suit the 2–3 m wheelbase of the Crafter. It will drive the wheels via the power split gearset, allowing a pure EV mode at low speed. Thus, Table 4 presents the technical specifications of the proposed AC synchronous electrical machine.

Table 4.
HPEVS AC-50 Brushless AC motor specifications [28,29].
Whether pure electric or parallel, the AC-50 provides instantaneous torque at zero rpm to overcome the 1907 kg Crafter’s low-speed inertia more effectively than the TDI340 and regenerates up to 40 kW under braking, recovering ~15% of kinetic energy in city cycles. The liquid-cooled design is integrated into the coolant loop, keeping the motor temperatures below 80 degrees Celsius under sustained highway loads and achieving an MTBF of over 2000 h in heavy-duty cycles [30].
A generator must convert the Duratorq’s mechanical power to electricity. A suitable generator is the BorgWarner/HPEVS AC-12 brushless AC motor (48–80 V), repurposed as an engine-driven generator. In practice, the modes are as follows:
- Traction mode: battery → inverter → AC-50 → planetary gear → wheels.
- Regeneration/series mode: engine → planetary gear → AC-12 (generator) → inverter → battery.
The AC-12 is compact (diameter ≈ 181 mm, length ≈ 279 mm) and lightweight (22.7 kg), easily fitting within the Crafter’s downsized engine bay (the Ford 1.5 L engine freed up ~120 mm of longitudinal space). It is rated with a ~28 kW (37 HP) continuous output and a 117 Nm continuous torque, with ~45 HP (33 kW) and 136 Nm peak capability. The motor features an integrated encoder and is designed for 72 V operation (up to 80 V) [31], matching the AC-50’s nominal voltage. These specs align with typical range extender units (e.g., ref. [32] used a similar 22.3 kW Wankel generator (range extender) in order to charge a 35 kWh battery during (loaded) vehicle operation in a WLTP drive cycle), while its small size and manufacturer support (used in EV conversion kits) make it “production-ready” for retrofitting. The AC-12 can be mounted via its C-face flange and internally fan-cooled. The specifications used in order to model the generator are presented in Table 5.

Table 5.
HPEVS AC-12 Brushless generator specifications [33].
The AC-12 was chosen for its compact size and suitable output. Its 279 × 181 mm envelope is much smaller than the AC-50 traction motor (210 × 200 mm, 52 kg), so it can be packaged next to the engine where space was freed up (the 1.5 L engine is shorter, leaving ~120 mm clearance). Its 28 kW continuous rating (≈117 Nm) matches that of similar generators used successfully in simulated HEVs for range extension, as in [32,34]. In our series–parallel layout, the AC-12 acts as the engine’s generator (analogous to Toyota’s MG1), while the AC-50 remains the traction motor (MG2). Both run on the same 72 V DC bus (fed by the 360 V BMW i3 battery through a DC/DC converter), simplifying integration. The AC-12’s built-in encoder and brushless design make control straightforward. In short, it fits the size envelope, is commercially available as an EV conversion motor, and provides the required ~30 kW class output for our hybrid system [31].
2.2.3. High-Voltage Lithium Battery Pack
The energy storage system is a key element in HEVs [35]. As a replacement for the AGM battery in the current VW Crafter, energy storage will be provided by an AESC pack featuring the BMW i3 60 Ah (Gen 1) battery, which boasts proven automotive reliability and a long cycle life. The pack, weighing 256 kg at 78.6 Wh/kg nominal, fits in the Crafter underfloor tunnel without obstructing cargo space. With its 32.5 Ah pouch cell, it can accept charge currents of up to 0.8 C, providing 60 kW of peak regenerative power and 25 kW of continuous discharge for electric-only launch [36].
Thermal management involves forced-air cooling below the modules via a cabin blower. It thus keeps cell temperatures at 20–40 degrees Celsius and limits capacity fade to 20% after 2000 full cycles at 80% depth of discharge, comparable to new technology Li-ion packs at a fraction of the cost. Cell voltage balancing, state-of-charge estimation, and fault diagnostics are functions that the original 12 V AGM battery could not perform in a high-power hybrid context [37].
When the high-voltage (HV) bus is offline, the factory-installed 12 V AGM starter battery (Exide EK950, 95 Ah 850 A) powers the accessories, ECU memory, and safety systems. Its spill-proof, valve-regulated design supports 500 deep cycles and accepts rapid absorption charging from the DC/DC converter without interrupting 12 V loads during regenerative events [23].
2.2.4. Power Split Unit
To combine the engine and motor powers in parallel mode, we adopt a planetary (epicyclic) gear “power split” device. A simple planetary gearset (comprising one sun, one ring, and one carrier) enables the engine (via the generator) and motor to share the output shaft. We select a gear ratio of approximately 2.8:1 between the engine (sun) and the wheels (ring), providing torque multiplication similar to that of hybrid transaxles. This is similar in concept to Toyota’s HSD power split (which uses a ~2.47:1 reduction on the motor [38]) but with a slightly higher ratio to suit the Crafter’s higher wheel torque needs. The planetary carrier drives the wheels, while the engine/generator drives the sun, and the ring gear may be geared to the wheels. This allows three modes: (1) EV only (engine disconnected); (2) series (engine drives generator, motor drives wheels); (3) parallel (engine and motor both drive wheels). The key feature is that the planetary gear acts like a mechanical differential: torque applied to one element is split between the other two elements, with their speeds related by the Willis formula. In general, the fundamental relationship is as follows:
where
- , and : speeds of the ring, carrier, and sun gears, respectively.
- , and : teeth counts of the ring, carrier, and sun gears, respectively.
Depending on which gear is fixed, different speed ratios result. For example, if the sun gear is held stationary (ns = 0) and the ring is the input, the carrier output speed satisfies nr/(nc) = (zr + zs)/zr.
During operation, this means that the ICE torque and motor torque are combined through the planetary set. For instance, one can drive the ring gear with the engine and have the motor drive the sun, producing a net torque at the carrier (output shaft to wheels). The gear ratios determine how motor/generator speeds scale relative to engine speed. This arrangement allows continuous variability (“e-CVT” behavior) and power splitting without discrete shifts. In summary, the power split device block receives torque inputs from two shafts (one from the engine and one from an electric machine) and produces a combined output torque on the third shaft. The mechanics follow the planetary gear equations as above, ensuring the correct distribution of speeds and torques among the sun, planet, and ring.
During the simulation of the HEV, the ring gear-to-sun gear ratio was set to 2.8, as it showed a good balance between torque output and smooth power flow, as well as regenerative braking. Our chosen ratio ensures that at typical engine speeds (2000–3000 rpm), the wheels achieve an appropriate rotational speed for 100 km/h (~1200 rpm on a 4.05 m2 area van), while multiplying torque by 2.8. Physically, the gearset can be fitted in-line with the transmission and differential of the Crafter, requiring minimal chassis modification, as the underbody has sufficient space to accommodate it along with the battery.
2.2.5. Combined HEV Performance and Packaging
The hybrid system preserves the factory performance envelope of the crafter while providing better low-speed thrust and hill start assist by electronically limiting the parallel sum of the 55 kW/190 Nm ICE and 53 kW/163 Nm motor to the original 103 kW/340 Nm curve. The downsized ICE plus motor (250 kg) is 30 kg lighter than the original TDI340 alone, partially offset by the 295 kg battery, resulting in a net weight of 35 kg—well within the payload tolerance [39].
Although our series–parallel hybrid replaces the conventional eight-speed automatic with only a power split coupling device, it nonetheless reproduces the full traction force and speed envelope of the stock Crafter. In the parallel mode, the downsized 1.5 L diesel (55 kW/190 Nm) and the 53 kW/163 Nm electric motor are combined through the planetary gearset to yield up to 108 kW and 353 Nm at the wheels—closely matching the TDI340’s 103 kW and 340 Nm curve (Table 6). The chosen 2.8:1 sun-to-ring ratio in the power split device ensures that, across the ICE’s 1500–3000 rpm efficiency band, wheel speeds span from standstill to well beyond 100 km/h without discrete shifts (i.e., e-CVT behavior). At low speeds, the motor alone provides a high starting torque, while at higher speeds, the ICE engages mechanically through the carrier, allowing the combined system to reproduce both the low-end thrust and high-speed drive of the factory powertrain. Finally, the regenerative and series modes enable engine-off propulsion and efficient charging, without compromising the maximum tractive effort or the top speed of the original van.

Table 6.
BMW i3 60 Ah (Gen 1) battery specifications [36].
Engine-off driving and regenerative braking reduce fuel consumption by up to 40% compared with the pure diesel model under urban driving conditions, while highway efficiency gains of 15% are achieved through optimized engine load points and reduced idling time. This hybrid architecture thus delivers, without significant structural modifications, the torque and power characteristics of the original TDI340, as well as the emissions and efficiency benefits of electric driving.
As presented in Table 7, the original VW Crafter 35 TDI 340 LWB FWD has a WLTP combined fuel consumption of 9.6 L/100 km. The literature on series–parallel HEVs reports fuel savings of between 30% and 35% under WLTP conditions and up to 40–50% in urban or mixed cycles [39].

Table 7.
TDI340 ICE vs. HEV ICE and motor performance [39].
The motor’s efficiency map, shown in Figure 4a, forms a smooth, double-lobed surface spanning both the motoring (positive torque) and generating (negative torque) quadrants. The efficiency is lowest at the extremes (very low or very high torque and speed) and reaches a broad peak (>0.95 efficiency) at a moderate torque and mid-range speed, with a peak efficiency of 97.3%. The surface is roughly symmetric about zero torque (reflecting similar motoring/generation behavior), and it is bounded by the motor’s torque–speed envelope (maximum torque and maximum speed). This efficiency surface covers the entire tested torque–speed plane, clearly showing the motor’s high-efficiency central region and the low-efficiency boundaries near its limits.
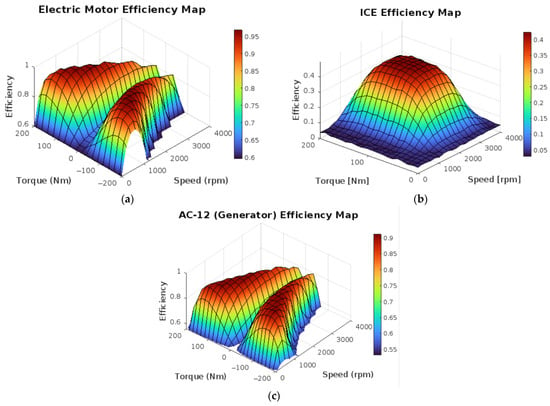
Figure 4.
Efficiency maps of HEV components: (a) HPEVS AC-50 motor efficiency; (b) Ford 1.5 L Duratorq ICE efficiency; (c) HPEVS AC-12 generator efficiency.
The diesel engine’s efficiency map, shown in Figure 4b, is a single-peaked “hill” only for positive torque, rising from near-zero (5%) efficiency at light load to a maximum in mid-load, mid-speed conditions. The efficiency climbs steeply from idle or low torque, reaching roughly 0.40–0.45 (40–45%) at its optimal operating point of 1750 rpm and then declines toward the edges. In other words, the engine is most efficient at moderate torque (roughly half of its maximum) and moderate speed (~1500–2000 rpm), as indicated by the red plateau, while efficiency drops off both at very low loads and at high rpm/torque extremes. The outer “rim” of the surface reflects the engine’s torque–speed limit (maximum torque curve) and associated derating at high speed.
The HPEVS AC-12 motor’s (used mainly in its generator mode in our HEV) efficiency map, shown in Figure 4c, is very similar to the motor’s efficiency map; however, its peak efficiency range is slightly narrower, as its operational range is less than that of the AC-50 motor. The efficiency is lowest at the extremes (very low or very high torque and speed) and reaches a narrow peak (>0.90 efficiency) at moderate torque and mid-range speed, with a lower peak than the motor’s, achieving a peak efficiency of 92.4%. The surface is roughly symmetric about zero torque, similar to the motor’s response, and it is bounded by its torque–speed as well. Such maps define a clear, high-efficiency zone that engine controllers aim for.
2.3. PID Controller
The Proportional–Integral–Derivative (PID) controller has long been considered a fundamental unit of control theory due to its simplicity, intuitiveness, and practical applications in process control as well as automotive systems [40]. The essential role of PID controllers in integrating conventional and modern systems has been highlighted in numerous contemporary studies. Figure 5 illustrates the general block diagram of the PID closed-loop control system.
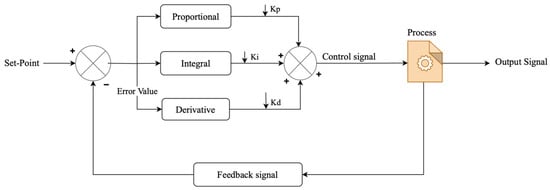
Figure 5.
PID controller adapted from [7].
The performance of a PID controller greatly depends on the proper selection of its three tuning parameters. Over the decades, numerous methodologies have evolved to determine the optimal values of and These methods range from classical empirical rules to modern optimization-based algorithms.
One of the most historically significant methods is the Ziegler–Nichols tuning rule. The system is usually subjected to experimental testing to establish the ultimate gain Ku and the ultimate period Tu (conditions under which the control loop starts sustained oscillations). Ziegler–Nichols then recommends tuning the parameters as follows:
Procedure:
- Set the integral () and derivative () gains to zero.
- Increase the proportional gain ( gradually until the controlled system output exhibits sustained oscillations. The gain at this point is called the ultimate gain (.
- Measure the oscillation period (the ultimate period).
While the Ziegler–Nichols’s method is straightforward to apply and implement, and is widely used, its tuning leads to aggressive settings with overshoot or oscillations in systems with large nonlinearities [24,41].
The advent of computational intelligence has given rise to optimization-based tuning methods that search for PID parameters by minimizing performance indices, such as the integral of absolute error (IAE), the integral of squared error (ISE), or the integral of time-weighted absolute error (ITAE). Two widely regarded methods in the modern literature are GA and PSO.
The GA method simulates the process of natural selection to optimize tuning parameters. A population of candidate PID parameter sets (chromosomes) is generated, and their fitness is evaluated based on a specific performance criterion. Genetic operations such as selection, crossover, and mutation are performed iteratively until convergence. For instance, for a series–parallel HEV model, a GA-tuned PID controller improved the transient response significantly, achieving a reduction in IAE from 50 to 25.7, with optimally tuned parameters around = 488.3, = 323.3, and approx 18.5 (values adjusted for a specific vehicular simulation scenario) [9].
PSO is an algorithm inspired by the social behavior observed in bird flocking or fish schooling. Each “particle” represents a possible solution (a set of PID parameters) that moves through the solution space influenced by its own best-known position and the swarm’s best position. A comparison of GA and PSO training on similar HEV applications found that PSO consistently achieved a lower IAE and faster settling times. In a typical simulation, the PSO-tuned controller achieved optimal parameters of around = 330, and , resulting in a 20% faster settling time and a 15% reduction in overshoot compared with GA-tuned parameters [42].
Beyond GA and PSO, adaptive tuning strategies that combine classical control and modern optimization have been studied. An adaptive tuning framework combining fuzzy logic with PID control was presented by [43]. They apply a dynamic adjustment of , and based on system behavior following rules which are robust to system nonlinearity and external disturbances. These methods are promising, but extensive comparative studies have shown that even under most conditions, the PSO method outperforms pure classical tuning and GA-based approaches in terms of minimizing error indices and enhancing dynamic response [42].
2.4. The Vehicle Model
2.4.1. Vehicle Modeling and Analysis Using MATLAB/Simulink
The MATLAB Simulink simulation platform is one of the most widely used tools, including those for HEV applications. Its block diagram environment enables researchers to model dynamic systems, control strategies, and performance metrics such as fuel economy and emissions. For HEVs, Simulink supports detailed vehicle dynamics, powertrain components, and energy management algorithms, including PID controller tuning. Various studies on the performance optimization and energy efficiency improvements of HEVs have been initiated due to the flexibility and modularity of Simulink.
A typical application of MATLAB Simulink for HEVs is the simulation of vehicle performance. Researchers simulate vehicle components, including ICEs, electric machines (motors and generators), batteries, and mechanical coupling devices, in discrete subsystems. For example, in [9], a simulation model of the interdependencies between engine torque, motor output, and regenerative braking effects was developed. It was then tested under various driving cycles, including the extra-urban driving cycle and ECE cycles, to evaluate its dynamic performance, such as acceleration, deceleration, and transient responses. With Simulink, you can add detailed physics-based models, such as aerodynamic drag and rolling resistance, to your analysis of how HEV powertrains respond to driver commands and external disturbances. Similarly, studies have utilized Simulink to simulate both transient and steady-state behavior. In one study, researchers predicted performance metrics such as acceleration capability and maximum speed by combining a vehicle dynamic model with periodic driving cycles. They integrate vehicle geometry, mass distribution, and tire–road interaction dynamics into a single model for optimization studies, aiming to minimize energy loss while maintaining a robust performance [44].
Figure 6 illustrates the complete control loop model, which implements a series–parallel HEV closed-loop simulation from a standardized WLTC driving cycle to vehicle dynamics. In this architecture, the vehicle receives a driver speed, which is compared with the actual vehicle speed to generate an error. This error is processed by a PID controller that issues power demands to the hybrid powertrain. The power demands are handled by a supervisory control block that produces torque and throttle commands for the engine, motor, and generator. These commands are passed on to the electrical system level and engine submodules. The engine output shaft and motor generators are coupled through a power split device (planetary gear) whose outputs drive the wheels. The resulting wheel torque is fed into the vehicle dynamics simple block, which calculates vehicle acceleration and updates the vehicle’s speed. A feedback loop returns the actual vehicle speed to the PID controller, closing the control loop. This overall setup, built upon the models in [45,46,47], embodies a series–parallel HEV architecture, combining mechanical power from the engine with electrical power from motor/generator units via a planetary gearset to meet the demanded wheel torque. Such models are commonly implemented in MATLAB/Simulink to evaluate the performance of hybrid powertrains under various driving cycles. In summary, the model’s architecture consists of
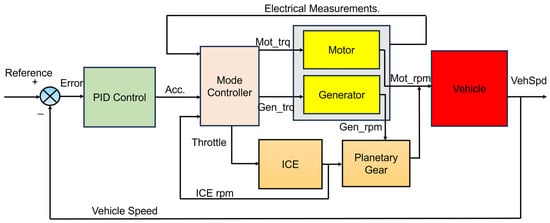
Figure 6.
HEV block diagram of control loop model.
- An input loop (EU standard drive cycle/driver demand and speed feedback).
- A PID speed controller.
- A supervisory control block.
- An electrical subsystem (motor/generator and battery).
- An ICE and mechanical subsystem.
- A vehicle dynamics output loop that produces the new speed and distance.
2.4.2. HEV Control
Speed regulation is performed by a classic PID controller. The PID block receives the speed error e(t) (desired minus actual speed) and computes a control output u(t) for the powertrain. In continuous form, the controller follows the following law:
where
- the control signal sent to the actuator.
- represents the error/difference between the setpoint and the measured process variable
- : represents the reference/desired speed of the HEV.
- : the actual current speed of the vehicle.
- : the proportional gain, providing a control signal proportional to the instantaneous error.
- : the integral gain, which addresses the accumulation of past errors and helps eliminate the steady-state error.
- : the derivative gain, which predicts the future error based on its current rate of change, thereby improving system stability by dampening oscillations.
The law combines the proportional term to decrease the current error, an integral of past errors, and a derivative term predicting future error. In the Simulink model the PID is implemented in parallel form (separate P, I, and D blocks) with gains and . The resulting u(t) is interpreted as a net acceleration demand (or braking demand) to be distributed to the ICE and electric machines. The proper tuning of PID coefficients trades off speed response, overshoot, and steady-state accuracy. PID tuning is further discussed in the next section.
The control block converts driver inputs into actuator commands. It takes the PID’s acceleration demand (and any brake pedal signal) and computes a total wheel torque request. Using known engine and motor capability maps, the controller determines how to distribute the torque between the ICE and the electric machines. Internally, it implements a power split logic that checks the current operating mode, the battery’s state of charge (SOC), and the demanded power. This block effectively acts as the vehicle control unit (VCU), controlling the vehicle’s state based on the power demands, as shown in Figure 7.
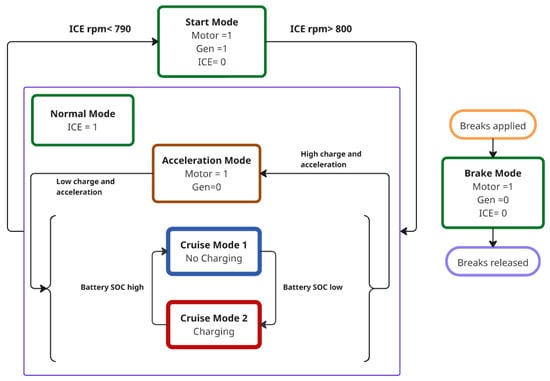
Figure 7.
Mode logic control of HEV.
The control block’s torque requests are fed into dynamic models of the motor and generator, as shown in Figure 8. Each machine block enforces its maximum torque vs. speed limits and computes shaft torque outputs (e.g., based on efficiency maps). These torques are applied to two shafts of the planetary gear (the motor on the sun gear and the generator on the ring gear). The main modes of the HEV operation considered during our simulation are as follows:
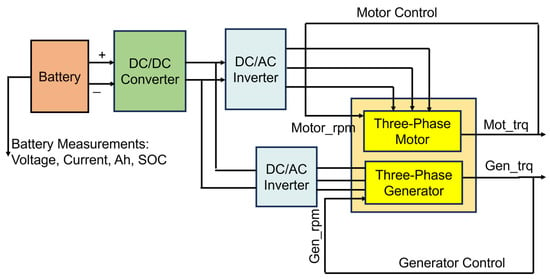
Figure 8.
Electrical components of the HEV model.
- Motor-only mode: During initial takeoff or low-speed acceleration, the HEV operates in a motor-only mode, where the battery powers the electric motor, which propels the wheels independently. The controller disengages the ICE via a clutch whenever the requested torque is within the motor’s capacity and the battery SOC remains above its lower limit.
- ICE-only mode: At steady cruising with moderate throttle and a nearly full battery, the system shifts into ICE-only mode where the engine reconnects mechanically to the drivetrain, the motor idles or decouples, and the ICE runs at its most efficient point to meet demand.
- Hybrid mode (ICE + motor): When the driver demands high power—such as for rapid acceleration or climbing—the hybrid mode combines both sources where the ICE drives the wheels directly and the electric motor supplements torque, and any ICE surplus can be fed to the generator to recharge the battery.
- Generator mode: If the SOC dips below a set threshold during light load conditions, the controller enters generator mode. Here, the clutches isolate wheel drive, and the ICE spins the generator solely to restore battery charge without contributing propulsion.
- Regenerative braking mode: During braking or coasting, regenerative braking kicks in. The motor operates as a generator, converting kinetic energy into electricity for the battery. Brake sensors and wheel speed monitors balance the proportion of friction braking versus regenerative braking, respecting the battery’s charge rate limits.
Throughout all modes, the vehicle’s control unit continuously evaluates the throttle position, brake input, vehicle speed, engine efficiency maps, and battery SOC, engaging the clutches and modulating the power split device to switch seamlessly among modes for optimal efficiency and responsiveness.
2.4.3. Electrical Components
The electric machines shown in Figure 8 also exchange power with the battery; a DC–DC converter steps up the battery voltage as needed, while an inverter changes the stepped down DC voltage from the battery into the 3-phase AC voltage required to run the HPEVS AC50 electric motor (and vise versa in case of the AC-12 generator). The battery’s state of charge (SOC) is updated by integrating the battery current as follows:
where
- SOC(t): State of charge of battery at time t seconds.
- SOC(t0): Initial state of charge of battery.
- Ibatt: Current flowing into or out of the battery [A].
- Qnom: Max charge capacity of the battery [Ah].
In practice, the model scales SOC to a percentage of full charge. The controller utilizes this SOC value in its logic; for example, it determines whether the ICE should drive the generator to recharge the battery when the SOC is low. Thus, the electrical system block produces mechanical torques to the power split unit and simultaneously updates SOC based on charge/discharge, closing the electrical loop. The main formulas used to effectively simulate the motor/generator units for the HEV in MATLAB are as follows:
where
- Vbus: High-voltage bus voltage [V].
- Im: Motor current [A].
- Tm: Motor torque [N·m].
- : Motor angular speed [rad/s].
So, the electric motor acts as a power generator when the engine rotates its shaft faster than its operating speed at its operational voltage and current, which is also referred to as its synchronous speed. Even though electric motors and generators have very high efficiencies, they still incur some power losses due to heat generation from electrical resistances. This was simulated in the MATLAB model as a variable resistance and capacitance set to ensure that the simulated motor matches real-life power consumption and generation conditions.
2.4.4. Engine and Power Split Unit
The engine block models the downsized ICE. Its primary input is a throttle command (Thr ∈ [0, 1]) from the controller; using a calibrated torque-vs-speed map, it outputs the crankshaft torque. At a steady state, the engine’s torque TICE is computed as a function of the interpolated throttle position into the speed and torque of the ICE. Transiently, the engine’s rotor inertia, JICE, integrates the net torque to update the engine speed. The ICE torque output is sent to the planetary gear carrier. The inertia, JICE, along with any governor or time constant, determines how quickly the engine speed can change. For the modeled engine, the power output and efficiency can be calculated using the following formulas:
where
- : Fuel mass flow [kg/s].
- LHV: Lower heating value of diesel (≈42.5 MJ/kg for diesel based on experimental data).
- : Engine angular speed [rad/s].
- ICE: Engine torque [N·m].
- ICE: Engine’s equivalent rotating inertia [kg·m2].
These engine dynamics are primarily used to estimate the power output of the engine in our Simulink model, while accounting for losses due to the engine’s inertia. The torque requirement signal is given by the HEV controller, and the angular velocity is then determined from lookup graphs in the HEV Simulink model in order to reduce the computational and simulation burden.
2.4.5. Fuel Economy Analysis
The advent of electrified hybrid powertrain technology addresses the issues of high toxic gas emissions, excessive fuel consumption, and environmental noise. Fuel consumption remains one of the key performance indicators for HEVs. It is usually simulated in MATLAB Simulink under realistic driving conditions. For instance, simulation results were obtained by combining an HEV model with various drive cycles, including FTP75, NYCC, HWFET, and EUDC. From these simulations, the authors developed regression models of fuel consumption that depend on vehicle mass, tire radius, and aerodynamic coefficients [48]. Because Simulink can combine transient responses with long-term operational trends, it is an indispensable tool for researchers seeking to reduce fuel consumption and emissions.
A second research group utilized Simulink to analyze the impact of power management strategies on fuel economy. Modeling the ICE, generator, and electric motor as interconnected subsystems, they could simulate how electric-only, hybrid, and regenerative braking modes contribute to fuel economy. A significant finding was that optimal control strategies implemented via Simulink could cut fuel consumption by up to 50% compared with conventional vehicles. This work demonstrates the fidelity of the simulation environment as well as its ability to model significant real-world energy savings when advanced control strategies are applied [49,50].
Besides performance and fuel economy simulations, MATLAB Simulink is widely used to design, analyze, and optimize PID controllers for HEVs. High-performance HEVs require advanced control strategies for managing the ICE/electric power split and battery state of charge during regenerative braking. With Simulink’s block diagram interface, PID controllers can be integrated with vehicle dynamics and energy management subsystems.
Hardware-in-the-loop (HIL) experiments are increasingly employed to validate such models. In [7], researchers integrated their Simulink/Simscape HEV model with a real-time CAN/LabVIEW HIL setup to emulate a Volkswagen Crafter powertrain. This allowed them to test control strategies under realistic dynamic conditions. In [48], a comprehensive Simulink HEV model was built and evaluated over standard drive cycles, using a regression analysis to link vehicle parameters to fuel consumption. This analysis achieved an R2 value greater than 0.99 for the best-fit model. In summary, Simulink remains the primary tool for HEV development, enabling detailed subsystem co-simulation and HIL linkage.
2.5. Fuel Consumption Measurement
Fuel economy is calculated by accumulating the total distance traveled and total fuel consumed and then converting these values to standard metrics. In Simulink, the vehicle speed (VehSpd_kph) is converted to km/s and integrated over time to yield the cumulative distance in kilometers. Fuel consumption is modeled using a lookup fuel consumption table, where the current engine speed and torque are input, and the table outputs the fuel mass flow rate (e.g., in g/s). This is converted to kg/s and then integrated to obtain the total fuel mass. Using diesel density (about 850 kg/m3) and unit conversions, the total fuel volume in liters is obtained. The fuel consumption calculation is based on the following equations:
To compute miles per gallon (US), the model converts distance to miles (1 mile = ~1.6091 km) and fuel to US gallons (1 gal = ~3.7851 L). Thus
2.6. PID Tuning Algorithms
In HEVs and similar systems, the PID controller is widely used to regulate speed due to its simplicity and effectiveness. However, achieving good tracking of the desired speed requires the precise tuning of the proportional, integral, and derivative gains. Proper tuning ensures that the vehicle rapidly reaches its set speed without excessive overshoot or oscillation and maintains stability under changing load conditions. By contrast, a poorly tuned PID controller can cause the speed to oscillate around the target value (overshooting and “hunting” for equilibrium) or respond sluggishly to changes in demand. Such behavior is unacceptable in automotive applications because it leads to inaccurate speed control, increased mechanical stress, and potentially poses safety issues. Thus, automated or systematic tuning methods are crucial for maximizing performance (minimizing settling time and steady-state error) while maintaining stability and robustness under worst-case driving conditions.
In this study, the PID controller regulates vehicle speed by minimizing both the tracking error and overall fuel consumption. This is achieved by optimally tuning the proportional (Kp), integral (Ki), and derivative (Kd) gains, which control the system’s response to dynamic driver demands. The tuning process is conducted using two nature-inspired metaheuristic algorithms—genetic algorithm (GA) and particle swarm optimization (PSO)—to identify the gain values that achieve the best trade-off between responsiveness, stability, and fuel efficiency.
The objective function to be minimized by the PID tuning algorithms (GA and PSO tuning) is a weighted combination of error metrics and fuel consumption as follows:
where
- : Different “weights” for each performance metric.
- : Integrated absolute error.
- : Integrated time-weighted absolute error.
- ISE: Integral of squared error.
- : Total fuel consumed [L].
The PID controller outputs a control signal based on the speed tracking error. This signal dictates the desired acceleration or deceleration. The proportional component provides an immediate response, the integral term eliminates steady-state error (thereby reducing fuel waste), and the derivative term dampens oscillations, enhancing comfort and mechanical safety. Within the Simulink model, this control output is translated into power split commands, which determines how torque demand is distributed between the electric motor and the ICE. This strategy optimizes not only speed tracking but also powertrain efficiency, especially under varying load and terrain conditions.
The control formulation, error metrics, and tuning process validate the optimality and reliability of the final PID parameters and confirm the suitability of the PSO-tuned controller for this SP HEV application. These metrics ensure that the PID controller achieves tight tracking while also minimizing energy expenditure. The performance metrics are further explained in the next sections.
2.6.1. Traditional (Ziegler–Nichols) PID Tuning
Classical methods for PID tuning typically rely on empirical rules or iterative trial-and-error. For example, manual tuning adjusts one gain at a time: the proportional gain is increased until the response begins to oscillate, and then the integral and derivative terms are added to refine the response. The most well-known formal method is Ziegler–Nichols tuning, which provides simple heuristic formulas based on the system’s “ultimate gain” (Ku) and oscillation period (Pu). In the closed-loop (feedback) Ziegler–Nichols procedure, one sets the integral and derivative gains to zero and increases the proportional gain until sustained oscillations occur. The resulting gain, Ku, and oscillation period, Pu, are then used in the Ziegler–Nichols formulas to compute the controller gains. Although these classical methods are simple and widely taught, they often yield overshoots and oscillations beyond what an HEV’s drive control requires. In practice, a skilled engineer can further fine-tune these gains (manually or with software tools) to enhance the performance and robustness in the specific HEV speed control model under the standardized WLTP drive cycle.
To implement the Ziegler–Nichols method for tuning the PID of the vehicle speed, we first need to configure the controller to proportional-only mode and assign zero values to both the integral (Ki) and derivative (Kd) parameters. The controller is then adjusted. This lets us find the crucial gain at which oscillations match. Adding (Kp) to the ultimate gain up until the system hits the threshold of continuous oscillation, the proportional gain (Kp) was gradually increased. The overall gain was determined to be Ku = 154.
Secondly, we need to find the oscillation period Tu when ( = Ku = 154), when the system showed equal oscillations with a measured periodic time () of 357 milliseconds (or 0.357 s). Now, we use the Ziegler–Nichols Formulas (9)–(11) in order to calculate the other values of Ki and Kp.
Added on top of these computed , and are further adjustments. By applying these early controller improvements, we achieved a baseline response that matched both responsiveness and stability. Further fine-tuning was performed to ensure the controller operated optimally under various driving conditions. Riding comfort and vehicle stability also improved.
Figure 9 shows the response of the HEV when simulated under the WLTP drive cycle. It shows that the vehicle speed output curve matches the general form of the drive cycle; however, there are several discrepancies between the input and output, indicating that further improvement is needed for the vehicle to match the input given to it more closely.

Figure 9.
Ziegler–Nichols WLTP PID-tuning response graph.
2.6.2. Genetic Algorithm (GA) PID Tuning
The genetic algorithm optimizes the PID gains by treating each candidate solution as a “chromosome” encoding a set of values (, and . The process, as outlined in Figure 10, begins with initialization: A population of candidate gain vectors (, and is randomly generated within preset bounds for each gain. Each chromosome may be represented as a real-valued or binary string. An objective (fitness) function is defined to measure how well a given PID parameter set performs in controlling the HEV speed. Some functions used include the integrated absolute error (IAE), which focuses on reducing the total magnitude of the error for balanced system performance as follows:
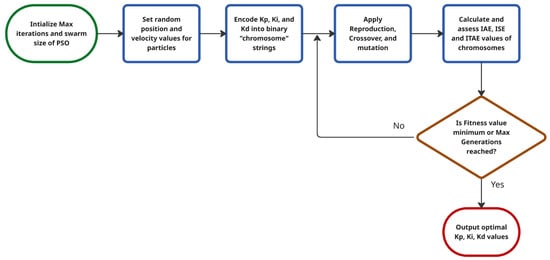
Figure 10.
GA PID tuning flowchart.
Alternatively, integrated time-weighted absolute error (ITAE) can be used, which penalizes errors that persist over time, driving a faster system response over the drive cycle as follows:
The integral of squared error (ISE) penalizes larger errors more heavily (due to the squaring).
Each candidate’s fitness value is computed by running a simulation of the HEV model with that PID controller and evaluating the resulting speed tracking error. If the termination criterion (e.g., a target error threshold or maximum generation count) is not met, the GA iterates the selection, crossover, and mutation to create a new population from the old one. Selection (often through a tournament or roulette wheel process) probabilistically chooses fitter individuals to serve as “parents.” The selection of new parents from the previous generation’s chromosomes is determined using (31).
where
- : the probability of selecting an individual to be a parent for the next generation.
- : the fitness of individual .
- N: the population size.
To produce children, the chromosomes of some parents are crossed. Parent chromosomal segments are swapped to set new PID settings. Should parent chromosomes [Kp1, Ki1, Kd1] and [Kp2, Ki2, Kd2] cross, the resulting offspring may be [Kp1, Ki2, Kd1] and [Kp2, Ki1, Kd2]. Crossover combines two parent chromosomes to produce the new generation’s chromosomes. An example of crossover is shown in (32) and (33), where the parent exchanges one of its chromosomes for another.
where
- k: the crossover point, randomly chosen between 1 and n – 1.
- n: the chromosome length.
Mutation then randomly perturbs genes in some offspring (for example, by flipping a bit or adding a small random offset to a real value) to maintain genetic diversity and avoid premature convergence. After crossover and mutation, the offspring replace some or all of the old population, and their fitness values are computed. Equation (34) shows how the mutation is introduced in genes.
where Δ is a small random value added to the original gene in the chromosomes.
It repeats this loop for each generation, with the GA implicitly “surviving” better-performing PID settings. Over many generations, the population settles on the set of gains with the lowest error criterion. The best chromosome obtained as the final output of the GA is the optimized value of HEV speed.
The code used sets up a genetic algorithm (GA) with a population size of 50 and 40 generations, using one-point crossover at an 80% rate and Gaussian mutation. These GA settings (population, crossover, etc.) are shown in Table 8. The GA optimizes the gains to minimize the drive cycle speed tracking error, using selection, crossover, and mutation as described.

Table 8.
GA PID tuning variables.
These values were selected based on a sensitivity analysis of multiple initialization settings. Parameter sweeps revealed that increasing population or swarm size, or iteration count beyond these values, produced diminishing returns—less than 1.5% improvement in MAE and under 1.0% in fuel economy—while significantly increasing computational load and runtime (up to 60% longer). Comparable parameter sets have been successfully employed in HEV controller design [7,35], affirming their validity.
In order to implement the GA PID tuning in the HEV MATLAB model, we used MATLAB’s genetic algorithm solver. We define an objective function, hevSpeedIAE, that returns the IAE or similar error for controller gains x = [Kp, Ki, Kd] as shown in Figure 11.
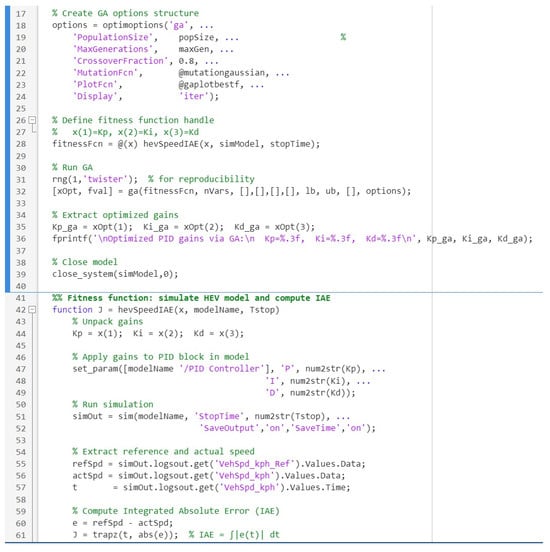
Figure 11.
MATLAB code for GA PID tuning.
This code sets up a GA with a population size of 50 and 40 generations, using one-point crossover (at an 80% rate) and Gaussian mutation. These GA settings (population, crossover, etc.) are shown in Table 7. The GA optimizes the gains to minimize the drive cycle speed tracking error using selection, crossover, and mutation as described.
Figure 12 shows the resultant output of the HEV model when using the GA PID tuning for vehicle speed control. It shows very promising results, which indicate that the optimal tuned parameters found provide excellent control over the speed. However, there are some inconsistencies and variations between the input WLTP drive cycle and the output speed, suggesting that further improvements could be implemented to reduce the variation.

Figure 12.
GA PID tuning WLTP response graph.
2.6.3. Particle Swarm Optimization (PSO) PID Tuning
Figure 13 shows the flowchart of the energy management strategy based on the PSO PID tuning approach.
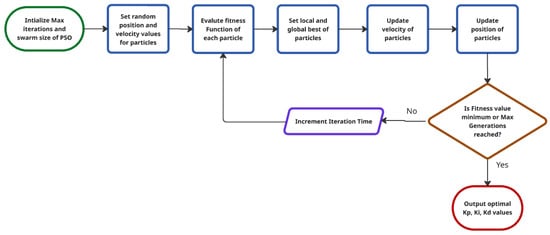
Figure 13.
PSO PID tuning flowchart.
The PSO algorithm takes a different approach to PID tuning inspired by the social behavior observed in bird flocking or fish schooling. In the search space of gains, a swarm of particles with each particle representing a gain candidate <Kp, Ki, Kd> vector flies through the swarm of particles. Each particle i is at xi (current PID gains) and has a velocity vi. The positions, as well as velocities, are initially initialized randomly within allowed gain bounds. Each particle stores its own best position, pbest, and shares information with the swarm’s global best position, gbest. Each iteration computes the fitness of each particle using the same error metric and updates the particle’s personal best pbest and global best gbest accordingly. The update equations for the velocity and position of a particle are as follows:
where
- new particle velocity after 1 iteration.
- : new particle position after 1 iteration.
- : inertia weight.
- and : cognitive and social coefficients, respectively.
- and : random numbers uniformly distributed in [0, 1].
- : best position found up to time t of the -th particle.
- : overall best position found up to time t across all particles.
Thus, the swarm flies through the parameter space, balancing exploration (due to random terms and inertia) and exploiting the best solutions found so far. The process continues until a stopping criterion, such as a maximum number of iterations or an acceptable error, is reached. The PSO method typically converges quickly and can efficiently explore multidimensional gain spaces without requiring binary encoding. In PID tuning, the tuple (Kp, Ki, Kd) may directly represent each particle’s position, xi. The best particle, g, is selected after each iteration. For PID tuning, particle swarm methods tend to outperform traditional and GA methods in terms of convergence speed and last tracking accuracy, with low overshoot and fast settling times during simulation [40]. For PSO-based tuning, we can implement a simple PSO loop. The PSO PID tuning code used is in Figure 14.
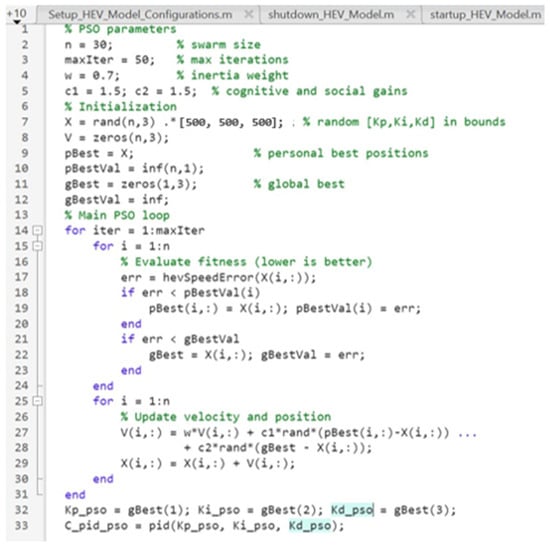
Figure 14.
MATLAB code for PSO PID tuning.
This code initializes a swarm of 30 particles (each particle is a [Kp, Ki, Kd] solution) and iterates 50 times with an inertia weight of 0.7. At each step, it updates personal bests and the global best, then updates velocities and positions according to the standard PSO rule. The final gbest yields the PSO-optimized PID gains. After running the code through MATLAB, the PSO PID tuned parameters are determined to be Kp = 114.7, Ki = 313.5, and Kd = 9.74. This results in a WLTP output, as shown in Figure 15, that very closely matches the original drive cycle input of the HV model with a max deviation of ±0.543, which is acceptable for HEVs.

Figure 15.
PSO PID tuned WLTP drive cycle response graph.
3. Results
3.1. PID Tuning Algorithms Analysis and Comparison
Figure 16 shows a cross-section overlaid view of several drive cycles’ reference speeds with actual vehicle speed traces for all three PID tuning methods—traditional Ziegler–Nichols as green, GA-optimized as black, and PSO-optimized as blue dashed lines. All three controllers approximate the slow–fast–slow cycle pattern but differ in fidelity. To evaluate tuning robustness, each algorithm was run 12 times with random initial conditions. Along with the error indices mentioned before, we also used two other error criteria, the mean absolute error (MAE) and the root mean square error (RMSE), in order to evaluate the performance of the different PID controller responses as follows:
where
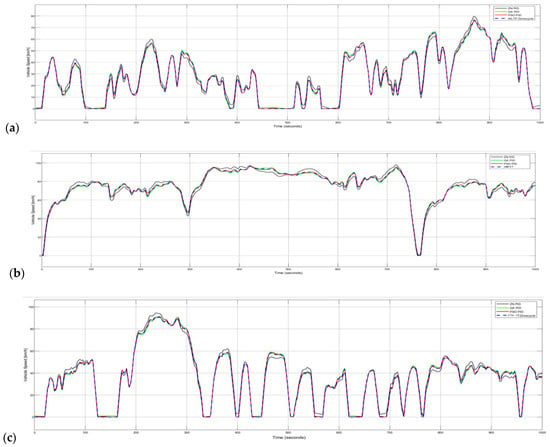
Figure 16.
Drive cycle response graphs using different PID tuning methods: (a) WLTP drive cycle; (b) HWFET drive cycle; (c) FTP-75 drive cycle.
- : reference velocity from the input (drive cycle) [km/h].
- : actual simulated velocity output of the HEV [km/h].
- : elapsed time [s].
Across all three standard drive cycles (WLTP, HWFET, and FTP-75), the PID controller tuned via particle swarm optimization (PSO) consistently delivered the most accurate speed tracking. For example, on the WLTP cycle the PSO PID reduced the average speed error by nearly half compared with a conventionally tuned PID (about 0.27 km/h versus 0.51 km/h MAE) and cut the RMS error from roughly 0.58 km/h down to 0.36 km/h. The other evolutionary approach (GA PID) stood in between, but still lagged behind PSO in every metric.
This pattern repeats on the HWFET and FTP-75 runs, where PSO PID achieves the lowest peak deviations and the smallest mean absolute errors (around 0.27–0.32 km/h). However, GA PID was slightly behind, but only by a narrow margin. By contrast, the traditional PID delivers errors on the order of 0.50–0.54 km/h MAE and up to 0.68 km/h in RMSE. These results clearly demonstrate that PSO tuning provides the most accurate adherence to the target speed profile, making it the superior controller among the three.
Table 9 presents the control strategies according to three different drive cycles as well the errors. As for the fuel consumed during these tests, the PSO PID-controlled HEV produced an average fuel consumption across the different drive cycles. The average fuel consumed during the 1000 s simulation is as follows:

Table 9.
PID tuning methods performance metrics under different drive cycles.
- PSO PID: 0.871 L.
- GA PID: 0.975 L.
- Traditional PID: 1.014 L.
The vehicle speed is maintained very close to the reference with minimal oscillation, allowing the engine to run more steadily near the optimal efficiency point, thereby reducing transient fuel penalties. In contrast, the larger speed swings of the traditional PID push the engine into less efficient regions more frequently, thereby increasing fuel use. Table 10 presents the optimal PID parameters obtained using each of the listed tuning methods across the 12 different run cycles.

Table 10.
Optimal PID tuned parameters.
In summary, the PSO-based tuning demonstrated the best overall performance in terms of the minor maximum deviation, the lowest mean and RMS error, and the lowest fuel consumption, making it the most effective method for our series–parallel HEV speed controller. Later, during the calculation of fuel economy, it was used exclusively to test the HEV model with different drive cycles.
3.2. Drive Cycle Outputs
Figure 17 plots the actual vehicle speed [km/h] for all four test cycles. The black trace (NEDC) rises only to about 50 [km/h] and exhibits numerous stops, the green trace (WLTP Class 3b) shows intermediate speeds with more variability, the blue trace (FTP) reaches several high-speed peaks, and the red trace (HWFET) largely stays at a high speed (70–100 [km/h]) after an initial ramp. In all cases, the PSO PID controller tracks the reference profile closely. Minor deviations appear in the fast up–down patterns (e.g., slight undershoot on accelerations), but there are no significant steady-state errors. This tight tracking is consistent with the tuned PSO PID achieving minimal speed errors—for example, the PSO PID never deviated by more than ±0.86 [km/h] on a WLTP cycle. Previous results showed that the PSO PID yielded the lowest mean and RMS speed errors across a WLTP 3b cycle, so its use here ensures stable speed regulation under all four drive cycles. The smooth (green) HWFET line and the jagged city cycle lines illustrate a key trend: on the highway, the vehicle holds a nearly constant speed with minor control action, whereas in urban-style cycles, the controller is constantly correcting for frequent starts and stops.

Figure 17.
HEV speed output of different drive cycles with PSO PID.
Figure 18 illustrates the ICE behavior and power demand during a representative cycle. The top plot shows engine speed (rpm), while the bottom one shows power demand (kW). In the low-speed portions, the engine often shuts off (rpm drops to 0), and power goes to zero, reflecting regenerative braking or idling. When the driver accelerates, the ICE speed jumps rapidly to 1500–3000 rpm and the power spikes up (red peaks). Note the close correlation: every acceleration hump in the green speed curve corresponds to a surge in rpm and power. During steady cruising segments (flat green line), the engine rpm and power level off. For example, from ~780 to 850 s, the speed is maintained at around 15 m/s, and the ICE operates steadily at ~3500 rpm, producing between 30 and 50 kW. These flat intervals indicate that the controller has settled to a steady operating point, minimizing unnecessary oscillation. Importantly, even during transient ramps, the controller avoids excessive overshoot: the speed ramps are controlled so that the engine spends minimal time far from its optimal efficiency. In previous tests, the PSO PID was found to maintain the engine’s operation near the optimal efficiency point, with only minor transient fuel penalties. Our traces show exactly this behavior—the engine transitions smoothly between off, moderate, and high rpm, with no long-lived oscillations.
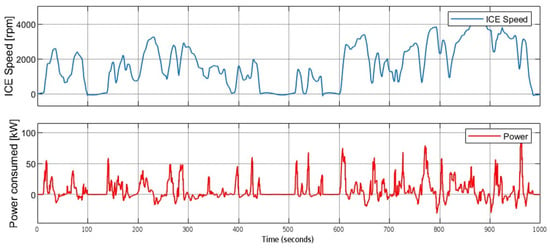
Figure 18.
WLTP power consumed and ICE speed graphs.
Figure 19 shows a similar set of plots for the NADC drive cycle. Here again, we see bursts of engine activity corresponding to the speed trace. During each standstill, the ICE rpm drops to zero, and the power trace often dips below zero (indicating energy recovery). With each acceleration, the ICE quickly revs to 2000–3000 rpm. In this cycle, the engine spends more time in mid-range RPM (up to ~3000 RPM) and rarely reaches the highest 4000 RPM seen in Figure 19, reflecting the slightly lower peak speed of this profile. However, the overall pattern is the same: repeated power pulses interspersed with idle periods. The bottom plot confirms the controller’s effectiveness: the speed curve exhibits very crisp, repeatable steps that match the reference, and any overshoot or undershoot is minimal. This stability, or absence of oscillation, during aggressive stop–go driving again matches the performance noted in earlier sections (PSO PID yielded a minor speed error with no oscillations). In summary, the ICE RPM and power reflect the driving conditions, where city-like cycles produce frequent on/off engine operation and transient power peaks, whereas highway cruising would produce longer, flatter traces (as partially seen after 800 s here).
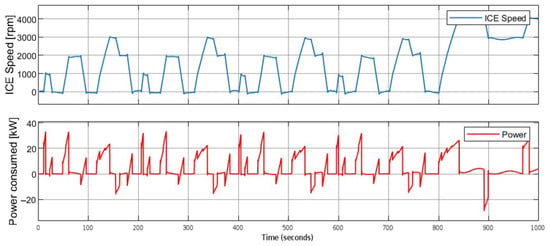
Figure 19.
NEDC power consumed and ICE speed graphs.
Figure 20 presents our detailed simulation of the series–parallel hybrid under the full 1000 s WLTP Class 3b cycle. In the lower panel, the solid black trace shows vehicle speed climbing to about 35 km/h at 20 s, dipping back to zero by 100 s for a brief stop, then rising again into a broad plateau of 50–60 km/h between 200 s and 300 s, followed by multiple stop–go segments and a final peak of 75 km/h around 830 s before tapering off to zero at 1000 s.
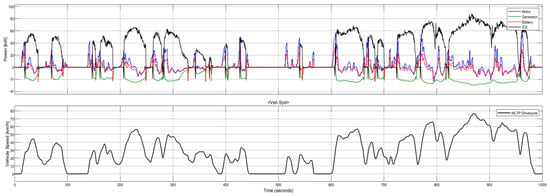
Figure 20.
WLTP Class 3b power consumed by ICE, motor, and generator.
Above, the four power traces reveal each subsystem’s contribution. The ICE (thick black line) quickly and sharply rises on activation, reaching 40–50 kW during the first three accelerations, then settles into 20–30 kW during mid-cycle cruising, and spikes to the almost-peak power of 88 kW during the high-speed ramps after 700 s. When the vehicle stops (e.g., at 100 s and 600 s), the ICE power falls to zero.
The traction motor (solid blue) increases up to 45 kW at each acceleration—peaking at 42 kW by 60 s and again around 720 s—then sags to −15 kW during regenerative braking events at 120 s, 350 s, and 900 s, before returning to positive assist.
The generator (solid green) operates within its 28 kW continuous envelope, providing steady power levels of 10–22 kW during steady-speed segments (notably 15 kW at 250 s and 20 kW at 800 s). It then drops back to near 0 kW when the battery SOC is satisfied or the vehicle stops. In heavy braking (around 350 s and 950 s), the green trace dips as low as 30 kW, indicating brief motoring to capture excess engine torque.
The battery (red dashed) maintains balance in the loop, charging at −25 kW under strong regenerative braking (e.g., 120 s and 900 s) and discharging up to +25 kW when motor demand exceeds generator output (notably at 60 s and 720 s). Between these peaks, the red trace swings around zero, reflecting active energy buffering throughout the cycle.
Comparing across the drive cycles reveals distinct trends in the real-time dynamics. In both Figure 17 and Figure 18 (typical of city-style driving), the controller frequently drives the ICE from off to on, resulting in rapid transitions. Each acceleration transition (represented by the sharp upward green line) coincides with a spike in RPM and power. The control loop quickly damps any overshoot—the engine returns to its trimmed speed within a second or two. By contrast, during steady phases (e.g., flat green segments), the ICE rpm and output stabilize immediately, indicating a well-damped steady state. The HWFET case (red in Figure 17) would exhibit even longer flat segments and nearly constant RPM; indeed, the highway segment (around 600–650 s) features a nearly flat RPM curve, illustrating a steady-state response with minimal control effort. Overall, the system is highly stable, as we observe no oscillatory behavior or hunting in any cycle, confirming that the PSO-tuned gains produce a well-damped response. Even in the most dynamic cycles (FTP and WLTP), the controller quickly settles speed after each change.
The power demand patterns also differ by cycle. The city-centric WLTP and FTP cycles exhibit numerous short, high-power bursts during acceleration, followed by power levels near zero or even negative (regeneration) when coasting or braking. In Figure 18, the power spikes up to ~30–40 kW for brief periods and then often goes negative between accelerations. By contrast, highway driving (HWFET) yields sustained positive power; once the vehicle reaches cruising speed, it draws a steady ~40–60 kW (not fully shown here but indicated by the long green plateaus). Thus, the average power is highest for HWFET, while energy is frequently recuperated on urban cycles. Despite this, the PSO controller keeps the engine working in mostly inefficient regions during both scenarios—the engine is not held at an unusually high rpm when idling or braking. These observations are consistent with the notion that minimizing speed error, as achieved here, concentrates engine operation in optimal zones, thereby reducing fuel burn.
Quantitatively, the average fuel consumption reflects these dynamics. The hybrid Crafter consumed on the order of a few liters per 100 km under each cycle. In our simulations, WLTP Class 1 gave the highest consumption of 3.126 L/100 km due to its stop–go nature, while HWFET yielded the lowest (2.857 L/100 km) because of steady cruising. The intermediate cycles fell between these extremes: WLTP Class 3b, 3.213 L/100 km, and FTP, 3.624 L/100 km.
Figure 21 shows an energy Sankey diagram for the series–parallel HEV under a 1000 s WLTP drive (with a full initial fuel tank and 100% battery charge state) at an ambient temperature of 25 °C. The block widths are proportional to energy (MJ) and the labels indicate the corresponding amounts. On the left, fuel (21.4 MJ) enters the engine (purple), while the initial battery (8.83 MJ) supplies the electric motor (green). The engine delivers ~7.29 MJ to the drivetrain (red arrow) after losing ~13.05 MJ as heat and ~1.06 MJ to internal friction, whereas the battery outputs 8.52 MJ to the motor (with ~0.97 kWh to auxiliaries and 0.29 MJ via the DC–DC converter). A portion of engine energy (5.21 MJ) is routed through the generator (brown) to recharge the battery. On the right, the combined mechanical output (~9.24 MJ) overcomes vehicle drag and rolling resistance (totaling approximately 4.51 MJ), with approximately 4.37 MJ recovered through regenerative braking (gray) minus a loss of approximately 0.75 MJ. The powertrain losses (~5.39 MJ) and auxiliary loads (~0.74 MJ) are also shown.
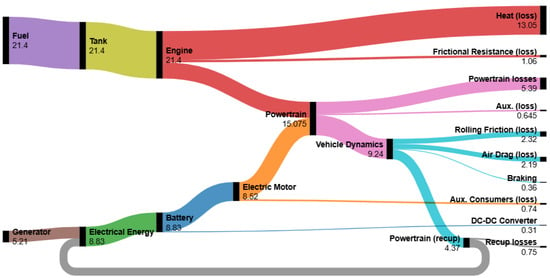
Figure 21.
Sankey energy (in MJ) flow diagram of modeled HEV under 1000 s of WLTP drive cycle.
3.3. Battery Thermal and SOC Analysis
The DC–DC converter’s thermal model is implemented as a lumped thermal network in Simulink. All of the converter’s electrical losses (switching and conduction losses) are treated as internal heat sources: the total power loss Ploss is converted into heat (i.e., Q = Ploss). This heat is assumed to flow into the converter case (modeled as a thermal mass of mass m and specific heat c) and is dissipated to the environment by convection. In particular, the convective heat transfer to ambient air [W] is given by the following:
where
- h: Convective heat transfer coefficient [W/(m2·K)].
- A: Effective surface area [m2].
- Tcase: Converter case temperature [°C].
- Tcoolant: Ambient temperature. The resulting temperature dynamics are governed by an energy balance [°C].
- m: Mass of the converter [kg].
- c: Specific heat capacity [J/(kg·K)].
So, the rate of rise in the case temperature is the net heat input (power loss minus convective loss) divided by the thermal capacitance, mc. In other words, as the converter operates, the lost power, Ploss, appears as an internal heat source that raises the case/junction temperature, and this heat is carried away by convection to the ambient surroundings. This model thus explicitly links electrical losses to temperature rise, allowing the simulation to track the converter’s temperature response under load. Figure 22 shows the battery temperature.

Figure 22.
Modeled HEV battery temperature increase under WLTP drive cycle conditions.
The battery pack’s thermal response under the WLTP driving cycle is seen as a slow, monotonic temperature rise. In the simulation results, the cell/pack temperature starts near ambient (≈approximately 25 °C) and gradually increases to just over 30 °C by the end of the cycle. The smooth, gentle rise implies that during driving, the battery generates heat (from internal resistance losses) roughly at the same time it sheds heat to the environment, so the pack temperature increases slowly. In short, under WLTP load, the battery warms up by only a few degrees, indicating moderate thermal stress rather than any runaway heating. Figure 23 shows the battery SOC based on the WLTP test procedure.
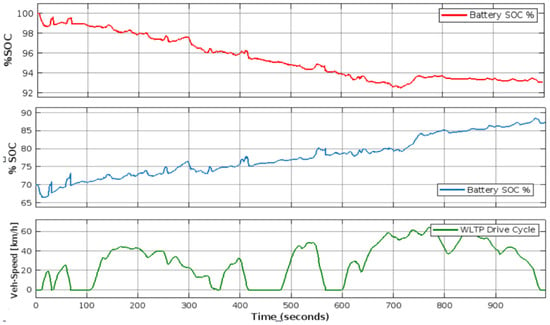
Figure 23.
Modeled HEV battery SOC under WTLP drive cycle.
The state-of-charge (SOC) profiles further illustrate the vehicle’s energy flows. When the battery begins at full charge (red plot), its SOC stays essentially flat during steady driving, rising only slightly during braking phases when regenerative braking feeds a bit of energy back into the pack. By contrast, when the battery starts at 70% SOC, although the battery’s SOC declines quickly at first due to the sudden power demand from the motor during the start phase, the curve shows a clear upward trend over the cycle. The engine–generator’s operation causes this behavior: as the ICE runs, it can drive the generator to charge the battery, causing the SOC to climb. In the present S–P HEV, this means that with an initial 70% SOC, the ICE-propelled generator injects current into the pack and noticeably increases SOC, whereas a fully charged pack has little headroom and only sees small bumps from regen. These SOC trends match the expected thermal–electric dynamics: regen adds minor SOC during braking, and the ICE can charge the battery when it is not already full (as seen by the SOC rise in the 70% case).
3.4. Performance Results
We estimated the conventional 2022 VW Crafter’s fuel use by converting logged OBD-II mass airflow (MAF) data into fuel flow. Assuming stoichiometric combustion (diesel AFR ≈ 14.6:1 by mass, density 0.832 kg/L), the instantaneous fuel volume flow is given by the following:
where
- : fuel volume flow (L/s).
- : mass airflow (MAF) (g/s).
- AFR: actual air fuel ratio.
- : fuel density (kg/L).
Integrating over each driving cycle, the total liters consumed are calculated and then divided by the cycle distance to yield L/100 km. This MAF-based approach—assuming near-stoichiometric operation—has been shown to yield accurate fuel estimates under normal engine conditions. We applied this calculation to each cycle for the conventional Crafter. For the series–parallel HEV model (with PSO PID tuning), fuel consumption was obtained directly from the MATLAB/Simulink simulation under the same drive profiles. All results below are presented from our data analysis.
Figure 24 compares the fuel economy and derived range for the two vehicles across the four test cycles conducted at 70% initial battery charge and fuel tank conditions with an ambient temperature of 25 °C. The conventional Crafter’s fuel consumption was 10.732 L/100 km on the WLTP combined cycle versus 7.473 L/100 km for the hybrid—a 30.4% reduction. In the FTP-75 cycle (representing city driving), consumption is 13.889 L/100 km (ICE) versus 9.274 L/100 km (HEV), resulting in a 33.2% reduction. For WLTP Class 3b (high-speed urban/interurban), the drop is from 8.456 to 5.661 L/100 km (33.1% reduction), and on HWFET (highway) from 7.952 to 6.054 L/100 km (23.8%). These fuel savings translate into an extended range on a 75 L (full) tank. For example, the WLTP range grows from ~698.8 km (ICE) to 1018.7 km (HEV). In HWFET, the range increases from ~943.6 km to 1296.4 km due to the HEV’s superior highway efficiency. The detailed figures are given by fuel saving and range equations, where fuel saving and expected range are calculated as follows:
where
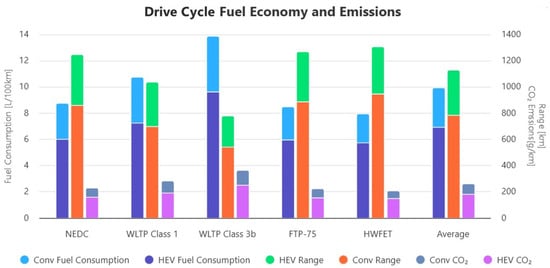
Figure 24.
Fuel consumption, range, and emission metrics of vehicles under different drive cycles.
- : Fuel consumed by conventional vehicle.
- : Fuel consumed by HEV.
- : Volume of tank (75 L in this case) [L].
- : Fuel consumed [km/100 L].
3.5. CO2 Emission Reduction
For CO2 emissions, we use 2.62 kg of CO2 per liter of diesel burned. Thus, under WLTP combined, the conventional van emits 10.732 × 26.2 = 281.2 g/km, while the HEV emits 7.473 × 26.2 = 195.8 g/km—a reduction of 85.4 g/km. Similar reductions occur in other cycles: FTP-75 CO2 drops from 363.9 to 261.1 g/km (−102.8 g/km), WLTP 3b from 221.5 to 165.2 (−56.4), and HWFET from 208.4 to 157.4 (−51.0). These correspond to roughly 24–30% lower tailpipe CO2 in the hybrid mode. Overall, the CO2 emissions were reduced by an average of 76.8 g/km.
Each liter of diesel avoided saves approximately 2.62 kg of CO2. In practical terms, the ~3.26 L/100 km fuel savings on the WLTP cycle corresponds to ~8.54 kg CO2 avoided per 100 km (85.4 g/km). For a delivery van running ~200 km per day, this translates to ~17 kg of CO2 saved per day, or roughly 4–5 tons per year (assuming around 250 operating days) per vehicle. The hybrid’s efficiency gain also implies significantly lower NOx and particulate emissions since the engine runs less and at a more optimal load, and regenerative braking recovers energy that would otherwise be lost. In dense urban delivery scenarios—characterized by frequent stops and low-speed travel—the HEV’s electric drive dominates, so these percentage savings often grow even larger in practice. Thus, the PSO PID-tuned hybrid Crafter would substantially reduce greenhouse gas emissions and fuel costs in urban logistics, aiding compliance with environmental targets and improving city air quality. Overall, our analysis shows that the HEV conversion significantly reduces CO2 per kilometer while extending range, outcomes that are crucial for sustainable delivery operations.
4. Conclusions
A series–parallel HEV conversion of a 2022 Volkswagen Crafter diesel van is demonstrated in this article to improve fuel efficiency, reduce emissions, and increase operational range. Simulations under standard driving cycles (with a full tank, 70% battery charge, and an ambient temperature of 25 °C) revealed an average fuel consumption reduction of 29.5% from 9.952 L/100 km for the conventional model to 7.014 L/100 km for the hybrid configuration. The average CO2 emissions decreased by 74.8 g/km (from 260.8 g/km down to 186 g/km) compared with global urban logistics sustainability targets. The hybrid system also increased the range of the proposed vehicle by 40.7% to 1105 km from 785.7 km.
Key among these was the optimization of PID control strategies using PSO, which proved superior to the conventional Ziegler–Nichols and genetic algorithm methods. Speed tracking errors were reduced to only ±0.34 km/h by the optimized PSO-tuned controller, enabling engine operation near its efficiency points. This precision reduced transient fuel penalties and maximized regenerative braking energy recovery, especially in urban cycles.
Despite these advances, some challenges, such as increased system complexity and upfront costs, were noted. However, the long-term fuel savings and environmental benefits make the investment worthwhile, especially for high-mileage fleets. Future work may investigate adaptive PID controllers for real-time parameter adjustment and lifecycle cost–benefit analyses to confirm the commercial viability of the hybrid Crafter.
This study concludes that series–parallel HEVs represent a significant contribution to decarbonizing urban transportation. It combines advanced control strategies with practical engineering solutions to create a roadmap for sustainable logistics that balances performance, efficiency, and environmental stewardship. The simulation results confirm that such a system can deliver substantial operational and environmental gains without sacrificing performance. This work lays a foundation for future developments in light commercial hybrid vehicles, and the methodology presented—integrating control optimization, system-level modeling, and empirical calibration—can be extended to other vehicle types and architectures.
Limitations and Future Development
This paper presents a study on converting the VW Crafter into a series–parallel hybrid vehicle, which necessitates certain modeling assumptions and simplifications. For example, the simulated vehicle dynamics were idealized; however, some variables, such as variable load distribution, road grade, suspension effects, and drivetrain losses, were not fully accounted for. Because our tests used idealized cycles (no external load, full tank, and ambient 25 °C), the quoted range is an upper bound. In real-world operations—with variable speeds, payload, road grade, and accessory loads—fuel consumption would be higher, reducing the range. For example, analyses indicate that PHEVs often use several times more fuel in practice than WLTP figures suggest, so the achievable range would degrade accordingly. Similarly, the battery and engine were modeled using simple equivalent circuits or efficiency maps, and phenomena such as thermal effects, aging, and component nonlinearities were ignored. The control strategy was based on a conventional PID controller, which may not fully exploit the potential of the hybrid system under dynamic conditions. All results are crucially numerically simulated and not hardware-tested; practical issues, such as sensor noise, actuator delays, and mechanical integration constraints, are not addressed. Therefore, future work should focus on improving model fidelity and conducting experimental validation. The vehicle/powertrain models can be extended to nonlinear dynamics, such as tire and suspension models, variable loading and drag, and more detailed battery behavior, including thermal management and degradation. Similarly, an energy management strategy may be extended beyond PID; for example, model predictive control is an optimization-based method that computes optimal power split decisions over a prediction horizon, while considering system constraints.
Future work should focus on refining the power split device and electric drive to more tightly match—and potentially exceed—the original diesel’s traction and speed envelope. Introducing an adaptive sun–ring ratio (via a two-stage e-gearset or continuously variable mechanism) alongside a higher power motor and faster discharge battery would improve low-speed launch without sacrificing top speed. Real-time control algorithms, which are predictive of driver demand and road load, could actively adjust the torque split for optimal performance. Finally, adding lightweight multi-speed e-transmission in a parallel mode would combine the seamless operation of an e-CVT with the responsiveness of fixed gears, ensuring full force and speed coverage under all conditions. The HEV model should also be further tested under various loads, initial battery charges, tank fills, and ambient temperature conditions to ensure its adaptability across different real-life scenarios.
It is worthwhile to also note that the PSO tuning in our study was performed offline to determine the PID gains. Once optimized, these gains are fixed, and the controller operates in real time with minimal computation. In other words, the vehicle’s control unit would simply apply the precomputed PID parameters at each control timestep. This offline calibration/online control approach is common in HEV design (for example, the ECMS control law utilizes offline-optimized parameters in real-time execution). Thus, although the PSO was run offline, the resulting PID controller is inherently real-time implementable. In practice, one can periodically re-run the offline PSO or use a fast adaptive method (e.g., a lookup table or model-predictive scheme) to update the gains if conditions change; however, the core control law itself can run live on the vehicle without further optimization.
Fuzzy logic and learning-based controllers, such as reinforcement learning, may also be investigated to handle uncertainties and nonlinearity. Finally, the simulation results should be checked in practice. This could involve hardware-in-the-loop testing using real controller hardware or building a prototype conversion of a VW Crafter. Such experimental validation would uncover unmodeled issues and confirm that the simulated gains in fuel efficiency and emissions are real in actual driving conditions.
Author Contributions
Conceptualization, P.T.S. and A.B.; methodology, A.B. and P.T.S.; software, A.N.F.A. and A.B.K.; validation, A.N.F.A., A.B. and P.T.S.; formal analysis, A.N.F.A.; investigation, A.N.F.A.; resources, A.B.K.; data curation, A.B. and A.B.K.; writing—original draft preparation, A.N.F.A.; writing—review and editing, A.N.F.A. and A.B.; visualization, A.B.K.; supervision, A.B., P.T.S. and A.B.K.; project administration, P.T.S. and A.B.K.; funding acquisition, P.T.S. All authors have read and agreed to the published version of the manuscript.
Funding
Supported by the University of Debrecen Program for Scientific Publication.
Data Availability Statement
The original contributions presented in the study are included in the article, further inquiries can be directed to the corresponding author.
Conflicts of Interest
The authors declare no conflicts of interest.
Abbreviations
The following abbreviations are used in this manuscript:
| HEV | Hybrid Electric Vehicle |
| ICE | Internal Combustion Engine |
| PID | Proportional–Integral–Derivative |
| PSO | Particle Swarm Optimization |
| GA | Genetic Algorithm |
| ZN | Ziegler–Nichols |
| WLTP | Worldwide Harmonized Light Vehicles |
| NEDC | New European Driving Cycle |
| HWFET | Highway Fuel Economy Test |
| FTP | Federal Test Procedure |
| SOC | State of Charge |
| HV | High Voltage |
| VW | Volkswagen |
| TDI | Turbocharged Direct Injection |
| FWD | Front Wheel Drive |
| LWB | Long Wheelbase |
| PMSM | Permanent Magnet Synchronous Motor |
| HPEVS | High-Performance Electric Vehicle Systems |
| IAE | Integral of Absolute Error |
| ISE | Integral of Squared Error |
| ITAE | Integral of Time-weighted Absolute Error |
| ITSE | Integral of Time-weighted Square Error |
| MPG | Miles Per Gallon |
| MAF | Mass Air Flow |
| AFR | Air–Fuel Ratio |
| MPC | Model Predictive Controller |
| MAE | Mean Absolute Error |
| RMSE | Root Mean Square Error |
| HIL | Hardware-in-the-loop |
| EMS | Energy Management System |
| MOMPC | Multi-Objective Model Predictive Control |
| A-ECMS | Adaptive Equivalent Consumption Minimization Strategy |
| DDPG | Deep Deterministic Policy Gradient |
References
- Ray, R. Series–Parallel Hybrid Electric Vehicle Parameter Analysis using MATLAB. Int. J. Res. Appl. Sci. Eng. Technol. 2021, 9, 421–428. [Google Scholar] [CrossRef]
- “Optimal Energy Management.” ScienceDirect. 2024. Available online: https://www.sciencedirect.com/science/article/pii/S2307187724000166 (accessed on 12 December 2024).
- Chen, P.; Pai, P.; Yang, C.; Huang, K.D. Development of Transmission Systems for Parallel Hybrid Electric Vehicles. Appl. Sci. 2019, 9, 1538. [Google Scholar] [CrossRef]
- Balerna, C.; Neumann, M.-P.; Robuschi, N.; Duhr, P.; Cerofolini, A.; Ravaglioli, V.; Onder, C. Time-Optimal Low-Level Control and Gearshift Strategies for the Formula 1 Hybrid Electric Powertrain. Energies 2021, 14, 171. [Google Scholar] [CrossRef]
- Yang, B.; Kim, K.; Mok, H. Fast and Robust Hybrid Starter and Generator Speed Control for Improving Drivability of Parallel Hybrid Electric Vehicles. Energies 2020, 13, 5055. [Google Scholar] [CrossRef]
- Polverino, P.; Arsie, I.; Pianese, C. Optimal Energy Management for Hybrid Electric Vehicles Based on Dynamic Programming and Receding Horizon. Energies 2021, 14, 3502. [Google Scholar] [CrossRef]
- Babangida, A.; Szemes, P.T. Dynamic Modeling and Control Strategy Optimization of a Volkswagen Crafter Hybrid Electrified Powertrain. Energies 2024, 17, 4721. [Google Scholar] [CrossRef]
- Zhang, Y.; Wang, Z.; Tian, Y.; Wang, Z.; Kang, M.; Xie, F.; Wen, G. Pre-Optimization Assisted Deep Reinforcement Learning-Based Energy Management Strategy for a Series-Parallel Hybrid Electric Truck. Energy 2024, 302, 131628. [Google Scholar] [CrossRef]
- Fu, Y.; Fan, Z.; Lei, Y.; Wang, X.; Sun, X. Integrated Optimization of Component Parameters and Energy Management Strategies for a Series–Parallel Hybrid Electric Vehicle. Automot. Innov. 2024, 7, 492–506. [Google Scholar] [CrossRef]
- Mittal, V.; Shah, R. Energy Management Strategies for Hybrid Electric Vehicles: A Technology Roadmap. World Electr. Veh. J. 2024, 15, 424. [Google Scholar] [CrossRef]
- Capito, M.; Rossi, L.; Hernández, P.; Kumar, S. Real-time adaptive equivalent consumption minimization strategy implementation on dSPACE MicroAutobox II. SAE Int. J. Engines 2023, 16, 1234–1242. [Google Scholar]
- Jia, C.; Liu, W.; He, H.; Chau, K. Superior energy management for fuel cell vehicles guided by improved DDPG algorithm: Integrating driving intention speed prediction and health-aware control. Appl. Energy 2025, 394, 126195. [Google Scholar] [CrossRef]
- Wei, H.; Li, G.; Wang, Y.; Lu, Y.; Lv, C.; Zhang, H. Priority-Driven Multi-Objective Model Predictive Control for Integrated Motion Control and Energy Management of Hybrid Electric Vehicles. IEEE Trans. Intell. Veh. 2023, 9, 5520–5531. [Google Scholar] [CrossRef]
- Fernandes, E.d.M.; Filho, R.B.; Pimenta, F.C. Development of a genetic algorithm-based control strategy for fuel consumption optimization in a mild hybrid electrified vehicle’s electrified propulsion system. Energies 2024, 17, 2015. [Google Scholar] [CrossRef]
- Liu, Z.E.; Li, Y.; Zhou, Q.; Shuai, B.; Hua, M.; Xu, H.; Xu, L.; Tan, G.; Li, Y. Real-time energy management for HEV combining naturalistic driving data and deep reinforcement learning with high generalization. Appl. Energy 2024, 377, 124350. [Google Scholar] [CrossRef]
- Chen, Z.; Xiong, R.; Cao, J. Particle Swarm Optimization-Based Optimal Power Management of Plug-In Hybrid Electric Vehicles Considering Uncertain Driving Conditions. Energy 2016, 96, 197–208. [Google Scholar] [CrossRef]
- Crafter TDI Near Warehouse Wall Stock Photo. (n.d.). Adobe Stock. Available online: https://share.google/8KHmU03rksJCX6RSf (accessed on 23 June 2025).
- Chan, C.C.; Chau, K.T. Modern Electric Vehicle Technology; Oxford University Press: Oxford, UK, 2001. [Google Scholar]
- Ehsani, M.; Gao, Y.; Emadi, A. Modern Electric, Hybrid Electric and Fuel Cell Vehicles: Fundamentals, Theory and Design, 2nd ed.; CRC Press: Boca Raton, FL, USA, 2010. [Google Scholar]
- Technische Daten–Volkswagen Crafter. Volkswagen Nutzfahrzeuge. 2022. Available online: https://www.volkswagen-nutzfahrzeuge.de/de/modelle/crafter/technische-daten.html (accessed on 10 April 2025).
- Genuine Audi-Volkswagen Battery 12 V 92 Ah AGM. HVP Automotive Motorsport. 2025. Available online: https://www.hvpautomotive.com/products/ac-delco-car-battery-ns60lmf-50b24l-copy (accessed on 27 March 2025).
- The Crafter Panel Van Brochure. Volkswagen Commercial Vehicles Ireland. 2022. Available online: https://www.volkswagenvans.ie/idhub/content/dam/onehub_nfz/importers/ie/models/downloads/january-2022/MY22%20Crafter%20Panel%20Van%20Brochure%2001042022.pdf (accessed on 22 February 2025).
- VW CRAFTER 2022 Battery–AGM Battery, 95 Ah, 850 A. AUTODOC Germany. 2025. Available online: https://www.autodoc.co.uk/car-parts/battery-10142/vw/crafter (accessed on 27 December 2024).
- Yadav, A.K.; Gaur, P.; Jha, S.K.; Gupta, J.; Mittal, A. Optimal speed control of hybrid electric vehicles. J. Power Electron. 2011, 11, 393–400. [Google Scholar] [CrossRef]
- Biswas, A.; Rathore, A.; Emadi, A. Coordinated Clutch Actuation for Drivability Improvement and Energy Management of a Novel Multi-Mode Hybrid Electric Vehicle and HIL Validation. Energy Convers. Manag. 2023, 287, 117060. [Google Scholar] [CrossRef]
- MyMotorList.com. Engine Specifications for Ford 1.5 TDCi, Characteristics, Oil, Performance. MyMotorList.com. 8 July 2022. Available online: https://mymotorlist.com/engines/ford/1-5-tdci/ (accessed on 26 October 2024).
- Ford. Ford Focus Specifications [Press Release]. Ford Media, n.d. Available online: https://media.ford.com/content/dam/fordmedia/Europe/documents/productReleases/Focus/FordFocus_TechSpecs_EU.pdf (accessed on 22 October 2024).
- European Automobile Manufacturers Association (ACEA). Euro 6 Diesel Aftertreatment Systems. ACEA White Paper. 2015. Available online: https://www.acea.auto/files/ACEA_Position_Paper-Principles_potential_post-Euro_6_post-Euro_VI_emission_regulations.pdf (accessed on 1 June 2024).
- AC-50 Electric Motor Technical Information. HPEVS (Electric GT). 2024. Available online: https://www.hpevs.com/hpevs-ac-electric-motors-ac50-ac51-for-automotive-mining-utility-ground-support-vehicles.htm (accessed on 15 August 2024).
- Kumar, S.; Singh, P. Future Perspectives on Hybrid Electric Vehicle Technology. Renew. Sustain. Energy Rev. 2018, 90, 486–499. [Google Scholar] [CrossRef]
- HPEVS AC-12 Brushless AC Motor Kit-72V with Curtis 1238-6501 Control. (n.d.). Canadian Electric Vehicles (canEV and icanEV). Available online: https://canev.com/products/curtis-1238-6501-hpevs-ac-12-brushless-ac-motor-kit-72-volt?srsltid=AfmBOoqdNQnUjdAhrX8BtQt_vDjOiqarLrj3a9cyUUII1JWCBmu7BrUt#:~:text=The%20AC,lots%20of%20reliable%20EV%20miles (accessed on 1 July 2025).
- Özkan, A.; Arslan, H.; Sen, O.T. Investigation of the series hybrid electric powertrain architecture with Wankel engine as a range extender. Gazi. Univ. J. Sci. 2022, 35, 1078–1089. [Google Scholar] [CrossRef]
- Maaruf, M.; Khalid, M. Global Sliding-Mode Control with Fractional-Order Terms for the Robust Optimal Operation of a Hybrid Renewable Microgrid with Battery Energy Storage. Electronics 2022, 11, 88. [Google Scholar] [CrossRef]
- Al-Adsani, A.S.; Jarushi, A.M.; Beik, O. ICE/HPM generator range extender for a series hybrid EV powertrain. IET Electr. Syst. Transp. 2019, 10, 96–104. [Google Scholar] [CrossRef]
- Pan, Y.; Zhong, K.; Xie, Y.; Pan, M.; Guan, W.; Li, L.; Liu, C.; Man, X.; Zhang, Z.; Li, M. A Review of Hybrid Vehicles Classification and Their Energy Management Strategies: An Exploration of the Advantages of Genetic Algorithms. Algorithms 2025, 18, 354. [Google Scholar] [CrossRef]
- BMW i3 60 Ah (2013–2017)–Battery and Dimensions. EV-Database. 2024. Available online: https://ev-database.org/car/1004/BMW-i3-60-Ah (accessed on 1 September 2024).
- Murden, D. AGM vs. Lithium Batteries: Which One to Choose According to Your Needs. Eco Tree Lithium. 2 October 2023. Available online: https://ecotreelithium.co.uk/news/agm-vs-lithium-batteries/ (accessed on 22 March 2024).
- A New Generation Hybrid TransaXL. (n.d.). Available online: https://www.altenergymag.com/articles/05.10.01/naftc/contents.html#:~:text=,more%20than%20doubled%3A%20from%2067hp (accessed on 10 June 2025).
- Gao, W.; Cao, Z.; Kurdkandi, N.V.; Fu, Y.; Mi, C. Evaluation of the second-life potential of the first-generation Nissan Leaf battery packs in energy storage systems. eTransportation 2024, 20, 100313. [Google Scholar] [CrossRef]
- Borase, R.P.; Maghade, D.K.; Sondkar, S.Y.; Pawar, S.N. A Review of PID Control, Tuning Methods and Applications. Int. J. Dyn. Control. 2021, 9, 818–827. [Google Scholar] [CrossRef]
- Al, J.K.E. Speed Control of Hybrid Electric Vehicle Using Artificial Intelligence Techniques. Int. J. Comput. Netw. Technol. 2014, 2, 33–39. [Google Scholar] [CrossRef]
- Abbas, I.A.; Mustafa, M.K. A Review of Adaptive Tuning of PID Controllers: Optimization Techniques and Applications. Int. J. Nonlinear Anal. Appl. 2020, 15, 29–37. [Google Scholar]
- Wong, K.; Lee, S. A Comprehensive Review on Advanced Energy Management Systems in Hybrid Electric Vehicles. Renew. Sustain. Energy Rev. 2024, 161, 112302. [Google Scholar] [CrossRef]
- Niu, Y.; Abdullayev, V. Design and Performance Analysis of Hybrid Electric Vehicles Using MATLAB Simulink. Wasit J. Comput. Math. Sci. 2023, 2, 64–75. [Google Scholar] [CrossRef]
- Hybrid-Electric Vehicle Model in Simulink. MATLAB Central File Exchange. 22 March 2025. Available online: https://de.mathworks.com/matlabcentral/fileexchange/28441-hybrid-electric-vehicle-model-in-simulink (accessed on 10 January 2025).
- Miller, S. Hybrid Electric Vehicle Model in Simulink. GitHub. 28 February 2025. Available online: https://github.com/mathworks/Simscape-HEV-Series-Parallel/releases/tag/24.2.4.6 (accessed on 2 April 2025).
- Chasiotis, I.D.; Karnavas, Y.L. Design, Optimization and Modelling of High Power Density Direct-Drive Wheel Motor for Light Hybrid Electric Vehicles. Electr. Veh. Technol. 2017, 125. [Google Scholar] [CrossRef]
- Vu, T.Q.; Moezzi, R.; Cyrus, J.; Hlava, J. Optimal Fuel Consumption Modelling, Simulation, and Analysis for Hybrid Electric Vehicles. Appl. Syst. Innov. 2022, 5, 36. [Google Scholar] [CrossRef]
- Adel, B.; Zhang, Y.; Sun, S. Parallel HEV Hybrid Controller Modeling for Power Management. World Electr. Veh. J. 2010, 4, 190–196. [Google Scholar] [CrossRef]
- Tuan, N.K. Modeling and Simulation of Series Parallel HEV Using MATLAB/Simulink. Int. J. Mech. Eng. Technol. 2018, 9, 1590–1599. [Google Scholar]
Disclaimer/Publisher’s Note: The statements, opinions and data contained in all publications are solely those of the individual author(s) and contributor(s) and not of MDPI and/or the editor(s). MDPI and/or the editor(s) disclaim responsibility for any injury to people or property resulting from any ideas, methods, instructions or products referred to in the content. |
© 2025 by the authors. Licensee MDPI, Basel, Switzerland. This article is an open access article distributed under the terms and conditions of the Creative Commons Attribution (CC BY) license (https://creativecommons.org/licenses/by/4.0/).
