Article

Genetic Characterization of Natural Oil Seeps in the Carpathians and Their Relationship to the Tectonic Structure

by
Wojciech Bieleń
*,
Irena Matyasik
*,
Marek Janiga
and
Agnieszka Wciślak-Oleszycka
Oil and Gas Institute—National Research Institute, 25A Lubicz St., 31-503 Kraków, Poland
*
Authors to whom correspondence should be addressed.
Energies 2025, 18(13), 3575; https://doi.org/10.3390/en18133575
Submission received: 17 June 2025 / Revised: 30 June 2025 / Accepted: 2 July 2025 / Published: 7 July 2025
(This article belongs to the Section B: Energy and Environment)

Abstract

The paper presents the geochemical characteristics of 26 selected oil seeps, more than half of which are remnants of old oil wells. The samples were collected from three tectonic units: the Magura, Silesian, and Skole units in the Polish part of the Carpathians. The analyzed seeps are mainly located on outcrops of Inoceramian beds within the Magura nappe, the Krosno Beds and Transition Beds in the Silesian nappe, as well as the Menilite Beds of the Skole unit. The study primarily focused on genetic characteristics, which were used to correlate the seeps with the oils from the deposits of these tectonic units and to assess the degree of secondary alterations. All hydrocarbon seeps were analyzed in terms of their location on surface cross-sections, and attempts were made to assign them features based on the classification proposed in 1952, which takes into account the tectonic characteristics of the regions where the seeps were identified. In the general genetic characterization, these seeps did not show significant differences, suggesting a similar source of supply as the crude oils. Among the analyzed seeps, three genetic groups were distinguished. For correlation purposes, information from published materials on crude oils and their genetic characteristics was used. Of the five classification types described in the literature, only two could be assigned to those occurring in the Carpathians. Considering the tectonic structure and the location of the seeps (based on surface cross-sections), it has been determined that most of the analyzed seeps are the result of migration along faults connecting source rocks or, less frequently, deformed deep accumulations with the surface.

1. Introduction

Hydrocarbon seepage to the surface is quite a common phenomenon observed worldwide, especially in oil basins with highly tectonized structural formations. Seeps generally indicate the presence of hydrocarbon accumulations in the subsurface zone. Their occurrence is associated with faults and intensified rock fracturing, cracks that provide migration pathways from reservoir rocks to the surface. Seeps result from the breach of seals above reservoir rocks of accumulation and appear on the surface as micro or macro-oil seeps, attributable to tertiary hydrocarbon migration towards the surface under the influence of accompanying buoyant forces. The relation between visible oil seeps and commercial deposits found in deeper horizons has been widely documented in Asia, Canada, Venezuela, Australia, Romania, as well as in the North Sea and the Caspian Sea [1,2,3,4]. Determining the distribution of such seeps can be one of the elements in the study of petroleum systems. Macro seeps are often very helpful in reconstructing the structure and tectonic changes in the basin, its dynamics, and the geochemical characteristics of the original organic matter. The intensity of incoming seeps is largely controlled by the style of tectonic structure and the timing of oil migration, particularly secondary and tertiary migration. A correlation can be observed between the number of seeps and the overall subsurface resources, but this is not a relation that can be directly interpreted. Hydrocarbon seeps are commonly found above tectonic elements such as active diapirs, faults, and uplifted basin margins [5,6]. Rarely, seeps occur directly above major accumulations, though many can be connected to deeper reservoirs through complex migration paths. Optimal relationships between seeps and accumulations are observed in basins under active compression with numerous faults, particularly in shallow reservoirs. Seeps are less frequent in areas where traps lie at significant depths beneath thick, undisturbed overburdens. They are used for local or regional assessments of the hydrocarbon potential, character, and extent of source rocks within a petroleum system [7,8,9].
The intensity of natural seeps can vary greatly, from huge (mega or macro-scale) to minimal (micro-scale). Micro-seeps are detected using geochemical tests of rock samples (chromatographic and luminescent methods). Oil basins with complex tectonic structures of hydrocarbon formations and/or advanced stages of erosion of sealing rocks feature mega and macro-manifestations of hydrocarbons. These mega and macro-seeps most often occur at the peaks of fold structures and in fault or thrust zones. The forms of natural hydrocarbon seepage differ in terms of intensity, location relative to tectonics, and molecular composition. Oil seeps are more easily noticed than gas exhalations due to physical properties (odor, color) and the possibility of their transportation in the form of emulsions through surface waters [10].
The genesis of natural occurrences may be related to different stages of hydrocarbon phase migration. The most intense manifestations occur as a result of the seepage of hydrocarbons from their accumulation zones in deep structures, i.e., in the vicinity of oil and natural gas deposits [7].
The occurrence of surface hydrocarbon seeps is often the reason for starting oil exploration in many regions of the world, including the Carpathians. Economically valuable oil deposits do not always exhibit the coexistence of hydrocarbon seeps. Therefore, in contemporary professional literature, which is dominated by specialized methods of searching for deposits in deep structures, natural manifestations of hydrocarbon seeps are treated marginally. However, it is important to remember that the analysis of natural manifestations of hydrocarbon migration (distribution, intensity) validates the reconstructed models of petroleum systems and the estimation of the losses of their original hydrocarbon potential. The intensity of oil seeps is also linked to the assessment of their potential impact on the natural environment.
The presence of seeps in quantities sufficient to conduct detailed molecular characterization of hydrocarbons can provide key information about oil systems [1,9,11], such as the following:
  • The source type (type of organic matter);
  • The age of the source substance (if age biomarkers are present);
  • The maturity level of the source organic matter;
  • Primary (from source rock to deposit—expulsion) and secondary (from basement to trap) migration paths.
The linkage of the surface seepage should be interpreted in relation to the subsurface structure documented by geological cross-sections.

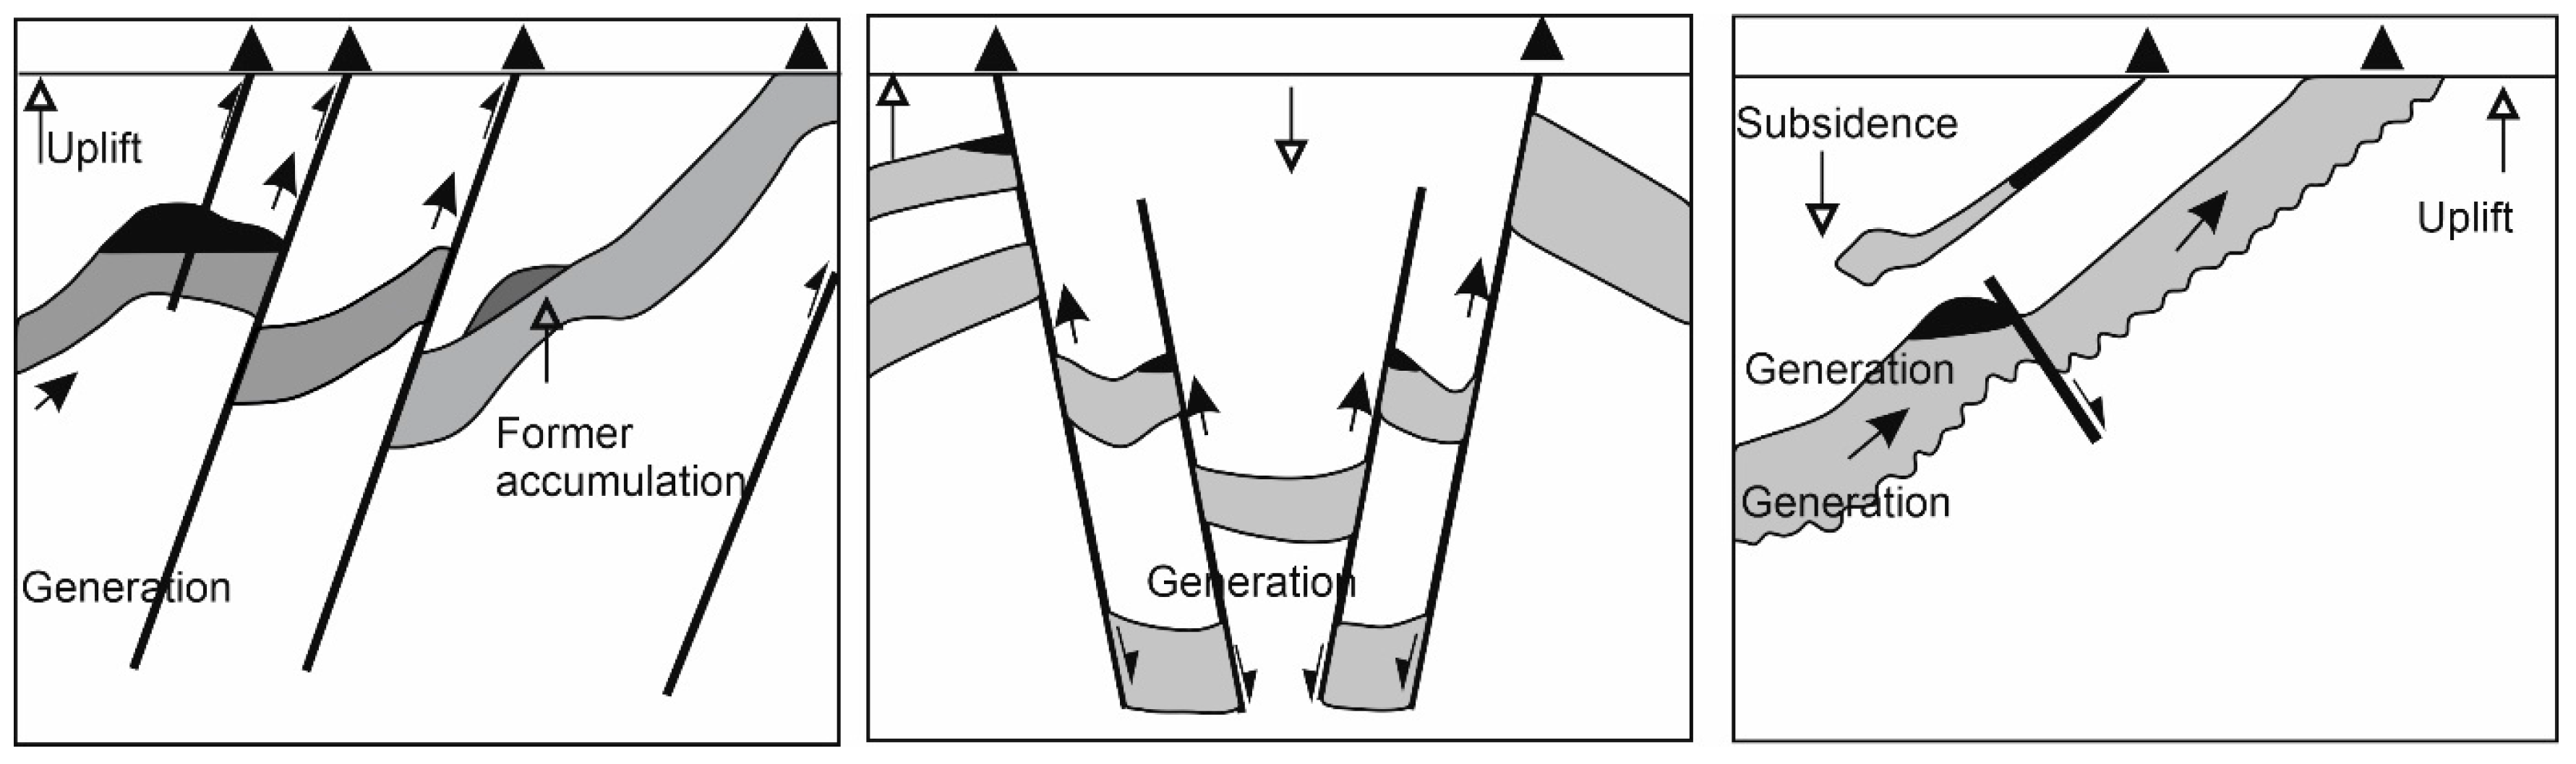
1.1. The Classification of Seeps
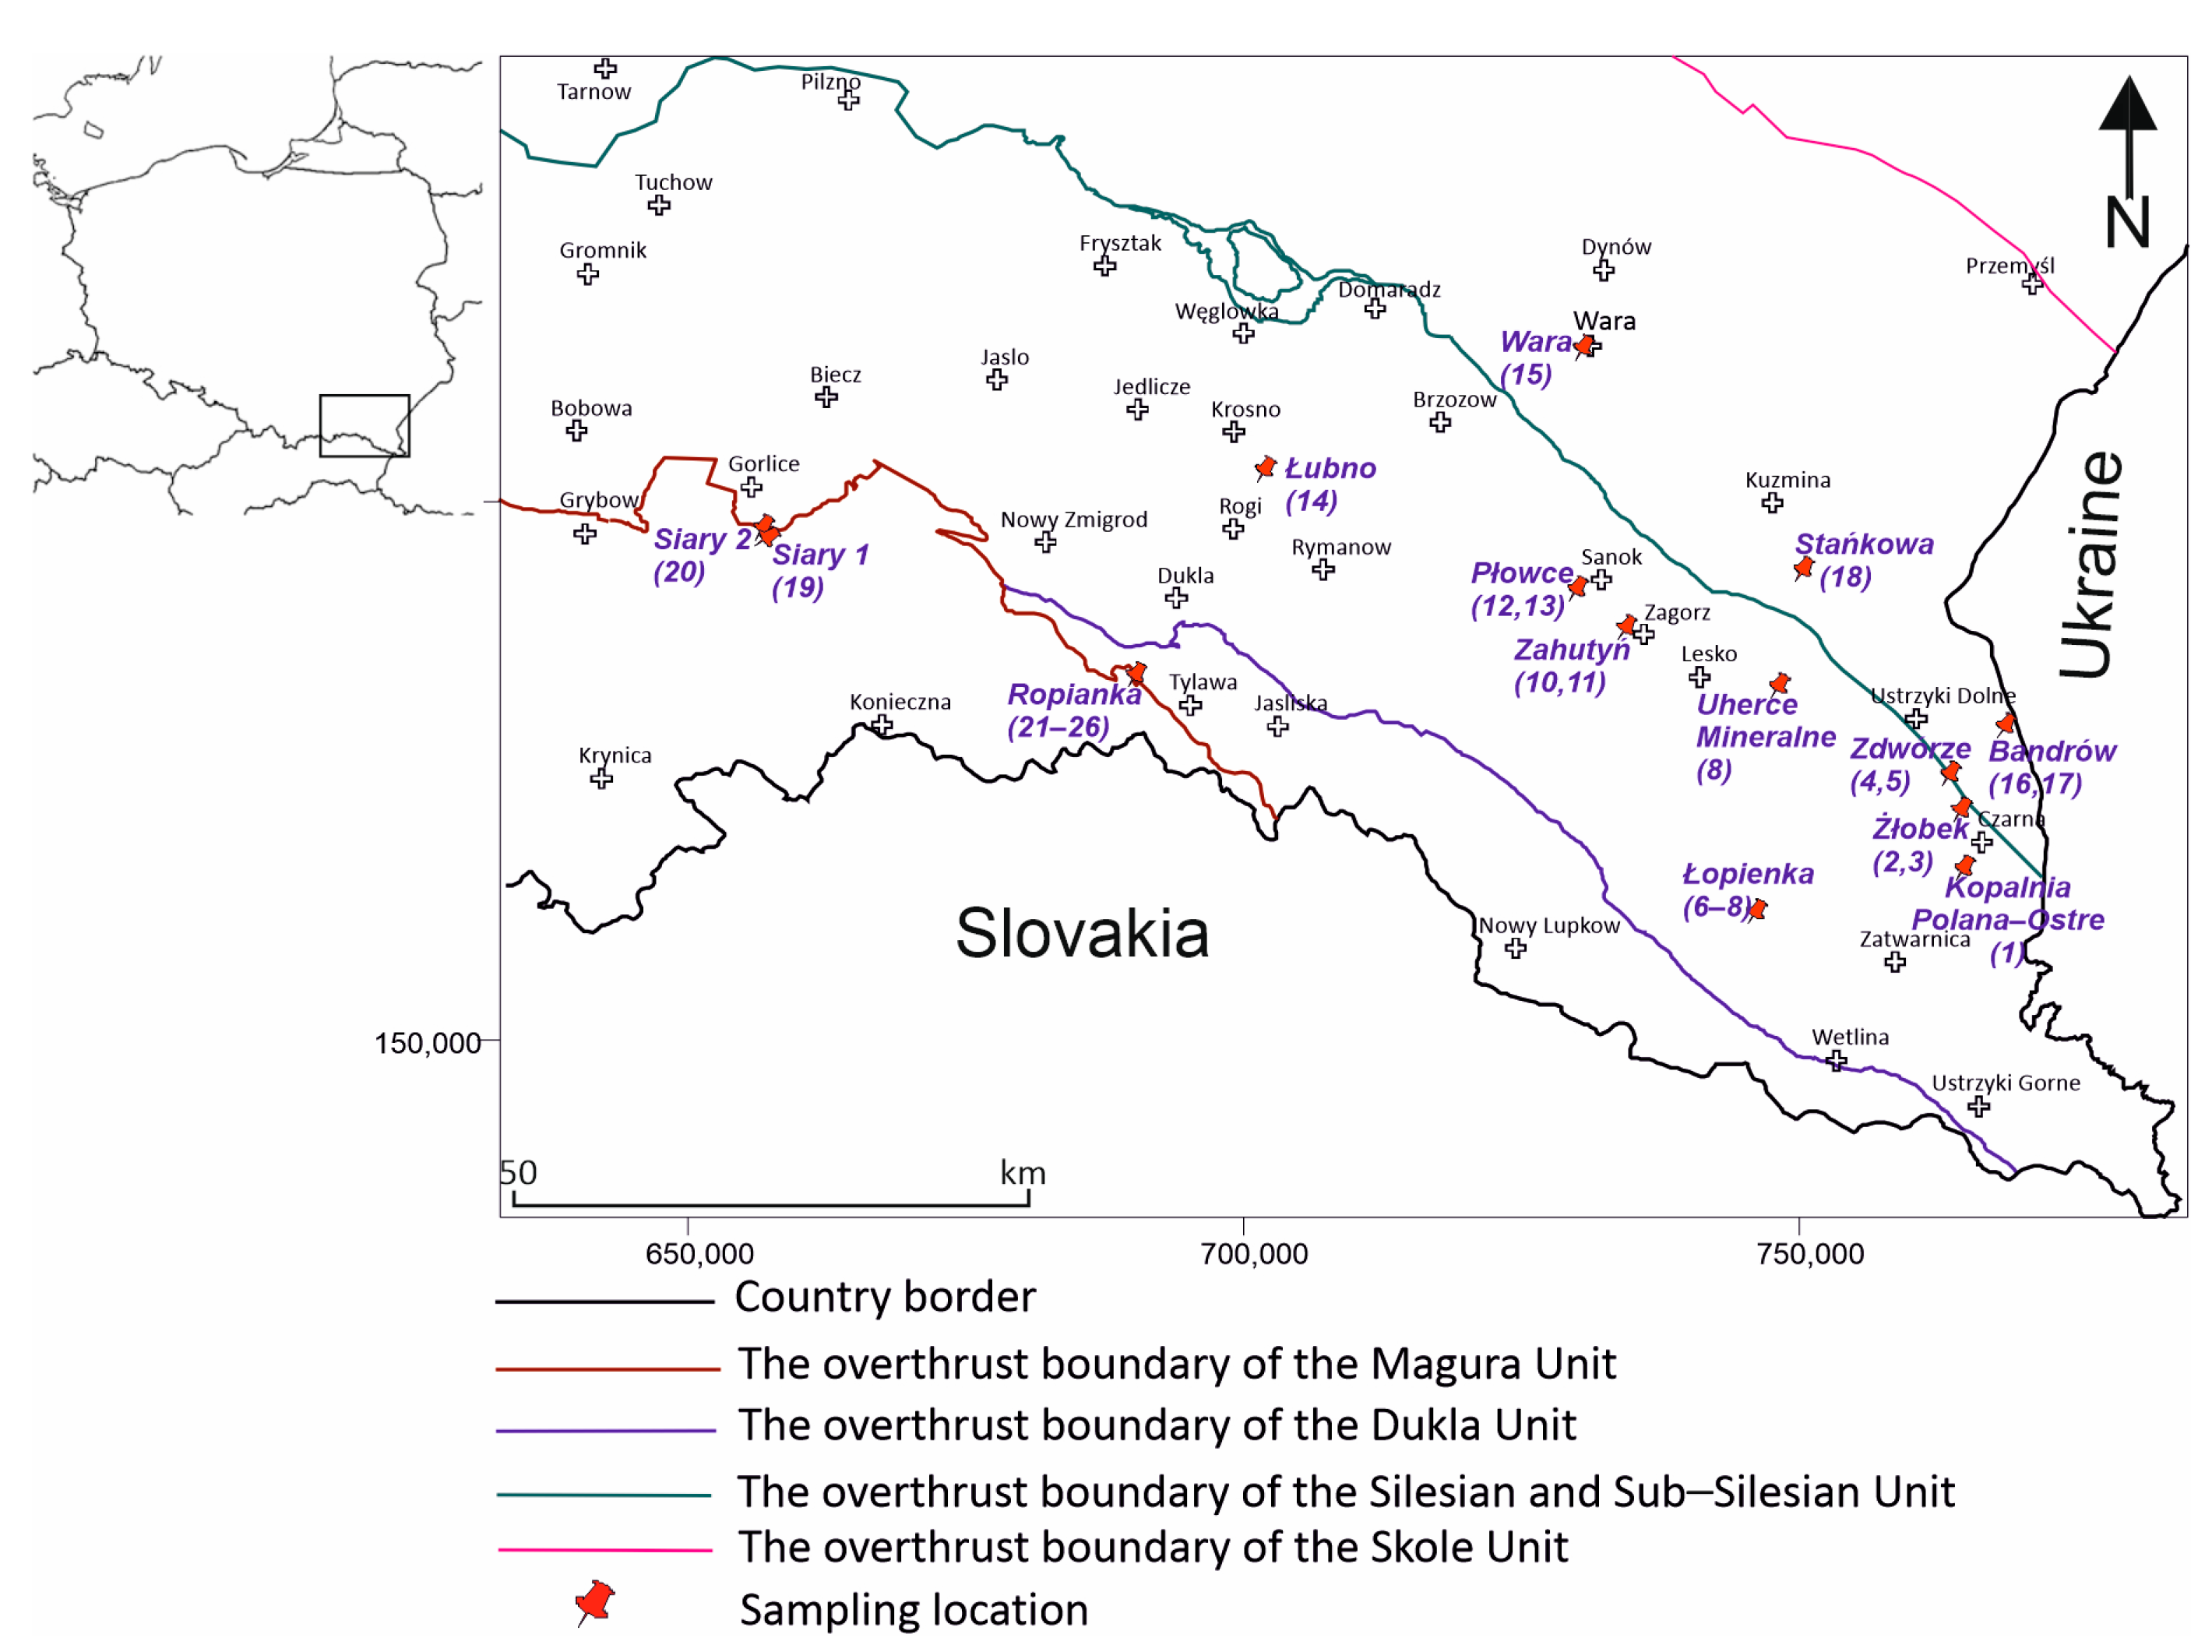
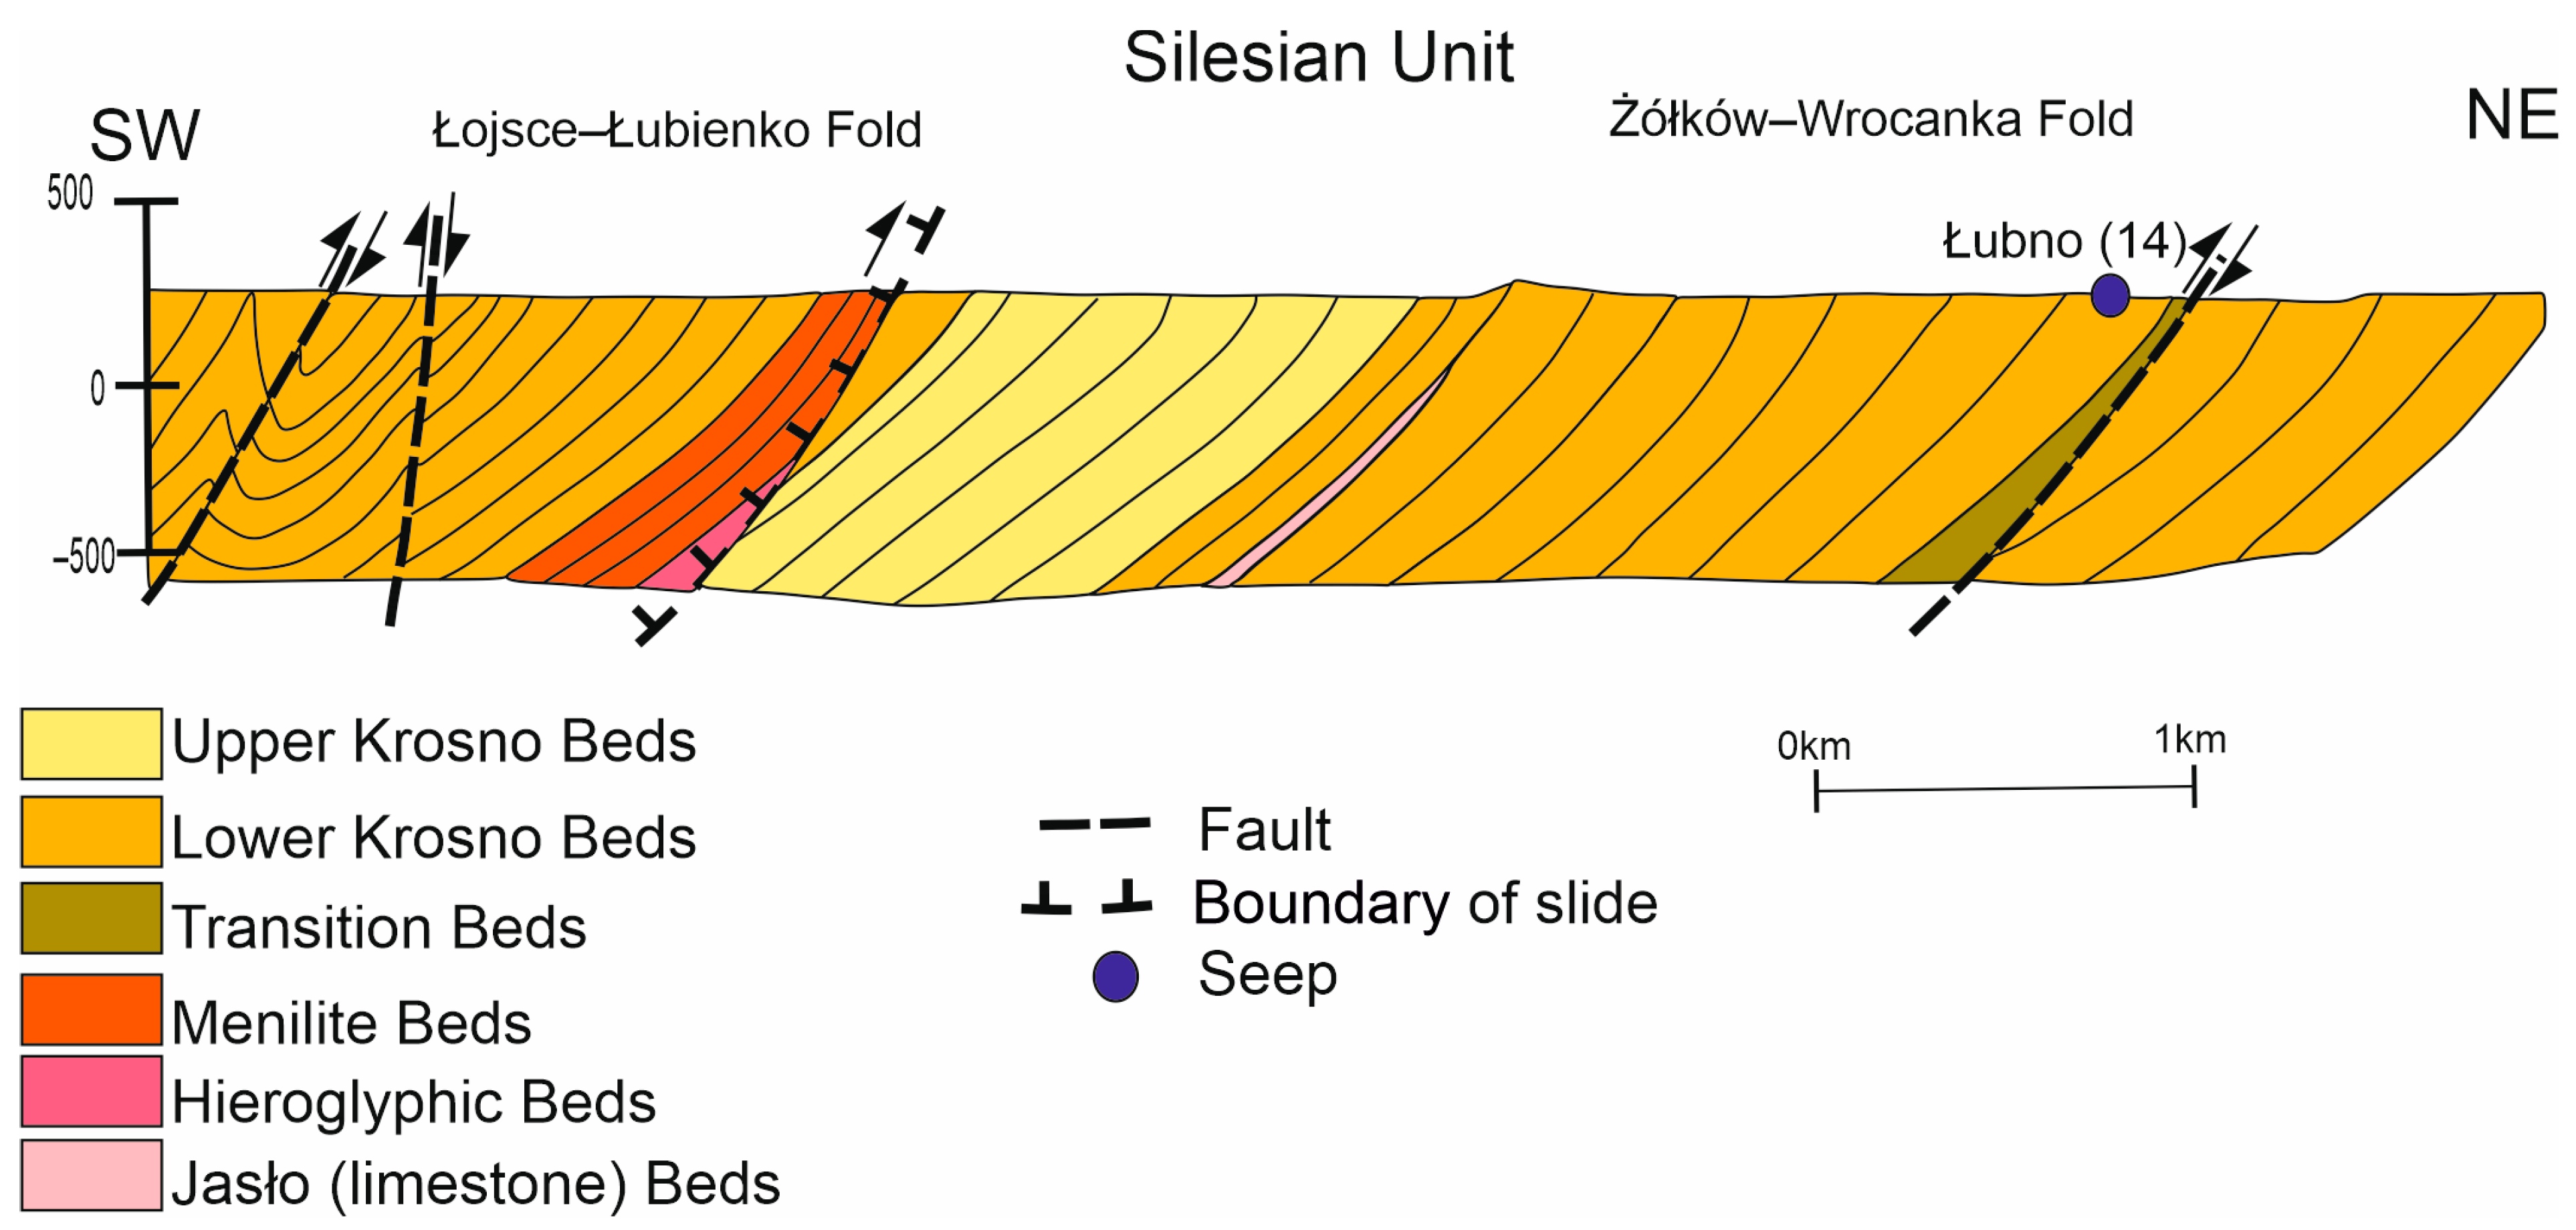
In general, seeps can be related to three types of tectonic structures, with a compressional tectonic system, extensional, or with uplifted basin edges, as shown in the figure below (Figure 1).
Seeps are most commonly found on the edges of basins and in sediments that have been folded, faulted, and eroded. Link [9] developed a cataloguing system for surface hydrocarbon seeps, placing them in one of the following categories:
Type 1—Surface seeps emerging from homocline beds containing oil deposits, whose boundaries are exposed on the surface. Generally, these seeps are not abundant but are persistent, as oil and gas slowly migrate to the surface along permeable formations. Such seeps were reported in Canada on Manitoulin Island in Ontario [7].
Type 2—Surface seeps related to deposits and formations where the oil formed belongs to so-called in situ deposits (direct connection to the source deposit). This type of seep results in small amounts of crude oil. Cracking of these deposit formations due to tectonic activity releases small amounts of oil and natural gas. An example of this type of seep is found in the Sixaola Valley in Costa Rica.
Type 3—Surface seeps from large sub-surface (deep accumulations) hydrocarbon accumulations, where the formations have been deformed by faults or folds as a result of tectonic plate movements. This class of seeps often represents the migration of large amounts of oil and natural gas. These are often eroded surfaces of anticlines.
Type 4—The seep surface is located at stratigraphic unconformity outcrops, where the migration path follows the unconformity.
Type 5—Surface seeps related to intrusions (i.e., magmatic intrusions and mud volcanoes). These are seeps whose migration path follows fractures and faults formed as a result of tectonic activity. Such seeps may or may not be associated with fractured formations containing hydrocarbons. An example of such a seep is the Golden Lane in Mexico [5].

1.2. Study Area

In the flysch profiles of the Polish Outer Carpathians, source and reservoir rocks of hydrocarbons are commonly found, whereas oil and gas deposits of industrial significance have been discovered in the eastern part, which features the most favorable geostructural configuration for forming effective hydrocarbon deposits [12]. These deposits are located within the nappes and the following units: Dukla (Dukla-Grybów), Silesian, Sub-Silesian, and Skole. Oil-bearing horizons occur in various lithostratigraphic units, from the early Cretaceous to the Oligocene. The most complicated tectonics of oil-bearing beds is typical for thrust tectonic zones.
In contrast to the tectonic structure of the western Carpathians, the eastern part is dominated by steep folds and thrusts. The main oil and gas zones are linked to the central synclinorium of the Silesian nappe and its borders. The southeastern part of the synclinorium is bordered by a zone of complex folds and thrusts with back verging, stretching along the Dukla thrust. The most characteristic feature of this zone is the Bystre slice, within which the oldest beds of the Silesian series in the eastern Carpathians are exposed, starting from the Cieszyn beds [13]. In the western part, the pre-Dukla zone is formed by the NW-tilted oil-bearing fold of Rudawka Rymanowska—Iwonicz Zdrój and the Bukowica slice. To the north of them are the following folds: Bóbrki-Rogów (Łopienki-Suchych Rzek) and Beska (Mokrego-Zatwarnicy), forming the internal zone of the synclinorium. The tectonic structure of this zone is characterized by a developed system of imbricate thrusts, which distinguish secondary structural elements (slices with reduced northern limbs, displaying back-verging in the eastern part—the Bieszczady subregion). Oil deposits in these elements occur at the hinges of anticlines and their southern limbs. The external zone of the synclinorium, where oil deposits with significant resources have been discovered, is built from the buried folds of Czaszyn and Tarnawa–Wielopola–Zagórza, which are characterized by a more regular structure.
The central synclinorium in the eastern part is composed of Krosno lithofacies (younger members of the Menilite–Krosno series (Oligocene) with a thickness of up to 3000 m). In the western part, beneath the cover of Krosno Beds, older Paleogene and younger Cretaceous lithostratigraphic members are exposed (in structural culminations), forming the axial zones of the most hydrocarbon-rich structures (crude oil, gas) in the Gorlice–Krosno region, i.e., Gorlice, Osobnica, Bóbrka–Rogi, and Potok–Roztoki [14].
The central synclinorium is surrounded on the outer side by uplifted structural elements of the frontal uplift of the Silesian nappe. These form the Zmiennica–Strachocina and Grabownica–Załuża folds, with disharmonic tectonics that are locally back-thrusted. In these folds, the largest gas field, Strachocina, and the Grabownica oil field were discovered, along with several smaller gas and oil fields. The Ciężkowice and Bzianka–Liwocz folds have their structural continuation in the western part. On the edges of these fold structures, numerous hydrocarbon seeps have been observed, resulting from tectonic reworking and disruption of sealing in deep accumulations. Many of these seeps, when correlated with geological cross-sections, can be linked to deep accumulations based on genetic similarities.
The Silesian nappe and the tectonic elements of the Sub-Silesian unit overthrust onto the internal synclinorium of the Skole nappe. The amplitude of these thrusts increases in the northwestern direction (NW), partially covering the extensive Strzyżów depression. To the southeast, it splits into several deep synclines filled with upper Krosno Beds (early Miocene) and steep anticlines (often sliced and secondarily folded).
The internal anticlines: Mrzygłód–Tyrawa Solna–Ustrzyki Dolne and Wańkowa (village)–Bandrowa, characterized by linear extension, are more subsided [15]. In the basal members of this series, thick lenses of the Kliwa sandstones occur, which constitute oil-bearing horizons at the Łodyna and Wańkowa oil fields, as well as in two small deposits (Brzegi Dolne, Tyrawa Solna).
The thickness of the thick Krosno bed’s cover significantly decreases within the anticlinorium of the Skole nappe. In this geostructural element, no industrial hydrocarbon deposits have been found so far, and natural seep manifestations are sporadic, unlike the previously described zones.
The reservoir rocks that are part of several dozen oil fields located in the Polish Carpathians include thick-bedded sandstones, representing diverse Cretaceous–Paleogene depositional sequences of flysch sediments. The profiles of these sediments are divided into the Magura, Dukla, Silesian, Sub-Silesian, and Skole series, and they vary in thickness, as well as textural and mineralogical maturity, affecting the considerable variability of reservoir properties [16]. Compact and intensely fractured rocks with low intergranular permeability are also a source of significant hydrocarbon seeps in some profiles.
The correlations, based on genetic characterization, were used to analyze seepage samples. However, similar correlations (oil–oil and oil–rock) were performed in the study area, but they did not take into account the occurrence of oil seeps [12,14,15,16]. This study applied an innovative approach by linking the locations of surface seepages and geological structures, reflected in cross-sections, with the characteristics of crude oils accumulated in previously described reservoirs.

2. Materials and Methods

2.1. Samples

The location of natural surface hydrocarbon seeps in the area of the Polish Carpathians appears to be related to exploited or depleted oil deposits and corresponds to the activity of hydrocarbon generation and migration processes in the Carpathian petroleum system. This study presents the results of various geochemical analyses of 26 samples taken from natural seeps or from old pits; some of them come from the same location but were collected at different times, while others were taken from several closely neighboring old oil pits within a single seep, e.g., Ropianka (6 samples). The study did not analyze samples of exhaled gases nor rocks saturated with hydrocarbons (so-called bituminous sands). The locations of the seeps are shown on the map (Figure 2), while example photos of natural seeps or seeps from old pits are shown in Figure 3. The largest number of samples was taken from the Silesian unit, and a few samples were from the Skole and Magura units. Seeps in the Magura unit mainly occur in the inoceramid beds, while in the Silesian unit, the lower Krosno beds exposed at the surface contain numerous seeps in depressions. In the Skole unit, seeps are found in Kliwa or intra-menilitic sandstones or in menilite beds.

2.2. Sample Preparation

Depending on the type and form of the surface hydrocarbon seep, the collection and preparation of samples for analysis can vary. If a thick layer of oil was present, it was collected into a container and treated as a classic oil sample. If the oil was present as a thin layer on the surface of the water, then it was scooped into the container along with the water. In the laboratory, the oil was extracted with a laboratory spoon, or the sample was centrifuged (for 10 min at 4000 rpm), and then the oil was collected. Any contaminants (leaves, bark, pieces of wood) were removed with tweezers. Group separations were performed on all samples, followed by GC-MS and isotopic composition analyses.

2.3. Group Separation (SARA)

The group separation of the seep samples was carried out using liquid chromatography columns after the separation of asphaltenes. Saturated hydrocarbons are not adsorbed by the column and elute with n-hexane (POCH*). This fraction was eluted into a previously weighed vessel by applying about 20 mL of n-hexane onto the column in portions of about 4 mL. After washing out the saturated hydrocarbons, the aromatic hydrocarbon fraction was eluted into another marked and weighed vessel using about 15 mL of a hexane/toluene (POCH*) mixture in a volume ratio of 1:3. The process was conducted until the luminescence of the column disappeared under UV light. Resins remaining on the column were eluted into a separate, weighed vessel with 15 mL of a toluene/methanol (POCH*) mixture in a volume ratio of 1:1, to which about 10 mL of dichloromethane (POCH*) was added in the final elution phase.
POCH*—Polish Chemical Reagents.

2.4. GC-MS Analysis

The analysis of specific biomarkers of the aromatic and saturated fractions was performed using gas chromatography (GC) coupled with mass spectrometry (MS), using a POLARIS Q ion trap (Thermo Scientific, Bremen, Germany) equipped with an RTX-5 MS column (30 m × 0.25 mm, film thickness of 0.25 µm). Helium was used as the carrier gas.
The following temperature program was applied:
Initial temperature 60 °C (isothermal—1 min);
Temperature increase at 4 °C per min to 310 °C;
Final temperature 310 °C (isothermal—15 min).
Each time, 1 µL of sample dissolved in n-hexane (approx. 30 mg/mL) was injected.
Mass spectra of aromatic and saturated fractions of the analyzed samples obtained in total ion chromatogram mode (TIC) and selected ion monitoring mode (SIM) were subjected to computer processing, selecting mass spectra of specific biomarker groups for identification.

2.5. Isotopic Analysis

Stable carbon isotope analyses were performed using a Thermo Scientific (Bremen, Germany) Delta V Advantage mass spectrometer. Bulk analyses of crude oils and fractions were performed with a spectrometer coupled to a Thermo Scientific Flash 2000 elemental analyzer and ConFlo IV open-split interface. The analyzer was operated at a helium flow rate of 200 mL/min. The oxidation–reduction tube was packed with chromium oxide, reduced copper, and silvered cobaltous, separated by quartz wool. The reaction tube was maintained at a temperature of 1030 °C. The oxygen gas for sample combustion was injected during the autosampler start.
The results were expressed in the δ-notation (δ13C, ‰) relative to VPDB scale. For calibration, reference material NBS-22 and IAEA-601 were used. Analytical precision was estimated to be ±0.2‰.

3. Results

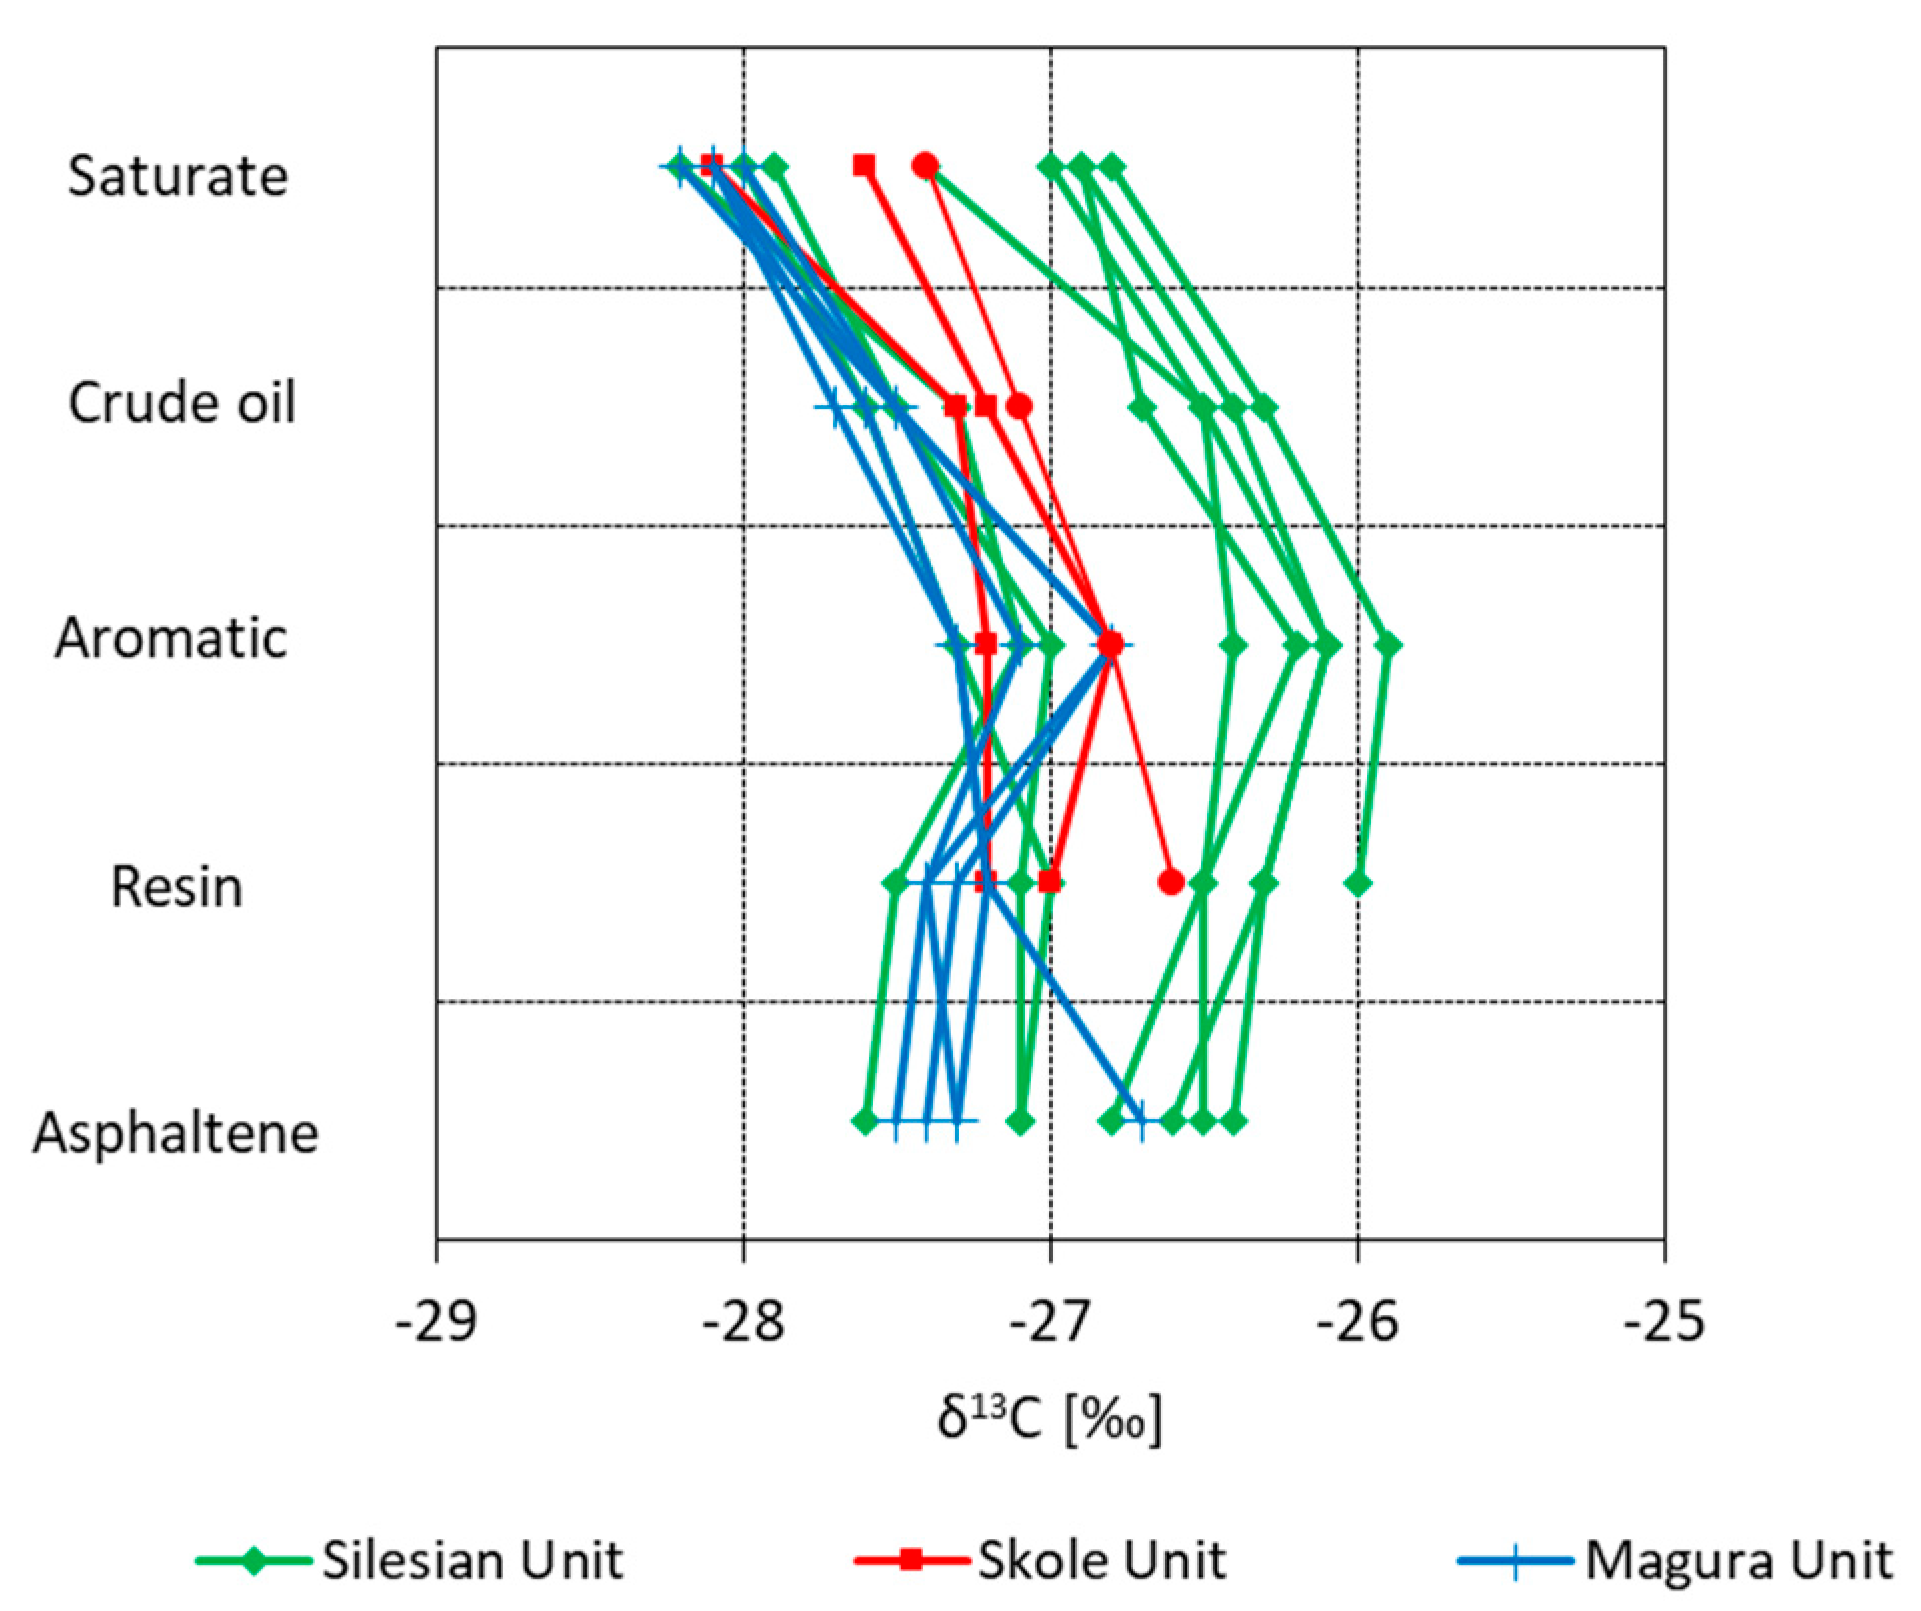
3.1. SARA and Isotopic Composition

Natural seeps can be considered geochemically as residual substances derived from mature crude oils. Seeps are characterized by a reduced content of saturated and aromatic hydrocarbons due to fractionated evaporation caused by reservoir leakage, water washing, or biodegradation. Oils in inactive surface seeps are significantly altered and are characterized by high viscosity and density values. Inactive hydrocarbon seeps constitute over 40% of known surface seeps worldwide [1,2,3,7,8].
Analyzed samples of surface hydrocarbon seeps can be divided into three groups based on the SA/SARA index value and the carbon isotopic composition of the whole seep (Figure 4). Fractional composition does not indicate strong degradation; the ratio of the sum of saturated and aromatic hydrocarbons to the content of all fractions ranges from 0.62 to 0.88 (Table 1). Group I includes most samples from the Silesian unit, among which the seep sample from the old Polana Ostre mine (sample 1) slightly stands out, with a high SA/SARA index and the highest δ13C value. This is the seep located closest to the Czarna deposit, whose crude oils were also characterized by a high value of δ13C. The II group samples include those with slightly lower (more negative) values of δ13C. These are samples taken from the Silesian unit at Płowce (sample 12) and from the Skole unit. Group III samples, with the highest content of saturated and aromatic fractions, include samples from the Magura unit and two samples from the Silesian Unit from Łopienka and Łubna (near Miejsce Piastowe), for which the SA/SARA index ranges from 0.74 to 0.85. This indicates that these samples may have been affected by secondary alteration due to contact with surface water and the atmosphere [17,18,19]. However, the SARA compositions of the oils are normal, as there was fresh oil charging later.
In the presented geochemical classification of seeps, the carbon isotopic composition of the whole seep was considered as a second criterion (Figure 4), with δ13C values varying from −26.3‰ to −27.7‰. Variability in the isotopic composition was also observed in crude oils accumulated in various deposits of the Silesian Unit [20,21,22,23]. These studies clearly confirm the division into the mentioned three groups. The most numerous Group I seeps are isotopically heavier, which could result from two factors: a higher degree of their degradation or a different source material. It is worth noting that the isotopically lightest samples taken from the Magura Unit and from the Silesian Unit from Płowce (sample 10) and Łopienka (sample 6) also show elevated sulfur contents ranging from 0.23 to 0.26%. Among the samples in group III with low δ13C values, there was also a sample taken from Łubno (sample 14) (near Miejsce Piastowe, between the folds of Potok and Bóbrka with numerous deposits).

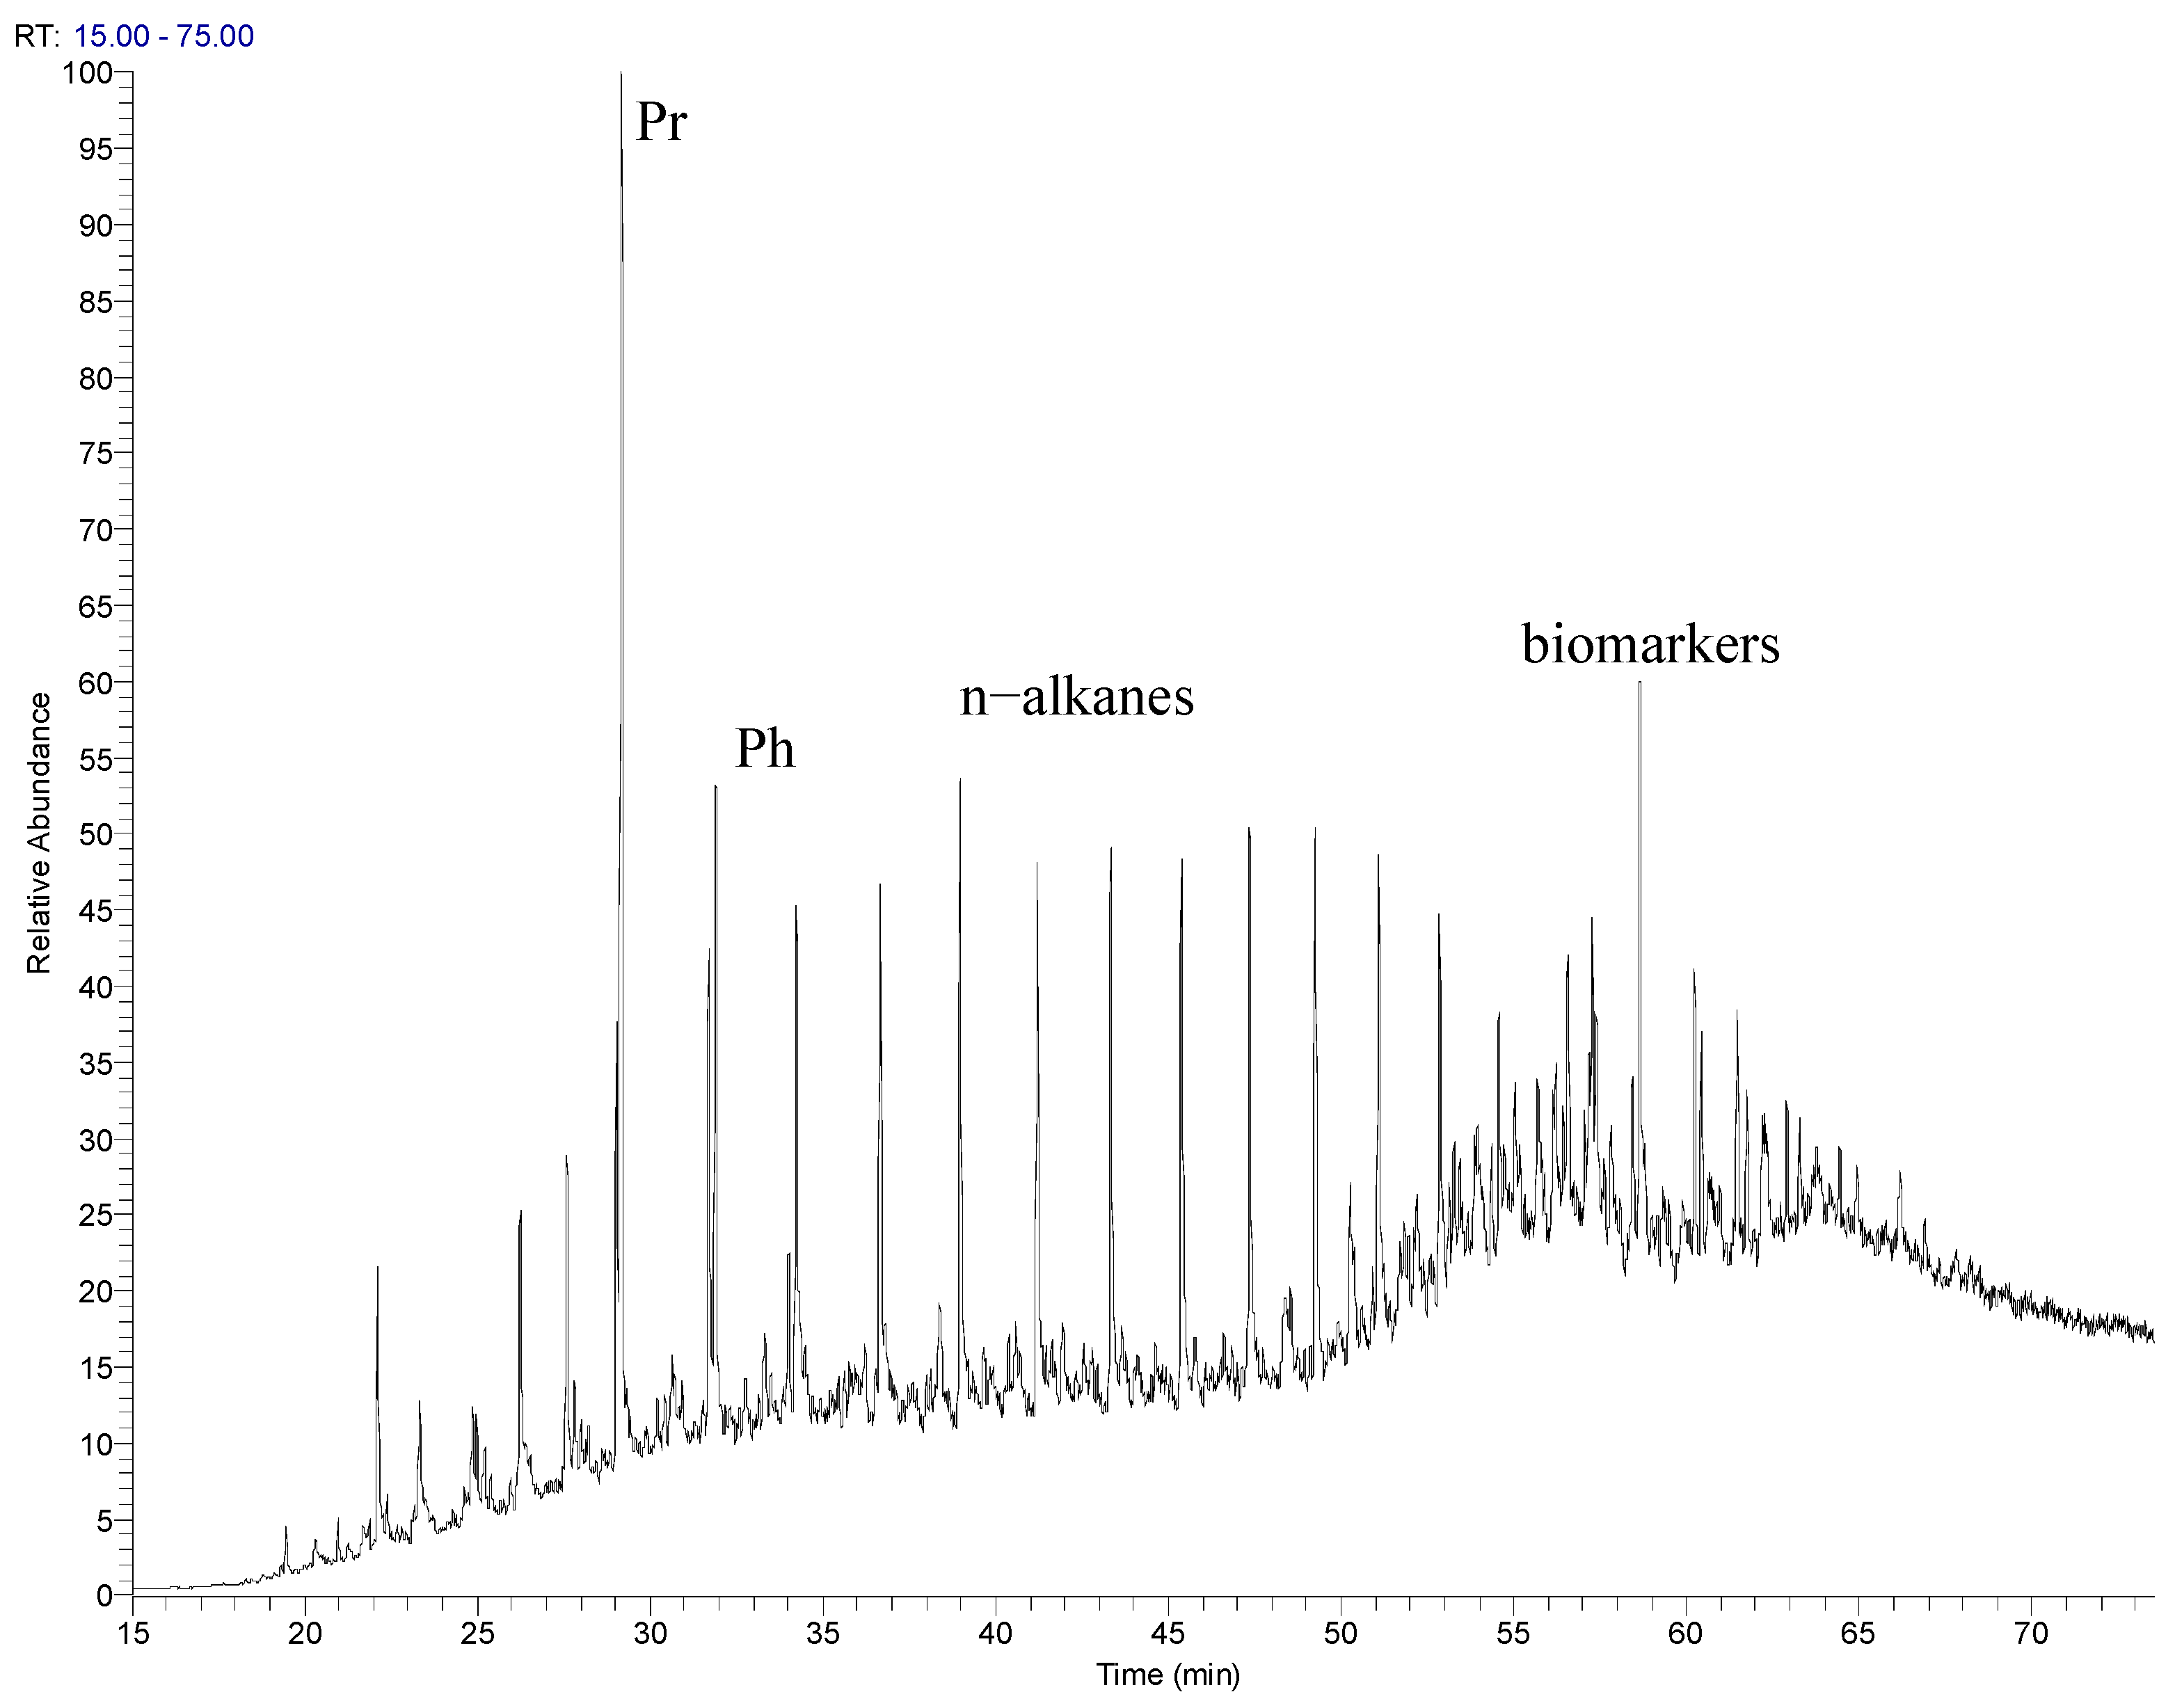
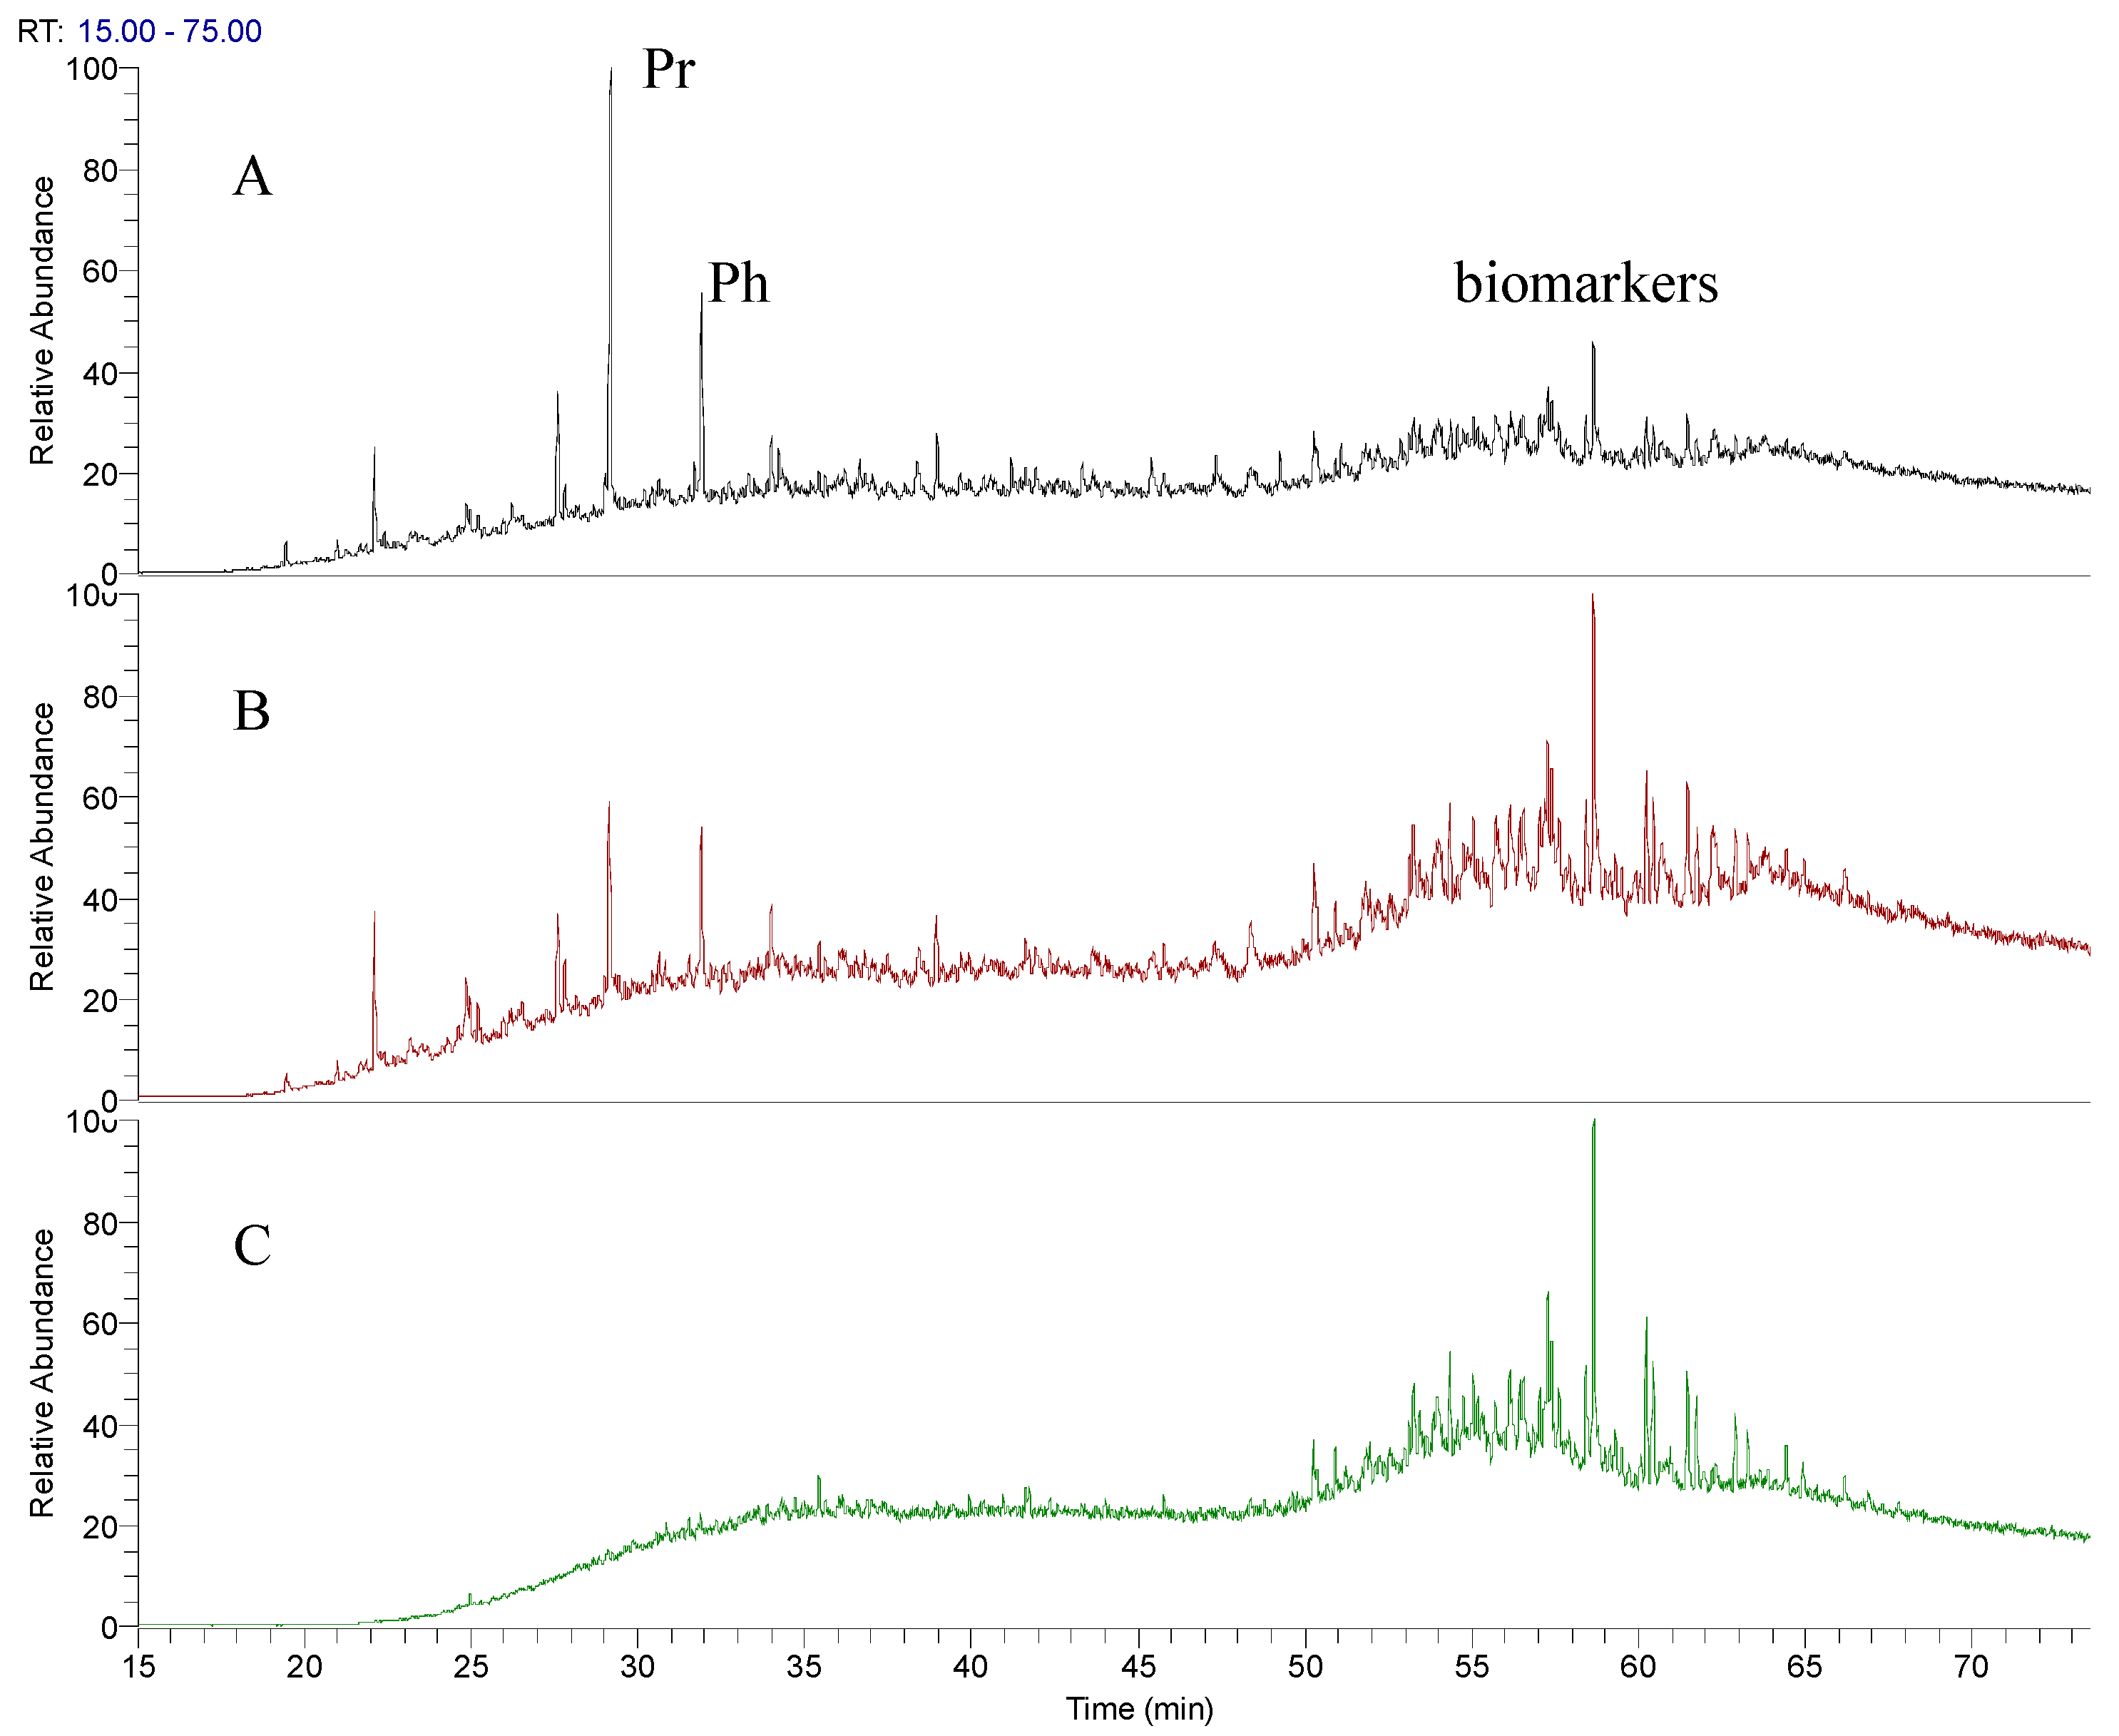
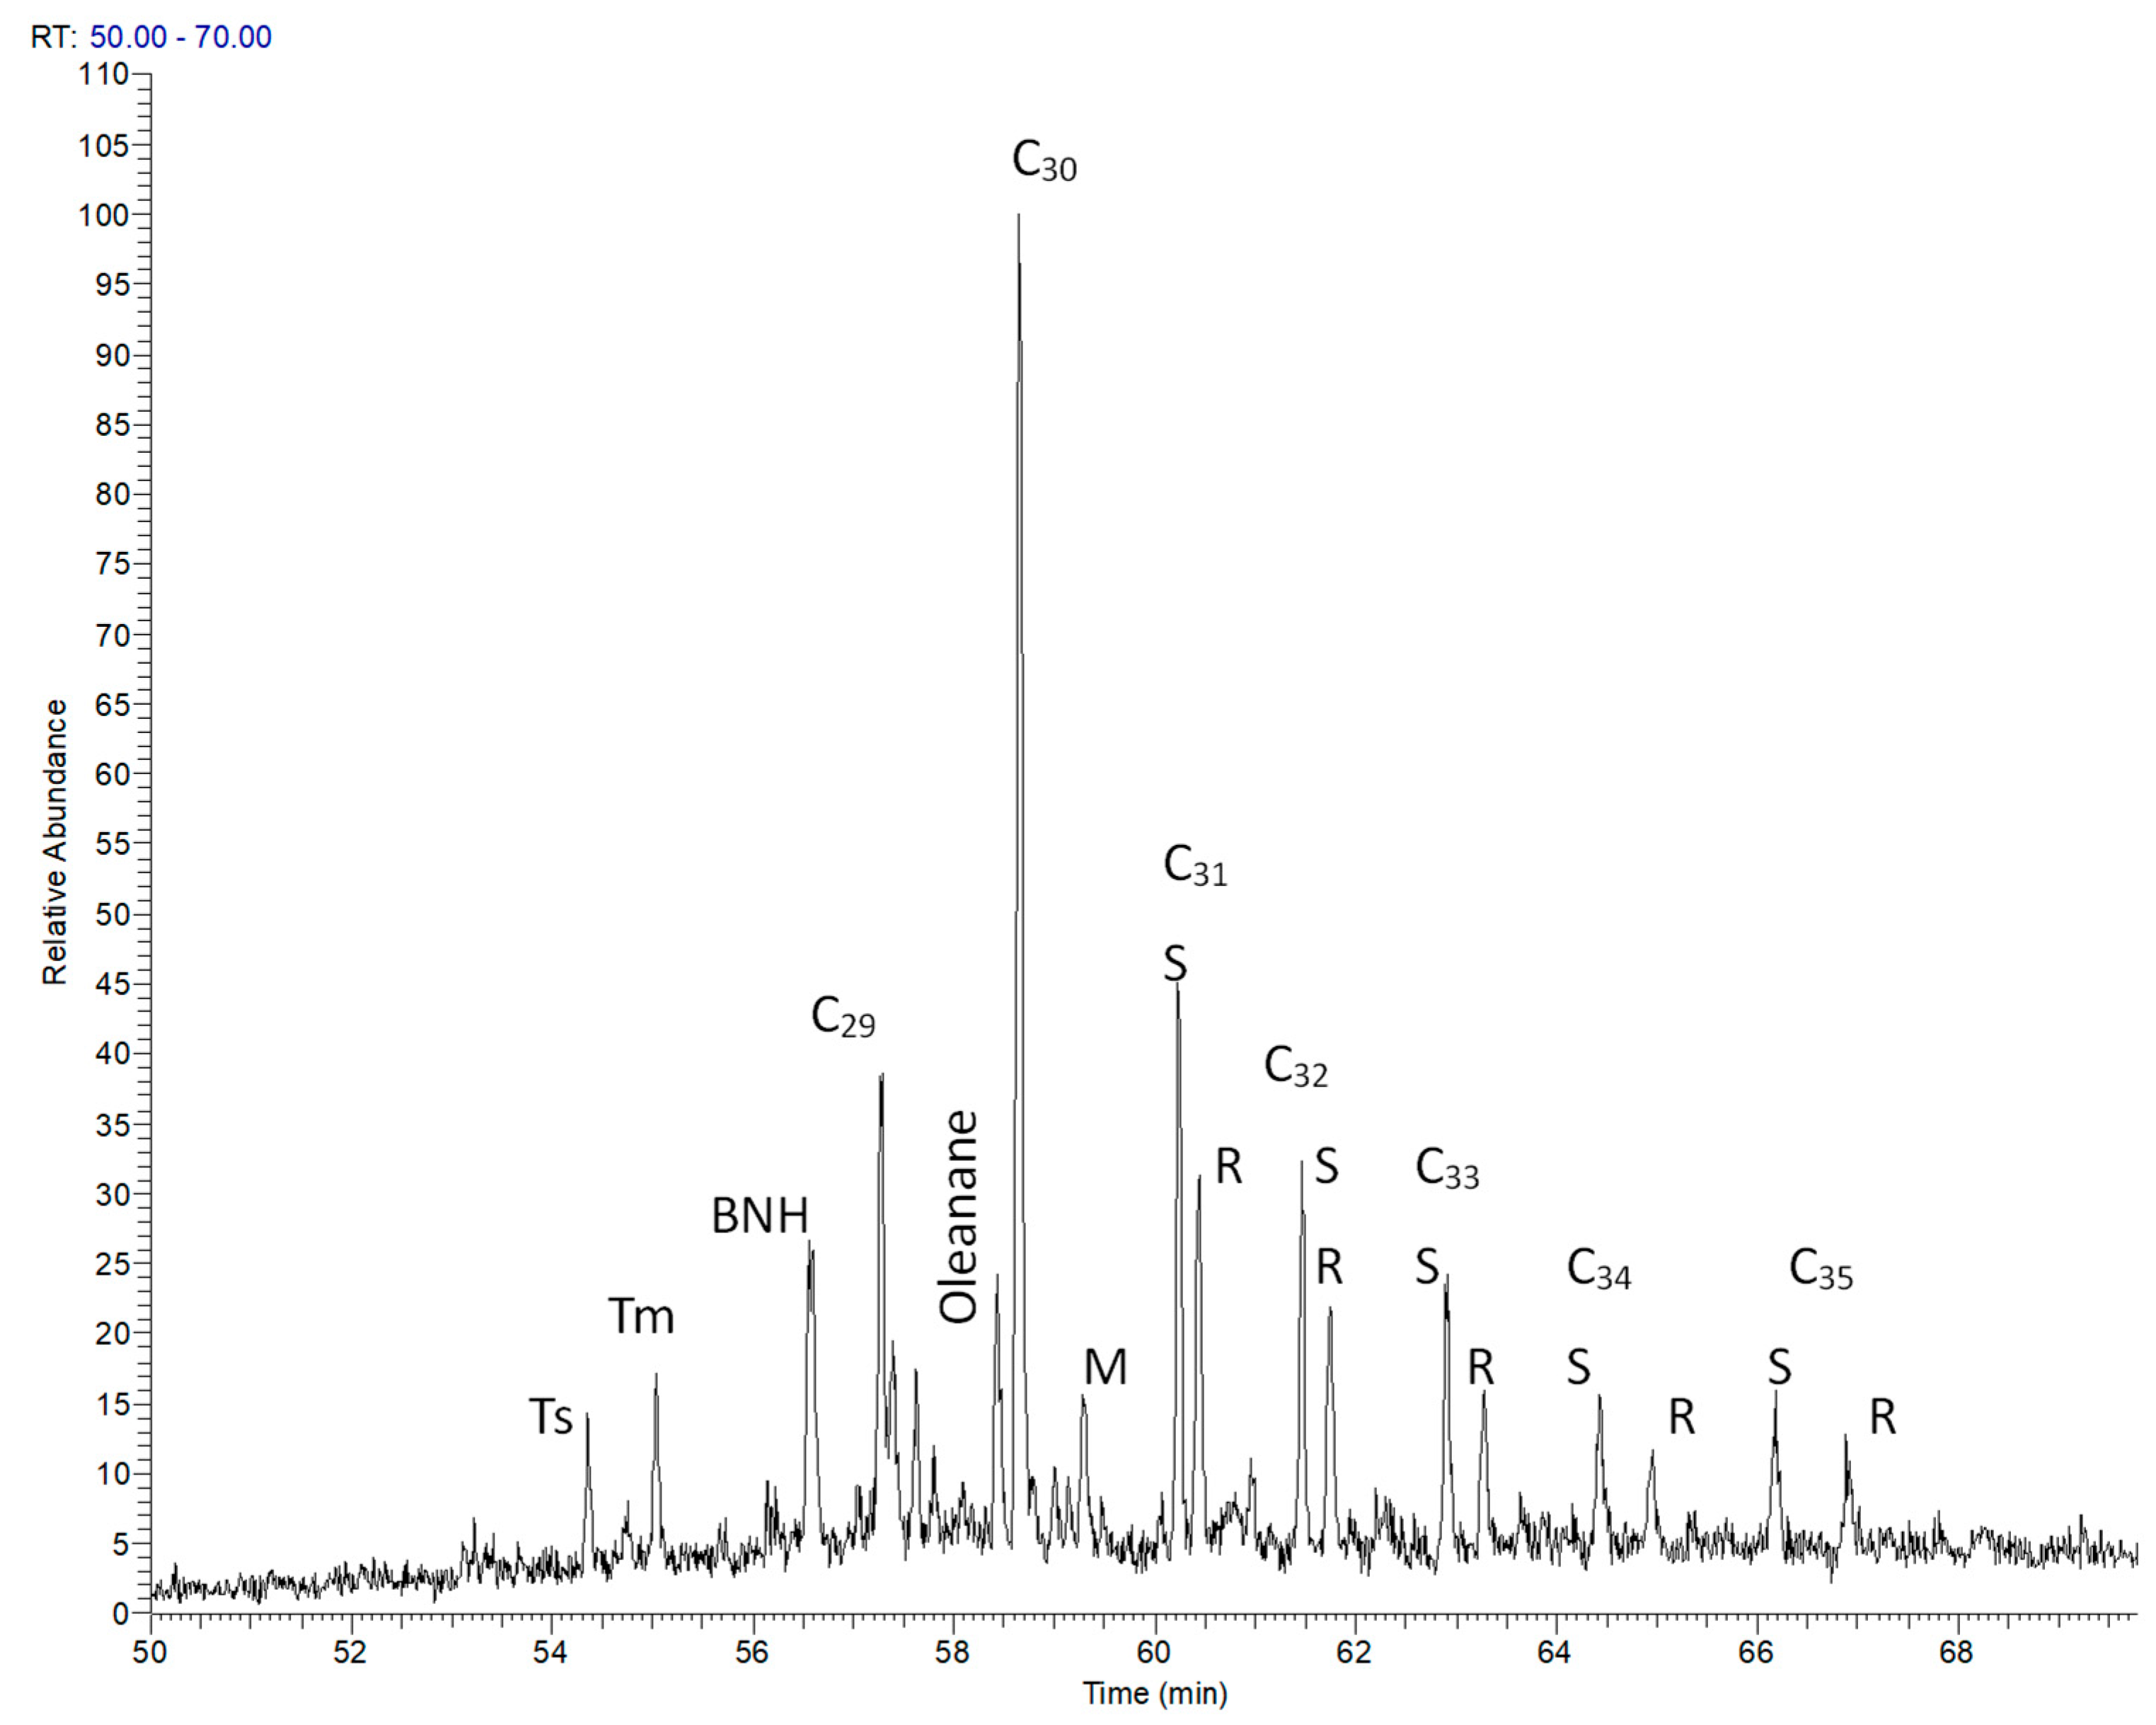
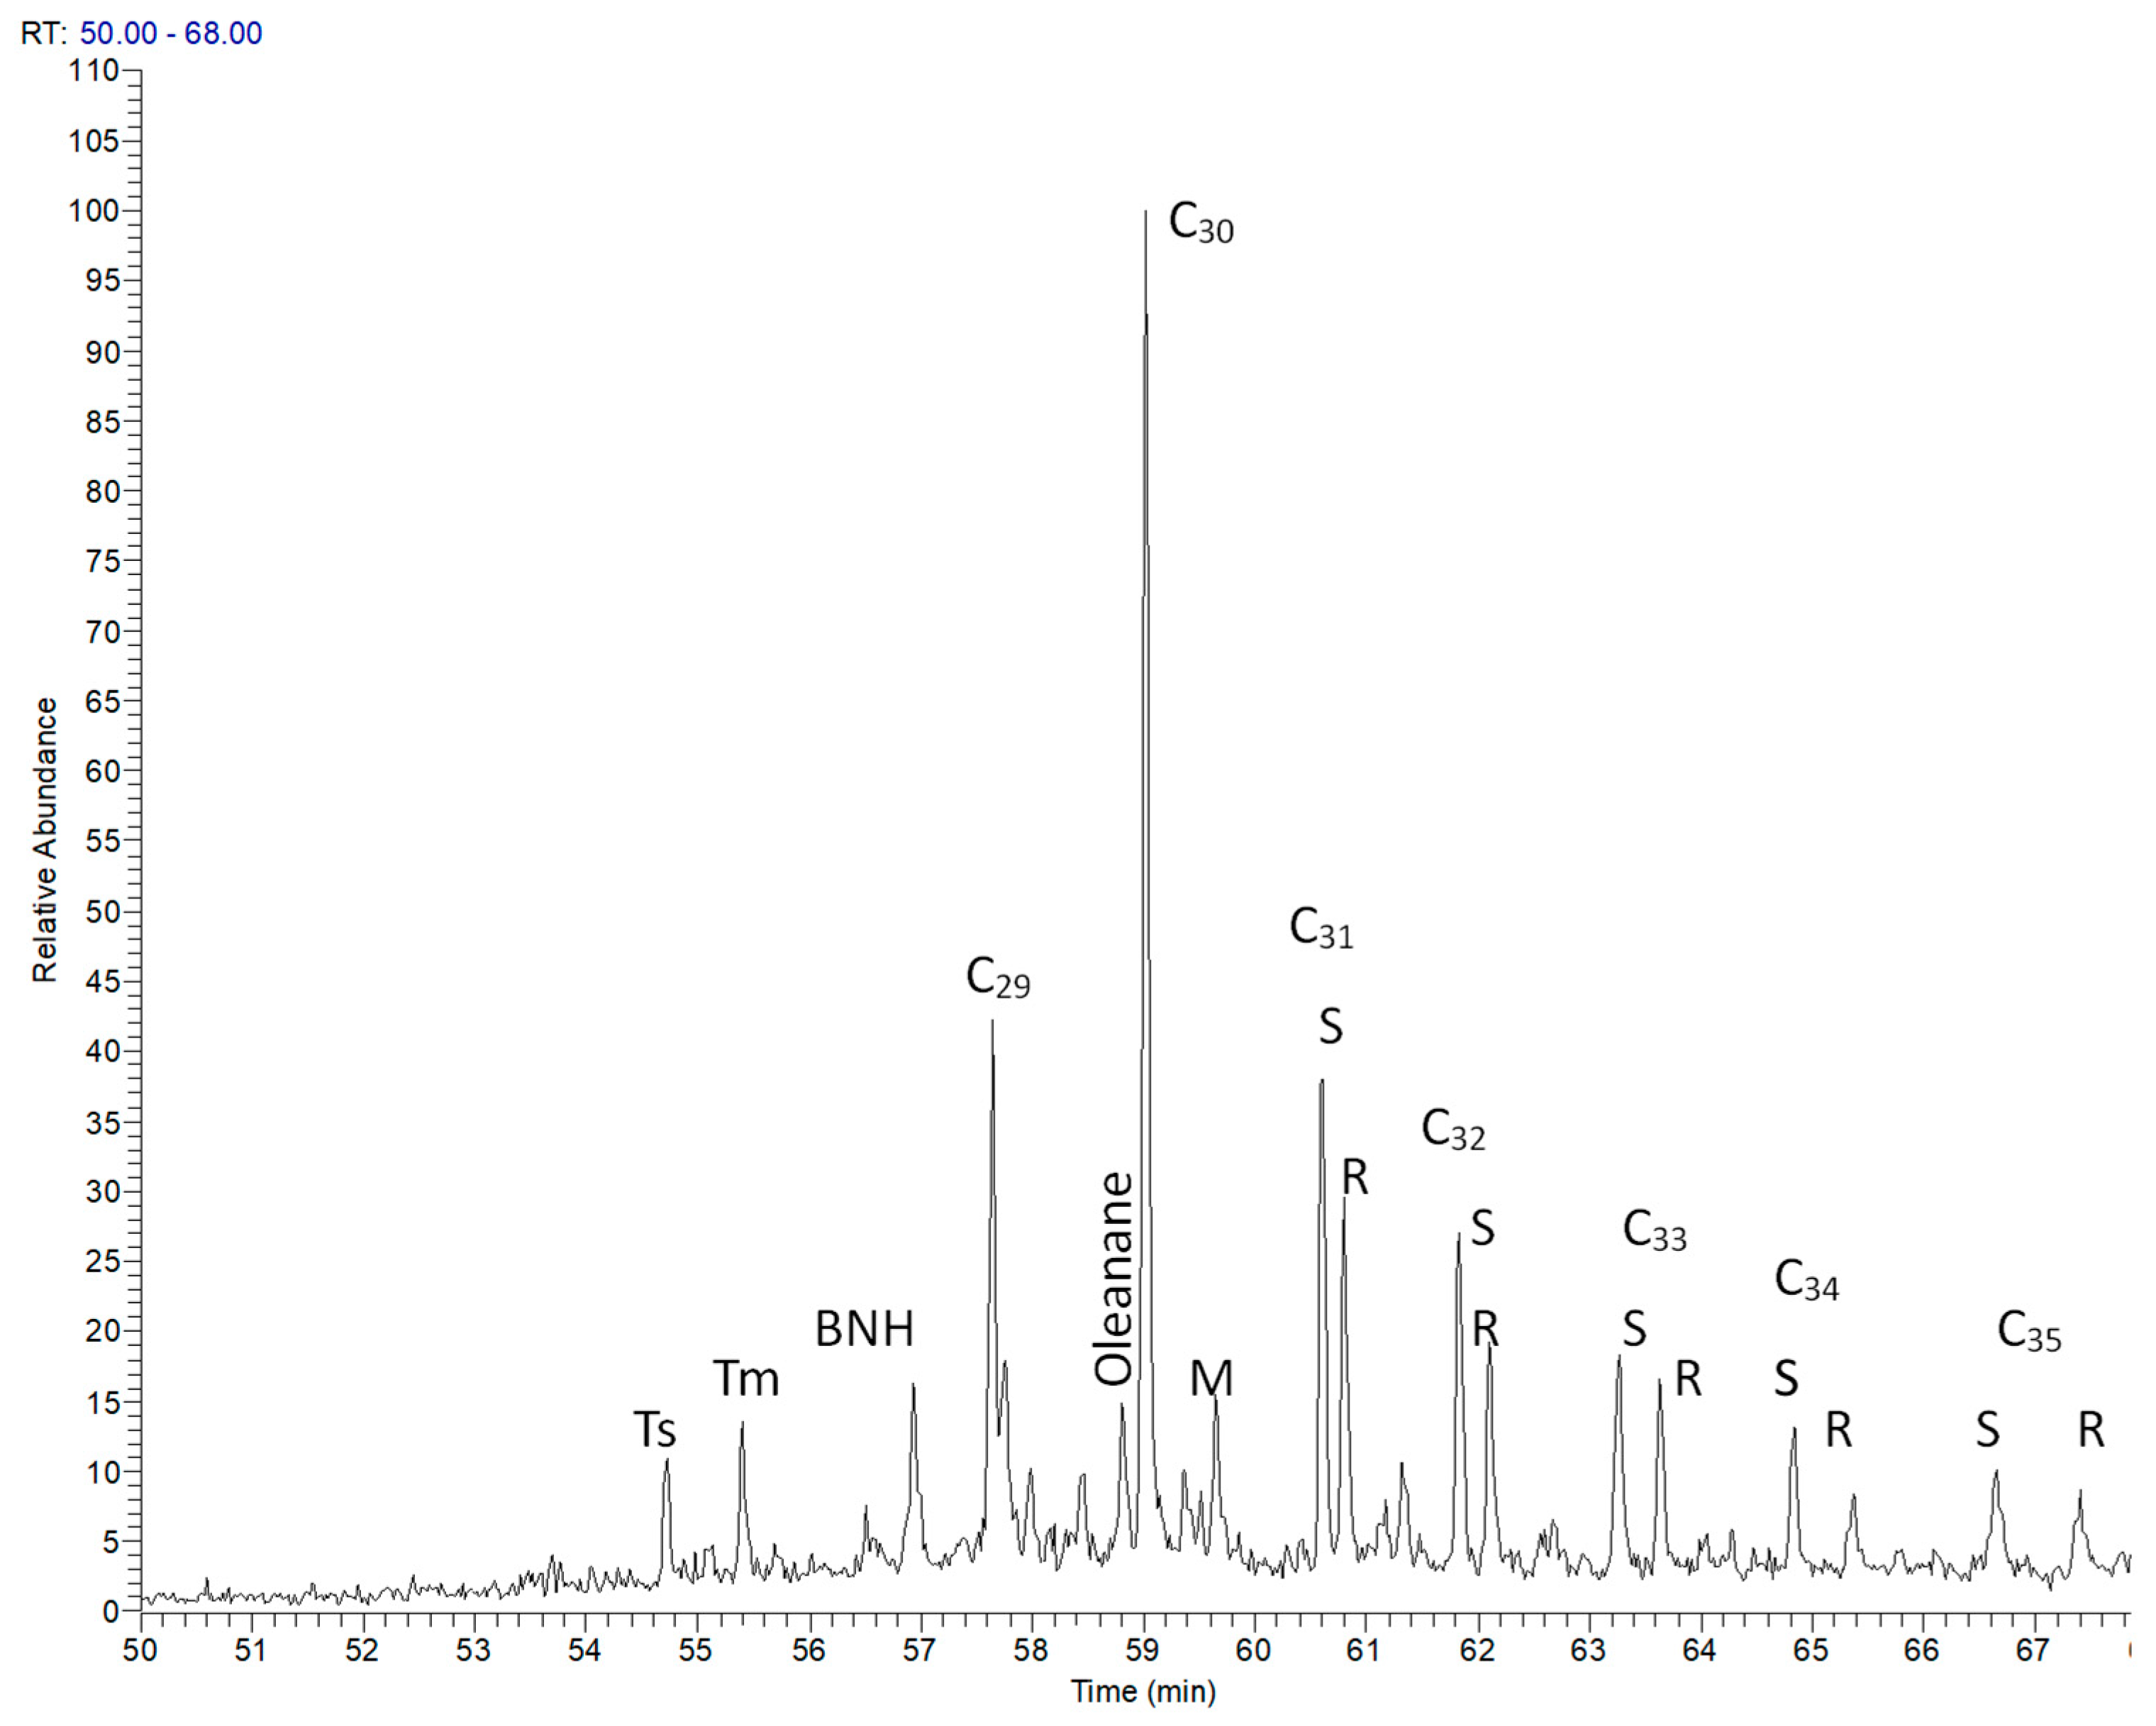
3.2. Molecular Composition

Most surface seep samples lack n-alkanes and isoprenoids (e.g., pristane and phytane) in their molecular composition, due to removal by secondary processes. This is not uniformly observed in all samples, as it is influenced by the type of seep and its location relative to the tectonic structure. The smallest impact of degradation processes was observed in the sample from Bandrów, from the Skole Unit, whose TIC mass chromatogram shows the full range of n-alkanes and isoprenoids (Figure 5).
In contrast, the greatest effect of secondary changes, manifested through the molecular composition, is observed in samples classified as Group I, from the marginal zone of the Silesian Unit (samples 2, 4, 8, and 9). In these samples, within the saturated fraction, only biomarkers from the hopane and sterane groups are present (Figure 6A–C).
Meanwhile, in Group III seeps located in the Magura and Silesian Units (sample 14), n-alkanes are absent, isoprenoids appear sporadically, and among the higher molecular weight hydrocarbons, biomarkers are also present.
This suggests that early oil biodegradation was followed by one or more overprinting oil-charging events [24]. This may reflect the location of these samples within fault zones in the study area that may have focused fluid flow [25]. This is common in complex petroleum systems characterized by multiple stages of hydrocarbon migration, accumulation, and alteration.
Analyzing the biomarker composition of both the saturated and aromatic fractions allows for assessing the genetic character of these samples and correlating them with crude oils and their source rocks. Thanks to the presence of biomarkers and their detailed analysis, it was possible to determine the genetic characteristics of the seeps, observed in various structural–tectonic positions of the Carpathians. Generally, as biodegradation of crude oils or seeps increases, the concentration of n-alkanes and isoprenoid alkanes decreases. Meanwhile, pentacyclic terpanes (m/z 191) and steranes (m/z 217) are relatively resistant to secondary alterations and can still be used for genetic studies [26,27,28].
Although differences were observed in the fractional and isotopic composition, as well as in the light hydrocarbon components, the biomarker composition remained consistent across all examined crude oil seep samples. The first and most noticeable difference in the composition of pentacyclic terpenes is the presence of BNH (bisnorhopane), which occurs only in a few seep samples, mainly from the Skole unit (in the Bandrowa sample (sample 7) and Stańkowa (sample 52)). However, in sample 15 from the northern part of the Skole unit on the Wara fold, BNH was absent.
The Bandrów sample uniquely contains n-alkanes ranging from n-C15 to n-C30 and isoprenoids—pristane and phytane. Both seeps from the Skole unit contain 25-norhopanes (m/z = 177), indicating biodegradation, despite the aforementioned presence of n-alkanes [29,30,31].
The discussed seep samples contain the full range of terpanes—from C29NH (norhopane) to C35H (homohopanes). Steranes are also present, dominated by those with 28 and 29 carbon atoms per molecule, suggesting a slightly lower contribution of marine substances in the source organic matter. Considering the observed degradation, it should be noted that only some biomarker groups can provide information about the source material of these seeps [32].
Seep samples from the Skole unit showed genetic features linking them to oils accumulated in the Łodyna–Wańkowa fold. Both the Stańkowa seep (sample 52) and Bandrowa seep (sample 7) show the lowest Ts/Tm ratios, presence of BNH, and oleanane (Table 2). Their genetic similarity is also evidenced by a similar sterane composition, dominated by C29 and C28, suggesting a dominance of terrestrial and algal material [33,34].
The most characteristic feature of the seeps and oils from the Łodyna–Wańkowa fold, in the hopane group, was the presence of BNH, alongside the dominant C30 hopane and C29 norhopane. This compound is associated with laminated limestone rocks, which are good source rocks, similar to the well-known Monterey shales (type II kerogen) [35,36,37]. Typically, this compound occurs in sediments where sulphide waters are present. Its presence also indicates bacterial activity in the destruction of organic matter during sedimentation, suggesting it took place in a relatively shallow basin. Bisnorhopane C28 presence may be associated with paleo-hydrocarbon seepage during sedimentation of the deposits [37,38].
In terms of the composition of αα and ββ isomers, as well as S and R, which reflect the degree of thermal transformation of the source material—both among steranes and hopanes—the samples from the Skole unit (Bandrow, Stańkowa, and Wara) exhibit the lowest maturity indices. The maturity indices calculated for the same samples from the aromatic fraction are slightly higher, with values for the Bandrowa sample of Rc1 = 0.64% and Rc2 = 0.69%, and significantly higher in the case of the Stańkowa seep, where RC2 reaches 0.82% [27,39].
Samples classified as group I from the Silesian Unit (Żłobek, Zdwórze, Uherce Mineralne, Zahutyń) have very similar biomarker composition, both in terms of maturity and genetics, indicating a single source. In this case, there is a clear increase in the share of marine material deposited under suboxic conditions, with a lower share of terrestrial material. The results of carbon isotopic composition studies show a shift towards the heavier isotope, close to the value of −26‰. Oleanane is present at a lower concentration than in the samples from the Skole Unit, and the Ol/C30hop ratio remains in the range of 0.18–0.19. The Ts/Tm ratio for these samples from the Silesian Unit is above one, ranging from 1.77 to 2.18. At the same time, these samples exhibited a high hopane-to-sterane ratio, ranging from 2.47 to 3.51. This indicates a predominance of prokaryotes over eukaryotes in the source material, which constitutes the source hydrocarbon substance appearing as seeps. The maturity indices for these samples are very similar, indicating the main phase of the oil window, where equilibrium is achieved in C31S/(S + R) homohopane epimers in the range of 0.54 to 0.58 and C29 ββ/(αα + ββ) in the range of 0.40 to 0.55. The sterane composition indicates an even contribution of terrestrial and marine material, with a slight dominance of marine substances (C27:C28:C29 = 37%:28%:35%) (Figure 7) [40].
The biomarker composition in seeps from the Magura Unit has slightly lower Ts/Tm ratio values (ranging from 0.72 to 1.93) compared to the previously discussed samples. This may be related to a different source material, assuming the same level of thermal maturity. These samples also show higher relative contents of terrestrial and lake-origin material (Table 2).
Table 2. Results of surface seep analyses—values of genetic indices calculated based on biomarker composition.
NumberPr/PhOleanane/
C30hop
Ts/TmBNH/C30hopC29NH/C30hopC31 S/(S + R)M/C30hopHop/SterS/(S + R)
C29αα
(Sterane)
ββ/(αα+ ββ)C29sterSteranes [%]MPI-1Rc1(MPI)MDRRc2(MDR)
272829
Silesian Unit
12.100.312.23N/A0.35
2N/A0.181.77N/A0.350.580.123.390.500.553826360.570.742.070.66
3N/A0.231.65N/A0.320.590.133.210.570.435519260.610.76N/AN/A
41.230.192.18N/A0.280.540.122.470.510.403728350.510.71N/AN/A
51.420.232.10N/A0.270.570.132.600.520.463432340.510.71N/AN/A
62.150.271.39N/A0.390.580.142.450.490.43373033N/AN/AN/AN/A
72.350.231.060.100.350.570.152.420.560.45303634N/AN/A6.460.98
82.300.301.150.090.360.260.152.460.530.46293140N/AN/A6.460.98
9N/A0.191.86N/A0.310.560.113.390.490.423728350.500.701.900.65
10N/A0.201.89N/A0.280.570.123.510.520.443329380.490.700.990.58
11N/A0.181.540.050.360.580.123.000.490.47213346N/AN/A2.770.71
121.880.161.95N/A0.340.560.122.950.470.583628360.740.851.770.64
131.880.210.990.070.360.560.153.100.460.412331460.490.701.730.63
142.060.220.970.070.390.560.142.140.380.33322939N/AN/A1.880.65
Skole Unit
152.000.170.610.030.490.570.112.670.560.53303931N/AN/A2.480.69
161.890.170.820.290.330.600.112.550.280.382936350.560.737.871.08
172.260.171.130.460.400.550.121.830.310.442737360.400.643.330.75
18N/A0.190.480.470.430.570.15N/A0.350.43273637N/AN/AN/AN/A
Magura Unit
191.720.260.720.300.520.540.150.370.390.37273835N/AN/A2.490.69
201.820.161.060.060.440.580.120.390.320.39283042N/AN/AN/AN/A
211.690.181.30N/A0.340.590.102.490.530.422835370.750.853.900.79
22N/A0.181.690.040.380.580.142.980.420.423136330.760.864.950.87
23N/A0.141.800.010.380.580.132.870.480.482939320.610.763.930.80
24N/A0.131.65N/A0.320.580.120.450.470.453030400.760.864.150.81
25N/A0.131.58N/A0.370.540.130.460.480.463031390.740.853.900.79
261.420.151.93N/A0.310.580.140.430.450.432532430.760.854.530.84
Pr/Ph—ratio between pristane and phytane, Oleanane/C30hop—ratio between oleanane and C30hopane, Ts/Tm—ratio between C2718α trisnorhopane and C2717α trisnorhopane, BNH/C30hop—ratio between bisnorhopane and C30hopane, C29NH/C30 Hop—C29 sterane/C30 hopane, C31 S/(S + R)—ratio between M/C30hop—ratio between moretane and C30hopane, Hop/Ster—C30hopane/ΣC29sterane, S/(S + R) C29αα (sterane)—epimerisation of regular steranes C29 ratio, ββ/(αα+ ββ)C29ster—ratio of bb−epimeres of regular steranes C29 to their total quantity, Steranes [%]—C27 = C27ααα 20Rsterane/(C27 + C28 + C29)ααα 20Rsteranesx100; C28 = C28ααα20Rsterane/(C27 + C28 + C29) ααα 20Rsteranesx100; C29 = C29ααα 20Rsterane/(C27 + C28 + C29) ααα 20Rsteranesx100, MPI-1 = 1.5(2 MP + 3 MP)/(Phen + 1 MP + 9 MP) [40]; MP—methylphenanthrene; Phen—phenanthrene, Rc1(MPI) = 0.6(MPI1) + 0.3, MDR = MDR = 4-MDBT/1-MDBT [40]; MDBT—methyldibenzothiophene, Rc2(MDR) = 0.073MDR + 0.51, N/A—not calculated due to low or missing biomarker content.

4. Discussion

The slight genetic variability of the analyzed natural seeps leads to the assumption that these seep samples may have different origins and are directly related to both discovered oil fields and the features of the tectonic structure.
The seeps from the Silesian Unit clearly show two sources of origin. The seeps from Płowce demonstrate a similar source of supply as the seeps in the Magura Unit. The seep from Łopienka shows many similarities in sterane group biomarkers with the seeps from the Skole Unit, where there is a balance among steranes C27, C28, and C29 (Figure 7).
Numerous oil seeps in the Skole Unit are present on the outcrops of folds, most commonly around Brzegi Dolne and Bandrów. In these cases, there appears to be a clear correlation with the deposits found in the Skole Unit along the Paszowa–Ropieńka–Wańkowa, Leszczowate, Łodyna, and Brzegi Dolne folds, within the Menilite beds (Kliwa sandstones). The deep structure of the internal synclinorium of the Skole Nappe has been explored by deep drilling (e.g., Brzegi Dolne IG-1, Paszowa-1, Kuźmina-1 and 2), showing that the deep structural elements contain source rocks. Although, so far, no industrial oil deposits have been found, and natural hydrocarbon manifestations occur sporadically. The seep in Bandrów is located within the Skole Unit in the lower Krosno Beds. Structurally, it is located on the southern limb of the Łodyna-mine anticline [41,42,43].
According to Link’s classification, this seep can be categorized as type 2, and its surface outflow is associated with the escape of hydrocarbons from in situ deposits that have become disintegrated. Cracking and deformation due to tectonic activity release small amounts of crude oil and natural gas to the surface.
From a geochemical perspective, this seep can be considered continuously active, showing a low degree of degradation and genetic characteristics similar to those of the oils from the Łodyna–Wańkowa deposit [20,23,34,44]. Figure 8 shows the location of the Bandrów seep against the background of the surface cross-section and its connection with the source rocks (Menilite Beds). In the northern part of this fold, a sample was also taken from Stańkowa (Figure 9), which represents the same tectonic system and was also compared with crude oils from the Łodyna field. In these accumulations, the Kliwa sandstones of the Skole series exhibit the highest productivity, with drastic variations in thickness and the number of sandy beds ranging from 1 to 15, and their total thickness reaching 270 m [16].
The crude oils accumulated in the Menilite Beds within the Skole unit belong to a single genetically similar group of oils. These are low-sulfur oils with sulfur content ranging from 0.21 to 0.45 [%w/w]. All belong to normal, paraffinic oils, generated in the first phase of the oil window, and, apart from water washing, show no signs of other secondary alterations (biodegradation) [20,27]. The maturity indicators have similar values to the active seep in Bandrów and correspond to the Ro scale range of 0.5 to 0.72%.
The evidence for early generation is supported by the high dominance of isoprenoids over corresponding n-alkanes [20,27] and the prevalence of hydrocarbons with an odd number of carbon atoms over those with an even number (CPI > 1). However, it should be noted that the maturity level is not the same for all oils, such as for the seeps from the northern part (Stańkowa) (Figure 9), where it is slightly higher (around 0.82% Rc2 according to MDR) and shows signs of degradation. Moreover, differences in the Pr/Ph ratio are observed among the analyzed oils from the Skole unit, reflecting variable depositional environment conditions from which these oils were generated. This variability is also observed for oils accumulated along the Wańkowa–Łodyna fold, from Paszowa, where Pr/Ph ranges from 0.83 to 1.15 [20,45], indicating the origin of these oils is from material deposited in a low-reductive or suboxic environment, to Brzegi Dolne, where there is a dominance of material deposited under oxic conditions. Such oxic conditions were identified in source rock samples from the southernmost part of the fold (archival studies). Due to the absence of isoprenoids in the Stańkowa sample, the homohopane ratio (C35/C34homohop) can be used to assess environmental conditions, as it also provides an evaluation of the redox conditions in the sedimentation environment, and in this case, it is higher than for the Bandrów sample. The above is consistent with the trend of changing oxidizing conditions among oils from the northern to the southern part of the fold. This observation may serve as a clue for determining the direction of surface seepage outflow from in situ deposits within the Menilite Beds [17,38]. Biomarker indicators confirm the validity of this assumption (Figure 10 and Figure 11, Table 2.)
Determining the thermal maturity of seeps is more problematic than for crude oils due to the degradation of aromatic compounds, which are used to calculate the MPI and MDR indices that indirectly indicate the degree of thermal alteration [39]. Although it was possible to determine a maturity parameter equivalent to 0.69% vitrinite reflectance for one of the Bandrów samples, the resolution level of aromatic (phenanthrene) compounds in the second seep from the Skole unit at Stańkowa (sample 18) was too low to assess thermal alteration. The thermal transformation estimates were based on the distribution of sulfur compounds, similar to the approach used for oils from the Łodyna–Wańkowa fold. It was found that the maturity is higher for the seep in Stańkowa, while it is lower and comparable to the Bandrów seep for the oils from Łodyna and Wańkowa. The activity of the Bandrów seep is indicated by the low degree of degradation, documented by the presence of n-alkanes and isoprenoids. Among the studied seeps, the Bandrów seep alone showed characteristics of a so-called flowing seep [1]. These two seeps from the Skole unit can be linked to oils from the Łodyna fold and considered to occur in situ within the Menilite Beds. These beds feed the deposit located deeper and are deformed due to tectonic events.
This is supported by the carbon isotopic composition, which is very similar for the seeps and oils (Figure 12). Greater differences occur in the saturated fraction, which may result from varying degrees of degradation [46].
Oil seeps in the southeastern part of the central Carpathian depression exhibit a somewhat different nature, as mentioned in the literature as early as the studies of J. Grzybowski [12,22].
Traces of crude oil and shallow wells within the Wara anticline, located west of the San River gorge, have been known since 1867. Later, drilling (Wara 1–3 and Wara 4–5) confirmed oil flows from depths of 360–400 m (Wara 4) and 520–720 m (Wara 3) [22].
The seep on the Wara fold (sample 15) appears to be related to migration along tectonic discontinuities, classified as type 2, for which it is difficult to establish a connection with a source. Attempts were made to genetically link this seep with oils from the Grabownica or Węglówka fields, but no clear correlation was found.
However, in terms of most genetic parameters and isotopic composition, it can be associated with seeps from the Skole unit. This seep does not contain BNH—a compound characteristic for all crude oils and source rocks of the Menilite Beds in this area—likely due to differing environmental conditions of the Menilite beds. Previous studies evaluating the genetic characteristics of these beds have demonstrated this [34,43,47].
The Płowce (samples 12, 13) and Zahutyń (samples 10, 11) seeps are located in thin- and medium-bedded sandstones within the lower Krosno Beds on the Zmiennica Sanok anticline (Figure 13). The axis of this fold dips southeastward, and the fold itself contains numerous internal folds. These seeps appear to be associated with migration along faults, directly from source rocks. These seeps are difficult to unequivocally correlate with specific oil deposits. Nevertheless, some parameters suggest a connection between the Płowce seep and crude oil from the Turze Pole field (Ryszoldo).
Another type of seepage is represented by the sample taken in the area of outcrops of Oligocene formations, in the region of Miejsce Piastowe (Łubno, sample 14, Figure 14) in the Silesian unit, specifically in the lower Krosno beds. This fragment is classified as part of the Jasło-Sanok Basin. A series of tectonic planes—thrusts—is visible. One example of this type of tectonics is interpreted based on seismic data and terrain morphology analysis, as well as structural data, as the detachment of the Żółków-Wrocanka Fold (Miejsce Piastowe). The detachment plane, together with adjacent structures, constitutes an analogous element visible in the Potok Fold.
The genetic character of this seep was attempted to be correlated with the oils present in the Bóbrka fold, but genetic parameters do not support a positive correlation.
In this case, hydrocarbon migration also occurs along the thrust, which, according to Link, is classified as Type 2, in a compressional oil basin.
Most likely, a different source, to which we can attribute surface seepages, should be assigned to hydrocarbons from the Magura unit (Ropianka and Siary).
The Ropianka seepage is located in the marginal part of the Magura unit on a structure called the Ropianka-Barwinek Scale or the Ropianka Anticline [22]. The profile begins with Upper Cretaceous-Paleocene inoceramid beds. Above them lies a profile of variegated shales (Paleocene-Eocene), which then transition into Eocene deposits of the sub-Magura beds, and the profile ends with Oligocene sandstones from Wątkowa. Due to the overthrust of the Magura unit, this structure transitions into the subdivisions of the Dukla unit within the Mszana syncline (Figure 15). In this region, there was an oil mine already mentioned during the interwar period. Oil occurred in several sandstone levels of the upper Inoceramian beds, called Ropianiec beds. It was paraffinic oil with dissolved gas [47].
The analyzed oil seeps in Ropianka are characterized by lower values of the Pr/Ph ratio sedimentary environment indices. It is important to note that the calculated values may be subject to error due to the very low overall isoprenoid content, resulting from secondary alterations (degradation). Genetic distinctness is expressed by a lower share of terrestrial-type substances in the source material (ol/C30hop < 0.2), lighter isotopic composition, and dominance of lake-origin material [48,49,50,51]. These seeps are also characterized by higher maturity indices calculated from the composition of biomarkers in the aromatic fraction. No presence of bisnorhopane was detected in these samples. The presence of this compound is particularly characteristic of oils and source rocks whose origin is related to chemoautotrophic bacteria that thrive in the anoxic–oxic transition zone [37,52,53,54].
Genetic distinctiveness can clearly be seen in classification diagrams concerning the composition of biomarkers in individual compound groups and in the isotopic composition (Figure 16 and Figure 17). In this case, genetic features such as the isotopic composition were compared with values characterizing oils from deposits accumulated in the Dukla unit. A high genetic similarity was found with oil from Stara Wieś. Therefore, the deposits of the Dukla unit migrate through thrust zones to the surface from old depleted deposits. Their source rocks could have been the source rocks identified in the Dukla unit [55].
For all seepage samples, a comparative analysis was performed using classification diagrams, taking into account both the isotopic composition of individual fractions and the composition of present biomarkers responsible for maturity and source material (Figure 18, Figure 19 and Figure 20). Based on these diagrams, the seeps are divided into three genetic groups, which confirms the observations presented in the discussion of results.

5. Conclusions

Studies of seeps are mainly significant on the regional scale of oil basins. The relationship between visible hydrocarbon seeps in the three tectonic units of the Carpathians and commercial subsurface deposits was analyzed by examining the distribution of documented seeps on surface cross-sections and in relation to the geological structure of their occurrence area.
Genetic analysis of 26 hydrocarbon seepage samples from the Carpathians indicates that these seepages exhibit minor variation in both the stage of hydrocarbon generation and the type of organic matter that served as the source for the petroleum accumulations. Three genetic types were distinguished, which can be attributed to the location of crude oil deposits.
  • The first type includes seepages from the Skole unit, originating from the source material of the Menilite Beds, where C29 and C28 steranes dominate, suggesting the presence of terrestrial and algal material deposited in an oxic and suboxic environment in the presence of sulphide waters (correlation with oils in the Łodyna Wańkowa fold).
  • The second type consists of seeps from the Magura unit, which is isotopically the lightest and has a higher share of marine material with a low bacterial content, similar to the Menilites from the Dukla unit. These are seeps with a high thermal maturity index.
  • The third type includes seeps from the Silesian unit, with a higher proportion of terrestrial material deposited in a suboxic or oxic environment in the deeper part of the basin, without the presence of bisnorhopane, but with a predominance of prokaryotes over eukaryotes. The nature of these seeps is more diverse, which may indicate an additional, different source of supply than the Menilite Beds. They can be locally associated with oils in the Potok, Grabownica folds, or the Czarna deposit.
Tectonically, most of the 26 examined seeps can be classified according to Link’s classification as type 2, which is associated with compressive tectonics that caused the deformation of structural facies traps.
  • The most characteristic seep is Bandrów (type 2) in the Skole unit. It is the only seep that can be described as “flowing”.
  • According to this classification, the fourth type of seep can be attributed to seeps from Ropianka in the Magura unit, where seep surfaces are located at outcrops of tectonic discontinuities.
After locating the seeps on cross-sections and conducting a thorough geochemical analysis, it can be concluded that at least two generations of hydrocarbons occurred in the Carpathians, and the later generation refilled the same traps that were previously destroyed by tectonic activity, especially in the central Carpathian depression.

Author Contributions

Conceptualization, I.M.; Formal analysis, W.B. and M.J.; Investigation, W.B. and M.J.; Writing—review & editing, I.M. and M.J.; Visualization, A.W.-O.; Supervision, I.M.; Project administration, I.M.; Funding acquisition, W.B. All authors have read and agreed to the published version of the manuscript.

Funding

This work is based on project INGA INNKARP “Development of an innovative concept of hydrocarbon exploration in the deep structures of the Outer Carpathians” (POIR.04.01.01-00-0006/18-00) financed by the National Centre for Research and Development and PGNiG S.A.

Data Availability Statement

All data is available in this article.

Acknowledgments

The authors would like to acknowledge Leszek Jankowski, Adam Kozłowski, Aleksander Gąsienica, and Piotr Dziadzio for valuable discussions and preparation of surface cross-sections.

Conflicts of Interest

The authors declare that they have no known competing financial interests or personal relationships that could have appeared to influence the work reported in this paper.

References

  1. Abrams, M.A. Significance of hydrocarbon seepage relative to petroleum generation and entrapment. Mar. Pet. Geol. 2005, 22, 457–477. [Google Scholar] [CrossRef]
  2. Logan, G.A.; Jones, A.T.; Kennard, J.M.; Ryan, G.J.; Rollet, N. Australian offshore natural hydrocarbon seepage studies, a review and re-evaluation. Mar. Pet. Geol. 2010, 27, 26–45. [Google Scholar] [CrossRef]
  3. Galarraga, F.; Urbani, F.; Escobar, M.; Márquez, G.; Martínez, M.; Tocco, R. Main factors controlling the compositional variability of seepage oils from Trujillo state, Western Venezuela. J. Pet. Geol. 2010, 3, 255–268. [Google Scholar] [CrossRef]
  4. Ionescu, A.; Burrato, P.; Baciu, C.; Etiope, G.; Kis, B.M. Inventory of Onshore Hydrocarbon Seeps in Romania (HYSED-RO Database). Geosciences 2017, 7, 39. [Google Scholar] [CrossRef]
  5. Alzaga-Ruiz, H.; Lopez, M.; Roure, F.; Seranne, M. Interactions between the Laramide Foreland and the passive margin of the Gulf of Mexico: Tectonics and sedimentation in the Golden Lane area, Veracruz State, Mexico. Mar. Pet. Geol. 2009, 26, 951–973. [Google Scholar] [CrossRef]
  6. Clarke, R.; Cleverly, R. Petroleum seepage and post-accumulation migration. Geol. Environ. Sci. Geol. Soc. Lond. Spec. Publ. 1991, 59, 265–271. [Google Scholar] [CrossRef]
  7. Link, W.K. Significance of oil and gas seeps in world oil exploration. Bull. AAPG 1952, 36, 1505–1540. [Google Scholar]
  8. Duncan, S. Macgregor. Relationships between seepage, tectonics and subsurface petroleum reserves. Mar. Pet. Geol. 1993, 10, 606–619. [Google Scholar]
  9. Piggott, N.; Abrams, M.A. Near surface coring in the Beaufort and Chukchi Seas. In Hydrocarbon Migration and Its Near Surface Effects; Schumacher, D., Abrams, M.A., Eds.; American Association of Petroleum Geologist Memoir: Tulsa, OK, USA, 1996; Volume 66, pp. 385–400. [Google Scholar]
  10. Tocco, R.; Escobar, M.; Ruggiero, A.; Galarraga, F. Geochemistry of oil seeps and rock samples of the Early Tertiary section from the North Andean of the Venezuelan Andes. Org. Geochem. 1995, 23, 311–327. [Google Scholar] [CrossRef]
  11. Heggland, R. Gas seepage as an indicator of deeper prospective reservoirs. A study based on exploration 3-D seismic data. Mar. Pet. Geol. 1998, 15, 1–9. [Google Scholar] [CrossRef]
  12. Kuśmierek, J. Ewolucja a ropogazonośność Karpat polskich. Pr. Geol. PAN 1995, 138, 190. [Google Scholar]
  13. Ślączka, A. Stratygrafia serii śląskiej łuski Bystrego na południe od Baligrodu. Biul. Inst. Geol. 1959, 131, 251–286. [Google Scholar]
  14. Konarski, E. Wgłębna Budowa Karpackiej Pokrywy Fliszowej w Rejonie Gorlicko-Krośnieńskim; Wydawnictwa Geologiczne: Warsaw, Poland, 1980. [Google Scholar]
  15. Żytko, K.; Gucik, S.; Ślączka, A. Przewodnik Geologiczny po Wschodnich Karpatach Fliszowych; Wydawnictwa Geologiczne: Warsaw, Poland, 1973. [Google Scholar]
  16. Kuśmierek, J.; Semyrka, R. Zmienność cech zbiornikowych przestrzeni porowo-szczelinowej piaskowców karpackich i ich kwalifikacja naftowa. Przegląd Geol. 2003, 9, 51. [Google Scholar]
  17. Peters, K.E.; Walters, C.C.; Moldowan, J.M. The biomarker guide. In Biomarkers and Isotopes in Petroleum Exploration and Earth History, 2nd ed.; Cambridge University Press: Cambridge, UK, 2005. [Google Scholar]
  18. England, W.A.; Mackenzie, A.S.; Mann, D.M.; Quigley, T.M. The movement and entrapment of petroleum fluids in the subsurface. J. Geol. Soc. 1987, 144, 327–347. [Google Scholar] [CrossRef]
  19. Masterson, W.D.; Dzou, L.I.P.; Holba, A.G.; Fincannon, A.L.; Ellis, L. Evidence for biodegradation and evaporative fractionation in West Sak, Kuparuk and Prudhoe Bay field areas, North Slope, Alaska. Org. Geochem. 2001, 32, 411–441. [Google Scholar] [CrossRef]
  20. Więcław, D.; Bilkiewicz, E.; Kotarba, M.J.; Lillis, P.G.; Dziadzio, P.S.; Kowalski, A.; Kmiecik, N.; Romanowski, T.; Jurek, K. Origin and secondary processes in petroleum in the eastern part of the Polish Outer Carpathians. Int. J. Earth Sci. 2020, 109, 63–99. [Google Scholar] [CrossRef]
  21. Karnkowski, P. Złoża gazu ziemnego i ropy naftowej w Polsce. T. 2. In Karpaty i Zapadlisko Przedkarpackie; Towarzystwo Geosynoptyków Geos AGH: Kraków, Poland, 1993. [Google Scholar]
  22. Karnkowski, P.; Konarski, E. Katalog złóż ropy naftowej i gazu ziemnego w Polsce. In Karpaty; Wydawnictwa Geologiczne: Warsaw, Poland, 1973. [Google Scholar]
  23. Kotarba, M.J.; Koltun, Y.V. The origin and habitat of hydrocarbons of the Polish and Ukrainian Parts of the Carpathian Province. Am. Ass. Petrol. Geol. Mem. 2006, 84, 395–442. [Google Scholar]
  24. Zhang, J.; Cao, J.; Wang, Y.; Li, J.; Hu, G.; Zhou, N.; Shi, T. Geochemistry and Genesis of Oil and Gas Seeps in the Junggar Basin, NW China: Implications for Hybrid Petroleum Systems. Geofluids 2019, 2019, 1–26. [Google Scholar] [CrossRef]
  25. Liu, Y.; Wu, K.; Wang, X.; Liu, B.; Guo, J.; Du, Y. Architecture of buried reverse fault zone in the sedimentary basin: A case study from the Hong-Che fault zone of the Junggar Basin. J. Struct. Geol. 2017, 105, 1–17. [Google Scholar] [CrossRef]
  26. Mackenzie, A.S. Application of biological markers in petroleum geochemistry. Adv. Pet. Geochem. 1984, 1, 115–214. [Google Scholar]
  27. Matyasik, I. Biomarkery w Charakterystyce Genetycznej Systemów Naftowych; Prace INiG-PIB: Kraków, Poland, 2011; 220p, ISSN 0209-0724. nr 177. [Google Scholar]
  28. Palmer, S. Effect of water washing on C15+ hydrocarbon fraction of crude oils from northwest Palawan, Philippines. Am. Ass. Petrol. Geol. Bull. 1984, 68, 137–149. [Google Scholar]
  29. Moldowan, J.M.; Seifert, W.K.; Gallego, S.E.J. Relationship between petroleum composition and depositional environment of petroleum source rocks. Am. Ass. Petrol. Geol. Bull. 1985, 69, 1255–1268. [Google Scholar]
  30. Palmer, S.E. Effect of biodegradation and water washing on crude oil composition. In Organic Geochemistry; Engel, M.H., Macko, S.A., Eds.; Plenum Press: New York, NY, USA, 1993; pp. 511–533. [Google Scholar]
  31. Peters, K.E.; Moldowan, J.M. Effects of source, thermal maturity, and biodegradation on the distribution and isomerization of homohopanes in petroleum. Org. Geochem. 1991, 17, 47–61. [Google Scholar] [CrossRef]
  32. Didyk, B.M.; Simoneit, B.R.T.; Brassell, S.C.; Eglinton, G. Organic geochemical indicators of palaeoenvironmental conditions of sedimentation. Nature 1978, 272, 216–222. [Google Scholar] [CrossRef]
  33. Kruge, M.A.; Mastalerz, M.; Solecki, A.; Stankiewicz, B.A. Organic geochemistry and petrology of oil source rocks, Carpathian Overthrust region, southeastern Poland—Implications for petroleum generation. Org. Geochem. 1996, 24, 897–912. [Google Scholar] [CrossRef]
  34. Köster, J.; Kotarba, M.; Lafargue, E.; Kosakowski, P. Source rock habitat and hydrocarbon potential of Oligocene Menilite Formation (Flysch Carpathians, Southeast Poland): An organic geochemical and isotope approach. Org. Geochem. 1998, 29, 543–558. [Google Scholar] [CrossRef]
  35. Curiale, J.A.; Odermatt, J.R. Short-term biomarker variability in the Monterey Formation, Santa Maria Basin. Org. Geochem. 1988, 14, 1–13. [Google Scholar] [CrossRef]
  36. Curiale, J.A.; Bromley, B.W. Migration of petroleum into Vermilion field, Gulf Coast, USA-Molecular evidence. Org. Geochem. 1996, 24, 563–579. [Google Scholar] [CrossRef]
  37. Dahl, B. The use of bisnorhopane as a stratigraphic marker in the Oseberg Back Basin, North Viking Graben, Norwegian North Sea. Org. Geochem. 2004, 35, 1551–1571. [Google Scholar] [CrossRef]
  38. Killops, S.D.; Massoud, M.S.; Scott, A.C. Biomarker characterization of an oil and its possible source rock from offshore Korea Bay Basin. Appl. Geochem. 1991, 6, 143–157. [Google Scholar] [CrossRef]
  39. Peters, K.E.; Moldowan, J.M. The Biomarker Guide: Interpreting Molecular Fossils in Petroleum and Ancient Sediments; Prentice-Hall: Englewood Cliffs, NJ, USA, 1993. [Google Scholar]
  40. Radke, M. Application of aromatic compounds as maturity indicators in source rocks and crude oils. Mar. Petrol. Geol. 1988, 5, 224–236. [Google Scholar] [CrossRef]
  41. Czochanska, Z.; Gilbert, T.D.; Philp, R.P.; Sheppard, C.M.; Weston, R.J.; Wood, A.D.; Woolhouse, A.D. Geochemical application of sterane and triterpane biomarkers to a description of oils from the Taranaki Basin in New Zealand. Org. Geochem. 1988, 12, 123–135. [Google Scholar] [CrossRef]
  42. Borys, Z. Aktualne problemy poszukiwań węglowodorów we wschodniej części przedgórza Karpat. Przeg. Geol. 1996, 44, 1019–1023. [Google Scholar]
  43. Curtis, J.B.; Kotarba, M.J.; Lewan, M.D.; Więcław, D. Oil/source rock correlations in the Polish Flysch Carpathians and Mesozoic basement and organic facies of the Oligocene Menilite Shales: Insights from hydrous pyrolysis experiments. Org. Geochem. 2004, 35, 1573–1596. [Google Scholar] [CrossRef]
  44. Koltun, Y.V. Organic matter in Oligocene Menilite Formation rocks of the Ukrainian Carpathians: Palaeoenvironment and geochemical evolution. Org. Geochem. 1992, 18, 423–430. [Google Scholar] [CrossRef]
  45. Bieleń, W.; Janiga, M. Zastosowanie badań izotopowych do określania pochodzenia wybranych biomarkerów. Naft. Gaz. 2022, 5, 336–342. [Google Scholar] [CrossRef]
  46. Sofer, Z. Stable carbon isotopic compositions of crude oils: Application of the source depositional environments and petroleum alteration. Am. Ass. Petrol. Geol. Bull. 1984, 68, 31–49. [Google Scholar]
  47. Dziadzio, P.; Jankowski, L.; Kopciowski, R.; Maksym, A.; Matyasik, I. Geologia jednostki śląskiej (wybrane elementy—Potencjalnej strefy do przyszłych poszukiwań naftowych. Elementy systemu naftowego od skały macierzystej do pułapki—Wybrane przykłady z obrębu jednostki śląskiej. In Materiały Konferencyjne LXXV Zjazdu Naukowego PTG; Dziadzio, P., Uchman, A., Eds.; Państwowy Instytut Geologiczny: Jasło, Kraków, Poland, 2004; pp. 153–162. ISBN 83-7372-740-X. [Google Scholar]
  48. Moldowan, J.M.; Fago, F.J.; Huizinga, B.J.; Jacobson, S.R. Analysis of oleanane and its occurrence in Upper Cretaceous rocks. In Organic Geochemistry. Advances and Applications in Energy and the Natural Environment (15th Meeting of European Association of Organic Geochemists Poster Abstracts); Manning, D.A.C., Ed.; Manchester University Press: Manchester, UK, 1991; pp. 195–197. [Google Scholar]
  49. Moldowan, M.; Dahl, J.; Huiznga, B.; Fago, F.; Hickey, L.; Peakman, T.; Taylor, D. The molecular fossil record of oleanane and its relation to angiosperms. Science 1994, 256, 768–771. [Google Scholar]
  50. Murray, A.P.; Sosrowidjojo, I.B.; Alexander, R.; Kagi, R.I.; Norgate, C.M.; Summons, R.E. Oleananes in oils and sediments: Evidences of marine influence during early diagenesis. Geochim. Cosmochim. Acta 1997, 61, 1261–1276. [Google Scholar] [CrossRef]
  51. Alberdi, M.; Lopez, L. Biomarker 18a(H)-oleanane: A geochemical tool to assess Venezuelan petroleum systems. J. S. Am. Earth Sci. 2000, 13, 751–759. [Google Scholar] [CrossRef]
  52. Bieleń, W. Związki arylowoizoprenoidowe jako wskaźniki charakteru środowiska sedymentacji. Naft. Gaz 2019, 9, 546. [Google Scholar] [CrossRef]
  53. Bieleń, W.; Janiga, M. Spektrometria masowa i analiza izotopowa biomarkerów frakcji nasyconej. Naft. Gaz 2021, 77, 512–520. [Google Scholar] [CrossRef]
  54. Summons, R.E.; Powell, T.G. Identification of aryl isoprenoids in source rocks and crude oils: Biological markers for the green sulphur bacteria. Geoch. Cosmochim. Acta 1987, 51, 557–566. [Google Scholar] [CrossRef]
  55. Dziadzio, P.S.; Matyasik, I. Sedimentological and geochemical characterisation of the Lower Oligocene Menilite shales from the Magura, Dukla, and Silesian nappes, Polish Outer Carpathians—A new concept. Mar. Pet. Geol. 2021, 132, 105–247. [Google Scholar] [CrossRef]
Figure 1. Types of seeps and their relationship to hydrocarbon generation and tectonic reconstruction processes of the oil basin containing hydrocarbon accumulations (modified after [8]).
Energies 18 03575 g001
Figure 2. Map showing research area with sampled seep location (number according to Table 1).
Energies 18 03575 g002
Figure 3. Photographs showing oil seeps in the (A) Magura, (B) Silesian, and (C) Skole Units of the Outer Carpathians.
Energies 18 03575 g003
Figure 4. Relations between fractional and isotopic composition (δ13C in ‰ relative to the VPDB standard vs. SA/SARA).
Energies 18 03575 g004
Figure 5. Molecular chromatogram (TIC) of the Bandrów oil seep sample (No. 7).
Energies 18 03575 g005
Figure 6. Selected molecular chromatograms of oil-seep samples from the Carpathian TIC (total ion current mass chromatogram): ((A) black) sample 1—Polana Ostre; ((B) brown) sample 4—Zdwórze; ((C) green) sample 2—Żłobek.
Energies 18 03575 g006
Figure 7. Ternary diagram for C27, C28, and C29 steranes for seep samples of the Silesian, Skole, and Magura Units.
Energies 18 03575 g007
Figure 8. Location of the Bandrów seep on a geological cross-section (changed after Kozłowski, Gąsienica, unpublished data).
Energies 18 03575 g008
Figure 9. Location of the Stańkowa seep (sample 18) in the Skole unit within the Menilite Beds (Tyrawa Wołoska 4042 sheet). The Ropienki anticline against the background of the geological cross-section (modified after Kozłowski, Gąsienica, unpublished data).
Energies 18 03575 g009
Figure 10. Mass chromatogram m/z 191 showing the homohopane distribution in seep sample from Bandrów (Ts−18α(H)−neohopane, Tm−17α(H)−22,29,30−trisnorhopane; C29−29 norhopane; C30−C35− homohopanes, BNH−Bisnorhopane.
Energies 18 03575 g010
Figure 11. Mass fragmentogram m/z 191 showing the homohopanes distribution in crude oil sample from Łodyna 90 well (Ts−18α(H)−neohopane, Tm−17α(H)−22,29,30−trisnorhopane; C29−29 norhopane; C30−C35−homohopanes, BNH−Bisnorhopane.
Energies 18 03575 g011
Figure 12. Isotopic curves of oil and seeps from Skole Unit.
Energies 18 03575 g012
Figure 13. The location of the Zahutyń and Płowce seeps in the Silesian unit within the lower Krosno beds, in the hinge zone of the Tarnawa-Wielopole anticline (modified after Kuśmierek, unpublished data).
Energies 18 03575 g013
Figure 14. Location of the Łubno seepage (sample 14) in the Silesian unit in the lower Krosno Beds, on the Wrocanka-Żółków Fold (modified after Kozłowski, Gąsienica, unpublished data).
Energies 18 03575 g014
Figure 15. Location of the Ropianka seepage (samples 21–26) in the Magura unit in the Inoceramian Beds (changed after Kozłowski, Gąsienica, unpublished data).
Energies 18 03575 g015
Figure 16. Molecular chromatogram (TIC) (A) and mass fragmentogram m/z 191 showing the homohopane distribution (B) of oil—seep from Ropianka sample.
Energies 18 03575 g016
Figure 17. Isotopic curves of seeps from Silesian, Magura, and Skole Units.
Energies 18 03575 g017
Figure 18. A plot of δ13C values for the saturate and aromatic hydrocarbon fractions in seep samples. All δ13C values are in ‰ relative to PDB (interpretation according to the diagram by Sofer [46].
Energies 18 03575 g018
Figure 19. Ts/Tm vs. oleanane/C30 hopane diagram to distinguish lacustrine and terrestrial (interpretation according to the diagram by Peters [17]).
Energies 18 03575 g019
Figure 20. A range of thermal maturity based on biomarker maturity ratios (interpretation according to the diagram by Mackenzie [26]).
Energies 18 03575 g020
Table 1. Basic data of oil seeps from Outer Carpathians.
NumberFormationSARA Separation [%]Ratio SA/SARASulfur Content [%]Carbon Isotopic Composition
SaturatesAromaticsResinsAsphaltenesSATSEEPAROMRESASPH
Silesian Unit
1Krosno66.7818.8312.511.900.860.00−26.80−26.30−25.90−26.00N/A
2Krosno50.9623.9022.362.800.740.16−26.90−26.40−26.10−26.30−26.60
3Krosno45.0627.2124.233.500.720.09N/AN/AN/AN/AN/A
4Krosno42.9718.6516.2122.200.620.16−27.00−26.50−26.10−26.30−26.40
5Krosno52.2724.4520.652.600.770.12N/AN/AN/AN/AN/A
6Krosno60.4222.3115.711.600.820.23−27.90−27.50−27.00−27.10−27.10
7Krosno70.3017.7010.901.100.880.23N/AN/AN/AN/AN/A
8Krosno62.2022.5014.101.200.85N/AN/AN/AN/AN/AN/A
9Krosno45.0324.5426.274.160.690.23−27.40−26.50−26.40−26.50−26.50
10Krosno39.6424.5227.668.170.640.21−26.90−26.70−26.20−26.50−26.80
11Krosno39.1037.8014.908.200.77N/AN/AN/AN/AN/AN/A
12Krosno54.5723.8919.442.110.780.26−28.20−27.30−27.10−27.50−27.60
13KrosnoN/AN/AN/AN/AN/AN/AN/AN/AN/AN/AN/A
14Krosno53.1030.2014.102.600.83N/A−28.00−27.60−27.30−27.00−27.10
Skole Unit
15Inoceramian48.1035.2014.702.000.83N/A−27.40−27.10−26.80−26.60N/A
16Kliwa sands54.6223.4120.551.400.770.37−27.60−27.20−26.80−27.00N/A
17Kliwa sandsN/AN/AN/AN/AN/AN/AN/AN/AN/AN/AN/A
18Menilite Beds19.4054.7023.202.700.74N/A−28.10−27.30−27.20−27.20N/A
Magura Unit
19Inoceramian54.8630.6713.331.100.85N/A−28.10−27.70−27.30−27.20−26.70
20Inoceramian70.5413.7014.601.200.84N/A−28.10−27.60−27.30−27.20−27.30
21Inoceramian48.9123.4125.402.300.730.00N/AN/AN/AN/AN/A
22Inoceramian48.1035.2014.702.000.86N/AN/AN/AN/AN/AN/A
23Inoceramian54.6223.4120.551.400.86N/AN/AN/AN/AN/AN/A
24Inoceramian50.8028.2815.105.800.79N/A−28.20−27.50−26.80−27.30−27.40
25Inoceramian48.6935.9213.721.700.74N/A−28.10−27.50−26.80−27.40−27.50
26Inoceramian56.5126.7714.921.800.83N/A−28.00−27.50−27.10−27.40−27.30
Sara separation [%]—separation into fractions, Ratio SA/SARA—proportion between SA (sum of saturates and aromatics) and SARA (sum of: saturates, aromatics, resins, and asphaltenes), Sulfur content %—content of sulfur, δ13C Seep—carbon isotopic composition of crude oil, δ13C Sat—carbon isotopic composition of the saturated fraction, δ13C Arom—carbon isotopic composition of the aromatic fraction, δ13C Res—carbon isotopic composition of the resins fraction, δ13C Asph—carbon isotopic composition of the asphaltenes fraction, N/A—non analized.
Disclaimer/Publisher’s Note: The statements, opinions and data contained in all publications are solely those of the individual author(s) and contributor(s) and not of MDPI and/or the editor(s). MDPI and/or the editor(s) disclaim responsibility for any injury to people or property resulting from any ideas, methods, instructions or products referred to in the content.

