Abstract
Electric-assist bicycles have recently become very popular. However, riding them generally requires significantly more energy, generated simultaneously by the motor and the rider, compared to much lighter traditional bicycles. Assessing the energy efficiency of electric-assist bicycles in comparison to traditional bikes allows us to determine in which cases using electric bikes is cost-effective and in which it is not. This study proposes a method for evaluating the energy efficiency of bicycles, which stands out by relying on relatively imprecise data recorded at low frequency by a commercial bike computer with accessories. The core of the method is an algorithm developed by the authors to determine the tractive force acting on the bicycle and rider, based on a minimal set of recorded data: road incline, riding speed, and the wind speed component parallel to the direction of movement. Depending on the situation, the tractive force may act as a driving force or as a braking force. Based on the calculated tractive force, the power required to maintain the recorded bicycle speed can be estimated.
1. Introduction
In recent years, single-track vehicles with electric assist and drive systems have found wide application in transportation, significantly improving mobility, especially for city residents. This is particularly important in the context of the so-called “last mile” in public transport systems and has become the subject of intensive scientific research [1,2]. From an urban planning perspective, such vehicles offer an attractive solution to issues related to road congestion, lack of parking spaces, and air pollution. The solution is car-sharing systems, which can reduce the number of cars by replacing them with bicycles, which will ultimately contribute to more efficient use of urban space [3,4,5,6].
Among the various types of single-track vehicles, a distinct group is formed by pedal-assisted electric bicycles, which not only significantly enhance mobility but also serve as an important component of mixed-mode transport. In the literature, these bicycles are referred to as power-assisted bicycles or electric-assisted bicycles (EABs) [7]. Electric bicycles combine the traditional bicycle drivetrain with an electric assist system, which, compared to conventional bicycles, enables more efficient travel over longer distances with reduced physical effort. As a result, a much broader group of people is able to use bicycles as a mode of transport [8]. This factor has undoubtedly contributed to the growing popularity of EABs. Morgan et al. [9], in their research, determined that conventional bicycles require approximately 13% more energy from the rider than pedal-assisted bikes. This finding aligns with the perceptions of EAB users, who also reported a lower perceived physical effort compared to riding a conventional bicycle [9].
The electric bicycle is increasingly chosen as a means of transport instead of a car. It contributes to the reduction in CO2 emissions and other air pollutants, which is of great importance in the context of global efforts for sustainable development [10]. Qiumeng et al. determined that the use of an electric bicycle results in a reduction of CO2 emissions of up to 120 g per kilometer. Additionally, noise reduction and reduced street congestion translate into an improvement in the quality of life in cities.
Electric assistance has also increased the number of people using bicycles for recreational purposes. In the case of most EAB designs, they do not eliminate the physical effort necessary for riding. The health benefits resulting from regular physical activity, despite the use of electric assistance, are an important factor in promoting a healthy lifestyle [9]. However, research by Bourne et al. [11] indicates that riding an electric bicycle requires more frequent and longer rides. Only then will the health benefits be comparable to riding traditional bicycles.
Research conducted by [12] indicates that a cyclist riding an electric bicycle in assist mode completes the same route significantly faster than when using a traditional bicycle. However, a faster ride is not always justified and may, in many cases, reduce road safety. At the same time, it is evident that in such situations, the total amount of energy supplied to the system—both by the rider and the electric motor—increases. On the other hand, riding an electric bicycle without assistance requires much greater effort from the rider compared to typically lighter conventional bicycles. Although this form of transport consumes relatively little energy compared to other means, it still seems reasonable to conserve both the energy supplied by the battery and the energy generated by human muscles.
The comparison of energy efficiency of electric and traditional bicycles can be performed using simple measures commonly used for other electric vehicles: energy efficiency (EE) [km/kWh], which expresses the ratio of the distance traveled to the energy consumed or its inverse energy consumption (EC) [kWh/km] [13,14]. Different versions of these measures can be used, considering different energy values: total energy, only energy supplied by the electric drive, or only energy generated by humans. Since the energy used depends primarily on the parameters of the route, speed, and driving style, comparative studies should be conducted under the same conditions as much as possible.
In the case of factory-built electric bicycles, the user typically has access to several assistance levels predefined by the manufacturer. However, the rider usually has no knowledge of exactly how much energy is being contributed by the electric drive system. Currently, there are many ways to measure the power generated by the cyclist, for example, by measuring pedal force and cadence. A variety of professional, factory-made tools are available for this purpose [15,16]. As a result, it is relatively easy to estimate the amount of energy supplied by the rider while using a pedal-assist electric bike. In contrast, accurately measuring the power delivered by the electric motor is more difficult without interfering with the closed structure of the drive system. Comparing the energy efficiency of traditional bicycles and factory-built electric bicycles, therefore, requires a complete understanding of the energy flow. This task is further complicated by the fact that, during real-world riding, cyclists are forced to take various actions—such as braking, interrupting pedaling while shifting gears, and others—which can significantly affect the energy balance.
Performing an energy balance requires the development of a dynamic model of bicycle motion, which must account for driving torques/forces, braking forces, rolling resistance, aerodynamic drag, and grade resistance. The balance typically excludes other energy losses caused by dissipation in components such as suspension or tires [17]. Various methods for modeling bicycle longitudinal dynamics can be found in the literature. The system can be reduced to the rotational motion of a rigid body with respect to the crank [18] or to the translational motion of a material point [5]. One can analyze the differential equation of motion [19] or directly balance the power and energy flows [20,21]. In this work, the authors chose a reduction to translational motion described by a differential equation. It is assumed that the mass representing the bicycle is subject to a tractive force, which, depending on the situation, may act as a driving or braking force. This approach appeared more advantageous compared to models involving driving torque, as it does not require real-time tracking of the gear ratios used by the rider.
This study proposes a method for reconstructing the tractive force acting on a bicycle using a minimal set of recorded data: road gradient, bicycle speed, and the wind speed component parallel to the direction of motion. This reconstruction allows for determining the total driving force required to change or maintain speed, as well as the braking force, including the precise moments when braking occurred. Bicycle speed can be measured directly from wheel rotation speed or numerically derived from additional GPS data. Similarly, the wind speed component can be measured while riding, based on the difference between static and dynamic pressure. Devices for airflow measurement designed specifically for cyclists are available on the market [22]. If such a device is not available, the wind speed component can be estimated based on wind speed and direction measured before the ride. However, this approach assumes that wind conditions remain constant throughout the ride. In this case, the azimuth of the bicycle’s movement direction must be determined from GPS coordinates. The road gradient can be calculated based on elevation changes recorded by a bike computer using barometric pressure data. Alternatively, it can be derived from a Digital Terrain Model (DTM) using cartographic coordinates obtained from GPS [21]. Additionally, the method requires prior determination of several parameters specific to the given bicycle: gravitational and equivalent mass, rolling resistance coefficient, and aerodynamic drag coefficient. The rider’s mass is also needed. The reconstruction method has been adapted to the low data sampling frequency typical of devices communicating via Bluetooth/ANT+ protocols. By knowing the tractive force values during the ride, along with speed and distance traveled, it is possible to determine power and the amount of work performed. These values can then be compared with the power generated by the cyclist, measured at the pedals.
Before conducting the main study, it was necessary to perform measurements and identify the bicycle parameters mentioned earlier. In the case of identifying resistance coefficients, results from coast-down speed tests were used, along with algorithms for fitting experimental curves to theoretical models. The coast-down tests were carried out on a straight and level section of road.
To assess the accuracy of the proposed reconstruction method, a virtual bicycle ride model was developed. This allowed for the generation of an artificial test data set free from errors and distortions (e.g., signal smoothing) typically found in data recorded by a bike computer [23]. The validated tractive force reconstruction method was then applied to analyze data collected during several rides on a selected test route of fixed length, performed using two traditional bicycles and two electric bicycles. Rides with and without electric assistance were compared in terms of travel time (speed) and energy expenditure.
All calculations and simulations presented in this study were performed using MATLAB version R2023b.
2. Test Route, Bikes, and Measuring Instruments
To compare the energy consumption of traditional and electric bicycles, experiments were conducted on a designated test route. A bicycle computer was used to record various parameters, including GPS coordinates, elevation and road gradient, speed and cadence, as well as the power generated at the pedals. The issue of the quality of such recorded data has been extensively discussed in the authors’ previous works [12,23].
Figure 1 shows the test route along with its elevation profile. The elevation was determined for an average route, based on GPS data recorded during eight selected rides. The GPS coordinates were converted into PUWG1992 cartographic coordinates, which enabled the use of data from the Digital Terrain Model (DTM) to interpolate the elevation along the route. The full procedure is described in detail in the authors’ previous work [23]. Scaling the terrain elevation using a logarithmic transformation highlighted the elevation differences along the route. Actual elevation values can be read from the accompanying color scale. The red diamond marker indicates the start/finish point, while red stars show the direction of travel along the route.
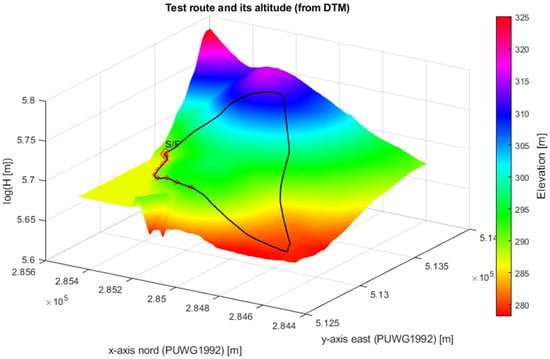
Figure 1.
Test route.
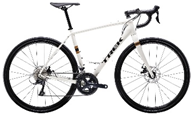
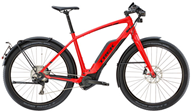
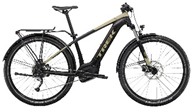
Two traditional bicycles and two electric bicycles were used in the study, along with measurement devices briefly described in Table 1.

Table 1.
Bicycles and other instruments.
3. Initial Evaluation of Recorded Results
The test route was completed a total of 13 times by the same cyclist (see Table 2). The first, second, and thirteenth rides were performed using two traditional road bicycles. The remaining ten rides were carried out on two electric bicycles, using five available assistance modes: “Turbo” (4), “Sport” (3), “Tour” (2), “Eco” (1), and “Without Assist” (0). Throughout all tests, the cyclist aimed to maintain a consistent aerodynamic riding position. Since the bike computer records data at a frequency of 1 Hz, the time shown in Table 2 also represents the number of recorded data entries for each ride. Before each test ride, wind speed and direction were also measured. The wind angle Θw is defined in PUWG1992 cartographic coordinates and measured clockwise from true north.

Table 2.
Overview of test route recordings.
Since the distance covered during each trial was identical, the travel time in Table 2 also provides a basis for evaluating the average speed. It is clear that the cyclist rode significantly faster when using electric assistance. This raises the following questions: Was riding at such a high speed truly necessary? And is this an optimal use of energy?
4. Method
4.1. Dynamic Model
It is assumed that the bicycle moves at a speed along a road inclined at an angle . Since GPS coordinates may be used during the reconstruction, it is convenient to describe the bicycle’s motion in cartographic coordinates. In this case, the PUWG1992 coordinate system was selected (see Figure 2). There is a relationship between the speed (or distance) along the inclined surface and its projection onto the coordinate system plane, expressed as follows:
when the road gradient is small, it can be reasonably approximated that and It is also assumed that the wind velocity is parallel to the ground surface. The wind direction is described by the angle Θw (see Figure 2). The component of the wind speed projected onto the direction of motion is denoted as .
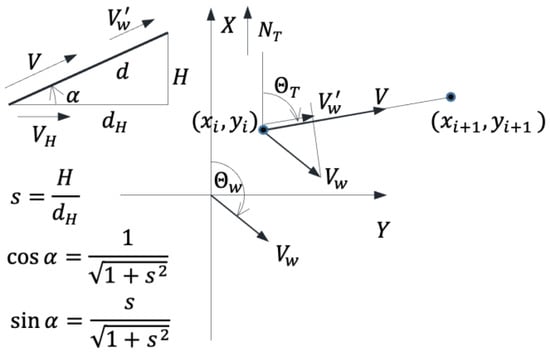
Figure 2.
Road gradient and wind direction azimuth.
The equation of longitudinal motion of the bicycle takes the form:
On the right-hand side of the equation, the following forces are considered in order: tractive force (driving or braking force), aerodynamic drag, rolling resistance, and grade resistance. The total gravitational mass is the sum of the masses of the rider, the bicycle frame with accessories, and the front and rear wheels. The equivalent mass additionally accounts for the reduced moments of inertia of the wheels:
where —the moments of inertia of the front and rear wheels with respect to their rotation axes, —wheel radius. In the mass reduction process, the moments of inertia of other rotating drivetrain components were neglected. Rolling resistance is proportional to the coefficient , while aerodynamic drag depends on the coefficient :
Since only non-negative values of velocity are of interest, the sign function used in the rolling resistance term of Equation (2) can be omitted. With the caveat that, in the case of the bicycle coming to a complete stop, the rolling resistance force must be set to zero.
It can be assumed that within a fixed, short time interval ΔT, the following remain constant: tractive force , wind speed and the rolling resistance coefficient (same road surface). An auxiliary velocity can also be introduced:
Equation (2) can now be rewritten in the following form:
where
The quantity belongs to the set of complex numbers and, depending on the value and sign of the tractive force, takes either real or purely imaginary values.
Equation (6) has two solutions. When the solution takes the form:
where —is the initial velocity. When the solution takes the form:
In Equations (8) and (9), due to the complex nature of , it is necessary to consider the analytic extensions of hyperbolic and trigonometric functions. At the same time, the resulting velocities will remain real. Interestingly, when the function arguments are small, choosing the incorrect solution does not lead to significant differences in the numerically computed velocity values. This results from the form of the power series expansions of these functions.
4.2. Measurements and Parameter Identification
The parameters related to mass in the bicycle motion equation were determined by estimation, based on measurements of the corresponding masses and distances. The moment of inertia of a bicycle wheel can be estimated using the following formula:
where respectively: the mass of the rim with tire, the outer radius, and the inner radius of the wheel; —the mass and length of a spoke; —the number of spokes.
In this study, the bicycles were weighed together with their equipment, followed by weighing the complete wheels after they had been dismounted from the bicycles. The corresponding radii were also measured. The results of the measurements and the estimated moments of inertia of the wheels, as well as the equivalent masses, are presented in Table 3. The moments of inertia of the spokes were omitted due to their negligible mass. All tests were conducted by the same cyclist, with a body mass of 108 kg.

Table 3.
Basic mass-related parameters.
The resistance coefficients were identified using the coast-down method, followed by fitting curves to the recorded velocity profiles from the experiments and comparing them with those obtained from theoretical equations. The tests were carried out on a straight, flat, and smooth asphalt road near a large, empty parking area. The type of surface was the same as on the test track. All tests, both on the test track and the coasting tests, were always performed by the same rider. The cyclist accelerated (in the case of electric bicycles, without assistance) to a speed of at least 25 km/h and then, at a designated point on the route, stopped pedaling to allow the bicycle to coast freely. The bicycle computer recorded, at one-second intervals, the gradual decrease in speed caused by aerodynamic drag and rolling resistance. For each type of bicycle, five to six such trials were performed. Before each trial series, the wind speed was measured (Anemometer C.A.1227, max 35 m/s, +−3% from Silesian University of Technology, Katowice, Polnad) and the component parallel to the direction of motion was determined. In all cases, the bicycle was ridden against the wind, ensuring that the velocity-time relationship could be accurately described by Equation (8). Tests were always conducted in light headwind conditions.
Next, for each bicycle, the selected segments of the velocity profiles corresponding to the coasting phase were fitted using the least squares method to the profiles obtained from Equation (8). During the coasting phase, the tractive force was equal to zero. An example of the fitting results for Bicycle No. 4 is presented in Figure 3. For the remaining bicycles, the velocity fitting errors also did not exceed a few percent. The optimization algorithm searched for three variables: the rolling resistance coefficient, the aerodynamic drag coefficient, and an additional variable representing the error in the initial velocity estimation.
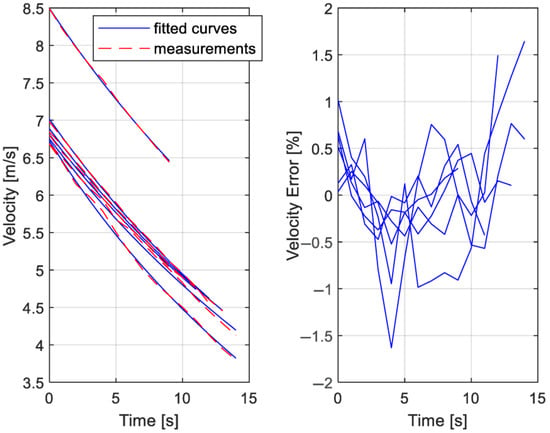
Figure 3.
Example of curve fitting—coast-down tests for Bicycle No. 4.
The aggregated results of the rolling resistance and aerodynamic drag coefficient estimation are presented in Figure 4. The coefficients are shown as a function of the objective function residual. The lower the residual value, the better the velocity curve fitting. As shown, the rolling resistance values for all bicycles are nearly identical and close to 0.005. The obtained values fall within the range of rolling resistance coefficients for bicycle wheels reported in the literature [24,25].
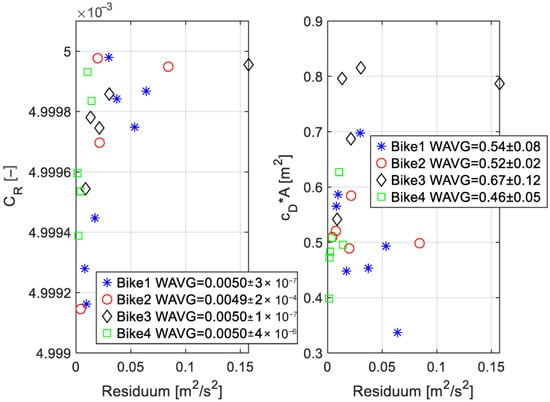
Figure 4.
Distributions of rolling resistance and aerodynamic drag coefficient values.
The case is somewhat different for the aerodynamic drag coefficient (drag area: [m2]). Air density was assumed under standard conditions. The determined drag coefficients vary between bicycles and, additionally, may differ between individual trials for the same bicycle. To estimate the aerodynamic drag coefficient for each bicycle, a weighted average was used, where the weight was the inverse of the residual. The averaged values are shown in the legend on the right-hand side of Figure 4. These values are consistent with those reported in the literature [26,27,28].
4.3. Energy Efficiency Coefficients
In the case of electric vehicles, two basic coefficients are most commonly used to evaluate energy efficiency: the amount of energy required to travel one kilometer at a constant speed, or the number of kilometers that can be traveled at a constant speed using a unit of energy:
where —work carried out, typically expressed in kWh, —distance traveled, in kilometers (km).
If the basic parameters of the bicycles are known, their energy efficiency coefficients can be calculated and compared. The tractive force was determined directly from the equation of motion. It was assumed that the bicycle moves with a constant acceleration of 0.25 m/s2 and that the road gradient is 3%. The effect of wind speed was neglected. Figure 5 shows the distributions of energy efficiency coefficients as a function of speed, obtained from the simulation.
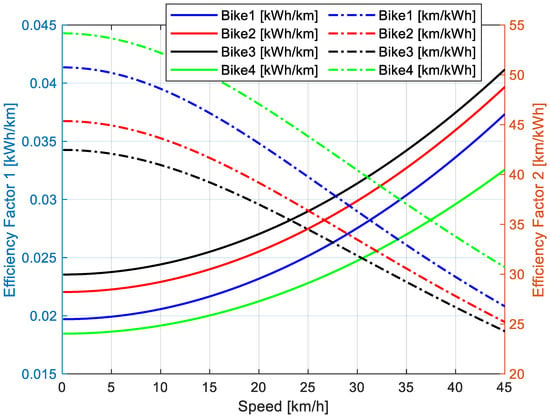
Figure 5.
Comparison of bicycle energy efficiency coefficients at different speeds.
From the plots in Figure 5, it can be observed, for example, that to maintain a speed of 15 km/h, the performance bicycle (Bike 4) requires approximately 20 Wh of energy per kilometer. Heavier electric bicycles perform less efficiently in this case, consuming between approximately 23 and 26 Wh per kilometer. At the same speed, with 1 kWh of available energy, the performance bike can travel around 50 km, while the heaviest electric bicycle (Bike 3) can cover only about 39 km. Such comparisons are meaningful when the energy produced by human muscles is considered equivalent to electrical energy, without analyzing the costs of generating each type of energy.
4.4. Reconstruction Method for Tractive Force and Energy Expenditure
The method assumes the availability of discrete data on riding speed , the component of wind speed parallel to the direction of motion and road gradient all recorded at successive time intervals with a step size ΔT. If such data were not directly recorded, they must be estimated based on other available information, such as: GPS coordinates of the route, elevation above sea level (from GPS or DTM), and stationary measurements of wind speed and direction.
Although the tractive force can be calculated directly from Equation (2), this requires the numerical computation of instantaneous acceleration, which may lead to significant errors. Hence, the idea is to use Equations (8) and/or (9) to determine the tractive force instead. The algorithm of the proposed method can be presented as the following procedure.
In the following moments of time, perform the actions:
(1). First, determine the initial velocity , and then the final velocity after time ΔT given by . This is consistent with the assumption that wind speed remains constant during the integration of Equation (6).
(2). Determine the road slope angle based on the gradient , which is also assumed to be constant during the interval ΔT. Next, calculate the constants and the combined rolling and grade resistance forces (according to Equation (7)).
(3). Four cases are possible:
If then the constant should be determined by numerically solving the following equation: .
If then the following equation must be solved: .
If then the velocity must pass through zero at some moment .
Two equations can be written:
After eliminating the time a nonlinear equation remains to be solved:
If then by following a similar procedure, the resulting equation is .
(4). Calculate the tractive force using the determined value of and Equation (7).
The nonlinear equations of the type (8) and (9) were solved using the Newton-Raphson method. The method proved to be rapidly convergent. The initial value was assumed in the form:
Instantaneous power is defined as . Calculating discrete power values at time points requires multiplying the tractive force by the velocity, which varies over the interval . This may lead to step-like changes in power values and discontinuities compared to the actual time-dependent power curve. In this study, discrete power was calculated using the following formula:
Or:
In practice, the latter approach yields significantly smoother plots.
Work can be calculated by integrating power over time:
From Equation (15), the formula for the discrete values of work can be derived as:
where —discrete values of the distance traveled at time points The distance traveled by the bicycle provides additional information that should ideally be recorded. If this information is not available directly, it can be obtained by numerically integrating the discrete velocity values using the trapezoidal method.
4.5. Evaluation of the Accuracy of the Proposed Method
To evaluate the accuracy of the proposed method, artificial data required for the reconstruction process were generated. For simplicity, it was assumed that the track has a circular shape with a radius of 1 km, first gently ascending and then descending. The variation in the track’s slope and elevation as a function of angular position is shown in Figure 6 (left).
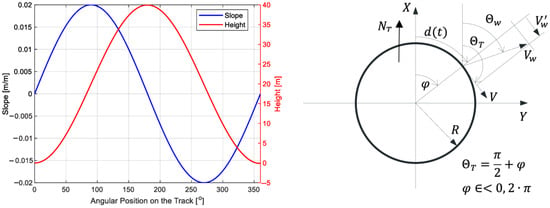
Figure 6.
Route slope and elevation as a function of angular position (left), and track shape with wind direction (right).
A simulation was conducted in which the cyclist rode on a circular track using Bicycle No. 1, maintaining a constant power output of 150 W, except during braking periods. The cyclist began the ride with an initial speed of 0.1 m/s. Until reaching a speed of 45 km/h, the tractive force was calculated as the ratio of power to velocity. Once the speed exceeded 45 km/h, the cyclist started braking with a constant force of –50 N. When the speed dropped below 35 km/h, pedaling resumed with a constant power of 150 W. Throughout the ride, a wind of 10 m/s blew from east to west (see Figure 6, right). The differential equation of bicycle motion (Equation (2)) was solved numerically using an adaptive step size not exceeding 0.01 s, allowing for the determination of the bicycle’s velocity as a function of time. A similar numerical integration was used to determine the distance traveled. The integration procedure was stopped once the cyclist completed a full loop. Figure 7 shows the distributions of bicycle speed, wind speed, and their difference as a function of the angular position along the track. The highlighted area indicates conditions in which the tailwind exceeds the cyclist’s speed, effectively providing an additional driving force.
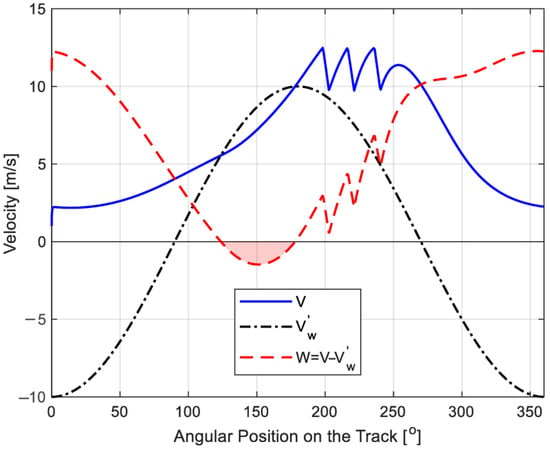
Figure 7.
Travel speed determined by integrating the equation of motion, wind speed component, and their difference.
Next, the numerically determined speed and distance profiles were resampled to a frequency of 1 Hz. These prepared virtual data, including information on road gradient and the wind speed component, were used for tractive force reconstruction. A variant was selected in which the bicycle’s travel speed was computed numerically based on the coordinates of points along the route. This introduced a source of error, corresponding to a situation where only GPS data is available.
Figure 8 presents the tractive force profiles obtained from the simulation (ODE integration), compared with the tractive force reconstructed using the proposed method, and additionally with the tractive force calculated directly from the differential Equation (2) using numerically determined acceleration. As expected, both reconstruction methods lose accuracy in cases of abrupt changes in tractive force (i.e., discontinuities in the function). However, the proposed method shows a lower error compared to the direct method (see Figure 9). An evident source of higher error in the direct method is the numerical computation of acceleration.
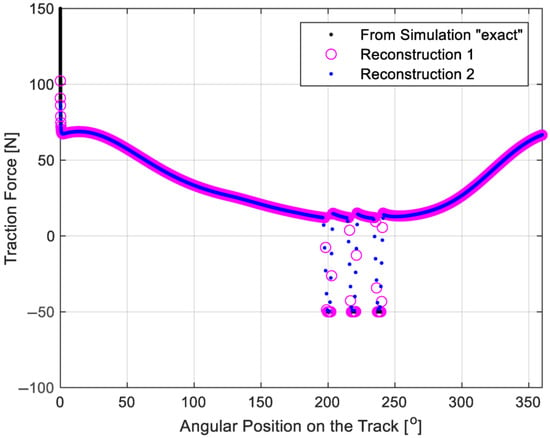
Figure 8.
Comparison of tractive force obtained using different methods.
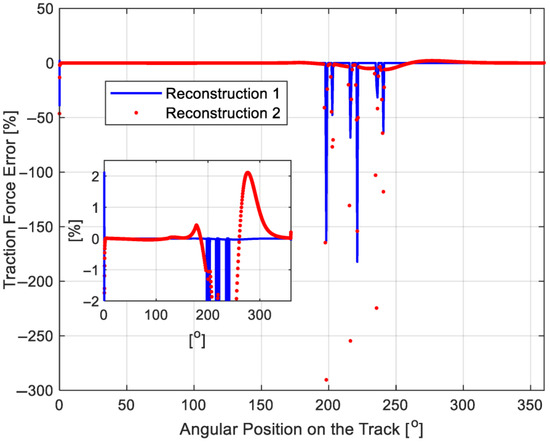
Figure 9.
Comparison of errors between the proposed method and the direct method.
Figure 10 shows the differences between velocities calculated using different methods.
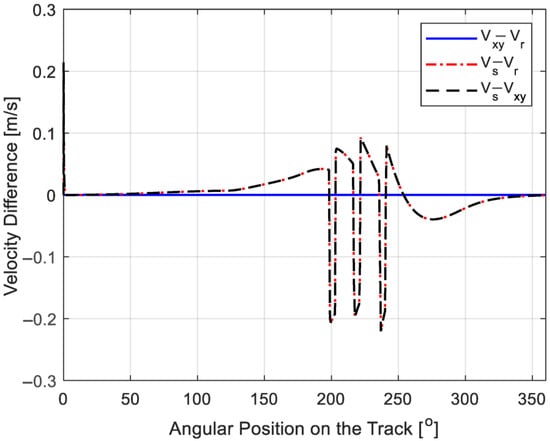
Figure 10.
Comparison of velocity distributions (—velocity numerically computed from trajectory point coordinates, —velocity reconstructed from the reconstructed tractive force, —exact velocity obtained during the simulation).
The reconstructed velocity obtained from the reconstructed tractive force was compared with the velocity numerically computed from the trajectory points. In this case, the differences are negligible. At the same time, the differences between the “reference” velocity and are practically the same as those between and . The largest differences correspond to points of discontinuity in the tractive force. This indicates that the proposed reconstruction method very accurately reproduces the velocity profile that was originally used as input for the simulation.
Based on the positive values of the tractive force, the power delivered by the cyclist over each time interval , was reconstructed (Figure 11), using the approximate Formulas (13) and (14). Additionally, power was calculated using the tractive force obtained directly from the equation of motion (2). Once again, the proposed method proved to be significantly more accurate. The total work performed by the positive reconstructed tractive force was also compared with the positive work of the force computed during the simulation (Figure 12). If the initial “startup effect” at the beginning of the simulation is disregarded, the error in the work calculation remains below 0.5%.
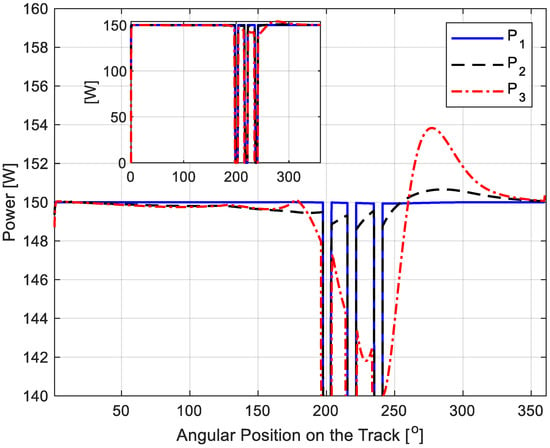
Figure 11.
Power plot. (—power calculated according to Equation (14), —power calculated according to Equation (13), —power calculated according to Equation (13) but with tractive force obtained directly from the equation of motion).
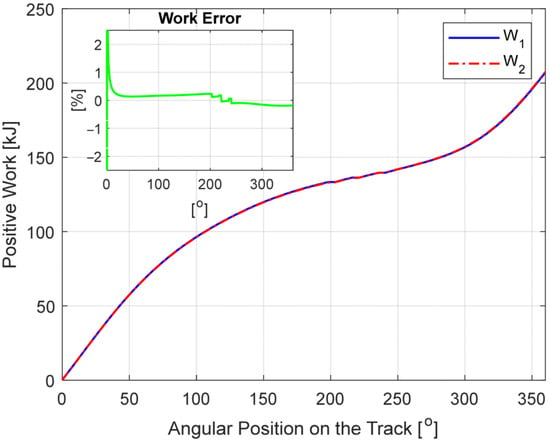
Figure 12.
Comparison of work conducted by the positive tractive force and the relative error in work. (
—work calculated based on the reconstructed tractive force, —work calculated based on the tractive force determined during the simulation).
4.6. Reconstruction Based on Recorded Data
After verifying the accuracy of the proposed method, it was used to analyze data collected during real test route rides. Speed profiles obtained from recorded GPS position data were used. As before, for verification purposes, the reconstructed velocity corresponding to the tractive force was also reconstructed based on the reconstructed tractive force.
The reconstructed tractive force acting on the bicycle during ride number 1, along with comparisons of the input and reconstructed velocities, power, and work, are presented in Figure 13, Figure 14, Figure 15 and Figure 16. Significant discrepancies can be observed in the case of power (Figure 15). The bicycle computer uses an algorithm that averages power for each crank rotation and records the results at a frequency of 1 Hz. Additionally, a smoothing filter is applied for averaging [10]. This may partly explain the differences in the power profiles. On the other hand, the comparison of the work profiles shows much better agreement (Figure 16). This trend also appears when analyzing the remaining rides without assistance (Figure 17). Using the proposed method, it is possible to estimate the amount of energy delivered to the bicycle-human system in assisted modes, such as in turbo mode (Figure 18).
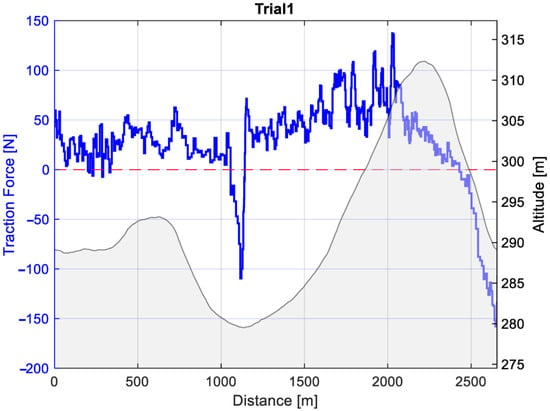
Figure 13.
Reconstruction of the tractive force during the first ride with traditional Bicycle Number 1.
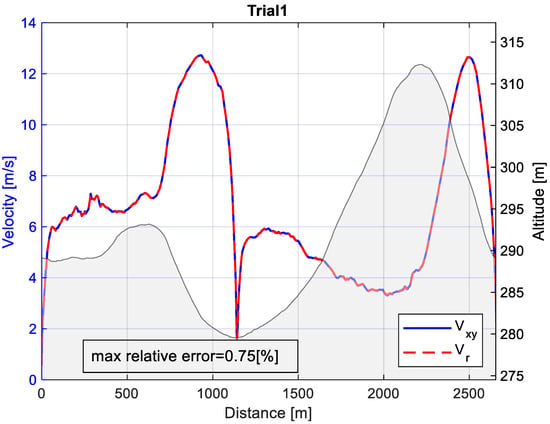
Figure 14.
Comparison of input and reconstructed velocity.
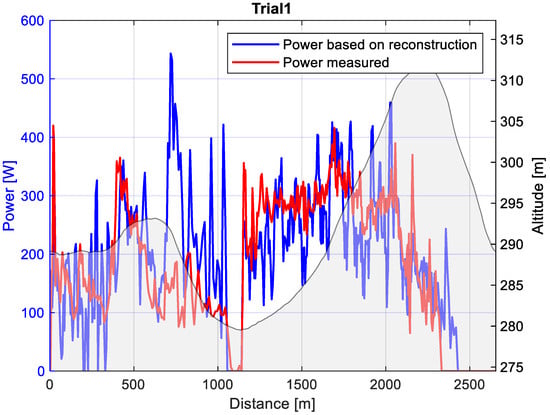
Figure 15.
Comparison of reconstructed power and power recorded by the bike computer.
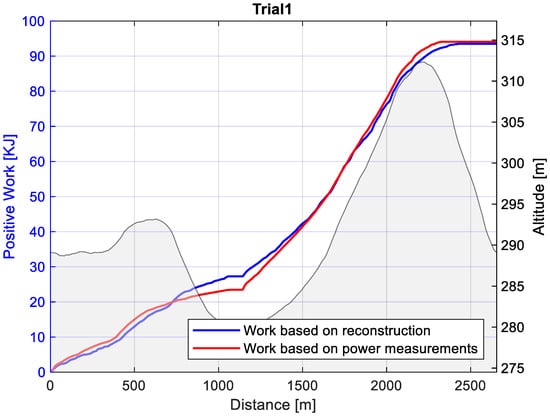
Figure 16.
Comparison of the work conducted by the cyclist.
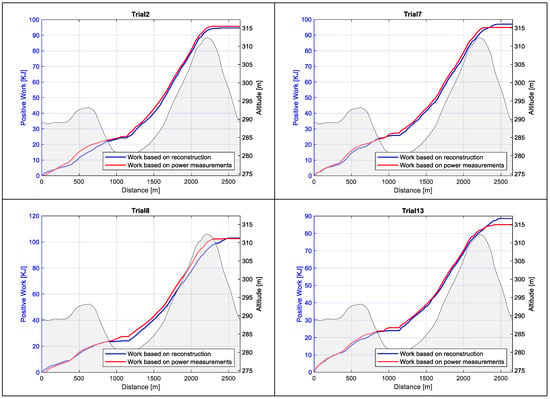
Figure 17.
Reconstruction of work conducted by the cyclist during the remaining rides without assistance.
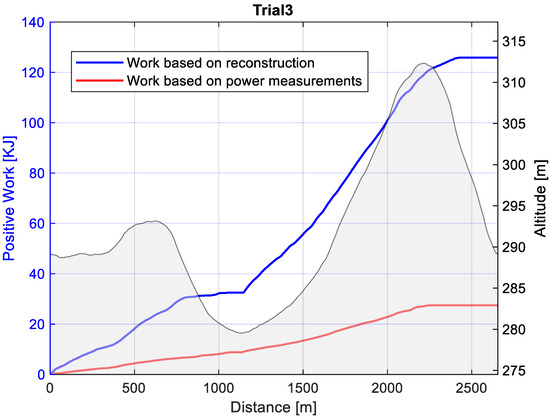
Figure 18.
Reconstruction of work conducted during the ride with Bicycle Number 2 in turbo mode.
Figure 19 presents the aggregated results of the total work required to complete the route, reconstructed and compared with the cyclist’s work calculated based on power measurements. In assisted modes, the electric motor contributes, on average, between approximately 50% and up to 350% of the power.
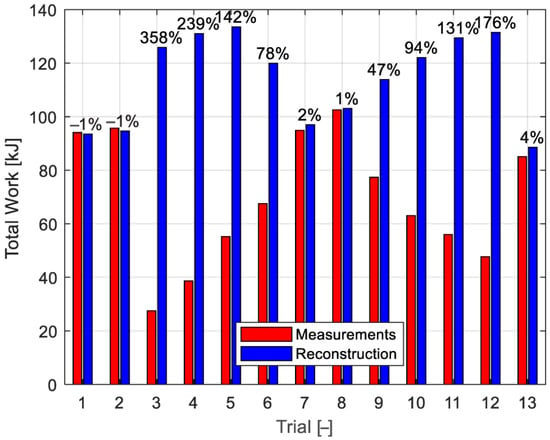
Figure 19.
Comparison of total work conducted by the cyclist based on power measurements to work determined by the reconstruction method (relative work increases are also provided in %).
Figure 20 presents the results of all recorded rides in the coordinate system: total work required (work conducted by the cyclist and generated by the electric motor if the ride was assisted) and travel time (equivalent to the average speed of the ride). It can be assumed that the travel time was determined accurately. However, the total work required for the ride was estimated using the reconstruction method, with some error comparable to the error in determining the velocity profile. As can be observed, traditional bicycles are the most energy-efficient. Riding an electric bicycle without assistance requires slightly more energy, but at the same time, the travel speed significantly decreases. Assistance encourages the cyclist to ride much faster, which, however, results in a much higher total energy consumption.
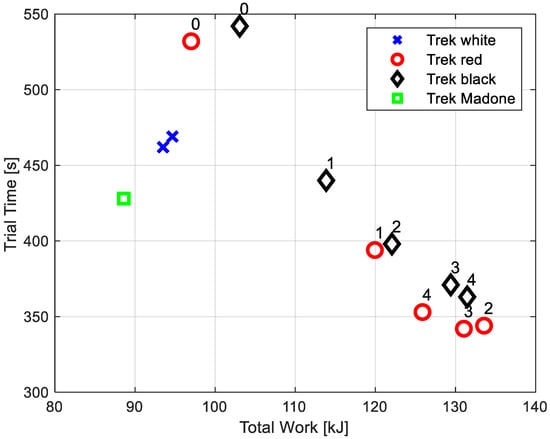
Figure 20.
Comparison of travel times and total work required (For electric bicycles, the numbers represent the assistance level).
4.7. Simulation of Route Traversal with Non-Assisted Bicycles Under Fixed Speed Conditions
It was assumed that the virtual cyclist (with a mass identical to that of the cyclist who performed all previously recorded experimental trials) would now traverse the test route using different bicycles at a speed identical to that recorded during trial number 1. In the case of electric bicycles, no assistance was used. The results of such simulations, performed using the reconstruction method, are presented in Figure 21 in the form of work conducted by the driving force. As can be easily seen, traveling with the performance bicycle requires significantly less energy compared to electric bicycles. In the case of riding Bicycle Number 1, the cyclist generated an average power of 202.4 W. For Bicycle Numbers 2 and 3, the average power was 216.7 W and 238.6 W, respectively (an increase of 7% and 18%). However, on Bicycle Number 4, the cyclist only needed an average of 166.6 W (a decrease of nearly 18%). When converted, these values correspond to 9.77, 10.46, 11.51, and 8.04 Wh/km, respectively.
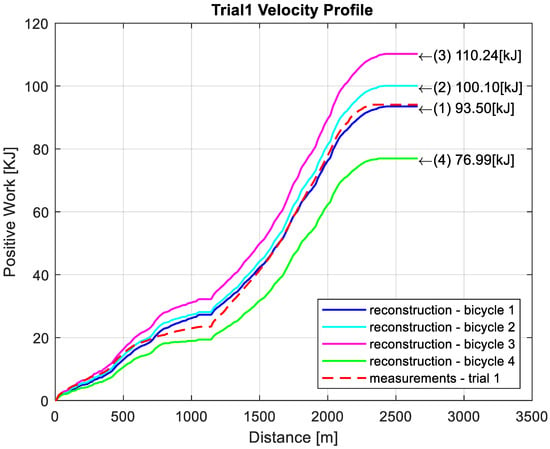
Figure 21.
Comparison of the work required to traverse the route with non-assisted bicycles at the speed recorded during ride number 1.
The procedure was then repeated using the speed profile recorded during ride number 13, completed with the bicycle performance (Figure 22). It should be remembered that this was the fastest of the recorded non-assisted rides. The average power generated on Bicycle Number 4 was 207 W. Traveling at the same speed on bicycles number 1, 2, and 3 required 250.9 W, 267.6 W, and 291.8 W, respectively. This corresponds to an increase of 21%, 29%, and 41%. The energy efficiency, in order of the numbered bicycles, was as follows: 11.22, 11.96, 13.05, and 9.26 Wh/km.
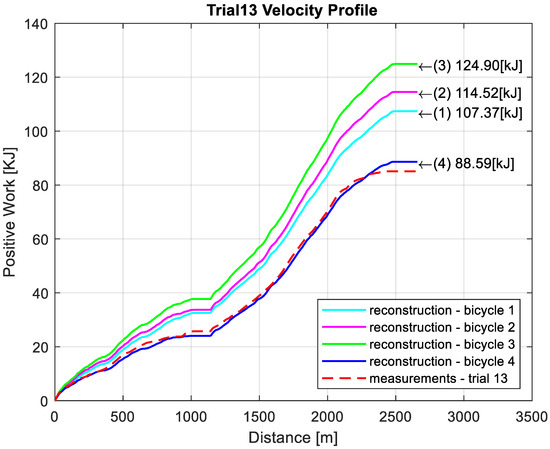
Figure 22.
Comparison of the work required to traverse the route with non-assisted bicycles at the speed recorded during ride number 13.
4.8. Uphill Ride Simulation
A section of the test route was selected as an uphill segment, where the cyclist had to continuously pedal and supply power to the system. Using the method of integrating the equation of motion (2), the uphill ride simulation was conducted with the selected test bicycles under conditions of constant power generated by the cyclist, always without assistance. The initial speed of the bicycle was set to 0.1 m/s. In each integration step, the tractive force was calculated by dividing the constant power by the current speed of the bicycle. It was assumed that an untrained person can generate 2 W of energy per kilogram of body mass [6]. Two cases were analyzed: in the first (Figure 23), the bicycle was ridden by an adult male weighing 108 kg; in the second (Figure 24), by a female weighing 50 kg. The power generated was proportional to the cyclist’s mass. The effect of wind was neglected.
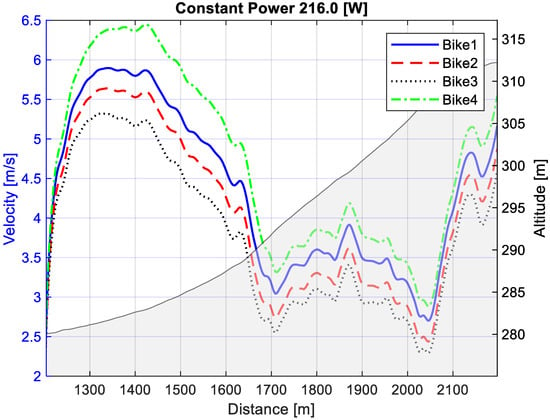
Figure 23.
Uphill ride simulation with a constant power of 216 W.
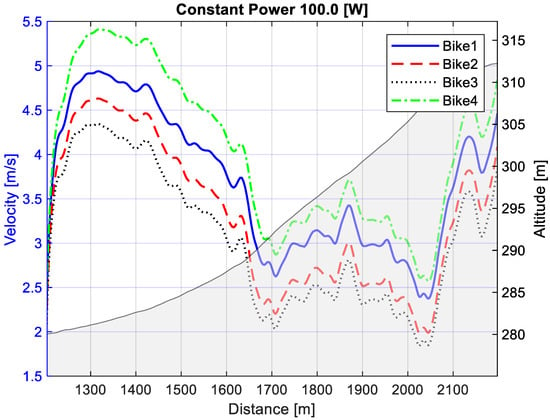
Figure 24.
Uphill ride simulation with a constant power of 100 W.
The velocity distributions presented in Figure 23 and Figure 24 clearly show a dependence on the bicycle’s mass. It is evident that riding non-assisted electric bicycles makes it more difficult to climb a hill. The riding speed decreases noticeably where the road gradient increases. Moving at too low a speed on a bicycle is uncomfortable. In the second case (Figure 24), the speed of Bicycle Number 3 drops at some point to the speed of fast walking. Such a low speed will negatively affect the bike’s stability, which could cause it to tip over. This example highlights a significant disadvantage of electric bicycles. After the battery is depleted, a person with lower physical strength may have difficulty continuing to use the bicycle. The manufacturer of the bike computer and the accessories connected to it does not specify the accuracy of speed measurements. These are devices that do not have a measurement class.
It is not possible to provide an explicit formula for the traction force, and for this reason, it is difficult to perform a classical error analysis, and even more so, a sensitivity analysis. In special cases, the error can be assessed using simulation methods. Figure 25 shows the situation when Bicycle Number 1 accelerates on a perfectly horizontal road in headwind conditions. The maximum wind speed measurement error was assumed to be ±1 m/s. The relative error in the reconstruction of the traction force is quite large in this case (it does not exceed 10%). This confirms the need to develop a much more accurate method of measuring the speed of airflow relative to the bike in the future.
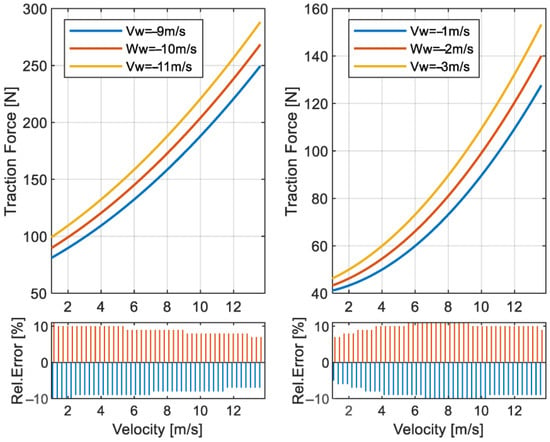
Figure 25.
The influence of wind speed measurement error on the traction force reconstruction error (two cases, the wind speed blowing opposite to the bicycle motion).
5. Discussion
For the energy balance, in addition to data recorded during the ride, it is important to consider parameters characteristic of each bicycle, related to its mass, dimensions, and tractive properties. The use of the coast-down method in this study to estimate the rolling resistance coefficients and aerodynamic drag coefficients significantly facilitated the acquisition of these data. For rolling resistance, the method seems entirely sufficient. The similarity in rolling resistance coefficients among the bicycles arises from the similarity in the dimensions and tread patterns of the tires used. In the case of aerodynamic drag coefficients, the results show some variability in values for each bicycle, which is difficult to explain. This may result from variations in the rider’s position during different trials or from changes in wind direction. However, the averaged values of these coefficients fairly reflect the differences in the “size” of the bicycles and fall within the range reported in the literature. Since aerodynamic drag is very significant in the energy balance, future research should focus on a more accurate determination of this parameter. Ideally, studies should be conducted in a wind tunnel [26]. Since the aerodynamic drag coefficient (drag area) studied in this work depends largely on the cyclist’s size, this approach seems somewhat impractical. Instead, dimensionless values of the aerodynamic drag coefficient should be used, and methods (e.g., optical) for estimating the effective cross-section for each cyclist [25] should be implemented. In future studies using the simple and inexpensive coast-down method, more attention should be paid to external conditions—preferably calm weather—and the length of the test section should be increased. In subsequent studies, the authors are considering applying the coast-down method to determine the moments of inertia of the wheels, instead of the estimation used in this study (Equation (10)).
One of the key pieces of information influencing the energy balance is the road gradient. The authors conducted studies on a test route, where the gradient was estimated based on readings from a barometric altimeter installed in the bicycle computer and verified using data obtained from the Digital Terrain Model (DTM) [23]. Accurately determining the gradient of any route while cycling is quite difficult, and according to the authors, the most effective tool remains the barometric altimeter. Available commercial dynamic inclinometers, which typically combine accelerometers and gyroscopes, usually lack sufficient resolution and accuracy. They are also prone to errors caused by vibrations in the bicycle’s frame during riding, caused by road irregularities and time-varying pedaling forces [29]. Promising results in this case come from the work of Misgeld et al. [30], where the physical pedaling torque on an electric bicycle was reconstructed depending on the road gradient. The road gradient angle was calculated based on data from a gyroscope and accelerometer with the help of a Kalman filter. Simple liquid-based inclinometers, commonly used by cyclists, can indeed visually track the road gradient, but this data cannot be practically recorded.
The accuracy of the proposed tractive force reconstruction method was evaluated using simulation methods. The source of errors in the method lies in the iterative numerical process of determining the tractive force itself and the discrete, noisy input data set. One of the objectives of the simulations was to generate virtual noisy input data and examine the impact of noise on the method’s results. The analyses revealed that the input data have a significant impact on the quality of the results. In particular, the accuracy with which velocity changes were recorded is crucial (see Figure 10). Determining the speed profile based on GPS data carries the potential for significant errors. Khalid [8] estimated the average speed error determined using GPS to be at least 7% compared to reference speeds obtained from pulse transmitters and vehicle speedometers. He also noted that the largest speed variations occur during turns. Witte et al. [31] found that GPS is more accurate at constant speeds, with accuracy clearly decreasing during rapid speed changes. For this reason, instead of determining speed numerically based on trajectory point coordinates, it is better to use an additional sensor to record the riding speed based on wheel rotations. This should improve the accuracy of tractive force estimation.
On the actual test route, wind speed and direction were measured just before each start. Although the travel time was short, there could have been some fluctuations in wind speed and direction during the ride, which were not accounted for in the calculations. A potential solution to this issue in the future could be the use of a Pitot tube device [20] to measure the air flow speed relative to the bicycle.
The comparison of the instantaneous power calculated based on the reconstructed tractive force with the power measured using a commercial power meter crankset and recorded by the bike computer shows poor agreement. This issue requires further research and analysis to determine the causes of such large discrepancies. The power meter crankset is a closed system and, in a sense, a black box, as the data processing algorithms used in this device are not disclosed. At the same time, as shown, there is a fairly good fit between the work profiles conducted by the tractive force and the work calculated based on the recorded power.
Based on the total work and the time taken to complete the route, the average power required to traverse it can be estimated. During ride number 3, the electric assistance was the most efficient, adding an average of about 280 W of power. This is in the order of magnitude reported in the literature. Nikolov [32] demonstrated that the power provided by assistance depends on the cyclist’s cadence and can range from 50 W to as much as 200 W. Of course, these results are largely dependent on the specific design of the electric bicycle’s drive system, which complicates direct comparisons.
The conducted simulations, assuming specific speed profiles, confirmed that electric-assisted bicycles require significantly more energy per kilometer compared to traditional bicycles. Similarly, uphill ride simulations with a constant power generated by the cyclist and the assistance turned off showed that riding an electric bicycle with a depleted battery can be practically impossible (or very difficult) for individuals with lower physical fitness.
6. Conclusions
In this study, an original method for reconstructing the tractive force acting on a moving bicycle was proposed, and it was shown to be significantly more accurate than the method of directly determining the instantaneous force from the equation of motion. The effectiveness of the method was verified using artificially generated speed profiles obtained by numerically integrating the equation of motion. This was conducted on a virtual route with a variable gradient, assuming a constant pedaling power and specific speed limits that trigger braking on and off. A significant error in the tractive force reconstruction method was observed only at points where there was a sudden transition from driving force to braking force. The main source of error in these particular cases was the discrete nature of the input data and the chosen low sampling frequency. Despite this, the error was still about half the size of the error from the direct method. Using the tractive force, it is easy to reconstruct the power and the total work generated by the cyclist and the electric motor assistance. The proposed method of traction force reconstruction has a significant advantage over the direct method in the case of low data sampling frequency typical of sensors operating in the ANT+ standard.
It was also shown that the reconstructed tractive force can be used to accurately reproduce the velocity profile that served as the input data for the reconstruction method. Again, the largest differences, around 0.2 m/s, were observed in situations of sudden transitions from driving force to braking force.
The verified method was applied to reconstruct the tractive force using data recorded by the bike computer during a real test route traversal with four different bicycle designs. However, before this could be conducted, it was necessary to first identify the basic parameters of the bicycles required to reconstruct their dynamic models. In this case, the coast-down method proved to be sufficiently accurate (and also very simple to implement) for estimating rolling resistance and aerodynamic drag coefficients. Since the bike computer also recorded the power generated by the cyclist on the pedals, it became possible to compare the work conducted by the drive system and the cyclist in different assistance modes.
For both traditional and electric bicycles in non-assisted mode, a direct comparison between the power generated on the pedals and recorded by the bike computer with the power obtained through reconstruction did not perform well. However, good agreement was achieved when comparing the work conducted. Therefore, instead of comparing instantaneous values, it is better to work with the integrals of the signals. It should be emphasized that the authors used commercially available pedals to measure the power generated by the cyclist. As a result, they do not have knowledge of the internal data processing algorithms used by the manufacturer to convert the measurements of force and cadence into an averaged power value. In the future, it may be advisable to change the approach to measurements. Currently, measuring power on the pedals and then converting it into work conducted allows for the evaluation of the work contributed to the system by the electric drive. Instead, one could measure power (work) directly in the electrical system, and such a measurement seems much more accurate. However, this would require interference with the design of commercial electric bicycles, but it could yield tangible benefits. In addition, an analysis of the battery state of charge impact on the efficiency of the electric motor must be carried out [33].
According to the authors, an advantage of the proposed tractive force reconstruction method is that it requires the registration of relatively few measurement data points with a low sampling frequency typical for bike computers. At the same time, there is no need to record data that are more difficult to obtain, such as the current gear, braking force, etc.
The accuracy of the proposed reconstruction method largely depends on the quality of the input data, particularly the riding speed, wind speed, and road gradient. Riding speed is best determined based on wheel rotation measurements and possibly correlated with GPS data. To determine the air flow speed relative to the bicycle and to assess the road gradient, measuring changes in static and dynamic pressure can be helpful.
The results presented in this article clearly indicate that traditional bicycles can be more energy-efficient than electric-assisted bicycles in certain cases. This is primarily because a cyclist using assisted modes significantly increases their speed at the cost of higher energy consumption. The second factor is the considerably greater mass of electric bicycles compared to traditional ones, especially when compared to performance bicycles. The formulated conclusion on the energy efficiency of electric bikes refers only to the case studied in this work, in which the selected support mode was switched on during the entire ride of a relatively short route. The effect of reducing cyclists’ efficiency during long-term effort was not taken into account. On longer distances, skillful use of assistance can contribute to changing the energy balance in favor of electric bikes.
In the future, the issue of multi-criteria optimization of the assistance level can be considered, aiming to achieve the shortest possible travel time (highest average speed) while minimizing the energy consumption provided by both the motor and the cyclist. By adjusting the weights assigned to the time criterion (average speed) and energy flows, different goals can be achieved, including those related to cycling transport efficiency, recreational bicycle use, and health-related objectives. The ideal scenario would be the smooth adjustment of assistance based on current road conditions, transportation needs, and the physical condition of the user. Due to the variability in road conditions, the energy optimization problem will be stochastic in nature. Perhaps the energy management methods proposed in [34,35] can be helpful in solving it.
Author Contributions
Conceptualization: T.M., Z.S. and A.K.; methodology: T.M., Z.S. and A.K.; software: T.M., Z.S. and A.K.; validation: T.M., Z.S. and A.K.; formal analysis: T.M., Z.S. and A.K.; investigation: T.M., Z.S. and A.K.; resources: T.M., Z.S. and A.K.; data curation: T.M., Z.S. and A.K.; writing—original draft preparation: T.M., Z.S. and A.K.; writing—review and editing: T.M., Z.S. and A.K.; visualization: T.M., Z.S. and A.K.; supervision: T.M., Z.S. and A.K.; project administration: T.M., Z.S. and A.K.; funding acquisition: T.M., Z.S. and A.K. All authors have read and agreed to the published version of the manuscript.
Funding
The Article Processing Charge was financed under the European Funds for Silesia 2021–2027 Program, co-financed by the Just Transition Fund—project entitled “Supporting the staff in intensifying scientific activities in the field of transport transformation towards a green and digital economy”. Project number: FESL.10.25-IZ.01-03AF/23-00; project number at the Silesian University of Technology: 12/010/FSD24/1161.
Data Availability Statement
The original contributions presented in this study are included in this article. Further inquiries can be directed to the corresponding author.
Conflicts of Interest
The authors declare no conflicts of interest.
References
- Fishman, E.; Washington, S.; Haworth, N. Bike Share: A Synthesis of the Literature. Transp. Rev. 2013, 33, 148–165. [Google Scholar] [CrossRef]
- McQueen, M.; MacArthur, J.; Cherry, C. The E-Bike Potential: Estimating Regional e-Bike Impacts on Greenhouse Gas Emissions. Transp. Res. Part D Transp. Environ. 2020, 87, 102482. [Google Scholar] [CrossRef]
- Pojani, D.; Stead, D. Sustainable Urban Transport in the Developing World: Beyond Megacities. Sustainability 2015, 7, 7784–7805. [Google Scholar] [CrossRef]
- Turoń, K. Car-Sharing Systems in Smart Cities: A Review of the Most Important Issues Related to the Functioning of the Systems in Light of the Scientific Research. Smart Cities 2023, 6, 796–808. [Google Scholar] [CrossRef]
- Rérat, P. Cycling to Work: Meanings and Experiences of a Sustainable Practice. Transp. Res. Part A Policy Pract. 2019, 123, 91–104. [Google Scholar] [CrossRef]
- Turoń, K. Multi-Criteria Decision Analysis during Selection of Vehicles for Car-Sharing Services—Regular Users’ Expectations. Energies 2022, 15, 7277. [Google Scholar] [CrossRef]
- Ba Hung, N.; Lim, O. The Effects of Operating Conditions and Structural Parameters on the Dynamic, Electric Consumption and Power Generation Characteristics of an Electric Assisted Bicycle. Appl. Energy 2019, 247, 285–296. [Google Scholar] [CrossRef]
- Theurel, J.; Theurel, A.; Lepers, R. Physiological and Cognitive Responses When Riding an Electrically Assisted Bicycle versus a Classical Bicycle. Ergonomics 2012, 55, 773–781. [Google Scholar] [CrossRef]
- Hughey, S.M.; Sella, J.; Adams, J.D.; Porto, S.C.; Bornstein, D.; Brown, K.; Amahrir, S.; Michalaka, D.; Watkins, K.; Davis, W.J. It’s Electric! Measuring Energy Expenditure and Perceptual Differences between Bicycles and Electric-Assist Bicycles. J. Transp. Health 2022, 27, 101523. [Google Scholar] [CrossRef]
- Al-Gaadi, K.A. Testing the Accuracy of Autonomous GPS in Ground Speed Measurement. J. Appl. Sci. 2005, 5, 1518–1522. [Google Scholar] [CrossRef]
- Bourne, J.E.; Sauchelli, S.; Perry, R.; Page, A.; Leary, S.; England, C.; Cooper, A.R. Health Benefits of Electrically-Assisted Cycling: A Systematic Review. Int. J. Behav. Nutr. Phys. Act. 2018, 15, 116. [Google Scholar] [CrossRef]
- Matyja, T.; Kubik, A.; Stanik, Z. Possibility to Use Professional Bicycle Computers for the Scientific Evaluation of Electric Bikes: Velocity, Cadence and Power Data. Energies 2022, 15, 1127. [Google Scholar] [CrossRef]
- Evtimov, I.; Ivanov, R.; Staneva, G.; Kadikyanov, G. A Study on Electric Bicycle Energy Efficiency. Transp. Probl. 2017, 10, 131–140. [Google Scholar] [CrossRef]
- Fiori, C.; Ahn, K.; Rakha, H.A. Power-Based Electric Vehicle Energy Consumption Model: Model Development and Validation. Appl. Energy 2016, 168, 257–268. [Google Scholar] [CrossRef]
- Balbinot, A.; Milani, C.; Nascimento, J. A New Crank Arm-Based Load Cell for the 3D Analysis of the Force Applied by a Cyclist. Sensors 2014, 14, 22921–22939. [Google Scholar] [CrossRef]
- Yamashita, K.; Matsuda, A.; Ishikura, K.; Takagi, H.; Otsuka, S. Visualization of Pedaling Technique Using Cleat-Size Biaxial Load Cells. Procedia Eng. 2013, 60, 415–421. [Google Scholar] [CrossRef]
- Wang, E.L.; Hull, M.L. A Model for Determining Rider Induced Energy Losses in Bicycle Suspension Systems. Veh. Syst. Dyn. 1996, 25, 223–246. [Google Scholar] [CrossRef]
- Mandriota, R.; Fabbri, S.; Nienhaus, M.; Grasso, E. Sensorless Pedalling Torque Estimation Based on Motor Load Torque Observation for Electrically Assisted Bicycles. Actuators 2021, 10, 88. [Google Scholar] [CrossRef]
- Bertucci, W.; Pernin, J.N.; Grappe, F. Optimisation of pedalling technique from mechanical model of cycle-cyclist. Arch. Physiol. Biochem. 2002, 110, 44. [Google Scholar]
- Malizia, F.; Blocken, B. Bicycle Aerodynamics: History, State-of-the-Art and Future Perspectives. J. Wind Eng. Ind. Aerodyn. 2020, 200, 104134. [Google Scholar] [CrossRef]
- Martin, J.C.; Milliken, D.L.; Cobb, J.E.; McFadden, K.L.; Coggan, A.R. Validation of a Mathematical Model for Road Cycling Power. J. Appl. Biomech. 1998, 14, 276–291. [Google Scholar] [CrossRef]
- Van Erp, T.; Galis, G.; Kordi, M. Validity of Bicycle Mounted Pitot Tubes for Real-Time Analysis of Cyclists’ Drag Area for Outdoor Testing: Validity of Bicycle Mounted Pitot Tubes. J. Sci. Cycl. 2021, 10, 17–24. [Google Scholar] [CrossRef]
- Matyja, T.; Kubik, A.; Stanik, Z. Possibility to Use Professional Bicycle Computers for the Scientific Evaluation of Electric Bikes: Trajectory, Distance, and Slope Data. Energies 2022, 15, 758. [Google Scholar] [CrossRef]
- Fenre, M.D.; Klein-Paste, A. Rolling Resistance Measurements on Cycleways Using an Instrumented Bicycle. J. Cold Reg. Eng. 2021, 35, 04021001. [Google Scholar] [CrossRef]
- Steyn, W.; Warnich, J. Comparison of tyre rolling resistance for different mountain bike tyre diameters and surface conditions. S. Afr. J. Res. Sport Phys. Educ. Recreat. 2014, 36, 179–193. [Google Scholar]
- Crouch, T.N.; Burton, D.; LaBry, Z.A.; Blair, K.B. Riding against the Wind: A Review of Competition Cycling Aerodynamics. Sports Eng. 2017, 20, 81–110. [Google Scholar] [CrossRef]
- Forte, P.; Marinho, D.A.; Nikolaidis, P.T.; Knechtle, B.; Barbosa, T.M.; Morais, J.E. Analysis of Cyclist’s Drag on the Aero Position Using Numerical Simulations and Analytical Procedures: A Case Study. Int. J. Environ. Res. Public Health 2020, 17, 3430. [Google Scholar] [CrossRef]
- Malizia, F.; Van Druenen, T.; Blocken, B. Impact of Wheel Rotation on the Aerodynamic Drag of a Time Trial Cyclist. Sports Eng. 2021, 24, 3. [Google Scholar] [CrossRef]
- Dozza, M.; i Fernandez, A. Understanding Bicycle Dynamics and Cyclist Behavior From Naturalistic Field Data (November 2012). IEEE Trans. Intell. Transp. Syst. 2014, 15, 376–384. [Google Scholar] [CrossRef]
- Misgeld, B.J.E.; Bergmann, L.; Szilasi, B.; Leonhardt, S.; Greven, D. Virtual Torque Sensor for Electrical Bicycles. IFAC-Pap. 2020, 53, 8903–8908. [Google Scholar] [CrossRef]
- Witte, T.H.; Wilson, A.M. Accuracy of Non-Differential GPS for the Determination of Speed over Ground. J. Biomech. 2004, 37, 1891–1898. [Google Scholar] [CrossRef]
- Mario, N. E-Bike Energy Consumption Analysis. 2023. Available online: http://uu.diva-portal.org/smash/get/diva2:1840744/FULLTEXT01.pdf (accessed on 12 March 2025).
- Cao, Y.; Zhao, C.; Zhang, Y.; Jin, Y. Optimizing Resource Allocation and Energy Efficiency in Vehicle Mobile Edge Computing With Blockchain Integration. IEEE Internet Things J. 2025. [Google Scholar] [CrossRef]
- Zhai, X.; Li, Z.; Li, Z.; Xue, Y.; Chang, X.; Su, J.; Jin, X.; Wang, P.; Sun, H. Risk-Averse Energy Management for Integrated Electricity and Heat Systems Considering Building Heating Vertical Imbalance: An Asynchronous Decentralized Approach. Appl. Energy 2025, 383, 125271. [Google Scholar] [CrossRef]
- Ding, B.; Li, Z.; Li, Z.; Xue, Y.; Chang, X.; Su, J.; Sun, H. Cooperative Operation for Multiagent Energy Systems Integrated With Wind, Hydrogen, and Buildings: An Asymmetric Nash Bargaining Approach. IEEE Trans. Ind. Inform. 2025, 1–12. [Google Scholar] [CrossRef]
Disclaimer/Publisher’s Note: The statements, opinions and data contained in all publications are solely those of the individual author(s) and contributor(s) and not of MDPI and/or the editor(s). MDPI and/or the editor(s) disclaim responsibility for any injury to people or property resulting from any ideas, methods, instructions or products referred to in the content. |
© 2025 by the authors. Licensee MDPI, Basel, Switzerland. This article is an open access article distributed under the terms and conditions of the Creative Commons Attribution (CC BY) license (https://creativecommons.org/licenses/by/4.0/).
