Article

Nodal Carbon Emission Factor Prediction for Power Systems Based on MDBO-CNN-LSTM

1
Metrology Center, Guangdong Power Grid Co., Ltd., Guangzhou 510080, China
2
National Institute of Metrology of China, Beijing 100029, China
*
Author to whom correspondence should be addressed.
Energies 2025, 18(13), 3491; https://doi.org/10.3390/en18133491
Submission received: 9 May 2025 / Revised: 20 June 2025 / Accepted: 26 June 2025 / Published: 2 July 2025
(This article belongs to the Section B3: Carbon Emission and Utilization)

Abstract

Carbon emission estimation for power systems is essential for identifying emission responsibilities and formulating effective mitigation measures. Current carbon emission prediction methods for power systems exhibit limited computational efficiency and inadequate noise immunity under complex operating conditions. In this study, we address these limitations by improving population initialization, search mechanisms, and iteration strategies and developing a hybrid strategy Modified Dung Beetle Optimization (MDBO) algorithm. This led to the development of an MDBO-enhanced Convolutional Neural Network–Long Short-Term Memory (CNN-LSTM) network hybrid prediction model for carbon emission prediction. Firstly, the theoretical calculation mechanism of carbon emission flow in power systems is analyzed. Subsequently, an MDBO-CNN-LSTM deep network architecture is constructed, with detailed explanations of its fundamental structure and operational principles. Then, the proposed MDBO-CNN-LSTM model is utilized to predict the nodal carbon emission factor of power systems with the integration of renewable energy sources. Comparative experiments with conventional CNN-LSTM models are conducted on modified IEEE 30-, 118-, and 300-bus test systems. The results show that the maximum mean squared error of the proposed method does not exceed 0.5734% in the strong-noise scenario for the 300-bus system, which is reduced by half compared with the traditional method. The proposed method exhibits enhanced robustness under strong noise interference, providing a novel technical approach for precise carbon accounting in power systems.

1. Introduction

The emission of carbon dioxide has reached the highest levels since its monitoring began, which is regarded as a key factor contributing to the increase in extreme climate events [1]. As an important energy source in modern industry, the power industry contributes the largest proportion of carbon emissions, which accordingly plays a pivotal role in carbon reduction efforts [2]. In China, carbon emissions from the power industry account for over 40% of the nation’s total carbon emissions [3]. The dual carbon goals were proposed in order to achieve carbon peaking by 2030 and carbon neutrality by 2060 [4]. The construction of a new type of power system centered on renewable energy generation has been initiated as a key strategy [5]. Accurate estimation of carbon emissions in power systems can indicate the carbon transmission from the generation side to the consumption side. As a result, the emission responsibilities of each segment in the power system can be identified during energy consumption. Carbon emission estimation will lay a solid foundation for developing emission reduction measures and achieving carbon neutrality goals.
Currently, carbon emission estimation methods in power systems primarily fall into two categories: model-driven and data-driven methods [6,7]. Model-driven methods were proposed by Chongqing Kang et al. [8], combining carbon emission analysis with power flow, whose computational efficiency is improved in [9]. Power transmission loss is further considered in [10]. Theoretically, the carbon emission factor of each node can be derived directly based on measurements of power flow for a whole power system [11]. However, due to issues such as electromagnetic interference and the degradation of measurement equipment performance, noise and anomalies are inevitably present in sensor measurement data, making model-driven methods inadequate for tracing carbon emissions from noise-contaminated measurements. As a consequence, model-based methods suffer from enormous uncertainty and the resulting computational burdens [12].
In contrast, data-driven methods explore the intrinsic relationship between carbon emissions and electrical quantities, leveraging intelligent algorithms to learn from historical data. In Ref. [13], different periods of carbon emission factors in the time dimension are mainly considered and integrated by the algorithm TimesNet. Aiming at short-term prediction of carbon emissions, Sun et al. present a combined model of decomposition and prediction, composed of ensemble empirical mode decomposition and a backpropagation neural network [14]. The accuracy of short-term carbon emission prediction was confirmed to be improved by decomposing before predicting [14]. For community carbon emissions, a support vector regression model is trained in [15]. A Long Short-Term Memory (LSTM)-based carbon emission factor prediction method shows superior performance in time series modeling [16]. Ref. [17] proposes a discounted mean square forecast error combination model optimized by the quantum harmony search algorithm, enhancing prediction accuracy through dynamic adjustment of discount factors. Although data-driven approaches allow for the prediction of carbon emissions in power systems, the noisy data measured by power system sensors make it difficult for existing methods to capture carbon emission features fully, which limits the accuracy and resistance to noise in carbon emission calculations. Meanwhile, the complexity of power grids is rising with the integration of renewable energy sources as well as the growing demand due to the electrification of the heat and mobility sectors, leading to difficulties in global convergence of carbon emission calculations, especially for large-scale systems. A hybrid model is employed in [18], integrating a generalized regression neural network and grey wolf optimization, achieving carbon emission prediction by decomposing non-stationary emission sequences. Furthermore, Particle Swarm Optimization is combined with Convolutional Neural Network (CNN)-LSTM to predict carbon emission, improving accuracy through wavelet packet decomposition denoising [19]. However, its random initialization strategy may result in uneven population distribution, hindering comprehensive coverage of the global search space.
Dung Beetle Optimization (DBO) is a swarm intelligence meta-heuristic algorithm, inspired by the natural behaviors of dung beetles, designed to address complex optimization problems. This algorithm has been widely applied in maximum power point tracking for photovoltaic systems [20] and photovoltaic power prediction [21]. However, traditional DBO faces issues such as susceptibility to local optima and relatively low search accuracy and convergence speed in high-dimensional or complex problems. In this case, several methods have been developed, including the Enhanced DBO (EDBO) [22] and the Multi-Strategy Improved DBO (MDBO) [23].
To address the computational efficiency and noisy sensitivity issues in existing data-driven methods, this paper proposes a Modified Dung Beetle Optimization (MDBO) enhanced CNN-LSTM method, i.e., MDBO-CNN-LSTM, for carbon emission factor prediction in power systems. The MDBO enhances the global search capability of the traditional Dung Beetle Optimization (DBO) algorithm by integrating spatial–temporal–multi-dimensional (SPM) chaotic mapping for population initialization, adaptive probability threshold adjustment, and differential mutation perturbation. Therefore, in this paper, combined with CNN’s spatial feature extraction and LSTM’s complex relationship modeling, the MDBO-CNN-LSTM framework is proposed for carbon emission factor prediction, which can maintain robust performance even under strong noise interference and has not been applied to carbon emission analysis. The main contributions are summarized as follows:
(1)
Hybrid strategies are utilized to modify and improve the global search capability of the Dung Beetle Optimization algorithm.
(2)
The MDBO-CNN-LSTM model is proposed to improve accuracy and robustness under noise interference for carbon emission prediction of power systems.
(3)
Simulation experiments of different scale test systems are conducted to verify the effectiveness and generalization of the proposed method.
The rest of this paper is organized as follows. Section 2 analyzes the calculation method for nodal carbon emission factors of power systems based on the carbon flow theory. Section 3 constructs the MDBO-CNN-LSTM model. And subsequently, the model is utilized to predict the nodal carbon emission factors of power systems and the overall process of the proposed method is carried out in Section 4. Section 5 presents various experimental verification, and finally, Section 6 gives the conclusions and suggests future work.

2. Calculation of Nodal Carbon Emission Factors for Power Systems

In the power system, power generation and power consumption are contributed by nodes of the power system. As the power is transmitted from power plants to nodes, due to the line loss, the actual power reaching the user side is less than the generated power, thus triggering changes in the node carbon emission factor [8]. The carbon emission factor is not only a reflection of carbon emissions in the power system but also an essential basis for distribution network optimization and energy saving.
(1)
Branch carbon emissions
Branch carbon emissions are the most basic physical quantity describing the carbon flow. It is used to characterize the size of the carbon flow on the tributary, expressed by F. Branch carbon emissions are defined as the cumulative amount of carbon emissions corresponding to the carbon flow that passes through a specific tributary with the current in a given time. The unit of carbon emission is generally expressed as tCO2 or kgCO2. In this way, the mass of CO2 is used as the basis for calculating the mass of greenhouse gases in the emitted gases.
(2)
Branch carbon flow rate
The branch carbon flow rate is defined as the carbon flow through a feeder in a unit of time with the tidal current, denoted by the symbol R. It is numerically equal to the derivative of the nodal carbon flow with respect to time in tCO2/h or kgCO2/s:
R = d F d t = Δ F Δ t = Δ F t i t i 1
where R is the nodal carbon flow rate, ΔF is the product of the electrical energy passed to generate a pulse and the carbon emission factor, and Δt denotes the moment difference between the ith and the i-1th pulse generated.
(3)
Branch carbon flow rate
Considering that carbon emissions in the power system are mainly related to the active tidal current, to characterize the combination of the two, the ratio of the carbon flow rate to the active power flow in any branch of the power system is defined as the carbon flow density of that branch, denoted by the symbol ρ:
ρ = R P
where R is the carbon flow rate at the node, P is the power passing through the node, and ρ is in kgCO2/kWh.
Since both the nodal carbon flow rate and the active power flow describe instantaneous values, the branch carbon flow density varies in the system as the power flow changes. The average nodal carbon flow density ρ ¯ for a given time period is defined as
ρ ¯ = R d t P d t = F Q
where the average carbon flow density of the node is obtained from the cumulative volume calculation, i.e., the ratio of carbon emissions over a period of time to the amount of electricity passing through the branch.
(4)
The calculation of nodal carbon potential
The nodal carbon potential of the power system is denoted by the symbol e, expressed as follows:
e = i N + P i ρ i i N + P i = i N + R i i N + P i
where N+ is the set of all branches connected to the node that have current flowing into the node and i is the branch number. The physical meaning of the node carbon potential is the equivalent value of carbon emissions on the generation side caused by consuming a unit of electricity at the node. For a power plant node, its nodal carbon potential is equal to the real-time carbon emission intensity of the power plant’s power generation. The node carbon potential has the same magnitude as the node carbon flow density, both kgCO2/kWh. It is numerically equal to the weighted average of the carbon flow density ρi of all the tributaries that flow into the node with respect to the active power flow Pi.

3. MDBO-CNN-LSTM Prediction Model

MDBO-CNN-LSTM mainly consists of two parts: the MDBO algorithm and the CNN-LSTM algorithm. The former is improved on the basis of Dung Beetle Optimization (DBO), while the latter integrates the CNN and the LSTM.

3.1. MDBO Algorithm

The DBO algorithm mimics dung beetles’ ball-rolling, breeding, foraging, and stealing behaviors to achieve global optimization [24]. The DBO is enhanced and modified into the MDBO through a hybrid strategy consisting of population initialization, search mechanisms, and iteration strategies.

3.1.1. DBO Algorithm

Key mathematical formulations include behaviors of ball-rolling, breeding, foraging, and stealing, as follows:
(1)
Ball-rolling behavior
Obstacle-free mode is described by
x i t + 1 = x i t + a k x i t 1 + b x i t x w o r s t t
where t is the current number of iterations; x i t is the position of the ith dung beetle in the population in t iterations; k is the deflection factor (k ∈ [0, 0.2]); a is the directional deviation coefficient (a = 1: no deviation; a = −1: full deviation); b is a random constant (b ∈ [0, 1]); and x w o r s t t denotes the position of the worst individual in the current population.
Obstacle mode is described by
x i t + 1 = x i t + tan θ x i t x i t 1
where θ is the deflection angle. The position is not updated when θ = 0, π/2, π.
(2)
Breeding behavior
Dynamic adjustment of breeding area boundaries is represented as
Lb 1 = max x g b e s t t 1 1 t T , Lb Ub 1 = min x g b e s t t 1 + 1 t T , Ub
The offspring position is updated by
x i t + 1 = x g b e s t t + b 1 x i t Lb 1 + b 2 x i t Ub 1
where T is the maximum number of iterations; x g b e s t t is the global optimality of breeding groups; b1 and b2 are 1 × D random matrices; Lb and Ub represent upper and lower bounds on the parameters of the CNN to be optimized, respectively; Lb1 and Ub1 represent the lower and upper bounds of spawning, respectively; x i t + 1 is the position of chick i in the breeding group after t-th updates.
(3)
Foraging behavior
The foraging area boundary is adjusted by
Lb 2 = max x l b e s t t 1 1 t T , Lb Ub 2 = min x l b e s t t 1 + 1 t T , U b
The position is updated from
x i t + 1 = x i t + c 1 x i t Lb 2 + c 2 x i t Ub 2
where Lb2 and Ub2 represent the lower and upper bounds of the foraging areas, respectively; x l b e s t t is the global optimality of foraging groups; c1 is the random number between 0 and 1 normally distributed; and c2 is a random vector of 1 × D between 0 and 1.
(4)
Stealing behavior
The location update formula for the steal group of beetles is formed by
x i t + 1 = x l b e s t t + S g x i t x g b e s t t + x i t x l b e s t t
where g is a random vector obeying a normal distribution; S is a constant.

3.1.2. Multi-Strategy Enhanced DBO Algorithm

The Dung Beetle Optimization algorithm has a poor balance between global exploration and local exploitation, which makes it prone to getting trapped in local optima. To overcome these limitations, the following three strategies are proposed to improve the Dung Beetle Optimization algorithm and enhance its global search capability:
(1)
Population initialization based on SPM chaos mapping
Traditional DBO algorithm random initialization may lead to uneven population distribution. By using SPM chaotic mapping to initialize the dung beetle population, a more evenly distributed initial population is generated, thereby improving the quality of the initial solutions. The mathematical expression is as follows:
x i + 1 = mod x i η + μ sin π x i + r , 1 , 0 x i < η mod x i η 0.5 η + μ sin π x i + r , 1 , 0 x i < 0.5 mod 1 x i η 0.5 η + μ sin π 1 x i + r , 1 , 0 x i < 1 η mod 1 x i η + μ sin π 1 x i + r , 1 , 1 η x i < 1
where r is a random number between 0 and 1; when μ ∈ (0, 1) and η ∈ (0, 1), the function is in a chaotic state. In the experiment, η = 0.4, μ = 0.3 are set.
(2)
Adaptive probability threshold adjustment
To address obstacle-induced position updates in ball-rolling beetles, an adaptive probability threshold adjustment strategy is introduced. This strategy expands the search scope and dynamically selects predation strategies suitable for the current population at different stages, balancing global exploration and local exploitation. The adaptive threshold formula is defined as
adaptive_p = 1 1 1 + λ λ t λ T λ + μ t μ T μ
where the adaptive probability threshold varies within the interval (0, 1]; t represents the current iteration count; T denotes the maximum iteration count; and λ and μ are control parameters. In the experiments, λ = 3 and μ = 2 are set. A higher initial threshold prioritizes global exploration, while a reduced threshold in later stages emphasizes local exploitation.
(3)
Perturbation strategies based on differential variation
During the iterative process, dung beetles progressively converge toward the current global optimum. However, premature convergence to local optima may occur, which can be avoided by enriching the diversity of the population. A differential mutation perturbation strategy is incorporated during position updates to enhance population diversity and improve the balance between global exploration and local exploitation. The mutation formula is defined as
X i , j t + 1 = X r 1 . j t + F X r 2 . j t X r 3 , j t
where i is the ith individual of the population, with j as the jth dimensional variable; F is the scaling factor, set to 0.6 in the experiment; and Xr1, Xr2, and Xr3 are randomly selected individuals whose difference perturbs the current individual Xi, effectively avoiding local optima.

3.2. CNN-LSTM Algorithm

Due to the complexity and instability of the power system, traditional prediction models make it difficult to capture the features fully and thus cannot make accurate predictions for the carbon emission factor. The CNN-LSTM model combines the spatial feature extraction ability of CNN with the complex relationship modeling ability of LSTM, making it suitable for predicting carbon emission factors at power system nodes.

3.2.1. One-Dimensional Convolutional Neural Network

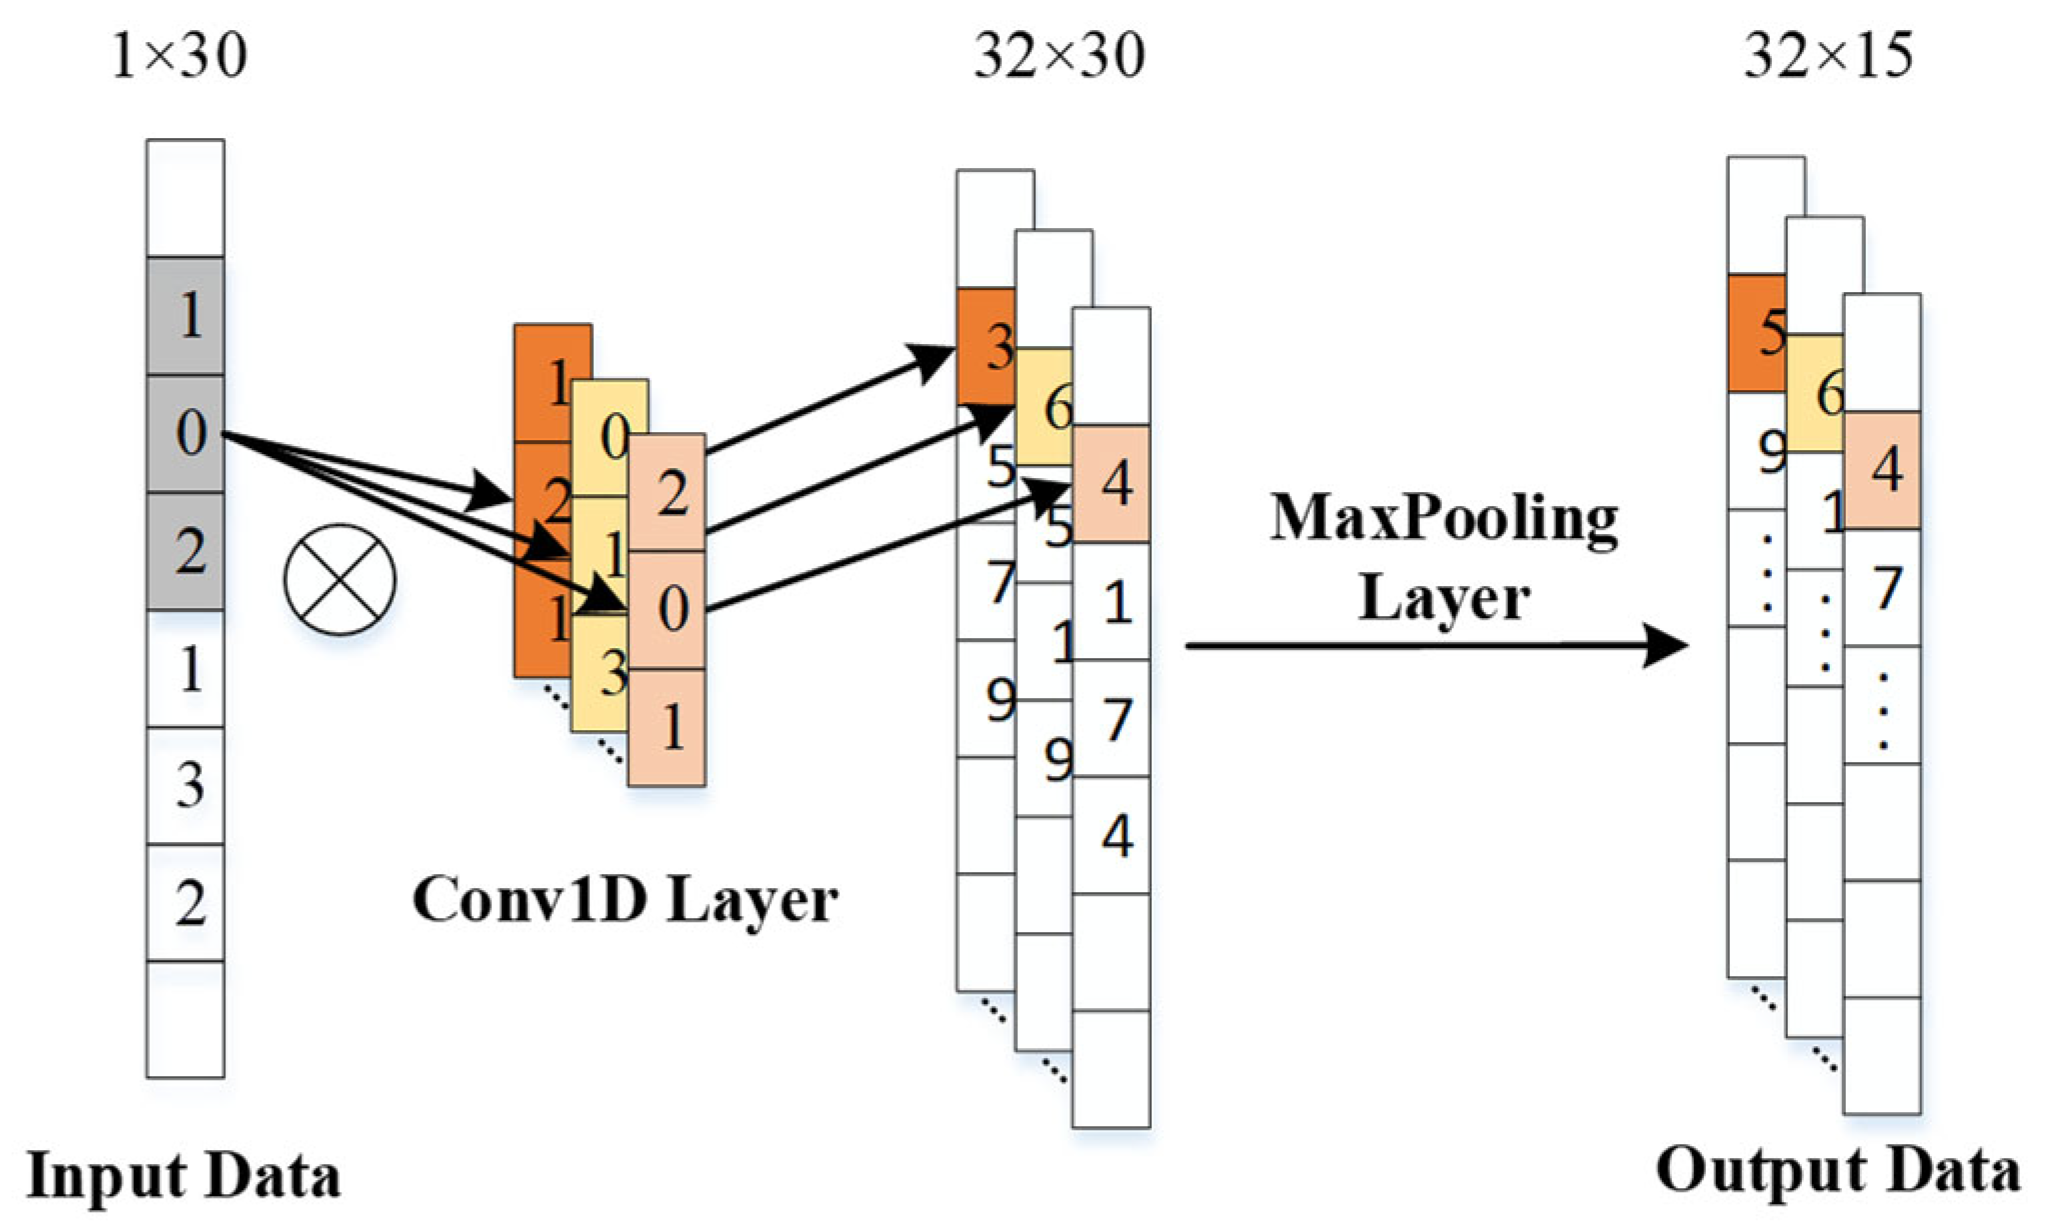
A one-dimensional convolutional neural network (1D-CNN) mainly consists of a one-dimensional convolutional layer, pooling layer, and activation function, whose model structure is shown in Figure 1. The local perceptual characteristics of this structure effectively mine the nonlinear coupling relationships between features. By sliding the convolutional kernel along the node dimension, it can automatically capture the spatial features of regional power flow.
1D-CNN performs convolution operations between the input one-dimensional sequence and the convolutional kernel, effectively capturing local features of the data. Its mathematical model is as follows:
O i = f W i I + b i
where Wi and bi represent the weights and bias of the i-th layer, respectively; * denotes the convolution operation; and f is the activation function.

3.2.2. Long Short-Term Memory Network

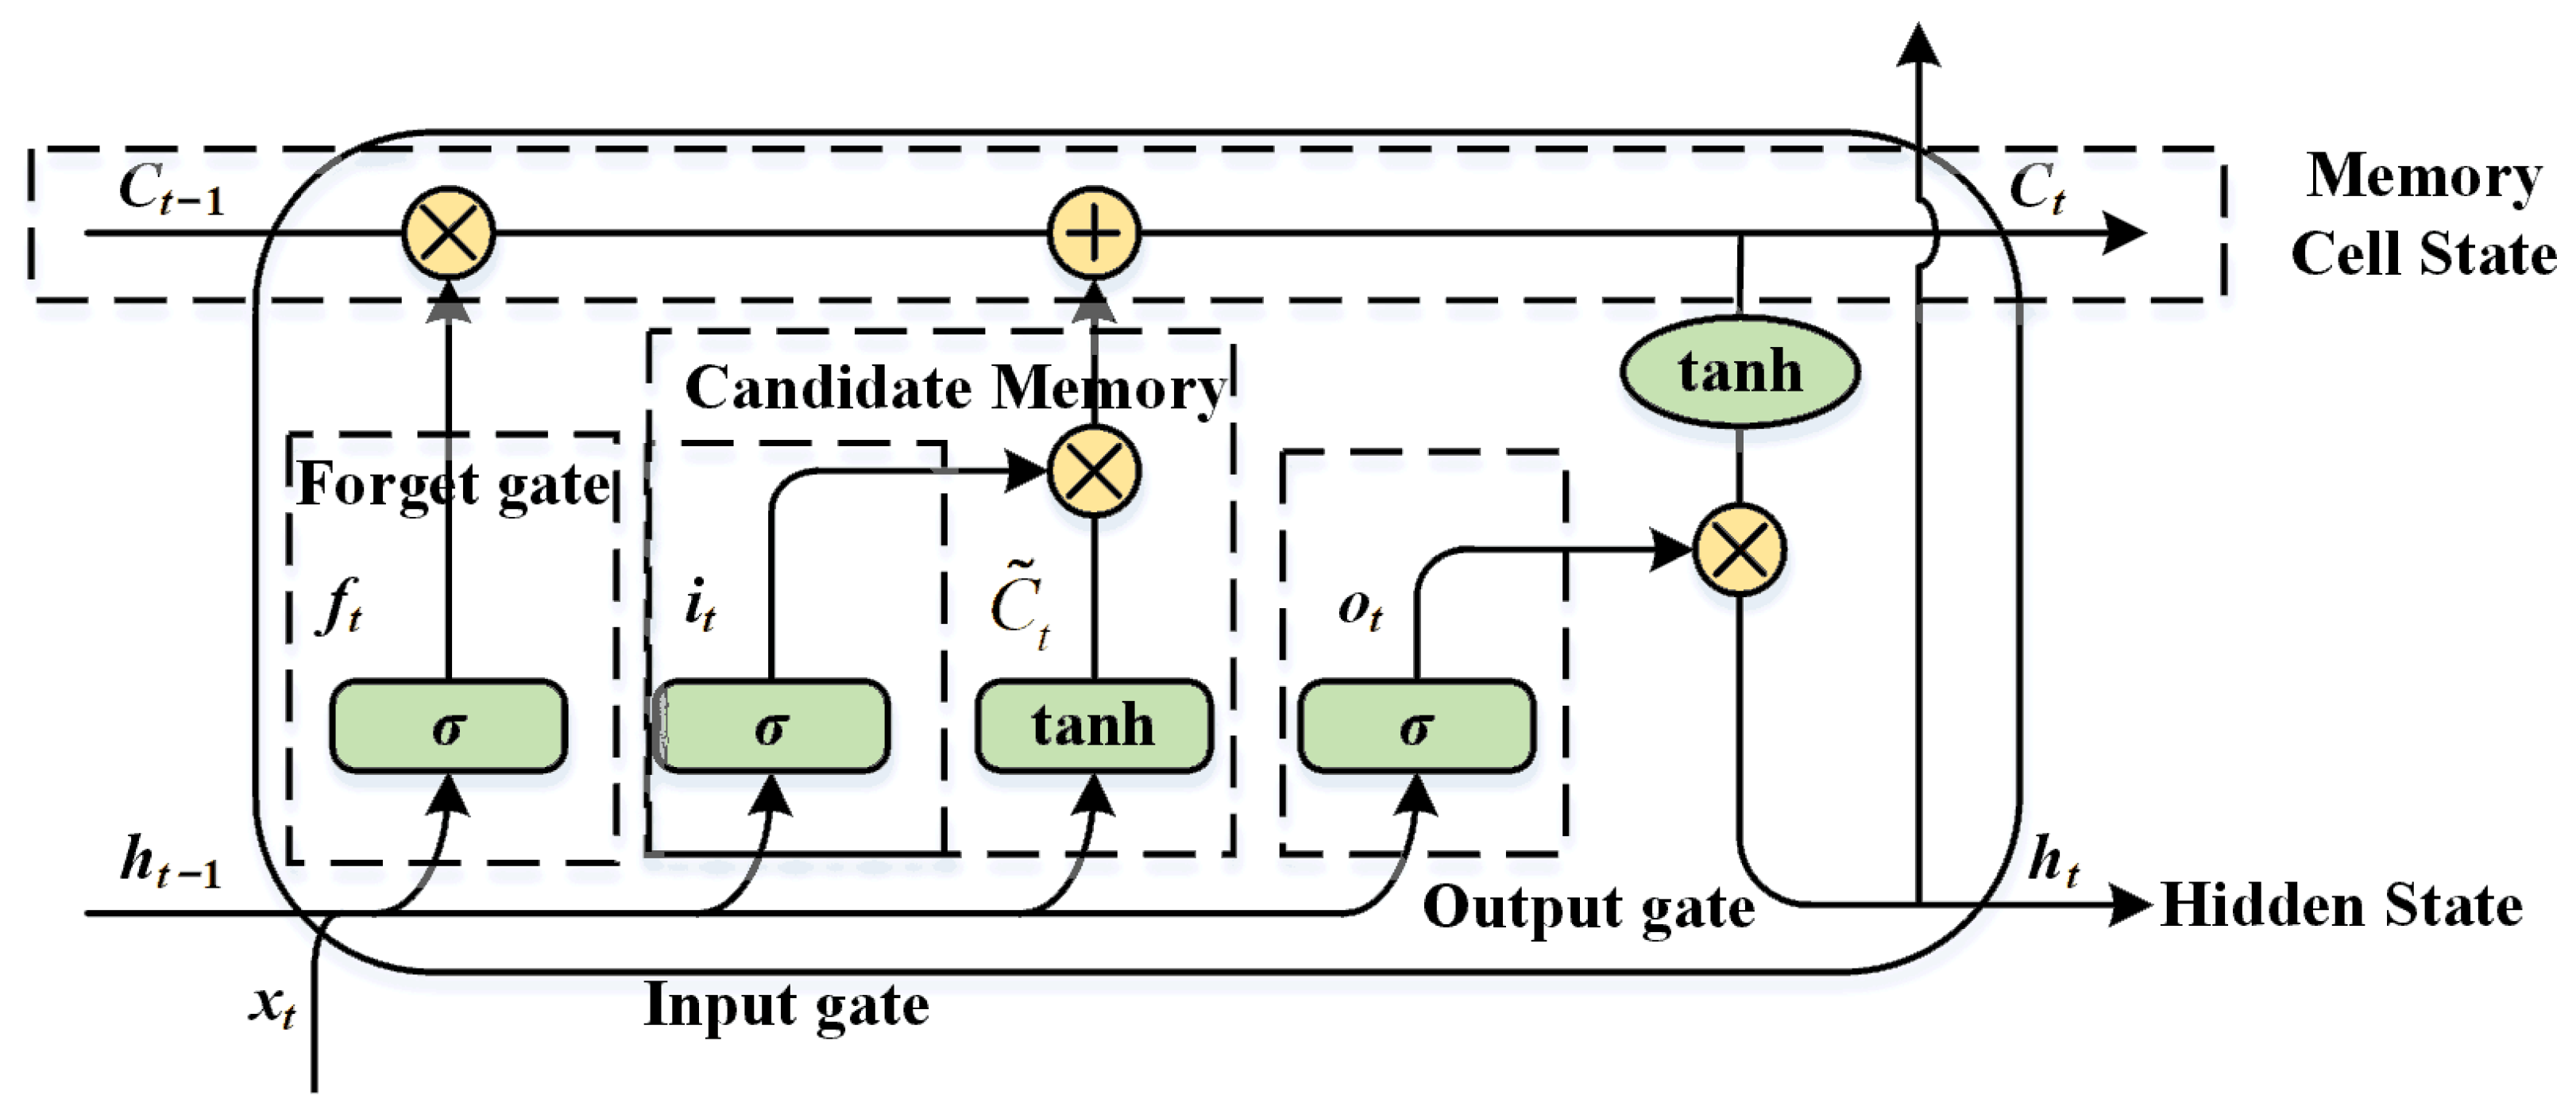
LSTM controls the memory information of time series data by adding memory cells to the hidden layer. Composed of three gates (input gate, forget gate, output gate) and a memory cell state, LSTM can better deal with long-term dependencies in the sequences. The key to LSTM is the cell state, which is similar to a conveyor belt. Running directly over the entire chain, with only a few linear interactions, it is easy for information to flow over it to remain constant. The LSTM model structure is shown in Figure 2.
(1) Forget gate: The forget gate determines which information to retain in and discard from the memory unit state, which is determined by
f t = σ ( W f × h t 1 , x t + b f )
where ft is the output of the forget gate; σ is the sigmoid activation function; Wf is the weight matrix; xt is the input information; ht−1 is the previous hidden state; and bf is the bias vector.
(2) Input gate: The input gate determines which information to store in the memory cell.
i t = σ ( W i × h t 1 , x t + b i )
C ˜ t = tanh ( W C × h t 1 , x t + b C )
where it is the output of the input gate that determines which information can be updated in the memory cell and C ˜ t is the candidate memory cell that updates the information in the memory cell.
(3) Memory cell state: The memory cell state is updated by combining the outputs of the forget gate and input gate.
C t = f 1 C t 1 + i t C ˜ t
where * indicates element-wise product.
(4) Output gate: The output gate determines which information is transmitted from the memory cell state to the hidden state:
o t = σ ( W o × [ h t 1 , x t ] + b o
h t = o t tanh ( C t )
The final hidden state ht serves as the output, encapsulating information from the current time step. In carbon emission factor prediction for power system nodes, the LSTM effectively learns long-term dependency features from diverse renewable energy generation scenarios, significantly improving prediction accuracy.

3.3. MDBO-CNN-LSTM Model

By integrating MDBO and CNN-LSTM, the issues of noise sensitivity and low computational efficiency in power system carbon emission factor prediction are expected to be addressed; a diagram of this is shown in Figure 3.
The proposed model combines the local feature extraction capability of CNNs with the complex relationship modeling ability of LSTM [25], while utilizing the MDBO algorithm to optimize network hyperparameters, forming an end-to-end prediction framework. In the prediction of node carbon emission factors for power systems, the MDBO algorithm is applied to optimize hyperparameters in the CNN-LSTM model, including the learning rate, number of convolutional kernels, number of LSTM hidden units, number of fully connected layer neurons, and batch size, thereby enhancing the model’s prediction accuracy. It is worth mentioning that deep hybrid models face inherent overfitting risks in high-dimensional power system scenarios. As a consequence, the dropout rates are set in LSTM and fully connected layer neurons to suppress potential overfitting risks. The hyperparameters of the CNN-LSTM model are assigned to the position of the dung beetle individual in MDBO, while the loss value of the CNN-LSTM model is defined as the fitness variable. During MDBO initialization, the position vector of each dung beetle individual is randomly initialized as a set of hyperparameter values. Throughout the optimization process, positions are updated through social behaviors such as rolling and stealing. The fitness variable is utilized to evaluate the quality of each hyperparameter combination, seeking the optimal hyperparameters that minimize the loss. Ultimately, the globally optimal position of MDBO is used as the optimal hyperparameter for the CNN-LSTM model.
The optimization strategy is critical for ensuring efficient training and stable performance. The Adam optimizer is employed in this work. As a gradient descent-based adaptive optimization method, Adam integrates the advantages of momentum and adaptive learning rates. It automatically adjusts learning rates to accelerate convergence while maintaining robustness in handling complex datasets [26]. At each iteration step t, Adam updates the model parameters by the following equation:
g t = θ L t m t = β 1 m t 1 + ( 1 β 1 ) g t v t = β 2 v t 1 + ( 1 β 2 ) g t 2 m ^ t = m t 1 β 1 t v ^ t = v t 1 β 2 t θ = θ α m ^ t v ^ t + e

4. Prediction for Nodal Carbon Emission Factors Based on MDBO-CNN-LSTM Model

4.1. Generation of Data Sets Considering Renewable Energy Fluctuations

Based on the power system’s historical operation data, a Latin hypercubic sampling method is used to generate the dataset for the model. This sampling method ensures the sample points are uniformly distributed in the whole variable space to better explore different operation scenarios and avoid the model’s overdependence on specific scenarios. At the same time, the model’s generalization ability can be improved to reduce the risk of model overfitting, making it better adapted to the actual power system operation.

4.1.1. Data Collection

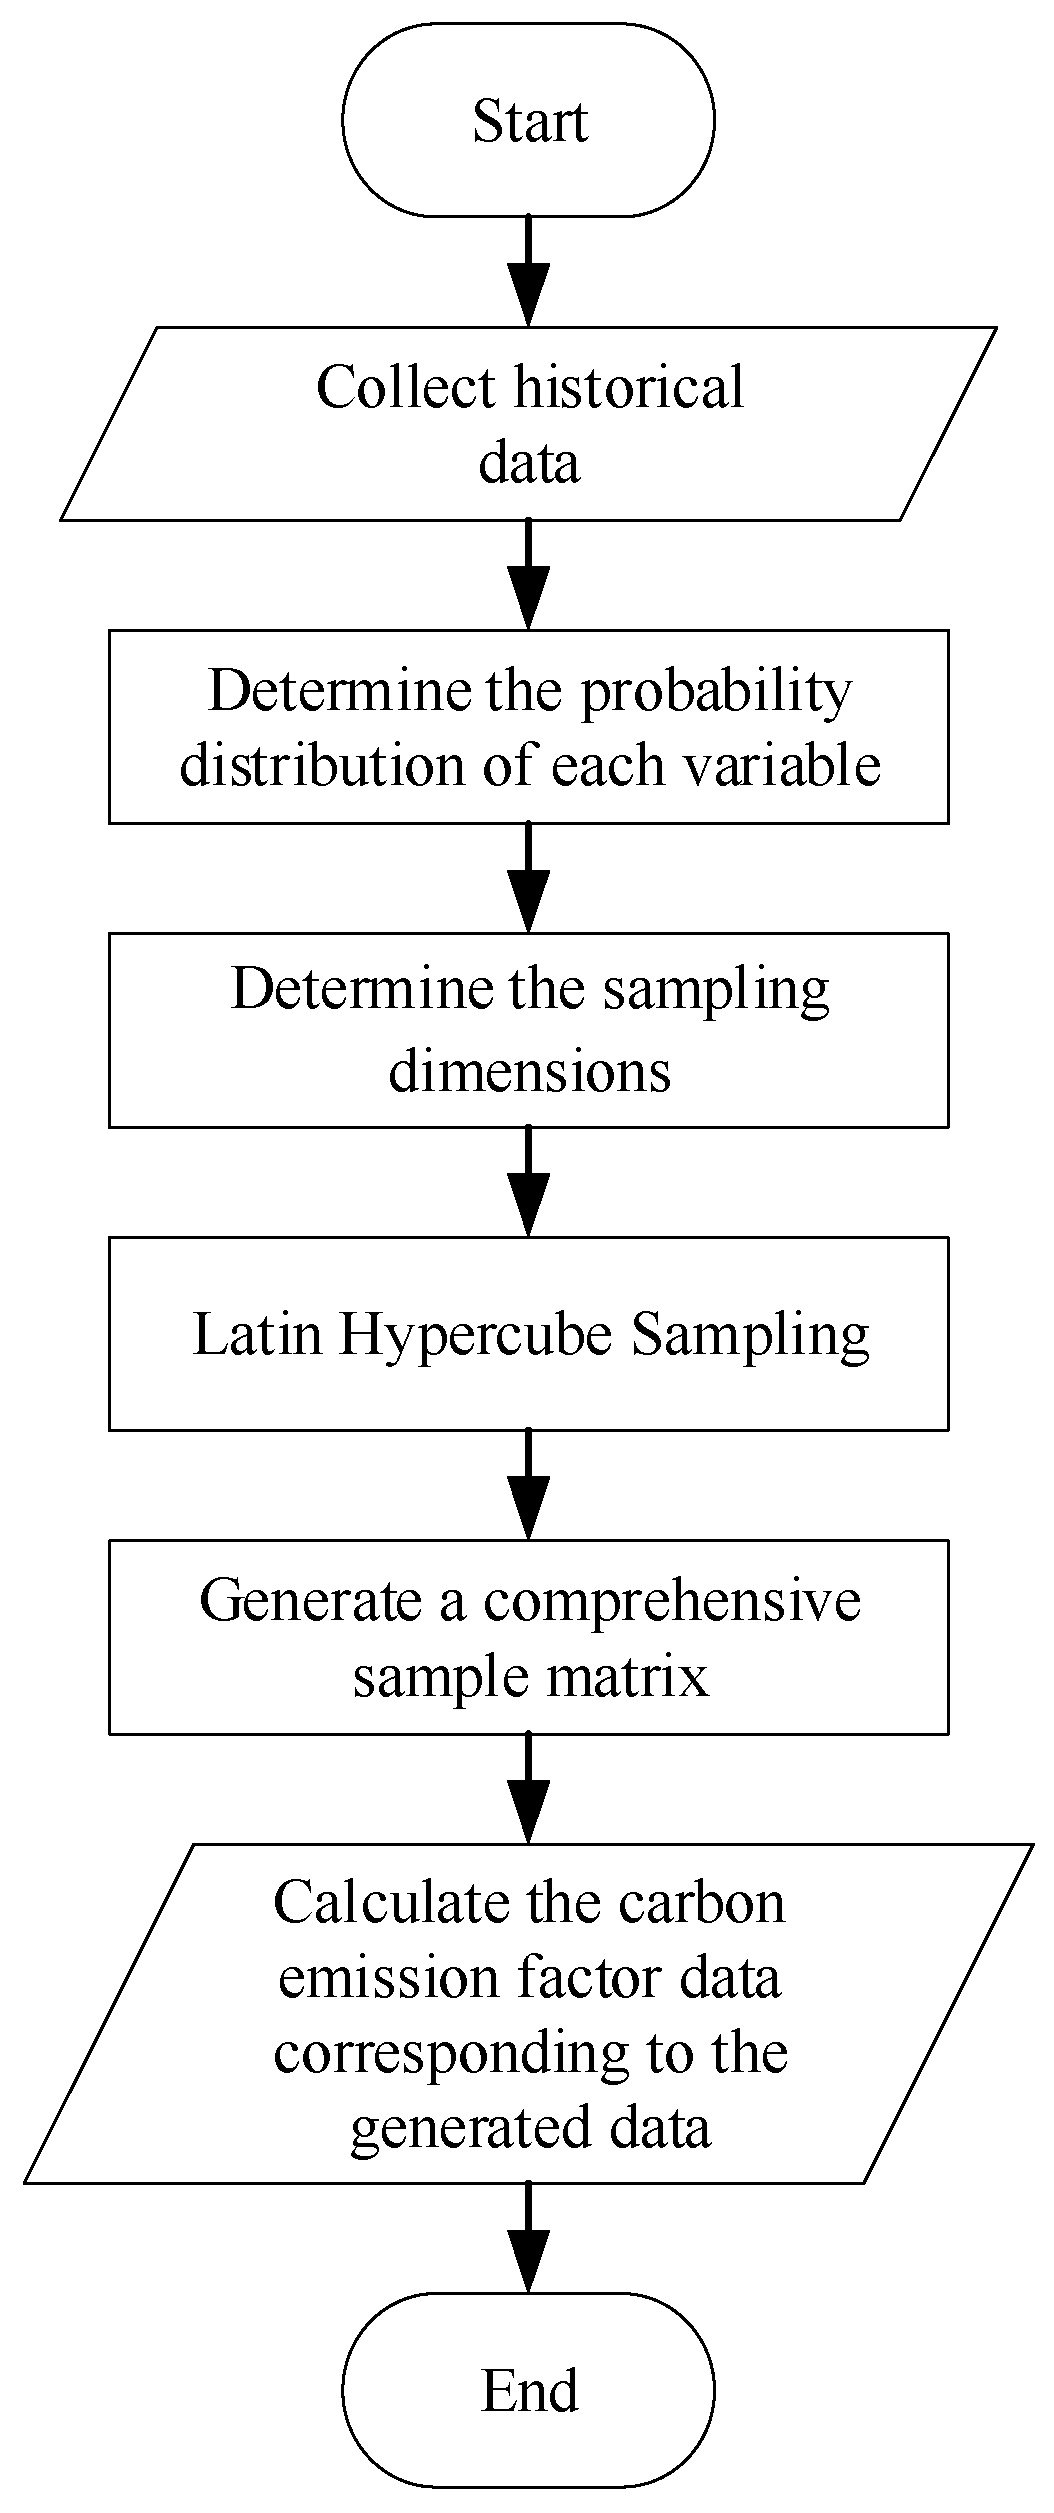
The steps for generating the dataset considering renewable energy fluctuations are shown in Figure 4.
(1)
Based on the collected historical data, the electricity consumption of each node and the proportion of different energy types (wind power and photovoltaic power) in the power generation structure are determined. The probability distribution of electricity consumption and the probability distribution of the proportion of energy sources at each node are fit, respectively.
(2)
The model complexity and training cost are considered to determine the sampling dimension. Considering the complexity of the model, the sampling dimension needs to cover a variety of possible operating states of the power system. At the same time, it should not be too large so as not to increase the computational cost. In addition, the predictive performance of the model under different sampling dimensions is evaluated using cross-validation to select the optimal sampling dimension. Up to this point, the sampling dimension of the hybrid model data, i.e., the number of sample points required, can be determined.
(3)
The Latin hypercube sampling for each variable is performed by dividing its probability distribution into equal probability intervals. Sample points are selected randomly within each interval to ensure a uniform distribution of sample points in the entire variable space.
(4)
A composite sample matrix is generated and normalized.
(5)
The system’s nodal carbon emission data are obtained using Equations (1)–(4).
By following the above steps, the obtained dataset is generated by considering different scenarios of renewable energy fluctuations, which can reflect the operating conditions of the power system comprehensively, thus providing the data basis for carbon emission factor prediction.

4.1.2. Data Normalization

In order to improve the efficiency of model training, Min–Max normalization is applied to preprocess the data. The feature values of the data are transformed into the [0, 1] range to avoid interference in model training and feature learning due to the scale differences in different features. The specific formula is as follows:
X norm = X X min X max X min
where X is the original data point; Xmin is the minimum value in the feature column; Xmax is the maximum value in the feature column; and Xnorm is the normalized data point.

4.1.3. Dataset Partitioning

After data normalization, the dataset is divided into training and validation sets. The training set is used for model training, while the validation set evaluates model performance and optimizes hyperparameter configurations. Additionally, an independent test set is constructed to assess the model’s generalization capability on unseen data.

4.2. MDBO-CNN-LSTM Model Training

The MDBO algorithm exhibits high convergence efficiency and solution accuracy in both global search and local exploitation phases. Applying the MDBO algorithm for parameter optimization effectively enhances the prediction accuracy of the CNN-LSTM model. The search ranges for hyperparameters in the MDBO-CNN-LSTM framework are summarized in Table 1.
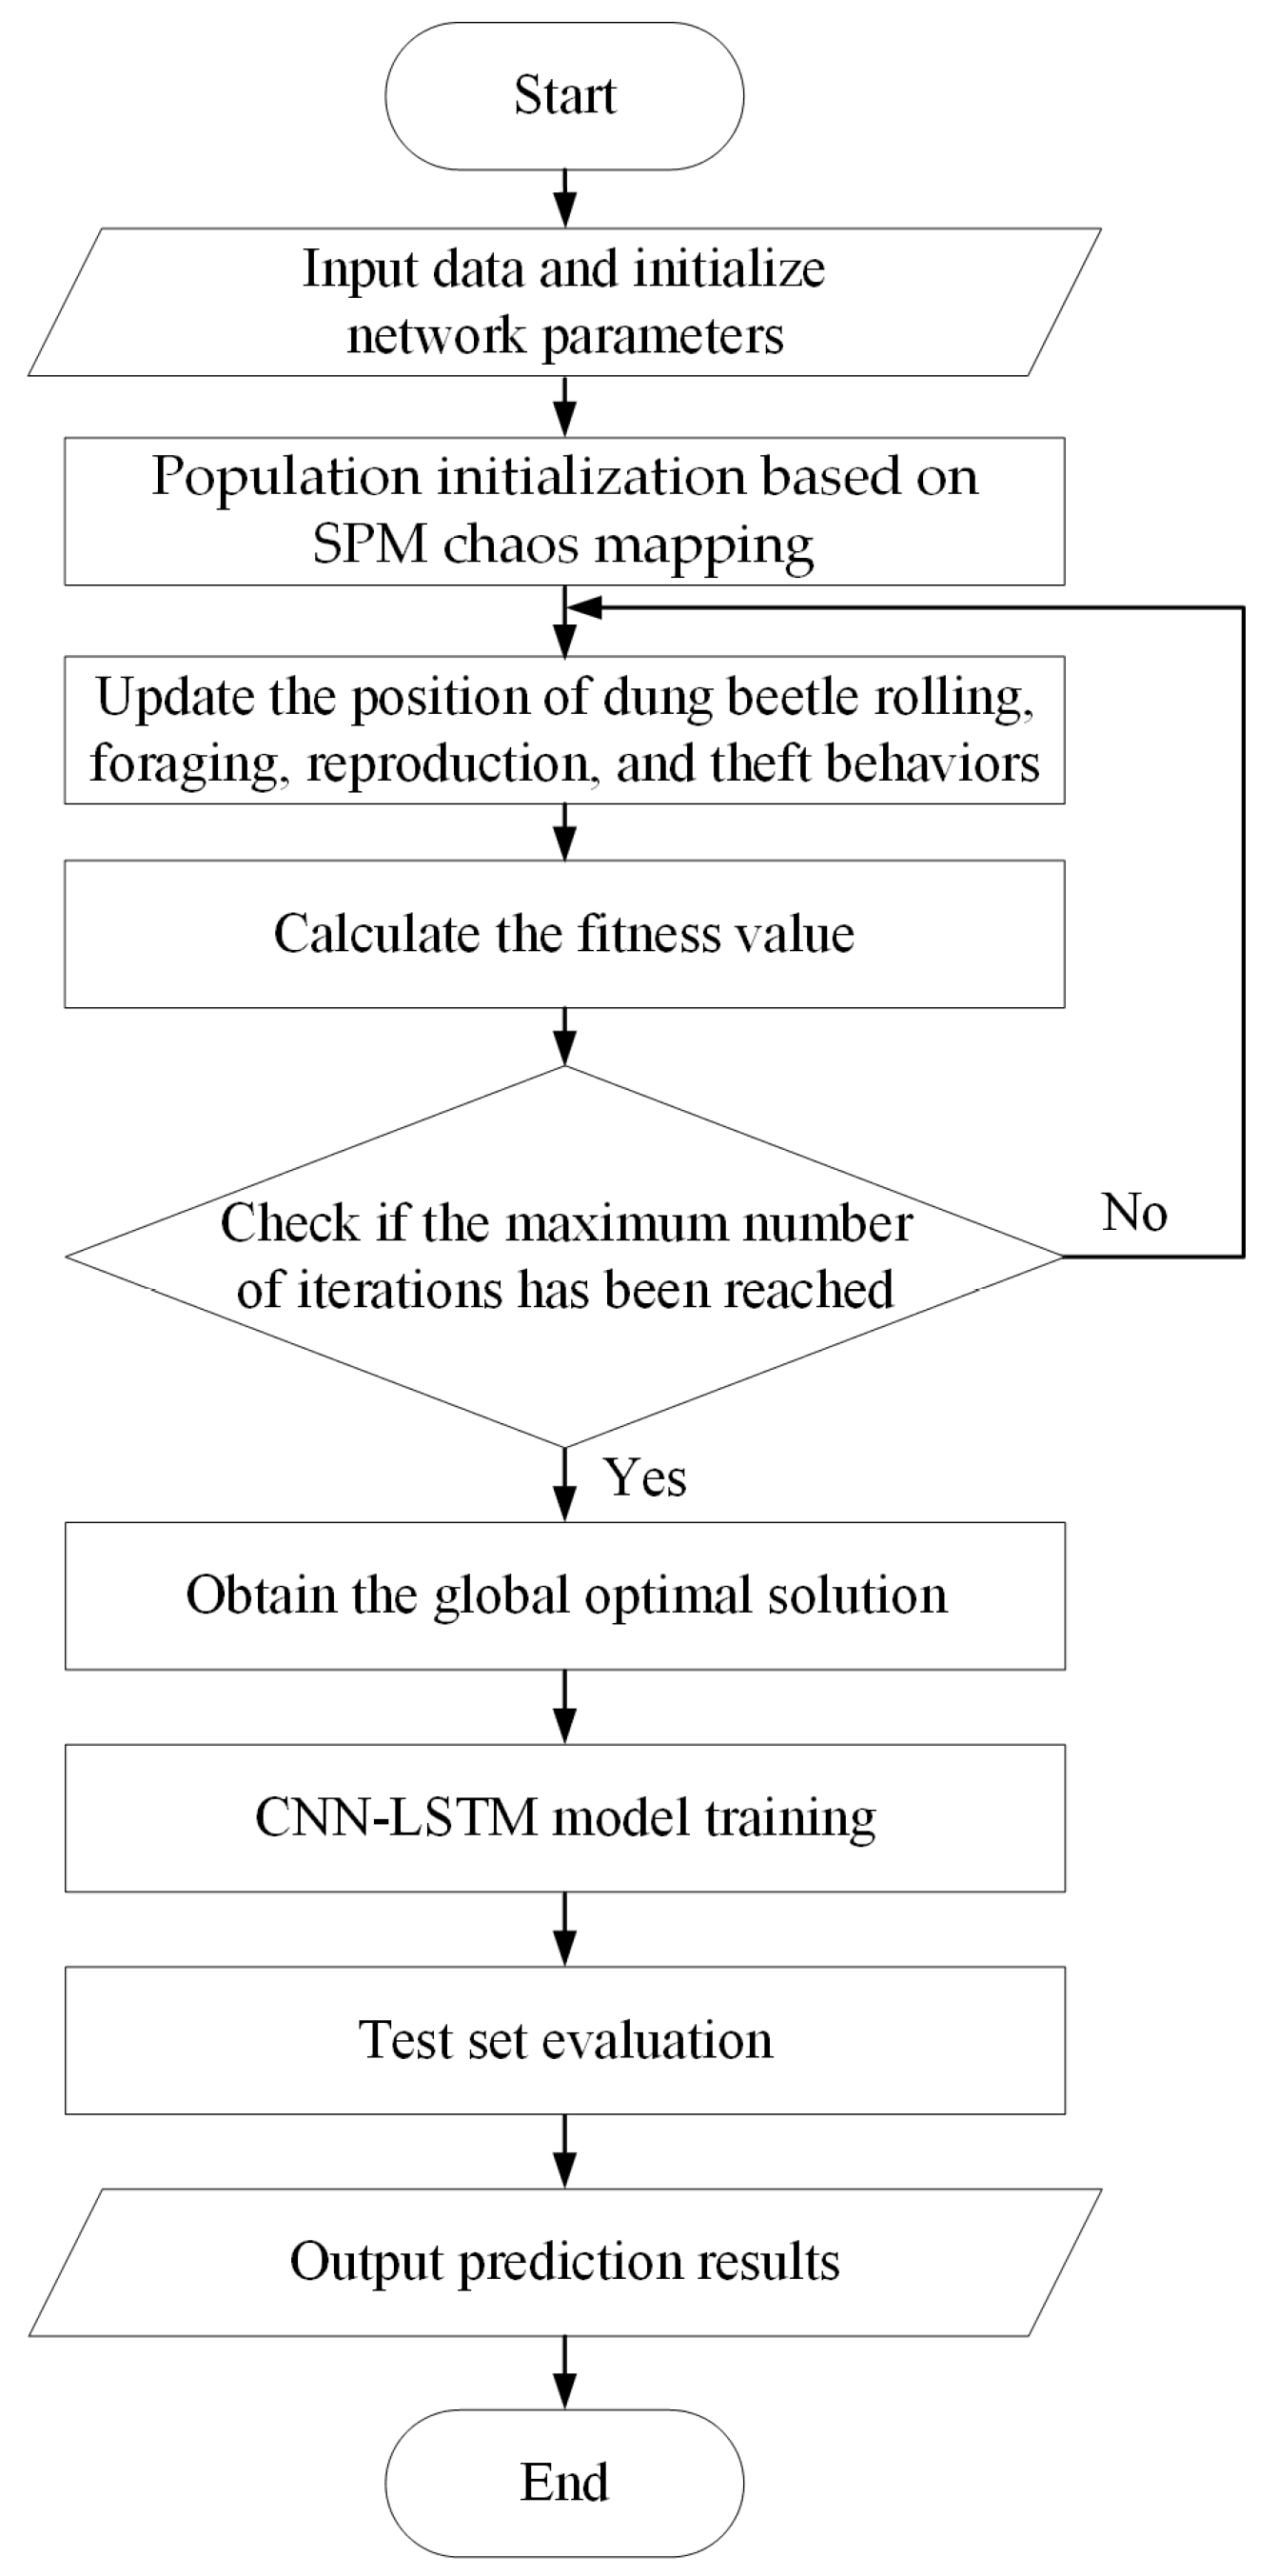
The workflow of the proposed MDBO-CNN-LSTM-based node carbon emission factor prediction method is illustrated in Figure 5.
The specific optimization process is as follows:
(1)
The historical data are collected with node load power generated. The injection power and corresponding carbon emission factors are generated under diverse renewable energy output scenarios using the proposed dataset generation method. After normalization, the data are divided into training, validation, and test sets.
(2)
The dung beetle population is initialized by Equation (12), with parameters defined such as population size, search space, and maximum iteration count.
(3)
The fitness of the initial hyperparameters is quantified to identify the best and worst individuals within the population.
(4)
The individual positions are updated based on ball-rolling, breeding, foraging, and stealing behaviors using Equations (6), (8), (10), and (11). The fitness for updated positions is recalculated to determine the optimal individuals.
(5)
If the maximum iteration count is reached, the global optimal solution is output, and the CNN-LSTM model with the optimized hyperparameters is trained. Otherwise, the process returns to Step (4).
(6)
The trained MDBO-CNN-LSTM model is deployed to predict carbon emission factors for power system nodes.
Through iterative cycles of the above steps, the optimal CNN-LSTM parameters are determined by minimizing the validation set’s mean squared error, completing the optimization process.

4.3. Evaluation Metrics for the MDBO-CNN-LSTM Model

The prediction results are evaluated using three metrics: Mean Absolute Error (MAE), Mean Squared Error (MSE), and Coefficient of Determination (R2). The definitions and calculation methods of these metrics are as follows:
(1) MAE is used to indicate the average absolute deviation between the predicted and the true value, with smaller values indicating higher accuracy. The calculation formula is
M A E = 1 n × Σ | y true y pred |
(2) The MSE reflects the average of the squared error between the predicted and true values, with the smaller MSE indicating the prediction closer to the true value, which can be calculated by
M S E = 1 n × ( y true y pred ) 2
(3) R2 indicates how well the regression model fits the data, with the value closer to 1 indicating the higher variability the model can explain, i.e., the better performance of the model. The formula of cc is
R 2 = 1 ( y true y pred ) 2 ( y true y mean ) 2
where n is the number of samples, ytrue is the true value, ypred is the predicted value, and ymean is the mean of the true value.

5. Results and Discussion

In order to verify the effectiveness of the proposed method, modified IEEE 30-bus, 118-bus, and 300-bus system simulation models are constructed using the MATLAB 2023b platform [27]. The topology of the modified IEEE 30-bus system is illustrated in Figure 6. In this system, thermal generating units are located at Bus 1, 2, 5, 8, 11, and 13, in which those at Bus 8 and 11 are replaced with wind power and photovoltaic power sources of the same capacity, respectively. The carbon emission intensity of the other thermal generating units is 0.875, 0.875, 0.525, and 0.525 kgCO2/kWh, respectively. For the IEEE 118-bus system, referred from [28], Bus 31, 46, 49, and 65 are integrated with wind power generation, while Bus 66, 80, 89, 100, and 103 are integrated with photovoltaic power generation. For the IEEE 300-bus system, referred from [29], Bus 122 and 165 are integrated with wind power generation, while Bus 215 and 248 interface with photovoltaic power generation.
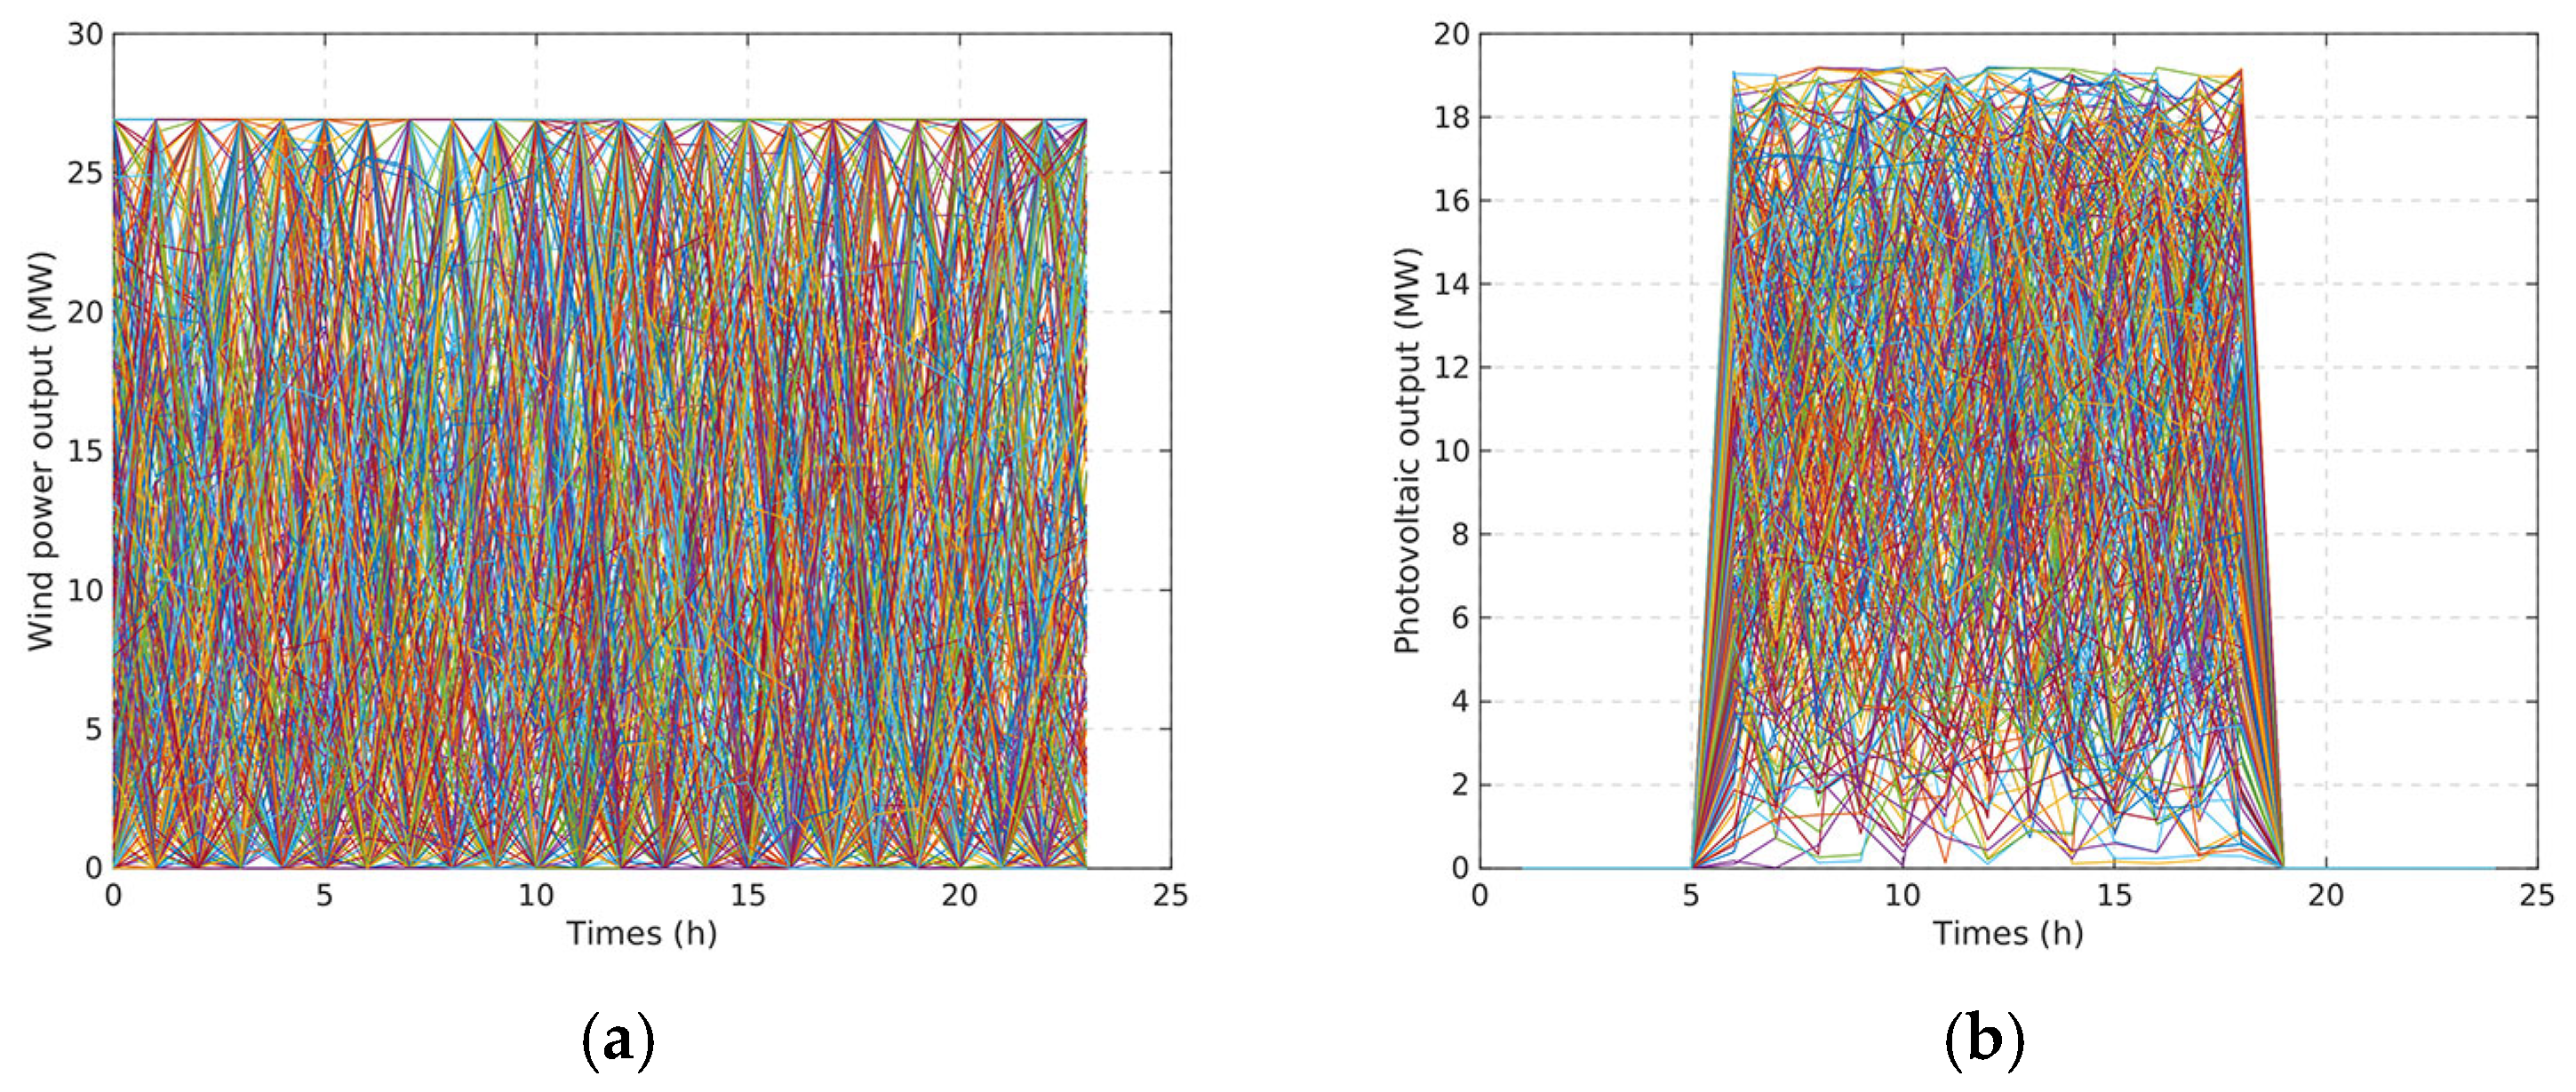
By performing the method in Section 4.1, the real-time wind power and photovoltaic power generation are probabilistically fitted to obtain output data close to the actual distribution. The output curves of 300 scenarios within 24 h for the wind power and the photovoltaic power are generated, respectively, according to the probabilistic models of photovoltaic and wind power [30]; the results are shown in Figure 7.
After data preprocessing, each system topology generates a dataset containing 10,000 samples. These datasets are partitioned into training, validation, and test sets in a 6:2:2 ratio.

5.1. Analysis of Nodal Carbon Emission Factor Prediction Results

To verify the proposed carbon emission factor prediction model, the MDBO-CNN-LSTM model is compared with the traditional CNN-LSTM model and Transformer model. The platform used to run code is Python 3.11, with an Intel(R) Xeon(R) w5-3435X 2.98 GHz processor and a computing memory of 512 GB. The predicted and theoretical value scatter plots for all models in different system scales are presented in Figure 8, Figure 9 and Figure 10, which illustrate the distribution characteristics of prediction errors for node carbon emission factors from three models in power systems of different scales.
The horizontal axis of the scatterplot represents the theoretical node carbon emission factor values calculated using the carbon flow analysis method, while the vertical axis denotes the model-predicted values. The red dashed line indicates the perfect prediction baseline for evaluating model fitting accuracy, where closer proximity to this line signifies higher consistency between predictions and theoretical values. Each point represents the prediction result of a node within a sample, with color intensity determined by the magnitude of absolute error, where larger errors correspond to lighter colors. The results demonstrate that both algorithms exhibit predictive capabilities for nodal carbon emission factors across power systems of varying scales. However, as the scale of system nodes expands, model complexity increases significantly, leading to greater prediction difficulty. The expansion of feature space dimensionality amplifies the dispersion of predicted values from the theoretical baseline.
To further compare the preprocessing performance of the three aforementioned models, the evaluation results of the three models across the modified IEEE 30-bus, 118-bus, and 300-bus systems are listed in Table 2. The comparative analysis indicates that the other two algorithms exhibit smaller prediction errors compared to the Transformer model. Furthermore, the proposed MDBO-CNN-LSTM model achieves reduced prediction errors relative to the traditional CNN-LSTM model. It can be concluded that MDBO-CNN-LSTM outperforms across all metrics (MAE, MSE, R2) in systems of varying scales, demonstrating superior prediction performance.
The 30-bus, 118-bus, and 300-bus power systems are configured with different renewable energy generation ratios of 35.7%, 54.6%, and 13.3%, respectively. To further illustrate the impact of different renewable energy capacity on model performance, two additional cases are added to the 30-bus system, with renewable energy generation ratios of 43.8% and 56.5%, covering a typical renewable energy installation scenario. The prediction results are shown in Figure 11, and the performance of the model is presented in Table 3. The results indicate that under the same node system and varying renewable energy output conditions, the MDBO-CNN-LSTM model demonstrates accurate predictions with tiny error across different scenarios, reflecting the transferability of the proposed method across real-world energy transition contexts.
For assessing the generalization capability of the proposed MDBO-CNN-LSTM model and reducing dependence on the single data partition, five-fold cross-validation is conducted on all test systems. The results of cross-validation for the MDBO model under different conditions are shown in Table 4. The average metric values of the MAE, MSE, and R2 for the IEEE 30-bus system performs well across all folds. In larger systems of the 118-bus and 300-bus systems, the model also demonstrates stability across all metrics between folds. The experimental results indicate that the proposed method maintains stable prediction accuracy regardless of data partitioning, effectively mitigating the risk of overfitting in the model, which provides confidence in the model’s generalization.
In response to overfitting risks in high-dimensional power system scenarios, the dropout rate has been set in the proposed model as described in Section 3.3. The results under different dropout rates are shown in Table 5.
Through systematic experimental analysis, the impact of dropout regularization on the model’s generalization ability is examined. In a small dataset scenario with 800 samples, the model without dropout exhibited significant overfitting. As the dropout rate increases, the overfitting gap continuously decreases. At a dropout rate of 0.3, both the training and validation errors, as well as the overfitting gap, reach their minimum values. The experimental results show that dropout effectively addresses the overfitting problem, particularly in small dataset scenarios, significantly improving the model’s generalization ability.

5.2. Hyperparameter Sensitivity and Interpretability Metric Analysis of MDBO-CNN-LSTM

To ensure the robustness of the MDBO-CNN-LSTM model and propose applicable ranges for future power system applications, we conducted a systematic sensitivity analysis on five key hyperparameters of the proposed model for identifying the most influential hyperparameters on model performance, including the learning rate, number of convolutional kernels, number of LSTM hidden units, number of fully connected layer neurons, and batch size. The sensitivity analysis adopts a single-variable perturbation strategy: for each hyperparameter, seven values within a ±70% range of the best value are scanned. During each scan, other parameters are fixed at their optimized values. Each configuration is evaluated using three random seeds to reduce variance [31]. The calculation formula for the log-sensitivity score is as follows:
Log - sensitivity = log M S E max log M S E min log p a r a m max log p a r a m min
The logarithmic sensitivity value is dimensionless and represents the percentage change in MSE for every percentage change in the parameter value. For example, a score of 0.5 means that a 1% increase in the parameter will result in a 0.5% increase in MSE. Figure 12, Figure 13, Figure 14, Figure 15, Figure 16 and Figure 17 display the relationship between various hyperparameters and the validation set MSE of the MDBO-CNN-LSTM model in three different power systems, along with sensitivity rankings.
Positive sensitivity scores indicate that increasing the hyperparameter leads to improved model performance, with a decrease in the validation set MSE. Negative sensitivity scores suggest that increasing the hyperparameter results in a decline in model performance, with an increase in the validation set MSE. The absolute value of the sensitivity score reflects the strength of the influence, with larger values indicating higher sensitivity.
Seen from Figure 12 and Figure 13, in the 30-bus system, the learning rate (0.3604) is the most sensitive parameter, exhibiting strong negative correlation. Increasing the learning rate significantly degrades model performance. The second most sensitive parameter is the number of fully connected layer neurons; reducing the complexity of the fully connected layer mitigates overfitting risks. The results of the 118-bus system shown in Figure 14 and Figure 15 indicate that the number of fully connected layer neurons (0.147) is the most sensitive parameter, with its negative correlation indicating a need for simplified model architecture. The positive effects of the learning rate (0.020) and number of LSTM hidden units (0.017) suggest their values can be moderately increased. The sensitivity of the batch size approaches zero (0.0002), confirming its weak association with generalization capability. The results of the 300-bus system are shown in Figure 16 and Figure 17, in which the learning rate remains the most sensitive parameter, while the importance of convolutional channels increases substantially. The learning rate is the most sensitive parameter globally, with significant negative correlations in 30-/300-bus systems requiring reduced values. The number of fully connected layer neurons is the second most sensitive parameter, consistently showing negative influence, necessitating reduced structural complexity. Additionally, batch size exhibits minimal global impact.
In practical applications, priority should be given to precise tuning of the learning rate and number of fully connected layer neurons within recommended ranges, while adopting default values for batch size to reduce optimization costs. Recommended hyperparameter ranges for different power systems are provided in Table 6.
To enhance the interpretability of carbon emission prediction models and identify key influencing factors, this study employs the SHAP (SHapley Additive exPlanations) method for systematic analysis. SHAP, based on game theory principles, quantifies the contribution of each feature to the model’s output, providing a consistent and reliable framework for explanation [32]. It satisfies the requirements of local accuracy and consistency to offer both global feature importance and local prediction explanations, making it particularly suitable for interpretability analysis in high-dimensional and complex systems such as power systems. The analysis process includes two key steps: (1) Local Explanation: For a single node’s carbon emission factor, SHAP values for each input feature are calculated. (2) Global Analysis: The feature importance is integrated across all nodes to identify system-level key influencing factors.
The SHAP code library in Python 3.11 is used for interpretability analysis of the model. Table 7 illustrates the top three most important features in the three different power systems. Through a comparative analysis of systems with 30, 118, and 300 nodes, it is found that the key factor influencing carbon emission prediction is the power injection of units, including wind, solar, and fossil fuel. This aligns with carbon flow theory, where carbon emissions originate from power sources and are allocated to power system nodes. Consequently, the most influential parameter on nodal carbon emissions is the carbon emission attributes of power sources.

5.3. Resistance to Noise in Carbon Emission Factor Prediction

Measurement data such as load and power generation of the power system will introduce unavoidable noise, causing errors in calculating carbon emission factors. In order to verify the robustness of the method in this paper, Gaussian white noise is introduced into the power generation measurement data of the power system to reflect the possible uncertainty. It is mainly divided into three kinds of noise scenarios: (1) In the weak noise environment, the noise amplitude is ±5%, simulating the low-intensity noise operation of the system. (2) In the stronger noise environment, the noise amplitude is ±15%, simulating more complex scenarios. (3) In an environment with a noise amplitude of ±20%, the robustness limits of the proposed method under high-uncertainty scenarios are further determined. The prediction results of the three methods under varying noise levels are compared in Table 8.
The experimental results in Table 8 indicate that increased noise intensity significantly raises prediction errors for both models. The CNN-LSTM model exhibits higher noise sensitivity, leading to substantial error increments. In contrast, the MDBO-CNN-LSTM model demonstrates stronger robustness, effectively mitigating noise impacts on predictions. This advantage is more pronounced in larger-scale systems (e.g., 118-bus and 300-bus). Even under significant Gaussian white noise interference, up to 20% amplitude, the proposed model maintains high prediction accuracy, while conventional methods exhibit notable performance degradation. This capability ensures stable performance in real-world applications with noisy power system data. The robustness limit of the proposed approach in high-uncertainty scenarios is about 20% noise.
To further validate the model’s noise resistance under different types of noise, impulse noise and sinusoidal noise are introduced into the data. The impulse noise probabilities were set at 1%, 5%, and 10%, with an amplitude five times the mean of the input data. The sinusoidal noise amplitudes were 1%, 5%, and 10% of the input data mean, with a frequency of 0.01 Hz. Predicted and theoretical carbon emission factor results are shown in Table 9. From the results in the table, it can be concluded that, under the same noise conditions, the MDBO-CNN-LSTM model consistently outperformed the CNN-LSTM model.
As the impulse probability and sinusoidal noise amplitude increases from 1% to 10%, both models exhibit a notable rise in MAE and MSE. However, the MDBO-CNN-LSTM model demonstrates a smaller degradation range, indicating higher tolerance to impulsive noise, greater stability, and stronger noise resistance. Moreover, in larger power systems (e.g., 118-bus and 300-bus), the MDBO-CNN-LSTM model maintains its advantage, though the performance gap slightly narrowed. The MDBO-CNN-LSTM model exhibits superior anti-interference capability and prediction accuracy across various noise types, noise intensities, and system scales through hyperparameter optimization. These results confirm its potential for practical applications in power systems.

5.4. Computational Efficiency of Carbon Emission Factor Prediction

For analyzing the model’s scalability and computational efficiency in online operational environments, this section compares the computation time in IEEE 30-bus, 118-bus, and 300-bus systems, respectively. Furthermore, a model-driven carbon emission factor computation method is added as a comparison against the data-driven method [33]. The inference time is evaluated over 2000 test runs under increasing node loads, representing the total time and latency metric required for the complete computational workflow with the training process not included. A remote computer first simulates data acquisition from online monitoring devices. Then, the local computer establishes communication for measured electricity consumption data, followed by carbon factor prediction through local program processing. Finally, carbon emission factor outputs are generated, with the mean value and standard deviation calculated for all single-input executions under controlled experimental conditions. The comparison results for computational efficiency between the model-driven method and the three data-driven methods are shown in Table 10.
In the IEEE 30-bus system, the computation time of the model-driven method is 23.939 ms, which increases to 35.192 ms when the node count rises to 300, indicating significant computational burden with system scale expansion. In contrast, the three data-driven models show better computational efficiency. With their computational time significantly lower than that of the model-driven method at different system scales, the growth rate of computational time is much smaller as the node scale increases. The CNN-LSTM and MDBO-CNN-LSTM models are superior to the Transformer model. After optimizing the hyperparameters of the CNN-LSTM model using the MDBO algorithm, the model’s number of parameters increases, leading to a slight extension in computational time. Therefore, in spite of the computational efficiency decreasing slightly compared with the CNN-LSTM model, the MDBO-CNN-LSTM prediction performance improves significantly. Through systematic hyperparameter optimization, the MDBO algorithm allows the CNN-LSTM model to approach near-theoretical optimal performance for specific tasks, though a trade-off between computational cost and prediction performance must be considered in practical applications. These results indicate that the computational efficiency of the proposed method remains stable even in large-scale power systems, making it highly suitable for nodal carbon emission factor prediction.

5.5. Analysis of Actual Power System on Carbon Emission Prediction

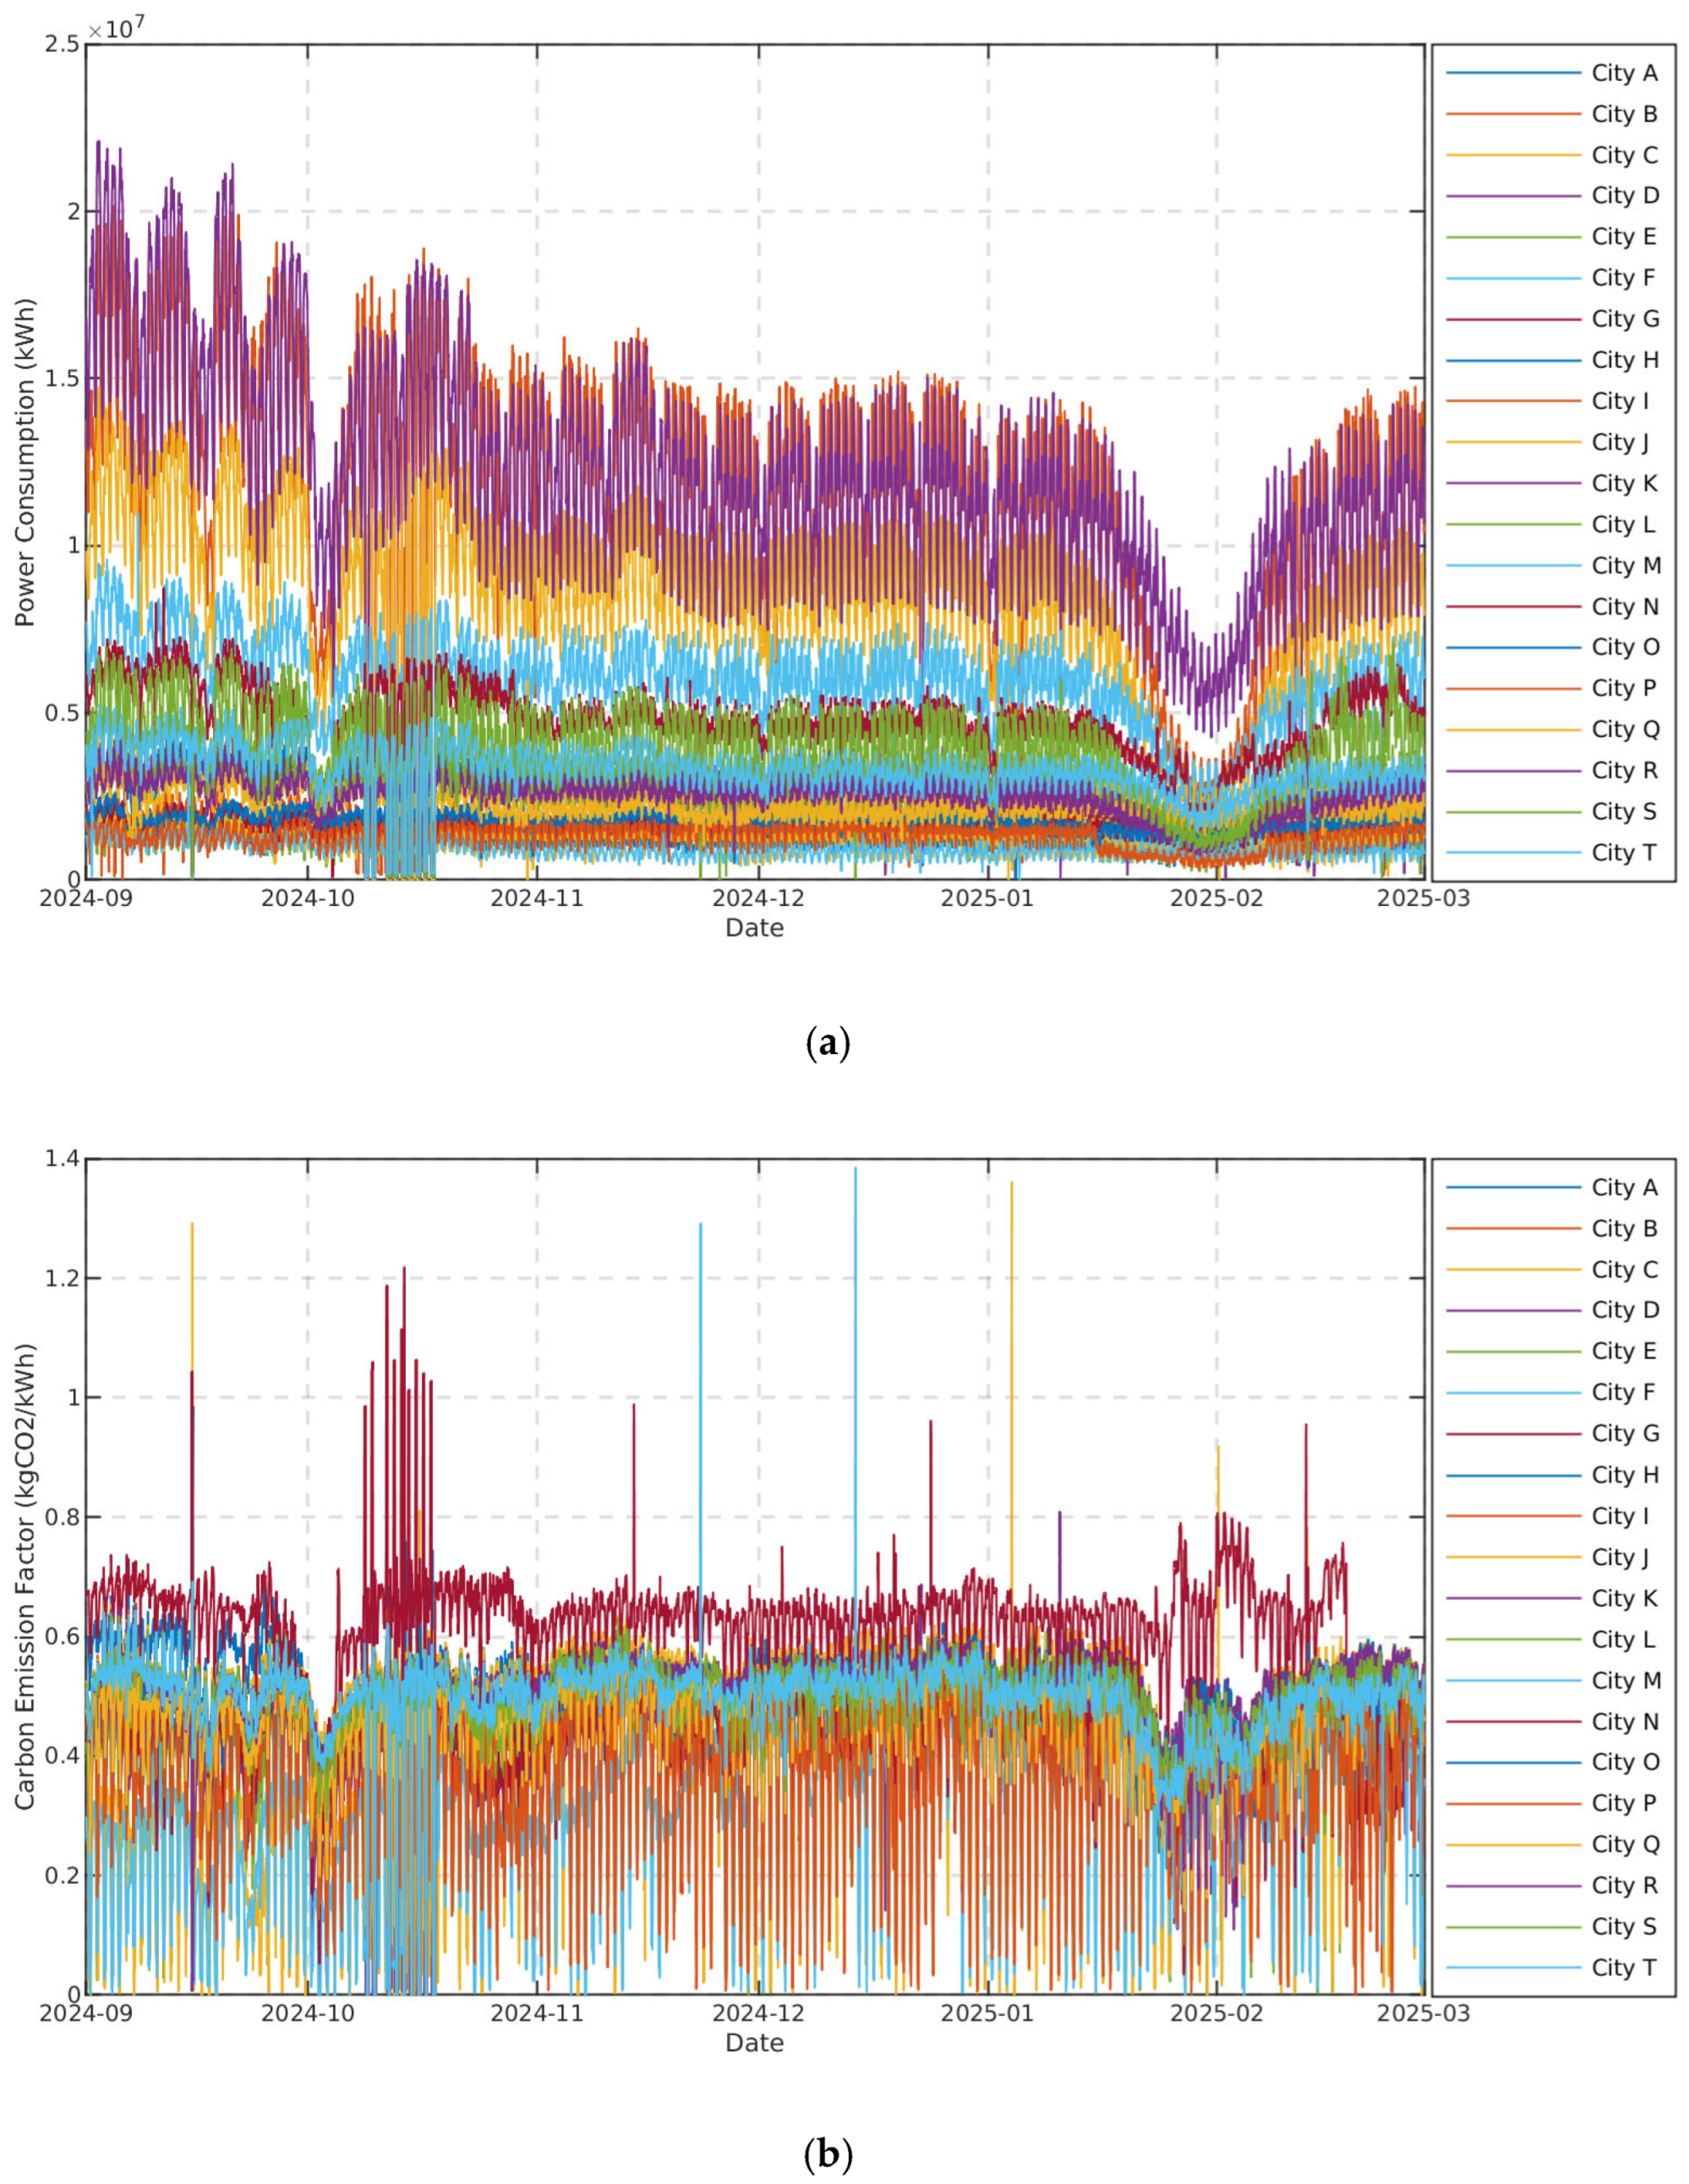
The proposed model is validated using real power system data to verify its feasibility for practical applications and credibility. Twenty representative cities in Guangdong Province in China are selected to collect hourly measurement data on power consumption and carbon emission factors at their gateway nodes over 6 months. The collected results are shown in Figure 18. The data from the first five months are used as the training set, the data from the first half of the sixth month are used as the validation set, and the data from the latter half of the sixth month are used as the test set.
A comparison between predicted and actual values of carbon emission factors in the test set reveals MAE, MSE, and R2 values of 0.020038, 0.000651, and 0.925592, respectively. This suggests that the proposed method demonstrates a relatively high level of accuracy when applied to real-world power grids. However, due to the noise present in the actual measurement sensor data, some bias occurs in the results. On the other hand, this finding corroborates the feasibility and reliability of the method in practical applications, providing empirical evidence for the model’s applicability and credibility in actual power systems.

6. Conclusions

At present, data-driven methods for carbon emission analysis in noise-contaminated sensor measurements and large-scale power systems exhibit deficiencies of model convergence efficiency, accuracy, and robustness. To address these issues, this study proposes a hybrid MDBO-CNN-LSTM prediction method. By integrating hybrid modified strategies, the population initialization, search strategy, and iteration mechanism of the algorithm are enhanced, improving the global search and local exploitation capability. Tests across 30-, 118-, and 300-bus systems, as well as an actual power system, demonstrate that the proposed method accurately predicts nodal carbon emission factors under renewable energy fluctuations, offering high computational efficiency, generalization capability, scalability, and robustness under noisy measurement data and large-scale power systems. To the best of the authors’ knowledge, this enhanced strategy-based algorithm represents the first application in carbon emission prediction within power systems, demonstrating a novel integration of optimization techniques in energy data analytics. This novel approach may provide a technical foundation for optimizing carbon emissions and advancing energy conservation in power systems, offering robust computational support for data-driven emission reduction strategies. However, limitations include strong data dependency and high computational resource demands. Future research will focus on lightweight model design and enhancing cross-scenario generalization capabilities. Subsequent research will also incorporate more large-scale field validation and address the problem caused by the lack of sensors, which hinders wider application.
Author Contributions

Conceptualization, L.Z. and F.P.; funding acquisition, H.S.; methodology, Y.Y.; supervision, H.S.; validation, L.F.; writing—original draft, J.W.; writing—review and editing, F.P. All authors have read and agreed to the published version of the manuscript.

Funding

This research was funded by the National Key Research and Development Program of China (2022YFF0606600) and the science and technology project of China Southern Power Grid, Ltd. (GDKJXM20231020).

Data Availability Statement

The original contributions presented in this study are included in the article. Further inquiries can be directed to the corresponding author.

Conflicts of Interest

Authors Lihua Zhong, Feng Pan, Yuyao Yang and Lei Feng were employed by the company Guangdong Power Grid Co., Ltd. The remaining authors (Haiming Shao and Jiafu Wang) declare that the research was conducted in the absence of any commercial or financial relationships that could be construed as a potential conflict of interest. The authors declare that this study received funding from China Southern Power Grid, Ltd. The funder was not involved in the study design, collection, analysis, interpretation of data, the writing of this article or the decision to submit it for publication.

References

  1. Li, Y.; Yang, X.; Du, E.; Liu, Y.; Zhang, S.; Yang, C.; Zhang, N.; Liu, C. A review on carbon emission accounting approaches for the electricity power industry. Appl. Energy 2024, 359, 122681. [Google Scholar] [CrossRef]
  2. Lv, T.; Pi, D.; Deng, X.; Hou, X.; Xu, J.; Wang, L. Spatiotemporal evolution and influencing factors of electricity consumption in the Yangtze River delta region. Energies 2022, 15, 1753. [Google Scholar] [CrossRef]
  3. Chen, H.; Liu, S.; Kuang, Y.; Shu, J.; Ma, Z. Decomposition analysis of regional electricity consumption drivers considering carbon emission constraints: A comparison of Guangdong and Yunnan Provinces in China. Energies 2023, 16, 8052. [Google Scholar] [CrossRef]
  4. He, Y.; Xing, Y.; Zeng, X.; Ji, Y.; Hou, H.; Zhang, Y.; Zhu, Z. Factors influencing carbon emissions from China’s electricity industry: Analysis using the combination of LMDI and K-means clustering. Environ. Impact Assess. Rev. 2022, 93, 106724. [Google Scholar] [CrossRef]
  5. Lin, B.; Omoju, O.E.; Okonkwo, J.U. Factors influencing renewable electricity consumption in China. Renew. Sustain. Energy Rev. 2016, 55, 687–696. [Google Scholar] [CrossRef]
  6. Gao, W.; Han, M.; Chen, L.; Ai, C.; Liu, S.; Cao, S.; Wei, L. Life cycle carbon emission accounting of a typical coastal wind power generation project in Hebei Province, China. Energy Convers. Manag. 2025, 324, 119243. [Google Scholar] [CrossRef]
  7. Liu, B.; Huo, X. Prediction of Photovoltaic power generation and analyzing of carbon emission reduction capacity in China. Renew. Energy 2024, 222, 119967. [Google Scholar] [CrossRef]
  8. Kang, C.; Zhou, T.; Chen, Q.; Wang, J.; Sun, Y.; Xia, Q.; Yan, H. Carbon emission flow from generation to demand: A network-based model. IEEE Trans. Smart Grid 2015, 6, 2386–2394. [Google Scholar] [CrossRef]
  9. Jenkins, J.D.; Luke, M.; Thernstrom, S. Getting to zero carbon emissions in the electric power sector. Joule 2018, 2, 2498–2510. [Google Scholar] [CrossRef]
  10. Kohút, R.; Klaučo, M.; Kvasnica, M. Unified carbon emissions and market prices forecasts of the power grid. Appl. Energy 2025, 377, 124527. [Google Scholar] [CrossRef]
  11. Chen, X.; Chao, H.; Shi, W.; Li, N. Towards carbon-free electricity: A flow-based framework for power grid carbon accounting and decarbonization. Energy Convers. Econ. 2024, 5, 316–418. [Google Scholar] [CrossRef]
  12. Linke, M.; Meßmer, T.; Micard, G.; Schubert, G. Power grid operation in distribution grids with convolutional neural networks. Smart Energy 2025, 17, 100169. [Google Scholar] [CrossRef]
  13. Shen, X.; Tang, J.; Li, J.; Zhao, Y.; Yin, Y.; Zhang, F. TimesNet: A algorithm for day-ahead forecast of dynamic carbon emission factors in power grids. In Proceedings of the 2024 6th Asia Energy and Electrical Engineering Symposium (AEEES), Chengdu, China, 28–31 March 2024; pp. 1393–1398. [Google Scholar]
  14. Sun, W.; Ren, C. Short-term prediction of carbon emissions based on the EEMD-PSOBP model. Environ. Sci. Pollut. Res. 2021, 28, 56580–56594. [Google Scholar] [CrossRef] [PubMed]
  15. Yu, H.; Yang, Y.; Li, B.; Liu, B.; Guo, Y.; Wang, Y.; Meng, R. Research on the community electric carbon emission prediction considering the dynamic emission coefficient of power system. Sci. Rep. 2023, 13, 5568. [Google Scholar] [CrossRef]
  16. Cai, M.; Huang, L.; Zhang, Y.; Liu, C.; Li, C. Day-ahead forecast of carbon emission factor based on Long and Short-Term Memory networks. In Proceedings of the 2023 5th Asia Energy and Electrical Engineering Symposium (AEEES), Chengdu, China, 23–26 March 2023; pp. 1568–1573. [Google Scholar]
  17. Chang, H.; Sun, W.; Gu, X. Forecasting energy CO2 emissions using a quantum harmony search algorithm-based DMSFE combination model. Energies 2013, 6, 1456–1477. [Google Scholar] [CrossRef]
  18. Heydari, A.; Garcia, D.A.; Keynia, F.; Bisegna, F.; Santoli, L.D. Renewable energies generation and carbon dioxide emission forecasting in microgrids and national grids using GRNN-GWO Methodology. Energy Procedia 2019, 159, 154–159. [Google Scholar] [CrossRef]
  19. Niu, X.; Luo, X. Research on the application of deep learning algorithm in energy management for low-carbon society. Int. J. Low-Carbon Technol. 2025, 20, 181–187. [Google Scholar] [CrossRef]
  20. Mai, C.; Zhang, L.; Chao, X.; Hu, X.; Wei, X.; Li, J. A novel MPPT technology based on dung beetle optimization algorithm for PV systems under complex partial shade conditions. Sci. Rep. 2024, 14, 6471. [Google Scholar] [CrossRef]
  21. Zhang, Y.; Li, T.; Ma, T.; Yang, D. Short-term photovoltaic power prediction based on extreme learning machine with improved dung beetle optimization algorithm. Energies 2024, 17, 960. [Google Scholar] [CrossRef]
  22. Li, Q.; Shi, H.; Zhao, W.; Ma, C. Enhanced dung beetle optimization algorithm for practical engineering optimization. Mathematics 2024, 12, 1084. [Google Scholar] [CrossRef]
  23. Ye, M.; Zhou, H.; Yang, H.; Hu, B.; Wang, X. Multi-strategy improved dung beetle optimization algorithm and its applications. Biomimetics 2024, 9, 291. [Google Scholar] [CrossRef] [PubMed]
  24. Xue, J.K.; Shen, B. Dung beetle optimizer: A new meta-heuristic algorithm for global optimization. J. Super Comput. 2022, 79, 7305–7336. [Google Scholar] [CrossRef]
  25. Iturrino, C.G.; Francesco, G.; Antonio, L.; Cristina, M.P.; Libero, P.; Giacomo, T. A Comparison of Power Quality Disturbance Detection and Classification Methods Using CNN, LSTM and CNN-LSTM. Appl. Sci. 2020, 10, 6755. [Google Scholar]
  26. Yang, L. Theoretical Analysis of Adam Optimizer in the Presence of Gradient Skewness. Int. J. Appl. Sci. 2024, 7, 27. [Google Scholar] [CrossRef]
  27. Liu, X.; Liu, J.; Chi, Y.; Yang, Y. A coordinated planning and management framework for transmission and distribution systems with novel bilateral sharing energy storage model and time-phased consumption subsidy strategy. J. Energy Storage 2024, 95, 112377. [Google Scholar] [CrossRef]
  28. Xie, B.; Tian, X.; Kong, L.; Chen, W. The Vulnerability of the Power Grid Structure: A System Analysis Based on Complex Network Theory. Sensors 2021, 21, 7097. [Google Scholar] [CrossRef]
  29. Pahwa, S.; Hodges, A.; Scoglio, C.; Wood, S. Topological analysis of the power grid and mitigation strategies against cascading failures. In Proceedings of the 2010 IEEE International Systems Conference, San Diego, CA, USA, 5–8 April 2010; pp. 272–276. [Google Scholar]
  30. Zheng, K.; Sun, Z.; Song, Y.; Zhang, C.; Zhang, C.; Chang, F.; Yang, D.; Fu, X. Stochastic scenario generation methods for uncertainty in wind and photovoltaic power outputs: A comprehensive review. Energies 2025, 18, 503. [Google Scholar] [CrossRef]
  31. Roka, R.; Figueiredo, A.; Vieira, A.; Cardoso, C. A systematic review of sensitivity analysis in building energy modeling: Key factors influencing building thermal energy performance. Energies 2025, 18, 2375. [Google Scholar] [CrossRef]
  32. Alatawi, M.N. Enhancing intrusion detection systems with advanced machine learning techniques: An ensemble and explainable artificial intelligence (AI) approach. Secur. Priv. 2025, 8, e496. [Google Scholar] [CrossRef]
  33. Li, J.; Zhou, Z.; Wen, B.; Zhang, X.; Wen, M.; Huang, H.; Yu, Z.; Liu, Y. Modeling and analysis method for carbon emission flow in integrated energy systems considering energy quality. Energy Sci. Eng. 2024, 12, 2405–2425. [Google Scholar] [CrossRef]
Figure 1. Diagram of the 1D-CNN model.
Energies 18 03491 g001
Figure 2. Diagram of the LSTM model.
Energies 18 03491 g002
Figure 3. Diagram of the MDBO-CNN-LSTM model.
Energies 18 03491 g003
Figure 4. Flowchart of dataset generation considering renewable energy fluctuation.
Energies 18 03491 g004
Figure 5. Flowchart of nodal carbon emission factor prediction based on the MDBO-CNN-LSTM model.
Energies 18 03491 g005
Figure 6. A diagram of IEEE 30-bus power system.
Energies 18 03491 g006
Figure 7. Generation results for (a) wind power and (b) photovoltaic outputs for 300 scenarios.
Energies 18 03491 g007
Figure 8. Predicted and theoretical value scatter plots in the 30-bus system of the (a) Transformer model, (b) CNN-LSTM model, and (c) MDBO-CNN-LSTM model.
Energies 18 03491 g008
Figure 9. Predicted and theoretical value scatter plots in the 118-bus system of the (a) Transformer model, (b) CNN-LSTM model, and (c) MDBO-CNN-LSTM model.
Energies 18 03491 g009
Figure 10. Predicted and theoretical value scatter plots in the 300-bus system of the (a) Transformer model, (b) CNN-LSTM model, and (c) MDBO-CNN-LSTM model.
Energies 18 03491 g010
Figure 11. Predicted and theoretical carbon emission factor scatter plots for (a) 35.7%, (b) 54.6%, and (c) 13.3% renewable energy installation ratios in 30-bus power system.
Energies 18 03491 g011
Figure 12. Relationship between hyperparameters and MSE of validation set for 30-bus system on (a) learning rate, (b) conv channels, and (c) LSTM hidden units.
Energies 18 03491 g012
Figure 13. Relationship between hyperparameters and MSE of validation set for 30-bus system on (a) batch size, (b) linear units, and (c) hyperparameter log-sensitivity ranking.
Energies 18 03491 g013
Figure 14. Relationship between hyperparameters and MSE of validation set for 118-bus system on (a) learning rate, (b) conv channels, and (c) LSTM hidden units.
Energies 18 03491 g014
Figure 15. Relationship between hyperparameters and MSE of validation set for 118-bus system on (a) batch size, (b) linear units, and (c) hyperparameter log-sensitivity ranking.
Energies 18 03491 g015
Figure 16. Relationship between hyperparameters and MSE of validation set for 300-bus system on (a) learning rate, (b) conv channels, and (c) LSTM hidden units.
Energies 18 03491 g016
Figure 17. Relationship between hyperparameters and MSE of validation set for 300-bus system on (a) batch size, (b) linear units, and (c) hyperparameter log-sensitivity ranking.
Energies 18 03491 g017
Figure 18. Actual measurement data for 20 cities in Guangdong Province in China on (a) power consumption and (b) carbon emission factor.
Energies 18 03491 g018
Table 1. Hyperparameter search ranges in the MDBO-CNN-LSTM model.
HyperparameterSearch Range
Learning Rate[0.0001, 0.01]
Convolutional Channels[8, 64]
LSTM Hidden Units[16, 128]
Fully Connected Neurons[64, 512]
Batch Size[64, 256]
Table 2. Carbon emission factor prediction performance comparison of three models.
System ScaleMethodMAE (%)MSE (%)R2
30-busTransformer0.61500.01090.9830
CNN-LSTM0.32460.00580.9777
MDBO-CNN-LSTM0.29890.00380.9954
118-busTransformer0.96180.02230.9752
CNN-LSTM0.51540.01040.9885
MDBO-CNN-LSTM0.38230.00610.9933
300-busTransformer0.34300.00890.9227
CNN-LSTM0.19080.00720.9372
MDBO-CNN-LSTM0.15750.00390.9665
Table 3. Performance of proposed model under different ratios of renewable energy generation.
Ratio of Renewable Energy Generation (%)MAE (%)MSE (%)R2
35.70.36930.00520.9901
43.80.37210.00470.9905
56.50.54170.00660.9903
Table 4. Cross-validation results of MDBO-CNN-LSTM model in three cases.
System ScaleMetricsFold 1Fold 2Fold 3Fold 4Fold 5Average
30-busMAE (%)0.49040.49430.59410.42280.48390.4971
MSE (%)0.00970.01070.01450.00860.01410.0115
R20.98570.98370.97880.98680.97770.9825
118-busMAE (%)0.43530.40060.42930.46620.38960.4242
MSE (%)0.00630.00620.00700.00720.00570.0065
R20.99300.99300.99200.99180.99350.9927
300-busMAE (%)0.12920.11160.11790.12600.14550.1260
MSE (%)0.01170.00570.00810.00550.00580.0074
R20.90480.95280.92620.94670.95080.9363
Table 5. Effect of dropout rate on performance of proposed model.
Dropout RateTrain MAE (%)Val MAE (%)Overfitting Gap
0.00.0077200.0079860.000266
0.10.0117470.0123070.000560
0.20.0105240.0108720.000348
0.30.0115090.0117760.000267
0.410.0141730.0144750.000303
0.50.0151110.0154600.000349
Table 6. Recommended range for each hyperparameter in three cases.
System Scale30-Bus118-Bus300-Bus
Learning rate[0.000319, 0.000738][0.001865, 0.010567][0.000654, 0.000807]
Number of convolutional kernels[69, 117][9, 54][112, 115]
Number of LSTM hidden units[211, 513][15, 27][412, 508]
Batch size[12, 42][72, 161][9, 17]
Number of fully connected layer neurons[767, 1057][112, 211][390, 481]
Table 7. The top three most important metrics in the three different power systems.
Ranking30-Bus118-Bus300-Bus
1Wind power generation node (D34)Photovoltaic power generation node (D163)Wind power generation node (D328)
2Fossil fuel power generation node (D33)Wind power generation node (D155)Photovoltaic power generation node (D356)
3Photovoltaic power generation node (D35)Photovoltaic power generation node (D162)Photovoltaic power generation node (D316)
Table 8. Predicted and theoretical carbon emission factors under Gaussian white noise with three different amplitudes.
System ScaleMethodNoise
Amplitude
MAE (%)MSE (%)R2
30-busCNN-LSTM±5%0.61970.01970.9694
±15%1.82450.17700.7245
±20%2.47350.31140.5152
MDBO-CNN-LSTM±5%0.46590.00960.9850
±15%1.03760.06650.8965
±20%1.33220.11450.8217
118-busCNN-LSTM±5%0.77200.02360.9738
±15%1.81720.17500.8057
±20%2.40030.29560.6718
MDBO-CNN-LSTM±5%0.58690.01330.9853
±15%1.54950.12880.8571
±20%2.24540.25550.7164
300-busCNN-LSTM±5%1.35000.21130.8792
±15%2.69090.63750.6357
±20%3.95930.94210.4615
MDBO-CNN-LSTM±5%1.22440.19740.8862
±15%1.80190.32020.8153
±20%2.30470.57340.7082
Table 9. Predicted and theoretical carbon emission factors under pulse and sinusoidal noise.
System ScaleMethodNoiseMAE (%)MSE (%)R2
TypeAmplitude
30-busCNN-LSTMPulse noise1%0.56760.05760.9104
5%0.99820.19220.7007
10%1.64360.39250.3888
Sinusoidal noise1%0.48550.01410.9780
5%0.82360.09580.8509
10%0.90560.11620.8191
MDBO-CNN-LSTMPulse noise1%0.49570.05180.9194
5%0.92920.18730.7166
10%1.36970.30630.6425
Sinusoidal noise1%0.41020.00940.9855
5%0.61140.05010.9220
10%0.67530.07410.8846
118-busCNN-LSTMPulse noise1%0.67090.08170.9093
5%1.23580.31410.6513
10%1.88180.56210.3760
Sinusoidal noise1%0.89750.10590.8824
5%1.46170.34110.6214
10%1.34440.31230.6533
MDBO-CNN-LSTMPulse noise1%0.62530.04940.9452
5%1.17200.21350.7630
10%1.77590.40360.5520
Sinusoidal noise1%0.75420.07800.9134
5%1.23920.22240.7531
10%1.25930.23710.7368
300-busCNN-LSTMPulse noise1%1.10620.21900.8749
5%1.54950.40480.7686
10%1.95920.58290.6669
Sinusoidal noise1%1.48050.32220.8159
5%1.55030.36380.7921
10%1.72200.49070.7196
MDBO-CNN-LSTMPulse noise1%1.07170.20770.8813
5%1.44800.35740.7957
10%1.87270.54280.6898
Sinusoidal noise1%1.20300.19990.8858
5%1.56750.33220.8101
10%1.73850.50130.7135
Table 10. Comparison of computational efficiency of the model-driven and three data-driven methods.
System ScaleMethodComputation
Time ± Standard
Deviation (ms)
30-busModel-driven23.939 ± 4.188
Transformer21.714 ± 1.087
CNN-LSTM20.621 ± 1.094
MDBO-CNN-LSTM20.810 ± 0.990
118-busModel-driven25.696 ± 3.851
Transformer20.917 ± 0.968
CNN-LSTM20.800 ± 1.399
MDBO-CNN-LSTM20.773 ± 1.017
300-busModel-driven35.192 ± 7.914
Transformer21.508 ± 1.085
CNN-LSTM20.813 ± 1.350
MDBO-CNN-LSTM21.730 ± 1.024
Disclaimer/Publisher’s Note: The statements, opinions and data contained in all publications are solely those of the individual author(s) and contributor(s) and not of MDPI and/or the editor(s). MDPI and/or the editor(s) disclaim responsibility for any injury to people or property resulting from any ideas, methods, instructions or products referred to in the content.