Article

Study of Three-Component Fe2O3/TiO2/rGO Nanocomposite Thin Films Anode for Lithium-Ion Batteries

Institute of Solid-State Physics, University of Latvia, LV-1063 Riga, Latvia
*
Author to whom correspondence should be addressed.
Energies 2025, 18(13), 3490; https://doi.org/10.3390/en18133490
Submission received: 10 April 2025 / Revised: 19 June 2025 / Accepted: 27 June 2025 / Published: 2 July 2025

Abstract

In this study, we synthesized anode materials based on iron oxide (Fe2O3), titanium dioxide (TiO2), and reduced graphene oxide (rGO) via the electrophoretic deposition technique. The structural and morphological characteristics of electrodes were examined through various methods including SEM, XRD, Raman, and XPS. Among the investigated compositions, the three-component Fe2O3/TiO2/rGO electrode displayed superior electrochemical characteristics in comparison to the binary Fe2O3/rGO and TiO2/rGO electrodes. Specific capacities of 571, 683, and 729 mAh/g were achieved at 0.5 mA for the respective Fe2O3:TiO2 molar ratios of 1:1, 2:1, and 3:1. The 2:1 ratio configuration offered the most promising balance between cycling stability and capacity, highlighting its potential as a high-performance anode in lithium-ion batteries. This work contributes valuable insights into the synergistic behavior of dual-transition metal oxides in composite electrode design using a low-cost and scalable method.

1. Introduction

Lithium-ion batteries (LIBs) are among the most promising energy storage technologies due to their high energy density, long cycle life, and excellent rate capability. Despite these advantages, their widespread application, particularly in electric and hybrid vehicles, remains limited by performance challenges [1]. To address the growing demand for batteries with higher reversible capacity, greater energy density, and prolonged cycling stability, the development of advanced anode materials is essential. Negative electrode materials can generally be categorized based on their charge storage mechanisms including intercalation/insertion, pseudocapacitive surface reactions, conversion reactions, and alloying processes [2,3].
Iron(III) oxide is considered a highly promising anode material for lithium-ion batteries due to its high theoretical capacity (~1007 mAh g−1), natural abundance, low cost, and environmental friendliness. However, its practical application is hindered by substantial volume expansion during lithiation and delithiation, which leads to mechanical stress, the pulverization of active material, and ultimately, poor cycling stability. Additionally, the intrinsically low electrical conductivity of Fe2O3 accelerates capacity degradation, particularly at high current densities [4].
In recent years, a distinct lithium storage mechanism known as the “conversion reaction” has been recognized in transition metal oxides such as iron and manganese oxides. This mechanism involves the reversible redox reaction between lithium ions and metal cations, enabling high specific capacities exceeding 1000 mAh g−1 in the case of Fe2O3 [5]. However, efficient and reversible conversion reactions typically require nanoscale particle sizes to mitigate volume changes and enhance ion/electron transport. Therefore, nanostructure engineering has emerged as a key strategy for improving the electrochemical performance of Fe2O3-based anodes [6,7].
Titanium dioxide (TiO2) is another widely investigated transition metal oxide anode material, known for its excellent cycle life and ability to operate at high charge/discharge rates. Despite its relatively poor intrinsic electronic conductivity, TiO2 offers remarkable advantages, including chemical stability, low cost, environmental friendliness, and minimal volume change during lithiation (less than 4%), which contributes to its superior safety profile [7]. However, its low theoretical capacity (~335 mAh g−1) and slow Li+ and electron transport kinetics remain major drawbacks. These limitations can be mitigated through nanostructure engineering, which enhances Li+ diffusion and improves surface reactivity, thereby boosting the electrochemical performance of TiO2-based electrodes [8,9].
Graphene, a carbon-based nanomaterial with a hexagonal lattice structure, has attracted substantial attention since it was first discovered in a laboratory in 2004. It possesses exceptional properties such as a large theoretical surface area (~2630 m2 g−1), excellent electrical conductivity (~670 Sm−1), mechanical flexibility, and chemical stability, making it an ideal support material for energy storage applications [10]. In composite anodes, graphene can effectively buffer volume changes and provide a conductive network for metal oxide nanoparticles, preventing agglomeration and facilitating electron transport. Consequently, metal oxide–graphene hybrids exhibit an enhanced rate capability and cycling stability [11,12]. Due to their remarkable structural and electrochemical features, graphene oxide (GO) and its reduced form play a vital role in the development of high-efficiency anodes for lithium-ion batteries. GO consists of a two-dimensional sheet of carbon atoms functionalized with oxygen-containing groups, which enhances its dispersibility in aqueous media and facilitates uniform mixing with other active materials. Upon reduction to rGO, many of these functional groups are removed, restoring electrical conductivity while retaining a wrinkled, high-surface-area morphology beneficial for charge transport and lithium-ion diffusion. In recent years, GO and rGO have been widely employed as conductive scaffolds or additives in composite anodes comprising metal oxides such as Fe2O3, TiO2, SnO2, and SiO2. These oxides, while offering high theoretical capacities, typically suffer from poor electrical conductivity and large volume changes during lithiation/delithiation, leading to mechanical degradation and capacity fading. The incorporation of rGO can alleviate these issues by forming a flexible, conductive network that buffers volume expansion, enhances electron transport, and promotes stable solid electrolyte interphase (SEI) formation. Furthermore, rGO sheets can inhibit nanoparticle agglomeration and provide additional lithium storage sites through surface adsorption and defect sites. In this context, our work explored a ternary composite anode system integrating Fe2O3, TiO2, and rGO, deposited via electrophoretic deposition (EPD). The role of rGO is critical in improving the electronic conductivity and structural integrity of the composite, thereby enhancing its practical applicability in binder-free LIB electrodes [13,14,15].
To fabricate composite electrodes, the direct current EPD method was employed. EPD is a cost-effective and scalable technique that enables the uniform deposition of nanoparticles onto substrates, allowing for precise control over the film thickness and morphology. This method is particularly suitable for producing thin films from colloidal suspensions and can yield amorphous, semi-crystalline, or crystalline coatings with high uniformity and a narrow particle size distribution [16]. Incorporating Fe2O3 and TiO2 nanoparticles into a reduced graphene oxide matrix via EPD leverages the synergistic effects of each component, enhancing the overall electrochemical performance of the composite film.
It has been reported that ternary composites composed of Fe2O3, TiO2, and rGO provide enhanced performance over simpler binary systems like Fe2O3/rGO and TiO2/rGO in terms of capacity and stability. Building upon this foundation, the present study investigated the effect of varying the Fe2O3:TiO2 molar ratio on the electrochemical behavior of the resulting ternary anodes for lithium-ion batteries [17,18,19].
Table 1 provides a comparative summary of widely used anode materials, helping to clarify the rationale for combining Fe2O3, TiO2, and rGO in the composite system. The table summarizes their theoretical capacities, key advantages, and known limitations. This comparison highlights the trade-offs between high capacity, stability, and rate performance, and underscores the motivation for developing multifunctional nanocomposites that integrate complementary properties of different components.

2. Materials and Methods

2.1. Preparation of Suspensions and Electrophoretic Deposition

To prepare TiO2/graphene oxide (GO) suspensions, 22.5 mg of TiO2 nanopowder (Sigma-Aldrich, Saint Louis, MO, USA, purity ≥ 99.5%, particle size ≤ 21 nm) was dispersed in 97.5 mL of deionized water under magnetic stirring. Subsequently, 2.5 mL of a commercial aqueous GO suspension (BGT Materials, Manchester, UK, 1 mg/mL, flake size 1–20 µm) was added to the mixture. A similar protocol was used to prepare Fe2O3/GO suspensions, using iron(III) oxide nanopowder (Sigma-Aldrich, purity ≥ 99.5%, particle size ≤ 50 nm). All suspensions were ultrasonicated for 1 h (Amsonic-Branson, BC series, Amsonic-Branson, Biel, Switzerland) to ensure homogeneity, followed by magnetic stirring for 30 min at 250 rpm. To modify the surface charge and ensure consistent deposition behavior during the EPD, 1 mL of 36% HCl was added to each suspension, adjusting the pH to 4 (measured using a Metrohm pH meter, (Metrohm AG, Herisau, Switzerland). Electrophoretic deposition was carried out in potentiostatic mode at room temperature (293 K) using a DC power supply (Agilent Technologies N5772A, Agilent Technologies, Santa Clara, CA, USA). A constant voltage of 30 V was applied for 5 min. A stainless steel sheet substrate (AISI 304, Goodfellow, Huntingdon, UK, 0.5 mm thick) was used as both the positive and negative electrode. The distance between electrodes was 10 mm. In this process, charged particles migrate under an electric field and deposit onto electrodes depending on their surface charge polarity. In multicomponent systems, matching the surface charge polarity of all components is important for successful co-deposition on the same electrode. Reduced graphene oxide was obtained by the thermal reduction of GO. The samples were placed in a tubular furnace (SNOL 0.2/1250, Utena, Lithuania) and subjected to heat treatment at 550 °C for 2 h under a continuous argon/hydrogen (Ar/H2) gas flow with a 95:5 ratio. The heating rate was set to 5 °C/min. The presence of hydrogen gas facilitated the removal of oxygen-containing functional groups (such as hydroxyl, epoxy, and carboxyl groups) from the GO structure, thus enhancing the electrical conductivity of the rGO. The furnace was purged with Ar/H2 prior to heating to eliminate oxygen traces. The thermal reduction conditions were chosen based on literature reports demonstrating effective GO-to-rGO transformation under similar parameters, which promote the partial restoration of sp2 hybridized carbon domains [25]. Film thickness was measured using a stylus profilometer (Veeco Dektak 150, (Veeco Instruments Inc., Plainview, NY, USA), stylus diameter 12.5 µm), while the mass was determined gravimetrically using a Mettler Toledo XS105 (Mettler-Toledo GmbH, Greifensee, Switzerland), analytical balance (maximum capacity 41 g, accuracy ± 0.01 mg) by subtracting the substrate mass before and after deposition. To study the impact of the material composition on electrochemical performance, suspensions were prepared with Fe2O3:TiO2 molar ratios of 1:1, 2:1, and 3:1, respectively. The term “molar ratios” refers to the ratio of the molar amounts of Fe2O3 and TiO2 used when preparing each suspension. The composite anodes were marked as FT11, FT21, and FT31, where “F” and “T” denote the iron and titanium oxides, respectively, and the digits indicate their molar proportions. In all samples, 10 wt% GO was used as a conductive additive, which was subsequently reduced during annealing. In the present study, Fe2O3:TiO2 molar ratios of 1:1, 2:1, and 3:1 were selected to systematically investigate the influence of increasing Fe2O3 content on the electrochemical performance and structural behavior of the composite anodes. Fe2O3 offers high theoretical capacity but suffers from large volume expansion and cycling instability, whereas TiO2 provides mechanical stability and structural support. The 1:1 ratio serves as a balanced composition, while the 2:1 and 3:1 ratios allow for the evaluation of how a higher Fe2O3 content affects the capacity and stability. These ratios were chosen based on previous studies [26,27,28] that demonstrated that an optimized balance between Fe2O3 and TiO2 could enhance the lithium storage performance.

2.2. Material Characterization

The structural properties of the synthesized materials were analyzed by X-ray diffraction (XRD) using a Rigaku MiniFlex 600 (Rigaku Corporation, Tokyo, Japan) diffractometer with Cu Kα radiation (λ = 1.54 Å). The XRD patterns were recorded in the 2θ range of 10° to 80° with a step size of 0.02° and a scan rate of 5°/min. Phase identification was conducted using the PDF database. Raman spectroscopy was performed using a TriVista CRS Confocal TR777 Raman microscope (Princeton Instruments, Trenton, NJ, USA) equipped with a 532 nm laser as the excitation source. The spectra were recorded in the 100–3000 cm−1 range to confirm the structural changes during GO reduction and to evaluate the D and G band intensity ratio (ID/IG) characteristic of defect density and graphitization. Scanning electron microscopy (SEM) images were obtained using a Tescan Lyra (Tescan Orsay Holding, Brno, Czech Republic) 3 field-emission SEM operated at an acceleration voltage of 5–15 kV. SEM was used to observe the surface morphology and estimate the particle and grain sizes. The elemental composition of the synthesized materials was examined by energy-dispersive X-ray spectroscopy (EDX) using an Oxford Instruments EDX system (Oxford Instruments, Abingdon, Oxfordshire, UK) attached to a scanning electron microscope (SEM). The surface chemical composition and oxidation states of the synthesized materials were analyzed by X-ray photoelectron spectroscopy (XPS) using a Thermo Scientific K-Alpha+ spectrometer (Thermo Fisher Scientific, Waltham, MA, USA) equipped with a monochromatic Al Kα radiation source (hν = 1486.6 eV).

2.3. Electrochemical Characterization

Half-cells were assembled in Swagelok-type cells to evaluate the electrochemical performance of the composite anodes. All cell assembly procedures were performed in an argon-filled glove box with O2 and H2O concentrations maintained below 1 ppm. Lithium foil (Ø 10 mm, ThermoFisher Scientific, Waltham, MA, USA) was used as the counter and reference electrode, and a glass microfiber filter (Whatman GF/C, Cytiva, Marlborough, MA, USA) served as the separator. A volume of 300 μL of electrolyte consisting of 1 M LiPF6 dissolved in ethylene carbonate (EC) and diethyl carbonate (DEC) in a 1:1 v/v ratio was added to each cell. Cells were rested for 12 h before testing to ensure electrolyte wetting and electrode stabilization. Galvanostatic charge–discharge tests were performed using a BioLogic battery tester (BioLogic Science Instruments, Seyssinet-Pariset, France) at C-rates of 0.5C, 1C, and 2C within a voltage window of 0.05–3.00 V. Cyclic voltammetry (CV) measurements were carried out at a scan rate of 1 mV s−1 in the 0.01–3.00 V range. Electrochemical impedance spectroscopy (EIS) was performed using the same workstation in the frequency range of 0.01 Hz to 100 kHz with an AC amplitude of 5 mV.

3. Results and Discussion

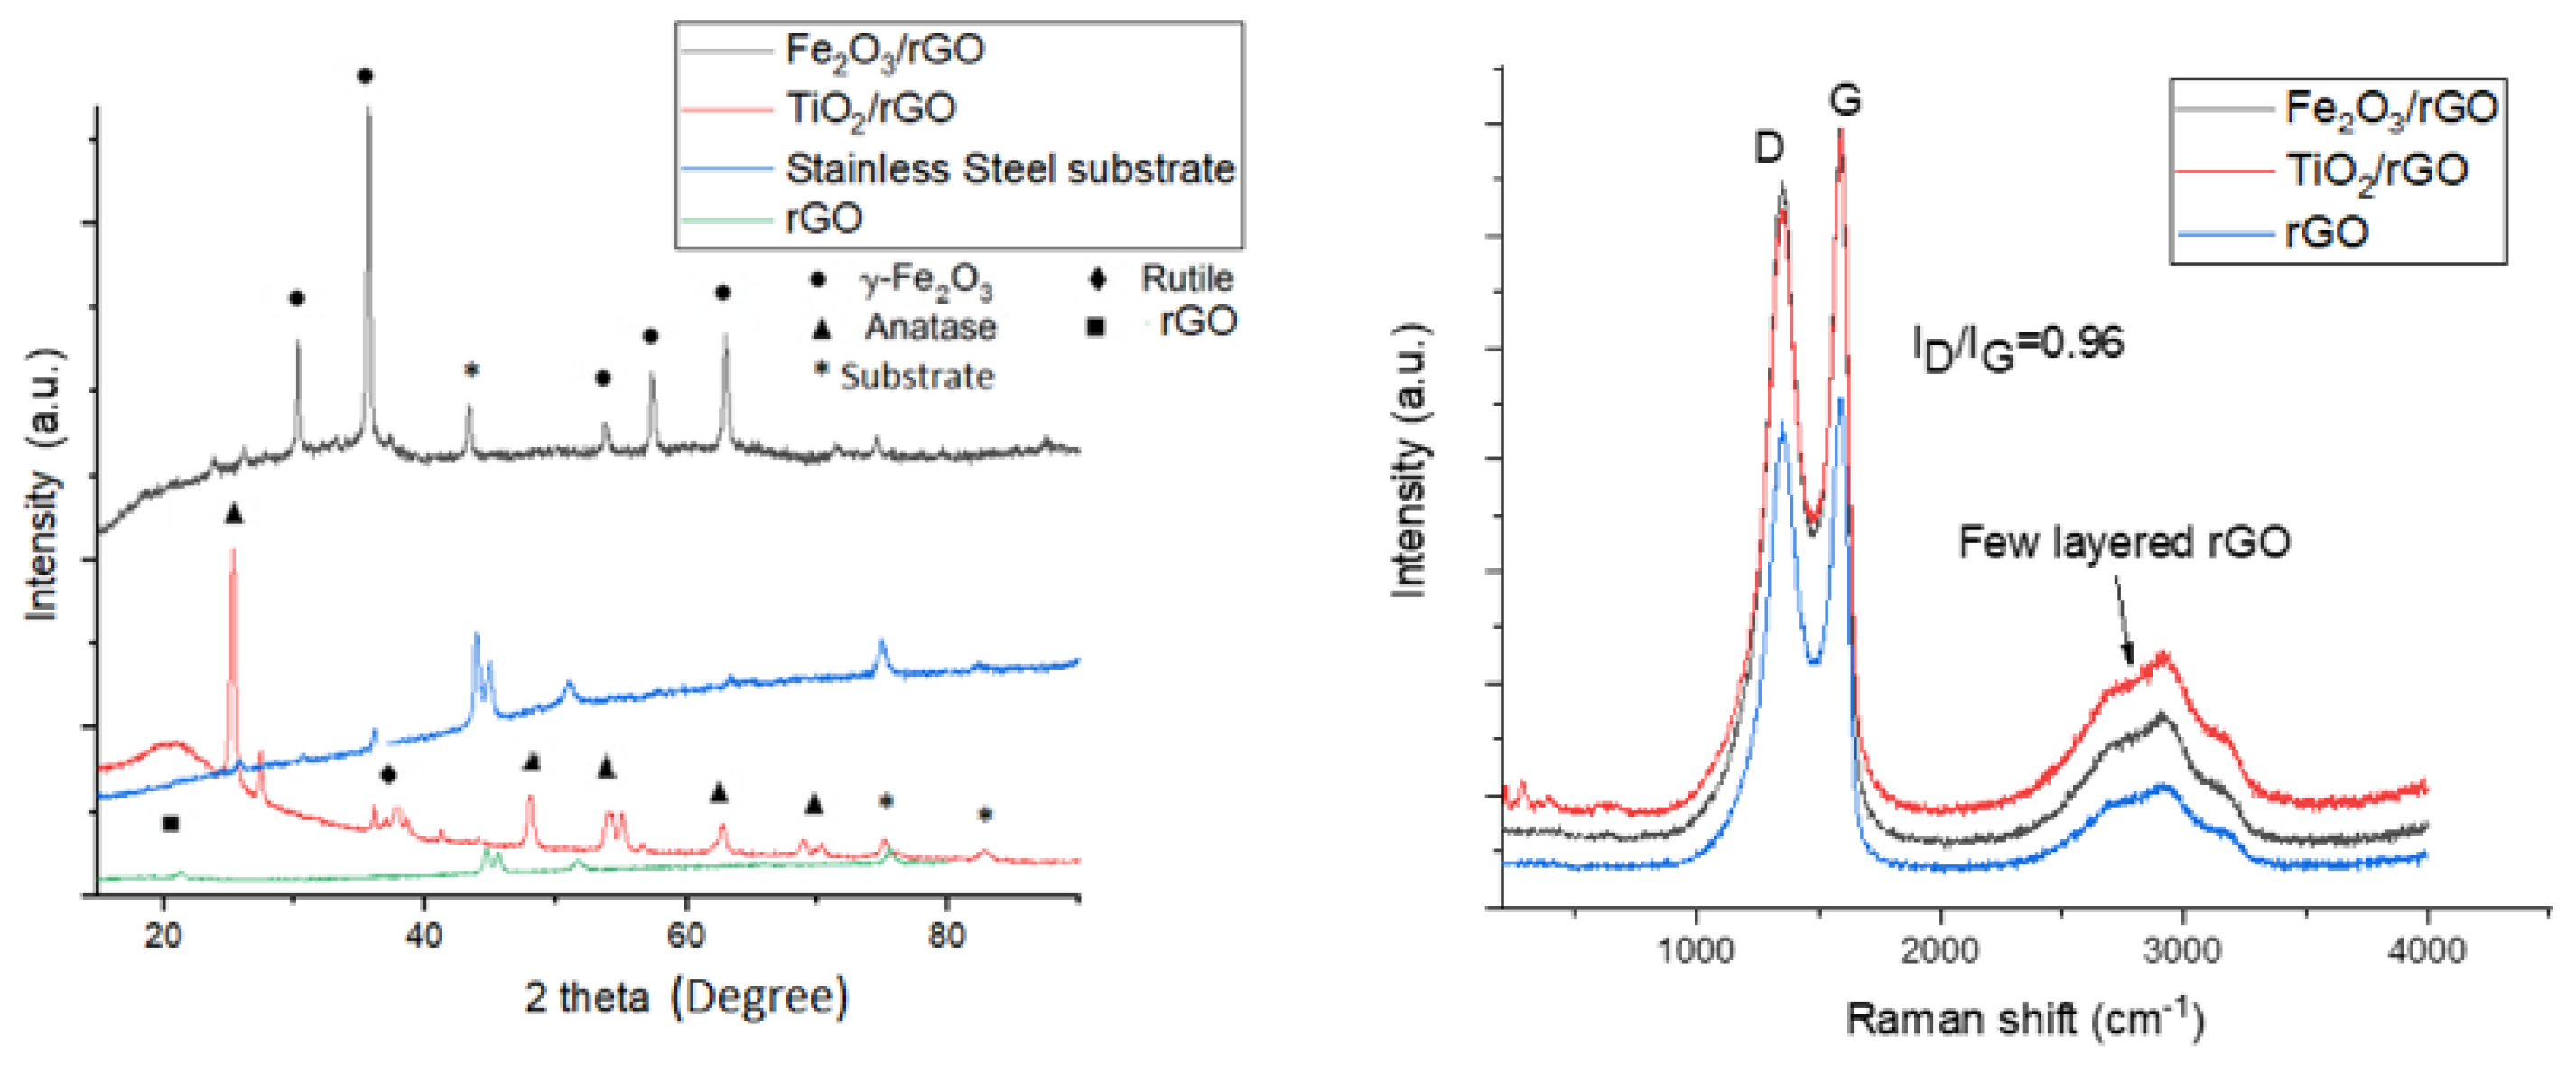
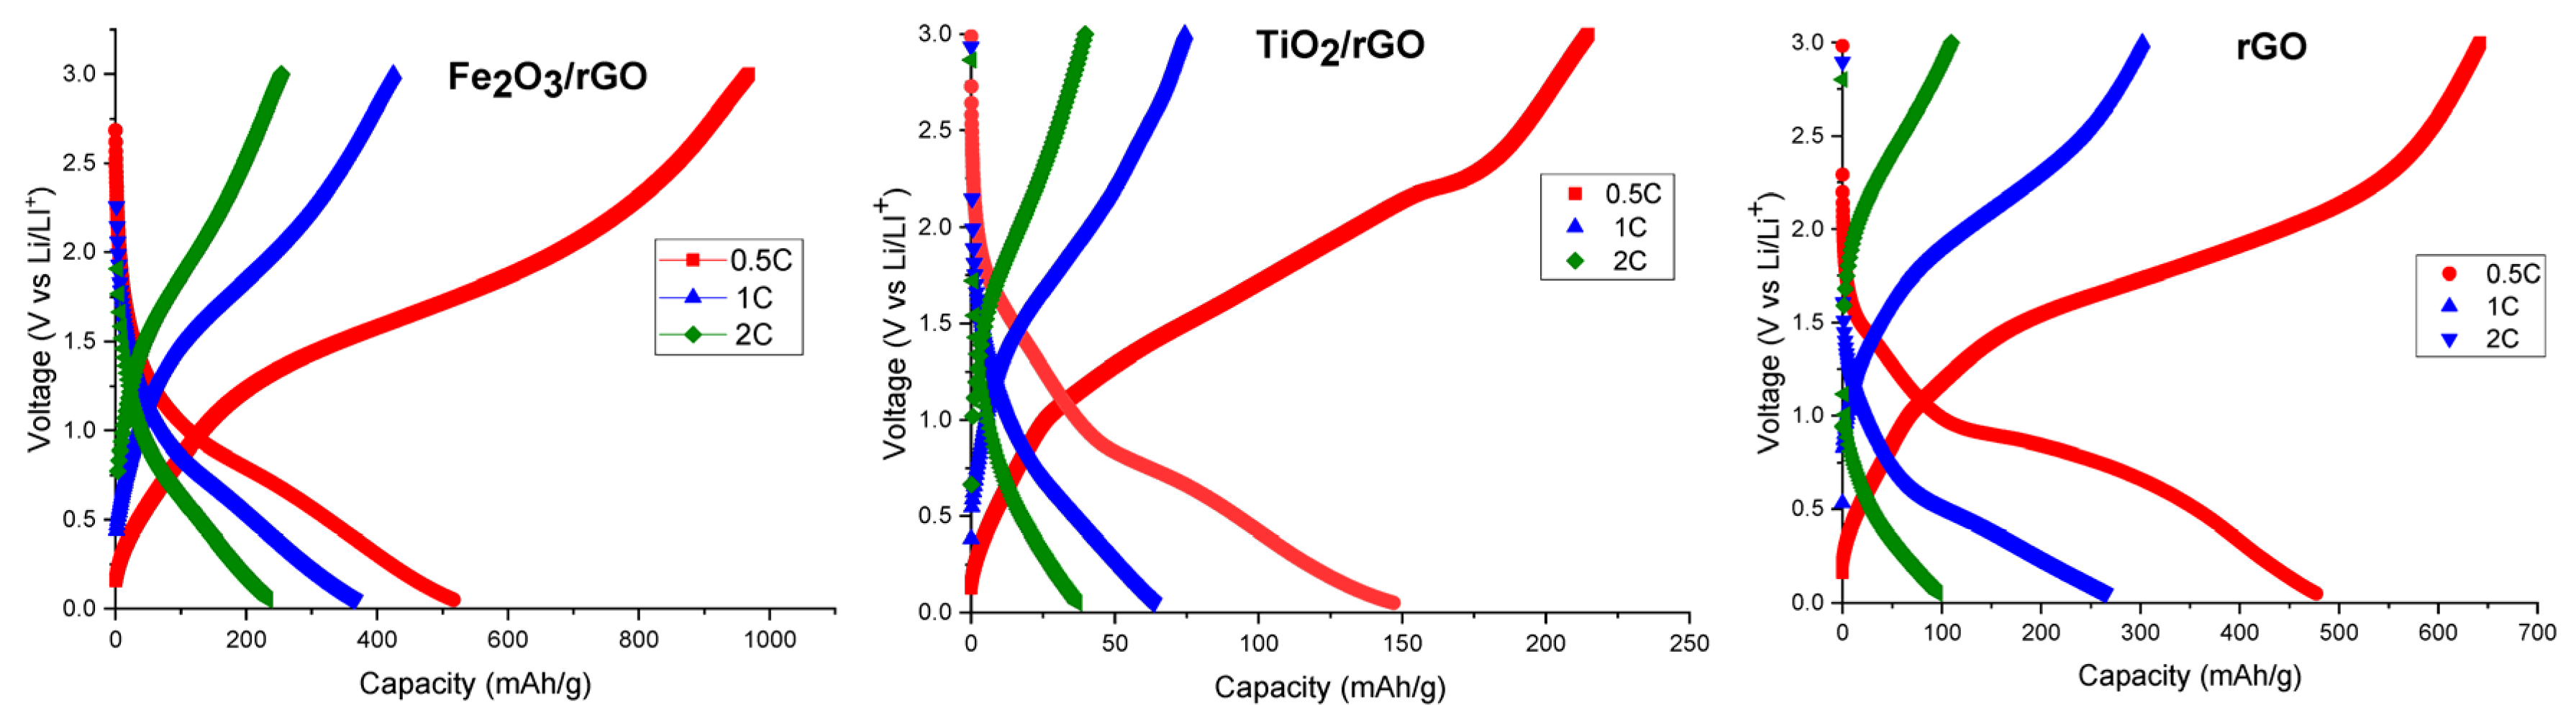
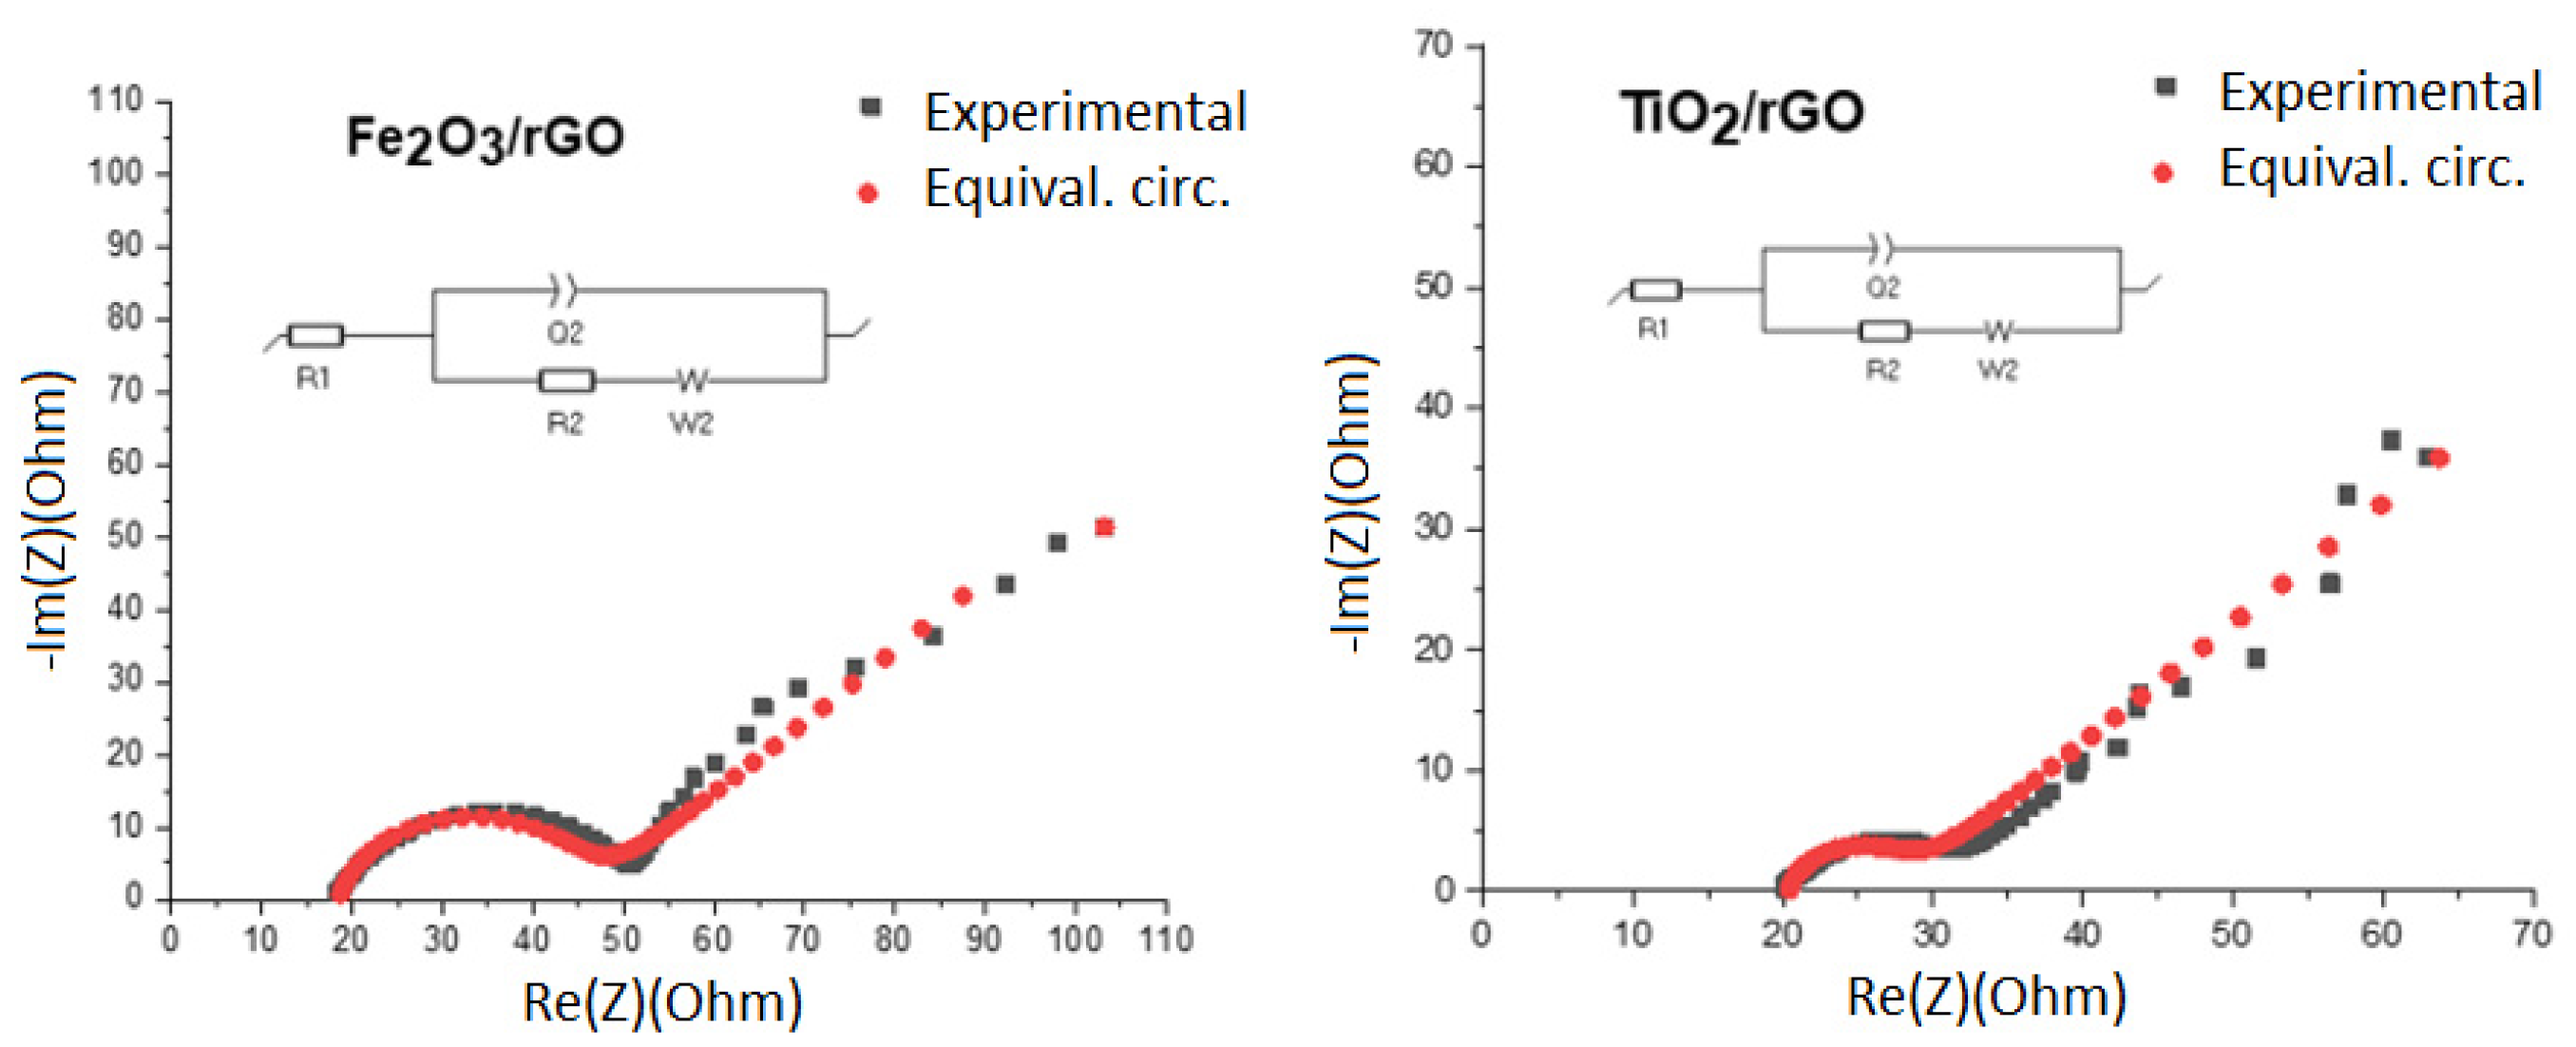
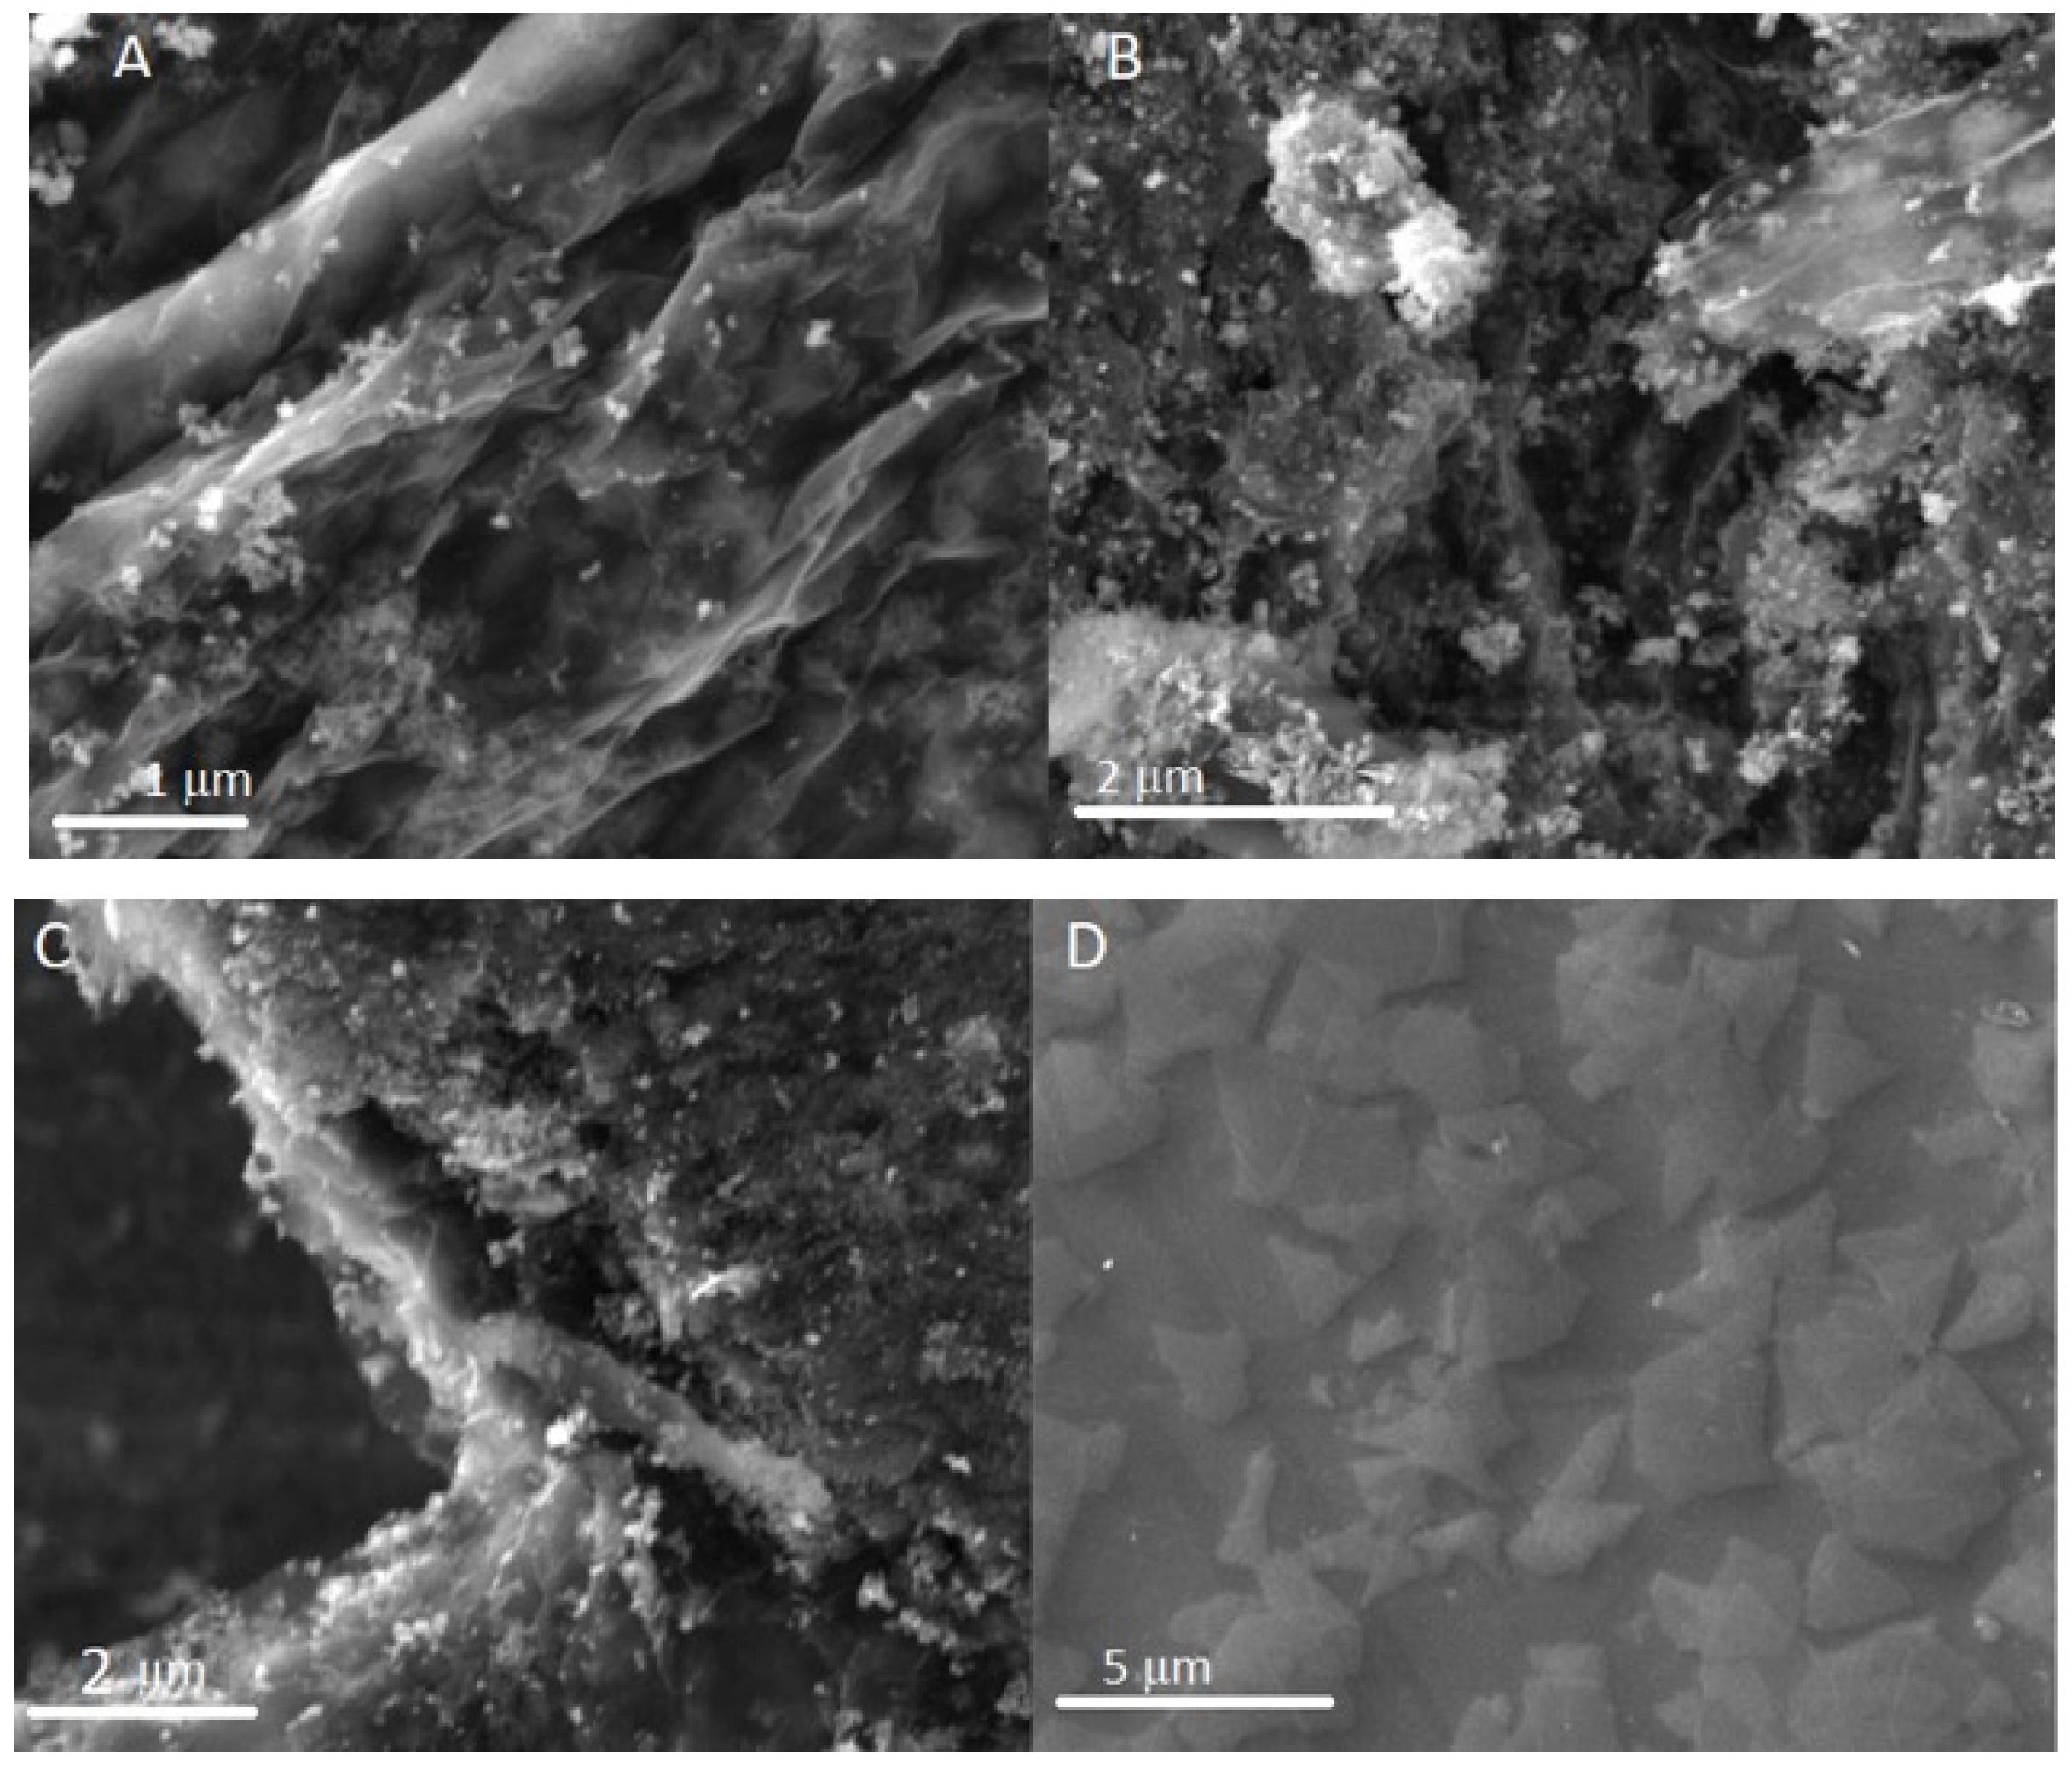
3.1. Study of Electrophoretically Deposited Iron Oxide, Titanium Dioxide, and Reduced Graphene Oxide

The weights of the Fe2O3/rGO, TiO2/rGO, and rGO films were estimated to range from 0.35 to 0.65 ± 0.01 mg, with corresponding film thicknesses ranging from 2.2 to 4.8 ± 0.1 μm. Scanning electron microscopy analysis revealed that Fe2O3 and TiO2 nanoparticles and agglomerates were embedded within the rGO layers and attached to their surfaces (Figure 1). The grain sizes were estimated based on SEM images using the ImageJ 1.53t software. The measurement was performed by manually outlining individual particles to determine their diameters. At least 100 particles were analyzed for each sample to ensure statistical relevance, and the average particle size with standard deviation was calculated. The measured grain sizes of TiO2 ranged from 30 ± 12 nm to 50 ± 12 nm, while the Fe2O3 grains exhibited sizes between 300 ± 43 nm and 500 ± 43 nm.
X-ray diffraction analysis (Figure 2, to the left) revealed that the obtained thin films consisted of iron oxide γ-Fe2O3 (maghemite), anatase phase TiO2, and a small admixture of rutile phase TiO2. The presence of rGO was identified in the TiO2/rGO sample. The calculated average crystallite size was 19.5 nm for Fe2O3/rGO and 42.8 nm for TiO2/rGO. The crystallite size was calculated using the Scherrer equation:
D = K λ β · cos Θ
where K is the shape factor, taken as 0.9, λ is the X-ray wavelength (Cu Kα, 1.5406 Å), β is the full width at half maximum (FWHM) of the diffraction peak in radians, and θ is the Bragg angle corresponding to the peak. The FWHM values were obtained by fitting the XRD peaks using OriginPro (OriginPro 2023, version 10.0.0.154) software. This method was applied to the most intense diffraction peak for each sample: Fe2O3/rGO at 2θ = 35.3°, TiO2/rGO at 25.3°, and rGO at ~24°, which corresponded to the (002) plane of turbostratic graphene oxide [29].
Analysis of the Raman spectra (Figure 2, to the right) showed the presence of reduced graphene oxide in the nanocomposites, and the intensity of the G-band located at a wavenumber value of 1600 cm−1 was slightly higher than the D-band intensity at 1350 cm−1. This was also confirmed by the decrease in the ID/IG band intensity ratio value. For graphene oxide, the relation of ID/IG bands was 1.1, while after its reduction, it was ID/IG = 0.96, respectively, which shows that the ratio of D and G band intensities decreased by 13% during the reduction process. The reduction of graphene oxide was successful, and a partial recovery of the carbon atomic structure occurred. A broad peak in the range from 2500 to 3500 cm−1 indicated the presence of a few layered graphene (FLG) [30]. The BET analysis showed that the TiO2/rGO material had largest surface area of 50.2 ± 0.1 m2g−1 and pore volume of 0.16 ± 0.05 cm3g−1, both measured values comparable to the results reported in the literature. The average pore diameter for both transition metal oxide films was found to be approximately 12 nm [31]. It should be noted that Fe2O3/rGO and TiO2/rGO showed higher values of pore volume and average pore diameter compared with the pure reduced graphene oxide thin film.
Rate capability tests of the obtained electrode materials were performed, where the applied current increased from 0.5C to 2C and the gravimetric capacities of Fe2O3/rGO, TiO2/rGO, and rGO decreased by 64%, 73%, and 77%, respectively. The result indicates that Fe2O3/rGO showed the highest tolerance to current increase. Galvanostatic measurements were performed to reveal potential voltage plateaus and analyze the charge–discharge behavior of the electrodes (Figure 3).
The galvanostatic charge–discharge curves did not show any distinct charge–discharge plateaus. The Fe2O3/rGO at a current of 0.5C showed a small discharge plateau at 0.8 V, related to the gradual reduction process of Fe2O3 from Fe3+ to Fe0. For the TiO2/rGO and rGO electrode materials, a small plateau in the voltage range of 0.6–0.9 V was found, consistent with the intercalation of the lithium into the material structure [30,32,33]. The highest capacity was determined at a discharge current of 0.5C for Fe2O3/rGO = 604 mAhg−1, TiO2/rGO = 280 mAhg−1, and rGO = 473 mAhg−1.
Cycle performance tests were performed in Swagelok-type cells using lithium metal as a counter electrode. The cells were cycled in a voltage window of 0.01–3.0 V (vs. Li/Li+) at a constant current corresponding to a C-rate of 1C. All measurements were carried out at room temperature (25 ± 2 °C). Cycle performance revealed that TiO2/rGO (Figure 4) exhibited the highest cycling stability, as evaluated by the percentage of charge capacity retained after cycling. This result is evidence of applying TiO2 as a matrix to improve high capacity LIB electrode materials.
Cyclic voltammetry measurements of the Fe2O3/rGO and TiO2/rGO electrode materials (Figure 5) revealed characteristic lithium injection and extraction peaks for Fe2O3 and TiO2 and high reversibility of the redox reactions, as evidenced by the overlap of several CV cycles. The electrode potential was reported vs. Li/Li+, where lithium metal served as both the counter and reference electrode.
In the first cathodic scan of the Fe2O3/rGO electrode, a broad and intense reduction peak appeared around ~0.55 V (vs. Li/Li+) due to the initial reduction of Fe2O3 to Fe0 and the formation of Li2O, accompanied by irreversible SEI formation and structural activation of the electrode. In the subsequent cycles (from second to fourth), this peak decreased in intensity and shifted slightly to higher potentials ~0.7 V (vs. Li/Li+), indicating stabilization of the electrode/electrolyte interface and a reduction in irreversible side reactions. The presence of reduced graphene oxide enhanced electrical conductivity and buffered mechanical stress during lithiation/delithiation, thereby facilitating more stable redox reactions. On the anodic side, an oxidation peak appeared around 1.6 V, attributed to the oxidation of Fe0 to Fe2+/Fe3+. This peak became increasingly pronounced in subsequent cycles, with a peak current of approximately 0.32 mA in the fourth cycle, reflecting improved redox reversibility. These findings are consistent with previously reported behavior for Fe2O3-based anodes. The main electrochemical reactions observed in the CV curves (Figure 5) can be summarized as follows [34,35]:
For Fe2O3/rGO:
Fe2O3 + 6Li+ + 6e → 2Fe0 + 3Li2O
Fe2O3 + 2Li+ + 2e → Li2(Fe2O3)
2Fe0 → Fe2+/Fe3+ + e
For TiO2/rGO:
TiO2 + xLi+ + xe ⇌ LixTiO2
For the Fe2O3/rGO electrode material, an increase in the current flowing through the electrode with an increasing number of CV cycles was observed, which was comparable with the results obtained by electrochemical impedance spectroscopy (Figure 6). The possible causes of the observed phenomenon are the formation of metal nanoparticles during the charge–discharge of transition metal oxides, which improves the electrical conductivity of the electrode [36], and electrochemical cycling improves the interactions between nanoparticles in the nanocomposite, which enhances its electrical conductivity and lithium ion kinetics [37]. The current value of lithium intercalation for TiO2/rGO decreased slightly during multiple CV cycles (Figure 5), which indicates electrode polarization and growth of the SEI (solid–electrolyte interface) layer [14,38]. Using the Randles–Sevchick equation, the chemical diffusion coefficients of the cathodic cycle lithium were calculated: D(Fe2O3/rGO) = 16 × 10−14 cm2/s and D(TiO2/rGO) = 1 × 10⁻¹⁴ cm2/s. Comparison of CV and the charge–discharge profiles showed that the voltage values of the cathodic lithium injection peaks had some approximation to the identified discharge plateau regions in the charge–discharge profiles. A good agreement between the experimental and calculated spectrum was observed when analyzing the results obtained using electrochemical impedance spectroscopy (Figure 6). The determined charge transfer resistance (Rct) for the TiO2/rGO electrode was 15 Ω/cm2, significantly lower than for the Fe2O3/rGO electrode (Rct = 38 Ω/cm2). This demonstrates a strategy on how to facilitate charge transfer (e.g., by integrating both transition metal oxides into a single electrode material). It should be noted that the EIS measurements were performed in a half-cell configuration using lithium metal as both the counter and reference electrode. Due to lithium’s high surface reactivity and the instability of its SEI layer, the measured impedance parameters may have been affected in part by the interface at the lithium electrode. Although this configuration is commonly used in Li-ion battery research, future studies should take into account the use of a symmetric cell design to improve the accuracy of the impedance measurements for the working electrode.
The equivalent circuit parameters derived from the electrochemical impedance spectra of the Fe2O3/rGO and TiO2/rGO electrodes are summarized in Table 2. The fitted model consisted of an electrolyte resistance (Rs), a constant phase element (CPE) characterized by parameters T and P, a charge transfer resistance (Rct), and a Warburg impedance (W), which accounted for lithium ion diffusion. The fitting results demonstrated a good agreement with the experimental data, with χ2 values in the range of 10−3, indicating the reliability of the equivalent circuit model used.
The diffusion coefficient of lithium determined by EIS showed values of D (Fe2O3/rGO) = 1 × 10⁻¹⁶ cm2/s, and D (TiO2/rGO) = 5 × 10⁻¹⁶ cm2/s. The diffusion coefficient values for lithium determined by CV and EIS differed by two orders of magnitude. The reason is still under investigation, but a difference in diffusion coefficients determined by two methods has also been observed by other authors [39,40,41].

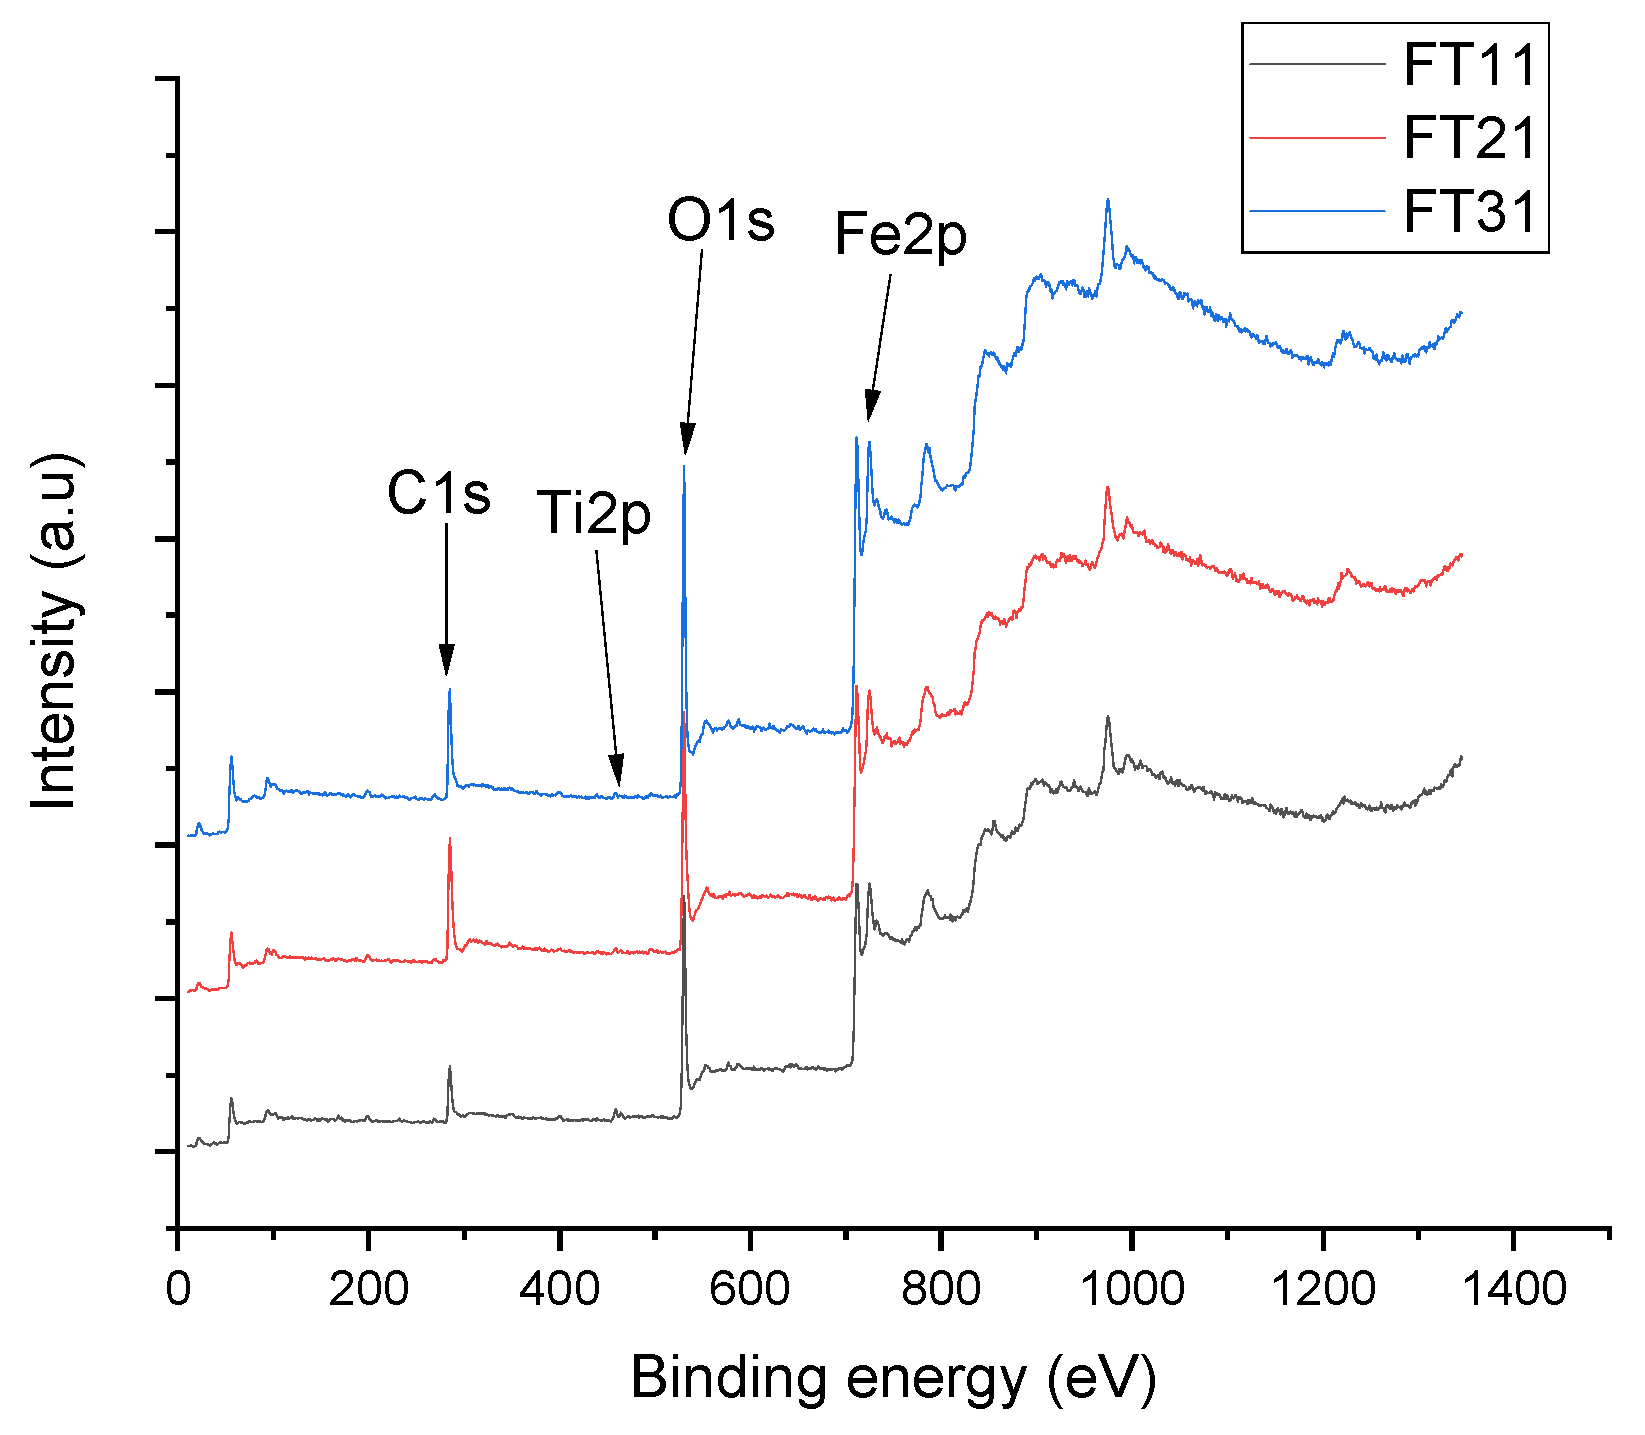
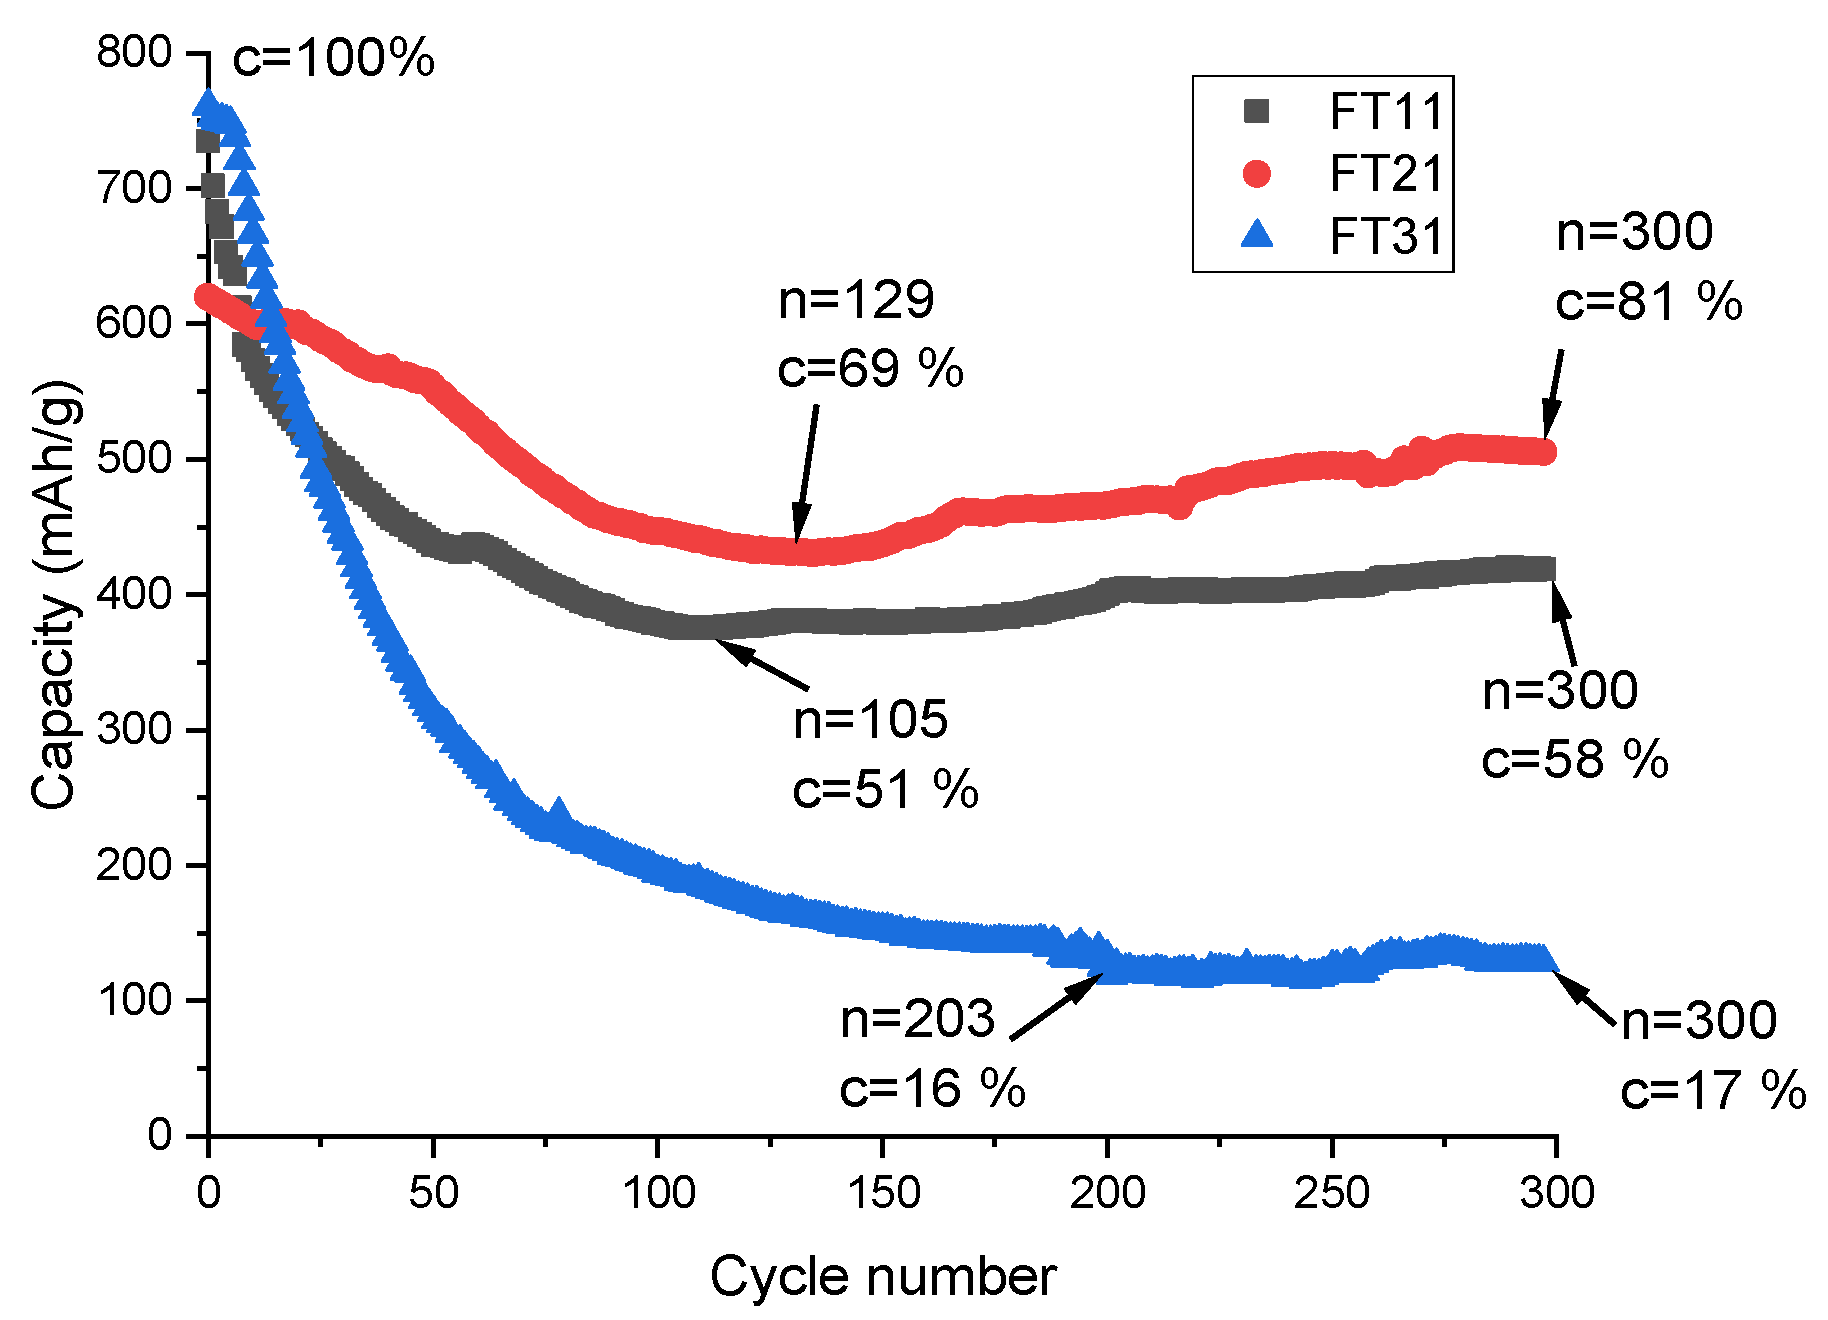
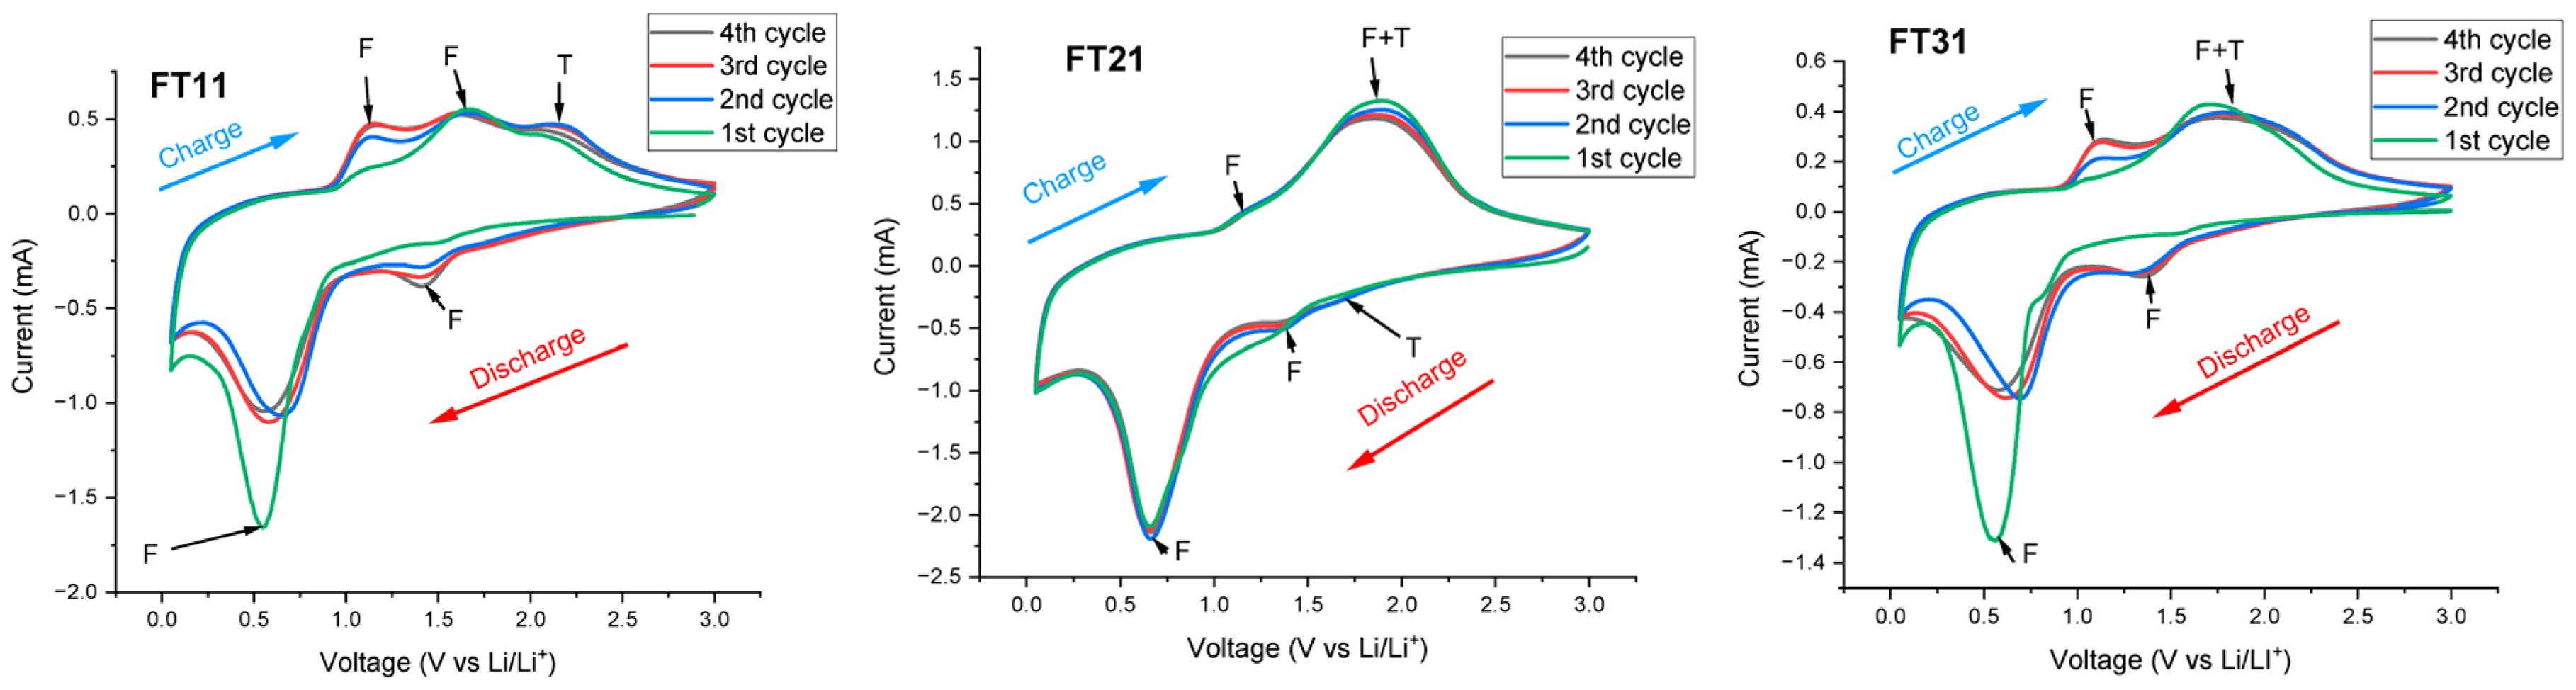
3.2. Study of Different Quantitative Compositions of Iron Oxide and Titanium Dioxide Electrode Materials

Using an analytical balance and surface profilometry, the weight and thickness of the FT11, FT21, and FT31 nanocomposite thin films were determined from 0.55–0.93 ± 0.01 mg to 3.8–6.1 ± 0.1 μm, respectively. SEM analysis showed Fe2O3 and TiO2 nanoparticles and their agglomerates anchored on a reduced graphene oxide matrix (Figure 7A). A separate rGO flake was found on the surface of the nanocomposite, coated with Fe2O3 and TiO2 nanoparticles (Figure 7B). This indicates the high adhesivity of the nanoparticles. The reduced graphene oxide flakes in the nanocomposite structure act as a matrix, either by binding nanoparticles to the surface or by incorporating them into the layered structure of rGO.
Further analysis revealed that the deposition of graphene oxide flakes produced a multilayer graphene oxide material (Figure 7C), which was also confirmed by the Raman spectroscopy. The average dimensions of the graphene oxide flakes were 3114 μm (length) and 1554 μm (width) (Figure 7D). The films obtained were inhomogeneous and granular, particle agglomerates were detected. Summarizing the observations, it can be concluded that electrophoretic deposition produced a thin layer of material deposited on the steel substrate consisting of both individual Fe2O3 and TiO2 nanoparticles and their agglomerates. The average particle diameters determined for FT11, FT21, and FT31 were found to be similar in the range of 98–120 nm, however, a slight trend of increasing size with increasing amount of Fe2O3 in nanocomposite was observed. The active surface area and porosity of the thin films were evaluated, and it was found that the active surface area and pore volume decreased with an increasing amount of Fe2O3. The average pore diameter of the nanocomposite thin films was ≈12.5 nm.
Analysis of the X-ray diffraction patterns showed that the nanocomposite thin films consisted of a maghemite phase, Fe2O3 (denoted by F), and an anatase phase, TiO2 (denoted by T), with a small admixture of a rutile phase, TiO2 [42], demonstrating that, for the first time, composite layers of Fe2O3 and TiO2 were successfully obtained by DC electrophoretic deposition (Figure 8).
Using an open source program (Profex BGMN 5.2.0), the amount of material phases was estimated using the Rietveld method (Table 3). The analysis revealed that nanocomposites FT21 and FT31 corresponded to the molar ratios of materials defined during suspension preparation for electrophoretic deposition. A slight deviation from the original amount was found for nanocomposite FT11, where the calculated weight percentage was 55:45 wt%, although the weight percentage ratio prepared in suspension was 60:30 wt%. The deviation from the initial setup found in the FT11 nanocomposite layer suggests that suspensions containing a high concentration of TiO2 nanoparticles undergo a faster deposition process, increasing the amount of TiO2 in the deposited layer.
X-ray microspectral analysis and X-ray photoelectron spectroscopy were performed to obtain information on the composition of the nanocomposite and to estimate the number of chemical elements. Summarizing the results, it was found that the nanocomposite materials consisted of Fe, Ti and O, which were also present in the prepared suspension before electrophoretic deposition.
The analysis of EDX spectra showed that the measured positions of the Fe intensity peak on the x-axis corresponded to the maghemite phase of iron oxide [43], while the Ti peaks corresponded to the anatase phase of titanium dioxide [32]. The distribution of Fe, Ti, and O was relatively homogeneous, confirming the uniform deposition of particles during EPD. In the FT31 nanocomposite, several regions of increased Ti concentration were found, which could indicate an increased agglomeration of TiO2 nanoparticles in the prepared suspension or during EPD. The presence of these agglomerates in the thin film explains the increased Ti content in the FT31 nanocomposite material.
Analysis of the XPS spectra revealed typical peaks at the energy levels of Fe, Ti, C, and O atoms (Figure 9). The x-axis values of the measured XPS peaks were similar for the materials, but the characteristic areas under the curve were different. Based on the above, it can be concluded that the nanocomposite consisted of the same chemical elements, the amount of which varied from FT11 to FT31.
The quantitative analysis of the chemical elements showed a gradual increase in Fe and a decrease in Ti in proportion to the composition of the prepared suspensions. The highest value of titanium weight percentage was observed for nanocomposite FT11, which agrees with the calculation of the Rietveld method used in XRD. Comparison of the quantitative calculations performed by XPS, EDX, and XRD showed that all methods used to investigate the thin films showed an increase in the Fe content with an increasing molar fraction of iron in suspension (Table 3). This observation led to the conclusion that the EPD method can be applied to customize the composition of the material by preparing suspensions with specific molar ratios of the materials.
It should be noted that the compositional differences observed among the XRD, EDX, and XPS data were due to the inherent differences in their probing depth and sensitivity. XRD provides information on the bulk crystalline structure, typically on the micrometer scale, while EDX captures near-surface elemental composition and can be influenced by particle agglomeration or inhomogeneous distribution. In contrast, XPS is an ultra-surface-sensitive technique (5–10 nm) and is strongly affected by surface oxidation, adsorbed species, or functional groups—especially in rGO-containing materials. Therefore, the deviations in the detected elemental ratios were expected and should be interpreted in the context of each technique’s limitations [29,44].
To evaluate the application of FT11, FT21, and FT31 nanocomposite materials in lithium-ion batteries, battery half-cells were assembled, and electrochemical performance measurements were performed. Galvanostatic analysis of the charge–discharge curves (Figure 10) showed that among the electrode materials, the FT31 nanocomposite had the highest gravimetric capacity, 729 mAh/g or 68% of theoretical charge capacity, which was 17% higher than the charge capacity of Fe2O3/rGO (604 mAhg−1). Some research groups have reported that the improved capacity of Fe2O3 and TiO2 composite electrodes were improved compared with pure transition metal oxide electrode materials, suggesting that the electrochemical activity of Fe2O3 and TiO2 nanoparticles effectively interact and create an electrode material with higher gravimetric capacitance [30,33,34].
At a current value of 0.5C, the charge–discharge curves showed small, quasi-linear regions in the voltage range of 0.4 to 0.8 V, corresponding to the gradual reduction process of Fe2O3 and Fe3+ changes its oxidation state to Fe0. In this reaction, an electrode–electrolyte interface layer and Li2O are formed. The capacities of the nanocomposite electrode materials FT11 and FT21 were 571 mAh/g and 683 mAh/g, or 77% and 88% of the theoretical gravimetric capacity, respectively.
The FT21 nanocomposite electrode material exhibited a gravimetric capacity value closest to its theoretical gravimetric capacity. From this observation, it can be concluded that the FT21 electrode material was characterized by the highest lithium injection and electrochemical activity. The rate capability tests of FT11, FT21, and FT31 showed that the gravimetric capacity decreased gradually with increasing current. For example, as the value of the applied current increased from 0.5C to 2C, the respective gravimetric charge capacities of electrode materials FT11, FT21, and FT31 decreased by 85%, 77%, and 64%. Among all of the materials, the FT31 nanocomposite had the highest tolerance against current increment. To assess the ability of electrode materials to maintain capacity over multiple charge–discharge cycles, a cycling test was performed (Figure 11).
It was clearly seen that all electrode materials showed a gradual decrease during the initial charge–discharge cycles, which was due to pulverization of iron oxide particles during lithium injection–extraction, causing a loss of electrical contact between the electrode material and current collector. Pulverization is the loss of the homogeneous structure of the electrode material due to tension and/or compression, caused by repeated changes in particle volume during the lithium injection and extraction process [23]. A comparison of curves showed that the slowest decrease in capacity during cycles was for the FT11 and FT21 nanocomposite materials. The improved electrochemical performance was probably due to the increased amount of TiO2 in the electrode material. The titanium dioxide nanoparticles inhibited the pulverization of the Fe2O3 particles while maintaining their structural integrity, which could be observed as the curves’ slope stabilization for FT11 and FT21 after a hundred charge–discharge cycles. The highest retention of charge capacity was observed for the nanocomposite electrode material FT21, which retained 69% of its initial gravimetric capacity value after 129 charge–discharge cycles. As the cycling process continued, the gravimetric capacity of FT21 increased and reached a value of 508 mAh/g or 81% of the initial charge capacity. The increase in capacity during the electrochemical cycling process is not characteristic of the nano-sized Fe2O3 composites but has also been observed for other conversion-type 3D transition metal oxides such as Co2O3 and MnO2 [19]. Several mechanisms have been put forward to explain the increase in capacity: (1) in the low voltage range of 0–1.9 V, as the electrolyte is reduced, an organic polymer–gel film is formed around the metal nanoparticles, into which lithium ions are incorporated, providing an additional charge capacity up to 800 charge–discharge cycles [45,46]; (2) uncompensated lithium ions accumulate in the interfacial space between the metal nanoparticles and electrolyte, compensated by electrons from the nanoparticle surface [47,48]; (3) new lithium injection “sites” are formed in the electrode material during cycling (i.e., resulting in additional charge capacity of the electrode material) [46]; and (4) Fe nanoparticles, formed as a side product of irreversible reactions and localized at the grain boundary surface of Fe2O3/TiO2, improve the electrical conductivity of active materials and facilitate oxidation–reduction reactions, which finally provides additional capacity [49].
The additional capacity observed for FT11 and FT21 is probably related to the reactions occurring on the surface of the material. Surface charge storage is divided into Faradaic (pseudocapacitance) and non-Faradaic (electric double layer capacitance). The pseudocapacitive charge storage mechanism is more relevant for charge storage in the SEI layer and at the metal nanoparticle/Li2O interface. The electric double layer energy storage mechanism refers to the static storage of electric charge for materials with a large surface area [50,51]. A comparison of the electrochemical performance of transition metal oxides composites is summarized in Table 4.
Cyclic voltammetry (CV) was performed to obtain information about the lithium ion injection–extraction peaks, the electrochemical activity of the FT11, FT21, and FT31 electrode materials, and data acquisition for the lithium ion diffusion coefficient calculations (Figure 12).
For nanocomposites FT11 and FT31, the intensity of the cathodic current peak (at voltage value ≈ 0.6 V) was highest in the first cycle. In the following cycles, the intensity of the current peak decreased, which indicates irreversible chemical reactions in the electrode material and a partial loss of initial capacity, which takes place during the electrochemical stabilization of the electrode and is related to SEI layer formation. The FT21 electrode material exhibited the highest lithium injection current peak (I = 2.2 mA) (Figure 12) and the best reversibility of reactions, confirming the high electrochemical activity. The data obtained by the CV method were used to calculate the lithium diffusion coefficient. Results revealed that the FT11 and FT21 nanocomposite electrode materials showed the highest lithium diffusion coefficient (Table 5). After summarizing the results of the electrochemical activity and lithium diffusion coefficient, the FT11 and FT21 nanocomposite electrode materials were chosen for further studies. The results obtained by EIS showed that the lowest charge transfer resistance (Rct) at the battery half-cell voltage U = 0.5 V was observed for the FT21 electrode (Rct = 15.4 Ω), which was 40% lower than for the FT11 electrode material. The lower value of Rct indicates an efficient charge transfer and thus a higher rate capability of FT21, which was also confirmed by previous rate capability measurements. For nanocomposite FT21, a good agreement of the experimental EIS spectrum with that calculated was observed (Figure 13).
The equivalent circuit for fitting the EIS spectra of the FT11 and FT21 electrodes was identical to that used for Fe2O3/rGO and TiO2/rGO, ensuring consistency for interpretation of the impedance parameters. The lithium diffusion coefficient determined by EIS showed values of D(FT11) = 7 × 10⁻¹⁶ cm2/s, and D(FT21) = 9 × 10⁻¹⁶ cm2/s. Table 5 was created to compare the calculated diffusion coefficients.
The table shows that the lithium diffusion coefficients obtained by both methods were higher for the Fe2O3 and TiO2 nanocomposite materials, indicating the positive effect of combining the two transition metal oxides to facilitate lithium diffusion in the electrode material.
The electrophoretic deposition method used in this study demonstrates excellent potential for scalable and binder-free electrode fabrication. EPD is a low-cost and room-temperature technique that enables uniform coatings on various conductive substrates. By adjusting parameters such as the deposition time, voltage, and suspension concentration, the film thickness and mass loading can be controlled. However, to ensure industrial viability, challenges such as achieving high areal mass loading, maintaining uniformity over large areas, and strong adhesion to commercial current collectors (e.g., Cu or stainless steel foil) must be addressed through process optimization. Notably, EPD is compatible with roll-to-roll processing, making it suitable for integration into existing LIB manufacturing lines [52,53,54].
Although a direct quantitative analysis of the residual functional groups on the rGO surface (e.g., by XPS or FTIR after reduction) was not performed in this study, it is reasonable to assume that due to the thermal reduction conditions applied, a certain amount of –OH, –COOH, and epoxy groups remains on the rGO surface. These residual groups may slightly reduce the electrical conductivity of rGO; however, they could also improve the wettability of the electrode, facilitate lithium-ion transport, and promote chemical interaction between rGO and metal oxides. As a result, the presence of these functional groups can have a positive effect on the structural integrity and long-term electrochemical performance of the electrode. This aspect is important and will be further explored in future work. The presence of rGO in the Fe2O3/TiO2 composite anode plays a vital role in enhancing the electrochemical performance, provides a highly conductive network that facilitates electron transport, buffers the mechanical stress from volume expansion during lithiation/delithiation, and supports the metal oxide nanoparticles [55].

4. Conclusions

Electrophoretic deposition has been proven to be effective for producing mechanically stable and porous two-component battery electrode materials of Fe2O3, TiO2, and reduced graphene oxide as a conductive additive. For the first time, ternary Fe2O3/TiO2/rGO nanocomposite thin films with varying transition metal oxide mass fractions were successfully fabricated using EPD. X-ray diffraction analysis combined with the Rietveld refinement confirmed that the mass fractions of Fe2O3 and TiO2 in the deposited films closely matched those in the precursor suspensions.
Among the nanocomposites, the FT21 sample exhibited the highest lithium insertion current peak and the greatest lithium-ion diffusion coefficient (1.2 × 10⁻¹² cm2s−1) as well as excellent charge–discharge reversibility. Notably, both the FT11 and FT21 nanocomposites showed an increase in specific capacity during cycling, attributed to a combination of Faradaic and non-Faradaic charge storage mechanisms. For instance, the specific capacity of FT21 increased from 442 mAh/g to 508 mAh/g after prolonged cycling, retaining 81% of its initial capacity.
Compared with electrodes composed of a single transition metal oxide, the Fe2O3–TiO2 composite demonstrated a significantly higher lithium diffusion coefficient, underscoring the synergistic benefit of combining these oxides. At a discharge rate of 0.5C, the FT21 electrode achieved a specific capacity of 683 mAh/g, corresponding to 88% of its theoretically calculated value. Based on its rate performance, cycling stability, and capacity retention, the nanocomposite with a 2:1 molar ratio of Fe2O3 to TiO2 (FT21) emerged as a highly promising high-performance electrode material for lithium-ion batteries.

Author Contributions

Methodology, K.K.; Investigation, K.K.; Writing—original draft, K.K.; Writing—review and editing, G.B. and G.K. All authors have read and agreed to the published version of the manuscript.

Funding

This research was funded by the Latvian Council of Science project “Cycle life prediction of lithium-ion battery electrodes and cells, utilizing current–voltage response measurements”, project no. LZP-2020/1–0425. The Institute of Solid-State Physics, University of Latvia, as the Center of Excellence, has received funding from the European Union’s Horizon 2020 Framework, Program H2020-WIDESPREAD-01-2016-2017-TeamingPhase2, under grant agreement no. 739508, project CAMART2.

Data Availability Statement

The original contributions presented in this study are included in the article. Further inquiries can be directed to the corresponding author.

Conflicts of Interest

The authors declare no conflict of interest.

References

  1. Qi, W.; Shapter, J.G.; Wu, Q.; Yin, T.; Gao, G.; Cui, D. Nanostructured Anode Materials for Lithium-Ion Batteries: Principle, Recent Progress and Future Perspectives. J. Mater. Chem. A 2017, 5, 19521–19540. [Google Scholar] [CrossRef]
  2. Smith, J.; Zhao, L. Iron Oxide-Based Composites for Energy Storage. Electrochim. Acta 2017, 231, 247–254. [Google Scholar] [CrossRef]
  3. Wang, H.; Li, X.; Baker-Fales, M.; Amama, P.B. 3D Graphene-Based Anode Materials for Li-Ion Batteries. Curr. Opin. Chem. Eng. 2016, 13, 124–132. [Google Scholar] [CrossRef]
  4. Kumar, P.; Singh, A. Novel Fe2O3 Anodes for Lithium Batteries. J. Power Sources 2011, 196, 6425. [Google Scholar] [CrossRef]
  5. Mishra, A.K.; Monika; Patial, B.S. A Review on Recent Advances in Anode Materials in Lithium Ion Batteries. Mater. Today Proc. 2024, 7, 100089. [Google Scholar] [CrossRef]
  6. Khan, B.M.; Oh, W.C.; Ullah, K. Development of Nanocomposites in Lithium-Ion Batteries. In Nanocomposites—Advanced Materials for Energy and Environmental Aspects; Khan, M.E., Aslam, J., Verma, C., Eds.; Woodhead Publishing Series in Composites Science and Engineering; Woodhead Publishing: Cambridge, UK, 2023; pp. 189–208. [Google Scholar] [CrossRef]
  7. Kurc, B.; Siwińska-Stefańska, K.; Jakóbczyk, P.; Jesionowski, T. Titanium Dioxide/Graphene Oxide Composite and Its Application as an Anode Material in Non-Flammable Electrolyte Based on Ionic Liquid and Sulfolane. J. Solid State Electrochem. 2016, 20, 1971–1981. [Google Scholar] [CrossRef]
  8. Shchegolkov, A.V.; Lipkin, M.S.; Shchegolkov, A.V. Preparation of WO3 Films on Titanium and Graphite Foil for Fuel Cell and Supercapacitor Applications by Electrochemical (Cathodic) Deposition Method. Russ. J. Gen. Chem. 2022, 92, 1161–1167. [Google Scholar] [CrossRef]
  9. Madian, M.; Eychmüller, A.; Giebeler, L. Current Advances in TiO2-Based Nanostructure Electrodes for High Performance Lithium Ion Batteries. Batteries 2018, 4, 7. [Google Scholar] [CrossRef]
  10. Perreault, L.L.; Colo, F.; Meligrana, G.; Kim, K.; Fiorilli, S.; Bella, F.; Nair, J.R.; Vitale-Brovarone, C.; Florek, J.; Kleitz, F.; et al. Spray-Dried Mesoporous Mixed Cu-Ni Oxide@Graphene Nanocomposite Microspheres for High Power and Durable Li-Ion Battery Anodes. Adv. Energy Mater. 2018, 8, 1802438. [Google Scholar] [CrossRef]
  11. Ulusoy Ghobadi, T.G.; Kunduraci, M.; Yilmaz, E. Improved Lithium-Ion Battery Anode Performance via Multiple Element Approach. J. Alloys Compd. 2018, 730, 96–102. [Google Scholar] [CrossRef]
  12. Kucinskis, G.; Bajars, G.; Kleperis, J. Graphene in Lithium Ion Battery Cathode Materials: A Review. J. Power Sources 2013, 240, 66–79. [Google Scholar] [CrossRef]
  13. Yu, S.; Guo, B.; Zeng, T.; Qu, H.; Yang, J.; Bai, J. Graphene-Based Lithium-Ion Battery Anode Materials Manufactured by Mechanochemical Ball Milling Process: A Review and Perspective. Compos. Part B Eng. 2022, 246, 110232. [Google Scholar] [CrossRef]
  14. Wang, D.; Choi, D.; Li, J.; Yang, Z.; Nie, Z.; Kou, R.; Hu, D.; Wang, C.; Saraf, L.V.; Zhang, J.; et al. Self-assembled TiO2–graphene hybrid nanostructures for enhanced Li-ion insertion. ACS Nano 2009, 3, 907–914. [Google Scholar] [CrossRef] [PubMed]
  15. Wu, H.B.; Chen, J.S.; Hng, H.H.; Lou, X.W. Nanostructured metal oxide-based materials as advanced anodes for lithium-ion batteries. Nanoscale 2012, 4, 2526–2542. [Google Scholar] [CrossRef]
  16. Kaprans, K.; Mateuss, J.; Dorondo, A.; Bajars, G.; Kucinskis, G.; Lesnicenoks, P.; Kleperis, J. Electrophoretically Deposited α-Fe2O3 and TiO2 Composite Anchored on rGO with Excellent Cycle Performance as Anode for Lithium Ion Batteries. Solid State Ionics 2018, 319, 1–6. [Google Scholar] [CrossRef]
  17. Wu, H.; Cui, Y. Designing Nanostructured Si Anodes for High Energy Lithium Ion Batteries. Nano Today 2012, 7, 414–429. [Google Scholar] [CrossRef]
  18. Zhang, X.; Zhang, B.; Pan, A.; Liang, S.; Tang, Y.; Wu, X. Facile Synthesis of Fe2O3/TiO2/rGO Composite with Enhanced Lithium Storage Performance. J. Alloys Compd. 2017, 723, 1006–1013. [Google Scholar] [CrossRef]
  19. Guo, S.; Wang, Y.; Chen, L.; Pan, D.; Guo, Z.; Xia, S. Porous TiO2–FeTiO3@Carbon Nanocomposites as Anode for High-Performance Lithium-Ion Batteries. J. Alloys Compd. 2021, 858, 157635. [Google Scholar] [CrossRef]
  20. Scrosati, B.; Garche, J. Lithium Batteries: Status, Prospects and Future. J. Power Sources 2010, 195, 2419–2430. [Google Scholar] [CrossRef]
  21. Etacheri, V.; Marom, R.; Elazari, R.; Salitra, G.; Aurbach, D. Challenges in the Development of Advanced Li-Ion Batteries: A Review. Energy Environ. Sci. 2011, 4, 3243–3262. [Google Scholar] [CrossRef]
  22. Qi, C.; Liu, C.; Meng, K.; Yu, X.; Zhang, Y.; Liu, J.; Jin, X.; Jin, L. Enhanced Performance of TiO2/α-Fe2O3 Nanostructure as Anode Material for Lithium-Ion Batteries. Int. J. Electrochem. Sci. 2018, 13, 265–274. [Google Scholar] [CrossRef]
  23. Li, H.; Richter, G.; Maier, J. Reversible Formation and Decomposition of LiF Clusters Using Transition Metal Fluorides as Precursors and Their Application in Rechargeable Li Batteries. Adv. Mater. 2003, 15, 736–739. [Google Scholar] [CrossRef]
  24. Chen, Y.; Liu, F.; Zhao, Y.; Ding, M.; Wang, J.; Zheng, X.; Wang, H.; Record, M.-C.; Boulet, P. Lychee-like TiO2@Fe2O3 Core-Shell Nanostructures with Improved Lithium Storage Properties as Anode Materials for Lithium-Ion Batteries. Materials 2023, 16, 1945. [Google Scholar] [CrossRef]
  25. Li, W.; Yang, Z.; Wang, J.; Wang, Y.; Wang, J.; Li, X.; Wang, Y. A Review on Recent Progress of Nanostructured Anode Materials for Lithium-Ion Batteries. J. Mater. Sci. Technol. 2022, 99, 9–17. [Google Scholar] [CrossRef]
  26. Zhang, L.; Wu, H.B.; Lou, X.W. Iron-Oxide-Based Advanced Anode Materials for Lithium-Ion Batteries. Adv. Energy Mater. 2014, 4, 1300958. [Google Scholar] [CrossRef]
  27. Xia, H.; Xiong, W.; Lim, C.K.; Yao, Q.; Wang, Y.; Xie, J. Hierarchical TiO2-B Nanowire@α-Fe2O3 Nanothorn Core-Branch Arrays as Superior Electrodes for Lithium-Ion Microbatteries. Nano Res. 2014, 7, 1797–1808. [Google Scholar] [CrossRef]
  28. Zuniga, L.; Gonzalez, G.; Orrostieta Chavez, R.; Myers, J.C.; Lodge, T.P.; Alcoutlabi, M. Centrifugally Spun α-Fe2O3/TiO2/Carbon Composite Fibers as Anode Materials for Lithium-Ion Batteries. Appl. Sci. 2019, 9, 4032. [Google Scholar] [CrossRef]
  29. Cullity, B.D.; Stock, S.R. Elements of X-Ray Diffraction, 3rd ed.; Prentice Hall: Upper Saddle River, NJ, USA, 2001. [Google Scholar]
  30. Laruelle, S.; Grugeon, S.; Poizot, P.; Dolle, M.; Dupont, L.; Tarascon, J.M. On the Origin of the Extra Electrochemical Capacity Displayed by MO/Li Cells at Low Potential. J. Electrochem. Soc. 2002, 149, A627–A634. [Google Scholar] [CrossRef]
  31. Nguyen, T.-A.; Halim, M.; Lee, J.K.; Lee, S.-W. Facile Synthesis of Nanoporous Fe2O3 with Internal Nanocavities for Highly Reversible Lithium Storage. Acta Mater. 2017, 140, 290–299. [Google Scholar] [CrossRef]
  32. Beaulieu, L.Y.; Larcher, D.; Dunlap, R.A.; Dahn, J.R. Reaction of Li with Grain-Boundary Atoms in Nanostructured Compounds. J. Electrochem. Soc. 2000, 147, 3206–3212. [Google Scholar] [CrossRef]
  33. Balaya, P.; Li, H.; Kienle, L.; Maier, J. Fully Reversible Homogeneous and Heterogeneous Li Storage in RuO2 with High Capacity. Adv. Funct. Mater. 2003, 13, 621–625. [Google Scholar] [CrossRef]
  34. Li, H.; Balaya, P.; Maier, J. Li-Storage via Heterogeneous Reaction in Selected Binary Metal Fluorides and Oxides. J. Electrochem. Soc. 2004, 151, A1878–A1885. [Google Scholar] [CrossRef]
  35. Zhang, Y.; Chen, B. Hierarchical Nanostructures for High-Performance Lithium-Ion Batteries. Adv. Energy Mater. 2013, 3, 737–743. [Google Scholar] [CrossRef]
  36. Zhou, Y.; Zhu, Q.; Tian, J.; Jiang, F. TiO2 Nanobelt@Co9S8 Composites as Promising Anode Materials for Lithium and Sodium Ion Batteries. Nanomaterials 2017, 7, 252. [Google Scholar] [CrossRef]
  37. Li, S.; Zhang, Y.; Huang, J. Three-Dimensional TiO2 Nanotubes Immobilized with Fe2O3 Nanoparticles as an Anode Material for Lithium-Ion Batteries. J. Alloys Compd. 2019, 783, 793–800. [Google Scholar] [CrossRef]
  38. Yang, Y.; Yuan, W.; Zhang, X.; Wang, C.; Yuan, Y.; Huang, Y.; Ye, Y.; Qiu, Z.; Tang, Y. A Review on FexOy-Based Materials for Advanced Lithium-Ion Batteries. Renew. Sustain. Energy Rev. 2020, 127, 109884. [Google Scholar] [CrossRef]
  39. Dreyer, D.R.; Park, S.; Bielawski, C.W.; Ruoff, R.S. The Chemistry of Graphene Oxide. Chem. Soc. Rev. 2010, 39, 228–240. [Google Scholar] [CrossRef]
  40. Chen, J.; Xu, L.; Li, W.; Gou, X. α-Fe2O3 Nanotubes as a Chemically Stable and Comb-Like Host for Lithium Storage with Superior Rate Capability and Long Cycling Life. Electrochim. Acta 2016, 211, 902–910. [Google Scholar] [CrossRef]
  41. Zhang, X.; Li, Y.; Wang, T.; Chen, Y.; Zhao, X. Improving Effect of Graphene on Electrochemical Properties of Fe2O3 Anode Materials. Metals 2022, 12, 593. [Google Scholar] [CrossRef]
  42. Zhang, S. Chemomechanical modeling of lithiation-induced failure in high-volume-change electrode materials for lithium ion batteries. npj Comput. Mater. 2017, 3, 7. [Google Scholar] [CrossRef]
  43. Liang, M.; Zou, J.; Zeng, X.; Ding, W. Nanostructured Fe2O3-Based Composites Prepared through Arc Plasma Method as Anode Materials in the Lithium-Ion Battery. J. Nanomater. 2016, 2016, 1207907. [Google Scholar] [CrossRef]
  44. Powell, C.J.; Jablonski, A. Surface Sensitivity of X-ray Photoelectron Spectroscopy. Nucl. Instrum. Methods Phys. Res. Sect. A 2009, 601, 54–65. [Google Scholar] [CrossRef]
  45. Guo, S.; Wang, S.; Wu, N.; Liu, J.; Nic, Y.; Liu, W. Facile Synthesis of Porous Fe2TiO5 Microparticulates Serving as Anode Material with Enhanced Electrochemical Performances. RSC Adv. 2015, 5, 103767–103775. [Google Scholar] [CrossRef]
  46. Yang, Y.; Liu, Q.; Cao, M.; Ju, Q.; Wang, H.; Fu, R.; Ji, H.; Yang, G. Enhanced Electrochemical Performance of α-Fe2O3 Grains Grafted onto TiO2-Carbon Nanofibers via a Vapor-Solid Reaction as Anode Materials for Li-Ion Batteries. Appl. Surf. Sci. 2019, 463, 322–330. [Google Scholar] [CrossRef]
  47. Zhao, W.; Fei, P.; Zhang, X.; Zhang, Y.; Qin, C.; Wang, Z. Porous TiO2/Fe2O3 Nanoplate Composites Prepared by De-Alloying Method for Li-Ion Batteries. Mater. Lett. 2018, 211, 254–257. [Google Scholar] [CrossRef]
  48. Zhong, Y.; Ma, Y.; Guo, Q.; Liu, J.; Wang, Y.; Yang, M.; Xia, H. Controllable Synthesis of TiO2@Fe2O3 Core-Shell Nanotube Arrays with Double-Wall Coating as Superb Lithium-Ion Battery Anodes. Sci. Rep. 2017, 7, 40927. [Google Scholar] [CrossRef]
  49. Kaprans, K.; Bajars, G.; Kleperis, J. Electrophoretic Nanocrystalline Graphene Film Electrode for Lithium Ion Battery. IOP Conf. Ser. Mater. Sci. Eng. 2015, 77, 012042. [Google Scholar] [CrossRef]
  50. Jiang, Y.; Liu, J. Definitions of Pseudocapacitive Materials: A Brief Review. Energy Environ. Mater. 2019, 2, 30–37. [Google Scholar] [CrossRef]
  51. Redel, K.; Kulka, A.; Walczak, K.; Plewa, A.; Hanc, E.; Marzec, M.; Lu, L.; Molenda, J. Origin of Extra Capacity in Advanced Li–Rich Cathode Materials for Rechargeable Li–Ion Batteries. Chem. Eng. J. 2021, 424, 130293. [Google Scholar] [CrossRef]
  52. Boccaccini, A.R.; Zhitomirsky, I. Application of electrophoretic and electrolytic deposition techniques in ceramics processing. Curr. Opin. Solid State Mater. Sci. 2010, 14, 205–212. [Google Scholar] [CrossRef]
  53. Wang, X.; Wang, F.; Chen, Y.; Liu, J. A review on electrophoretic deposition for organic/inorganic nanocomposite coatings: Fundamentals, applications, and perspectives. Adv. Colloid Interface Sci. 2015, 221, 25–43. [Google Scholar] [CrossRef]
  54. Yin, Y.-J.; Hu, F.; Cheng, L.-H.; Wang, X.-D. Electrophoretic Deposition of Hybrid Organic-Inorganic PTFE/Al/CuO Energetic Film. Defence Technol. 2023, 22, 112–118. [Google Scholar] [CrossRef]
  55. Zhang, Y.; Wang, L.; Guo, Y.; Zhang, H.; Wang, Y.; Wang, Z.; Liu, H.; Wang, Y. Reduced Graphene Oxide as a Conductive Additive and Structural Buffer for High-Performance Lithium-Ion Battery Electrodes. Materials 2020, 13, 218. [Google Scholar] [CrossRef]
Figure 1. SEM images of the TiO2/rGO (A) and Fe2O3/rGO (B) thin films.
Energies 18 03490 g001
Figure 2. XRD (to the left) and Raman spectra (to the right) of the Fe2O3/rGO, TiO2/rGO and rGO thin films after thermal reduction.
Energies 18 03490 g002
Figure 3. Galvanostatic profiles of the Fe2O3/rGO, TiO2/rGO, and rGO electrode materials.
Energies 18 03490 g003
Figure 4. Capacity as a function of discharge cycles at the discharge current of 1C. Voltage window 0.01–3.0 V (vs. Li/Li+).
Energies 18 03490 g004
Figure 5. CV curves of the Fe2O3/rGO and TiO2/rGO electrodes. Sweep rate of 1 mVs−1 and voltage range of 0.05–3 V. Electrolyte 1 M LiPF6 in EC:DMC (1:1 v/v).
Energies 18 03490 g005
Figure 6. Electrochemical impedance spectroscopy of the Fe2O3 and TiO2 electrodes and equivalent circuit. Electrolyte 1 M LiPF6 in EC:DMC (1:1 v/v).
Energies 18 03490 g006
Figure 7. Scanning electron microscopy images of (A) FT11, (B) FT21, (C) FT31 nanocomposite thin films and (D) graphene oxide flakes.
Energies 18 03490 g007
Figure 8. Comparison of the X-ray diffractogram intensities of the FT11, FT21, and FT31 thin films.
Energies 18 03490 g008
Figure 9. Comparison of the XPS intensities of the FT11, FT21, and FT31 nanocomposites.
Energies 18 03490 g009
Figure 10. Galvanostatic charge–discharge curves of the FT11, FT21 and FT31 nanocomposite electrodes at current 0.5C, 1C, and 2C.
Energies 18 03490 g010
Figure 11. Capacity of the FT11, FT21, and FT31 nanocomposite electrodes as a function of the number of discharge cycles at current 1C. Voltage window of 0.01–3.0 V (vs. Li/Li+).
Energies 18 03490 g011
Figure 12. Cyclic voltammograms of the FT11, FT21, and FT31 nanocomposite electrodes at a voltage step rate 1 mVs−1. Characteristic current peaks denoted as F—Fe2O3 and T—TiO2 materials.
Energies 18 03490 g012
Figure 13. Experimental and calculated EIS spectra of the FT11 and FT21 electrodes at U = 0.5 V. Electrolyte 1 M LiPF6 in EC:DMC (1:1 v/v).
Energies 18 03490 g013
Table 1. Summary of selected anode materials for lithium-ion batteries.
Anode MaterialTheoretical Capacity (mAh/g)AdvantagesDisadvantages
Graphite [20]372Commercial standard; high cycle life; stable SEI formationLow capacity; limited rate performance
Silicon (Si) [21]4200Extremely high capacity; abundantSevere volume expansion (~300%); poor cycle stability
Fe2O3 [18]1007High capacity; environmentally friendly; low costLarge volume change; poor electronic conductivity
TiO2 (anatase) [22]335Safe; stable structure; fast Li+ kineticsLow capacity; needs nanostructuring
SnO2 [23]790High capacity; good conductivityVolume change; aggregation; unstable SEI
rGO [22]~500High surface area; good electrical conductivityNeeds combination with active material; restacking tendency
Fe2O3/TiO2/rGO [24]Estimated ~600–800Synergistic effects; improved conductivity and stabilityRequires careful optimization; complex interface
Table 2. Estimated values of the equivalent circuit parameters for the Fe2O3/rGO and TiO2/rGO electrodes based on the Nyquist plots.
SampleRs, (Ω)Rct, (Ω)CPE-T (F)CPE-PW (Ω·s−1/2)χ2
Fe2O3/rGO12383.0 × 10−50.85201.2 × 10−3
TiO2/rGO18152.0 × 10−50.85151.0 × 10−3
Table 3. Quantitative estimation of the elemental composition in the FT11, FT21, and FT31 nanocomposites obtained from the XRD, EDX, and XPS analyses.
Nanocomposite MaterialAverage Crystallite Size, nmChemical Element Content Determined by EDX, wt%Chemical Element Content Determined by XPS, wt%Quantities of Material Phases Calculated from XRD Data by the Rietveld Method, wt%
FeTiOFeTiOCFe2O3
(maghemite)
TiO2
(anatase)
TiO2
(rutile)
FT1137 ± 26742962306255 ± 0.0135 ± 0.0110 ± 0.01
FT2124 ± 27252371233379 ± 0.0214 ± 0.017 ± 0.02
FT3132 ± 27671780132588 ± 0.029 ± 0.013 ± 0.01
Table 4. Comparison of the electrochemical performance of transition metal oxide composites.
SynthesisRate CapabilityCycle Performance
TiO2/Fe2O3/C [47]Thermal alloyingCharge capacity of 558 mAhg−1 at a discharge current of 0.5C (500 mAg−1)Charge capacity of 438 mAhg−1 after 400 charge/discharge cycles
TiO2/Fe2O3/CNT [46]Hydrothermal synthesisCharge capacity of 487 mAhg−1 at a discharge current of 0.5C (500 mAg−1)Charge capacity of 436 mAhg−1 after 600 charge/discharge cycles
TiO2/Fe2O3/CNF [46]Chemical synthesisCharge capacity of 592 mAhg−1 at a discharge current of 500 mAg−1Charge capacity of 576 mAhg−1 after 200 charge/discharge cycles
TiO2/Fe2O3/C [19]Atomic layer depositionCharge capacity of 525 mAhg−1 at a discharge current of 400 mAg−1Charge capacity of 591 mAhg−1 after 200 charge/discharge cycles
TiO2/Fe2O3/rGO
[this work]
Electrophoretic depositionCharge capacity of 683 mAhg−1 at a discharge current of 0.5C (500 mAg−1)Charge capacity of 508 mAhg−1 after 300 charge/discharge cycles
Table 5. Lithium diffusion coefficients determined by CV and EIS.
Cyclic Voltammetry,
D, cm/s2
Electrochemical Impedance Spectroscopy,
D, cm2/s × 10−16
Fe2O3/rGO1.6 × 10−131
TiO2/rGO1 × 10−145
FT116 × 10−137
FT211.2 × 10−129
Disclaimer/Publisher’s Note: The statements, opinions and data contained in all publications are solely those of the individual author(s) and contributor(s) and not of MDPI and/or the editor(s). MDPI and/or the editor(s) disclaim responsibility for any injury to people or property resulting from any ideas, methods, instructions or products referred to in the content.

