
Evaluation of the Reliability of Thermogravimetric Indices for Predicting Coal Performance in Utility Systems


Abstract
1. Introduction
2. Mini-Review of TG-Based Indices

| Stage of Combustion | Index | Source |
|---|---|---|
| Devolatilization | D1 | [20,33,34] |
| D2 | [21,22,33,35,36] | |
| D3 | [23,24] | |
| Ignition | C1 | [25,26,31,37,38,39,40,41] |
| C2 | [21,22,26,27,28,29,31,35,37,39,40,42,43,44,45,46,47,48,49,50,51,52,53,54,55,56,57,58,59,60,61] | |
| C3 | [21,22,24,30,40,47,53,59,60,62,63,64] | |
| C4 | [25,32,40,60] | |
| C5 | [31,36] | |
| C6 | [31,40,59,60] | |
| Burnout | B1 | [28,29,31,38,46] |
| B2 | [21,22,24,40,53,59,60,63,64] | |
| B3 | [25] | |
| B4 | [32] |
3. Experimental Section
3.1. Methods
3.1.1. General Outline of the Adopted Methodology
3.1.2. Assessment Method of TGA-Based Indices
3.1.3. Statistical Approach
3.2. Materials and Equipment
3.2.1. Samples
3.2.2. Proximate/Ultimate Analysis and Heating Value Determination
3.2.3. TGA
3.2.4. DTF
3.2.5. PI
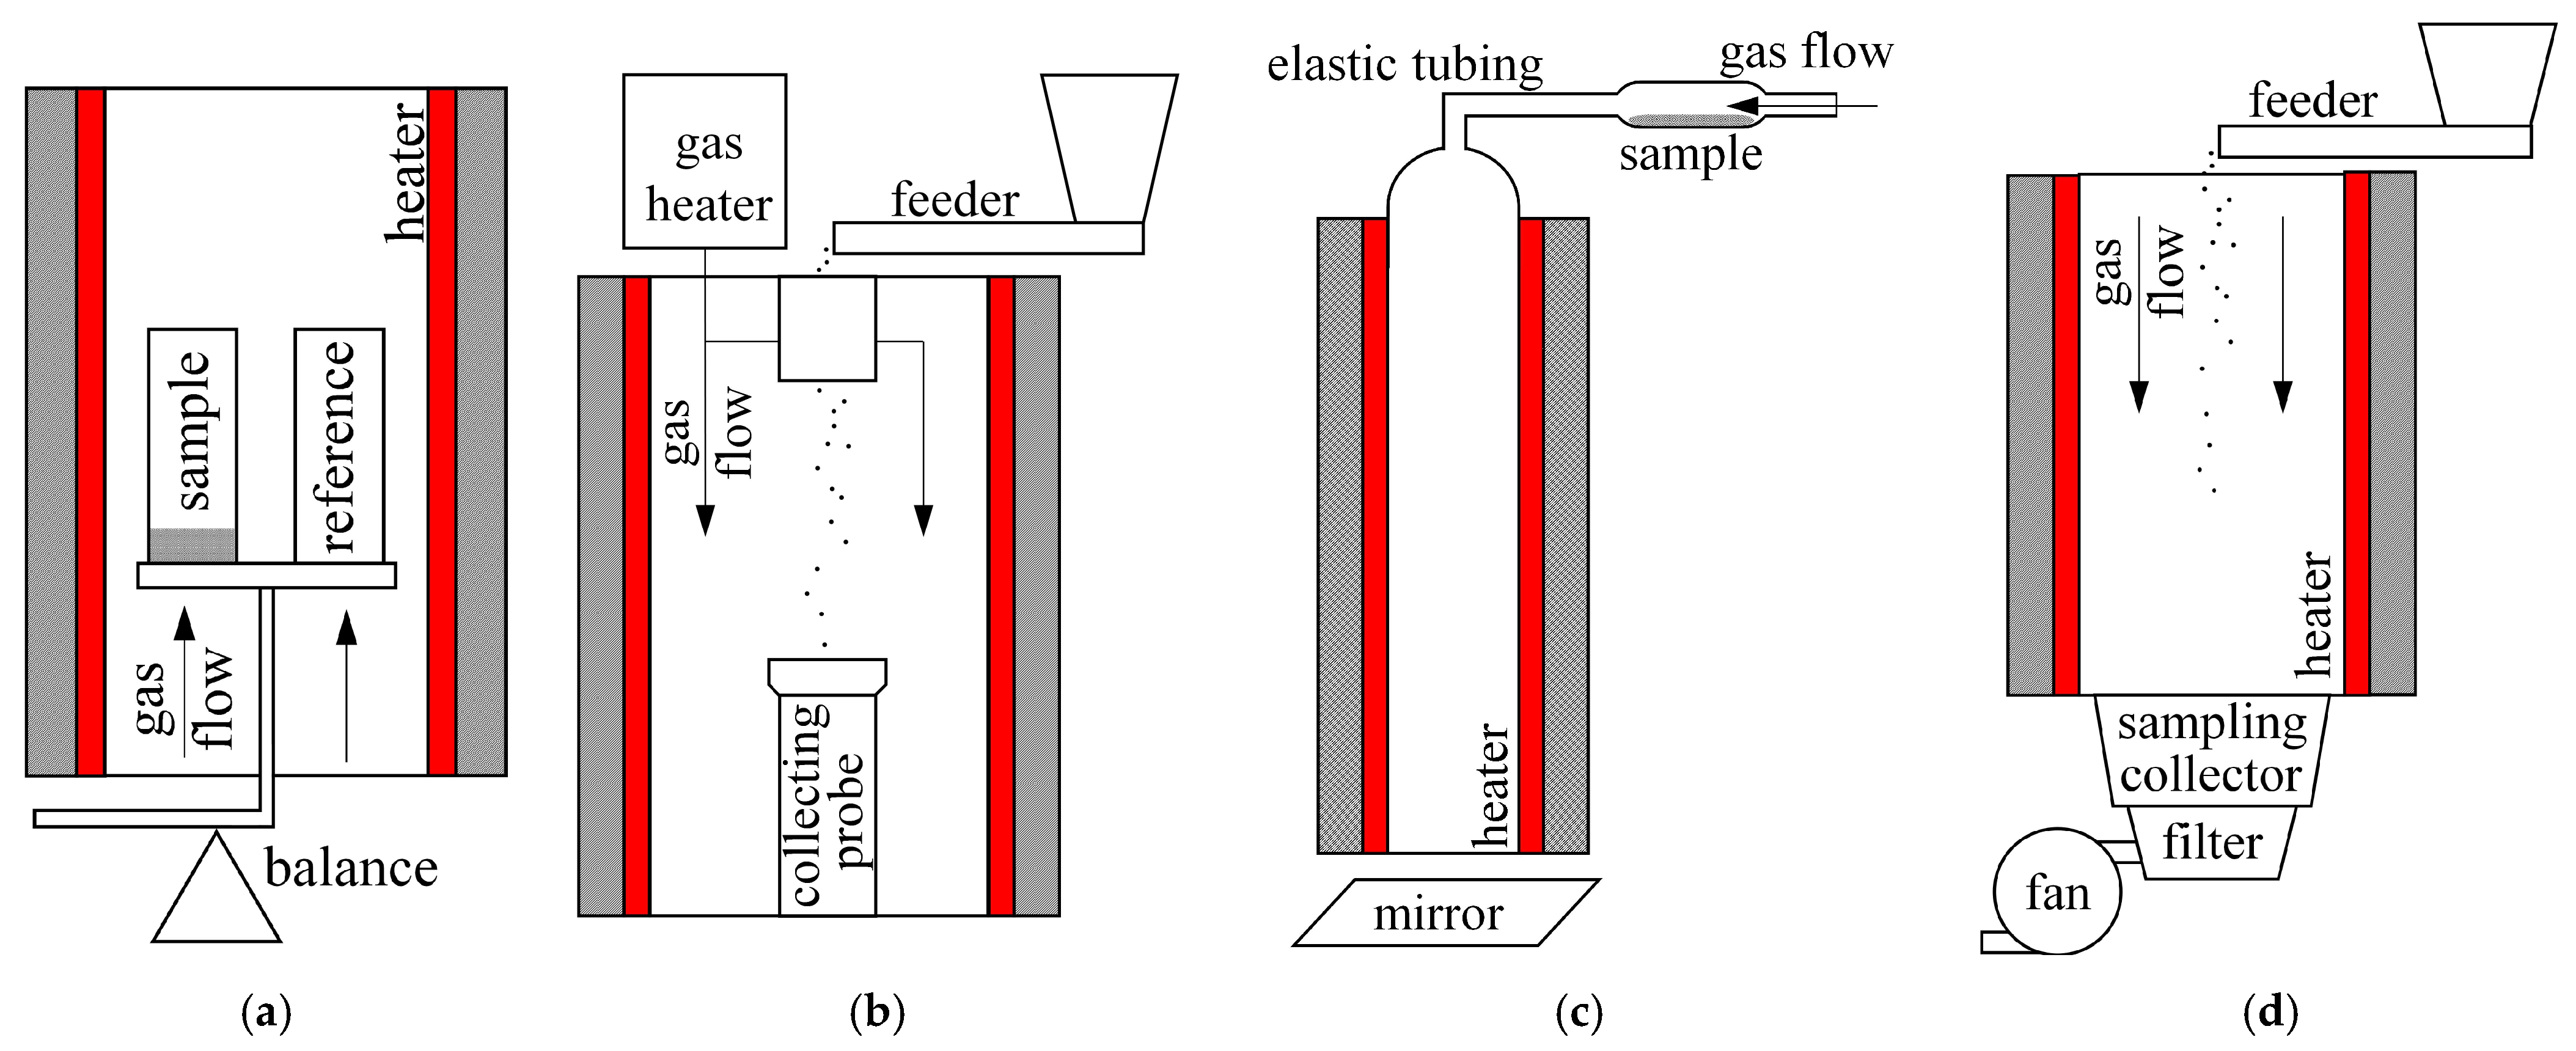
3.2.6. EFR
4. Results and Discussion
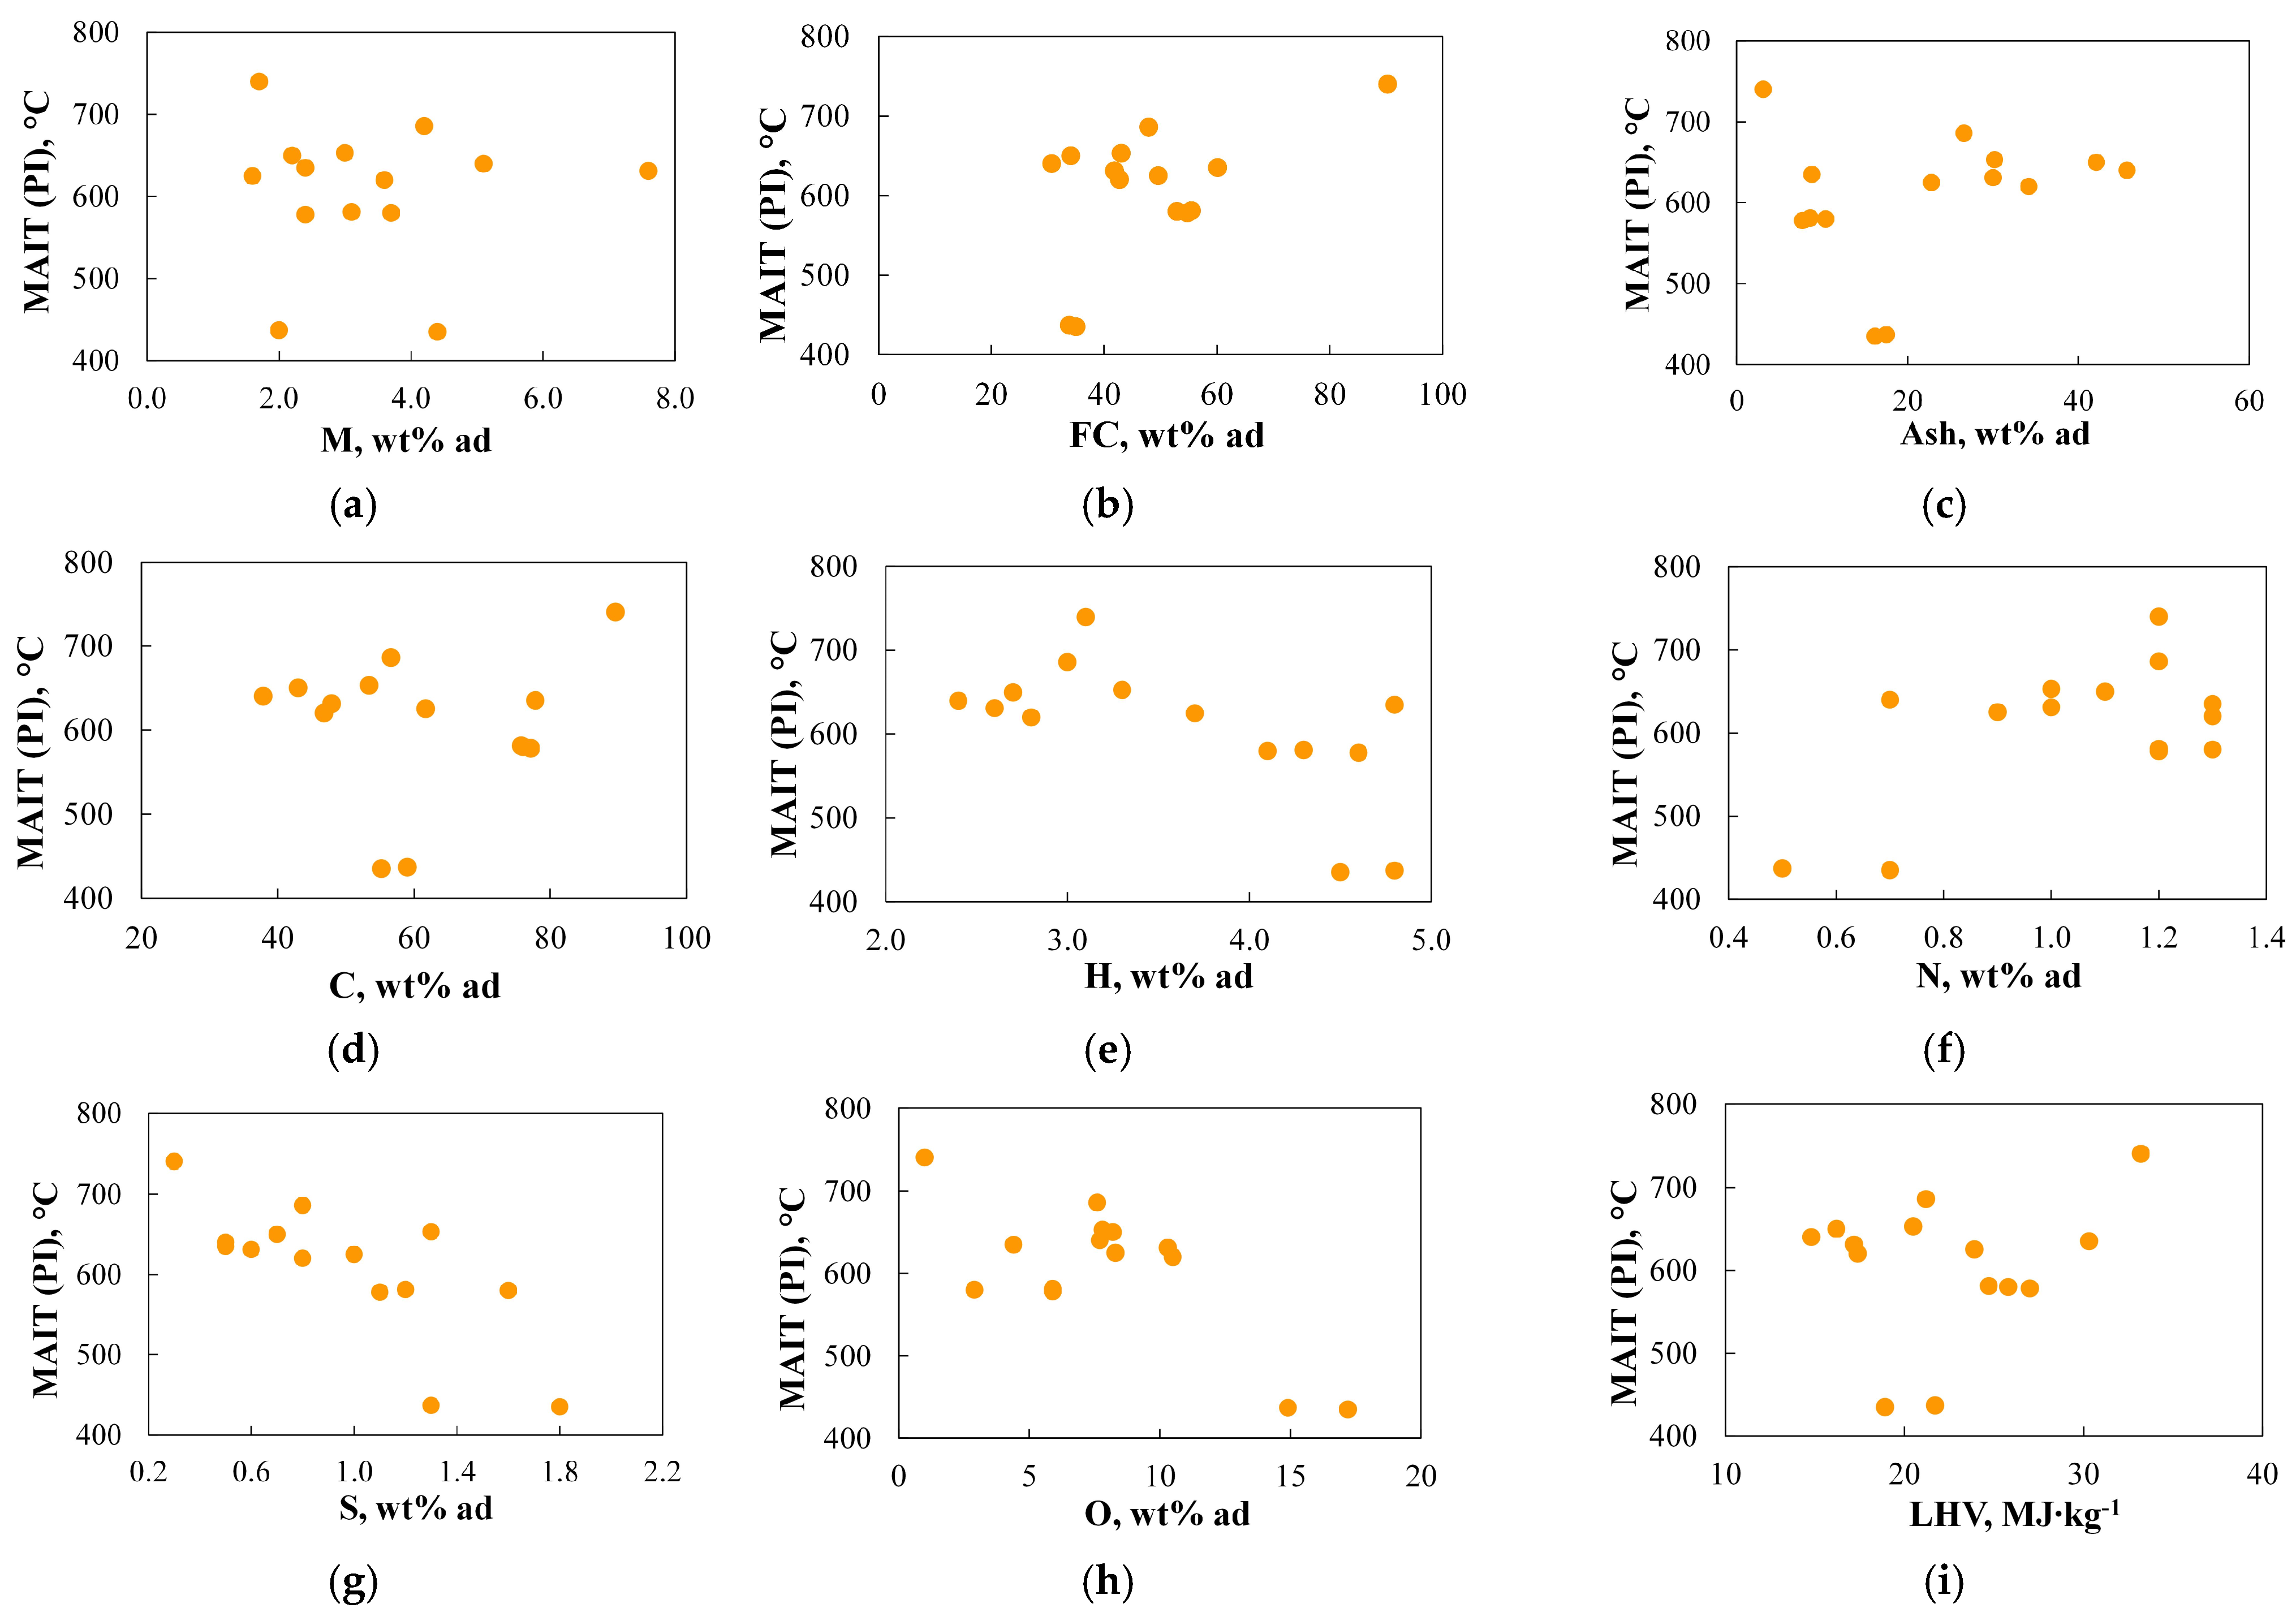
4.1. Physicochemical Properties of Fuels
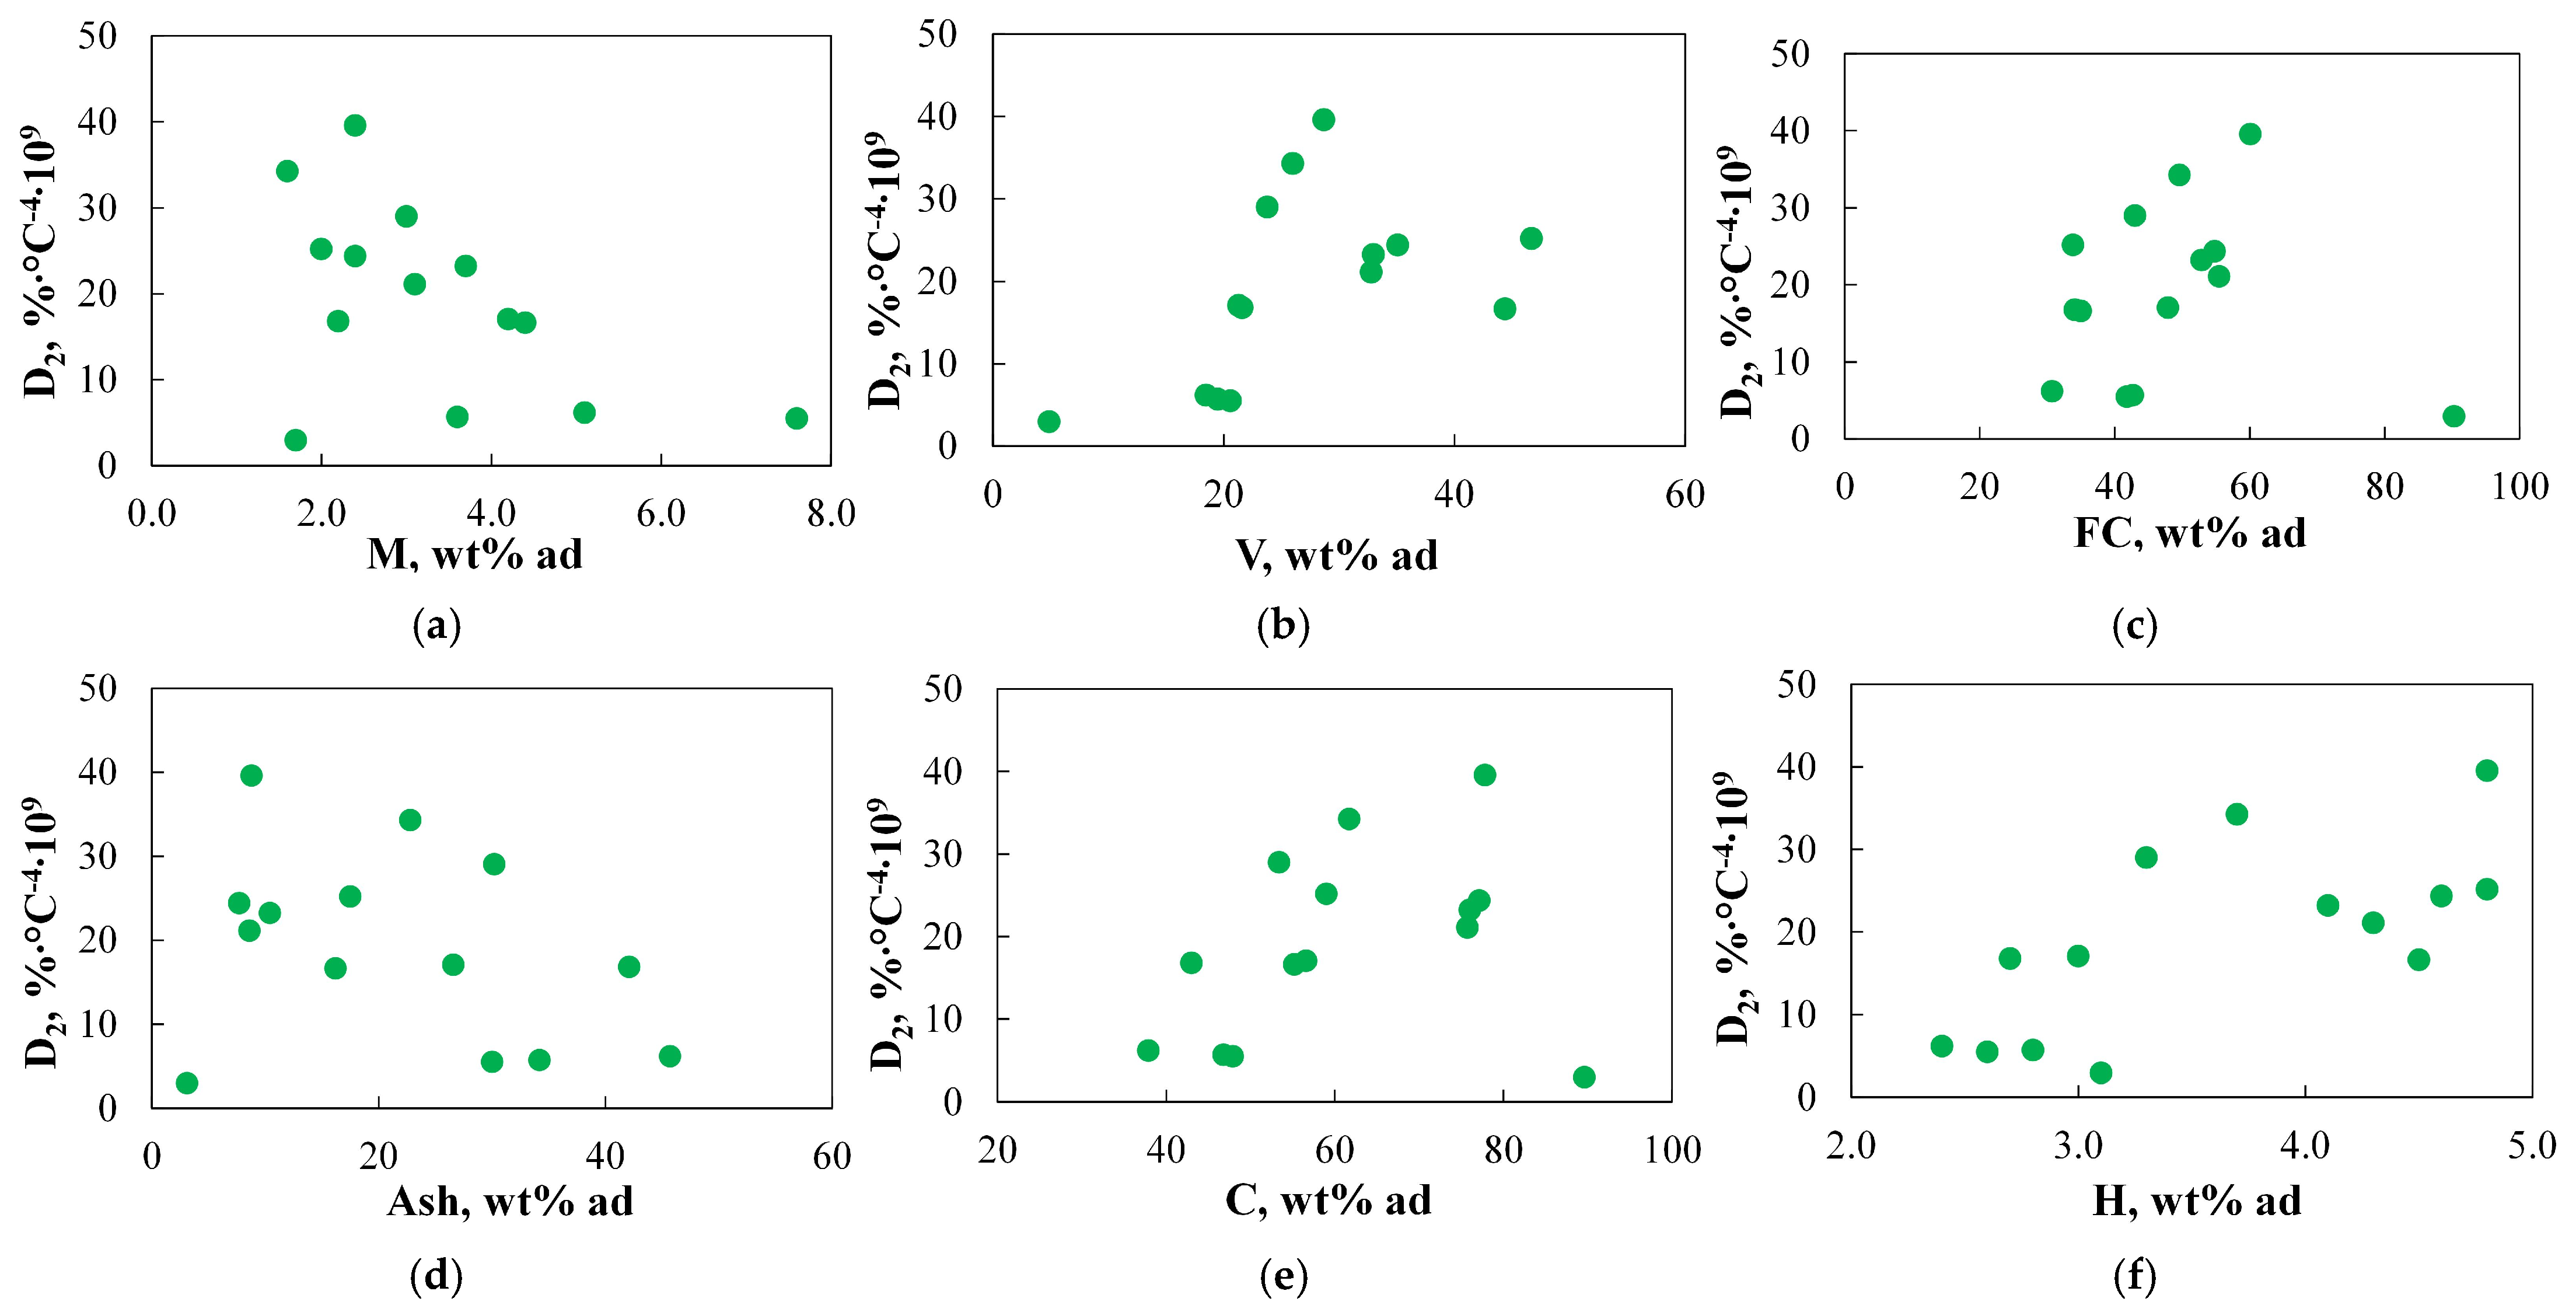
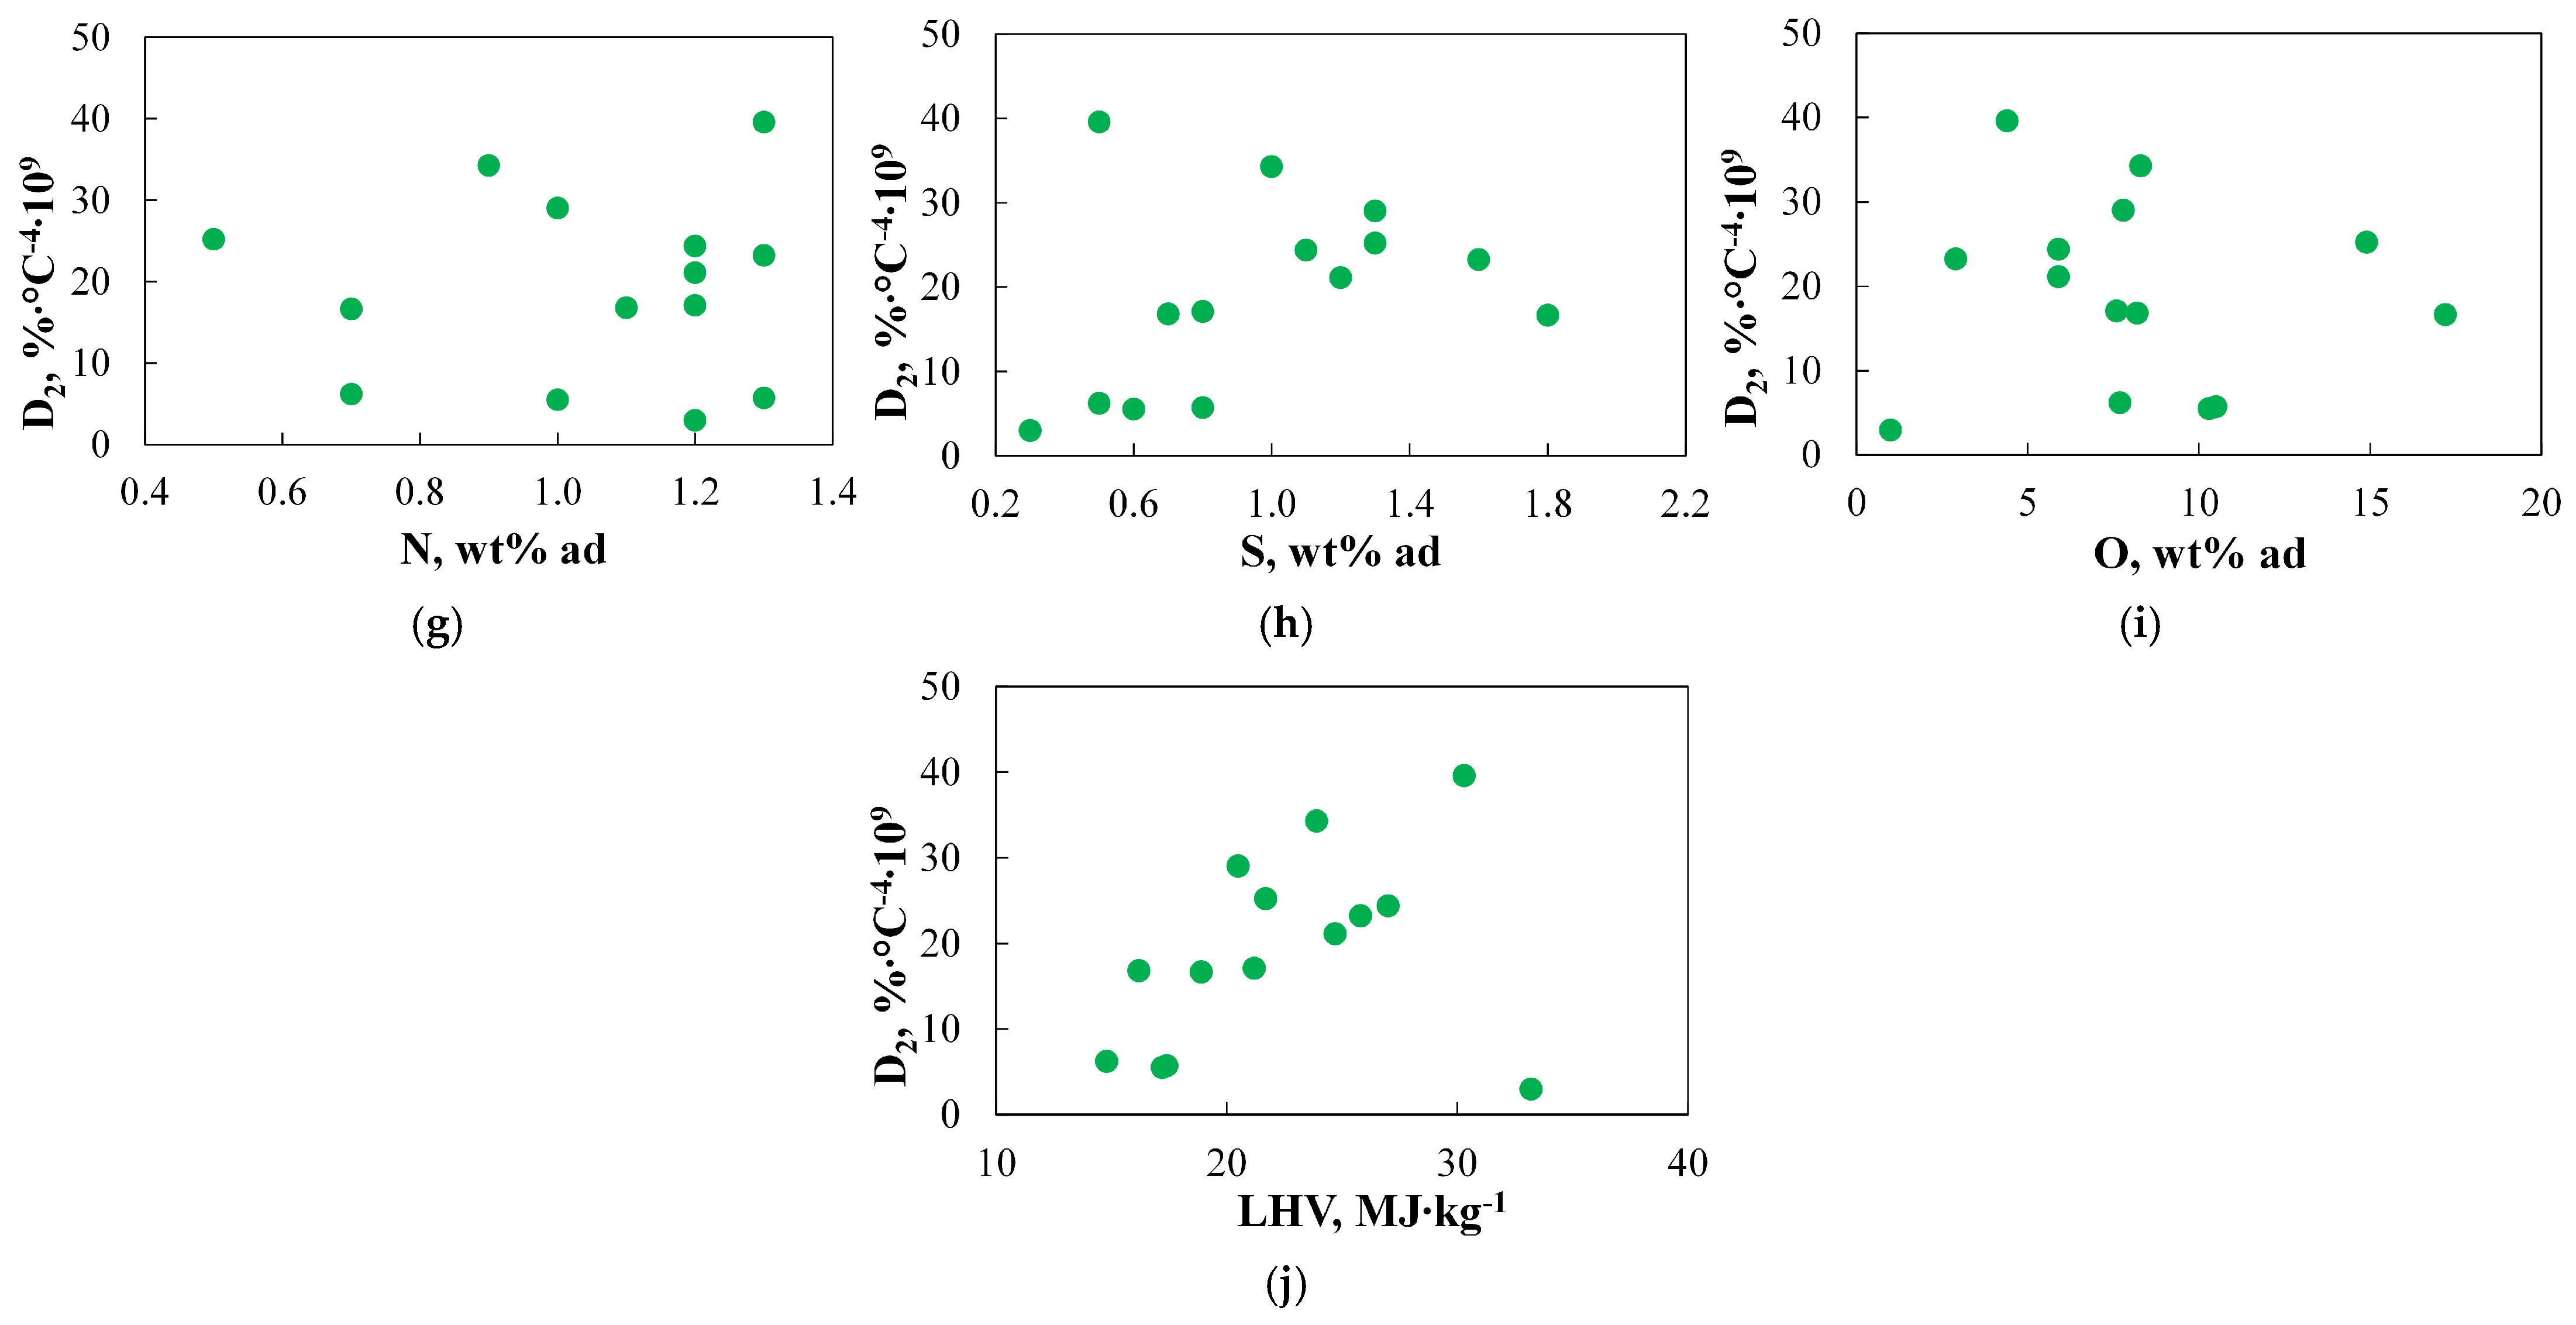
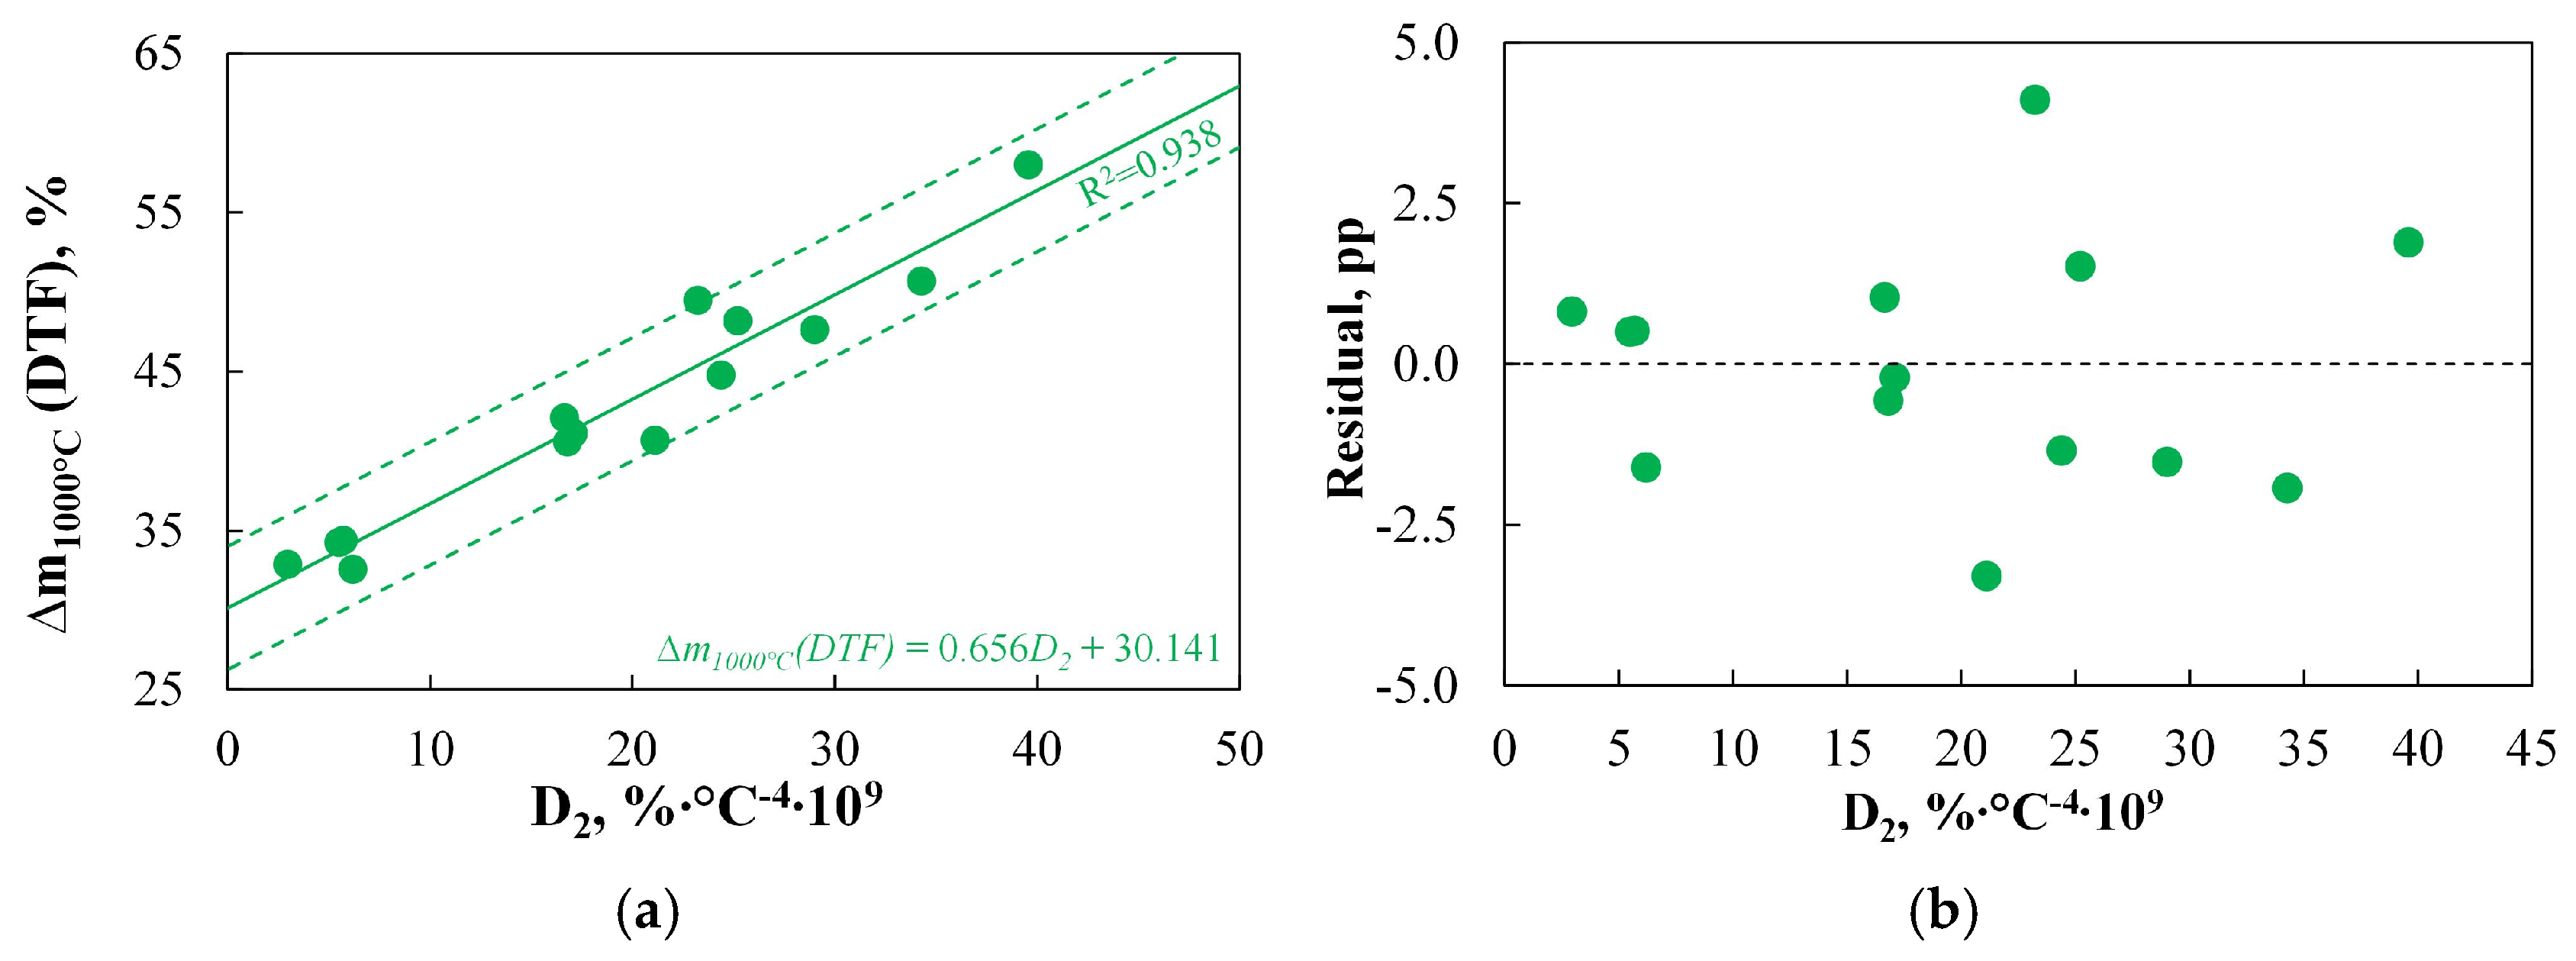
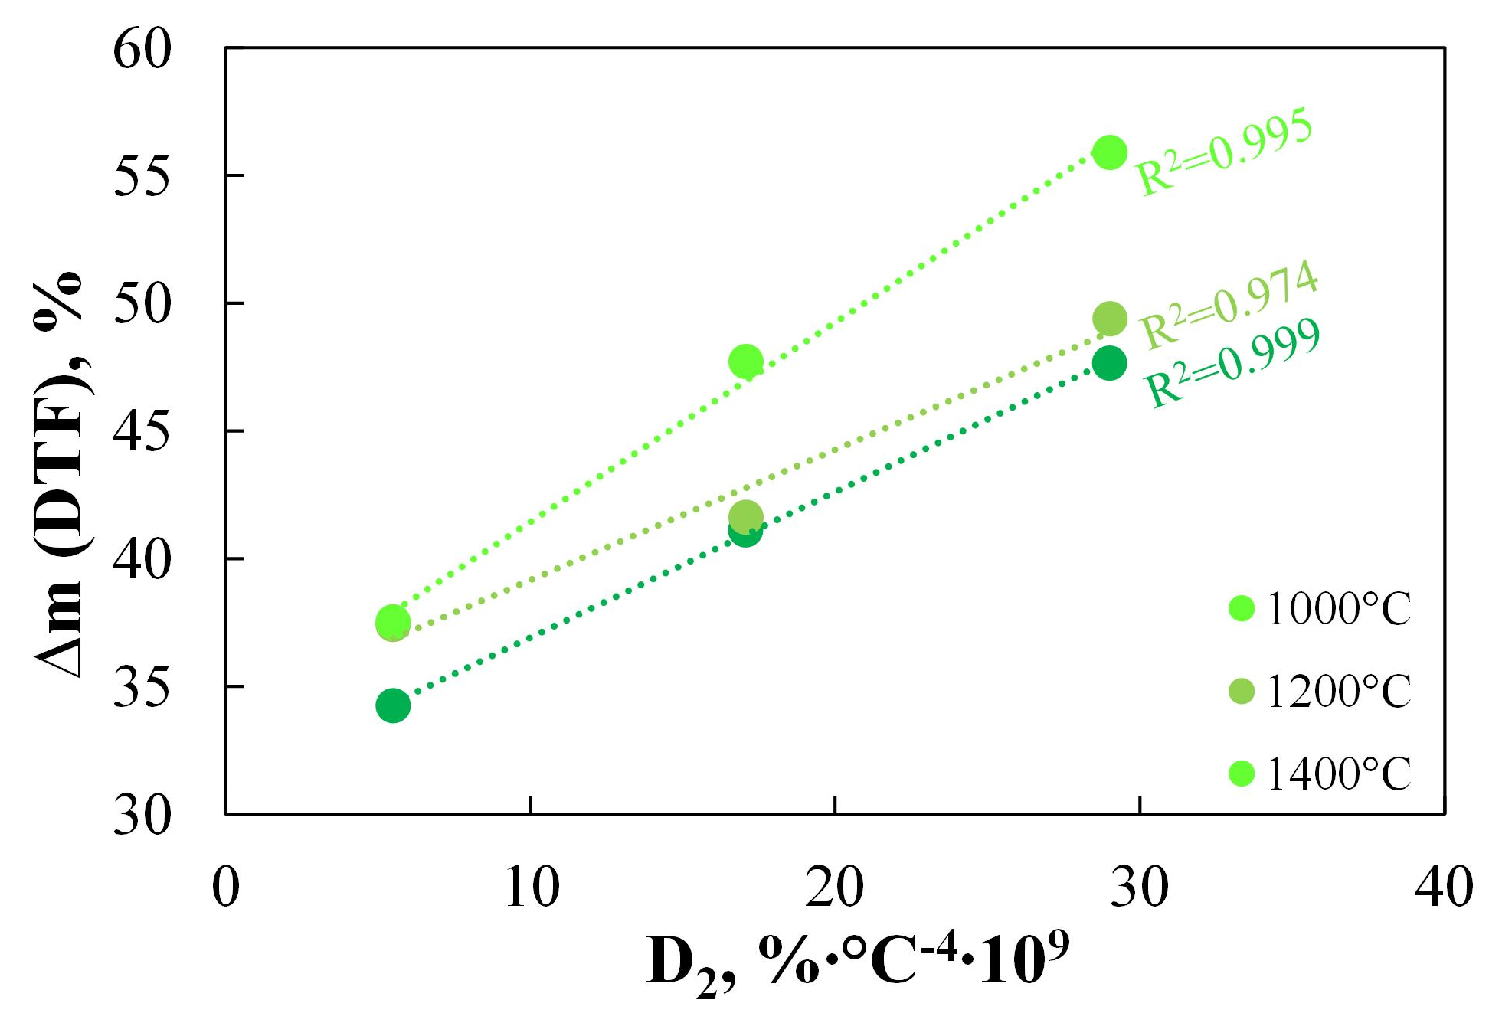
4.2. TGA-Based Indices for Devolatilization
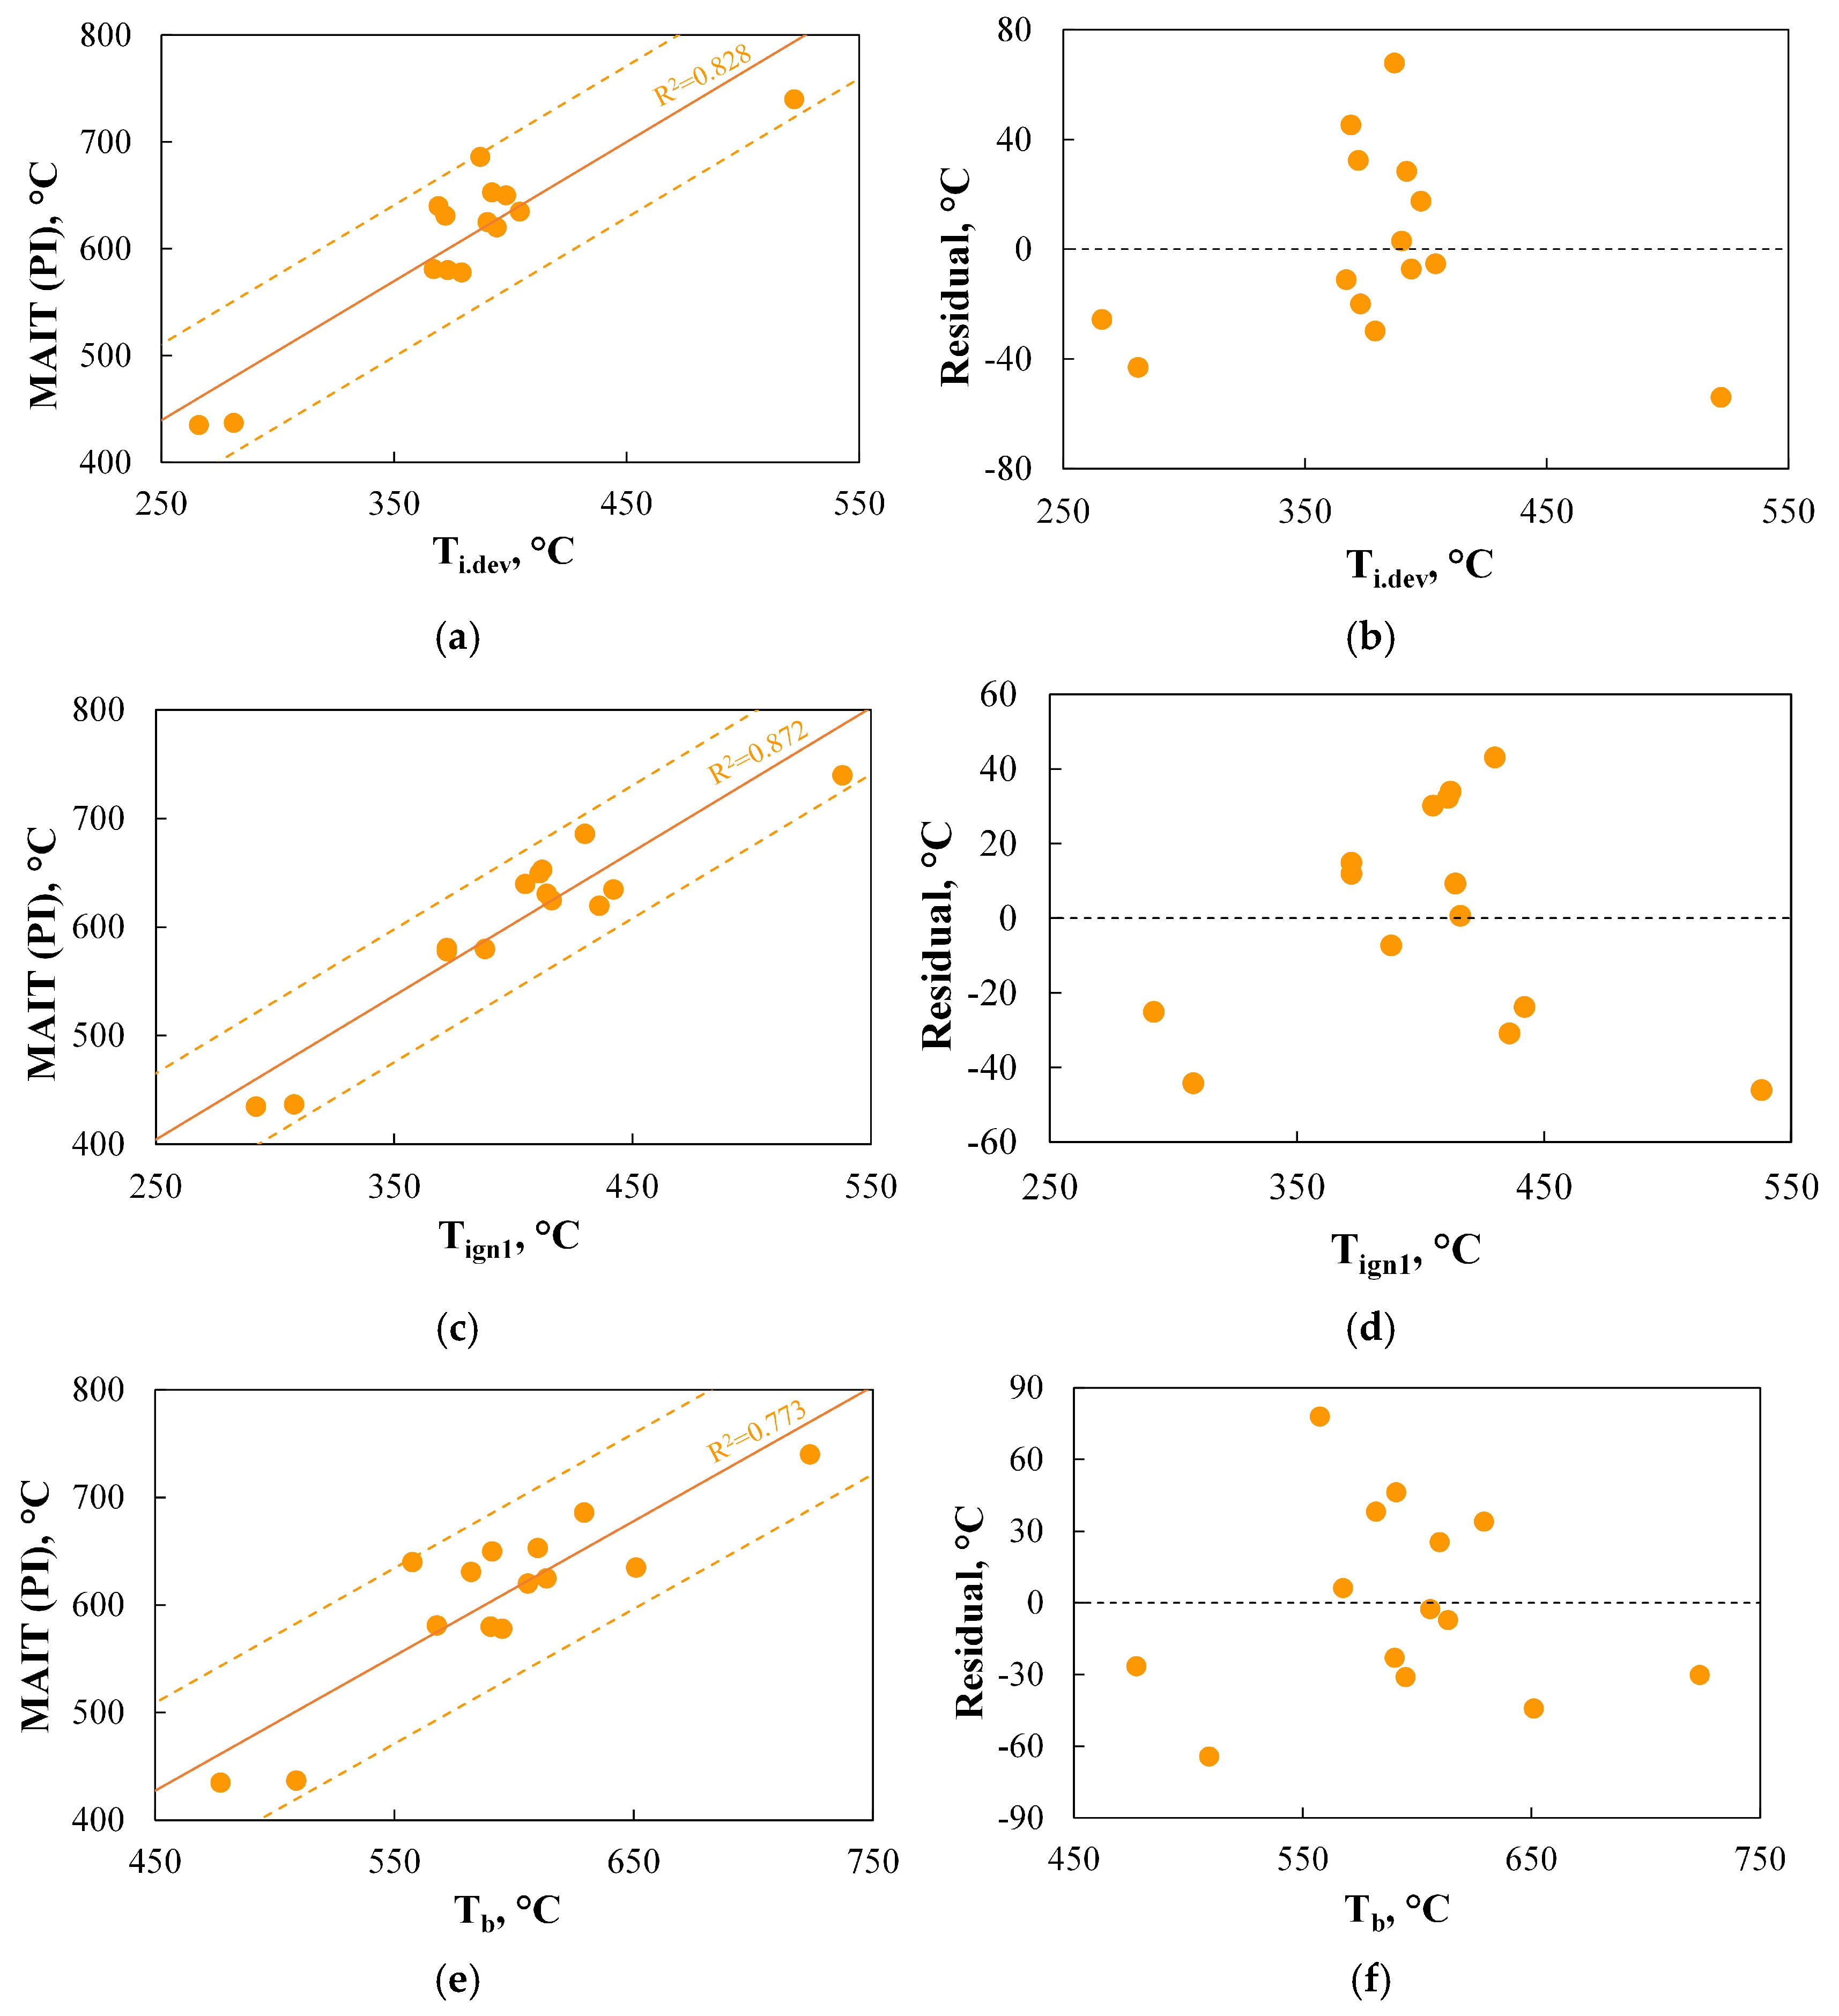
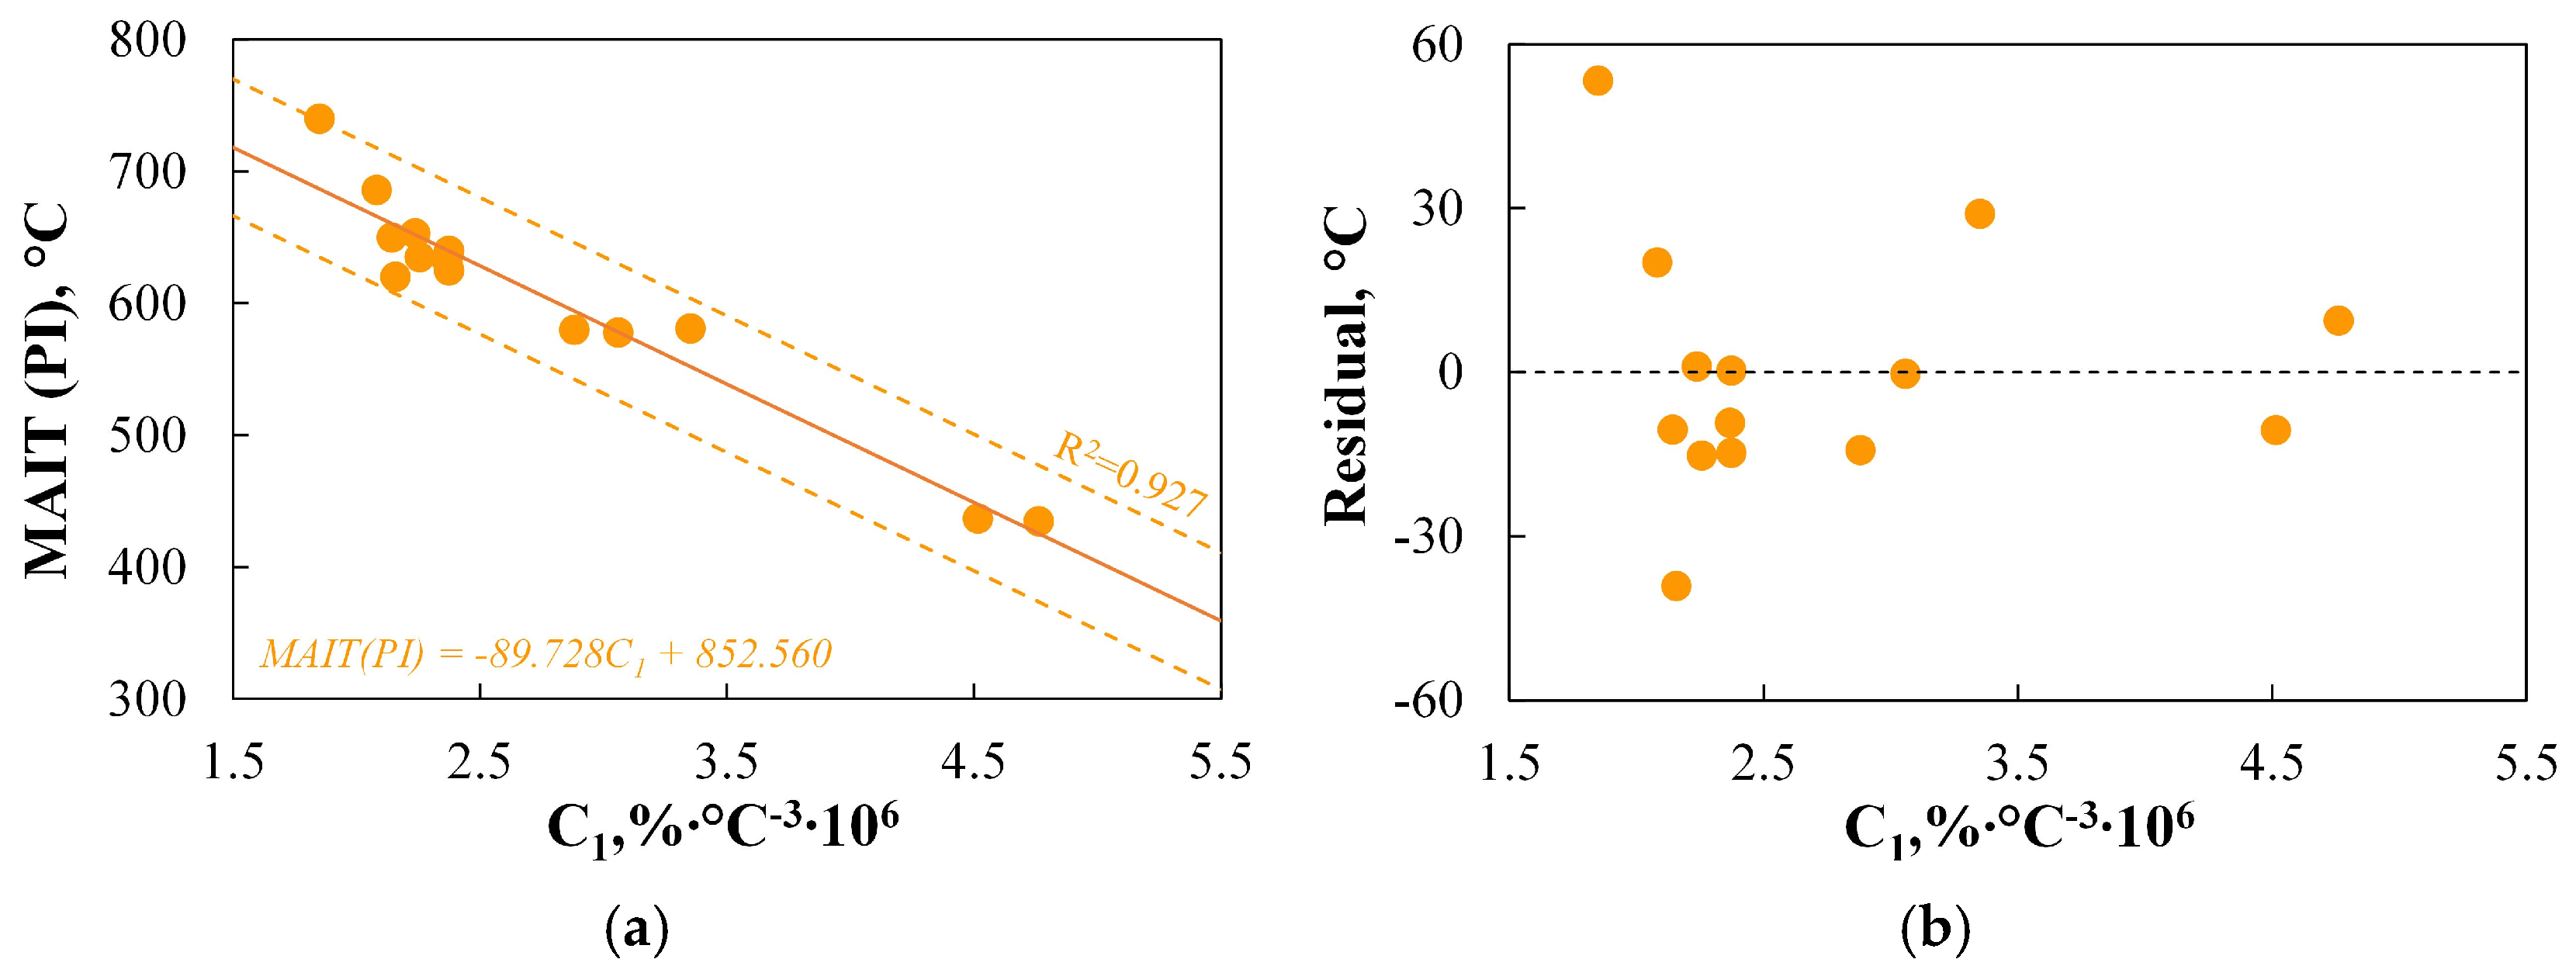
4.3. TGA-Based Indices for Ignition
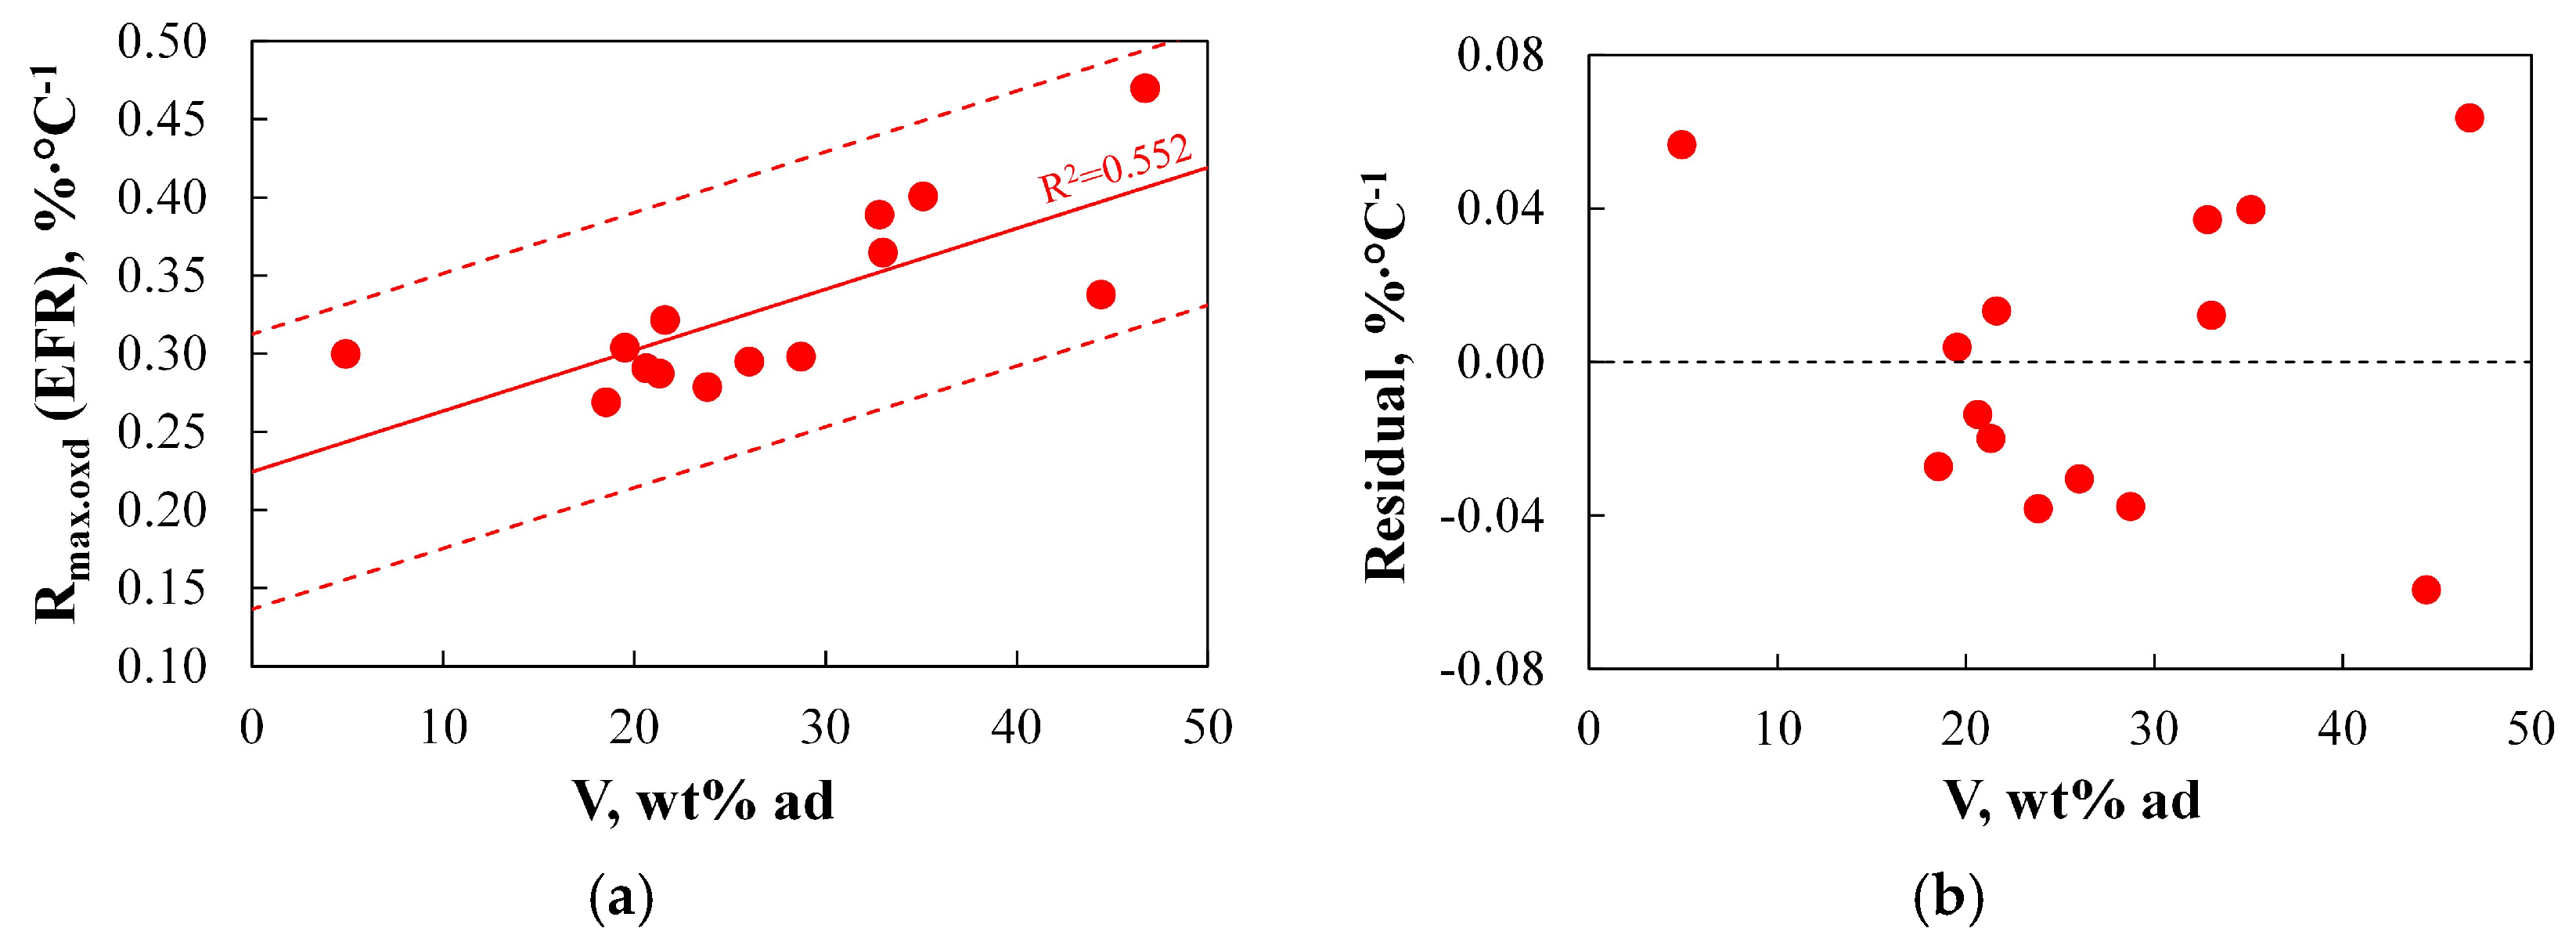
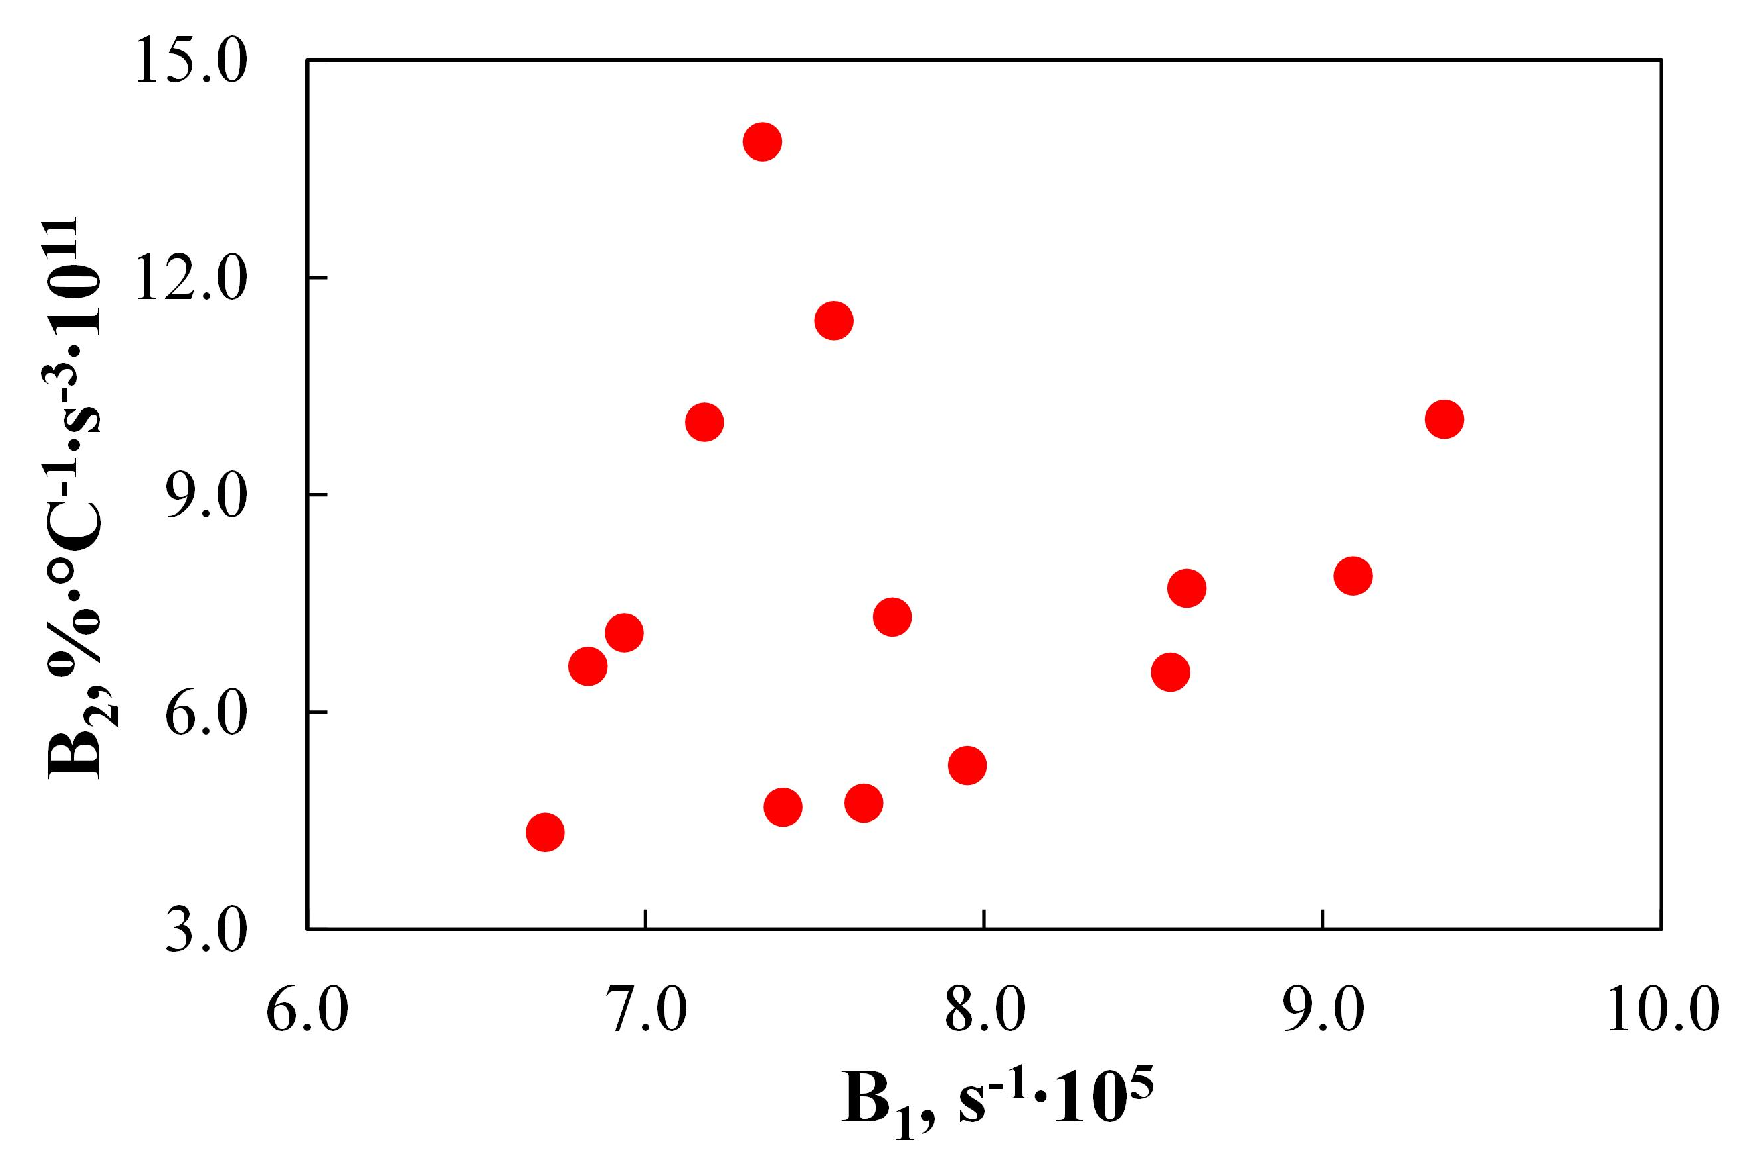
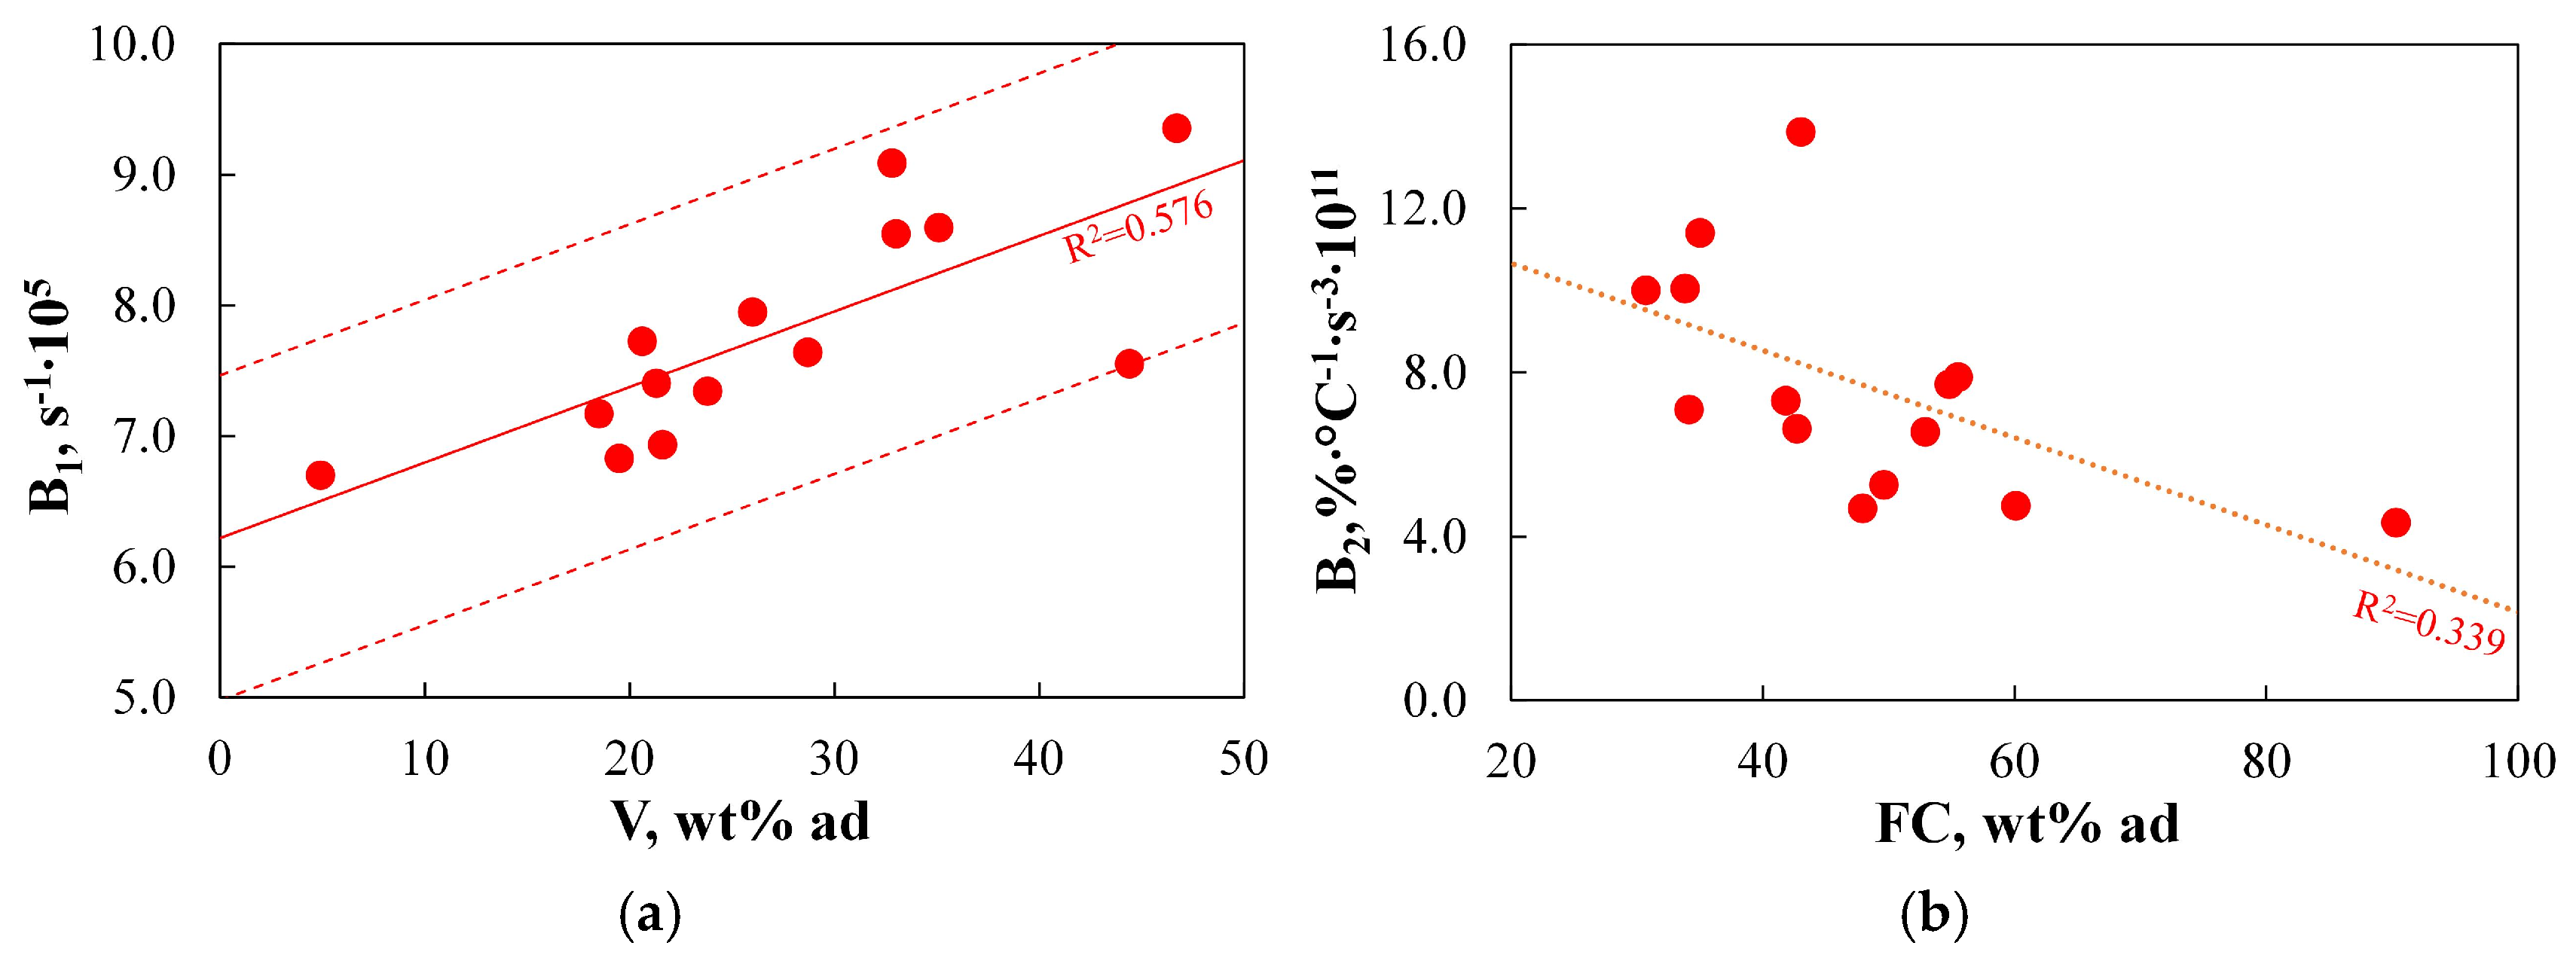
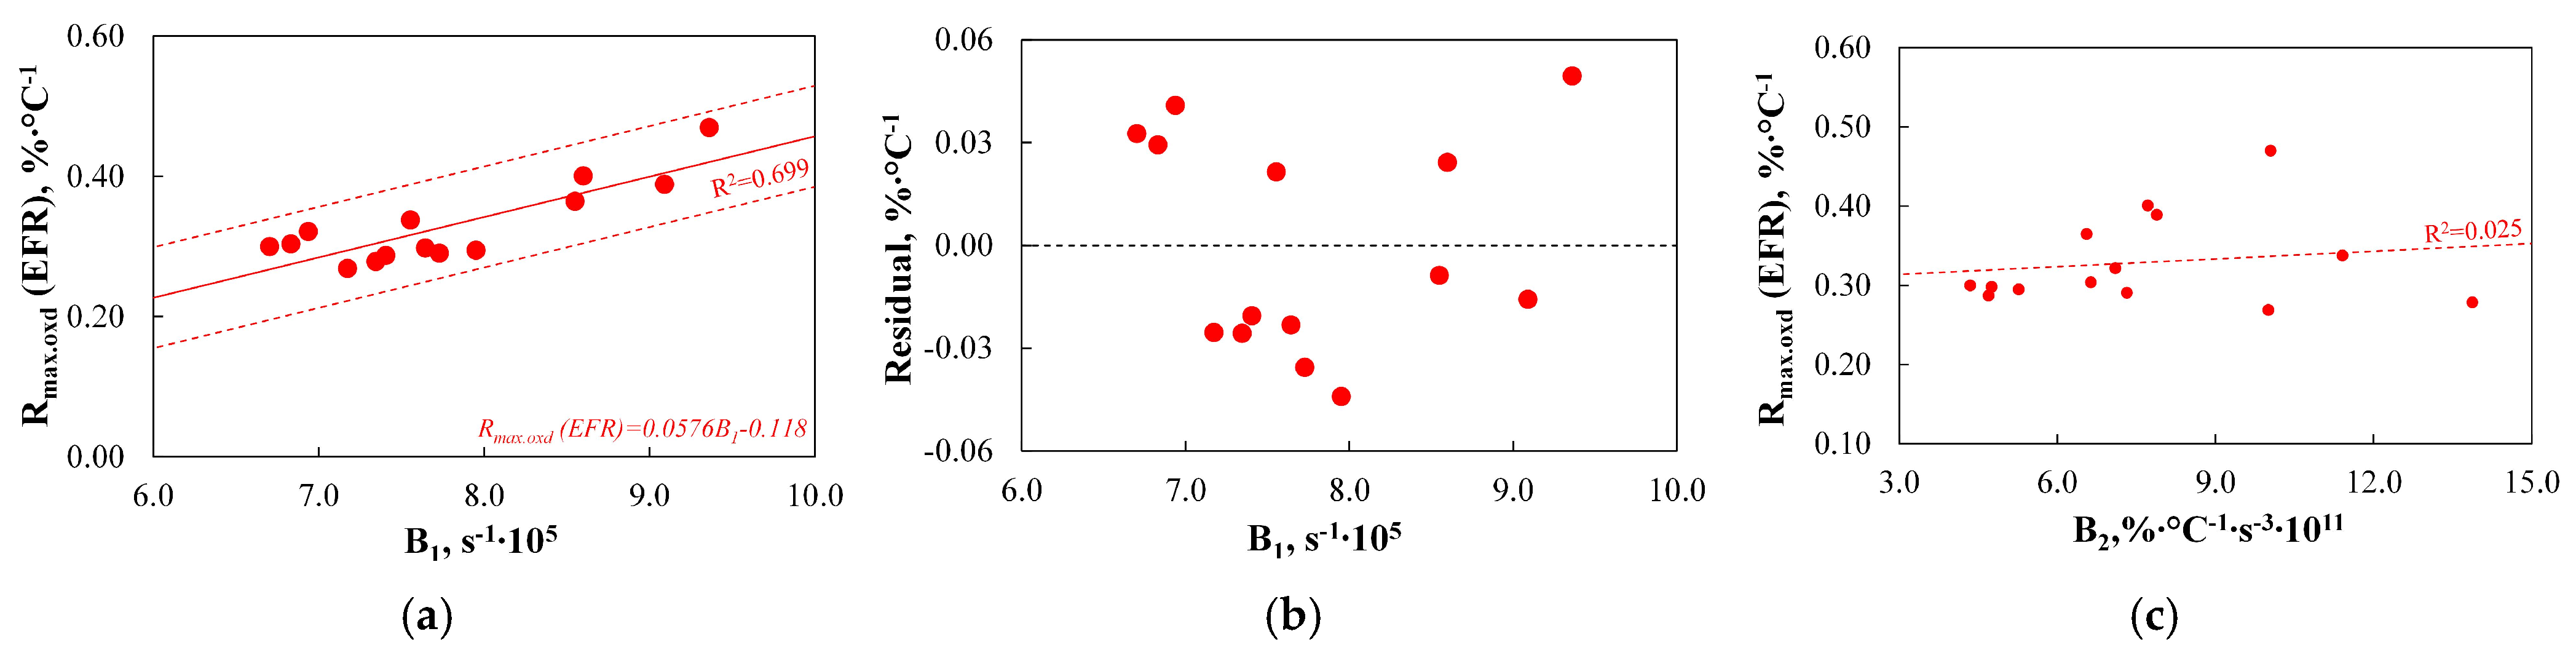
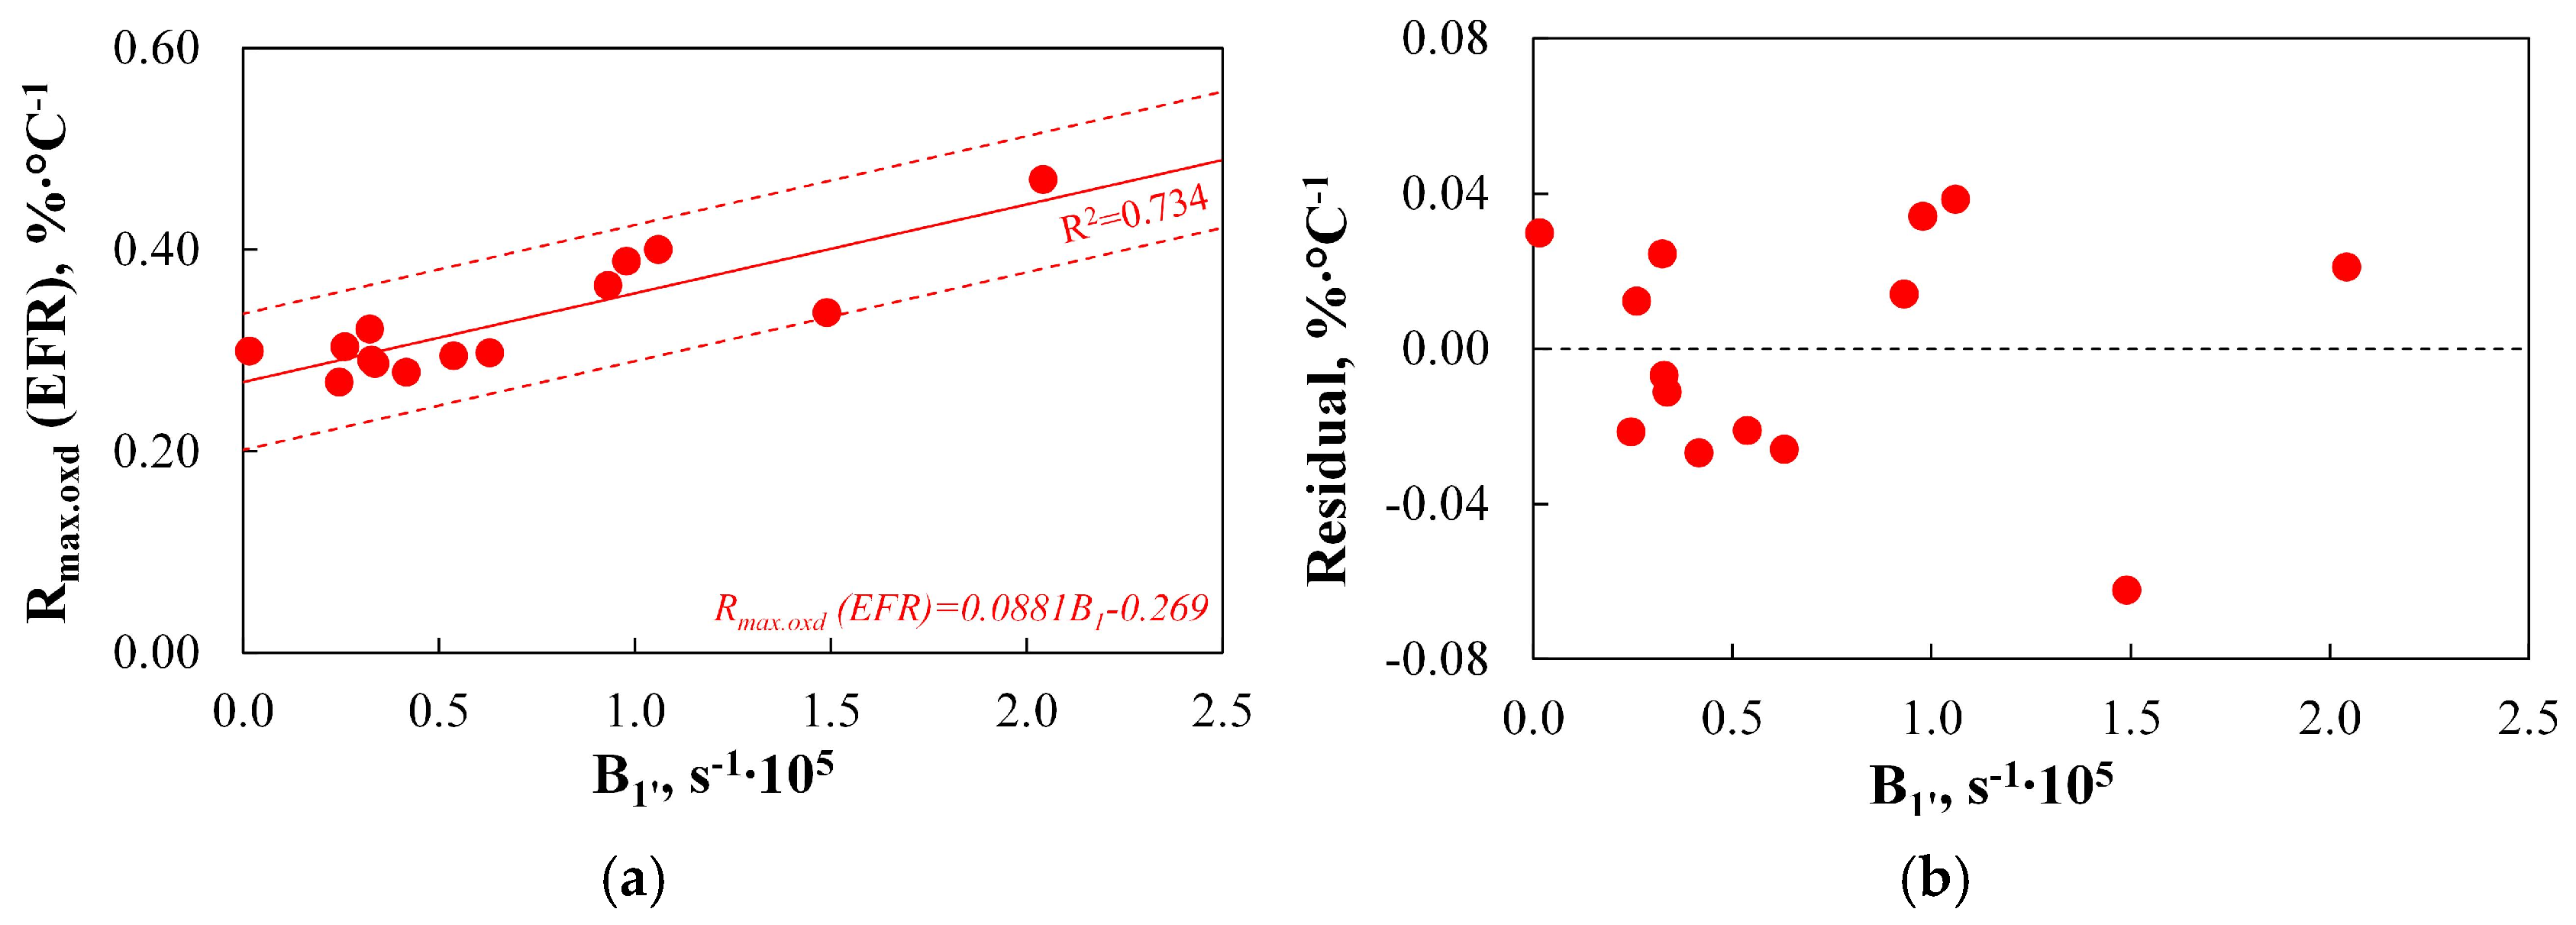
4.4. TGA-Based Indices for Burnout
5. Conclusions
Funding
Data Availability Statement
Conflicts of Interest
Abbreviations
| B1 | Burnout Characteristic Index, s−1 |
| B1′ | Modified Burnout Characteristic Index, s−1 |
| B2 | Burnout Index, %∙°C−1∙s−3 |
| B3 | Comprehensive Burnout Judging Index, %∙°C−3. |
| B4 | Burnout Index, - |
| C | Elemental carbon content |
| C1 | Flammability Index, %∙°C−3 |
| C2 | Comprehensive Combustion Index, %2∙°C−5. |
| C3 | Ignition Index, %∙°C−1∙s−2 |
| C4 | Combustion Stability Index, %∙°C−3 |
| C5 | Ignition Index, %∙°C−3 |
| C6 | Combustion Stability Index, %−1∙°C3 |
| CFB | Circulating Fluidized Bed Boilers |
| D1 | Comprehensive Devolatilization Index, %2∙°C−5 |
| D2 | Volatile Matter Release Index, %∙°C−4 |
| D3 | Volatile Matter Release Index, %∙°C−3 |
| DTF | Drop Tube Furnace |
| EFR | Entrained Flow Reactor |
| f1 | Ratio of the particle mass loss to the combustible material at the ignition point, - |
| f2 | Share equal to “1- f1”, - |
| FC | Fixed carbon content |
| FR | Fuel ratio (=FC/V) |
| H | Elemental hydrogen content |
| HHV | Higher Heating Value |
| k | Number of coefficients estimated by the regression (equal to 2) |
| LHV | Lower Heating Value |
| M | Moisture content |
| MAIT(PI) | Experimental data obtained using PI |
| n | Total sample size |
| N | Elemental nitrogen content |
| O | Elemental oxygen content |
| PC | Pulverized Coal-fired Boilers |
| PI | Pulse Ignition |
| R-squared coefficient of determination | |
| Ra.dev | Average reactivity during devolatilization, %∙°C−1 |
| Ra.oxd | Average reactivity, %∙°C−1 |
| Rmax.dev | Maximum reactivity during devolatilization, %∙°C−1 |
| Rmax.oxd | Maximum reactivity during oxidation, %∙°C−1 |
| Rmax.oxd (EFR) | Experimental data obtained using EFR |
| S | Elemental sulphur content |
| SER | Precision of the model’s predictions |
| tb.oxd | Burnout time, s |
| Tb.oxd | Burnout temperature, °C |
| TGA | Thermogravimetric Analysis |
| Ti.dev | Initial temperature of devolatilization, °C |
| tign | Ignition time at ignition temperature, s |
| Tign | Ignition temperature, °C |
| Tmax.dev | Temperature of maximum devolatilization rate, °C |
| tmax.oxd | Time which corresponds to the maximum combustion rate, s |
| Tmax.oxd | Temperature of maximum oxidation rate, °C |
| V | Volatiles content |
| Mean of the actual x values | |
| xᵢ | Actual x value |
| Mean of the observed values | |
| yi | Observed values |
| Predicted values from the regression model | |
| ∆T1/2.dev | Temperature range at a half value of Rmax.dev, °C |
| ∆t1/2.oxd | Time range at a half value of Rmax.oxd, s |
| ∆T1/3.oxd | Temperature range at a one-third value of Rmax.dev, °C |
| ∆Texo | Width of the exothermic peak, - |
| ∆m1000°C (DTF) | Experimental data obtained using DTF |
References
- Czajka, K.M. Proximate analysis of coal by micro-TG method. J. Anal. Appl. Pyrolysis 2018, 133, 82–90. [Google Scholar] [CrossRef]
- ASTM E1131-20; Standard Test Method for Compositional Analysis by Thermogravimetry. ASTM International: West Conshohocken, PA, USA, 2020. Available online: https://store.astm.org/e1131-20.html (accessed on 8 June 2025).
- ASTM E2021-15; Standard Test Method for Hot-Surface Ignition Temperature of Dust Layers. ASTM International: West Conshohocken, PA, USA, 2023. Available online: https://store.astm.org/e2021-15r23.html (accessed on 8 June 2025).
- Annamalai, K.; Ryan, W.; Dhanapalan, S. Interactive processes in gasification and combustion—Part III: Coal/char particle arrays, streams and clouds. Prog. Energy Combust. Sci. 1994, 20, 487–618. [Google Scholar] [CrossRef]
- Kuznetsov, A.V.; Pochtar, A.S.; Vinogradov, S.V.; Burdukov, A.P. Determination of the ignition temperature of mechanically activated carbon of various degrees of metamorphism and type of grinding. J. Phys. Conf. Ser. 2022, 2233, 012018. [Google Scholar] [CrossRef]
- Paredes, R.; Amez, I.; Leon, D.; Castells, B. Biomass minimum ignition temperature prediction through differential study of thermogravimetric analysis. J. Loss Prev. Process. Ind. 2024, 92, 105486. [Google Scholar] [CrossRef]
- Jankovic, B.; Manic, N.; Stojiljkovic, D.; Jovanovic, V. The assessment of spontaneous ignition potential of coals using TGA–DTG technique. Combust. Flame 2020, 211, 32–43. [Google Scholar] [CrossRef]
- Motiei, P.; Pecchi, M.; Adair, J.L.; Goldfarb, J.L.; O’Connor, J. Pairing combustion experiments and thermogravimetric analysis to uncover timescales controlling cellulose ignition and burnout in a Hencken burner. Combust. Flame 2023, 258, 113092. [Google Scholar] [CrossRef]
- Le Manquais, K.; Snape, C.; McRobbie, I.; Barker, J.; Pellegrini, V. Comparison of the Combustion Reactivity of TGA and Drop Tube Furnace Chars from a Bituminous Coal. Energy Fuels 2009, 23, 4269–4277. [Google Scholar] [CrossRef]
- Czajka, K.M.; Modlinski, N.; Kisiela-Czajka, A.M.; Naidoo, R.; Peta, S.; Nyangwa, B. Volatile matter release from coal at different heating rates –experimental study and kinetic modelling. J. Anal. Appl. Pyrolysis 2019, 139, 282–290. [Google Scholar] [CrossRef]
- Vyazovkin, S.; Burnham, A.K.; Favergeon, L.; Koga, N.; Moukhina, E.; Perez-Maqueda, L.A.; Sbirrazzouli, N. ICTAC Kinetics Committee recommendations for analysis of multi-step kinetic. Thermochim. Acta 2020, 698, 178597. [Google Scholar] [CrossRef]
- De Lannoye, K.; Trettin, C.; Belt, A.; Reinecke, E.A.; Goertz, R.; Arnold, L. The influence of experimental conditions on the mass loss for TGA in fire safety science. Fire Saf. J. 2024, 144, 104079. [Google Scholar] [CrossRef]
- Pronobis, M.; Mroczek, K.; Tymoszuk, M.; Ciukaj, S.; Wejkowski, R.; Janda, T.; Jagodzińska, K. Optimisation of coal fineness in pulverised-fuel boilers. Energy 2017, 139, 655–666. [Google Scholar] [CrossRef]
- Wang, Y.; Yu, J.; Liang, H.; Li, Q.; Hu, P.; Wang, D. Modelling on rapid prediction and cause diagnosis of boiler combustion efficiency. Energy 2024, 302, 131848. [Google Scholar] [CrossRef]
- Li, K.; Cheng, L.; Zhao, X.; Wang, B.; Zhang, Q.; Zhu, L.; Kang, Q.; Ma, Z. Experimental study of NH3 and coal Co-firing in a CFB and its nitrogen conversion. Energy 2024, 304, 132156. [Google Scholar] [CrossRef]
- Felix, C.B.; Chen, W.H.; Ubando, A.T.; Park, Y.K.; Lin, K.Y.A.; Pugazhendhi, A.; Nguyen, T.B.; Dong, C.D. A comprehensive review of thermogravimetric analysis in lignocellulosic and algal biomass gasification. J. Chem. Eng. 2022, 445, 136730. [Google Scholar] [CrossRef]
- Khaldi, N.; Chouari, Y.; Mhiri, H.; Bornout, P. CFD investigation on the flow and combustion in a 300 MWe tangentially fired pulverized-coal furnace. Heat Mass Transf. 2016, 52, 1881–1890. [Google Scholar] [CrossRef]
- Glushkov, D.; Paushkina, K.; Vershinina, K.; Vysokomornaya, O. Slagging characteristics of a steam boiler furnace with flare combustion of solid fuel when switching to composite slurry fuel. Appl. Sci. 2023, 13, 434. [Google Scholar] [CrossRef]
- Zhou, B.; Yang, S.; Wang, C.; Hu, X.; Song, W.; Cai, J.; Xu, Q.; Sang, N. The characterization of free radical reaction in coal low-temperature oxidation with different oxygen concentration. Fuel 2020, 262, 116524. [Google Scholar] [CrossRef]
- Ma, J.; Luo, H.; Liu, Z.; Li, D.; Gai, C.; Jiao, W. Pyrolysis kinetics and thermodynamic parameters of the hydrochars derived from co-hydrothermal carbonization of sawdust and sewage sludge using thermogravimetric analysis. Bioresour. Technol. 2019, 282, 133–141. [Google Scholar] [CrossRef]
- Chen, J.; Mu, L.; Cai, J.; Yao, P.; Song, X.; Yin, H.; Li, A. Pyrolysis and oxy-fuel combustion characteristics and kinetics of petrochemical wastewater sludge using thermogravimetric analysis. Bioresour. Technol. 2015, 198, 115–123. [Google Scholar] [CrossRef]
- Chen, J.; Wang, Y.; Lang, X.; Ren, X.; Fan, S. Comparative evaluation of thermal oxidative decomposition for oil-plant residues via thermogravimetric analysis: Thermal conversion characteristics, kinetics, and thermodynamics. Bioresour. Technol. 2017, 243, 37–46. [Google Scholar] [CrossRef]
- Fan, Y.; Zhou, Z.; Cao, Z.; Jiang, X.; Xu, Y. The Influence of High Oxygen Concentration on Ignition Characteristics of Pulverized Bituminous Coal. In Proceedings of the International Conference on Power Engineering-2007, Hangzhou, China, 23–27 October 2007. [Google Scholar]
- Paniagua, S.; Prado-Guerra, A.; Garcia, A.I.; Calvo, L.F. Bioenergy derived from an organically fertilized poplar plot: Overall TGA and index estimation study for combustion, gasification, and pyrolysis processes. Biomass Convers. Biorefin. 2019, 9, 749–760. [Google Scholar] [CrossRef]
- Yan, X.; Wang, X.; Chen, D.; Liu, L. Experimental Investigation for effects of Pulverized-coal Fineness on Combustion Characteristics. In Proceedings of the International Conference on Power Engineering-2007, Hangzhou, China, 23–27 October 2007. [Google Scholar]
- Chen, G.-B.; Li, J.-W.; Lin, H.-T.; Wu, F.-H.; Chao, Y.-C. A Study of the Production and Combustion Characteristics of Pyrolytic Oil from Sewage Sludge Using the Taguchi Method. Energies 2018, 11, 2260. [Google Scholar] [CrossRef]
- Chen, J.; Liu, J.; He, Y.; Huang, L.; Sun, S.; Sun, J.; Chang, K.; Kuo, J.; Huang, S.; Ning, X. Investigation of co-combustion characteristics of sewage sludge and coffee grounds mixtures using thermogravimetric analysis coupled to artificial neural networks modelling. Bioresour. Technol. 2017, 225, 234–245. [Google Scholar] [CrossRef]
- Zhao, Y.; Wang, Z.; Liu, S.; Li, R.-N.; Li, M.-D. Experimental Study on the Oxidation Reaction Parameters of Different Carbon Structure Particles. Environ. Prog. Sustain. Energy 2015, 34, 1063–1071. [Google Scholar] [CrossRef]
- Yang, H.; Li, X.; Wang, Y.; Mu, M.; Li, X.; Kou, G. Pyrolysis Characteristic Analysis of Particulate Matter from Diesel Engine Run on Diesel/Polyoxymethylene Dimethyl Ethers Blends Based on Nanostructure and Thermogravimetry. Aerosol Air Qual. Res. 2016, 16, 2560–2569. [Google Scholar] [CrossRef]
- Li, X.-g.; Ma, B.-g.; Xu, L.; Hu, Z.-w.; Wang, X.-g. Thermogravimetric analysis of the co-combustion of the blends with high ash coal and waste tyres. Thermochim. Acta 2006, 441, 79–83. [Google Scholar] [CrossRef]
- Song, C.-Z.; Wen, J.-H.; Li, Y.-Y.; Dan, H.; Shi, X.-Y.; Xin, S. Thermogravimetric Assessment of Combustion Characteristics of Blends of Lignite Coals with Coal Gangue. In Advances in Engineering Research (AER), Proceedings of the 3rd Annual International Conference on Mechanics and Mechanical Engineering (MME 2016), Chengdu, China, 16–18 December 2016; Atlantis Press: Paris, France, 2016; Volume 105, pp. 490–495. [Google Scholar]
- Zhang, K.; Zhang, K.; Cao, Y.; Pan, W.-p. Co-combustion characteristics and blending optimization of tobacco stem and high-sulphur bituminous coal based on thermogravimetric and mass spectrometry analyses. Bioresour. Technol. 2013, 131, 325–332. [Google Scholar] [CrossRef]
- Bongomin, O.; Nzila, C.; Mwasiagi, J.I.; Maube, O. Comprehensive thermal properties, kinetic, and thermodynamic analyses of biomass wastes pyrolysis via TGA and Coats-Redfern methodologies. Energy Convers. Manag. X 2024, 24, 100723. [Google Scholar] [CrossRef]
- Nawaz, A.; Kumar, P. Impact of temperature severity on hydrothermal carbonization: Fuel properties, kinetic and thermodynamic parameters. Fuel 2023, 336, 127166. [Google Scholar] [CrossRef]
- Liu, X.; Chen, M.; Yu, D. Oxygen enriched co-combustion characteristics of herbaceous biomass and bituminous coal. Thermochim. Acta 2013, 569, 17–24. [Google Scholar] [CrossRef]
- Shu, Y.; Zhang, J.; Li, W.; Zhao, P.; Zhang, Q.; Zhou, M. Thermogravimetric analysis of the pyrolysis and combustion kinetics of surface dead combustibles in the Daxing’an Mountains. PLoS ONE 2021, 16, e0260790. [Google Scholar] [CrossRef] [PubMed]
- Yan, Y.F.; Zhang, Z.E.; Zhang, L.; Zhang, L. Influence of coal properties on the co-combustion characteristics of lowgrade coal and city mud. Glob. NEST J. 2014, 16, 330–339. [Google Scholar]
- Li, Q.; Zhao, C.; Chen, X.; Wu, W.; Li, Y. Comparison of pulverized coal combustion in air and in O2/CO2 mixtures by thermo-gravimetric analysis. J. Anal. Appl. Pyrolysis 2009, 85, 521–528. [Google Scholar] [CrossRef]
- Jin, Y.; Li, Y.; Liu, F. Combustion effects and emission characteristics of SO2, CO, NOx and heavy metals during co-combustion of coal and dewatered sludge. Front. Environ. Sci. Eng. 2016, 10, 201–210. [Google Scholar] [CrossRef]
- Paredes, R.; Castells, B.; Tascon, A. Thermogravimetric Assessment of Biomass: Unravelling Kinetic, Chemical Composition and Combustion Profiles. Fire 2024, 7, 396. [Google Scholar] [CrossRef]
- Qin, Z.; Lei, M.; Zhang, L. Thermogravimetric analysis of the co-combustion of bituminous coal, rice straw and sewage sludge. IOP Conf. Ser. Earth Environ. Sci. 2022, 1011, 012028. [Google Scholar] [CrossRef]
- Luo, S.Y.; Xiao, B.; Hu, Z.Q.; Liu, S.M.; Guan, Y.W. Experimental study on oxygen-enriched combustion of biomass micro fuel. Energy 2009, 34, 1880–1884. [Google Scholar] [CrossRef]
- Lopez-Gonzalez, D.; Fernandez-Lopez, M.; Valverde, J.L.; Sanchez-Silva, L. Kinetic analysis and thermal characterization of the microalgae combustion process by thermal analysis coupled to mass spectrometry. Appl. Energy 2014, 114, 227–237. [Google Scholar] [CrossRef]
- Qing, W.; Yang, X.; Hongpeng, L.; Xiyan, L.; Mingshu, C. Gaseous emission and thermal analysis during co-combustion of oil shale semicoke and sawdust using tg-ftir. Oil Shale 2015, 32, 356–372. [Google Scholar] [CrossRef]
- Qing, W.; Hao, X.; Hongpeng, L.; Chunxia, J.; Jingru, B. Thermogravimetric analysis of the combustion characteristics of oil shale semi-coke/biomass blends. Oil Shale 2011, 28, 284–295. [Google Scholar] [CrossRef]
- Zhang, N.; Ning, X.A.; Zhou, J.; Wei, P.; Luo, J. Investigation on the co-combustion characteristics of pulverized coal and paper mill sludge. Appl. Mech. Mater. 2011, 55–57, 1132–1137. [Google Scholar] [CrossRef]
- Vamvuka, D.; Sfakiotakis, S. Combustion behaviour of biomass fuels and their blends with lignite. Thermochim. Acta 2011, 526, 192–199. [Google Scholar] [CrossRef]
- Mundike, J.; Collard, F.-X.; Gorgens, J.F. Co-combustion characteristics of coal with invasive alien plant chars prepared by torrefaction or slow pyrolysis. Fuel 2018, 225, 62–70. [Google Scholar] [CrossRef]
- Du, Y.; Yu, D.; Wu, J.; Zeng, X.; Xu, M. Co-combustion characteristics of rice husk and different coal. Therm. Eng. 2016, 45, 6–13. [Google Scholar]
- Wang, C.; Wang, F.; Yang, Q.; Liang, R. Thermogravimetric studies of the behaviour of wheat straw with added coal during combustion. Biomass Bioenergy 2009, 33, 50–56. [Google Scholar] [CrossRef]
- Xiu, S.; Rojanala, H.K.; Shahbazi, A.; Fini, E.H.; Wang, L. Pyrolysis and combustion characteristics of Bio-oil from swine manure. J. Therm. Anal. Calorim. 2012, 107, 823–829. [Google Scholar] [CrossRef]
- Wang, S.; Jiang, X.M.; Han, X.X.; Liu, J.G. Combustion characteristics of seaweed biomass. 1. Combustion characteristics of Enteromorpha clathrata and Sargassum natans. Energy Fuels 2009, 23, 5173–5178. [Google Scholar] [CrossRef]
- Wei, Q.; Qiang, X.; Yuyi, H.; Jiatao, D.; Kaidi, S.; Qian, Y.; Jincao, W. Combustion characteristics of semicokes derived from pyrolysis of low rank bituminous coal. Int. J. Min. Sci. Technol. 2012, 22, 645–650. [Google Scholar] [CrossRef]
- Xiong, S.; Zhang, S.; Wu, Q.; Guo, X.; Dong, A.; Chen, C. Investigation on cotton stalk and bamboo sawdust carbonization for barbecue charcoal preparation. Bioresour. Technol. 2014, 152, 86–92. [Google Scholar] [CrossRef]
- Miao, Z.-Y.; Wu, G.-G.; Zhao, N.; Wang, P.-C.; Meng, X.-L. Combustion characteristics of Daqing oil shale and oil shale semi-cokes. Min. Sci. Technol. 2009, 19, 380–384. [Google Scholar] [CrossRef]
- Huang, X.; Jiang, X.; Han, X.; Wang, H. Combustion Characteristics of Fine- and Micro-pulverized Coal in the Mixture of O2/CO2. Energy Fuels 2008, 22, 3756–3762. [Google Scholar] [CrossRef]
- Jiang, X.; Zheng, C.; Qiu, J.; Li, J.; Liu, D. Combustion Characteristics of Super Fine Pulverized Coal Particles. Energy Fuels 2001, 15, 1100–1102. [Google Scholar] [CrossRef]
- Moon, C.; Sung, Y.; Ahn, S.; Kim, T.; Choi, G.; Kim, D. Effect of blending ratio on combustion performance in blends of biomass and coals of different ranks. Exp. Therm. Fluid Sci. 2013, 47, 232–240. [Google Scholar] [CrossRef]
- Wnorowska, J.; Ciukaj, S.; Kalisz, S. Thermogravimetric Analysis of Solid Biofuels with Additive under Air Atmosphere. Energies 2021, 14, 2557. [Google Scholar] [CrossRef]
- Bilkic, B.; Haykiri-Acma, H.; Yaman, S. Combustion reactivity estimation parameters of biomass compared with lignite based on thermogravimetric analysis. Energy Source Part A 2023, 45, 370–383. [Google Scholar] [CrossRef]
- Plis, A.; Lasek, J.A.; Zuwala, J.; Yu, C.C.; Iluk, A. Combustion performance evaluation of Posidonia oceanica using TGA and bubbling fluidized-bed combustor (batch reactor). J. Sustain. Min. 2016, 15, 181–190. [Google Scholar] [CrossRef]
- Sahu, S.G.; Sarkar, P.; Chakraborty, N.; Adak, A.K. Thermogravimetric assessment of combustion characteristics of blends of a coal with different biomass chars. Fuel Process. Technol. 2010, 91, 369–378. [Google Scholar] [CrossRef]
- Li, X.G.; Lv, Y.; Ma, B.G.; Jian, S.W.; Tan, H.B. Thermogravimetric investigation on co-combustion characteristics of tobacco residue and high-ash anthracite coal. Bioresour. Technol. 2011, 102, 9783–9787. [Google Scholar] [CrossRef]
- Ma, B.-G.; Li, X.-G.; Xu, L.; Wang, K.; Wang, X.-G. Investigation on catalyzed combustion of high ash coal by thermogravimetric analysis. Thermochim. Acta 2006, 445, 19–22. [Google Scholar] [CrossRef]
- Diaz-Faes, E.; Barriocanal, C.; Diez, M.A.; Alvarez, R. Applying TGA parameters in coke quality prediction models. J. Anal. Appl. Pyrolysis 2007, 79, 154–160. [Google Scholar] [CrossRef]
- Kisiela-Czajka, A.M. Adsorption behaviour of SO2 molecules on unburned carbon from lignite fly ash in the context of developing commercially applicable environmental carbon adsorbent. Energy 2022, 250, 123741. [Google Scholar] [CrossRef]
- Dasari, H.P.; Patil, S.S.; Kamath, R.S.; Kisiela-Czajka, A.M. Ceria-based electrospun nanofibers and their widespread applications: A review. J. Environ. Manag. 2025, 377, 124656. [Google Scholar] [CrossRef] [PubMed]
- Cherbanski, R.; Kotkowski, T.; Molga, E. Thermogravimetric analysis of coking during dry reforming of methane. Int. J. Hydrogen Energy 2023, 48, 7346–7360. [Google Scholar] [CrossRef]
- Kisiela-Czajka, A.M.; Hull, S.; Albiniak, A. Investigation of the activity of unburned carbon as a catalyst in the decomposition of NO and NH3. Fuel 2022, 309, 122170. [Google Scholar] [CrossRef]
- Tognotti, L.; Malotti, A.; Petarca, L.; Zanelli, S. Measurement of Ignition Temperature of Coal Particles Using a Thermogravimetric Technique. Combust. Sci. Technol. 1985, 44, 5–18. [Google Scholar] [CrossRef]
- Saponaro, A.; Senneca, O.; Cerciello, F.; Brand, D.J.; Torresi, M.; Cesareo, F.; Valenzano, M.; Siena, S.; Rago, G.; Rossiello, G.; et al. CFD modelling: A powerful tool for high efficiency burner design. In Proceedings of the 12th European Conference on Industrial Furnaces and Boilers (INFUB-12), Porto, Portugal, 14–17 April 2020. [Google Scholar]
- ASTM E1491-06; Standard Test Method for Minimum Autoignition Temperature of Dust Clouds. ASTM International: West Conshohocken, PA, USA, 2019. Available online: https://store.astm.org/e1491-06r19.html (accessed on 8 June 2025).
- Roberts, P.T.; Morley, C. Practical Use of Coal Combustion Research. In Fundamentals of the Physical-Chemistry of Pulverized Coal Combustion; Lahaye, J., Prado, G., Eds.; NATO Science Series E; Springer: Berlin/Heidelberg, Germany, 1987; pp. 452–465. Available online: https://link.springer.com/chapter/10.1007/978-94-009-3661-4_20 (accessed on 8 June 2025).
- Singh, R.; Jamwal, N.; Kumar, M.; Luyt, A.S.; Sharma, P.K.; Kumar, R. Theoretical assessment of mechanical behaviour of LDPE/Cu composites using nonlinear polynomial regression analysis. Adv. Mech. Eng. 2025, 17, 16878132251323156. [Google Scholar] [CrossRef]
- Pilatov, A.; Czajka, K.M.; Petraconi Filho, G.; Medeiros, H.S.; Kisiela, A.M. Evaluation criteria for assessment of additives (AlCl3 and ZnCl2) influence on pyrolysis of sunflower oil cake. Waste Biomass Valorization 2017, 8, 2595–2607. [Google Scholar] [CrossRef]
- Zhang, H.; Wu, Z. The general goodness-of-fit tests for correlated data. Comput. Stat. Data Anal. 2022, 167, 107379. [Google Scholar] [CrossRef]
- Moore, D.S.; Notz, W.I.; Flinger, M.A. The Basic Practice of Statistics, 6th ed.; W. H. Freeman and Company: New York, NY, USA, 2013. [Google Scholar]
- McHugh, M.L. Standard error: Meaning and interpretation. Biochem. Med. 2008, 18, 7–13. Available online: https://www.biochemia-medica.com/assets/images/upload/xml_tif/McHugh_ML_-_Standard_error.pdf (accessed on 8 June 2025). [CrossRef]
- ISO 11722:2013; Solid Mineral Fuels—Hard Coal—Determination of Moisture in the General Analysis Test Sample by Drying in Nitrogen. International Organisation for Standardisation: Geneva, Switzerland, 2013. Available online: https://www.iso.org/standard/62610.html (accessed on 8 June 2025).
- ISO 562:2024; Hard Coal and Coke—Determination of Volatile Matter. International Organisation for Standardisation: Geneva, Switzerland, 2024. Available online: https://www.iso.org/standard/86976.html (accessed on 8 June 2025).
- ISO 1171:2024; Coal and Coke—Determination of Ash. International Organisation for Standardisation: Geneva, Switzerland, 2024. Available online: https://www.iso.org/obp/ui/#iso:std:iso:1171:ed-5:v1:en (accessed on 8 June 2025).
- ISO 21663:2020; Solid Recovered Fuels—Methods for the Determination of Carbon (C), Hydrogen (H), Nitrogen (N) and Sulphur (S) by the Instrumental Method. International Organisation for Standardisation: Geneva, Switzerland, 2020. Available online: https://www.iso.org/standard/71332.html (accessed on 8 June 2025).
- ISO 1928:2020; Coal and Coke—Determination of Gross Calorific Value. International Organisation for Standardisation: Geneva, Switzerland, 2020. Available online: https://www.iso.org/standard/75883.html (accessed on 8 June 2025).
- Peta, S. Ignition Characteristics of Low Volatile Quality High Ash Coal. Master’s Thesis, University of Witwatersrand, Johannesburg, SA, USA, 2014. [Google Scholar]
- Rybak, W.; Moron, W.; Czajka, K.M. Report: Selection of Coals and Conducting Proximate, Ultimate, and Petrographic Analyses of Selected Fuels; PWr: Wroclaw, Poland, 2016. (In Polish) [Google Scholar]
- Czakiert, T.; Nowak, W.; Rybak, W. Oxy-Fuel Combustion for Pulverized and Fluidized Bed Boilers Integrated with CO2 Capture: Kinetics and Mechanism of Oxy-Fuel Combustion and CO2 Capture; Wydawnictwo Politechniki Częstochowskiej: Czestochowa, Poland, 2013. (In Polish) [Google Scholar]
- Speight, J.G. The Chemistry and Technology of Coal, 3rd ed.; CRC Press: Boca Raton, FL, USA, 2016. [Google Scholar]
- Neoh, K.G.; Gannon, R.E. Coal volatile yield and element partition in rapid pyrolysis. Fuel 1984, 63, 1347–1352. [Google Scholar] [CrossRef]
- Solomon, P.R.; Hobbs, R.H.; Hamblen, D.G.; Chen, W.-Y.; La Cara, A.; Graff, R.S. Correlation of coal volatile yield with oxygen and aliphatic hydrogen. Fuel 1981, 60, 342–346. [Google Scholar] [CrossRef]
- Kim, J.K.; Lee, H.D.; Kim, H.S.; Park, H.Y.; Kim, S.C. Combustion possibility of low rank Russian peat as a blended fuel of pulverized coal fired power plant. J. Ind. Eng. Chem. 2014, 20, 1752–1760. [Google Scholar] [CrossRef]
- Su, S.; Pohl, J.H.; Holcombe, D.; Hart, J.A. Techniques to determine ignition, flame stability and burnout of blended coals in p.f. power station boilers. Prog. Energy Combust. Sci. 2001, 27, 75–98. [Google Scholar] [CrossRef]
- Pisupati, S.V.; Scaroni, A.W. Prediction of combustion behaviour of coal blends in industrial scale boilers from laboratory scale data. In Proceedings of the ICCS’97, DGMK Tagungsberichte 9703, Seattle, WA, USA, 3–8 August 1997. [Google Scholar]
- Pohl, J.H. Fuel Evaluation Report: Obed Mountain Coal; Energy and Environmental Research Corporation: Irvine, CA, USA, 1985. [Google Scholar]
- Pohl, J.H. Fuels Evaluation Report: Gloucester Coals; Energy and Environmental Research Corporation: Irvine, CA, USA, 1984. [Google Scholar]
- Holcombe, D. Interim Test Results for the CRC for Black Coal Utilization; ACIRL Limited: Ipswich, UK, 1998. [Google Scholar]
- Li, L.; Bai, X.; Qu, C.; Zhou, K.; Sun, Y. Effects of Moisture on the Ignition and Combustion Characteristics of Lignite Particles: Modelling and Experimental Study. ACS Omega 2022, 7, 34912–34920. [Google Scholar] [CrossRef]
- Pinchuk, V.A.; Sharabura, T.A.; Kuzmin, A.V.; Pinchuk, S.A. The peculiar influence of the mineral impurities content in coal-water fuel on the regularities of fuel drop ignition and combustion. J. Energy Inst. 2020, 93, 911–921. [Google Scholar] [CrossRef]
- Zheng, W.; Gan, S.; Jia, X.; Liu, X. Effect of Moisture Content on Spontaneous Combustion Characteristics of Bituminous Coal in Wuda Coal Field. In Solid Fuel Chemistry; Dzhemilev, U.M., Ed.; Springer Nature: Berlin/Heidelberg, Germany, 2025; Available online: https://link.springer.com/journal/11985 (accessed on 8 June 2025).
- Skorupska, N.M. Coal Specifications—Impact on Power Station Performance, IEACR/52; IEA Coal Research: London, UK, 1993; Available online: https://www.sustainable-carbon.org/report/coal-specifications-impact-on-power-station-performance-ieacr-52/ (accessed on 8 June 2025).
- Pohl, J.H. Fuels Evaluation Report: SRP Coals; Energy and Environmental Research Corporation: Irvine, CA, USA, 1985. [Google Scholar]
- Breen, B.P.; Dusatko, G.C.; Mann, A.N. Low sulphur cleaned coal as a compliance strategy for existing utility boilers. In Proceedings of the Second International Conference on Effects of Coal Quality on Power Plants, St Louis, MO, USA, 19–21 September 1990. [Google Scholar]
- Su, S.; Pohl, J.H.; Holcombe, D.; Hart, J.A. A proposed maceral index to predict combustion behavior of coal. Fuel 2001, 80, 699–706. [Google Scholar] [CrossRef]
- Hertzberg, M. Autoignition temperatures for coal particles dispersed in air. Fuel 1991, 70, 1115–1123. [Google Scholar] [CrossRef]
- Zeng, H.C.; Yao, B.; Qiu, J.R. Studies of combustion and slagging characteristics of anthracite blends with bituminous coal. Ranshao Kexue Yu Jishu 1996, 2, 181–189. (In Chinese) [Google Scholar]
- Sha, D.; Li, Y.; Zhou, X.; Zhang, J.; Zhang, H.; Yu, J. Influence of Volatile Content on the Explosion Characteristics of Coal Dust. ACS Omega 2021, 6, 27150–27157. [Google Scholar] [CrossRef]
- Ajrash, M.J.; Zanganeh, J.; Moghtaderi, B. Experimental investigation of the minimum auto-ignition temperature (MAIT) of the coal dust layer in a hot and humid environment. Fire Saf. J. 2016, 82, 12–22. [Google Scholar] [CrossRef]
- Wu, K.; Qi, Y.; Chen, Y.; Zhao, P.; Xi, C.; Zhao, Y.; Wang, Q. Dependence evaluation of factors influencing coal spontaneous ignition. Energy Sci. Eng. 2023, 11, 3307–3960. [Google Scholar] [CrossRef]
- Aich, S.; Behera, D.; Nandi, B.K.; Bhattacharya, S. Relationship between proximate analysis parameters and combustion behaviour of high ash Indian coal. Int. J. Coal Sci. Technol. 2020, 7, 766–777. [Google Scholar] [CrossRef]
- Li, H.; Elliott, L.; Rogers, H.; Wall, T. Comparative Study on the Combustion Performance of Coals on a Pilot-Scale Test Rig Simulating Blast Furnace Pulverized Coal Injection and a Lab-Scale Drop-Tube Furnace. Energy Fuels 2014, 28, 363–368. [Google Scholar] [CrossRef]
- Smart, J.P.; Nakamura, T. NOx emissions and burnout from a swirl-stabilized burner firing pulverized coal: The effects of firing coal blends. J. Energy Inst. 1993, 66, 99–105. Available online: https://scispace.com/papers/nox-emissions-anf-burnout-from-a-swirl-stabilised-burner-1paywnfad4 (accessed on 8 June 2025).
- Kim, J.K.; Lee, H.D. Combustion Possibility of Indonesia KBB Coal with High Moisture as a Pulverized Fuel of Thermal Power Plant. J. Chem. Eng. Jpn. 2010, 43, 704–712. [Google Scholar] [CrossRef]
- Oka, N.; Murayama, T.; Matsuoka, H.; Yamada, S.; Yamada, T.; Shinozaki, S.; Shibaoka, M.; Thomas, C.G. The influence of rank and maceral composition on ignition and char burnout of pulverized coal. Fuel Process. Technol. 1987, 15, 213–224. [Google Scholar] [CrossRef]
- Douglas, R.E.; Mai, M.C.; Stoessner, R.D. Effects of increasing coal hardness and volatility on pilot-scale pulverization and combustion performance. In Proceedings of the 7th Annual International Pittsburgh Coal Conference, Pittsburgh, PA, USA, 10–14 September 1990; pp. 837–851. [Google Scholar]
- Carpenter, A.M. Coal Blending for Power Stations; IEA/81; IEA Coal Research: London, UK, 1995. [Google Scholar]
- Walker, P.L.; Rusinko, F.; Austin, L.G.; Eley, D.D.; Selwood, P.W.; Weisz, P.B. Gas reactions of carbon. Adv. Catal. 1959, 11, 133–221. [Google Scholar] [CrossRef]
- Hasse, C.; Debiagi, P.; Wen, X.; Hildebrandt, K.; Vascellari, M.; Faravelli, T. Advanced modelling approaches for CFD simulations of coal combustion and gasification. Prog. Energy Combust. 2021, 86, 100938. [Google Scholar] [CrossRef]
- Yuan, Y.; Li, S.; Li, G.; Wu, N.; Yao, Q. The transition of heterogeneous–homogeneous ignitions of dispersed coal particle streams. Combust. Flame 2014, 161, 2458–2468. [Google Scholar] [CrossRef]
- Chen, Y.; Mori, S.; Pan, W.P. Studying the mechanisms of ignition of coal particles by TG-DTA. Thermochim. Acta 1996, 275, 149–158. [Google Scholar] [CrossRef]
- Li, J.; Paul, M.C.; Czajka, K.M. Studies of ignition behaviour of biomass particles in a down-fire reactor for improving co-firing performance. Energy Fuels 2016, 30, 5870–5877. [Google Scholar] [CrossRef]
- Sitka, A.; Szulc, P.; Smykowski, D.; Anwajler, B.; Tietze, T.; Jodkowski, W. Conversion of post-refining waste mong to gaseous fuel in a rotary gasifier. Sustainability 2024, 16, 4251. [Google Scholar] [CrossRef]
- Huang, Q.; Yu, B.; Qiu, K.; Zhou, G.; Wang, S.; Chi, Y.; Yan, J. Effect of moisture on sewage sludge combustion temperature profile and heavy metal leaching. Dry. Technol. 2016, 34, 1810–1819. [Google Scholar] [CrossRef]


| Sample | M | V | FC | Ash | FR | C | H | N | S | O * | LHV |
|---|---|---|---|---|---|---|---|---|---|---|---|
| wt% ad | - | wt% ad | MJ∙kg−1 | ||||||||
| AA | 1.5 | 4.8 | 90.9 | 2.8 | 18.9 | 90.0 | 3.3 | 1.1 | 0.4 | 0.9 | 33.2 |
| HA | 3.0 | 23.8 | 43.0 | 30.2 | 1.8 | 53.4 | 3.3 | 1.0 | 1.3 | 7.8 | 20.5 |
| HB | 7.6 | 20.6 | 41.8 | 30.0 | 2.0 | 47.9 | 2.6 | 1.0 | 0.6 | 10.3 | 17.2 |
| HC | 4.2 | 21.3 | 47.9 | 26.6 | 2.2 | 56.6 | 3.0 | 1.2 | 0.8 | 7.6 | 21.2 |
| HD | 1.6 | 26.0 | 49.6 | 22.8 | 1.9 | 61.7 | 3.7 | 0.9 | 1.0 | 8.3 | 23.9 |
| HE | 3.1 | 32.8 | 55.5 | 8.6 | 1.7 | 75.7 | 4.3 | 1.2 | 1.2 | 5.9 | 24.7 |
| HF | 3.7 | 33.0 | 52.9 | 10.4 | 1.6 | 76.0 | 4.1 | 1.3 | 1.6 | 2.9 | 25.8 |
| HG | 2.4 | 35.1 | 54.8 | 7.7 | 1.6 | 77.1 | 4.6 | 1.2 | 1.1 | 5.9 | 27.0 |
| HH | 3.6 | 19.5 | 42.7 | 34.2 | 2.2 | 46.8 | 2.8 | 1.3 | 0.8 | 10.5 | 17.4 |
| HI | 5.1 | 18.5 | 30.7 | 45.7 | 1.7 | 37.9 | 2.4 | 0.7 | 0.5 | 7.7 | 14.8 |
| HJ | 2.2 | 21.6 | 34.1 | 42.1 | 1.6 | 43.0 | 2.7 | 1.1 | 0.7 | 8.2 | 16.2 |
| HK | 1.4 | 29.8 | 59.5 | 9.3 | 2.0 | 77.8 | 4.9 | 1.4 | 0.6 | 4.6 | 30.3 |
| LA | 4.4 | 44.4 | 35.0 | 16.2 | 0.8 | 55.2 | 4.5 | 0.7 | 1.8 | 17.2 | 18.9 |
| LB | 2.0 | 46.7 | 33.8 | 17.5 | 0.7 | 59.0 | 4.8 | 0.5 | 1.3 | 14.9 | 21.7 |
| Sample | D2 | C1 | C2 | C3 | B1 | B2 |
|---|---|---|---|---|---|---|
| %∙°C−4∙109 | %∙°C−3∙106 | %2∙°C5∙1010 | %∙°C−1∙s−2∙108 | s−1∙105 | %∙°C−1∙s−3∙1011 | |
| AA | 2.95 | 1.85 | 3.11 | 7.09 | 6.70 | 4.35 |
| HA | 29.01 | 2.24 | 3.17 | 8.93 | 7.34 | 13.88 |
| HB | 5.49 | 2.37 | 3.37 | 10.49 | 7.73 | 7.32 |
| HC | 17.07 | 2.08 | 3.00 | 8.19 | 7.41 | 4.69 |
| HD | 34.26 | 2.37 | 3.72 | 9.70 | 7.95 | 5.27 |
| HE | 21.11 | 3.35 | 6.36 | 14.90 | 9.09 | 7.89 |
| HF | 23.23 | 2.88 | 5.08 | 12.67 | 8.55 | 6.55 |
| HG | 24.38 | 3.06 | 5.69 | 13.62 | 8.60 | 7.72 |
| HH | 5.70 | 2.16 | 2.87 | 8.75 | 6.83 | 6.64 |
| HI | 6.19 | 2.37 | 2.73 | 10.69 | 7.17 | 10.00 |
| HJ | 16.80 | 2.14 | 2.57 | 9.77 | 6.94 | 7.10 |
| HK | 39.57 | 2.26 | 3.81 | 9.23 | 7.64 | 4.75 |
| LA | 16.64 | 4.76 | 9.53 | 22.98 | 7.55 | 11.41 |
| LB | 25.20 | 4.51 | 8.95 | 22.68 | 9.36 | 10.05 |
| Sample | Tign1 | Tign2 | Tign3 |
|---|---|---|---|
| °C | |||
| AA | 538.1 | 499.5 | 494.8 |
| HA | 412.9 | 361.5 | 356.8 |
| HB | 414.3 | 339.9 | 345.6 |
| HC | 430.9 | 368.3 | 360.9 |
| HD | 416.8 | 359.4 | 347.5 |
| HE | 372.6 | 329.3 | 316.3 |
| HF | 388.7 | 334.3 | 322.1 |
| HG | 372.4 | 332.8 | 323.3 |
| HH | 436.3 | 377.1 | 353.8 |
| HI | 405.1 | 359.6 | 342.2 |
| HJ | 411.6 | 374.5 | 335.0 |
| HK | 442.0 | 392.2 | 369.0 |
| LA | 292.4 | 261.4 | 255.3 |
| LB | 308.7 | 260.9 | 262.1 |
| Sample | ∆m1000°C (DTF) | MAIT (PI) | Rmax.oxd (EFR) |
|---|---|---|---|
| % | °C | %∙°C−1 | |
| AA | 47.7 | 653 | 0.300 |
| HA | 34.3 [84] | 631 [85] | 0.279 |
| HB | 41.1 [84] | 686 [85] | 0.291 |
| HC | 50.7 [84] | 625 [85] | 0.287 |
| HD | 42.1 | 435 [85] | 0.295 |
| HE | 40.7 | 581 [86] | 0.389 |
| HF | 49.5 | 580 [86] | 0.365 |
| HG | 44.8 | 578 [86] | 0.401 |
| HH | 48.2 | 437 | 0.304 |
| HI | 34.4 | 620 | 0.269 |
| HJ | 32.6 | 640 | 0.322 |
| HK | 40.6 | 650 | 0.298 |
| LA | 62.0 | 635 [86] | 0.338 |
| LB | 32.9 | 740 [86] | 0.470 |
| Devolatilization | Ignition | Burnout | |
|---|---|---|---|
| TGA-based indices | D2+++ | C1+++, C2++, C3+++ | B1+, B1′++ |
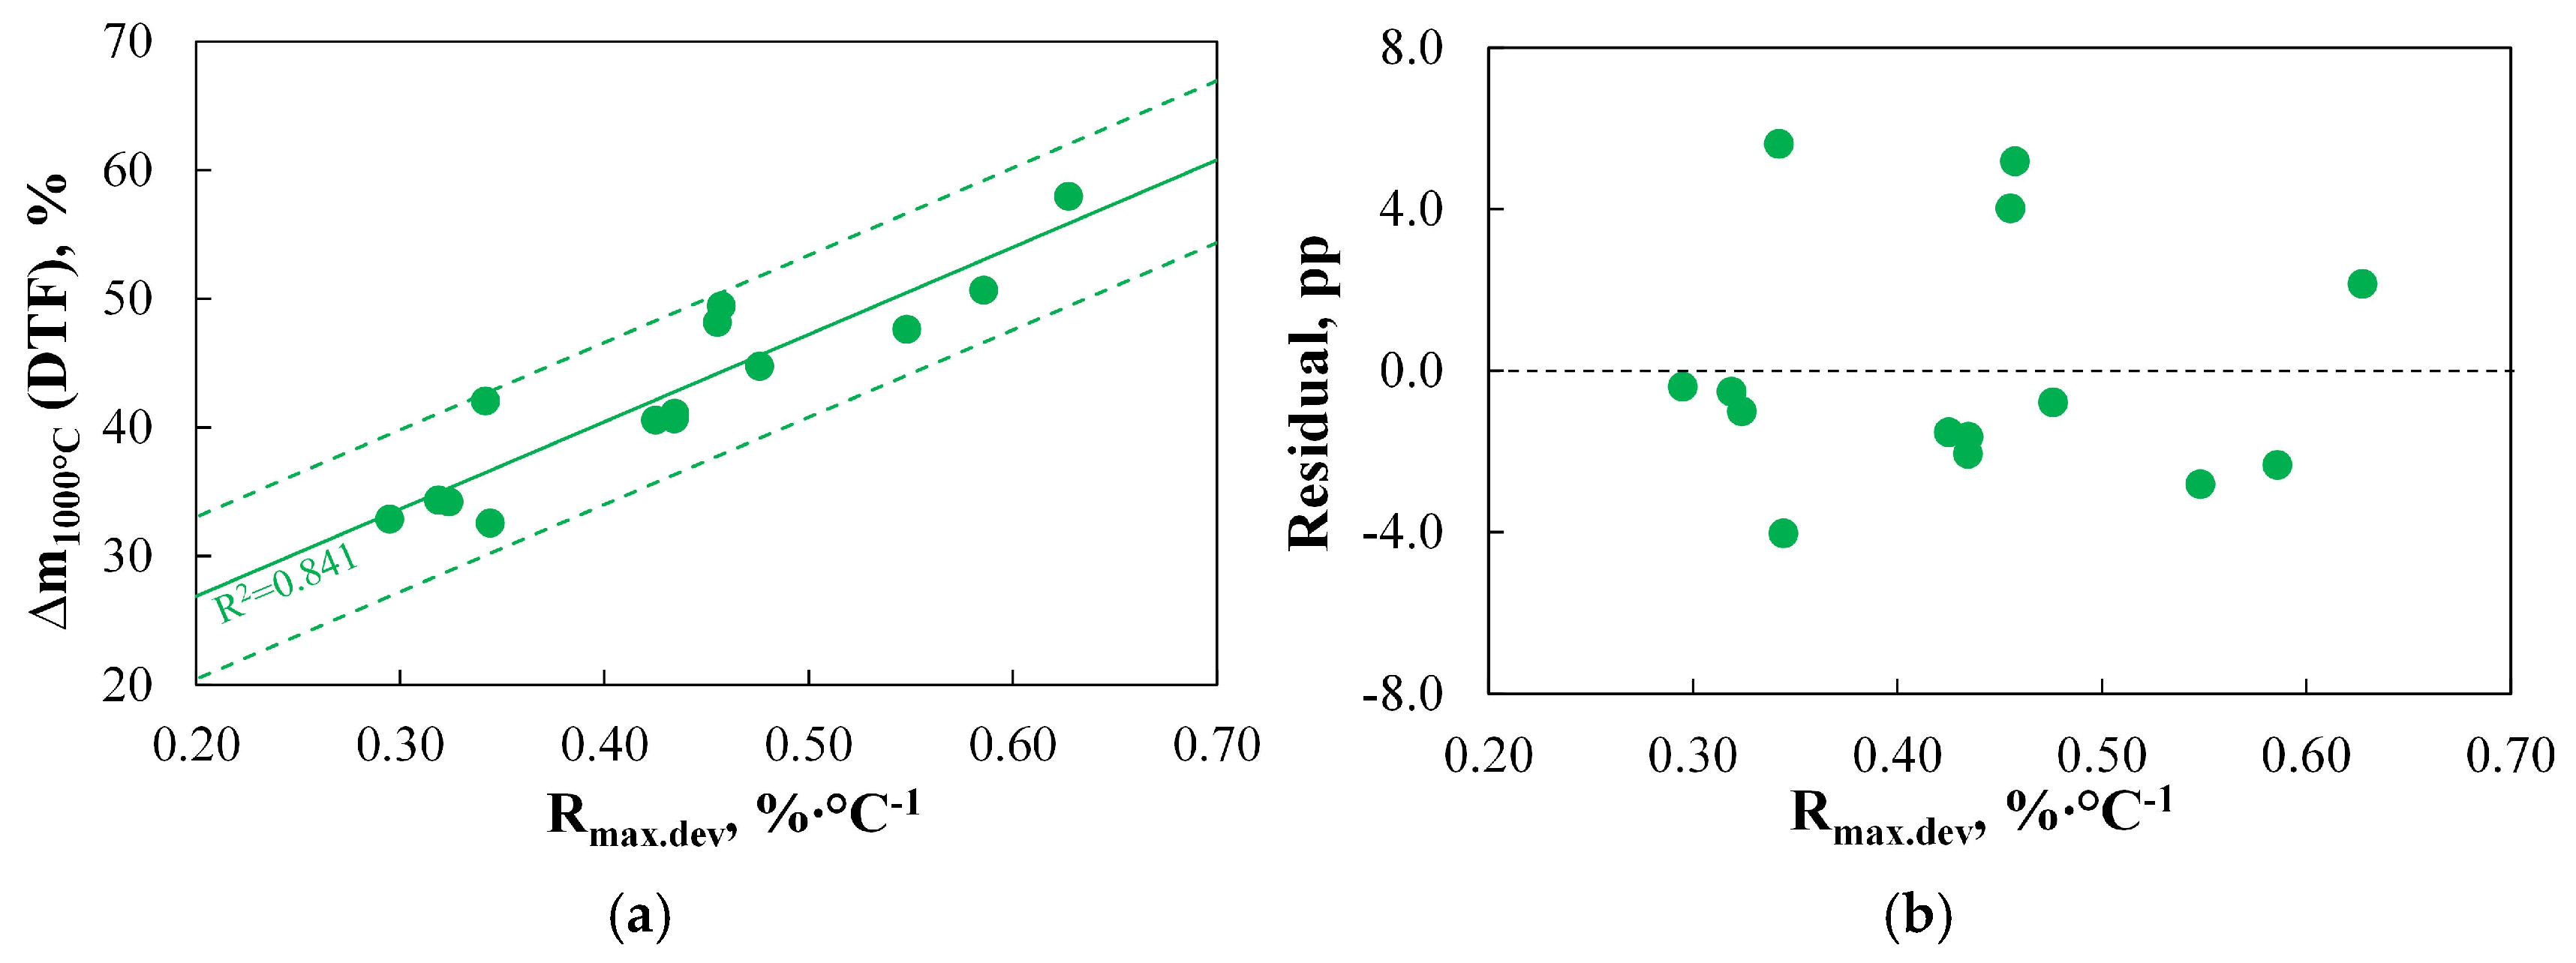
| TGA-based parameters | Rmax.dev++ | Ti.dev++, Tign1++, Tb++ | - |
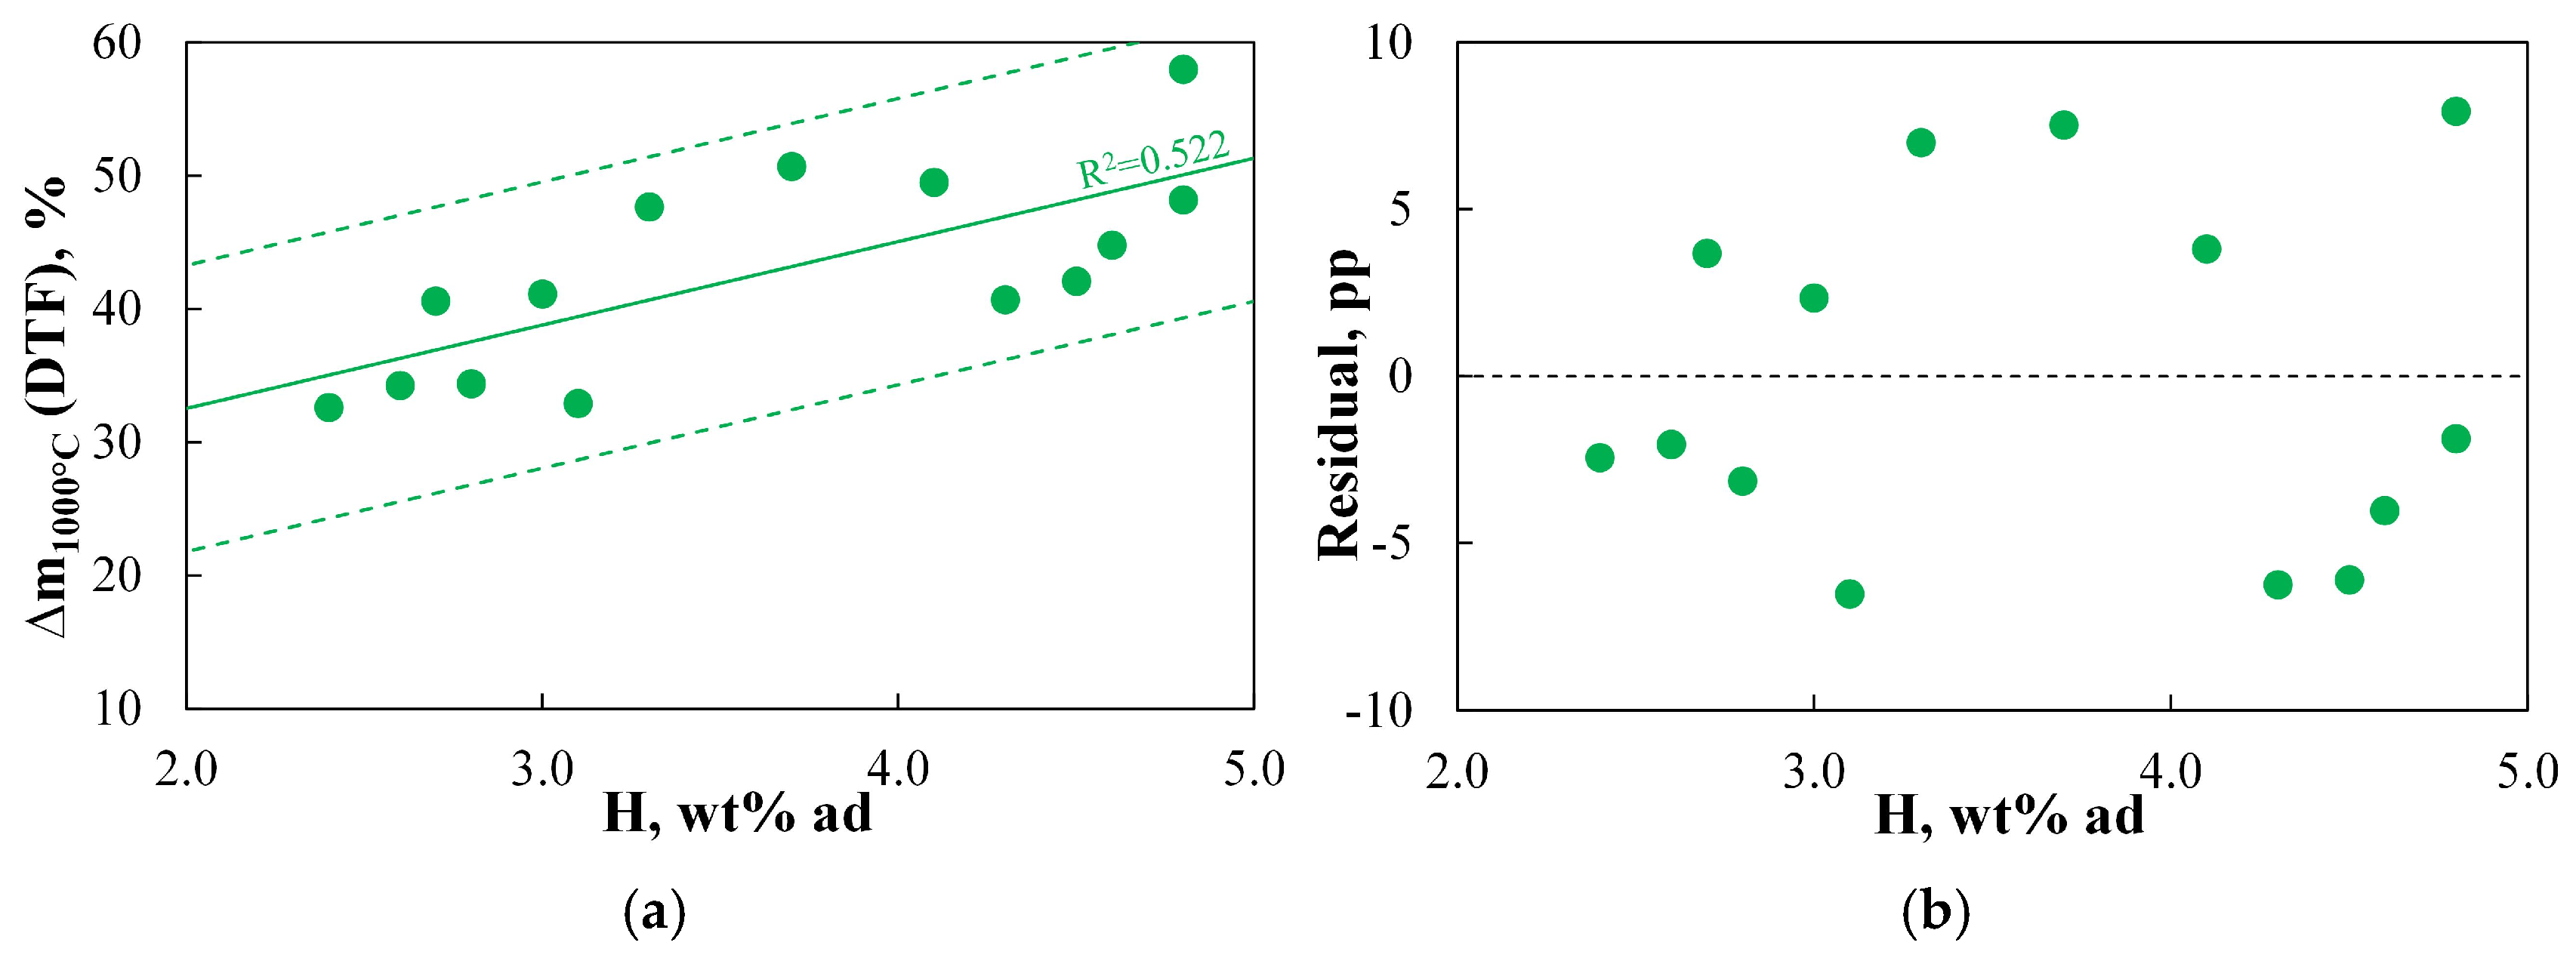
| Basic physicochemical parameters | H+ | V++ | V+ |
Disclaimer/Publisher’s Note: The statements, opinions and data contained in all publications are solely those of the individual author(s) and contributor(s) and not of MDPI and/or the editor(s). MDPI and/or the editor(s) disclaim responsibility for any injury to people or property resulting from any ideas, methods, instructions or products referred to in the content. |
© 2025 by the author. Licensee MDPI, Basel, Switzerland. This article is an open access article distributed under the terms and conditions of the Creative Commons Attribution (CC BY) license (https://creativecommons.org/licenses/by/4.0/).
Share and Cite
Czajka, K.M. Evaluation of the Reliability of Thermogravimetric Indices for Predicting Coal Performance in Utility Systems. Energies 2025, 18, 3473. https://doi.org/10.3390/en18133473
Czajka KM. Evaluation of the Reliability of Thermogravimetric Indices for Predicting Coal Performance in Utility Systems. Energies. 2025; 18(13):3473. https://doi.org/10.3390/en18133473
Chicago/Turabian StyleCzajka, Krzysztof M. 2025. "Evaluation of the Reliability of Thermogravimetric Indices for Predicting Coal Performance in Utility Systems" Energies 18, no. 13: 3473. https://doi.org/10.3390/en18133473
APA StyleCzajka, K. M. (2025). Evaluation of the Reliability of Thermogravimetric Indices for Predicting Coal Performance in Utility Systems. Energies, 18(13), 3473. https://doi.org/10.3390/en18133473