Article

Increasing Efficiency of Energy Conversion Systems from Renewable Sources Using Voltage Source Inverters with Soft Switching of Transistors

Department of Electrical Engineering, Cracow University of Technology, Warszawska 24 St., 31-155 Cracow, Poland
*
Author to whom correspondence should be addressed.
Energies 2025, 18(13), 3474; https://doi.org/10.3390/en18133474
Submission received: 6 June 2025 / Revised: 27 June 2025 / Accepted: 27 June 2025 / Published: 1 July 2025

Abstract

This article presents proposals to increase the efficiencies of energy conversion systems from renewable sources using a soft-switching technique in three-phase voltage source inverters. The first part of this article briefly presents basic systems for generating energy from renewable sources. Special attention is paid to both photovoltaic and wind power plants. The next section describes the voltage source inverter with the soft-switching system of transistors, which is resistant to disturbances in the control systems of inverters. Laboratory tests on cooperation between the voltage source inverter and the AC grid are carried out for two cases, when energy is transmitted from the DC circuit to the AC grid and vice versa. In the final part, the efficiencies of energy conversion systems operating under the voltage source inverter with the soft-switching technique are compared with those of an inverter using hard switching of transistors. A comparison is made for energy conversion systems with a rated power of 100 kW and 1 MW.

1. Introduction

The generation of electricity from renewable sources is still an important issue. This mainly concerns wind energy and solar radiation. One of the most important problems is the maximum use of energy from individual renewable sources. This is understandable because it allows reduced burning of fossil fuels and the highest possible profits from the sale of such ecological energy to be obtained. For this purpose, control algorithms are applied to use the maximum power that can be obtained from renewable sources. The so-called the maximum power point tracking (MPPT) is determined, and this point depends on external conditions, i.e., wind speed and sunlight [1,2,3,4,5,6,7,8,9]; now, artificial intelligence is being used for the MPPT [10].
In many cases, electrical energy from renewable energy sources must be converted into energy with the parameters of the AC grid 50 Hz or 60 Hz; this concerns primarily the frequency and the content of higher harmonics of the current flowing from the energy conversion systems to the AC grid. Voltage source inverters (VSIs) are integral elements of energy conversion systems from photovoltaic power plants or wind power plants using permanent magnet synchronous generators (PMSG). These inverters are also used if double-fed induction generators (DFIGs), or sometimes squirrel cage induction generators (SCIGs), are used in wind farms.
When assessing the use of energy from renewable sources, the efficiency of power electronic converters, especially VSIs, is quite often ignored. Their efficiencies range on average from 94% to 98% for inverters with rated power of several MW. The efficiency of VSIs can be noticeably increased using soft-switching systems of transistors [11,12,13,14,15,16,17]. This allows an increase in the efficiency of the entire system of energy conversion from renewable sources. An analysis of the efficiencies of these systems was performed for an assumed rated power of 100 kW and 1 MW.

2. Energy Conversion Systems from Renewable Sources

2.1. Conversion System in Photovoltaic Plants

The most often used energy conversion system in photovoltaic power plants consists of a DC/DC converter increasing the DC voltage and a three-phase VSI connected to the AC grid (Figure 1) [7,9,18,19,20]. This inverter is connected to the AC grid by inductors in relatively low power systems or using transformers, especially if energy from renewable sources is transmitted to the medium voltage AC grid. Every renewable energy conversion system comprises a two-level VSI, or a three-level VSI in high-power systems. The DC/DC boost converter typically contains one IGBT and one inductor.
The operation of the VSI is synchronized with the AC grid; the control algorithm of the VSI must depend, among others, on the actual voltage of the AC grid. Sometimes the VSI should be able to regulate the active and reactive power transmitted to the AC grid. The control system takes into account the rms value of the AC grid voltage as well as the level of solar radiation on the PV panels. The VSI is often controlled by the voltage-oriented method with space vector modulation.
In some cases, the DC/DC boost converter is replaced by a Z-source inverter [21,22]. However, the use of the Z-source inverter requires a certain modification in the control system of the three-phase VSI. Therefore, the Z-source inverter can be used only for one group of photovoltaic panels and it is not applied in high-power energy conversion systems. Different modifications of the power conversion system with the Z-source inverter are described in [23]. In many photovoltaic plants, one main VSI is used, and individual groups of photovoltaic panels are connected to a common DC voltage circuit using the “classical” DC/DC boost converters [24]. Therefore, in the analysis of the efficiency of the energy conversion system, it was assumed that the DC voltage is increased using the “classical” DC/DC boost converter.
Power losses are the sum of both the conduction and switching losses in the transistors and diodes of the VSI and of the DC/DC boost converter. The efficiency ηPV of this energy conversion system is the product of the efficiency ηDC of the DC/DC boost converter and the efficiency ηVSI of the VSI:
η P V = η D C η V S I
where efficiency is defined as the ratio of active power at the output to active power at the input of the converter.
As it is shown later, the efficiency of energy conversion systems depends not only on the losses in converters but also on the power transmitted to the AC grid.

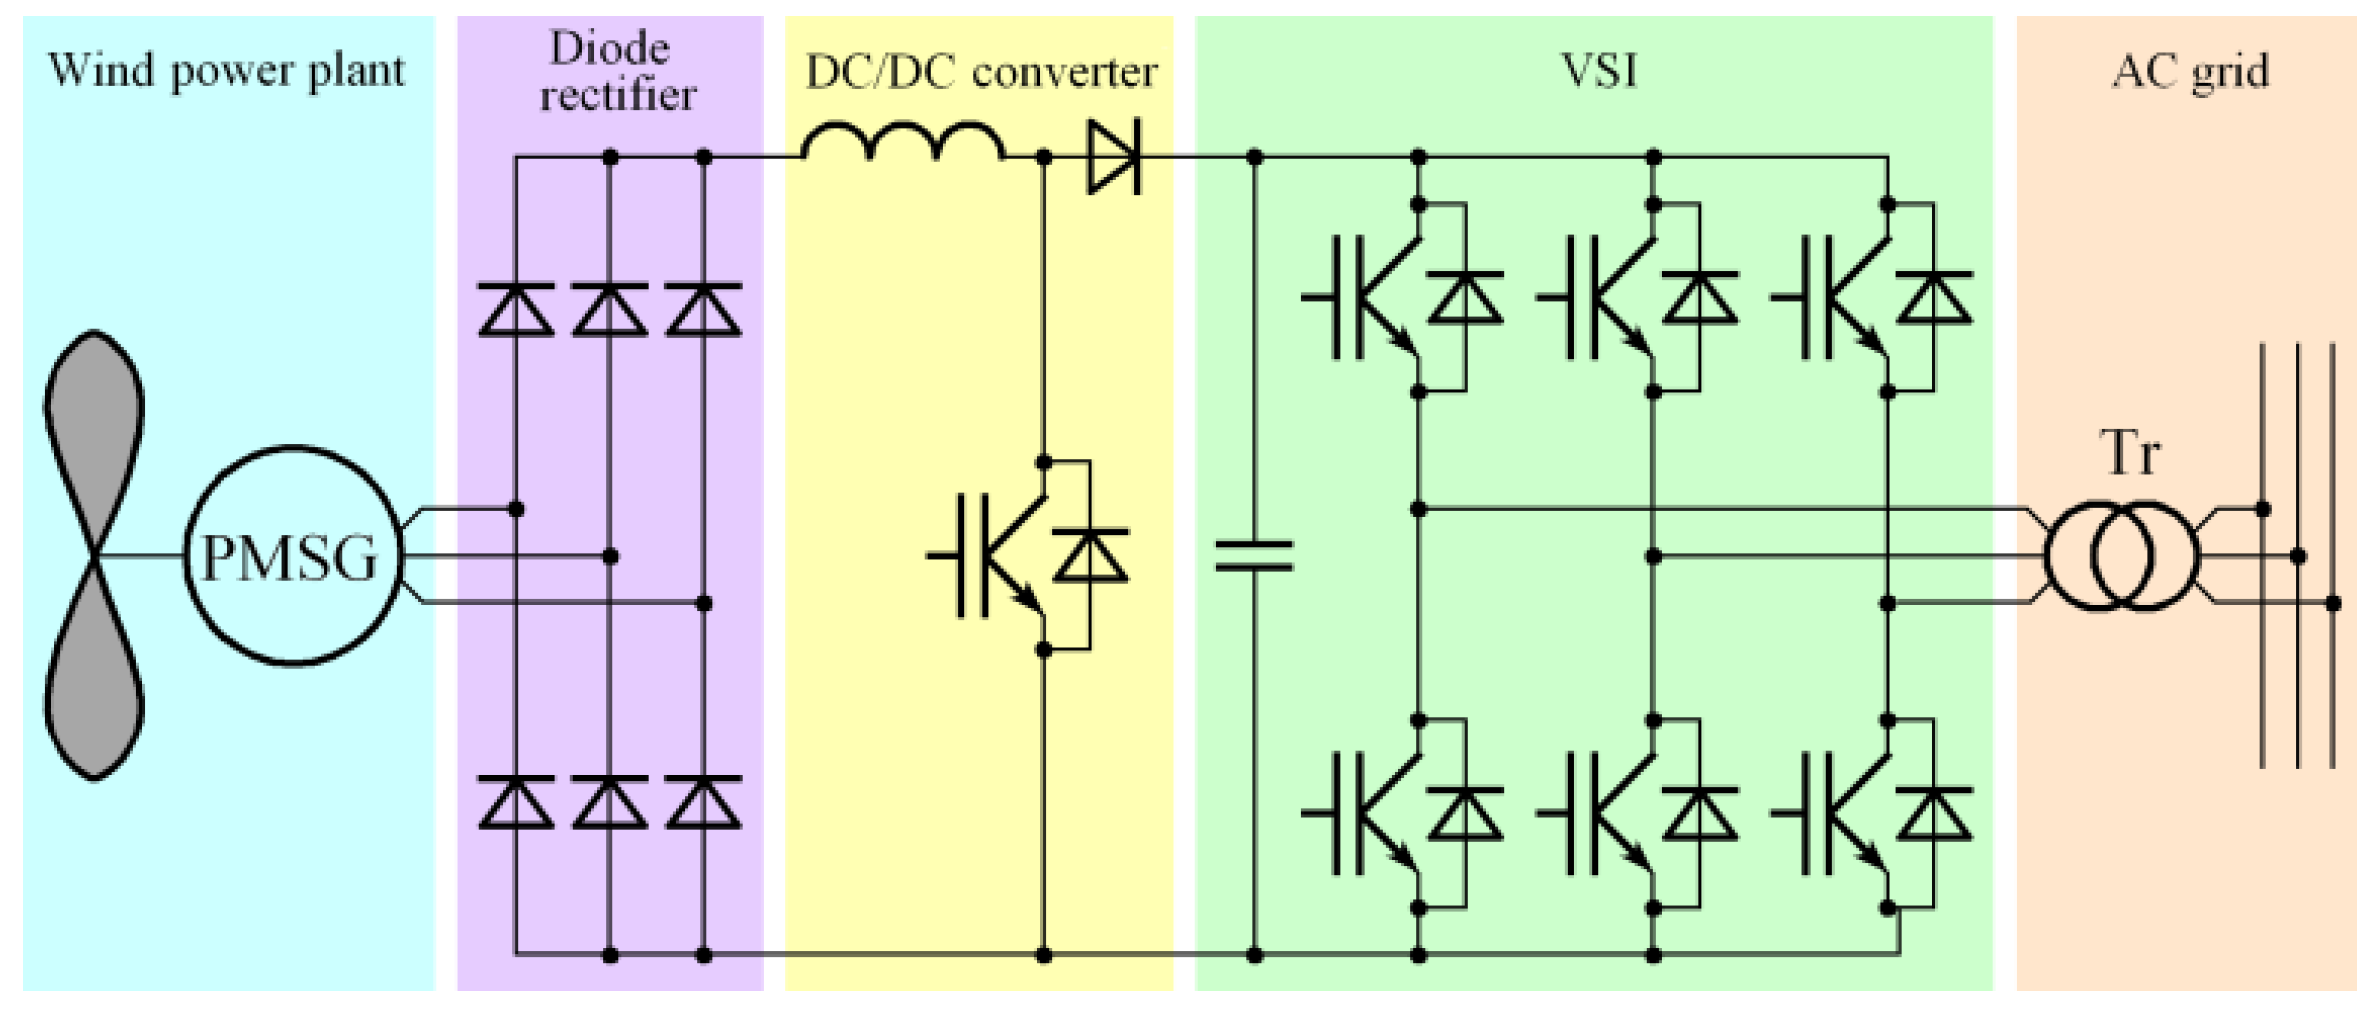
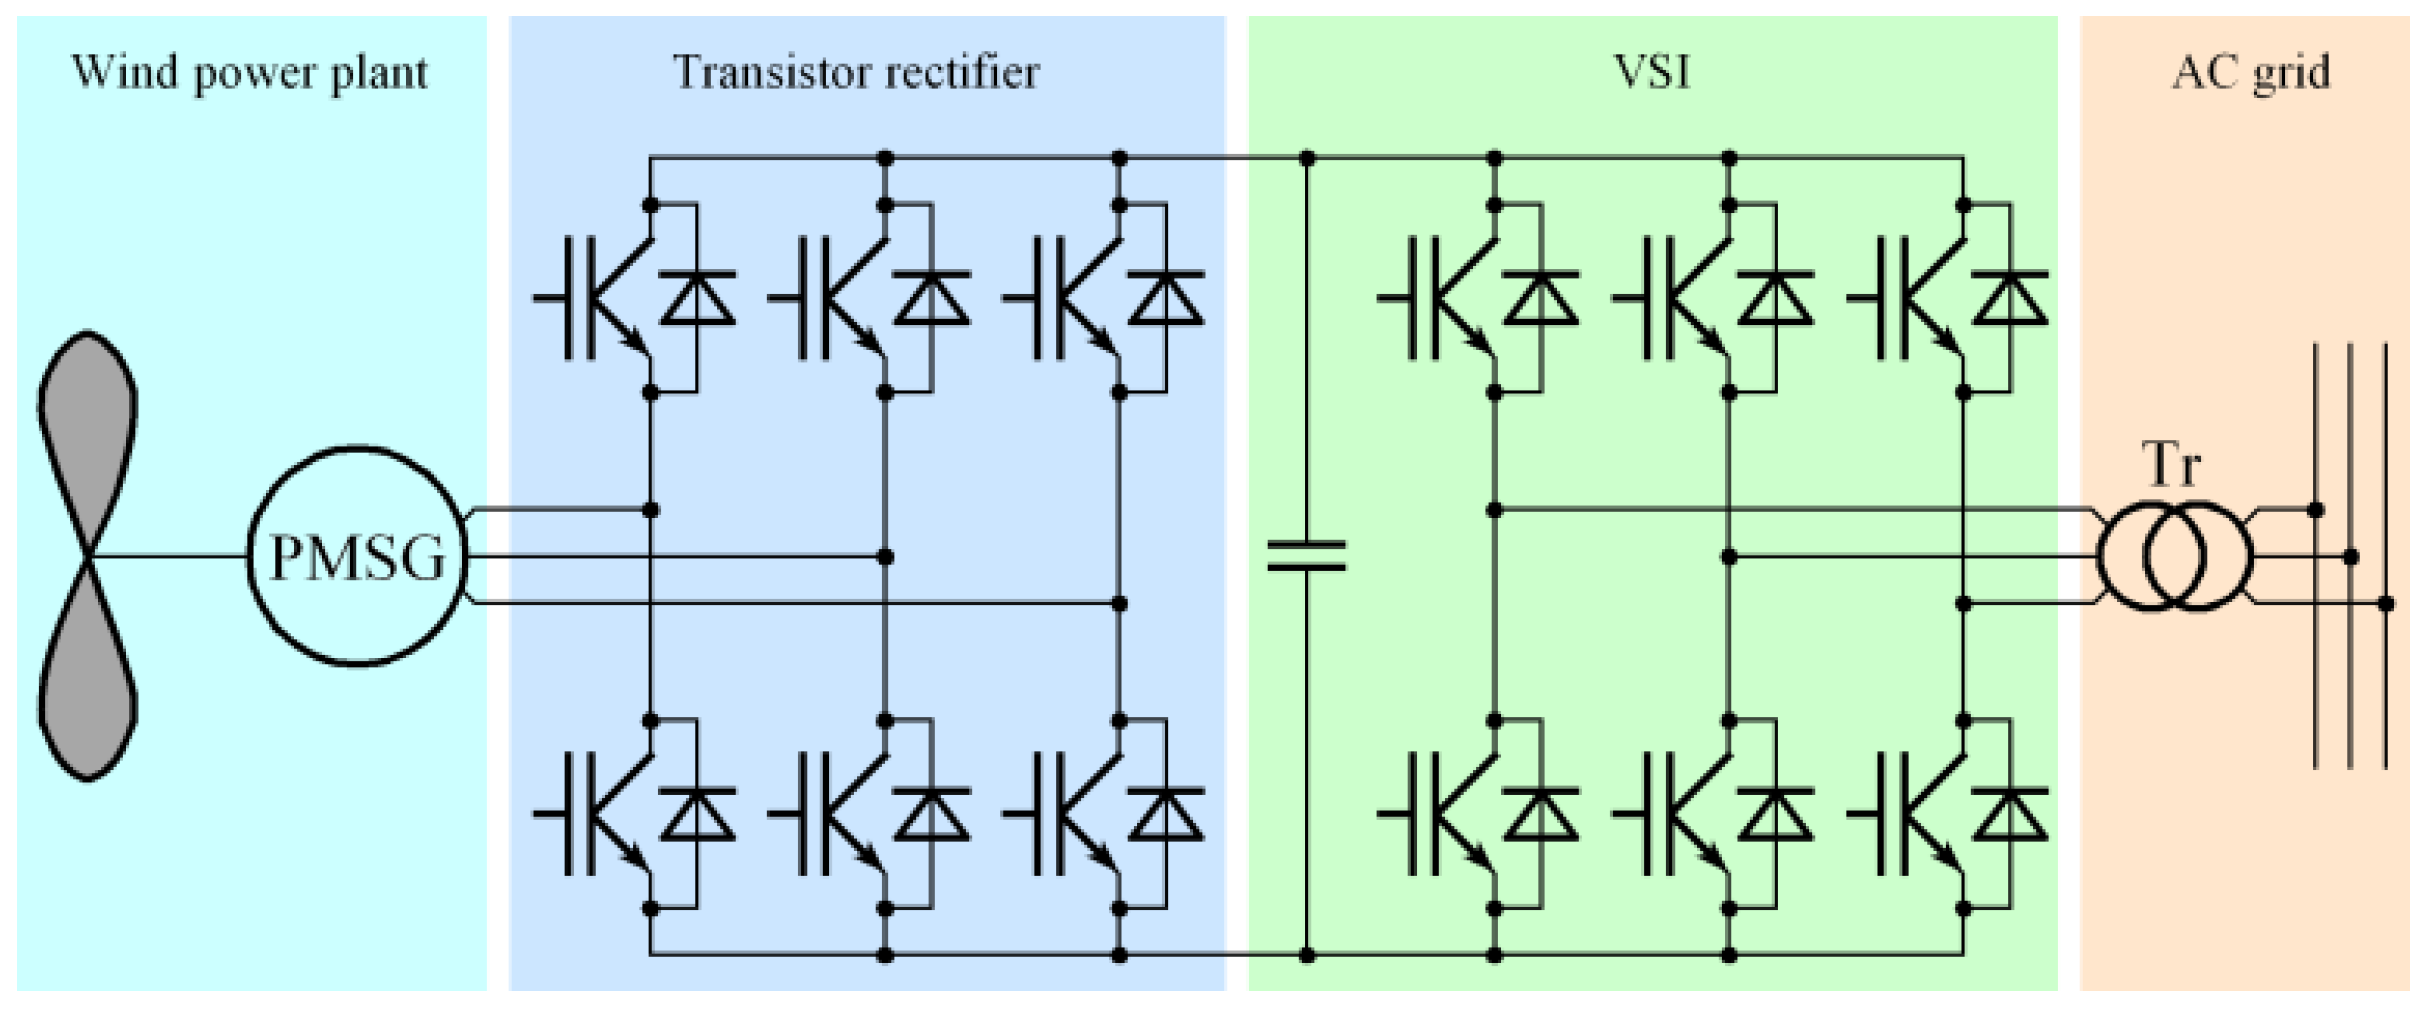
2.2. Conversion Systems with a Permanent Magnet Synchronous Generator

Synchronous generators with permanent magnets (PMSGs) are used in wind plants quite often. The type of this generator deserves special attention because the energy generation system with the PMSG can operate in a wide range of the wind speed, which determines the rms value and frequency of the PMSG output voltage.
Energy conversion can be carried out in two ways. In the first one, the AC voltage of the PMSG is converted into DC voltage using a diode rectifier. Then, the output voltage of this rectifier is increased by the DC/DC boost converter to the value that should be at the VSI input (Figure 2) [25]. This method is generally not recommended because the generator currents are significantly distorted from the sinusoidal waveform. This leads to the appearance of a variable generator torque component, which may affect the durability and reliability of the turbine–generator set. Notably, in this method of energy conversion, it is not possible to reduce the content of higher harmonics of the generator currents.
Power losses in this energy conversion system occur, as previously described, in the VSI and DC/DC converter and in the diode rectifier as conduction losses of diodes. Owing to relatively low frequency of the PMSG output voltage, losses associated with turning off of the rectifier diodes can be neglected. In this case, the efficiency ηPMSG1 is the product of the efficiency ηDR of the diode rectifier, the efficiency ηDC of the DC/DC boost converter, and the efficiency ηVSI of the VSI:
η P M S G 1 = η D R η V S I
In the second energy conversion method, a transistor rectifier is connected to the PMSG (Figure 3) [5,6,25,26,27,28,29]. The output voltage of this rectifier can be regulated to maintain the input voltage of the VSI at a required level. The operation of this rectifier must be synchronized with the PMSG output voltages. The use of a transistor rectifier causes the shape of the generator currents to be similar to sinusoidal waveform. As a result, the variable component of the generator torque has much smaller value compared to the component that occurs in the previous variant of energy conversion. The efficiency of this energy conversion system is equal to
η P M S G 2 = η T R η V S I
where ηTR denotes the efficiency of the transistor rectifier.
The power losses occurring in the transistor rectifier are qualitatively the same as in the VSI connected to the AC grid.

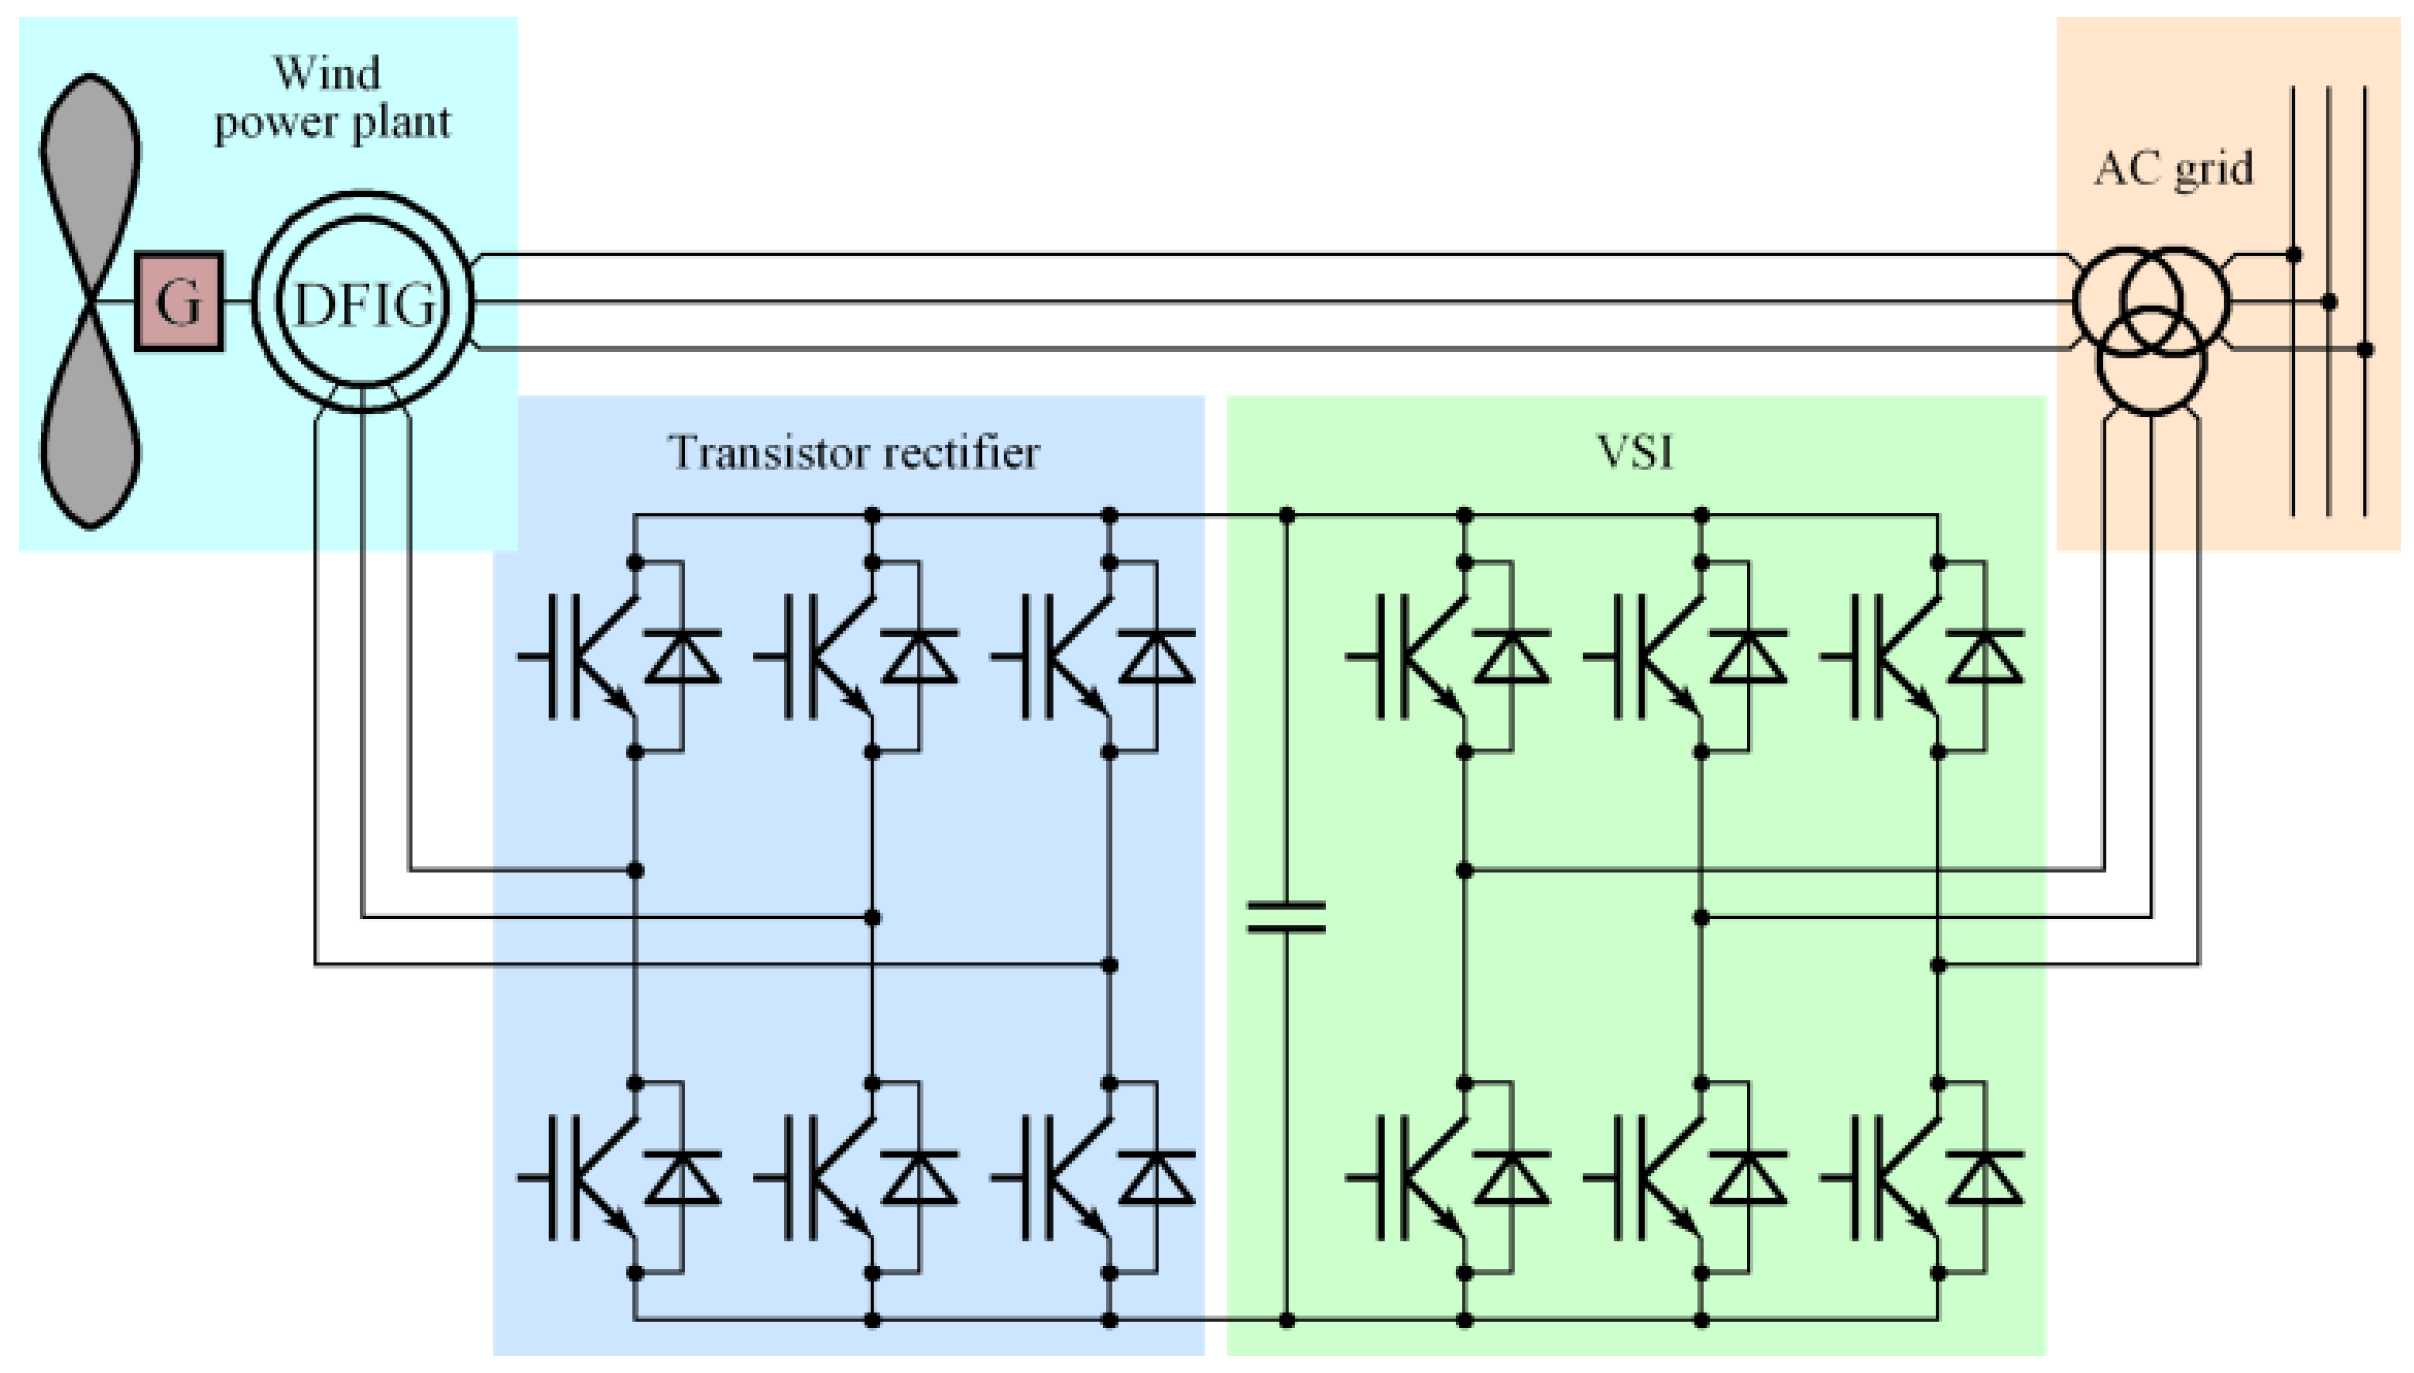
2.3. Conversion Systems with a Double-Fed Induction Generator

Quite often, double-fed induction generators (DFIG) are applied in wind energy conversion systems (Figure 4) [2,30,31,32,33,34,35,36,37]. The stator of this generator is connected to the AC grid using a three-winding transformer. The rotor windings are connected to the second secondary winding of this transformer by the transistor rectifier and the three-phase VSI. This combination allows us to shape the mechanical characteristics of the DFIG. Therefore, the wind turbine–generator set can operate stably in a quite wide range of wind speeds. An alternative solution of the DFIG system is proposed in [35], in which the rotor is connected directly to the AC grid.
The efficiency of the wind energy conversion system with the DFIG is equal to
η D F I G = k s t ( s ) + 1 k s t ( s ) η T R η V S I
where kst(s) determines the part of the energy that is transmitted from the stator circuit to the AC grid through the transformer, s denotes the slip of the DFIG, and ηTR and ηVSI denote the efficiency of the converters in the rotor circuit.
The efficiency depends significantly on the generator slip. The smaller the slip, the greater the efficiency of this energy conversion system because the amount of energy transmitted through the rotor circuit is reduced.
The converters in the rotor circuit have a much smaller impact on the efficiency, because a maximum of about 30% of the energy generated by the DFIG is transmitted through the rotor circuit and significant part of the energy is transmitted directly from the stator output to the AC grid through the three-winding transformer [32]. In some DFIG solutions, a battery is connected to the DC circuit to store energy [30,36].

2.4. Conversion Systems with a Squirrel Cage Induction Generator

Wind energy conversion systems with squirrel cage induction generators (SCIG) are used relatively rarely [4,38]. In this case, it is quite problematic to generate a magnetic flux in this generator. For this purpose, a capacitor bank connected directly to the stator of the SCIG or a system of two converters are used, one of which can operate as the transistor rectifier and the other as the VSI. The efficiency is defined analogously to the efficiency of the energy conversion system with the PMSG and the transistor rectifier.
It is worth noting that in some countries, for example in the Europe Union, weighted efficiency is used, which is the sum of efficiencies for different percentage values of rated efficiency taken into account with different weights [39]. When analyzing the efficiency of energy conversion systems, it is necessary to take into account the efficiency of transformers that couple the energy conversion system with the medium voltage AC grid. The efficiency of transformers with a rated power above 1 MW is about 99% and even 99.5% for liquid-cooled transformers.

3. Increasing the Efficiency of Voltage Source Inverters

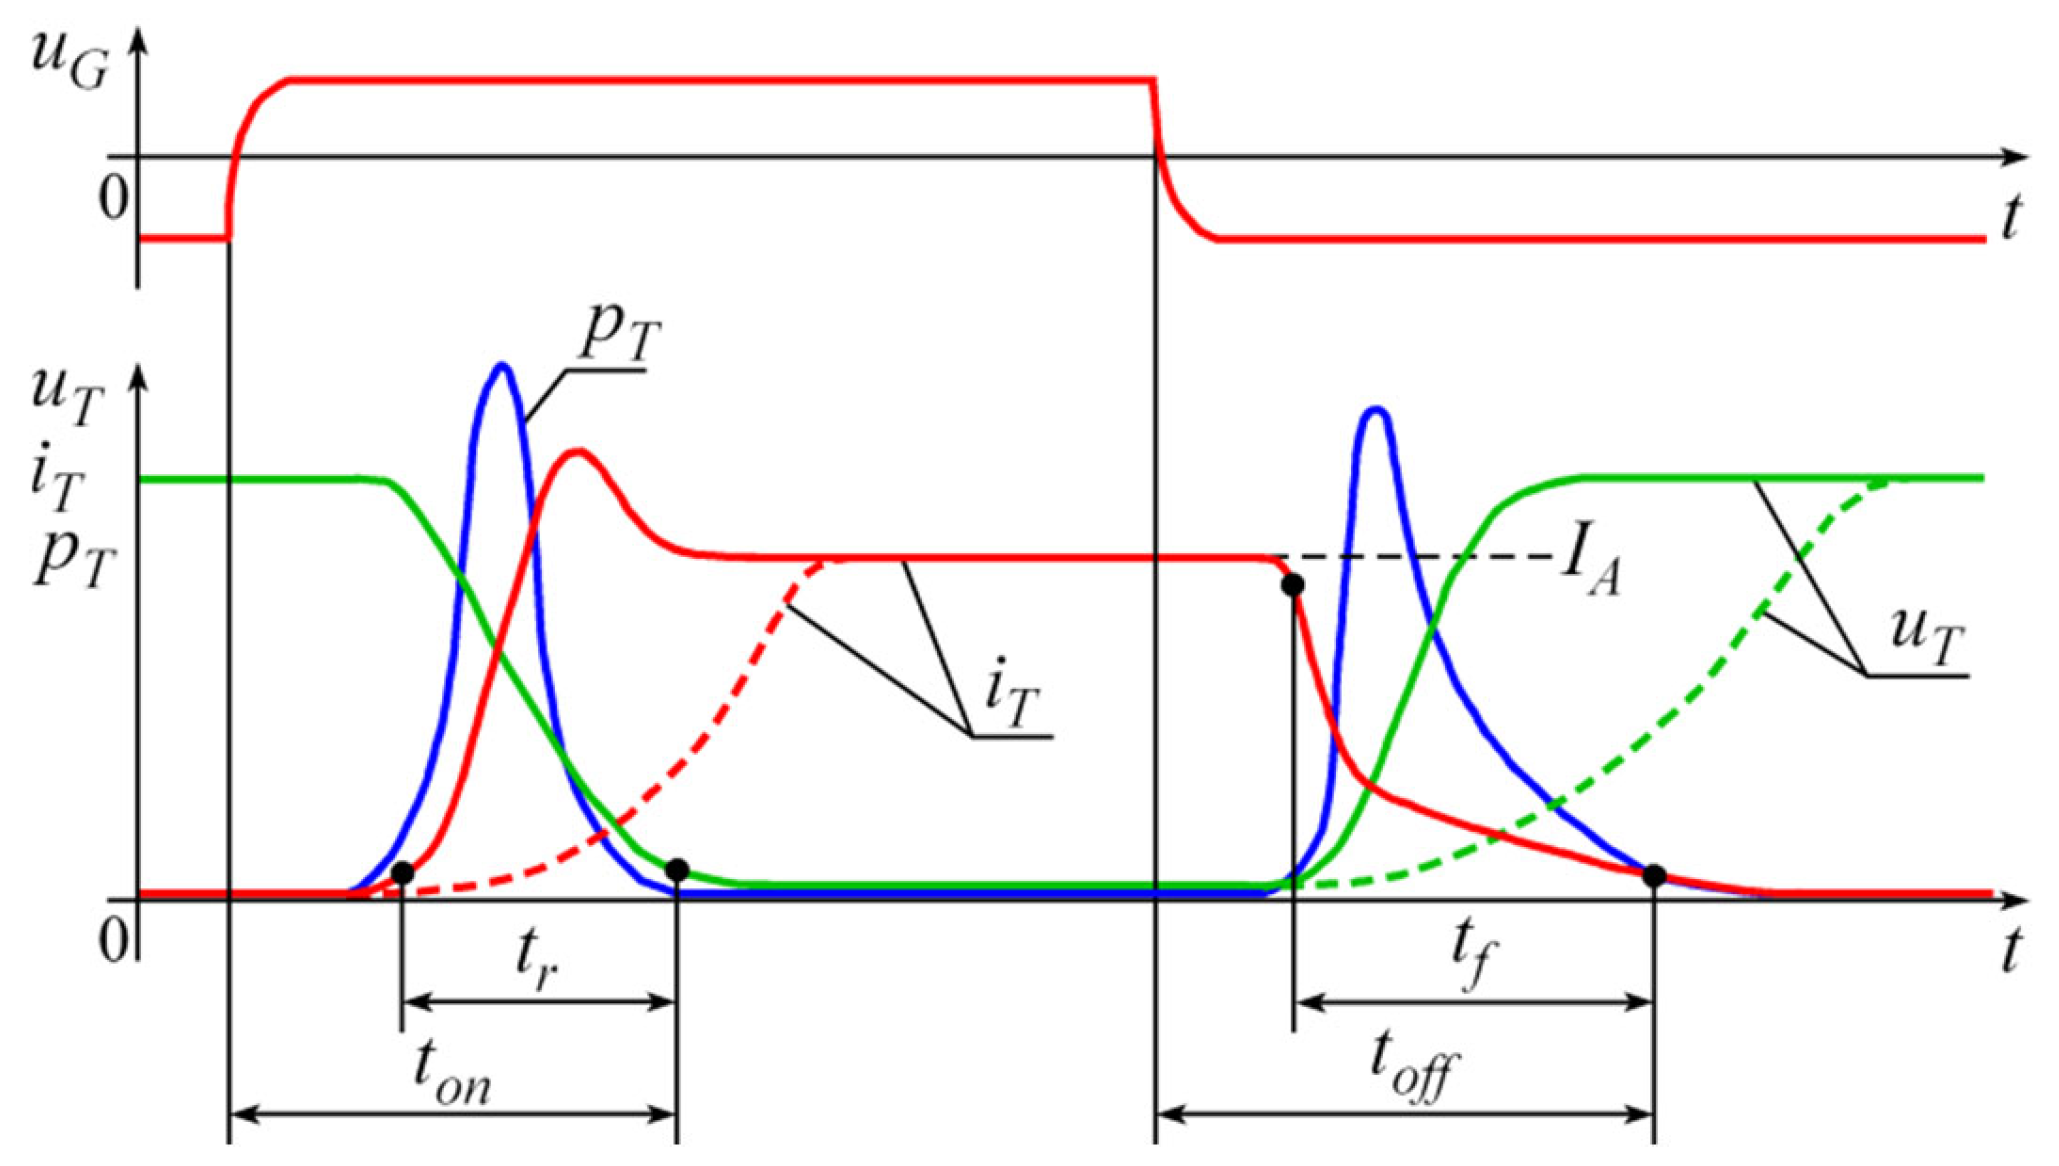
3.1. Power Losses in Inverters

The efficiency of the energy conversion systems mainly depends on the power losses in transistors and diodes of converters and losses in passive elements as inductors.
The total power losses in transistors are the sum of the conduction losses Pcon and the switching losses Psw. The first loss component can be expressed as follows:
P c o n = 1 T p 0 t c o n i T ( t ) u T s a t ( t ) d t
where Tp denotes the switching period, iT(t) is the transistor current, uTsat(t) is the transistor voltage drop during conduction, and tcon denotes the conduction time.
Both the transistor current and voltage do not change abruptly during switching processes. Therefore, average power losses can be determined as an integral of the product of these values. The switching losses should be determined separately:
P s w = 1 T p 0 t r i T r ( t ) u T r ( t ) d t + 0 t f i T f ( t ) u T f ( t ) d t
where uTr(t) and uTf(t) are the transistor voltages during the turn-on process and during the turn-off process, respectively; iTr(t) and iTf(t) denote the transistor current during the turn-on process and turn-off process, respectively; tr is the current rise time in the turn-on process; and tf denotes the current fall time in the turn-off process.
Similarly, as described previously, the power losses in diodes are the sum of the conduction losses and switching losses, which occur only during the turn-off process of diodes. The conduction losses in diodes are determined according to relationship (5), assuming uTsat(t) to be the voltage drop across the diode during a conduction state. Determining the losses during the turn-off process of the diode is quite problematic because the datasheets of diodes do not contain the time intervals when the reverse recovery current of the diode decreases from the maximum value Irrm to zero. Assuming that this time interval is approximately equal to half of the time trr, the switching losses PDrr in the diode can be estimated as follows:
P D r r = 1 4 f P I r r m U D C t r r
where fp is the switching frequency, Irrm denotes the maximum value of the reverse recovery current, UDC is the voltage of the DC source, and trr denotes the reverse recovery time.
Users of power electronic devices have no influence on the conduction losses of transistors and diodes, because they depend on the current and voltage drop across the transistor or diode during their conduction. However, the switching losses of transistors can be significantly reduced using soft-switching systems [11,12,13,14,15,16,17]. The switching losses of transistor can be significantly reduced if its current or voltage is close to zero during switching processes. The simplified voltage and current waveforms of the transistor during switching are shown in Figure 5.
Figure 6a shows the transistor voltage and current during the turn-on process. Notably, the transistor voltage decreases suddenly to zero while its current increases from zero slowly. During the turn-off process, the transistor current decreases suddenly to zero, whereas its voltage increases slowly (Figure 6b).

3.2. Voltage Source Inverter with the Soft-Switching Technique

In many soft-switching systems, each phase of the three-phase VSI is equipped with additional circuits containing two auxiliary transistors, one or two inductors, and two capacitors [11,13,14]. However, in most existing soft-switching systems, the capacitors are connected in parallel to the main transistors or the inductors are connected in series with the auxiliary transistors. This poses a risk of transistor damage when disturbances occur in the control system. An additional drawback of these systems is the complexity of the control algorithms because the main transistors are often turned on with a delay relative to the auxiliary transistors. This is troublesome when the VSI operates mainly with the pulse width modulation (PWM).
The system of the soft switching of transistors, which has no risk of an abrupt discharge of capacitors through the main transistors and no danger of interruption of the inductor current, was described in [40,41]. A certain inconvenience of this proposal was impact of the resonance processes associated with the soft switching of transistors on the output voltage of the VSI. Therefore, the soft-switching system was modified to avoid this drawback, and the control system was simplified to simultaneously switch on both the main and auxiliary transistors. The structure of the modified soft-switching solution is shown in Figure 7 [42].
The capacitors reduce the steepness of the voltage increase in the main transistors during the turn-off processes. The inductors connecting the main transistors to the load terminals limit the rate of current increase in these transistors during their turn-on processes. The resonant discharge current of the capacitors is limited by the inductors connected in series with the diodes. Additionally, the negative magnetic coupling between the inductors must be prioritized. This coupling helps to reduce the current of the inductors connected to the transistors to zero after they are turned off. Simplified waveforms of control signals and selected voltages and currents in the VSI with the modified soft-switching system are shown in Figure 8. Subsequent operation stages of the VSI with the soft-switching system are shown in Figure 9, where circuits with currents are marked by a bold red line.
Up to time t1, the current from the voltage source UDC flows to the load phase A through transistor T1; capacitor C1 is discharged (Figure 9a). Transistor T1 is turned off at time t1, and its voltage increases gradually from zero due to the charging of capacitor C1 (Figure 9b). The voltage of the main transistor T1 changes in the same manner as the voltage of capacitor C1; therefore, it can be assumed that the soft-switching process of transistor T1 has a soft character. The voltage of capacitor C1 reaches the supply voltage UDC at time t2.
In the time interval t2t3, capacitor C1 is charged to a voltage higher than UDC; diodes D1n and D2z begin to conduct and the current through capacitor C1 decreases (Figure 9c).
At time t3, the current of capacitor C1 is zero. The load current IA primarily flows from the negative clamp of the voltage source through diode D1n (Figure 9d). During the time interval t3t4, transistor T1 is in a nonconducting state, and the voltages of the individual elements in the inverter phase remain unchanged. The load current IA primarily flows from the negative clamp of the voltage source through diode D1n, and a relatively small current flows through inductor L2a, diode D2z, and inductor L1b.
Both the main transistor T1 and auxiliary transistor T1a are turned on at time t4, and diode D1s stops conducting (Figure 9e). The current in transistors T1 begin to gradually increase to the load current IA. It means that the main transistor T1 is turned on with a current close to zero. Therefore, it can be stated that the turn-on process of this transistor has a soft character. The turn-off losses of diode D1s can be neglected because it changes its operating state at a relatively low current. At time t4, capacitor C1 begins to discharge.
At time t5, the current of transistor T1 reaches the load current value IA, and diode D1n stops conducting (Figure 9f). This diode changes its operating state without losses because its current gradually decreases to zero during the interval t4t5. During the period t5t6, capacitor C1 continues to discharge. Due to the magnetic coupling between inductors L1b and L2a, a small current appears in circuits T1, L1b, and D1p, which decreases to zero at time t6.
In the time interval t6t7, only the load current IA flows through transistor T1, while capacitor C1 continues to discharge (Figure 9g). In the next time interval t7t8, the current of inductor L2a decreases to zero.
At time t8, the processes related to the soft-switching of the transistor T1 end. The soft-switching processes of the remaining transistors of the VSI proceed similarly. The switching losses of transistors are significantly reduced if the maximum voltage across the capacitors, and thus the main transistors, is twice the voltage UDC, although a significant reduction in switching losses is achieved even if this voltage is about 150% of UDC. The detailed description of the soft switching of transistors and the selection of transistors and reactive elements are discussed in detail in [42].
First tests of the soft-switching transistor were performed for the case where the laboratory VSI was supplied with a voltage of 400 V, and the maximum load current was 12 A. Measurements were conducted using a laboratory inverter with a squirrel cage induction motor (PN = 3 kW, UN = 230/400 V Δ/Y). Figure 10 shows selected current and voltage waveforms. As transistor T1 is turned off, capacitor C1 begins charging, and its voltage increases gradually from zero, with the transistor voltage following a similar pattern. After transistor T1 is turned ON, its voltage immediately decreases to zero, while its current gradually increases from zero. Simultaneously, transistor T1a is turned ON, and the resonant capacitor begins discharging.
The described soft-switching system has no capacitors connected in parallel to the main transistors and no inductors connected in series to the auxiliary transistors. Therefore, the capacitor discharges through the main transistors and abrupt interruptions in the inductor currents are eliminated. The soft-switching processes do not affect the shape of the phase voltage of the load. Additionally, the control system is significantly simplified because the auxiliary transistors are controlled by the same signal as the main transistors.

4. Cooperation Between the VSI with Soft Switching and the AC Grid

4.1. Converting Energy from the DC Circuit to the AC Grid

The investigation of cooperation between the VSI using the soft-switching system and the AC grid was carried out for two cases. In the first one, energy from the DC circuit was transmitted to the AC grid using the VSI. Such a case occurs in almost all systems generating energy from renewable sources, as well as when energy is transmitted from the storage battery to the AC grid. The second case was related to transmission energy from the AC grid to the DC circuit. It was assumed that the rms voltage of the AC grid was constant.
The tests of the cooperation between the VSI with the described soft-switching system and AC grid were performed according to the scheme shown in Figure 11. The VSI with a rated power of about 5 kW was connected to a real three-phase AC grid (400 V, 50 Hz) through a transformer, and the maximum voltage of the battery replacing the DC circuit was 240 V. The VSI using the soft-switching technique of IGBTs was controlled by a sinusoidal PWM, and the angle between the control signal and the voltage signal of the AC grid was changed in the range from −180 to +180 degrees. The laboratory energy conversion system is presented in Figure 12. Due to the prototype nature of the laboratory energy conversion system, the transistors and diodes of the VSI with the soft-switching technique were selected for a higher rated voltage and current than would be expected based on the supply and load conditions. The transformer connecting the VSI to the AC grid had a rated power of 10 kVA and voltage ratio of 180/400 V. Inductors were connected to the output terminals of the VSI.
Figure 13 shows the waveform when energy from the DC circuit was transmitted to the AC grid at switching frequency of 3 kHz, and Figure 14 presents analogous waveforms at a switching frequency of 6 kHz. The maximum voltage on the main transistor T1 is approximately twice as high as the voltage in the DC circuit, regardless of the switching frequency. In the intervals when transistor T1 is not switched, its maximum voltage is equal to the voltage of the DC circuit, and the voltage on the auxiliary transistor T1a is equal to zero. When transistor T1 is switched, the voltage on capacitor C1 changes from zero to the maximum value of the voltage on transistor T1 due to the resonance processes related to the soft switching of this transistor. If T1 is not switched, the voltage on capacitor C1 is equal to the voltage of the DC circuit.

4.2. Converting Energy from the AC Grid to the DC Circuit

In this case, energy was transmitted from the AC grid to the DC circuit, and the VSI operated as the transistor rectifier. This case occurs especially in energy generation systems with the PMSG, where the output voltage of the generator operating with variable speed is converted to the DC voltage. Figure 15 shows the waveform when energy from the AC grid was transmitted to the DC circuit at a switching frequency of 3 kHz, and Figure 16 presents analogous waveforms at a switching frequency of 6 kHz.
In this case, the nature of the voltage and current changes is qualitatively similar to the waveforms shown in Figure 13 and Figure 14. Laboratory tests were performed with a simplified control including the pulse width modulation. The shift angle of the control signal relative to the phase voltage of the AC grid and the modulation depth factor were set for various switching frequencies from 1 kHz to 6 kHz. These tests confirmed that the VSI with the soft-switching system cooperates correctly with the AC grid, regardless of the direction of energy flow. When designing a medium- or high-power energy conversion system, it is advisable to use the so-called vector control method, which allows us to set amount of the active and reactive power transmitted to the AC grid.
Based on the laboratory measurements of input and output current and voltages, the efficiency of the prototype VSI with soft-switching technique was determined for energy conversion from the DC circuit to the AC grid and vice versa (Table 1). The efficiency analysis was performed for switching frequencies of 3 kHz and 6 kHz; it was assumed that the coefficient k, which denotes the multiple of the maximum voltage on the main transistors relative to the DC voltage, was equal to 2.0.
It should be noted that due to the prototype nature of the laboratory energy conversion system, transistors with higher rated voltages were used than required by the power supply and load conditions. Therefore, the conduction and switching losses of the transistors are certainly higher than those of the components selected for the actual voltages and currents.
In order to compare the efficiency of the voltage source inverter with the described soft switching technique, it would be necessary to construct two voltage source inverters in SiC-MOSFET technology of the same rated power. The aim of the prototype energy conversion system based on IGBTs was to validate the correctness of the cooperation between the inverter with the soft switching technique and the AC grid for both directions of the energy transmission. The measured efficiencies of voltage source inverters with a rated power close to 5 kW are in the range of about 94% to 97% [15,16]. However, all efficiencies refer to inverters made using SiC-MOSFETs, which have much shorter switching times than IGBTs.

5. Efficiency of Energy Conversion Systems Using the VSI with the Soft-Switching Technique

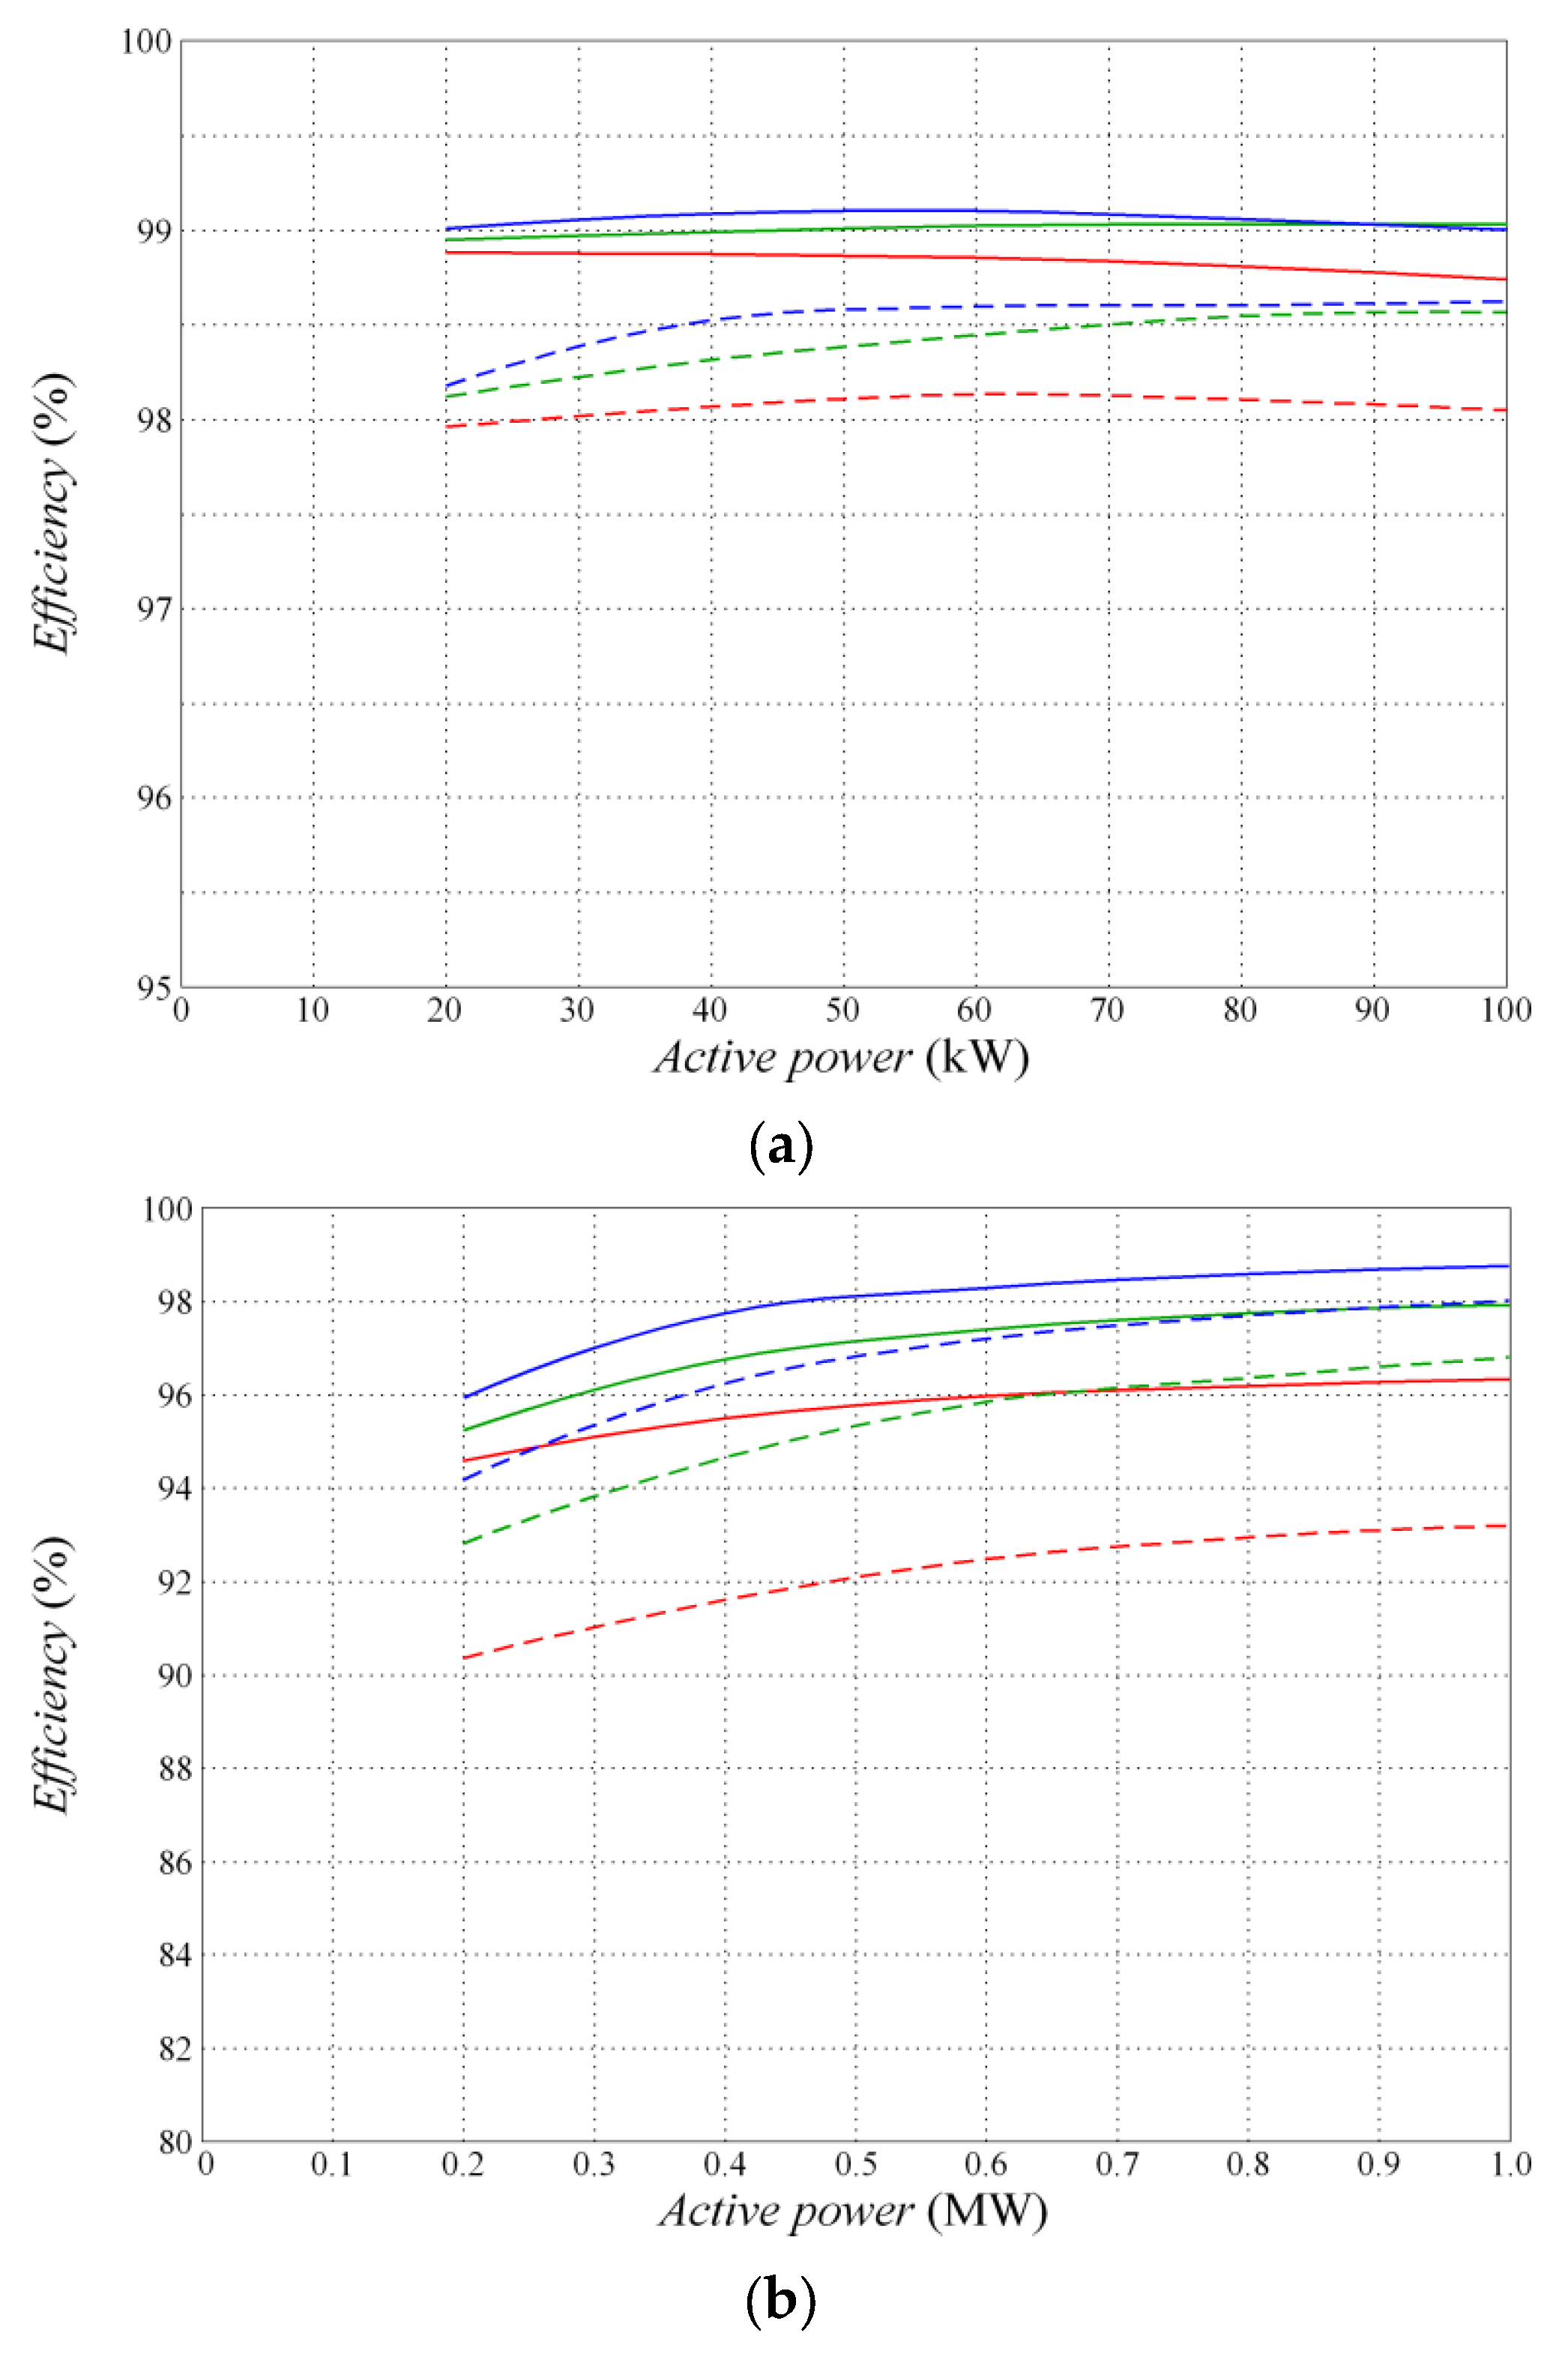
5.1. Efficiency of the Energy Conversion System in Photovoltaic Plants

The efficiency of the energy conversion systems using the VSI with the soft-switching technique was estimated for two rated powers of 100 kW and 1 MW. In the first case, the VSI was based on SiC-MOSFETs [43], and the efficiency calculations were performed for two switching frequencies of 20 kHz and 40 kHz. The 1 MW inverter contained IGBTs, and operated at switching frequencies of 2 kHz and 4 kHz. The efficiencies were determined for several values of the power transmitted to the AC grid. It was assumed that the maximum voltage on the main transistors of the VSI using the soft-switching technique cannot be higher than 1.5 UDC or 2.0 UDC. For the same switching frequencies, the efficiency of the energy conversion systems with the VSI using the hard-switching technique was estimated.
When estimating the efficiency, it was assumed that the “classical” DC/DC boost converter was used in the energy conversion system, the efficiency of which can be about 98% at the rated power. As presented in [44,45,46,47], its efficiency depends not only on the converted power but also on differences between both the input and output voltages of this converter. As mentioned in Section 2.1, the “classical” DC/DC boost converters can be replaced by the Z-source inverters, which have no transistors. However, their use requires a change in the control algorithm of the VSI, and the Z-source inverters can be used for one set of photovoltaic panels. Notably, the efficiency of the entire energy conversion system depends on the efficiency of the transformer connecting the VSI to the AC grid, because at the assumed rated powers, transformer-less systems are not used. Transformer efficiencies for the assumed powers range from 98.0% to 99.5% and depend significantly on a transformer cooling method.
Power losses were calculated separately for each element of the considered VSI as the integral of the product of both the current and voltage of the element. For the 100 kW inverter (450 V, 220 A), SiC-MOSFETs rated at 1.7 kV and 600 A (FMF600DXE-34BN) and diodes rated at 3.5 kV and 720 A, with a forward voltage of 1.9 V at 450 A (D721S) were used. For the 1 MW inverter (1400 V, 715 A), IGBTs rated at 4.5 kV and 1500 A (CM1500HC-90XA) and diodes rated at 4.5 kV and 1970 A, with a forward voltage of 2.8 V at 1.5 kA (5SDF 20L45) were applied. The parameters of the transistors are listed in Table 2 and Table 3.
In the estimation of efficiencies, the model of SiC-MOSFETs presented in [48] was used; this model can be applied for high frequency applications. In calculations concerning the 1 MW system, the IGBT model described in [49] was used. This model allows us to consider, among others, the nonlinear properties of the IGBTs. Numerical calculations regarding the efficiency of energy conversion systems were performed using ICAP/4 V8.1.11 software. The control system of the VSI was based on the direct power control method, which allows us to set instantaneous active and reactive power values. Inductors were modeled as a series connection of a resistor reflecting the winding resistance and inductance; capacitors were assumed as ideal elements (lossless, without parasitic parameters). In the estimation of the efficiencies, the switching and conduction losses of transistors, the conduction and turn-off losses of diodes, and the losses of the inductors were included in the consideration. It was assumed that inductors were coreless, and on this basis, the number of turns was determined. In real systems, inductors with ferrite cores should be applied. Although hysteresis losses occur then, the number of turns is much smaller, which leads to a reduction in resistive power losses. The power losses of capacitors were not included in the efficiency analysis.
The parameters of the passive elements of the VSI with the soft-switching technique are listed in Table 4.
Notably, SiC-MOSFETs have much shorter switching times than IGBTs; however, they have a forward voltage drop that is higher by about 1 V in comparison to IGBTs, which results in higher conduction losses in SiC-MOSFETs. The efficiency of the DC/DC boost converter depends on the current, switching frequency, and voltage difference between the input and output of this converter. For the DC/DC boost converter shown in Figure 1, the efficiency is about 97%. However, the efficiency of different modified DC/DC converters can reach 98%, and in some operating conditions, even 98.6% [45]. The selected waveforms of currents and voltages calculated for the 1 MW energy conversion system are presented in Figure 17.
Numerical calculations and laboratory measurement show that the processes related to the soft switching of transistors do not negatively affect the shape of the voltage and current flowing from the energy conversion system to the AC grid.
The efficiency of the energy conversion system equipped with the VSI with the soft-switching technique were compared to those with the VSI using the hard-switching technique. It was assumed that the switching frequency of the DC/DC boost converter was the same as the switching frequency of the VSI. The efficiencies of the energy conversion system in photovoltaic plants are shown in Table 5 and Table 6. The dependences of the particular efficiency on the output power are presented in Figure 18, Figure 19 and Figure 20.
Figure 18 shows the efficiency of the VSI as function of the power transmitted to the AC grid. The efficiency of the system using the VSI with the hard-switching technique was compared with the efficiency of the systems with the VSI using the soft switching of transistors. It was assumed that the coefficient k determining multiple of the maximum voltage on the main transistors with respect to the DC voltage was equal to 1.5 or 2.0.
Figure 19 presents the efficiency of the photovoltaic energy conversion systems comprising the DC/DC boost converter. Similarly, as described previously, the efficiencies were estimated for two rated powers and two switching frequencies.
In some cases, the VSI connecting the energy conversion system to the AC grid must operate as a transistor rectifier. This is necessary if the energy storage connected to the DC circuit must be charged from the AC grid. Figure 20 shows the efficiency of the VSI when converting energy from the AC grid to the DC circuit. Notably, the efficiencies for both directions of energy transmission differ quite significantly.
The use of the VSI with the soft-switching technique does not significantly increase the efficiency for the 100 kW energy conversion system, because the efficiency increase is about 0.3% at a switching frequency of 20 kHz and about 0.5% at 40 kHz. However, for the 1 MW system, the increase in the efficiency is significant and amounts to about 2.5% at a switching frequency of 2 kHz and about 5% at 4 kHz.
In energy conversion systems from renewable sources, attention should be paid to the content of higher harmonics in the current flowing to the AC grid. Table 7 shows the coefficients of the total harmonic distortion (THD) for the VSI operating with and without the soft-switching technique.
The THD coefficient in the phase current of the VSI with the soft-switching system is more than 1% higher than for the VSI with hard-switching technique at a switching frequency of 2 kHz. The differences between these coefficients decrease with an increase in the switching frequency. With some simplification, the IEEE standard 519 specifies a level of 5% for current distortion limits for systems rated 120 V–69 kV for the most critical conditions. To meet this condition, the switching frequency can be increased, but this may be problematic for systems with a rated power of several MW. Alternatively, additional inductors connected to the transformer coupling the energy conversion system with the AC grid can be used.

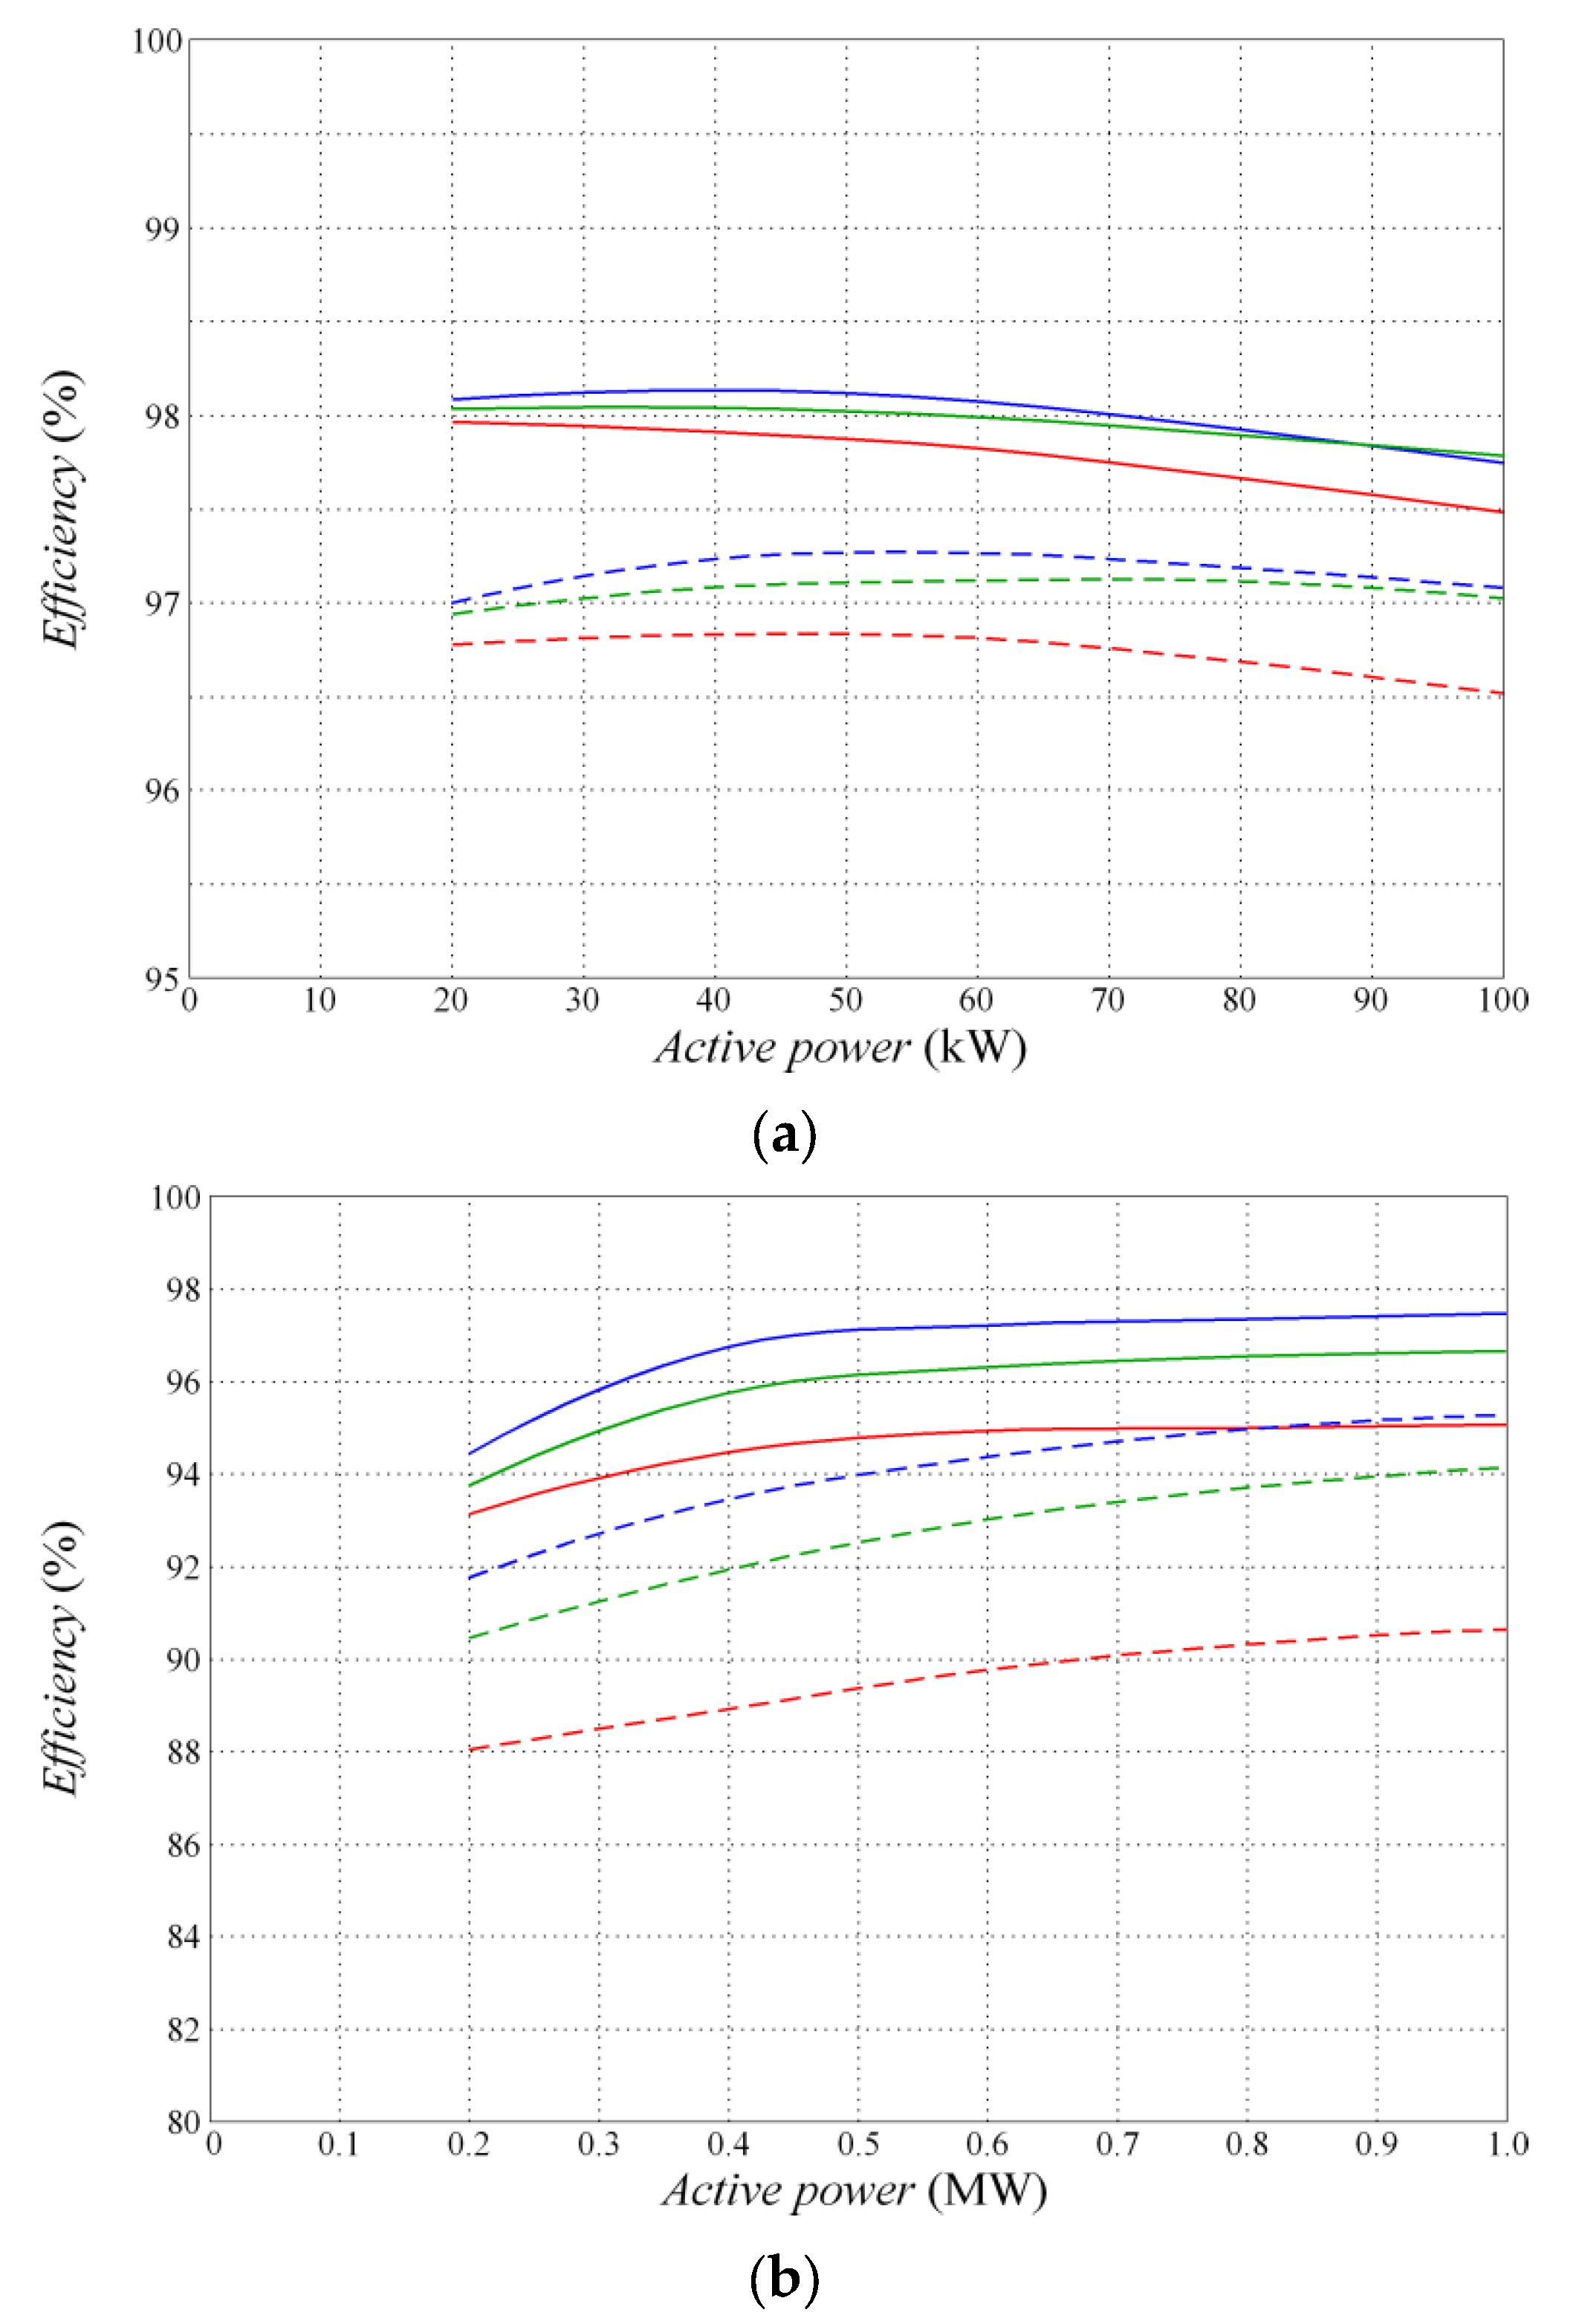
5.2. Efficiency of the Energy Conversion System with the PMSG

The efficiency of the energy conversion systems generated by the PMSG was estimated for the two cases described in Section 2.2. In the case shown in Figure 2, only the diode conduction losses were taken into account owing to a relatively low frequency of the output voltage of the PMSG. The efficiency of the DC/DC boost converter was assumed at the level of 98%, as described previously. The efficiencies of the energy conversion system with the PMSG are listed in Table 8 and Table 9. The dependences of efficiency on the output power are shown in Figure 21 and Figure 22. Since the rotational speed of the PMSG can vary within a wide range due to changes in the wind speed, the efficiency of the transistor rectifier depends on the output voltage of this generator, which should be considered at design stage.
In the second case (Figure 3), the output voltage of the PMSG is converted into DC voltage using a transistor rectifier, which has the ability to increase the DC voltage. The transistor rectifier has the same structure as the VSI connecting the energy conversion system to the AC grid, and the rectifier switching frequencies are the same as for the VSI.
In energy conversion systems with the PMSG and the DC/DC boost converter, the increase in the efficiency is not too large at 100 kW. However, for 1 MW, the increase in efficiency is from 3% to about 5%. If the transistor rectifier is used in the systems with PMSG, the increase in efficiency ranges from about 1% for 100 kW to almost 10% at 1 MW.

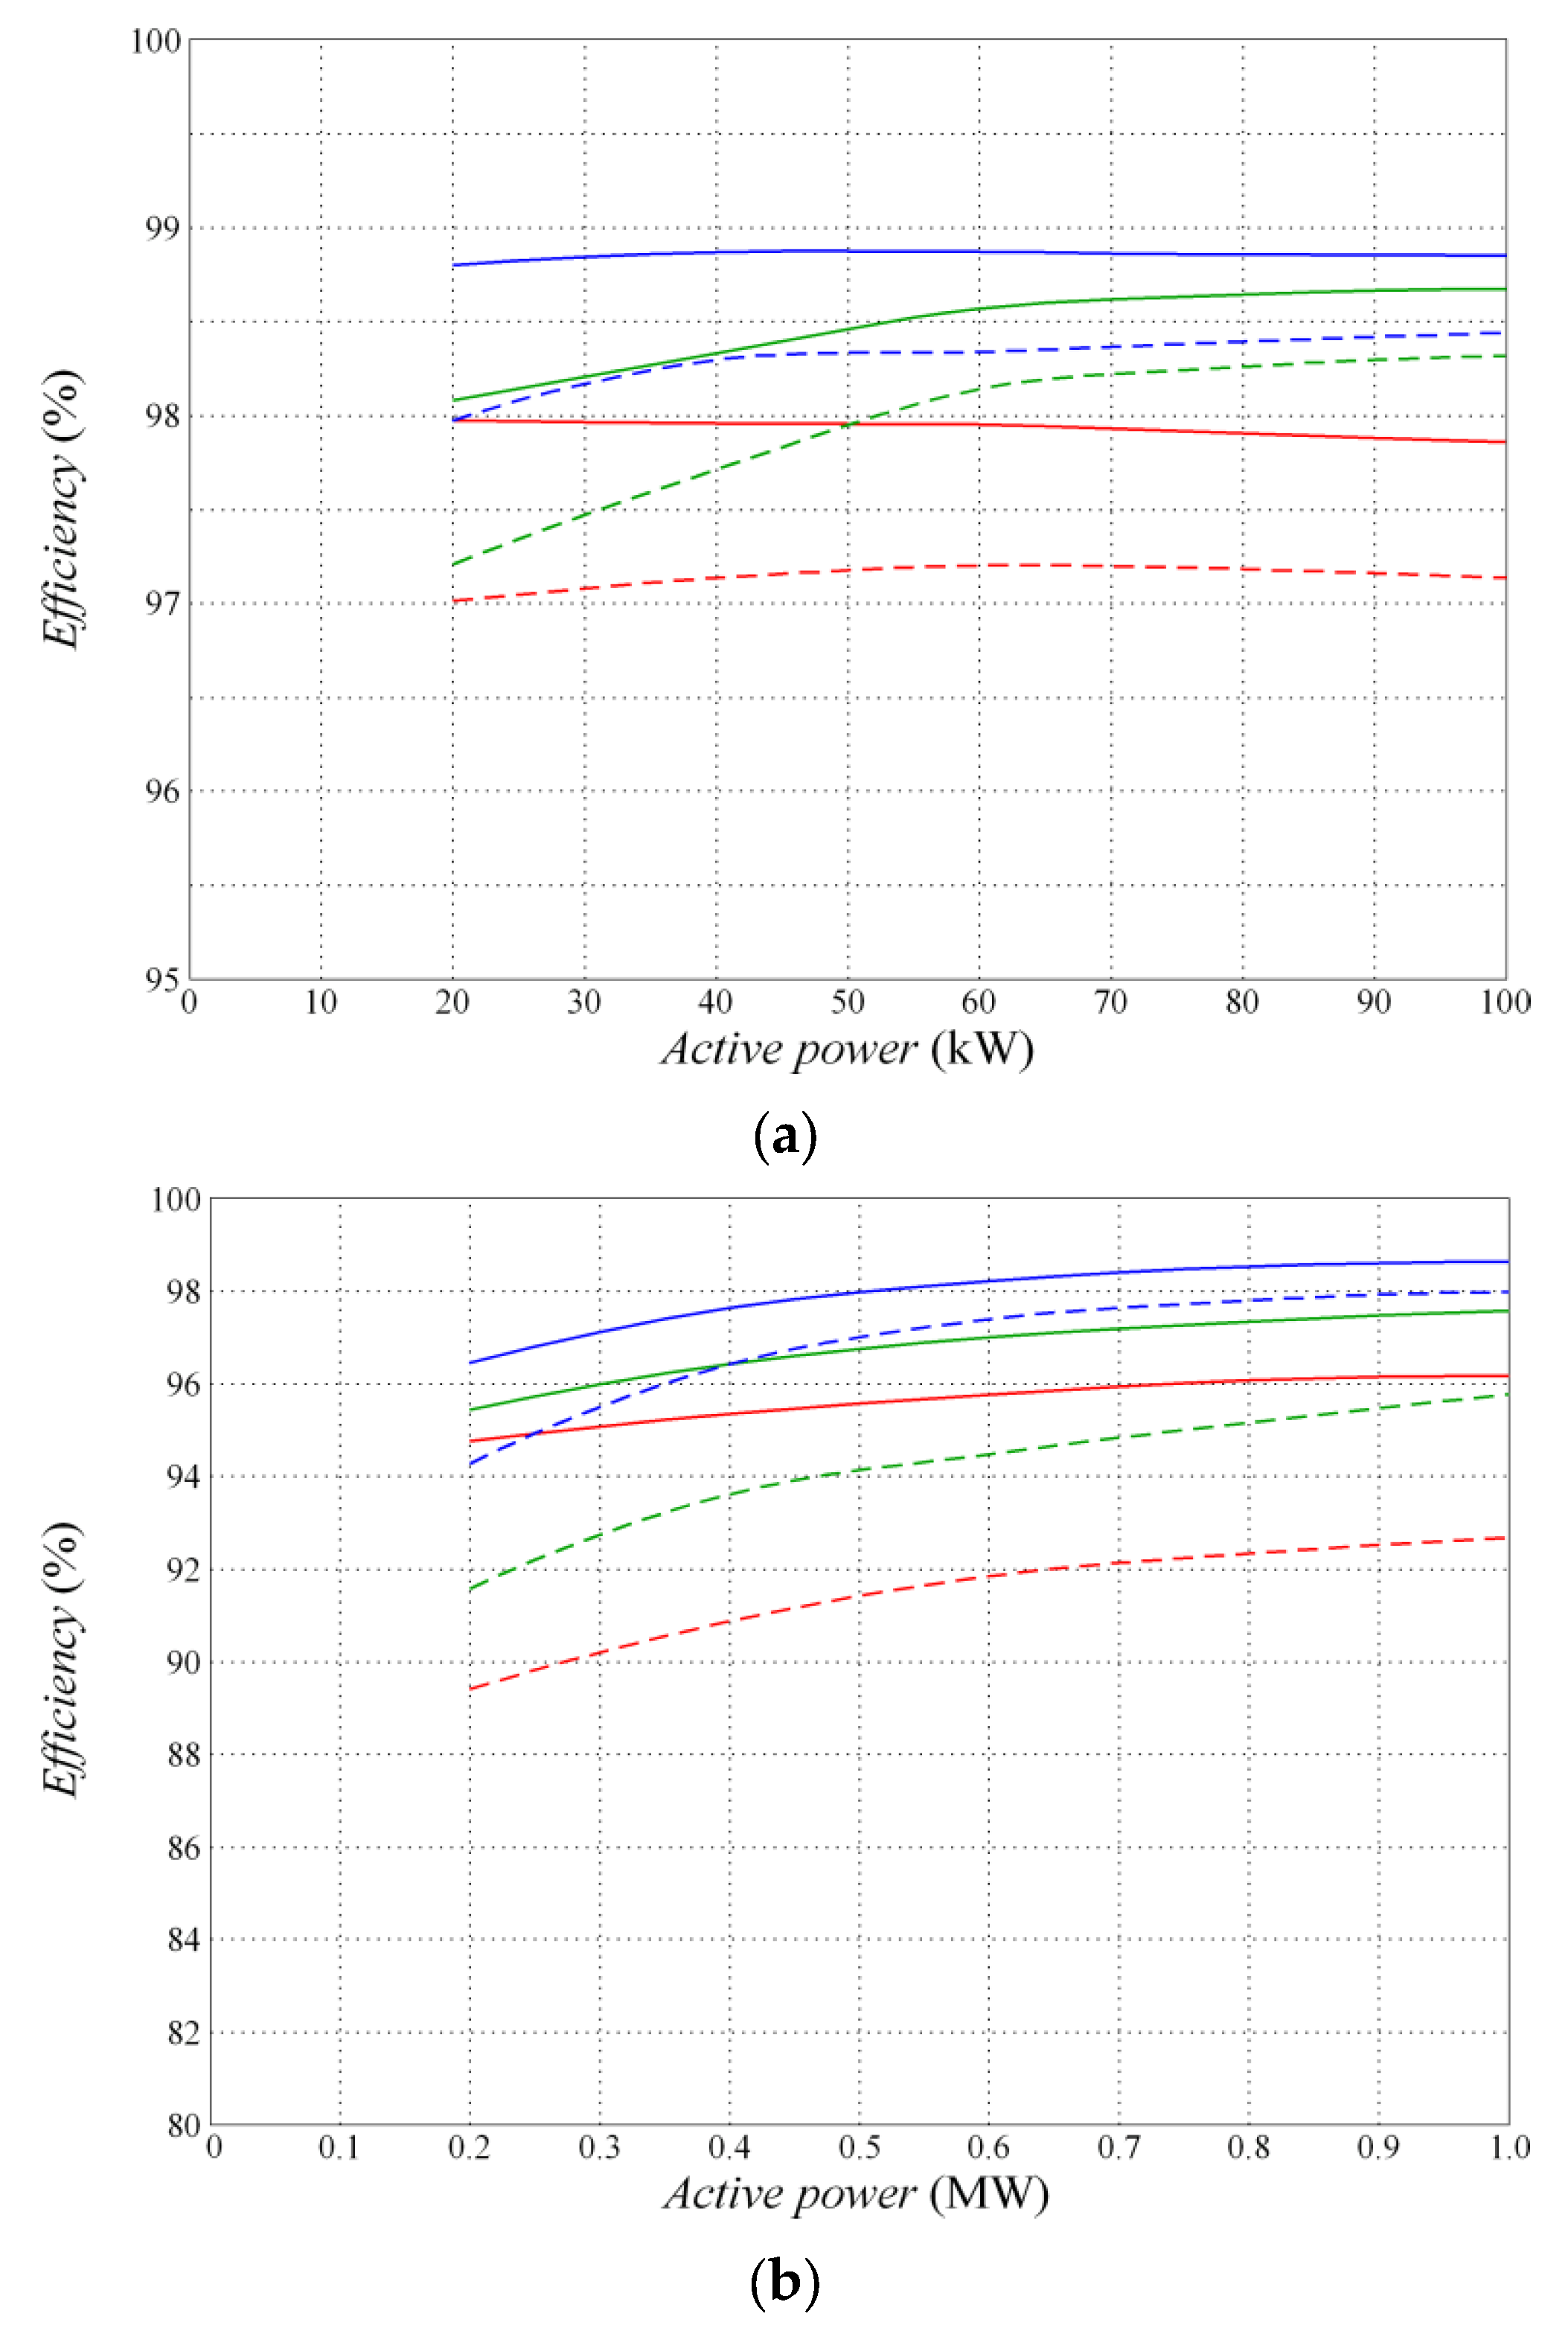
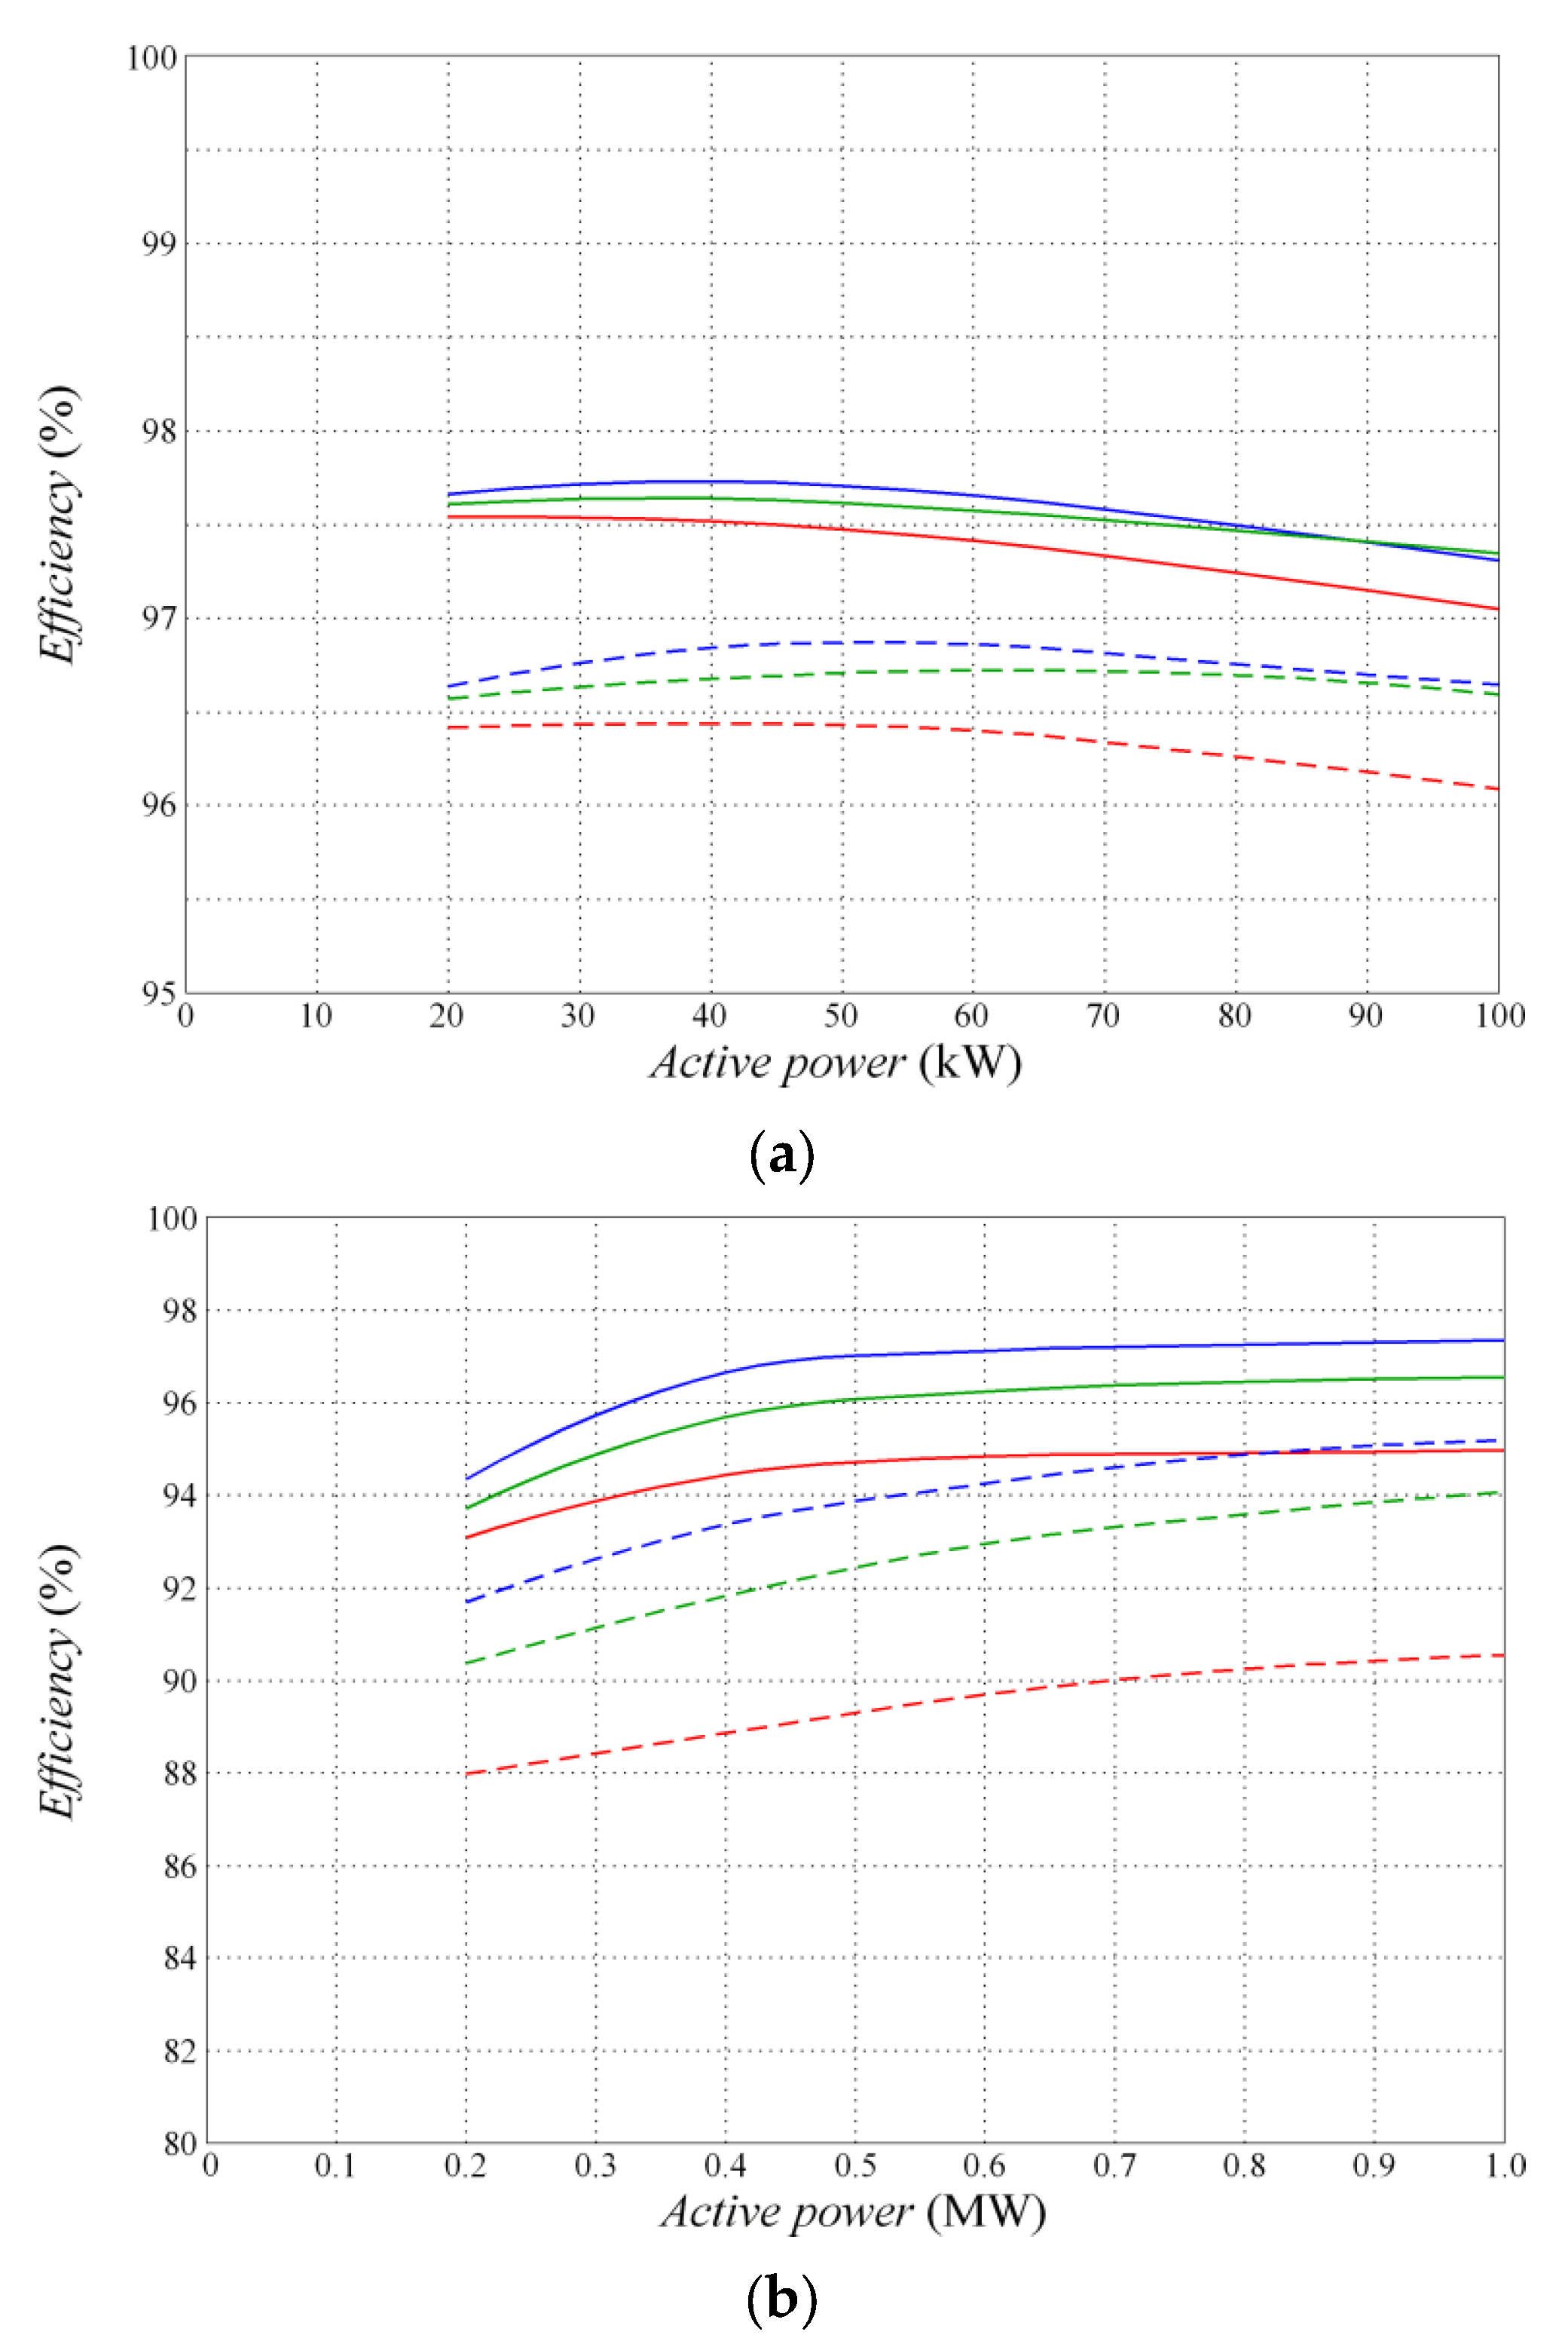
5.3. Efficiency of Energy Conversion Systems with the DFIG and SCIG

The control method of the DFIG is implemented in the rotor circuit, which contains the transistor rectifier and the VSI connected to one of the secondary windings of the three-phase transformer (Figure 4). Since a maximum 30% of the power generated by DFIG can be transmitted through the rotor circuit, the use of VSIs with the soft-switching technique gives a significantly smaller increase in system efficiency. For example, if the power transmitted by the rotor circuit is 30% of the power generated by the DFIG, then assuming the same transistor rectifier and the VSI as for the system with PMSG, the efficiency would increase by about 2% compared to the energy conversion system using inverters with the hard-switching technique.
In the energy conversion system with the SCIG, two converters are used, similarly to the system with the PMSG (Figure 3). However, the control algorithm of the transistor rectifier connected to the SCIG is different than for the PMSG due to the need to generate a rotating magnetic field in the SCIG.

5.4. Power Losses in the Energy Conversion System During Reactive Power Transmission

Sometimes it is necessary to send reactive power to the AC grid, and this is determined by a AC grid manager; this applies to high-power systems. In such cases, determining the efficiency of the energy conversion system does not make sense. If only reactive power has to be transmitted to the AC grid, it is advisable to determine the losses only in the VSI and possibly in the transformer coupling the VSI to the medium-voltage AC grid. Table 10 shows the power losses in the VSI using the soft-switching system and the losses in the VSI with the hard-switching technique for two values of reactive power transmitted to the AC grid.
Notably, often the reactive power is sent to the AC grid together with the active power at an assumed power factor. This applies especially to high-power energy generation systems. The amount of reactive power transmitted to the AC grid is often determined by the power system manager. However, the transmission of the reactive power from photovoltaic systems is rather an exceptional situation.

5.5. Cost and Reliability Analyses of the Energy Conversion System

The use of the VSIs with the soft switching technique in energy conversion systems requires a cost analysis and an assessment of the operational reliability. One of the essential factors in a cost analysis is an increase in the efficiency of the energy conversion system. On the one hand, the analysis should take into account the costs of transistors, diodes, passive components, auxiliary transistor drivers, additional monitoring systems, design issues, etc. On the other hand, electricity prices are important. Taking into account the current prices of additional components of the VSIs with soft-switching technique, average electricity prices, and efficiency increases, it is not recommended to modify energy conversion systems with a rated power up to 100 kW. However, for systems with a rated power of several MW or more, the use of VSIs with the soft-switching technique can bring real benefits, as the costs of modifying the system can be paid back after a period of four to six years.
The application of VSIs with the soft-switching system does not require significant changes in the basic control system because the auxiliary transistors are controlled simultaneously with the main transistors. Resonant processes associated with the soft switching of transistors do not affect the output voltages of the VSI, which have a similar shape to those of the VSI with the hard-switching technique. The role of the inductors connected to the main transistors is to limit the rate of current increase in these transistors after they are switched on. This is important in the case of possible short circuits, because the time available to turn-off the transistor is longer.

6. Conclusions

Laboratory tests and numerical analyses confirmed the correct cooperation of the VSI using the soft-switching technique with the AC grid, regardless of the direction of energy transmission. The application of the VSI with the soft switching of transistors improves the efficiency of energy conversion systems from renewable sources in comparison to those using VSIs with the hard-switching technique. Efficiency differences are greater the higher the power transmitted to the AC grid is.
The correct operation of the VSI with soft-switching technique requires the maximum voltage on the main transistors to be twice the DC voltage. However, a significant increase in efficiency can be obtained even when this voltage is 150% of the DC voltage. At power of 1 MW, the increase in efficiency is even 9% higher compared to the VSI with the hard-switching technique. This applies primarily to the energy conversion systems with the PMSG and the transistor rectifiers.
The estimated increase in efficiency for systems with a rated power of 100 kW fluctuates around 1%. Therefore, an application of the voltage source inverters with the described soft-switching technique in energy conversion systems with such or lower rated powers is not recommended. In such systems, SiC-MOSFETs are currently used, which have shorter switching times compared to IGBTs. However, the increase in efficiency for systems with rated power above 1 MW is several percent, which should be a significant incentive to use voltage source inverters with the soft switching technique in large photovoltaic farms and wind plants.
A further increase in the efficiency of energy conversion systems can be achieved using DC/DC boost converters with a soft-switching technique. This applies to energy conversion systems in photovoltaic plants, especially since an energy storage device quite often is connected to the DC circuit.

Author Contributions

Conceptualization, W.M. and Z.S.; methodology, W.M. and Z.S.; software, Z.S.; validation, W.M. and Z.S.; formal analysis, W.M. and Z.S.; investigation, W.M. and Z.S.; resources, W.M.; data curation, Z.S.; writing—original draft preparation, W.M.; writing—review and editing, W.M. and Z.S.; visualization, Z.S. All authors have read and agreed to the published version of the manuscript.

Funding

This research was funded by the Polish Ministry of Science and Higher Education and performed by the Department of Electrical Engineering of Cracow University of Technology.

Data Availability Statement

The original contributions presented in this study are included in the article. Further inquiries can be directed to the corresponding author.

Conflicts of Interest

The authors declare no conflicts of interest.

References

  1. Puchalapalli, S.; Singh, B. A novel control scheme for wind turbine driven DFIG interfaced to utility grid. IEEE Trans. Ind. Appl. 2020, 56, 2925–2937. [Google Scholar] [CrossRef]
  2. Hu, Y.; Chau, T.K.; Zhang, X.; Iu, H.H.C.; Fernando, T.; Fa, D. A novel adaptive model predictive control strategy for DFIG wind turbine with parameter variations in complex power systems. IEEE Trans. Power Syst. 2023, 38, 4582–4592. [Google Scholar] [CrossRef]
  3. Hussain, H.A.; Loncarski, J.; Ristic, I.B.; Bellini, A. DFIG-based WECS with partial-scale converter: Efficiency, cost, and volume comparison of SiC-based and IGBT-based converter solution. IEEE Access 2024, 12, 89908–89920. [Google Scholar] [CrossRef]
  4. Alnasir, Z.; Kazerani, M. Standalone SCIG-Based Wind Energy Conversion System Using Z-Source Inverter with Energy Storage Integration. In Proceedings of the IEEE 27th Canadian Conference on Electrical and Computer Engineering (CCECE), Toronto, Canada, 4–7 May 2014. [Google Scholar] [CrossRef]
  5. Majout, B.; Alami, H.; Salime, H.; Laabidine, N.Z.; Mourabit, Y.E.; Motahhir, S.; Bouderbala, M.; Karim, M.; Bossoufi, B. A review on popular control applications in wind energy conversion system based on permanent magnet generator PMSG. Energies 2022, 15, 6238. [Google Scholar] [CrossRef]
  6. Prince, M.K.K.; Arif, M.T.; Gargoom, A.; Oo, A.M.T.; Haque, M.E. Modeling, parameter measurement, and control of PMSG-based grid-connected wind energy conversion system. J. Mod. Power Syst. Clean Energy 2021, 9, 1054–1065. [Google Scholar] [CrossRef]
  7. Kolantla, D.; Mikkili, S.; Pendem, S.R.; Desai, A. Critical review on various inverter topologies for PV system architectures. IET Renew. Power Gener. 2020, 14, 3418–3438. [Google Scholar] [CrossRef]
  8. Salam, Z.; Rahman, A. Efficiency for Photovoltaic Inverter: A Technological Review. In Proceedings of the IEEE Conference on Energy Conversion (CENCON), Johor Bahru, Malaysia, 25–26 October 2021. [Google Scholar] [CrossRef]
  9. Laib, H.; Sakri, D.; Barra, K. Advanced topology for grid-connected photovoltaic system based PWM rectifier. Prz. Elektrotechniczny 2023, 4, 266–272. [Google Scholar] [CrossRef]
  10. Kalaiarasi, N.; Sivapriya, A.; Vishnuram, P.; Pushkarna, M.; Bajaj, M.; Kotb, H.; Alphonse, S. Performance evaluation of various Z-source inverter topologies for PV applications using AI-based MPPT techniques. Int. Trans. Electr. Energy Syst. 2023, 2023, 1134633. [Google Scholar] [CrossRef]
  11. Li, Y.; Lee, F.C.; Boroyevich, D. A three-phase soft-transition inverter with a novel control strategy for zero-current and near zero-voltage switching. IEEE Trans. Power Electr. 2001, 16, 710–723. [Google Scholar] [CrossRef]
  12. Pal, A.; Basu, K. A soft-switched high-frequency link single-stage three-phase inverter for grid integration of utility scale renewables. IEEE Trans. Power Electr. 2019, 34, 8513–8527. [Google Scholar] [CrossRef]
  13. Wang, Q.; Wang, Y. Research on a novel high-efficiency three-phase resonant pole soft-switching inverter. IEEE Trans. Power Electr. 2021, 36, 5845–5857. [Google Scholar] [CrossRef]
  14. Wang, Q.; Li, L.; Wang, Y. An efficient zero-voltage switching resonant pole inverter with high reliability. IEEE Trans. Circuits Syst. II Express Briefs 2023, 70, 156–160. [Google Scholar] [CrossRef]
  15. Liu, Y.; Xiao, H.; Hua, W.; Cheng, M. An Improved Zero-Switching-Loss Inverter with Low Conduction Loss. IEEE Trans. Power Electr. 2024, 39, 5913–5923. [Google Scholar] [CrossRef]
  16. Lu, H.; Wang, Q.; Chai, J.; Li, Y. Review of Three-phase soft switching inverters and challenges for motor drives. CES Trans. Electr. Mach. Syst. 2024, 8, 177–190. [Google Scholar] [CrossRef]
  17. Wang, Q.; He, J.; Wang, Y.; Bai, H. An efficient three-phase soft-switching inverter with simplified asymmetric single auxiliary circuit on each bridge arm for low-speed AC motor drive. IEEE Trans. Circuits Syst. I Regul. Pap. 2024, 71, 4388–4399. [Google Scholar] [CrossRef]
  18. Ayad, A.; Hanafiah, S.; Kennel, R. A Comparison of Quasi-Z-Source Inverter and Traditional Two-Stage Inverter for Photovoltaic Application. In International Exhibition and Conference for Power Electronics, Intelligent Motion, Renewable Energy and Energy Management, Proceedings of the PCIM Europe 2015, Nuremberg, Germany, 19–21 May 2015; Available online: https://ieeexplore.ieee.org/abstract/document/7149205 (accessed on 6 July 2015).
  19. Singh, B.; Jain, V. TOCF based control for optimum operation of a grid tied solar PV system. IEEE Trans. Energy Convers. 2020, 35, 1171–1181. [Google Scholar] [CrossRef]
  20. Pathak, G.; Singh, B.; Panigrahi, B.K. Multi-operational solar photovoltaic microgrid with synchronization, backup and power quality enhancement ability. e-Prime Adv. Electr. Eng. Electron. Energy 2023, 5, 100256. [Google Scholar] [CrossRef]
  21. Duong, T.D.; Nguyen, M.K.; Tran, T.T.; Vo, D.V.; Lim, Y.C.; Choi, J.H. Topology review of three-phase two-level transformerless photovoltaic inverters for common-mode voltage reduction. Energies 2022, 15, 3106. [Google Scholar] [CrossRef]
  22. Bradaschia, F.; Cavalcanti, M.C.; Ferraz, P.E.P.; Neves, F.A.S.; Santos, E.C.; da Silva, J.H.G.M. Modulation for three-phase transformerless Z-source inverter to reduce leakage currents in photovoltaic systems. IEEE Trans. Ind. Electr. 2011, 58, 5385–5395. [Google Scholar] [CrossRef]
  23. Ellabban, O.; Abu-Rub, H. Z-source inverter topology improvements review. IEEE Ind. Electron. M. 2016, 10, 6–24. [Google Scholar] [CrossRef]
  24. Espinoza-Trejo, D.R.; Castro, L.M.; Bárcenas, E.; Sánchez, J.P. Data-driven switch fault diagnosis for DC/DC boost converters in photovoltaic applications. IEEE Trans. Ind. Electron. 2024, 71, 1631–1640. [Google Scholar] [CrossRef]
  25. Hasirci, H.Y.; Vural, A.M. Power Converter Topologies for PMSG Based Wind Energy Systems: Packed U Cell Multilevel Inverter Simulation. In Proceedings of the 5th International Symposium on Multidisciplinary Studies and Innovative Technologies (ISMSIT), Ankara, Turkey, 21–23 October 2021. [Google Scholar] [CrossRef]
  26. Shahni, A.; Qazi, S.H.; Kaloi, G.S.; Ullah, R. Review on performance analysis of SCIG and PMSG-based wind energy conversion system systems. SSRG Inter. J. Electron. Commun. Eng. (SSRG-IJECE) 2019, 6, 1–10. [Google Scholar] [CrossRef]
  27. Ghaffarzadeh, H.; Mehrizi-Sani, A. Review of control techniques for wind energy systems. Energies 2020, 13, 6666. [Google Scholar] [CrossRef]
  28. Xue, T.; Lyu, J.; Wang, H.; Cai, X. A complete impedance model of a PMSG-based wind energy conversion system and its effect on the stability analysis of MMC-HVDC connected offshore wind farms. IEEE Trans. Energy Convers. 2021, 36, 3449–3461. [Google Scholar] [CrossRef]
  29. Yang, M.; Cai, X.; Wusiman, A.; Zhang, J.; Lyu, J. Distributed-diode-rectifiers-based offshore wind power MVDC direct-transmission system. IEEE Trans. Energy Convers. 2022, 37, 643–653. [Google Scholar] [CrossRef]
  30. Hamid, B.; Hussain, I.; Iqbal, S.J.; Singh, B.; Das, S.; Kumar, N. Optimal MPPT and BES control for grid-tied DFIG-based wind energy conversion system. IEEE Trans. Ind. Appl. 2022, 58, 7966–7977. [Google Scholar] [CrossRef]
  31. Das, S.; Singh, B. Enhanced control of DFIG based wind energy conversion system under unbalanced grid voltages using mixed generalized integrator. IEEE J. Emerg. Sel. Top. Ind. Electron. 2022, 3, 308–320. [Google Scholar] [CrossRef]
  32. Din, Z.; Zhang, J.; Xu, Z.; Zhang, Y.; Zhao, J. Low voltage and high voltage ride-through technologies for doubly fed induction generator system: Comprehensive review and future trends. IET Renew. Power Gener. 2021, 15, 614–630. [Google Scholar] [CrossRef]
  33. Chen, S.; Yao, J.; Pei, J.; Liu, Y.; Liu, R.; Huang, S. Transient stability analysis and improved control strategy for DC-link voltage of DFIG-based WT during LVRT. IEEE Trans. Energy Convers. 2022, 37, 880–891. [Google Scholar] [CrossRef]
  34. Zhou, Y.; Zhu, D.; Zou, X.; He, C.; Hu, J.; Kang, Y. Adaptive temporary frequency support for DFIG-based wind turbines. IEEE Trans. Energy Convers. 2023, 38, 1937–1947. [Google Scholar] [CrossRef]
  35. David, N.; Aliprantis, D.C. Improved Efficiency of DFIG Wind Energy Conversion Systems by Operating in the Rotor-Tied Configuration. In Proceedings of the International Conference on Electrical Machines (ICEM), Berlin, Germany, 2–5 September 2014. [Google Scholar] [CrossRef]
  36. Akanto, J.M.; Hazari, M.R.; Mannan, M.A. LVRT and stability enhancement of grid-tied wind farm using DFIG-based wind turbine. Appl. Syst. Innov. 2021, 4, 33. [Google Scholar] [CrossRef]
  37. Hamid, C.; Aziz, D.; Zamzoum, O.; Idrissi, A.E. Robust control system for DFIG-based WECS and energy storage in reel wind conditions. EAI Endorsed Trans. Energy Web 2024, 11, 1–6. [Google Scholar] [CrossRef]
  38. Sotoudeh, A.; Rezaei, M.M. An adaptive control strategy for grid-forming of SCIG-based wind energy conversion systems. Energy Rep. 2023, 10, 114–122. [Google Scholar] [CrossRef]
  39. Standard CSN EN 50530; Overall Efficiency of Grid Connected Photovoltaic Inverters. European Standards: Brussels, Belgium, 2010.
  40. Mazgaj, W.; Rozegnal, B.; Szular, Z. Proposal of a New Soft Switching System for Three-Phase Voltage Source Inverters. In Proceedings of the 19th European Conference on Power Electronics and Applications (EPE’17 ECCE Europe), Warsaw, Poland, 11–14 September 2017. [Google Scholar] [CrossRef]
  41. Mazgaj, W.; Szular, Z.; Rozegnal, B. Soft-switching system with safe connections of capacitors and inductors in three-phase two-level voltage source inverter. IEEE Trans. Power Electr. 2021, 36, 6443–6456. [Google Scholar] [CrossRef]
  42. Mazgaj, W.; Szular, Z. Modified soft-switching system with safe connections of capacitors and inductors in three-phase voltage source inverter. IEEE Trans. Power Electr. 2025, 40, 1797–1812. [Google Scholar] [CrossRef]
  43. Yuan, X.; Laird, I.; Walde, S. Opportunities, challenges, and potential solutions in the application of fast-switching SiC power devices and converters. IEEE Trans. Power Electr. 2021, 36, 3925–3945. [Google Scholar] [CrossRef]
  44. Cetin, S. Power-factor-corrected and fully soft-switched PWM boost converter. IEEE Trans. Ind. Appl. 2018, 54, 3508–3517. [Google Scholar] [CrossRef]
  45. Mondzik, A.; Stala, R.; Piróg, S.; Penczek, A.; Gucwa, P.; Szarek, M. High efficiency DC–DC boost converter with passive snubber and reduced switching losses. IEEE Trans. Ind. Electr. 2022, 69, 2500–2510. [Google Scholar] [CrossRef]
  46. Abbasian, S.; Gohari, H.S.; Farsijani, M.; Abbaszadeh, K.; Hafezi, H.; Filizadeh, S. Single-switch resonant soft-switching ultra-high gain DC-DC converter with continuous input current. IEEE Access 2022, 10, 33482–33491. [Google Scholar] [CrossRef]
  47. Marangalu, M.G.; Kurdkandi, N.V.; Alavi, P.; Khadem, S.; Tarzamni, H.; Mehrizi-Sani, A. A new single DC source five-level boost inverter applicable to grid-tied systems. IEEE Access 2023, 11, 24112–24127. [Google Scholar] [CrossRef]
  48. Li, X.; Jiang, J.; Huang, A.Q.; Guo, S.; Deng, X.; Zhang, B. A SiC power MOSFET loss model suitable for high-frequency applications. IEEE Trans. Ind. Appl. 2017, 64, 8268–8276. [Google Scholar] [CrossRef]
  49. Chimento, F.; Mora, N.; Bellini, M.; Stevanovic, I.; Tomarchio, S. A Simplified Spice Based IGBT Model for Power Electronics Modules Evaluation. In Proceedings of the 37th Annual Conference of the IEEE Industrial Electronics Society, Melbourne, VIC, Australia, 7–10 November 2011. [Google Scholar] [CrossRef]
Figure 1. Energy conversion system with a DC/DC boost converter in photovoltaic plants.
Energies 18 03474 g001
Figure 2. Conversion system of energy generated by a PMSG with a diode rectifier and DC/DC boost converter.
Energies 18 03474 g002
Figure 3. Conversion system of energy generated by a PMSG with a transistor rectifier.
Energies 18 03474 g003
Figure 4. Energy conversion system with a double-fed induction generator.
Energies 18 03474 g004
Figure 5. Simplified waveforms during switching processes: uG—control signal of the transistor; uT and iT—transistor voltage and current, respectively; pT—power losses in switching processes; IA—load current; and dashed lines—changes in the transistor current and voltage during the soft-switching processes.
Energies 18 03474 g005
Figure 6. Voltage and current of type IRG4PH50KD IGBT (1200 V, 24 A) (a) during the turn-on process and (b) during the turn-off process.
Energies 18 03474 g006
Figure 7. One phase of a soft-switching system in a three-phase VSI; M represents a magnetic coupling.
Energies 18 03474 g007
Figure 8. Simplified waveforms in one phase of a soft-switching system: GT1 and GT1a—control signals of transistors T1 and T1a, respectively; uT1 and iT1—voltage and current of transistor T1, respectively; uT1a—voltage of transistor T1a; iC1 and uC1—current and voltage of capacitor C1, respectively; iL1b and iL2a—currents of inductors L1b and L2a, respectively; iL1b and iL2a—currents of diodes D1s and D1n, respectively; IA—load current; green color—processes related to the soft turning off of transistor T1; and yellow color—processes related to soft turning on of transistor T1.
Energies 18 03474 g008
Figure 9. Operation stages of a VSI with a soft-switching system for the following time intervals: (a) before t1, (b) t1t2, (c) t2t3, (d) t3t4, (e) t4t5, (f) t5t6, (g) t6t7, and (h) t7t8.
Energies 18 03474 g009
Figure 10. Measured waveforms in one switching cycle: uT1 and iT1—voltage and current of transistor T1, respectively; uT1a—voltage of transistor T1a and its freewheeling diode; iC1—current of capacitor C1; output frequency 40 Hz; switching frequency of 2.4 kHz; green color—processes related to soft turning off of transistor T1; and yellow color—processes related to the soft turning on of transistor T1 and soft turning on and turning off of auxiliary transistor T1a.
Energies 18 03474 g010
Figure 11. Laboratory system for testing the cooperation of the VSI with the AC grid: uph—phase voltage on the primary side of the transformer; uA—output phase voltage of the VSI; uAB—output phase to phase voltage of the VSI; and iA—phase current of the VSI.
Energies 18 03474 g011
Figure 12. Laboratory system of energy conversion.
Energies 18 03474 g012
Figure 13. Waveforms when energy from the DC circuit was transmitted to the AC grid at a switching frequency of 3 kHz: UDC = 240 V; uT1 and iT1—voltage and current of transistor T1, respectively; uC1—voltage of capacitor C1; uph—phase voltage on the primary side of the transformer; and iA—output phase current.
Energies 18 03474 g013
Figure 14. Analogous waveforms as in Figure 13 recorded at a switching frequency of 6 kHz.
Energies 18 03474 g014
Figure 15. Waveforms when energy from the AC grid was transmitted to the DC circuit at a switching frequency of 3 kHz; waveform markings are as in Figure 13.
Energies 18 03474 g015
Figure 16. Analogous waveforms as in Figure 15 at a switching frequency 6 kHz.
Energies 18 03474 g016
Figure 17. Waveforms in two output-voltage periods when an assumed rated power of 1 MW was transmitted to the AC grid: iA—output phase current of the VSI; uph—phase voltage on the primary side of the transformer; uA—output phase voltage of the VSI; uAB—output phase to phase voltage of the VSI; and other markings as in Figure 7.
Energies 18 03474 g017
Figure 18. Efficiency as functions of the power transmitted to AC grid: (a) 100 kW and (b) 1 MW; continuous lines—at a switching frequency of 20 kHz and 2 kHz, respectively; dashed lines—at a switching frequency of 40 kHz and 4 kHz, respectively; red lines—the VSI with the hard-switching technique, green lines—the VSI with soft switching at k = 1.5, and blue lines—the VSI at k = 2.0.
Energies 18 03474 g018
Figure 19. Efficiency of 100 kW photovoltaic energy conversion systems consisting of a DC/DC boost converter and VSI: (a) 100 kW; (b) 1 MW; and efficiency markings as in Figure 18.
Energies 18 03474 g019
Figure 20. Efficiency of the VSI when converting energy from the AC grid to the DC circuit: (a) 100 kW; (b) 1 MW; and efficiency markings as in Figure 18.
Energies 18 03474 g020
Figure 21. Efficiency of the energy conversion system with a diode rectifier and DC/DC boost converter: (a) 100 kW; (b) 1 MW; and efficiency markings as in Figure 18.
Energies 18 03474 g021
Figure 22. Efficiency of the energy conversion system with a transistor rectifier: (a) 100 kW; (b) 1 MW; and efficiency markings as in Figure 18.
Energies 18 03474 g022
Table 1. Efficiency of the laboratory prototype energy conversion system.
Conversion TypeSwitching Frequency of
3 kHz
Switching Frequency of
6 kHz
PDC
(W)
PAC
(W)
Efficiency (%)PDC
(W)
PAC
(W)
Efficiency (%)
DC → AC
(k * = 2.0)
42534083964335411895
21312003942210205593
12201122921252112790
AC → DC
(k * = 2.0)
41904411954134439894
21782317942123228393
11901293921114122491
* k is the multiple of the maximum voltage on the main transistors relative to the DC voltage.
Table 2. Parameters of SiC-MOSFET.
Transistor TypeVDS
(V)
ID
(A)
ton
(μs)
tr
(μs)
toff
(μs)
tf
(μs)
trr
(μs)
Irrm
(A)
VDS(on)
(V)
FMF600DXE-
34BN
17006000.100.060.190.040.115102.75
Table 3. Parameters of IGBT.
Transistor TypeVCC
(V)
IC
(A)
ton
(μs)
tr
(μs)
toff
(μs)
tf
(μs)
trr
(μs)
Irrm
(A)
VCE
(V)
CM1500HC-
90XA
450015000.800.257.700.501.6021002.80
Table 4. Inductances and capacitances of the soft-switching system.
100 kW1 MW
k *1.52.01.52.0
La (μH)2.233.7711.6031.20
Ra (mΩ)1.602.081.021.68
Lb (μH)0.301.203.6914.80
Rb (mΩ)0.591.170.581.16
C (μF)0.260.263.803.80
M (uH) **0.301.193.6614.80
* k is the multiple of the maximum voltage on the main transistors relative to the DC voltage, and ** M denotes the mutual inductance (Figure 7).
Table 5. Efficiency of the 100 kW conversion system in a photovoltaic plant.
Efficiency (%)
Switching
Frequency of 20 kHz
Switching
Frequency of 40 kHz
Conversion systemVSI hardVSI soft
k = 1.5
VSI soft
k = 2.0
VSI hardVSI soft
k = 1.5
VSI
soft
k = 2.0
VSI → DC → AC *98.799.099.098.198.698.6
VSI → AC → DC **97.998.798.997.198.398.5
DC/DC boost conv. and VSI97.597.897.896.597.097.1
* Energy transmitted from the DC circuit to the AC grid; ** energy transmitted from the AC grid to the DC circuit.
Table 6. Efficiency of the 1 MW conversion system in a photovoltaic plant.
Efficiency (%)
Switching
Frequency of 2 kHz
Switching
Frequency of 4 kHz
Conversion systemVSI hardVSI soft
k = 1.5
VSI soft
k = 2.0
VSI hardVSI soft
k = 1.5
VSI soft
k = 2.0
VSI → DC → AC *96.497.998.893.296.898.0
VSI → AC → DC **96.297.698.792.795.898.0
DC/DC boost conv. and VSI95.196.797.590.794.295.3
* Energy transmitted from the DC circuit to the AC grid; ** energy transmitted from the AC grid to the DC circuit.
Table 7. Total harmonic distortion of the phase current of the 1 MW energy conversion system.
Total Harmonic Distortion (%)
Switching Frequency of 2 kHzSwitching Frequency of 4 kHz
VSI hardVSI soft
k = 1.5
VSI soft
k = 2.0
VSI hardVSI soft
k = 1.5
VSI soft
k = 2.0
10.2712.0611.675.015.845.64
Table 8. Efficiency of the 100 kW energy conversion system with the PMSG.
Efficiency (%)
Switching
Frequency of 20 kHz
Switching
Frequency of 40 kHz
Conversion systemVSI hardVSI soft
k = 1.5
VSI soft
k = 2.0
VSI hardVSI soft
k = 1.5
VSI soft
k = 2.0
Diode rectifier, DC/DC boost conv. and VSI97.197.397.396.196.696.7
Transistor rectifier and VSI96.697.797.995.396.997.1
Table 9. Efficiency of the 1 MW energy conversion system with the PMSG.
Efficiency (%)
Switching
Frequency of 2 kHz
Switching
Frequency of 4 kHz
Conversion systemVSI hardVSI soft
k = 1.5
VSI soft
k = 2.0
VSI hardVSI soft
k = 1.5
VSI soft
k = 2.0
Diode rectifier, DC/DC boost conv. and VSI95.096.697.490.694.195.2
Transistor rectifier and VSI92.795.697.486.492.896.1
Table 10. Power losses in the VSI during the transmission of reactive power to the AC grid.
Power Losses (kW)
Reactive Power100 kVAr1 MVAr
Switching frequency (kHz)204024
VSI hard1.712.4237.2772.71
VSI soft; k = 1.51.151.5520.4039.74
VSI soft; k = 2.01.071.4913.6820.48
Disclaimer/Publisher’s Note: The statements, opinions and data contained in all publications are solely those of the individual author(s) and contributor(s) and not of MDPI and/or the editor(s). MDPI and/or the editor(s) disclaim responsibility for any injury to people or property resulting from any ideas, methods, instructions or products referred to in the content.

