1. Introduction
Steam injection in heavy oil reservoirs triggers complex water–rock and water–oil interactions that can significantly impair reservoir productivity by altering permeability and porosity [
1,
2,
3]. The injected steam and associated hot water typically possess high pH levels (often >12) and low salinity, conditions that promote several damage mechanisms [
4]. These include the swelling and dispersion of water-sensitive clays, dissolution of silica and clay minerals [
4], alteration in crude oil composition, and asphaltene precipitation [
5]. Together, these effects can shift reservoir wettability and reduce flow capacity, ultimately hampering oil recovery [
6,
7,
8].
Formation damage mechanisms vary with rock type, fluid properties, and in situ reservoir conditions. Extensive studies have characterised the key interactions responsible for such damage [
9,
10,
11,
12]. These works highlight the crucial role of laboratory investigations in identifying and quantifying the controlling parameters and evaluating their dependence on both reservoir and operational factors.
For practical analysis, the commonly encountered formation damage mechanisms can be classified into two broad categories: (1) fluid–fluid interactions and (2) fluid–rock–particle interactions [
13]. The fluid–fluid interactions primarily involve (a) emulsion blocking, (b) inorganic scale deposition, and (c) organic deposition [
13]. In contrast, the fluid–rock–particle interactions encompass (a) mobilisation, migration, and deposition of in situ fine particles; (b) invasion, migration, and deposition of externally introduced fine particles; and (c) alteration in particle and porous media properties through surface processes such as absorption, adsorption, wettability changes, and swelling [
14].
Fines migration and retention within a porous medium involve several key mechanisms: pore surface release (detachment), pore surface capture (attachment), pore throat release (dislodgement), and pore throat capture (straining, bridging, and plugging) [
15].
Fines mobilisation arises from the interplay of various forces acting on fine particles within porous media. These include hydrodynamic forces (drag and lift), surface interaction forces (electrostatic), and gravitational force [
16]. Electrostatic interactions encompass attractive van der Waals forces (VDW), repulsive electrical double-layer forces (EDL), and short-range Born repulsion (BRN) [
17]. Fines’ detachment from sand grains occurs when repulsive forces exceed the adhesive forces binding particles to the pore surface [
18,
19,
20]. Among these, the contributions of lift and gravitational forces are typically negligible relative to those of hydrodynamic drag and electrostatic interactions during fluid flow through porous media [
21,
22,
23]. Both theoretical analyses and laboratory investigations indicate that hydrodynamic forces become significant only at elevated flow velocities—on the order of 10
−3 m/s—conditions generally encountered in the near-wellbore region [
24].
When an electrolyte solution traverses a porous medium, it induces the formation of an electrical double layer around negatively charged grain and particle surfaces. This double layer consists of a compact layer and a diffusive layer rich in counter-ions. The thickness of the diffusive layer—and thus the magnitude of the electrical interactions—depends on the electrolyte properties, including ionic strength, cation valence, pH, and temperature [
25]. The electrical potential at the boundary between the diffusive layer and the bulk fluid is termed the zeta potential [
26]. The EDL component specifically reflects the repulsive interaction between overlapping diffuse layers of adjacent particles and grains.
Higher temperatures intensify the electrical double-layer repulsion between particles. This enhancement in repulsive forces facilitates fines mobilisation. The influence of temperature on fines migration has been effectively described using DLVO theory, which computes electrostatic forces based on the interaction energy between fines and the solid matrix, incorporating the temperature dependence of zeta potential [
27]. The total interaction energy comprises the summation of VDW, EDL, and BR [
19,
28,
29].
In addition, temperature variations can affect colloidal particle aggregation by modulating both the magnitude of interparticle repulsive energy and the frequency of particle collisions [
30]. Higher temperature reduces adhesion and increases Brownian motion, dispersing fines and weakening aggregation [
31].
Elevated temperatures exert significant microscopic influences on both fluid properties and particle behaviour. Specifically, increasing temperature reduces the fluid’s viscosity and alters its density, thereby enlarging the hydrodynamic shear and torque acting on particles adhered to rock surfaces. As a result, the detachment torque may exceed the adhesive forces, promoting the release of fine particles [
32].
Permeability impairment due to fines migration in porous media has been widely documented in hydrocarbon reservoirs [
20,
25,
33]. Since absolute permeability is a fundamental property of porous media, any alteration in pore morphology or texture impacts the formation’s permeability [
34]. Core flooding experiments generally suggest that increasing temperature leads to reduced core permeability [
10,
35,
36,
37], providing relevant data on the impact of fluid interactions on core properties and the mechanisms contributing to formation damage.
Research on permeability evolution [
10] conducted by injecting NaCl brine at salinities ranging from 0.512 to 0.068 mol/L under temperatures of 0 °C, 30 °C, and 60 °C elucidated that fine mobilisation initiated at higher salinities as temperature increased. Interestingly, the permeability reduction was 56% at 30 °C but only 50% at 60 °C, a discrepancy that remained unexplained. In a separate study [
35], fresh water was injected into a Berea core saturated with 0.854 mol/L NaCl and maintained at temperatures of 23 °C, 93 °C, and 150 °C. There was a report of more rapid permeability decline at elevated temperatures, although the final permeability impairment was comparable across all conditions. A study using NaCl brine with salinities from 2 to 0.002 mol/L at 20 °C and 80 °C [
36] observed a striking 99% permeability loss at 20 °C but none at 80 °C. It was attributed to the immediate mobilisation of all available fines at a high temperature during the early stages of injection.
Another study explored the coupled effects of temperature and low-salinity water injection on fines transport in Berea sandstone. Using injection salinities of 0.0085, 0.043, 0.171, and 0.684 mol/L at temperatures of 25, 50, and 70 °C, this research underscored the thermally activated nature of geochemical and colloidal interactions in porous media at elevated temperature [
37].
In SAGD applications, condensate water at the steam chamber’s edge mixes with high-salinity formation water, resulting in relatively low-salinity produced water within the bitumen emulsion. In SAGD Northern Alberta operations, salinities ranging from 400 ppm to 3400 ppm of NaCl brine and a pH between 7.1 to 8.8 for produced water have been reported [
38]. These conditions promote a suitable environment where particle mobilisation is encouraged.
Even though some previous experimental tests have used elevated temperatures, they have been developed on consolidated sand and have not accounted for the interactions of low salinity, elevated temperature and sand control devices that correspond to SAGD producers in one single test. Additional details and a critical analysis of these processes can be found in the review by Rengifo Barbosa et al. [
39].
In the context of SAGD, SRT facilities have been commonly used to assess the performance of sand control devices in terms of sand retention capability and plugging tendency by fines particles. These tests consider the amount of produced sand and the final retained permeability as key indicators for this purpose compared with acceptable criteria. Several studies [
40,
41,
42,
43,
44] have conducted SRT on sand packs representing McMurray Formation sands under different flow conditions (single-phase, multi-phase), PSDs, salinity, pH, stress and sand control specifications at room temperature and atmospheric conditions.
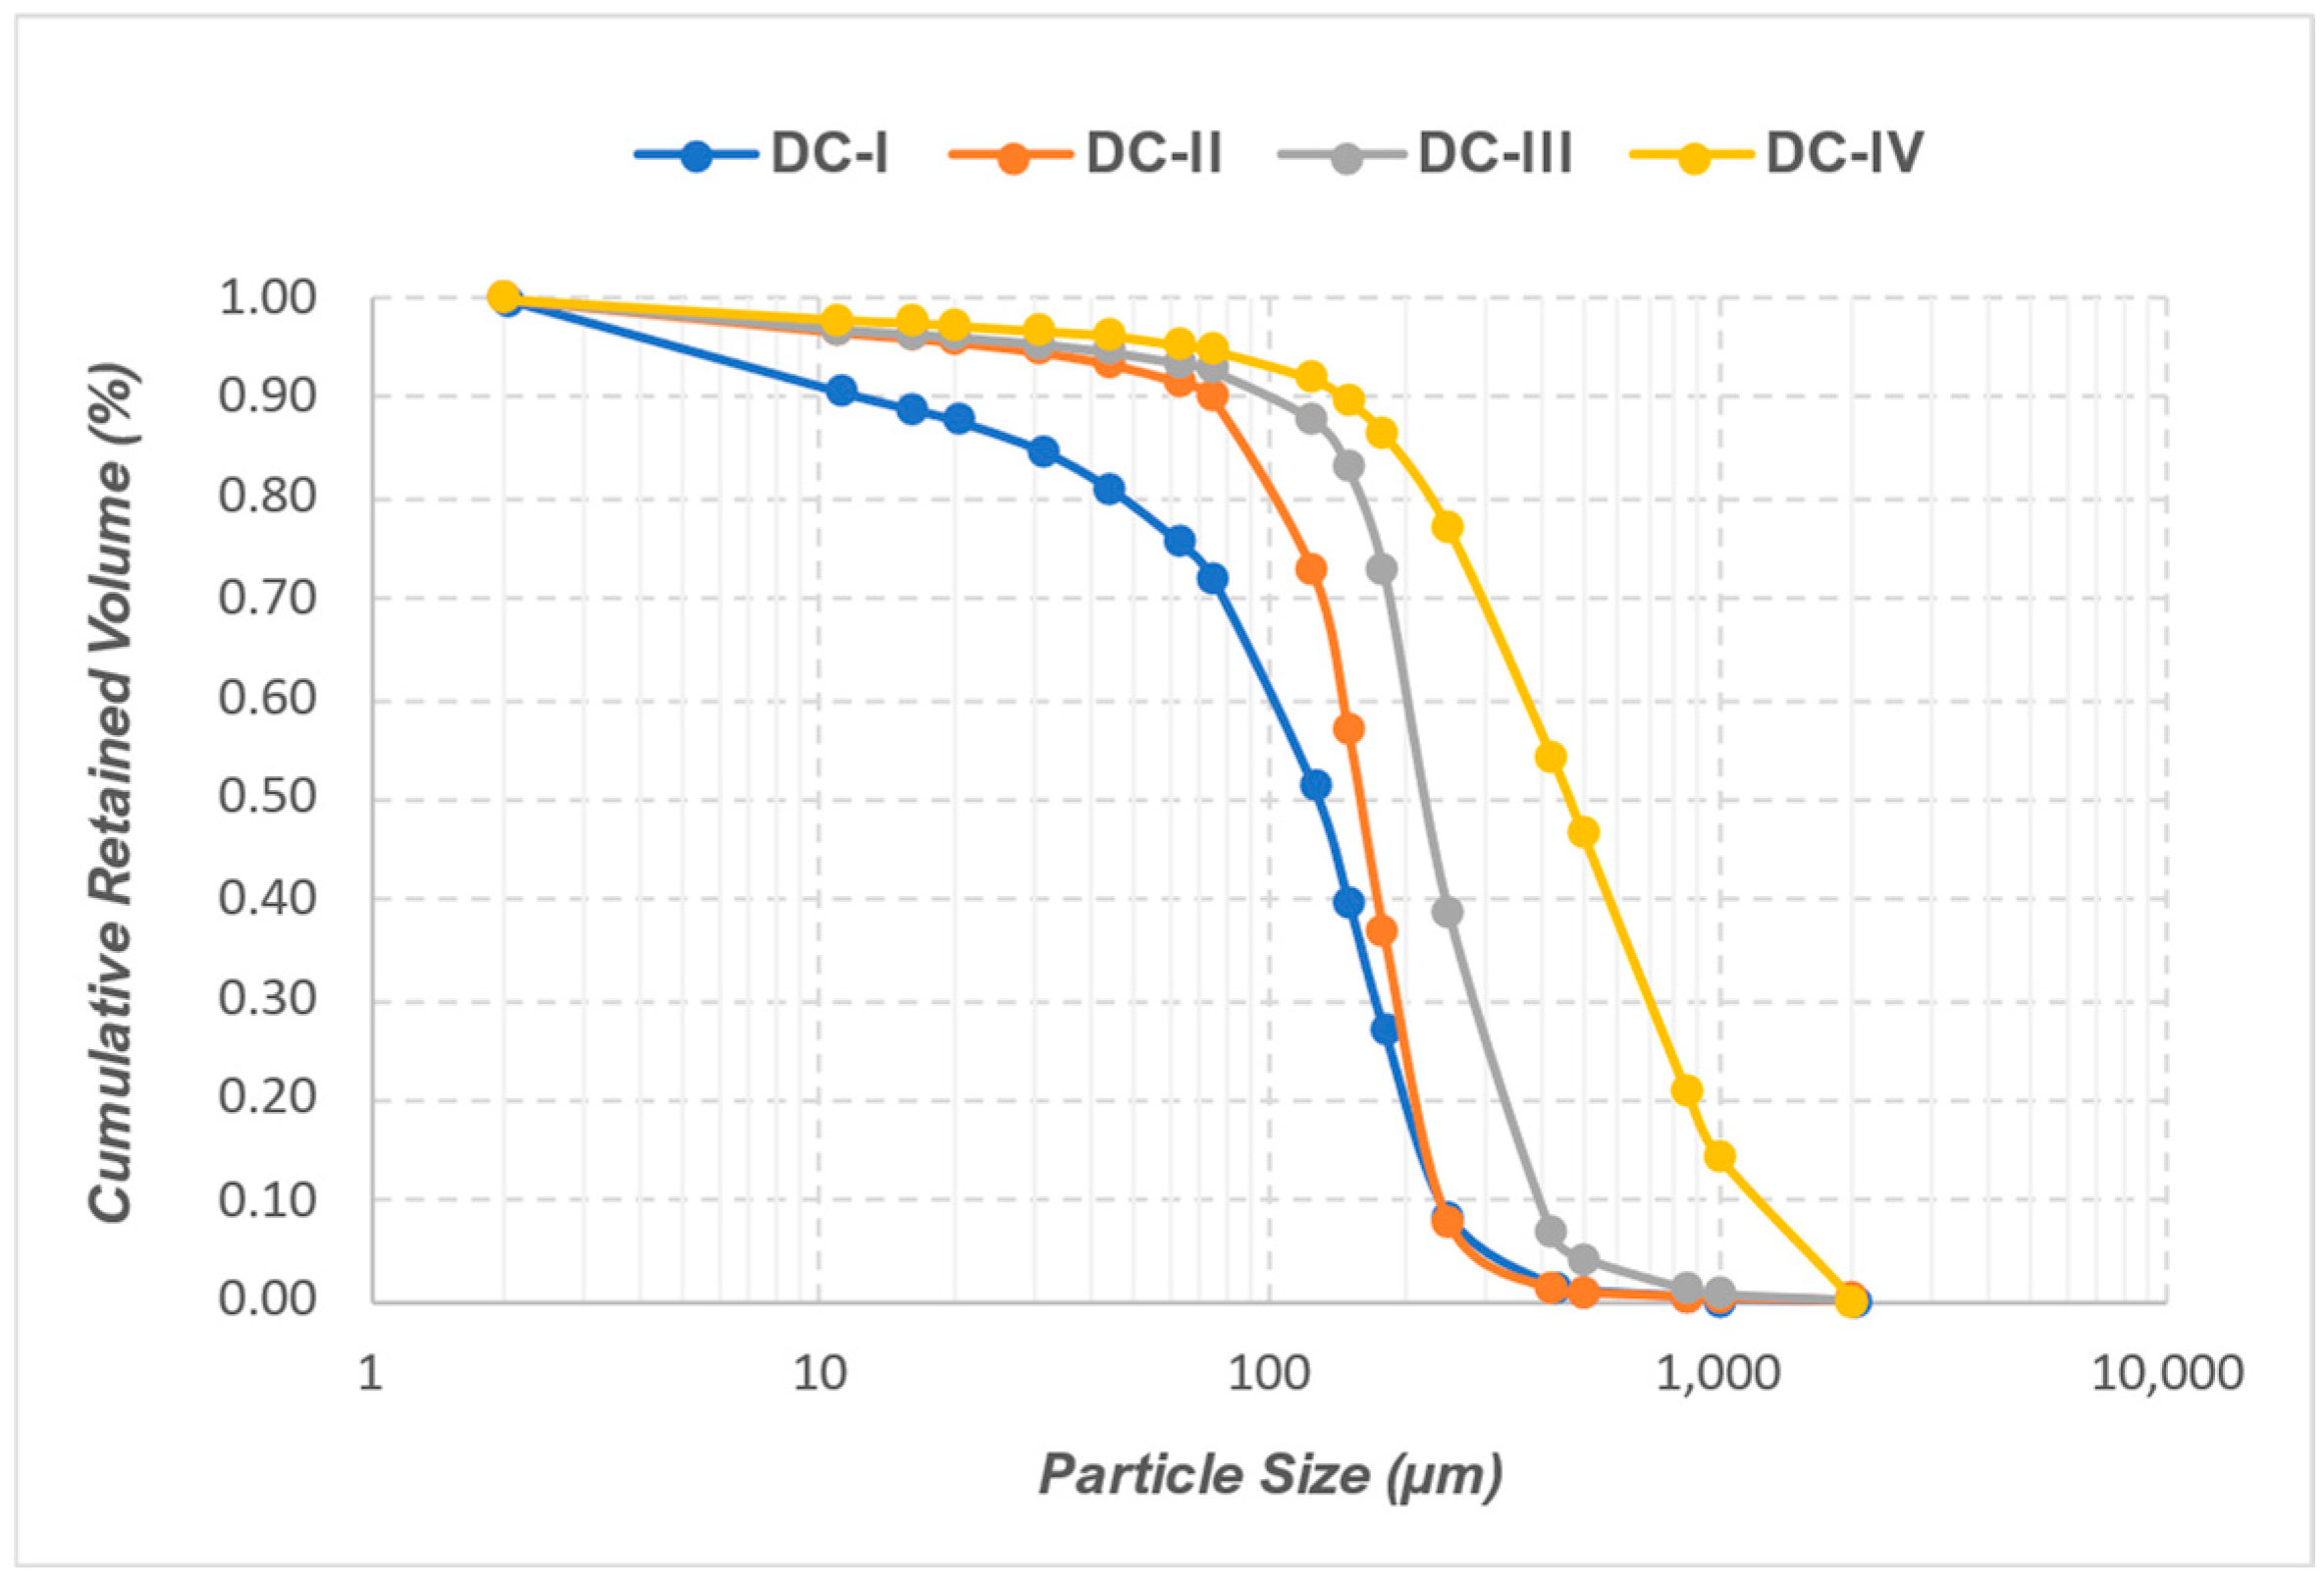
In this study, a novel HP-HT SRT facility is employed to assess the fines migration process on a synthetic sand pack representative of near-wellbore SAGD producers. The objective is to conduct fines migration experiments on sand packs that reflect a PSD class of the McMurray Formation characterised by fines contents of 14.5%, packed over a circular coupon of slotted liner screen. Typical SAGD flow rate, salinity change from 10,000 ppm to 400 ppm and elevated temperature of 80 °C are applied.
Although prior SRT studies have examined the individual effects of flow rate and salinity on fines migration, the combined influence of thermal conditions, salinity shifts, flow dynamics, and sand control design specific to SAGD well completions has remained largely unexplored. This work provides the first integrated experimental investigation of fines migration under SAGD-relevant salinity, temperature, and flow conditions using slotted liner sand control.
2. Development of the HP-HT Testing Facility
The intricate interplay between temperature, fines mobilisation, and salinity highlights the need for a holistic approach to managing formation damage under SAGD conditions, leveraging experimental insights and predictive modelling to enhance resource recovery efficiency.
This section outlines the methodology employed to develop an HP-HT testing facility designed to investigate formation damage mechanisms in thermal wells under conditions typical of SAGD operations. The advanced feature of this facility is its ability to integrate sand control screens, the surrounding porous media, and their interactions under realistic SAGD conditions, offering insights into formation damage processes to define mitigation strategies.
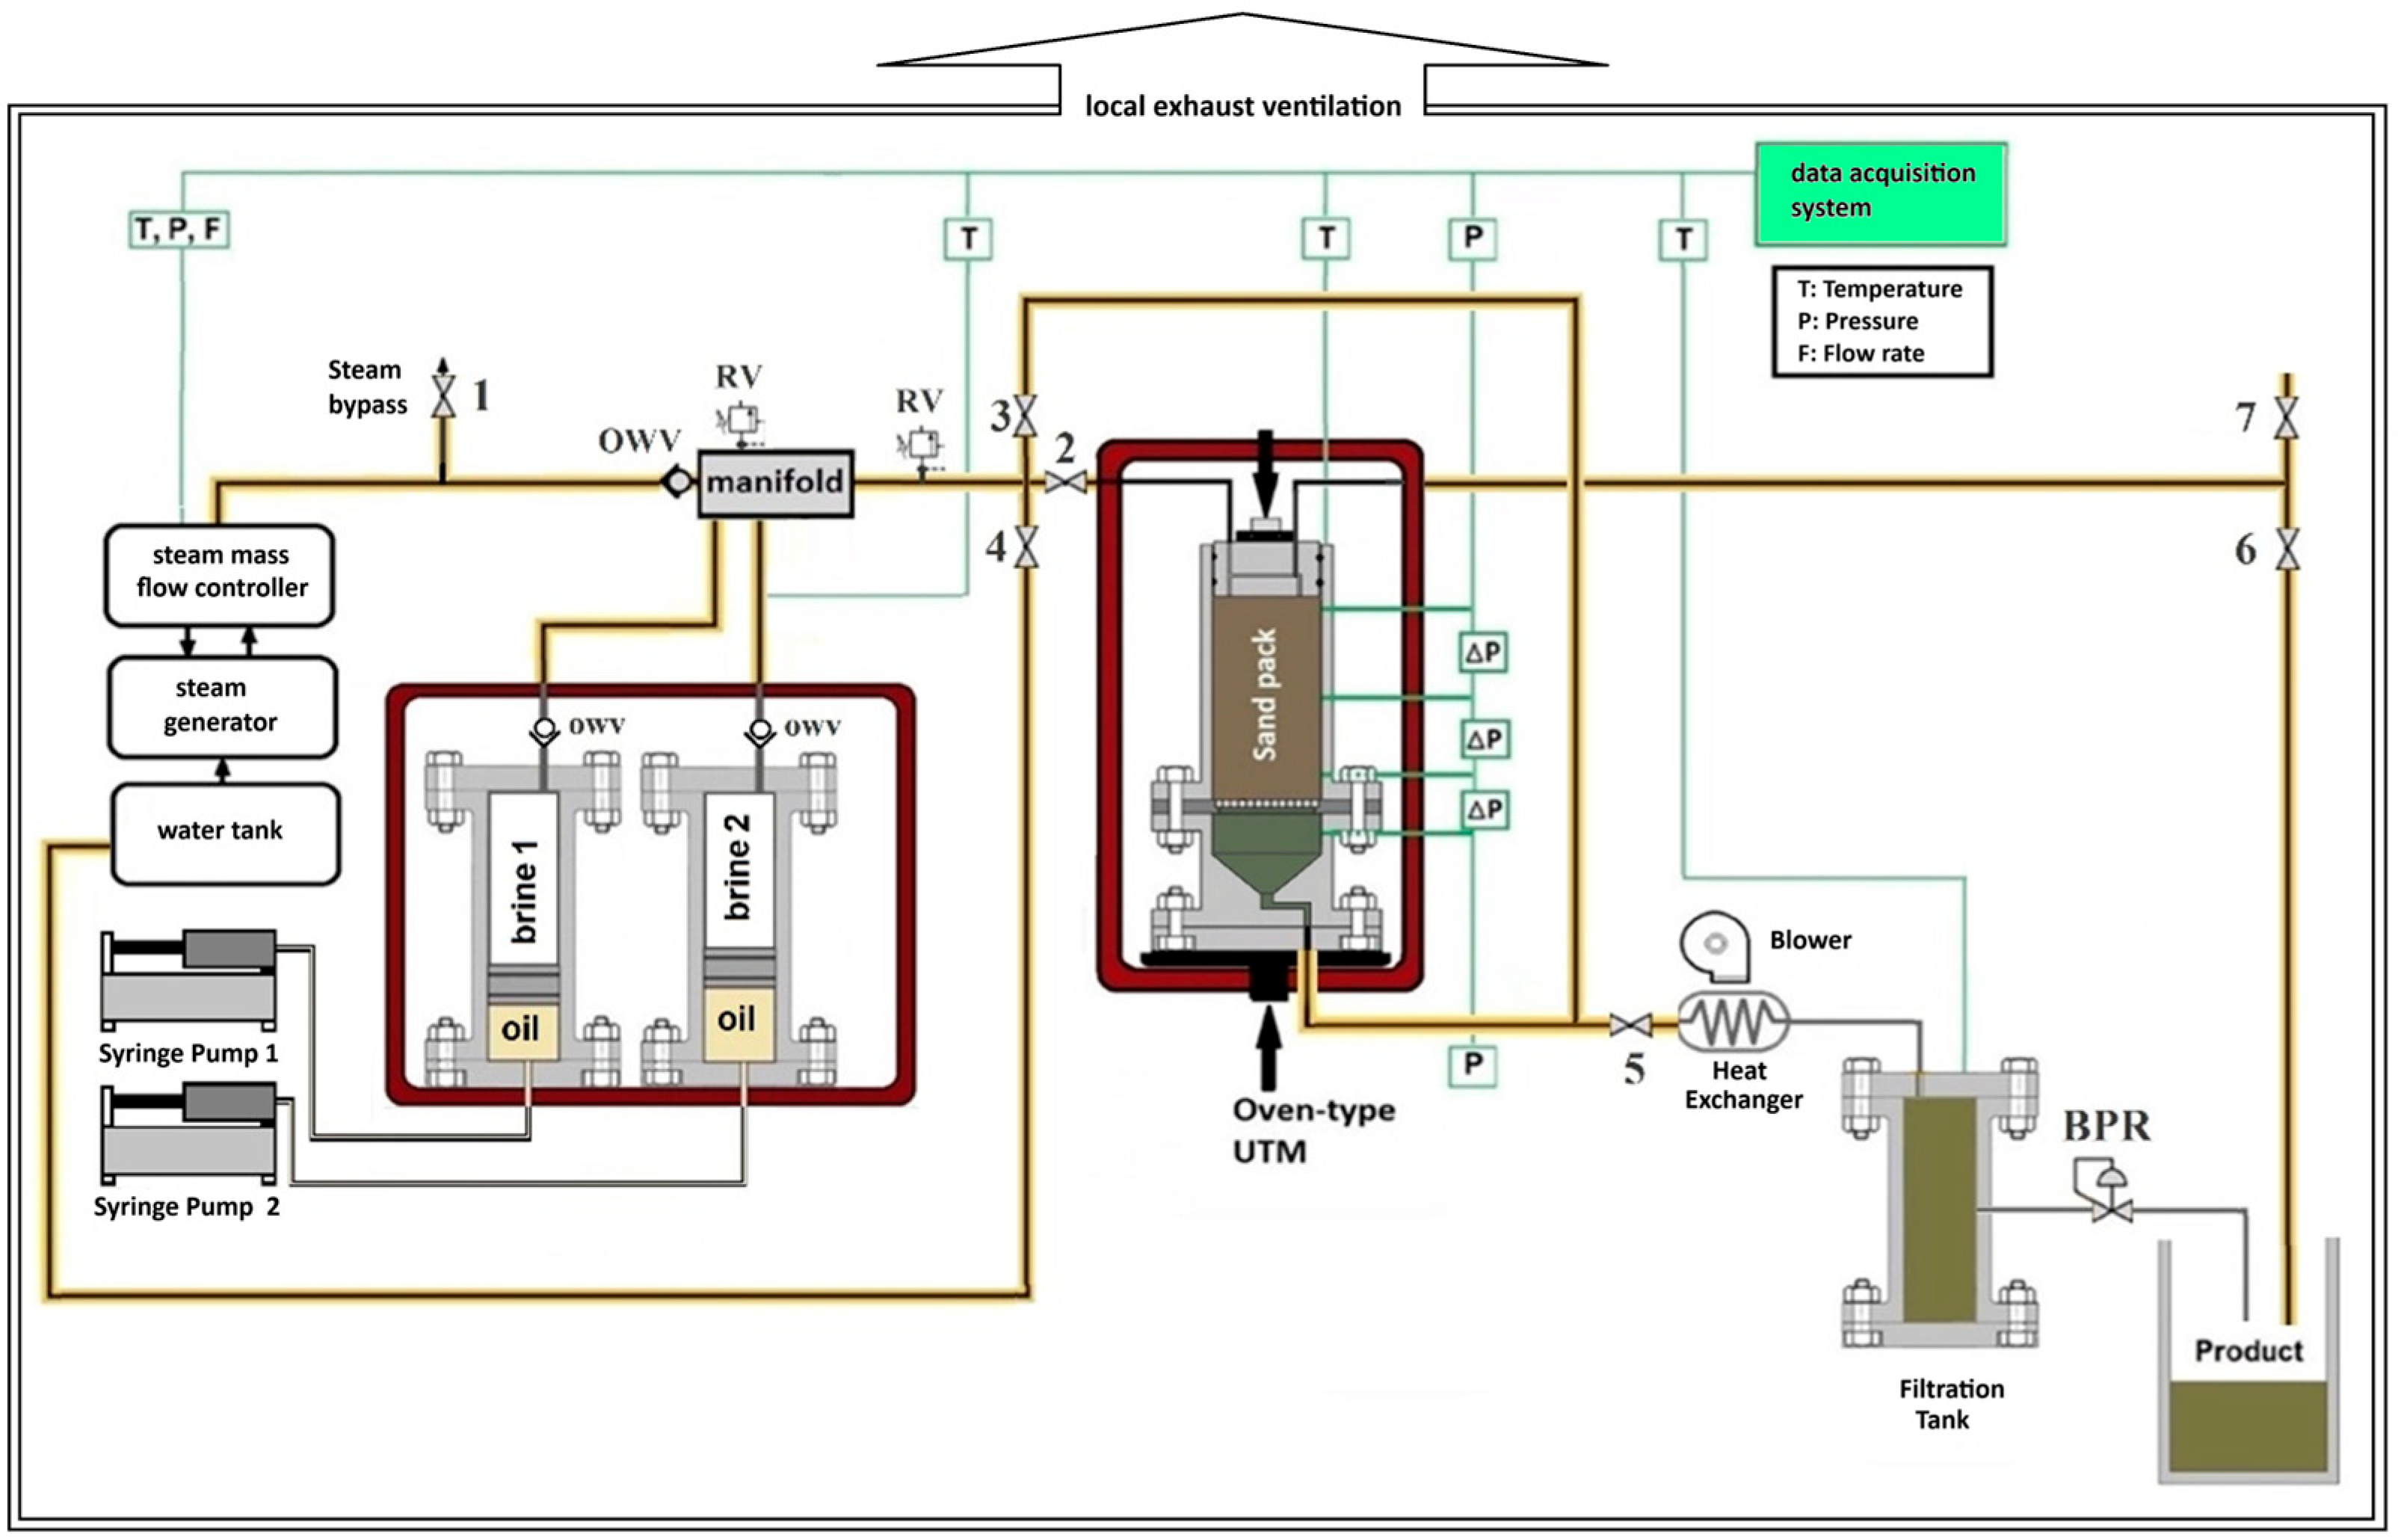
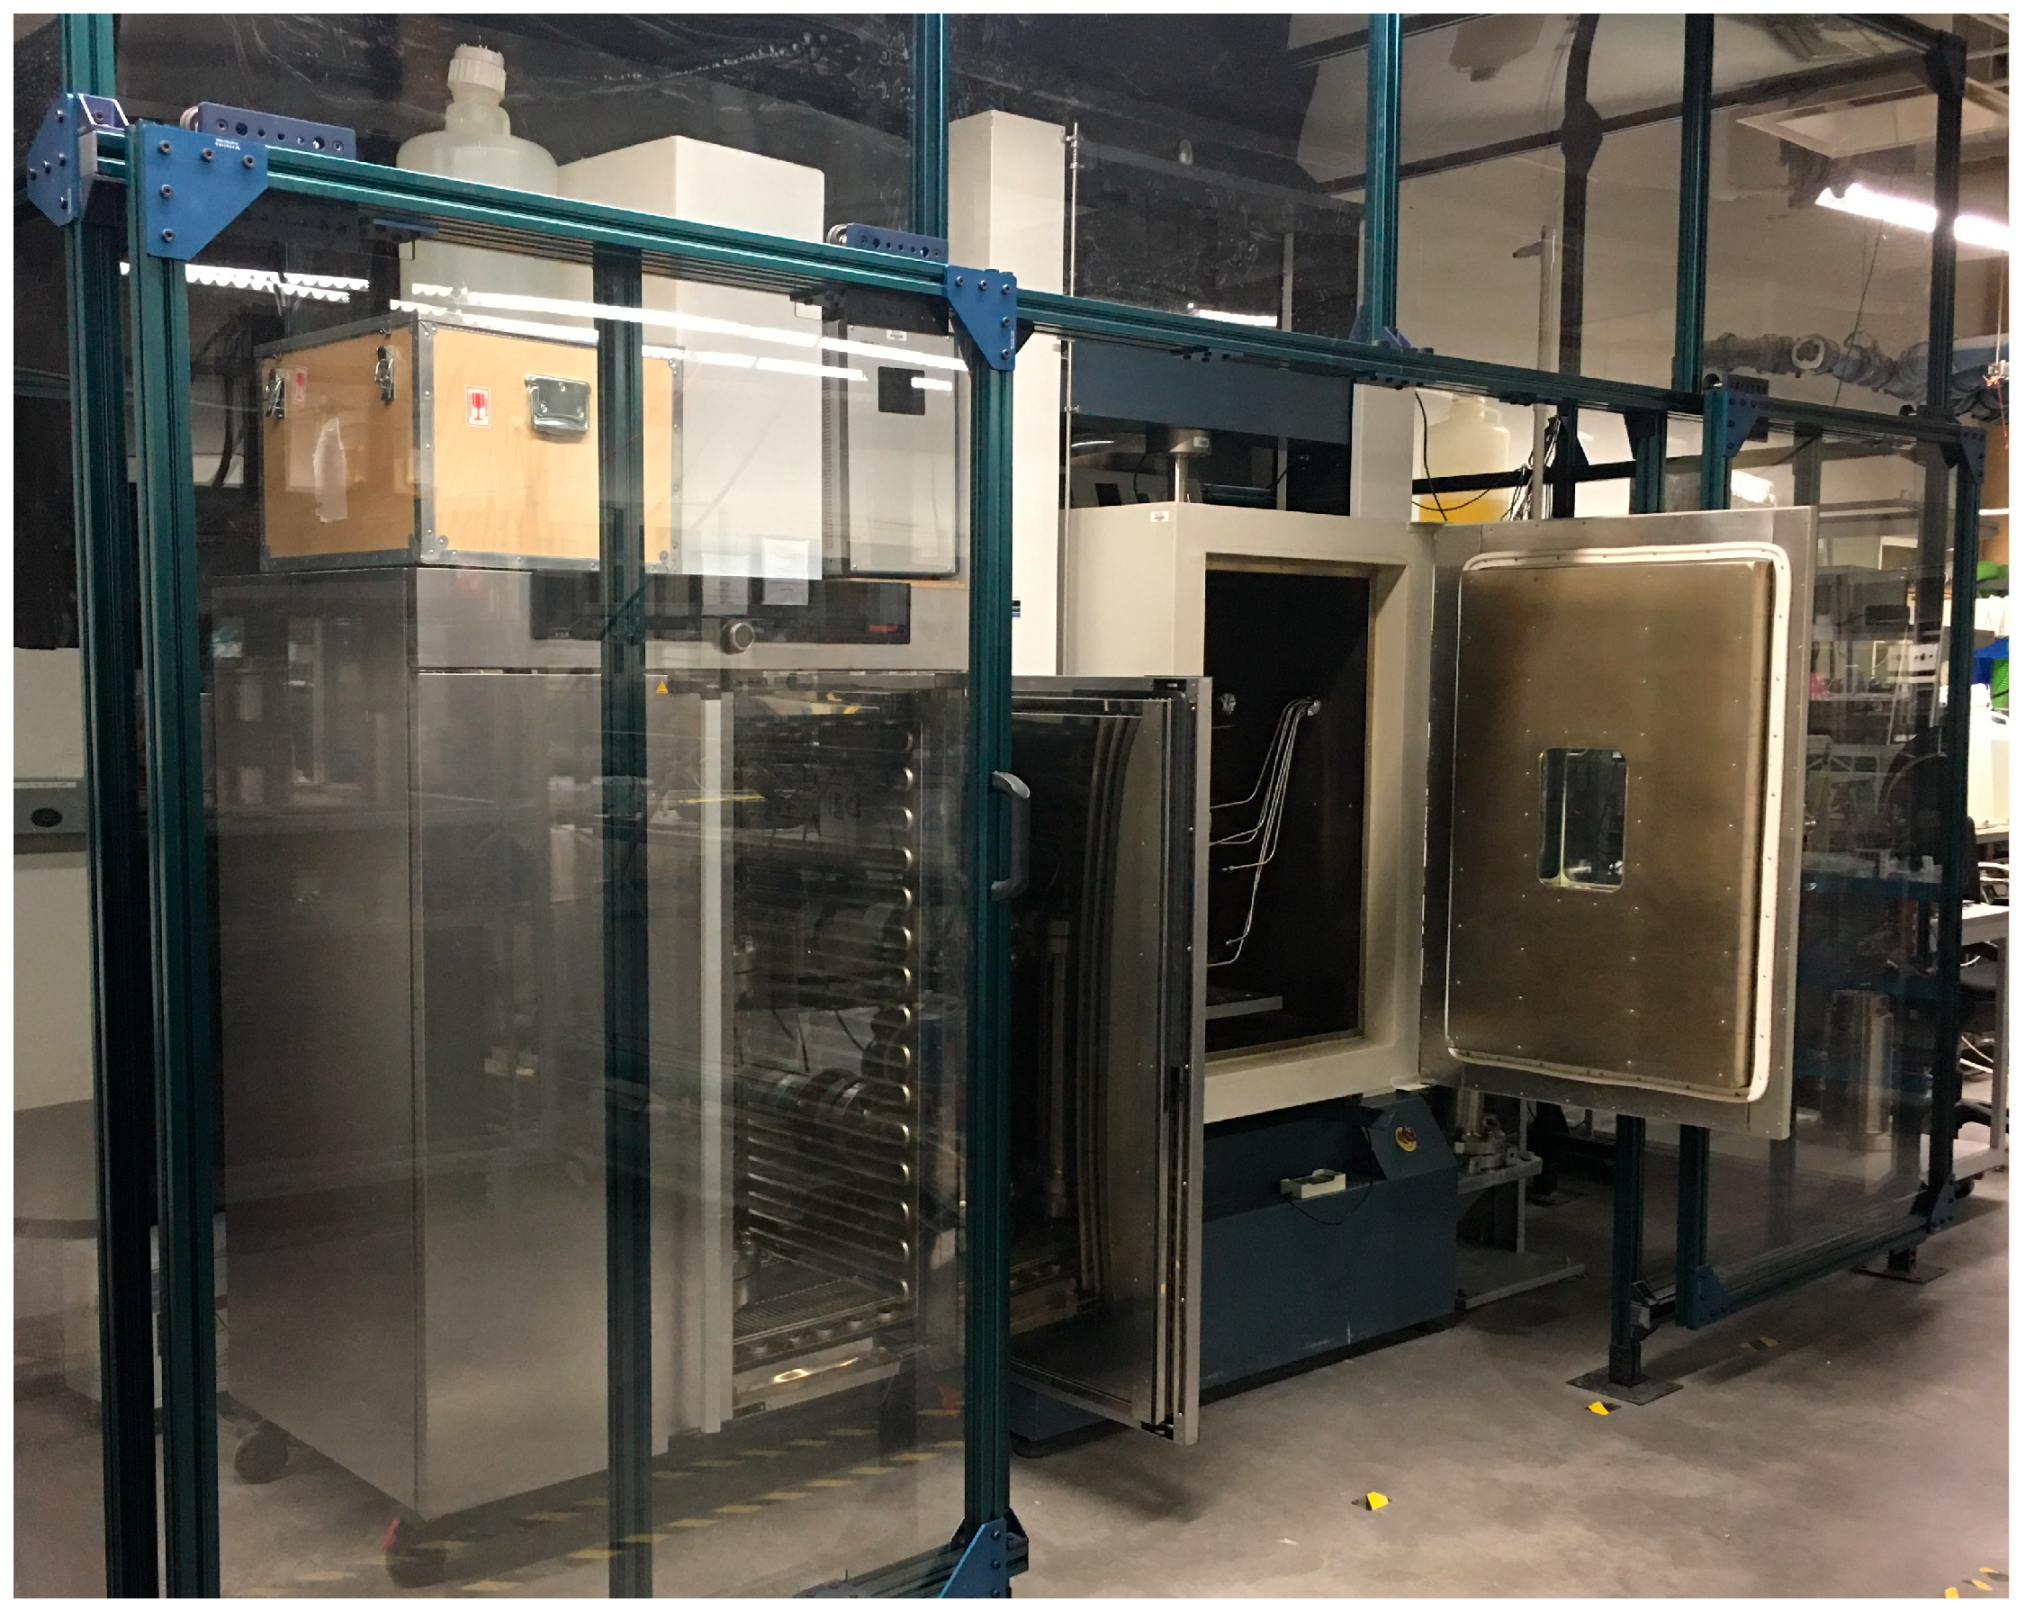
The HP-HT testing facility is a state-of-the-art laboratory designed to replicate the complex thermal and mechanical conditions encountered in SAGD wells (
Figure 1 and
Figure 2). The facility’s equipment and instruments are rated for pressures exceeding 2 MPa (290 psi), temperatures up to 350 °C, and axial stresses up to 27 MPa (3920 psi). These parameters ensure the capability to conduct tests under realistic reservoir conditions, allowing for an accurate simulation of formation damage mechanisms.
The research aimed to design a testing facility including a stainless-steel core holder that:
- a.
Facilitates testing under full reservoir pressure and temperature conditions, if required.
- b.
Accounts for multiphase flow.
- c.
Quantifies the mass and size distribution of produced sand and solids passing through the sand control device coupon.
- d.
Enables the usage of actual formation sand material for more representative testing conditions.
- e.
Accommodates the use of actual reservoir fluids to simulate in situ interactions.
2.1. Sample-Holding Unit
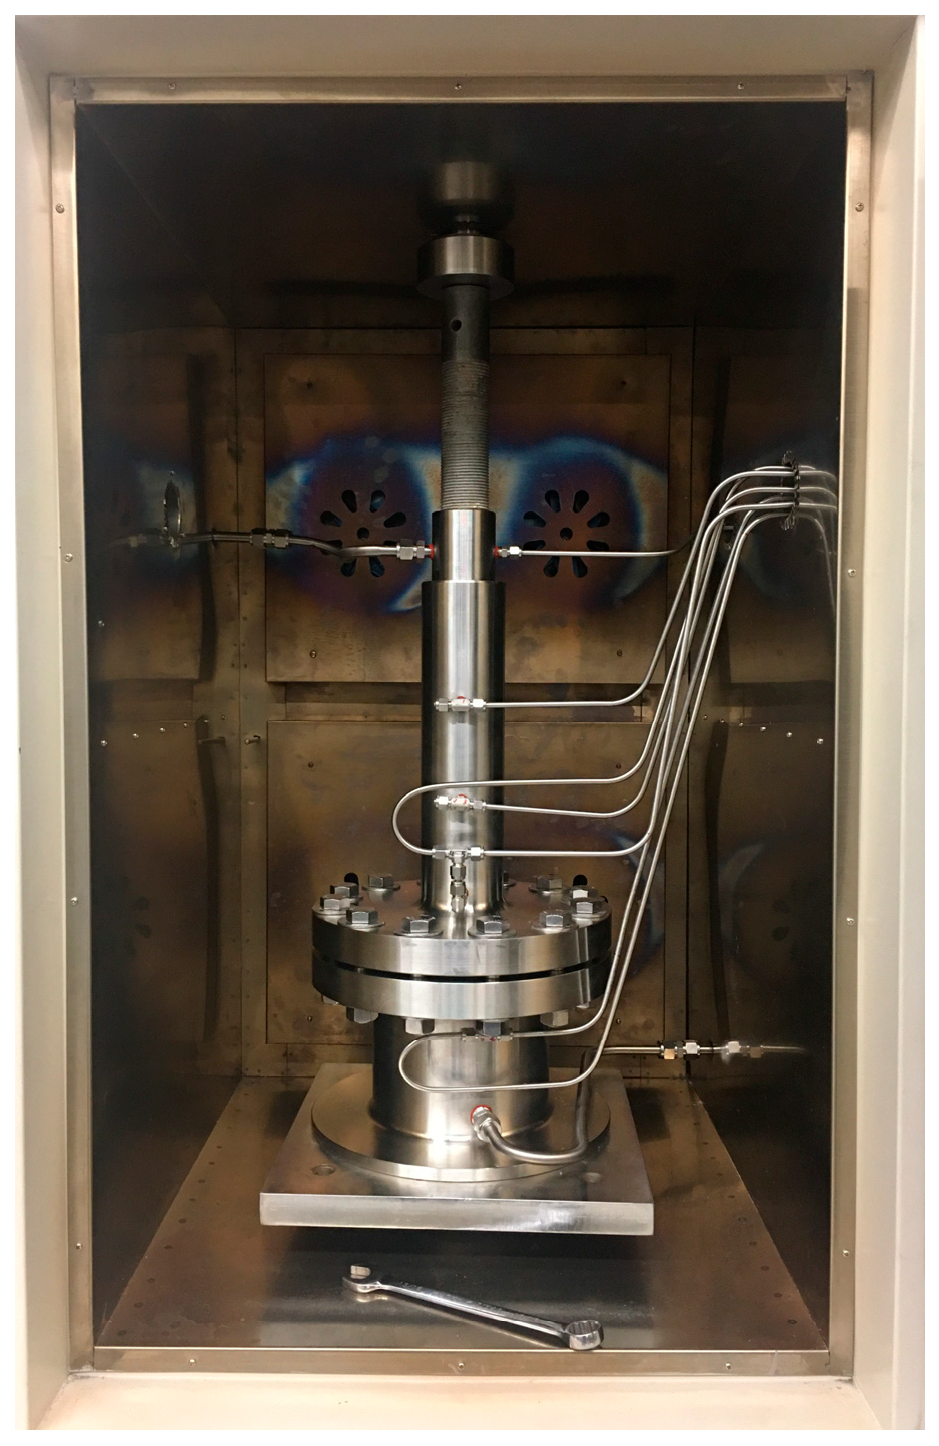
The sample-holding unit comprises an oven-type Universal Testing Machine (UTM) and a core holder, both essential components for simulating reservoir conditions in high-temperature and high-pressure environments.
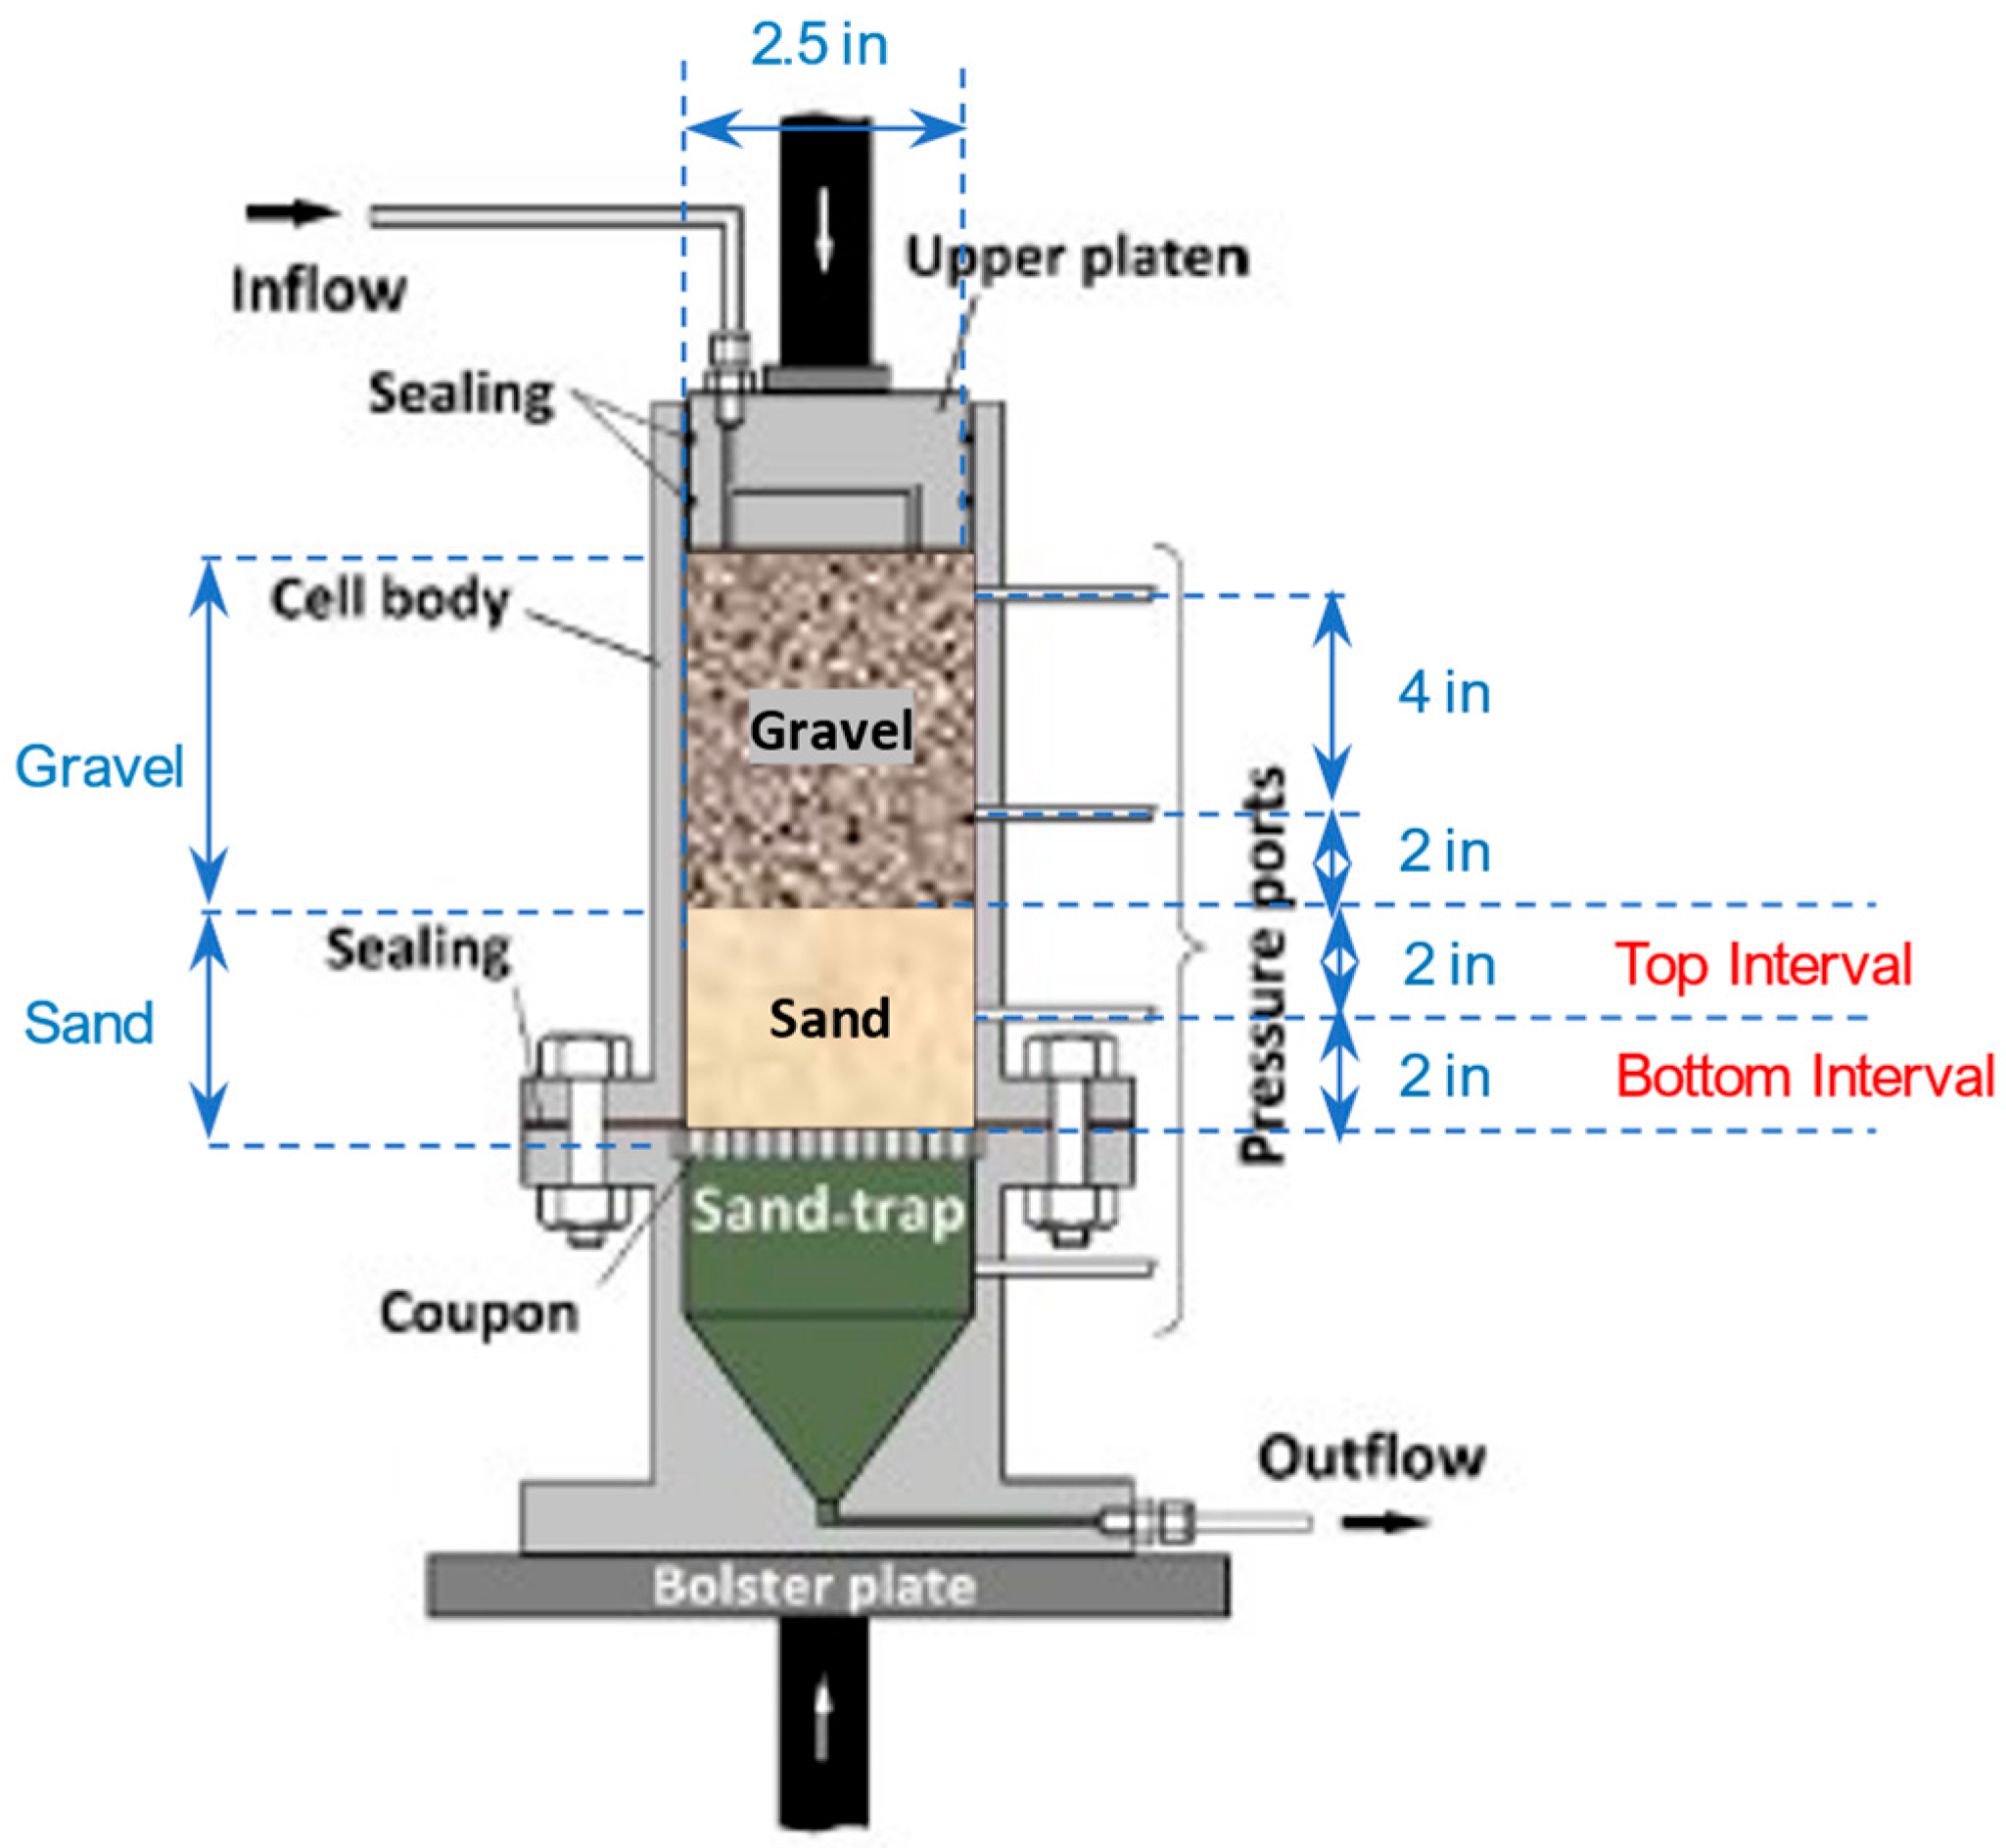
HP-HT cell. A custom-built core holder with an internal diameter of 2.5 in. (6.675 cm) and a height of 15 in. (38 cm) was designed to accommodate sand pack samples and screen coupon on top of a sand trap 7.5 in. (19 cm) height. To achieve an even flow distribution across the sand pack, an injection platen was carefully positioned on top (
Figure 3).
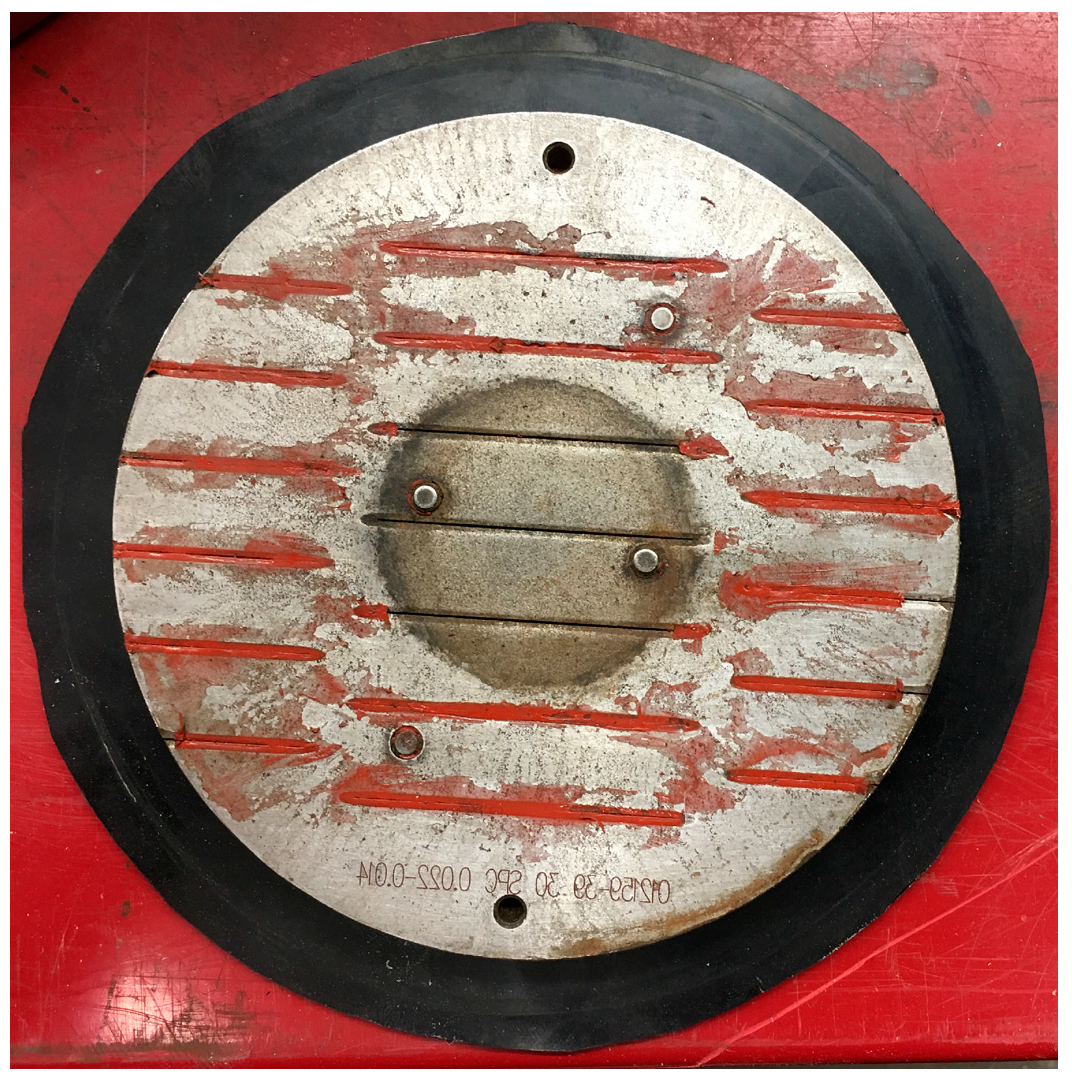
Screen Coupons. The experimental setup features a 6-inch diameter sand screen coupon (
Figure 4) positioned at the base of the test cell.
Oven-type UTM. The oven-type UTM (HD-B607-S, Haida International Equipment, Dongguan, China) provides a controlled environment for temperature and stress application. It combines compression testing capabilities with a precision oven to replicate reservoir conditions. A significant advantage of this UTM is its ability to house the HP-HT cell and tubing inside the temperature-controlled oven, ensuring consistent and uniform temperature distribution.
2.2. Fluid Injection Unit
The injection unit was designed to deliver fluids into the core holder under controlled HP-HT conditions. It included two liquid injection accumulators, an oven, metering pumps with variable frequency drives (VFDs) controller, and a stainless-steel manifold.
High-temperature reservoir fluid accumulators. These facilitate the injection of reservoir fluids, brines, and treatment solutions into the core holder at elevated temperatures. Accumulators are utilised to inject brine into the core holder. The accumulators were heated in an oven, and metering pumps drove the accumulators’ pistons to displace the liquids at controlled rates.
Oven for heating accumulators. A forced-air oven (UF1060, Memmert, Schwabach, Germany) capable of reaching temperatures up to 300 °C was utilised to maintain a consistent temperature to the accumulators.
Metering pumps. Two pumps (GDS) with precision pressure controllers injected hydraulic oil with a high flash point into the accumulators to push the pistons and displace the liquid at controlled rates. These pumps ensured a precise fluid flow of 2340 mL/min during the injection process.
Variable frequency drives (VFDs). Two variable frequency drives controlled the flow rates of the metering pumps. The VFDs enabled fine adjustments to ensure accurate fluid injection along various stages of testing.
Pressure transducers. High-precision pressure transducers, with an accuracy of ±0.2% at full scale (15 psi), corresponding to an uncertainty of ±0.03 psi, continuously measure differential pressure drop at different intervals along the cell.
Manifold. The stainless-steel manifold was designed with three inlet ports for different flow testing (brine, steam, and bitumen) and three corresponding outlet ports connected to the upper platen of the core holder. This configuration will allow the fluids to mix before entering the specimen.
2.3. Solid and Fluid Collection Unit
The solid and fluid collection unit was responsible for separating produced solids from the HP-HT cell outflow and cooling the discharged fluids before collection. It comprises a heat exchanger, a filtration vessel, a back-pressure regulator and a fluid collection tank.
Heat exchanger. The heat exchanger featured a variable-speed motor fan to control the cooling rate. Key components for constructing the heat exchanger included a variable-speed air blower, stainless steel piping bent into a U-shape, metal bars for the frame, and adjustable air dampers to regulate airflow and heat transfer.
Outlet filtration vessel. A cylindrical vessel uses gravity and mechanical filters (screen/mesh) to separate the solids from the outflow.
Back-pressure regulator. This device (KBP1J0A4A5A20000, Swagelok, Solon, OH, USA) maintained a target initial pore pressure throughout the experiment.
Fluid collection tank. The cooled fluid was collected in a stainless-steel tank at ambient conditions.
2.4. Control Panel and Data-Recording Unit
The data acquisition system (DAQ) was essential for monitoring and recording various parameters throughout the tests. This system included DAQ hardware with signal conditioning components, and a computer running DAQ software. To ensure safety and efficient control of the testing process, all gauges, alarms, and switches were consolidated on a mobile control panel positioned outside the enclosure, providing the operator with clear visibility and control without entering the testing area.
DAQ. A data logger was installed to record multiple measurements simultaneously. This ensured comprehensive monitoring of all critical parameters throughout the testing process, such as pressure, temperature throughout the experiments.
Instrumentation. The setup incorporated four differential pressure transducers to monitor absolute and differential pressures at key points within the system. It is also equipped with seven inlet and outlet valves to regulate flow direction during both sample saturation and testing phases.
Control panel. The control panel was custom-built to house the essential components required for operating the system. This included:
The UTM stop switch.
The UTM operating box and control system.
The data monitoring system.
The existing closed-loop control system for the actuators.
Alarm systems for safety.
The control panel also integrated ventilation controls to regulate the internal temperature of the enclosure, ensuring a safe operating environment.
Ventilated safety enclosure. It ensured safe operation by containing high-temperature and high-pressure components within a controlled environment.
4. Experimental Results and Analysis
As outlined in the introduction, the primary aim of the experiments was to replicate the fines migration process observed in SRT within the context of increased temperature and salinity change. As this research involved the development of a new HP-HT testing facility, tests at room temperature (23 °C) using an SRT setup (three in total) were conducted to obtain a reference for comparison with those on the HP-HT testing facility. Preliminary tests (three) utilising the HP-HT were also developed at room temperature to determine repeatability. Those tests utilised the same sand pack and flow characteristics, besides flow conditions and extended time; however, only Test No. 1 and Test No. 2 are discussed.
The specifications of each stage duration and applied temperature during the test are summarised (
Table 1) for clarity and reference.
Initial permeability measurements on the sand samples showed a consistent agreement in sand packing procedure and allowed for a fair comparison between these (
Figure 7).
The sand packs exhibited a permeability ranging from 700 to 800 mD, with a narrow proximity between the bottom and top intervals in each one (
Table 2).
4.1. Test No. 1 (23 °C)
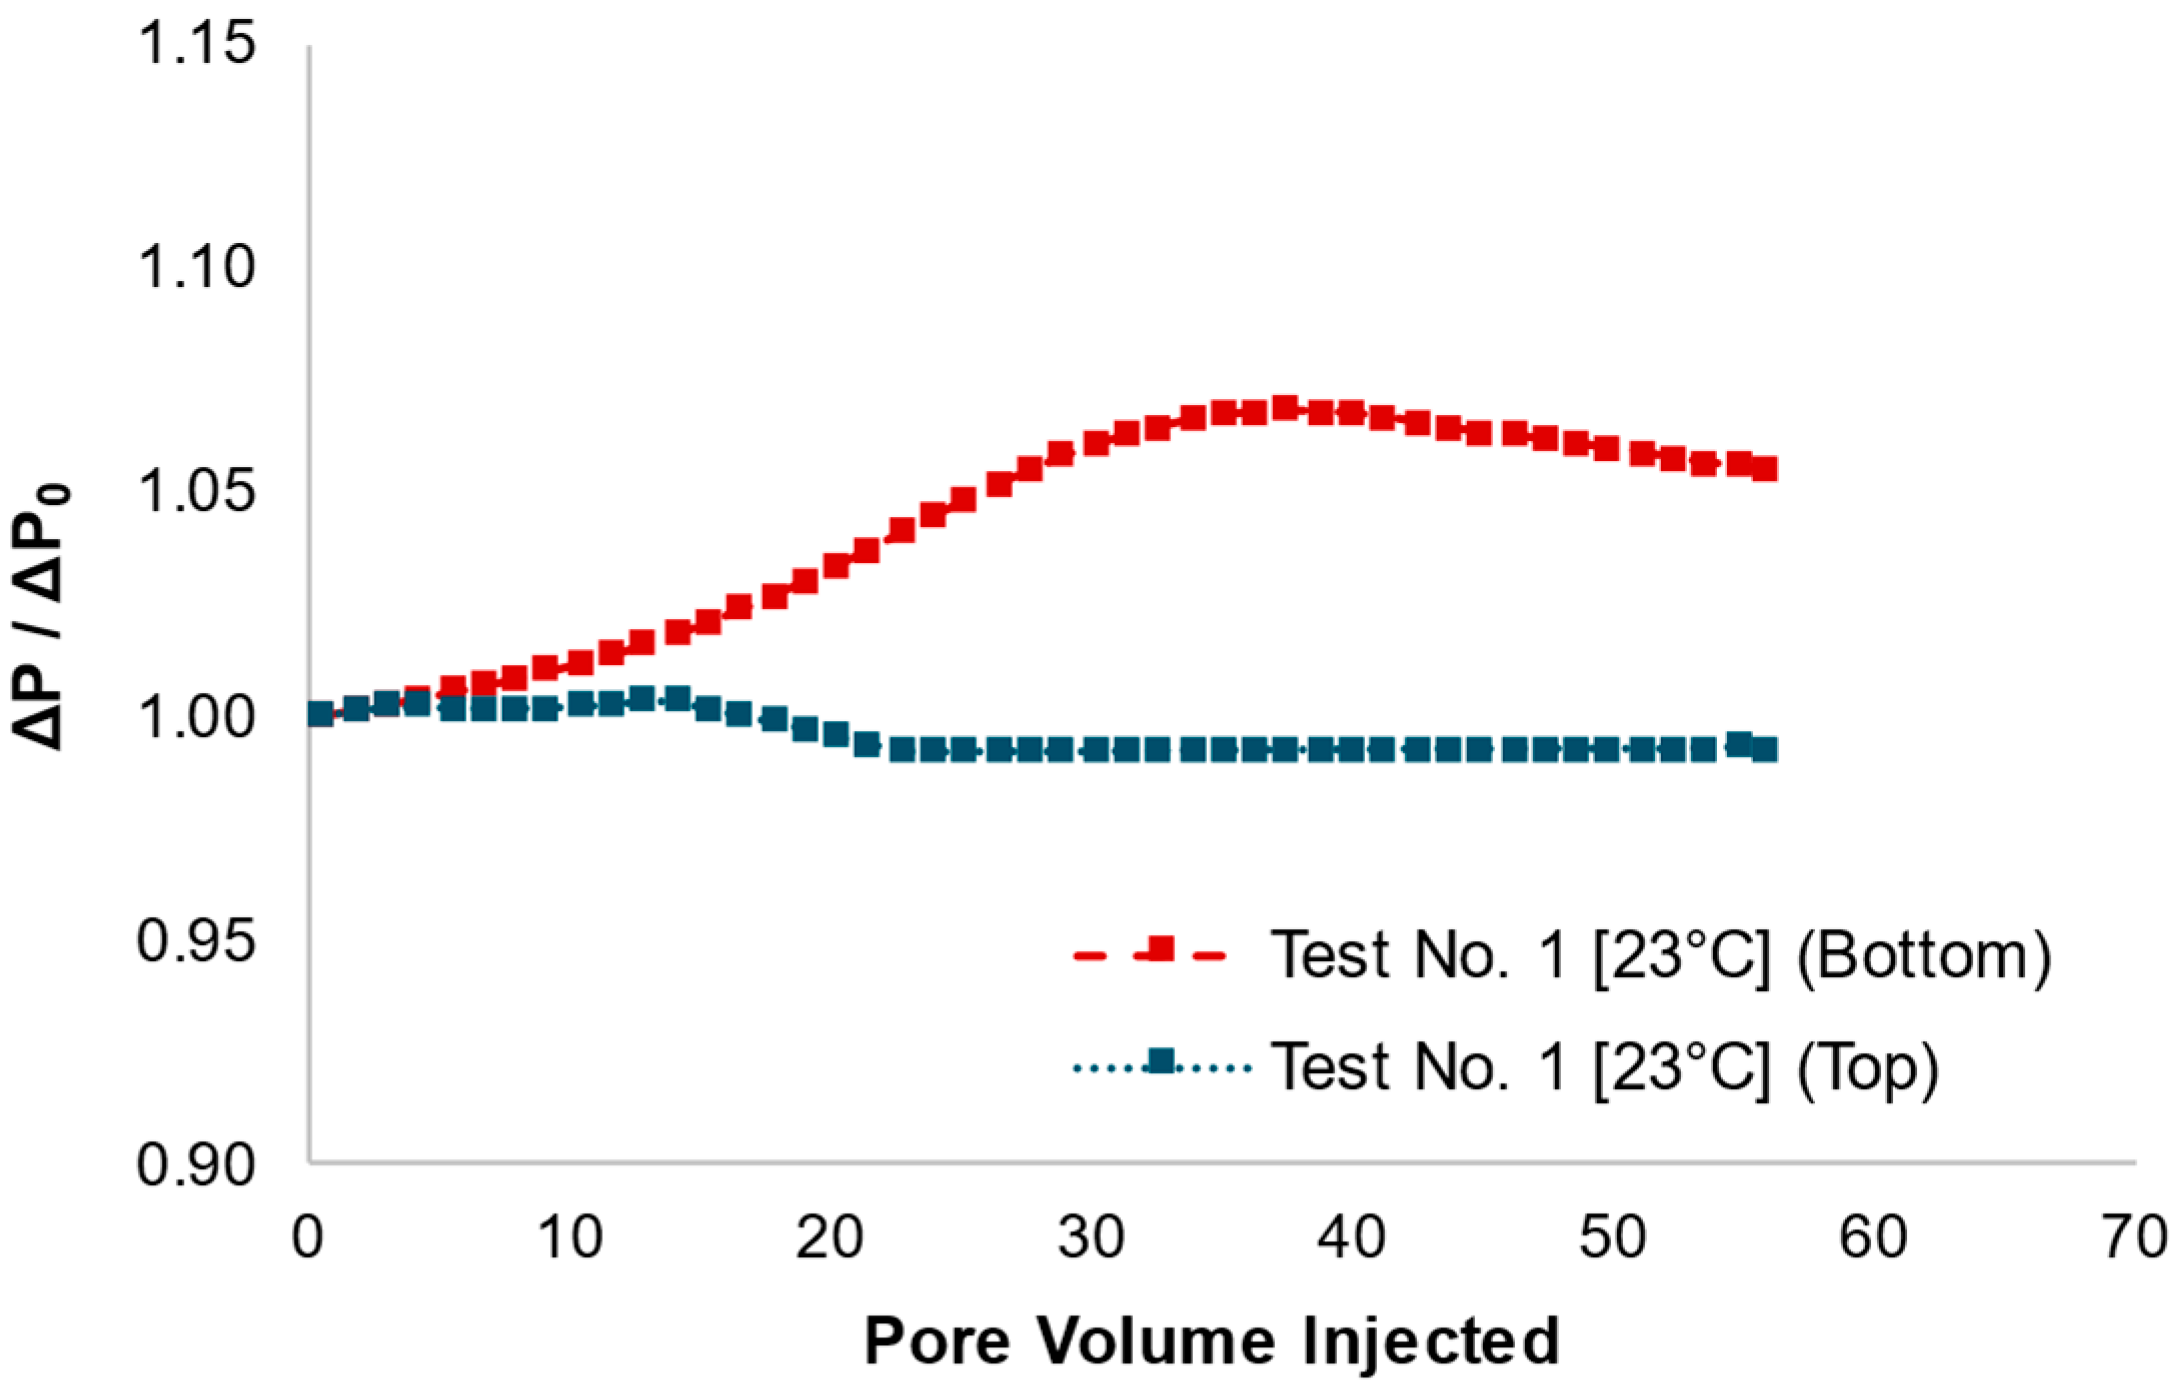
In the first stage, high-salinity brine (10,000 ppm) was injected at room temperature and a flow rate of 2340 mL/hr (superficial velocity of 1.79 × 10
−4 m/s). The dimensionless pressure drops graph (
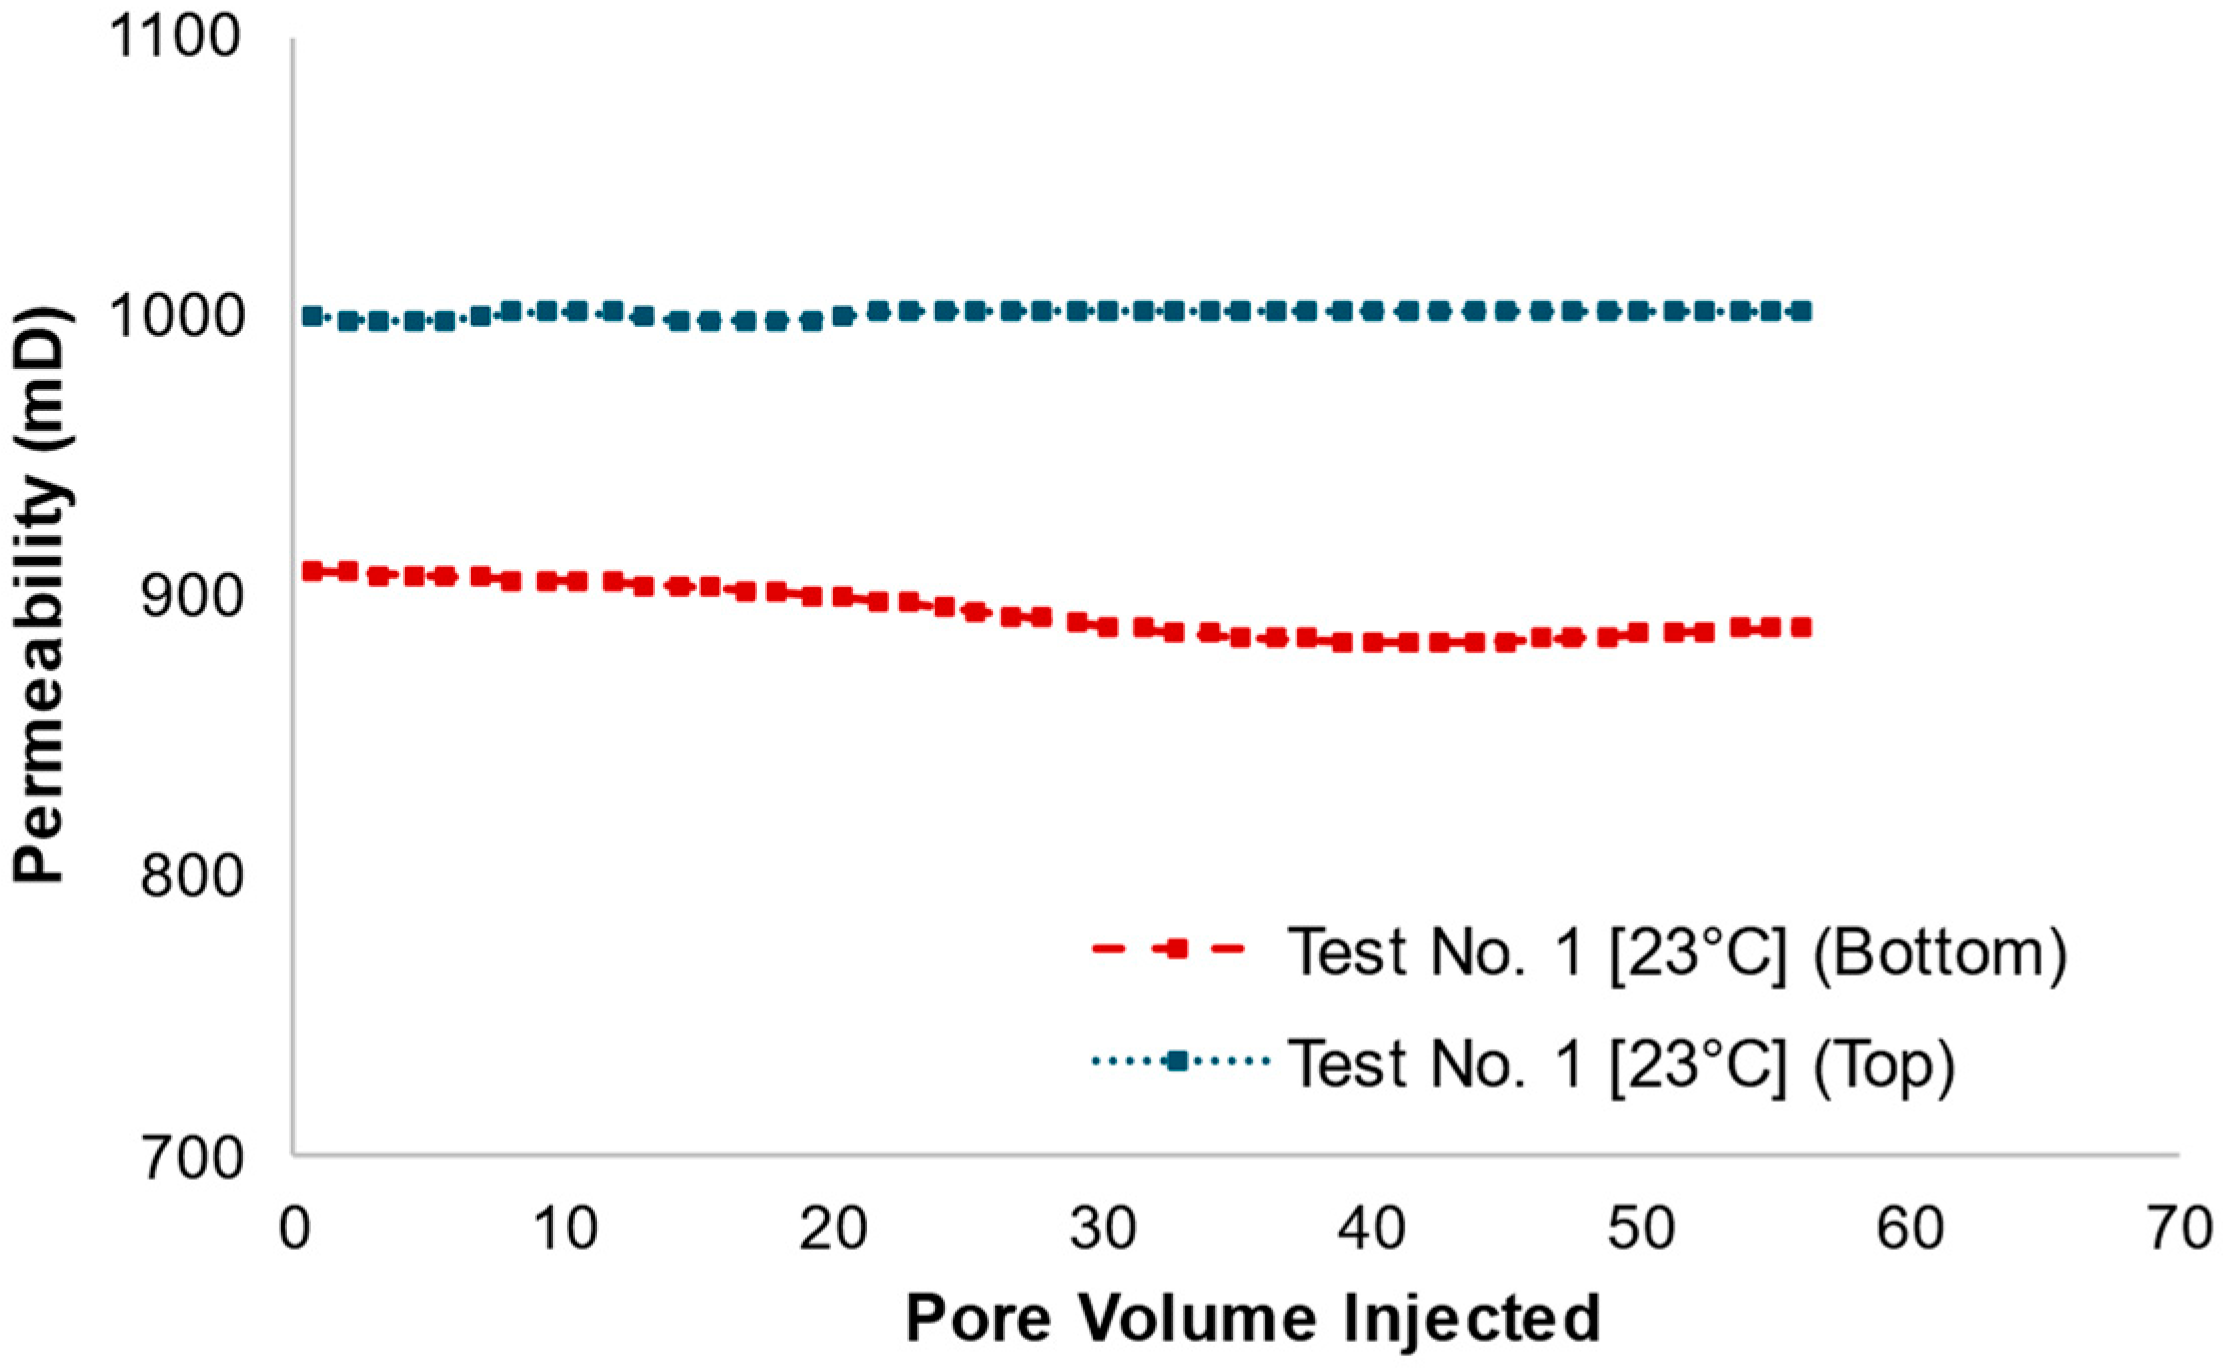
Figure 8) shows a small and gradual increase in the bottom interval, peaking at about 1.1, whilst the top interval remained flat. As explained in the uncertainty analysis section later, the pressure measurements are subject to an estimated uncertainty of ±3%. The corresponding permeability graph (
Figure 9) shows a slight decline in the bottom interval from around 910 mD to about 890 mD, and a stable value in the top interval (~1000 mD). These trends indicate minimal fines’ detachment, which is expected under high-salinity and low-temperature conditions where the EDL is compressed and fine–grain adhesion remains strong. The small pressure increase in the bottom interval may be attributed to slight grain rearrangement near the screen.
The previous observed performance underlines that under hydrodynamic effects, fine particles are primarily released near pore throats where shear force and flow velocities are high or from pore throats due to high–normal pressure gradients. Most pressure drops theoretically occur at pore throats, which are chiefly responsible for altering the permeability of the porous medium. These particles can be easily dislodged under sufficient hydrodynamic forces (critical flow velocity), significantly increasing permeability. The results above suggest that although the superficial flow velocity exceeds the critical threshold for releasing fines from the pores, the driving force is not sufficiently significant.
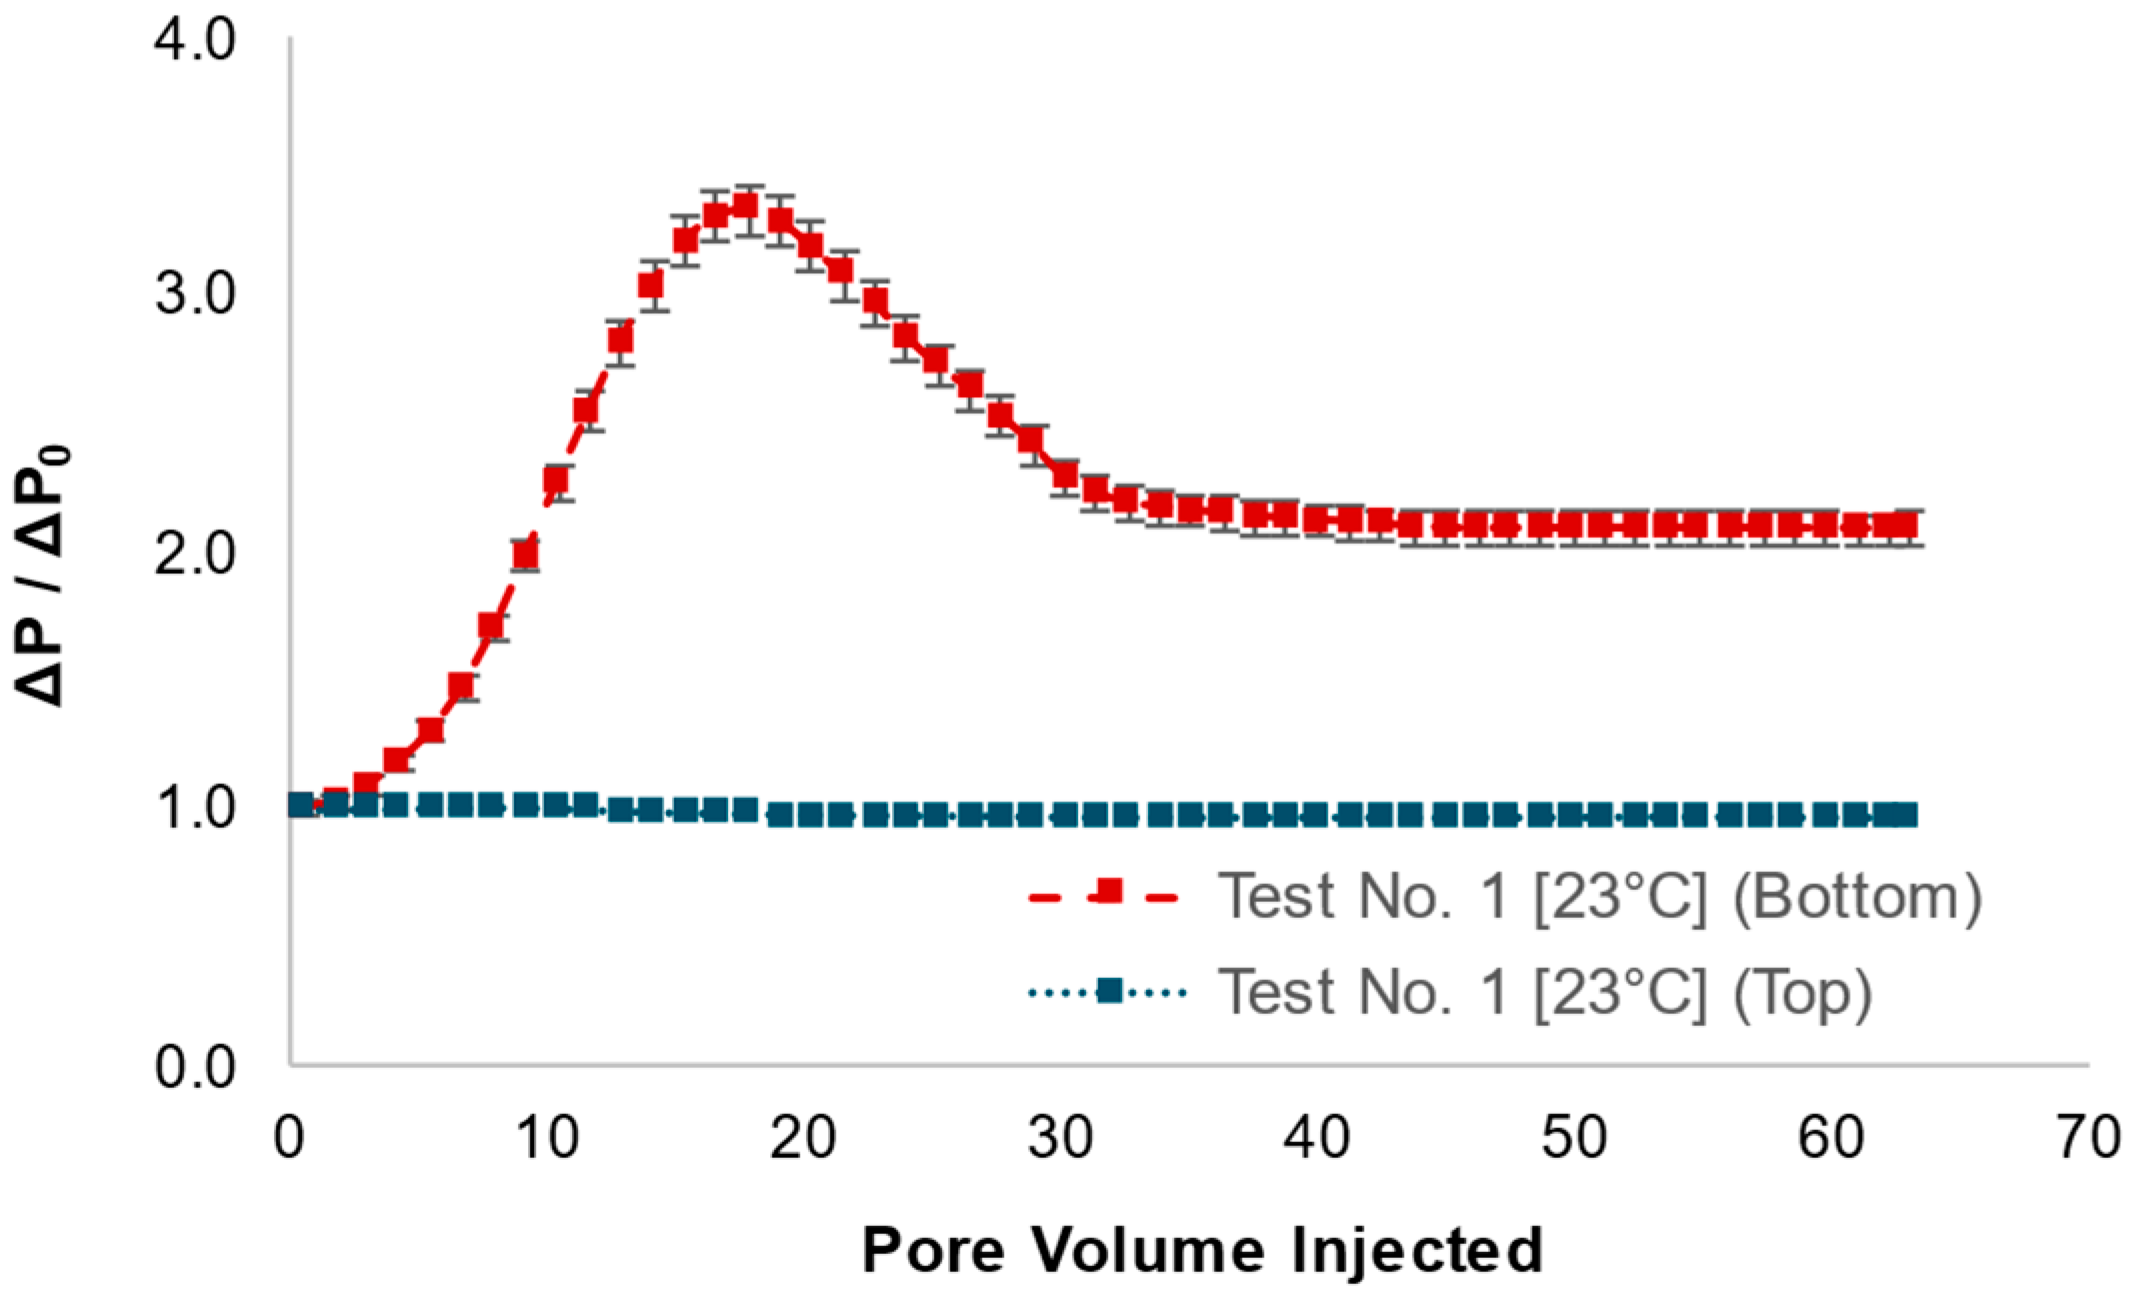
In the second stage, the brine salinity was reduced to 400 ppm whilst maintaining the same room temperature and flow rate. This salinity shock would expand the EDL, weakening adhesion forces and triggering significant fines detachment, especially of larger fine particles. The pressure drop graph (
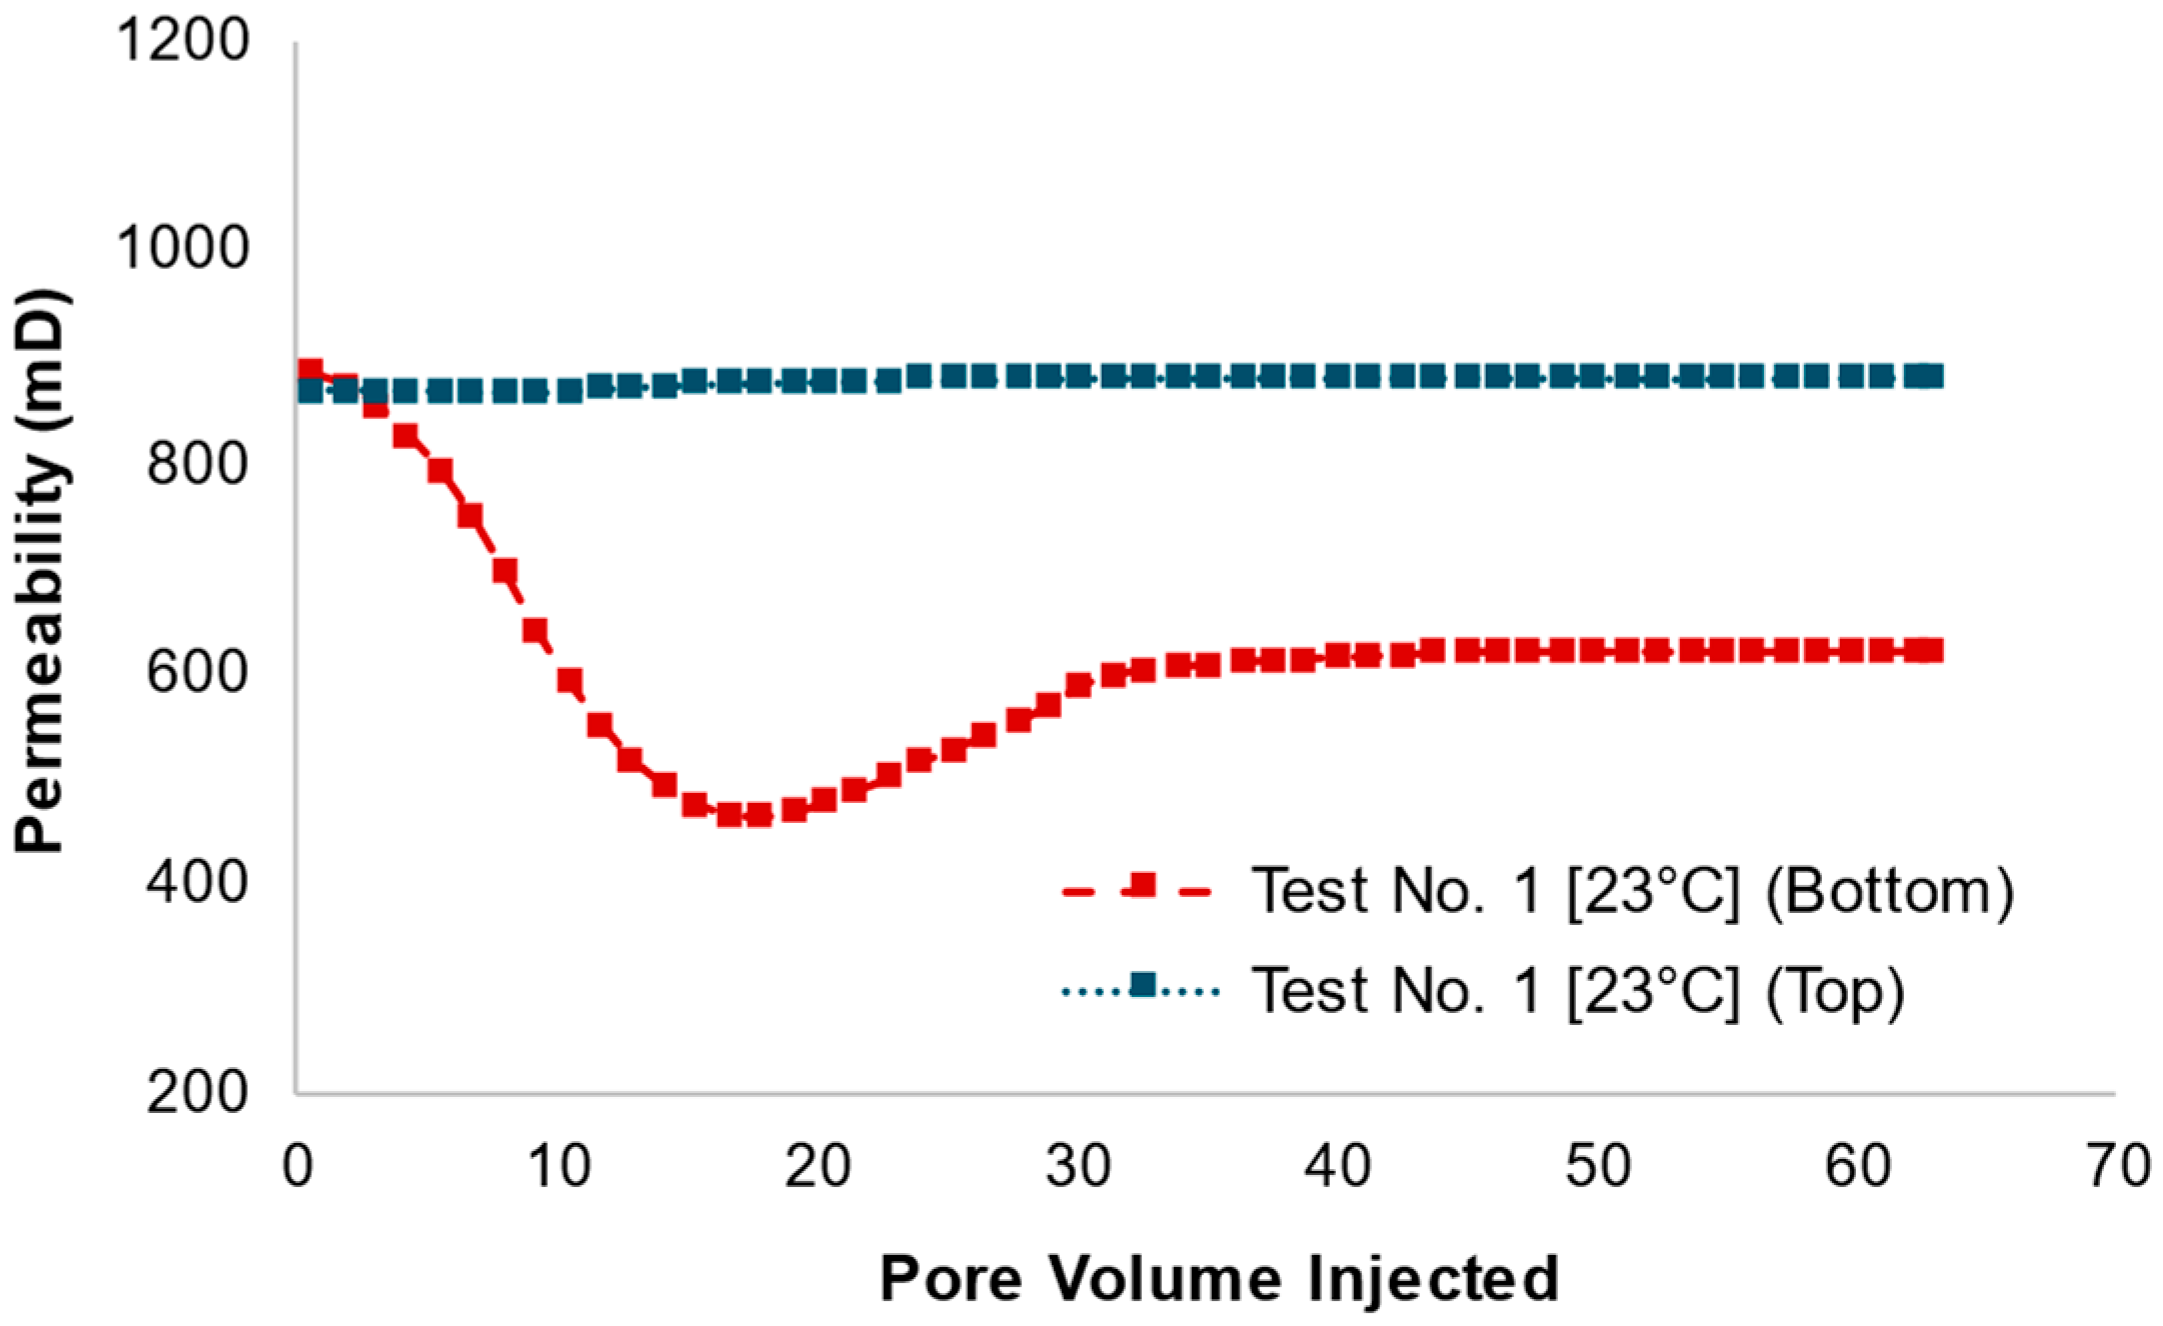
Figure 10) shows a sharp rise in the bottom interval, reaching a peak of about 3.4 before declining and stabilising around 2.1, indicating fines’ accumulation and partial bridging near the screen. In contrast, the top interval showed minimal pressure change, suggesting that the grated toward the screen whilst inducing minimal resistance to flow. The grey error bars shown on the data points correspond to a measurement uncertainty of ±3%. The permeability graph (
Figure 11) supports this, where the bottom interval’s permeability dropped drastically from ~885 mD to ~460 mD, with only partial recovery after 30 PV, whilst the top interval remained stable (~620 mD). These results confirm that ilised in the upper part of the sand pack migrated but accumulated near the screen.
4.2. Test No. 2 (80 °C)
This test was conducted in a higher-energy environment due to the increased temperature, which could enhance interactions among sand grains and fines, as well as between fines themselves, in addition to affecting fluid viscosity.
In the first stage, 10,000 ppm brine was injected at the same temperature as the sand pack (80 °C). As shown (
Figure 12), the dimensionless pressure drops (ΔP/ΔP
0) remained low and stable throughout the injection, with the bottom interval rising slightly to around 1.2 and the top interval remaining near 0.9. As a reminder, similar to Test No. 1, the data points presented here result from averaging the recorded measurements over five-minute intervals and are subject to an estimated uncertainty of ±3%. The corresponding permeability graph (
Figure 13) shows a gradual decrease in the bottom interval from ~465 mD to ~460 mD, and a slight increment in the top interval (~415 mD to ~425 mD). These trends suggest that although the temperature was high, the high salinity kept repulsive forces low, limiting fines’ detachment.
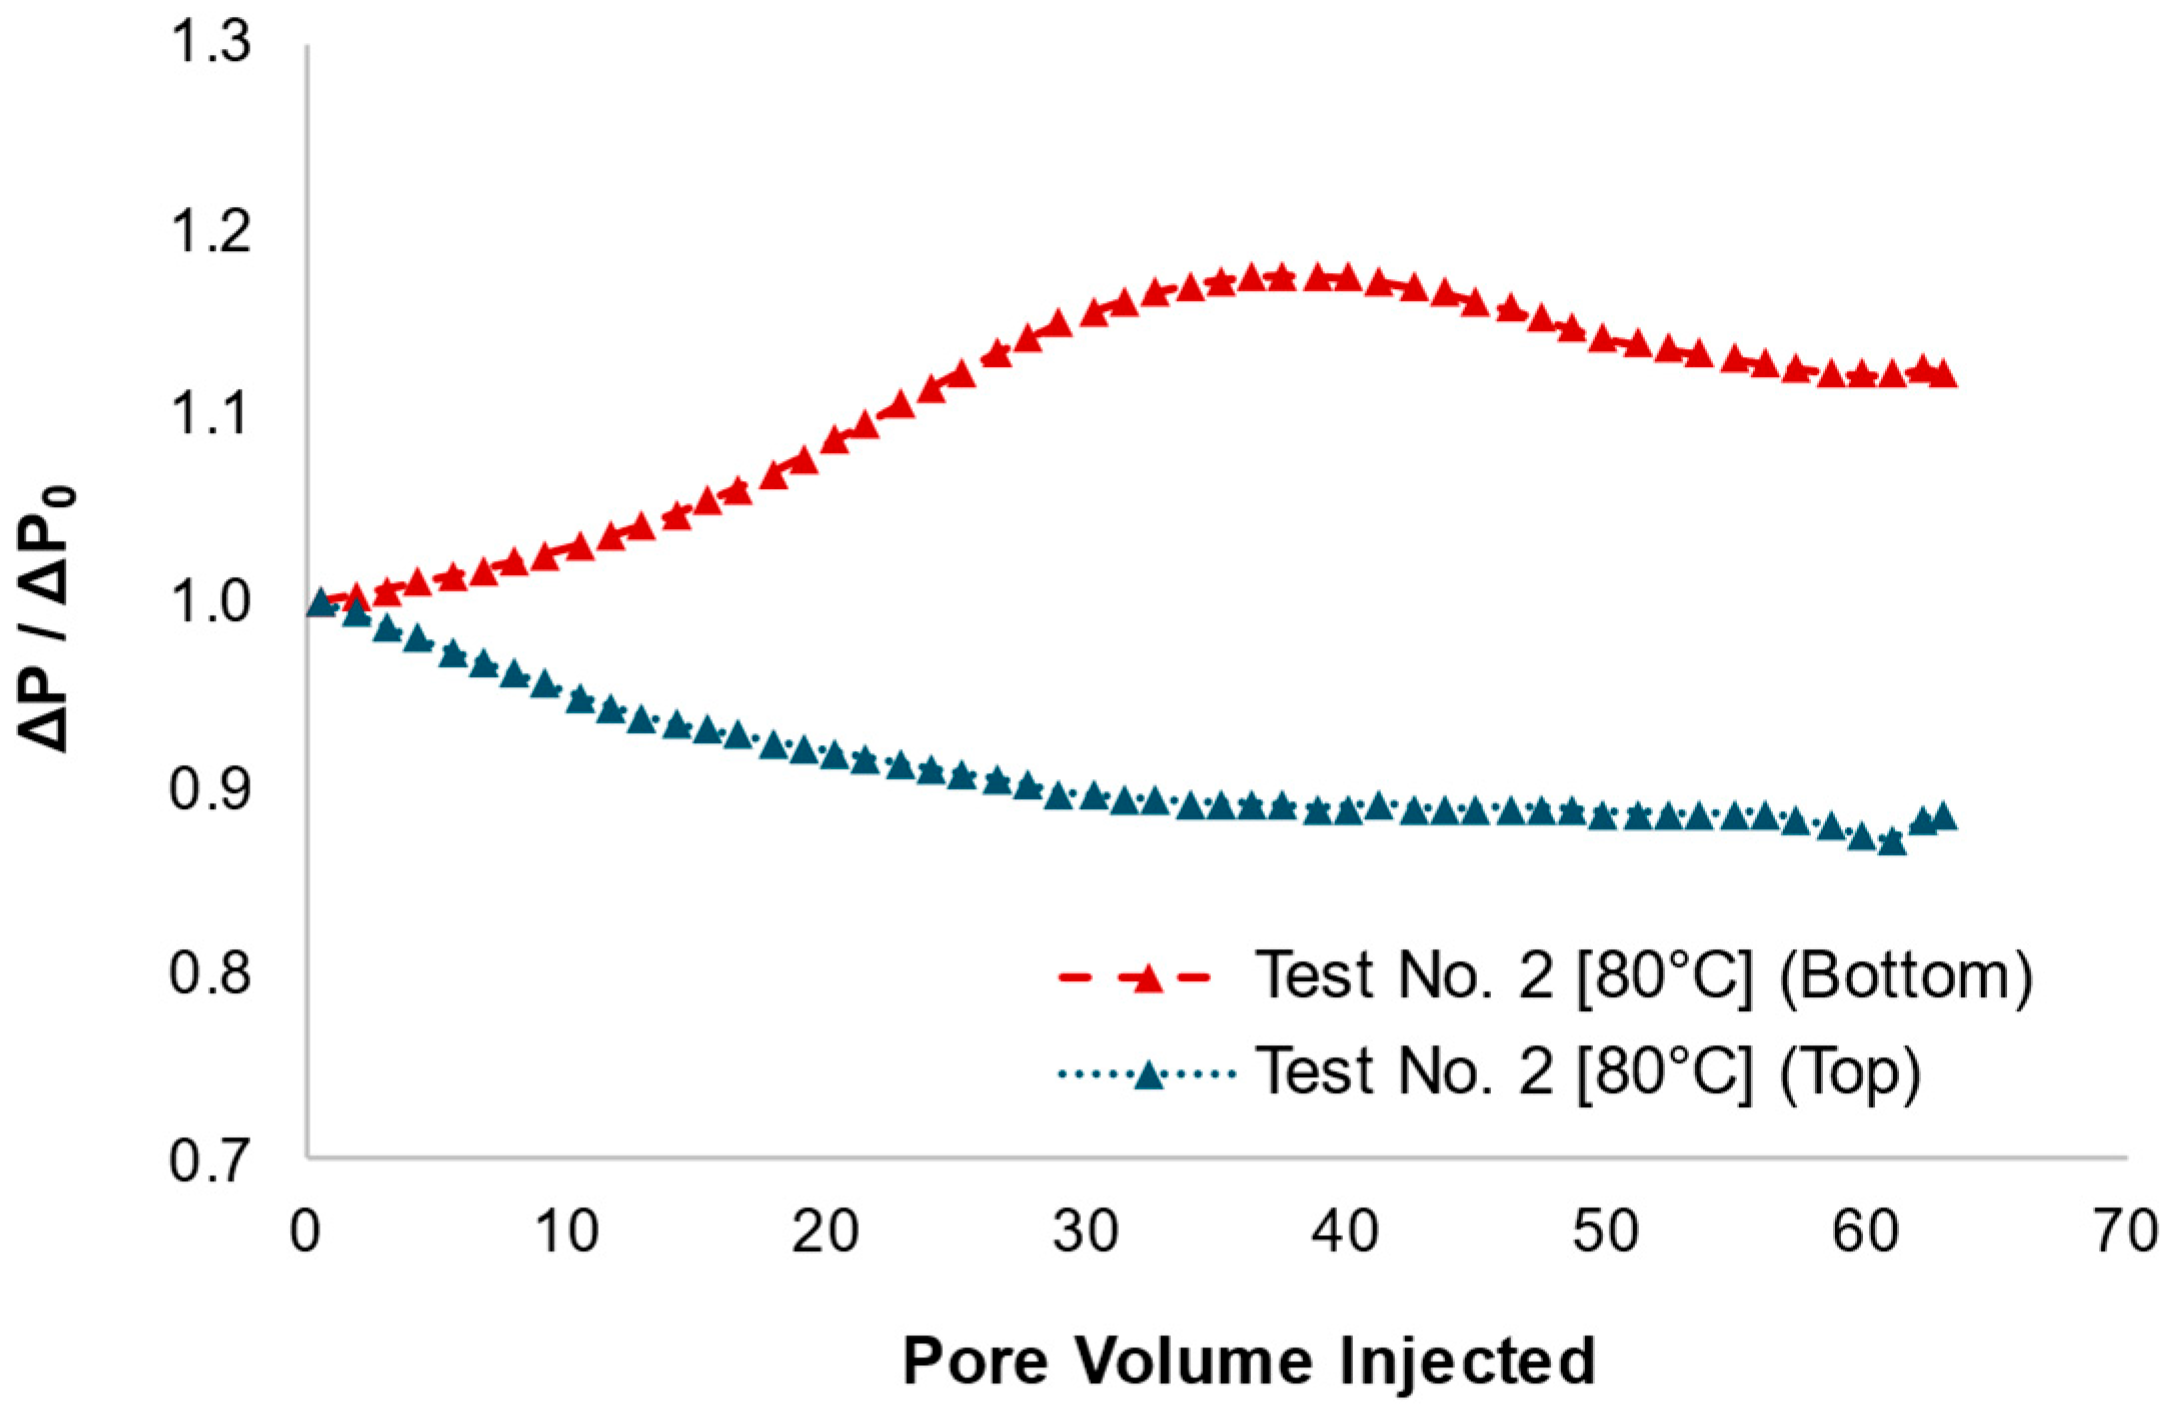
In the second stage, the brine salinity was reduced to 400 ppm whilst maintaining the same high temperature. The dimensionless pressure drops (
Figure 14) increased noticeably in the bottom interval, peaking around 3 before gradually declining. The top interval showed only a slight increase. This sharp rise in pressure corresponds to fines mobilisation triggered by the salinity shock, as low salinity expands repulsive forces and detaches fines. The combination of high temperature and low salinity enhanced fines’ release, leading to increased flow resistance near the screen due to transient fines accumulation. As previously described, the grey error bars present ±3% uncertainty.
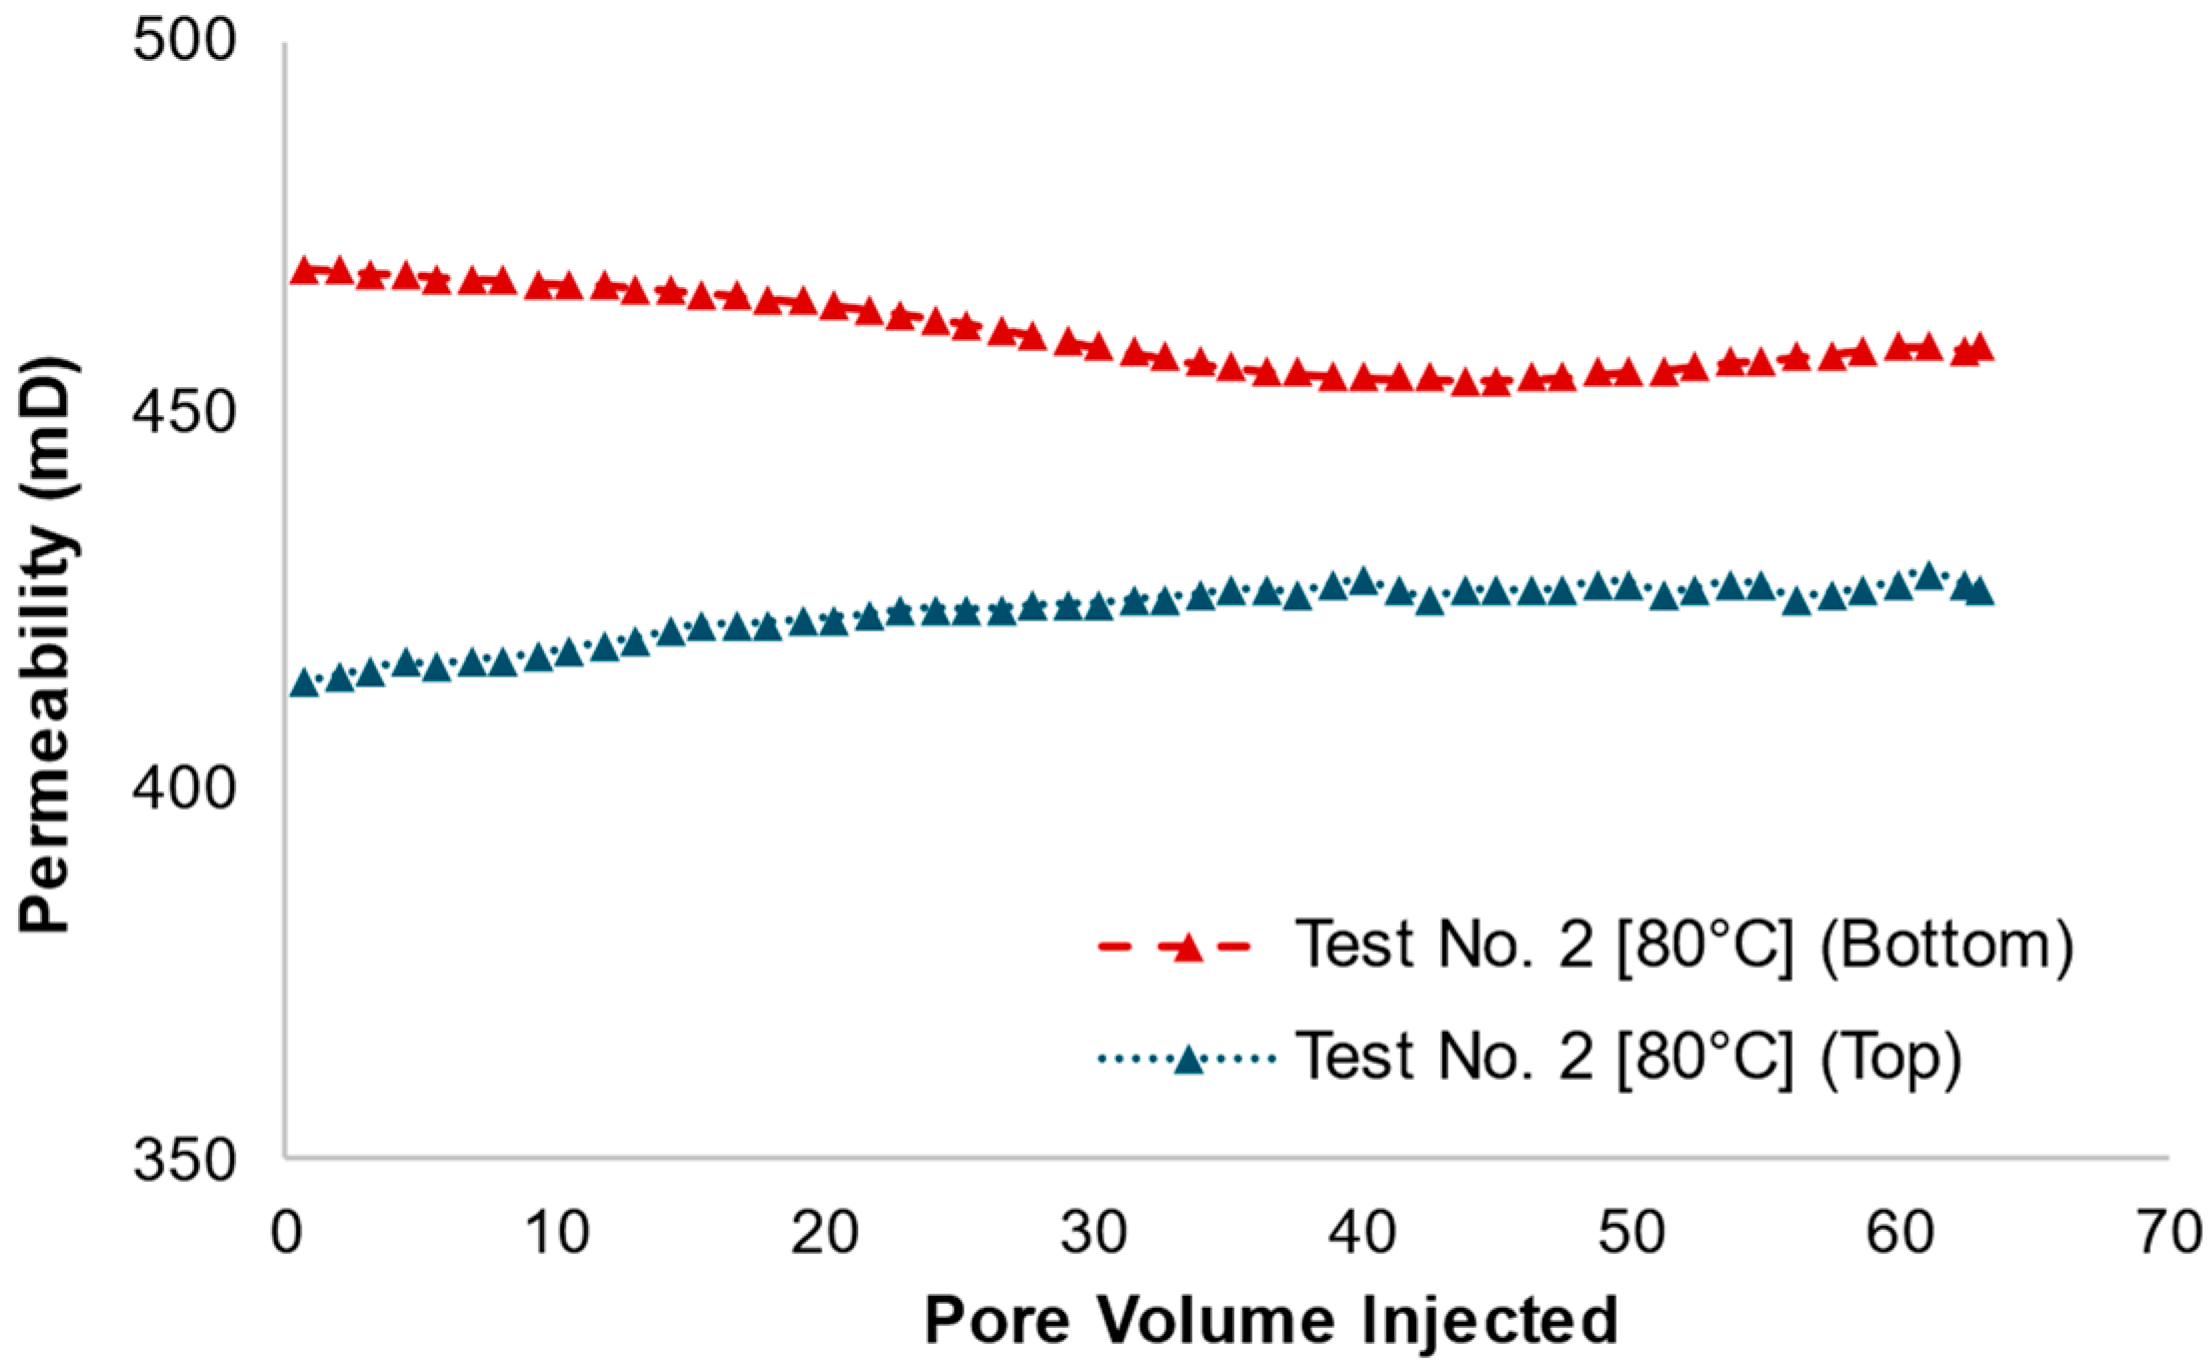
The permeability graph (
Figure 15) shows a clear decrease in permeability in the bottom interval, dropping from around ~480 mD to about ~390 mD over the first 30 pore volumes injected, followed by a slight recovery (~400 mD). In contrast, the top interval shows a mild upward trend throughout the injection (~450 mD to about ~465 mD).
4.3. Post-Test Comparison
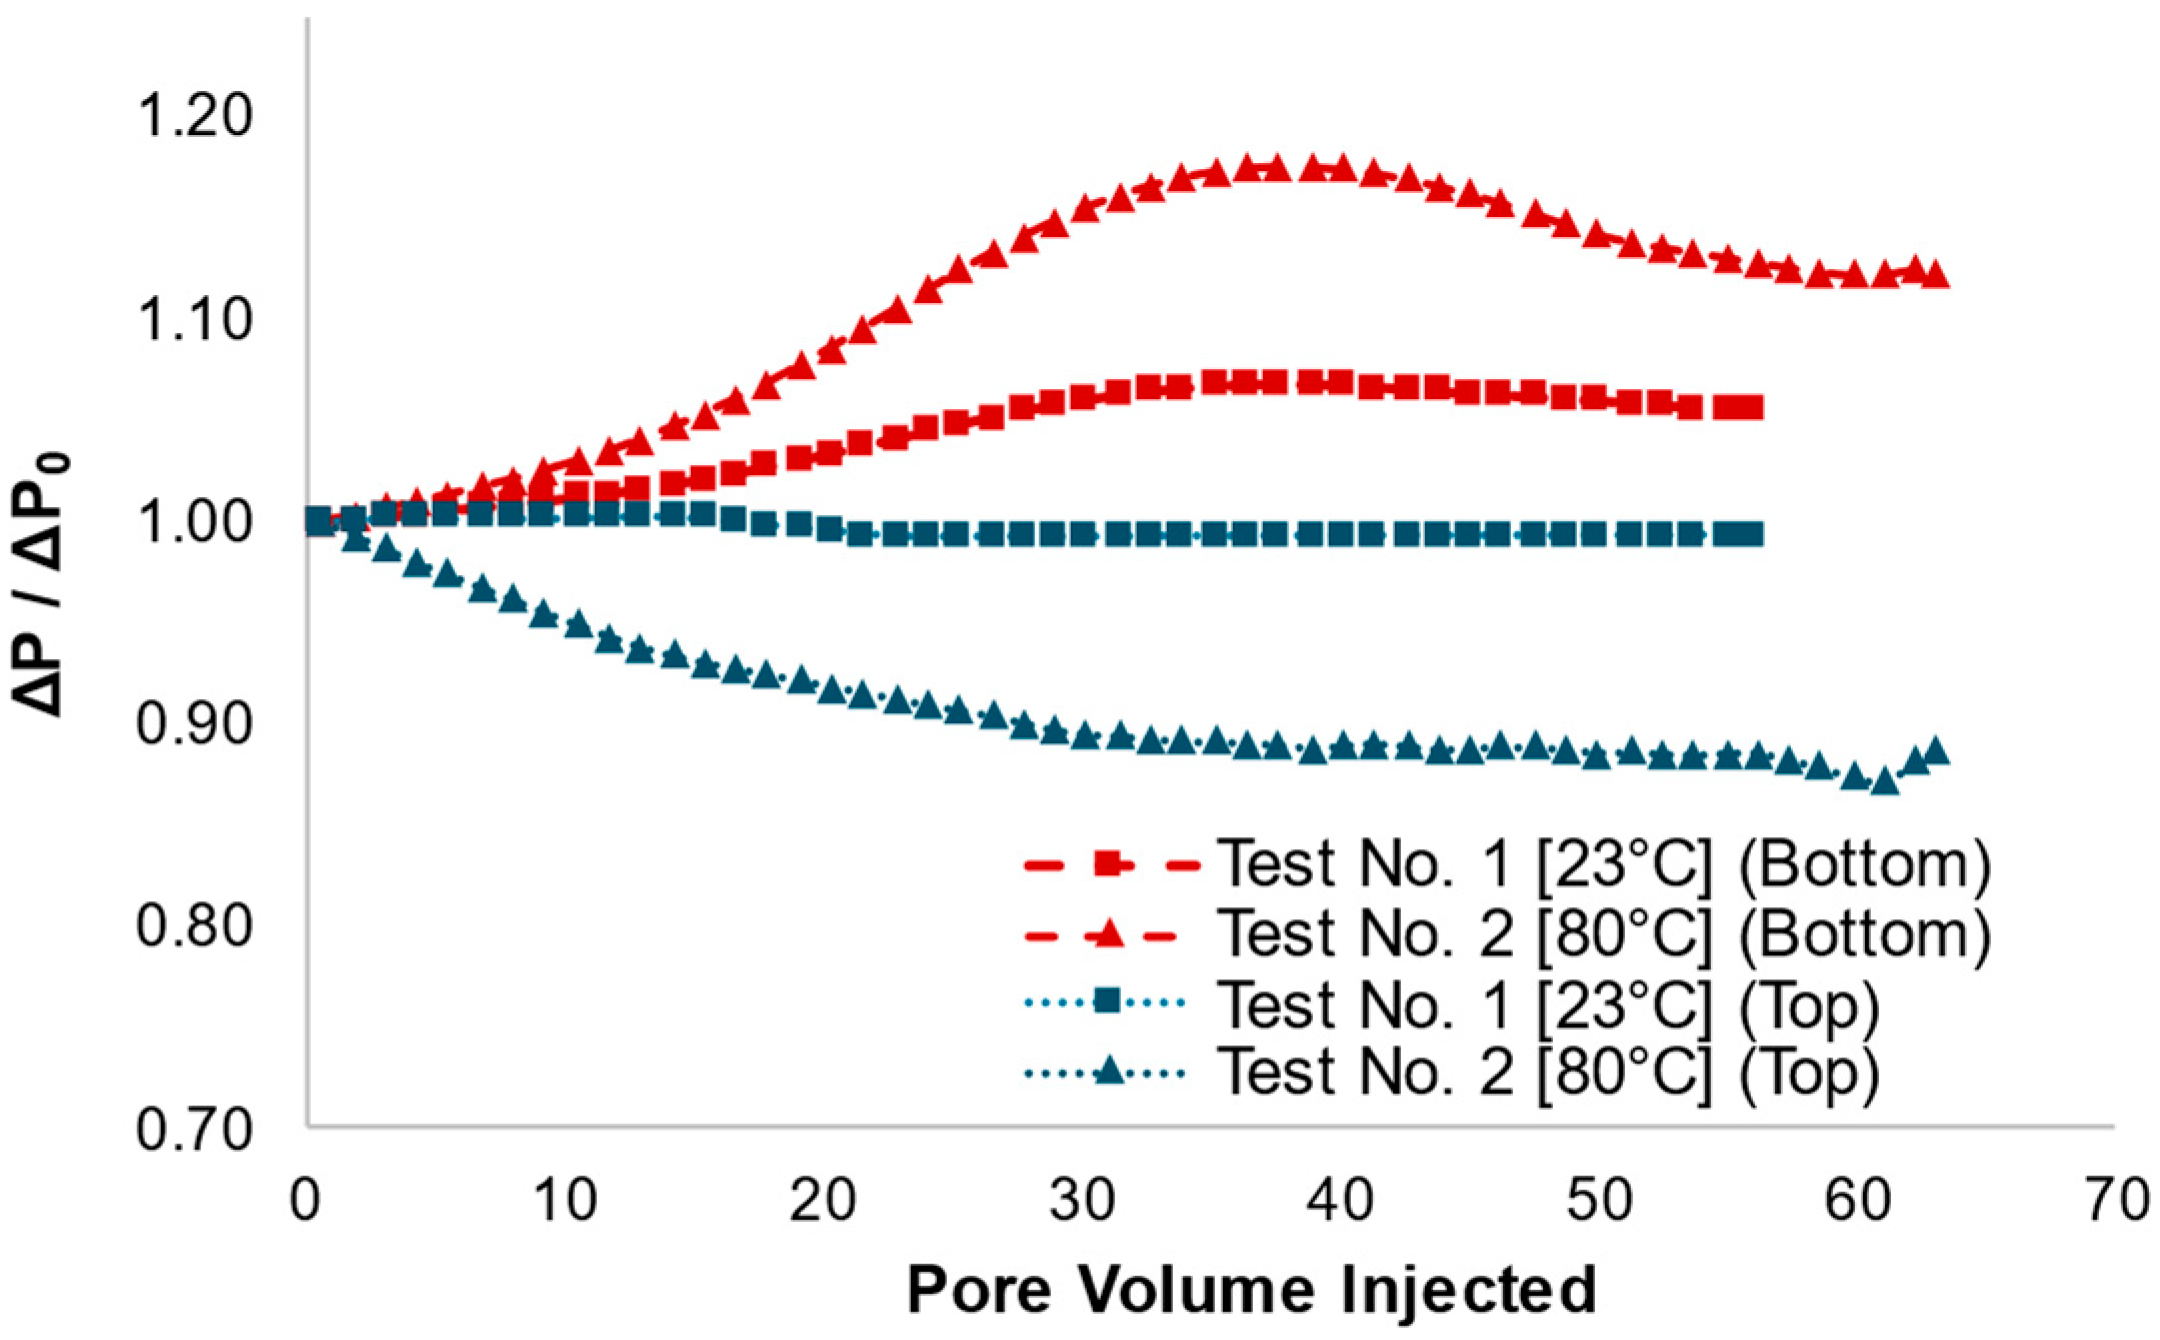
Figure 16 and
Figure 17 show the dimensionless pressure drops for both tests at each stage. In both tests, the effect of hydrodynamic forces on fines migration during the first stage was not significant, although Test No. 2 showed a slight increase in pressure drop near the screen, attributed to higher detachment of fines at higher temperature.
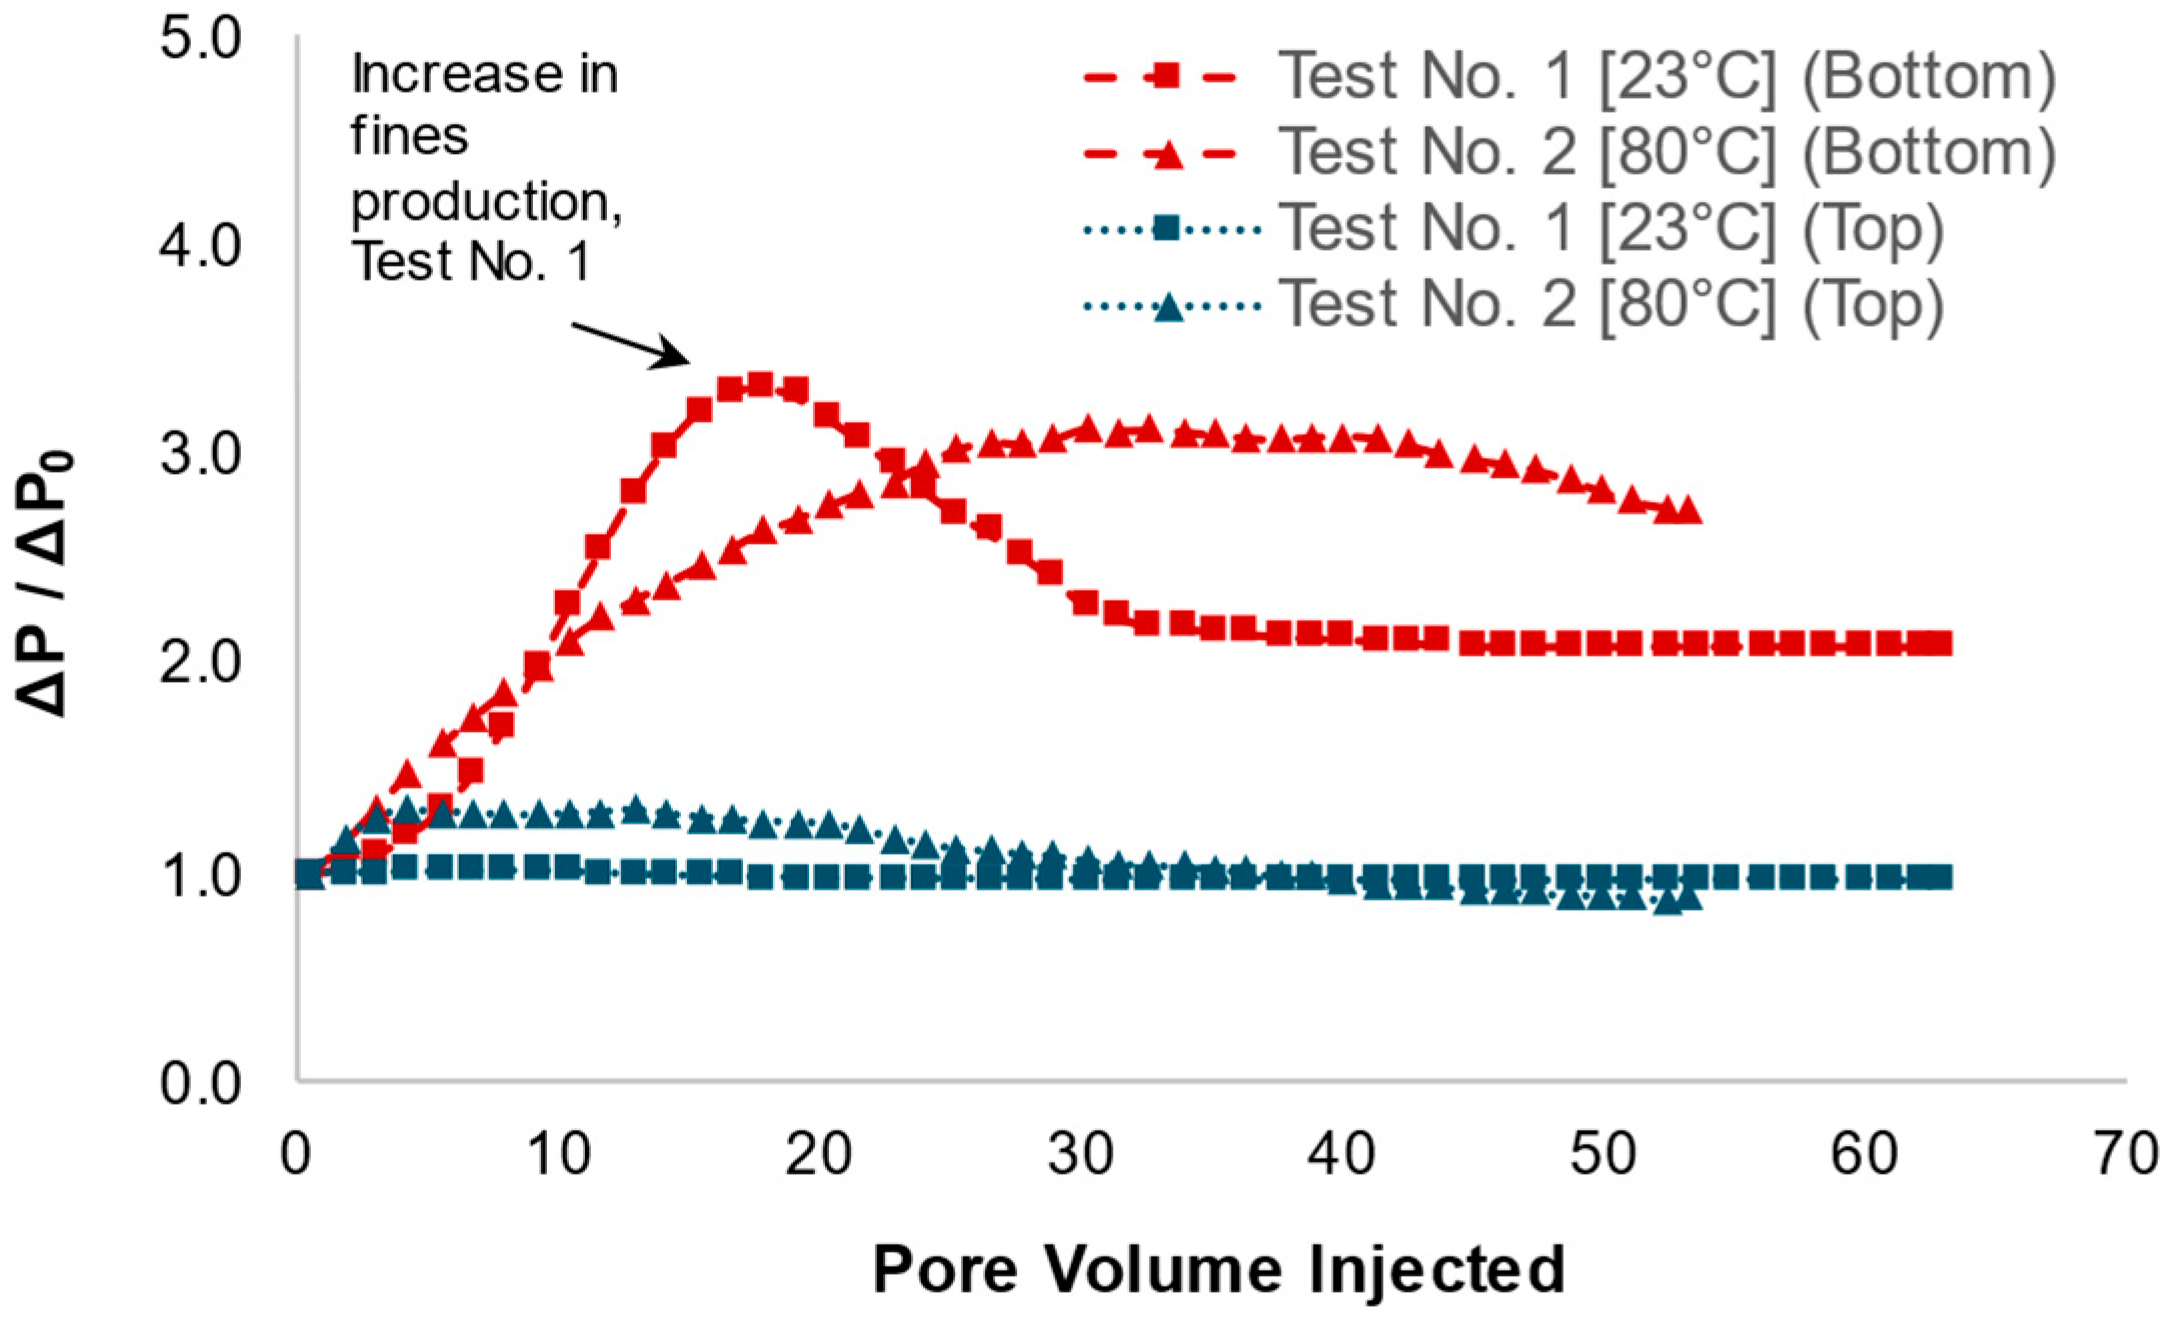
For the second stage, in Test No. 1 (low temperature + salinity shock), the dimensionless pressure drops in the bottom interval built up sharply to a peak of 3.5, and then plateaued around 2.3, indicating sustained flow resistance by multi-particle bridging near the screen. The salinity shock expands EDL, weakens fine–grain adhesion, and detaches primarily larger fines. However, at a low temperature, mobilised fines move slowly and fine–fine interactions promote aggregation, and fine–grain repulsive forces are not sufficient to prevent bridging. The result is a build-up of fines at the screen, consistent with the sustained pressure drop. In Test No. 2 (high temperature + salinity shock), the dimensionless pressure drop increased more gradually and had a lower peak (3.0), and then declined smoothly. In this case, both fine–grain and fine–fine repulsive interactions are boosted by EDL expansion and thermal effects. As a result, fines are more mobile, less prone to bridge, and able to pass through the system without accumulating, producing a more stable pressure profile. In addition, in Test No. 1, fines detached with a delay following the salinity shock, whereas in Test No. 2 (conducted at high temperature), fines began detaching from the initial pore volume injected due to weakening of attractive forces at a high temperature.
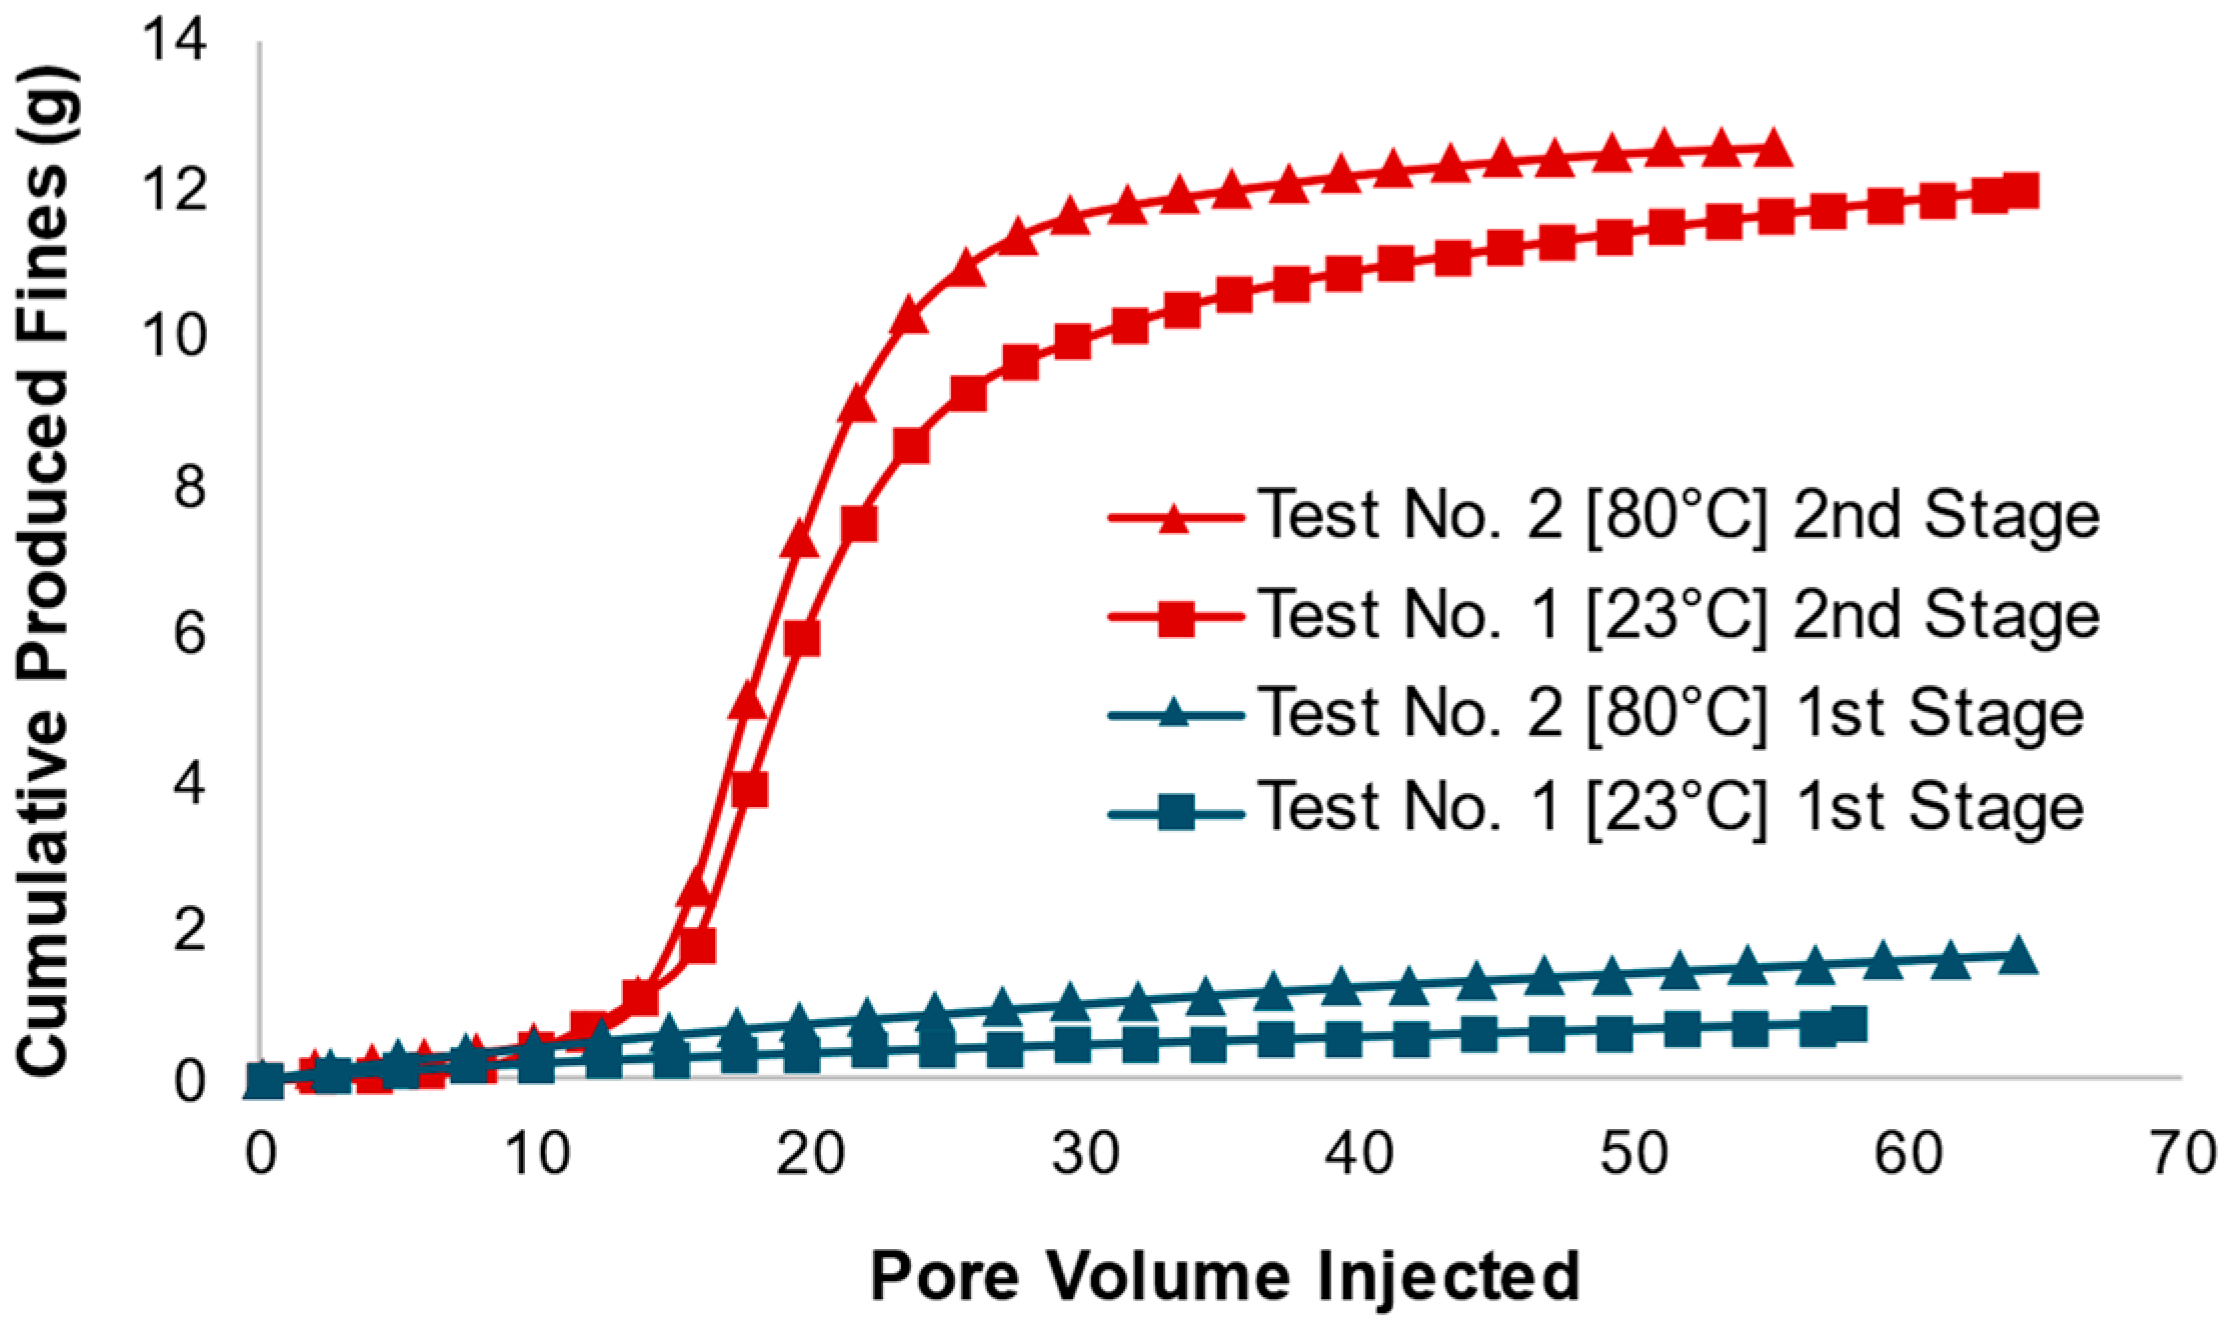
Concerning the produced fine concentration (
Figure 18), both tests showed low fine production during high-salinity (10,000 ppm) injection, confirming strong fine–grain attraction. Upon switching to low salinity, as shown in
Table 3, both Test No. 1 and Test No. 2 released significant fines, 12 g and 13 g, respectively (with ±0.1% uncertainty), indicating that EDL expansion was triggered. However, the nature of the detached particles and their interactions differed between tests. In Test No. 1, the lower temperature limited Brownian motion, and fine–fine attraction dominated, favouring flocculation or small aggregate formation. This promoted the risk of bridging, especially for slower-moving larger fines. In contrast, during Test No. 2, the elevated temperature reduced fine–fine attractive forces and made both small and large fines dispersed. Fines were too mobile and well-separated to form bridges. Thus, whilst fine production was comparable, the interaction mechanisms dictated plugging behaviour, not the volume alone. As is seen from the pressure drop and produced fines curves, in Test No. 2, the system responds uniformly, and the fines clog and flush simultaneously. However, in Test No. 1, the flow behaviour is non-uniform along the test. Fines move slowly and take time to exit; therefore, the fine production curve lags behind the pressure curve. This is evident in the data, where the pressure drops increase after 5 pore volumes of injection (
Figure 17), whilst the corresponding increase in produced fines concentration occurs after 15 PV (
Figure 18).
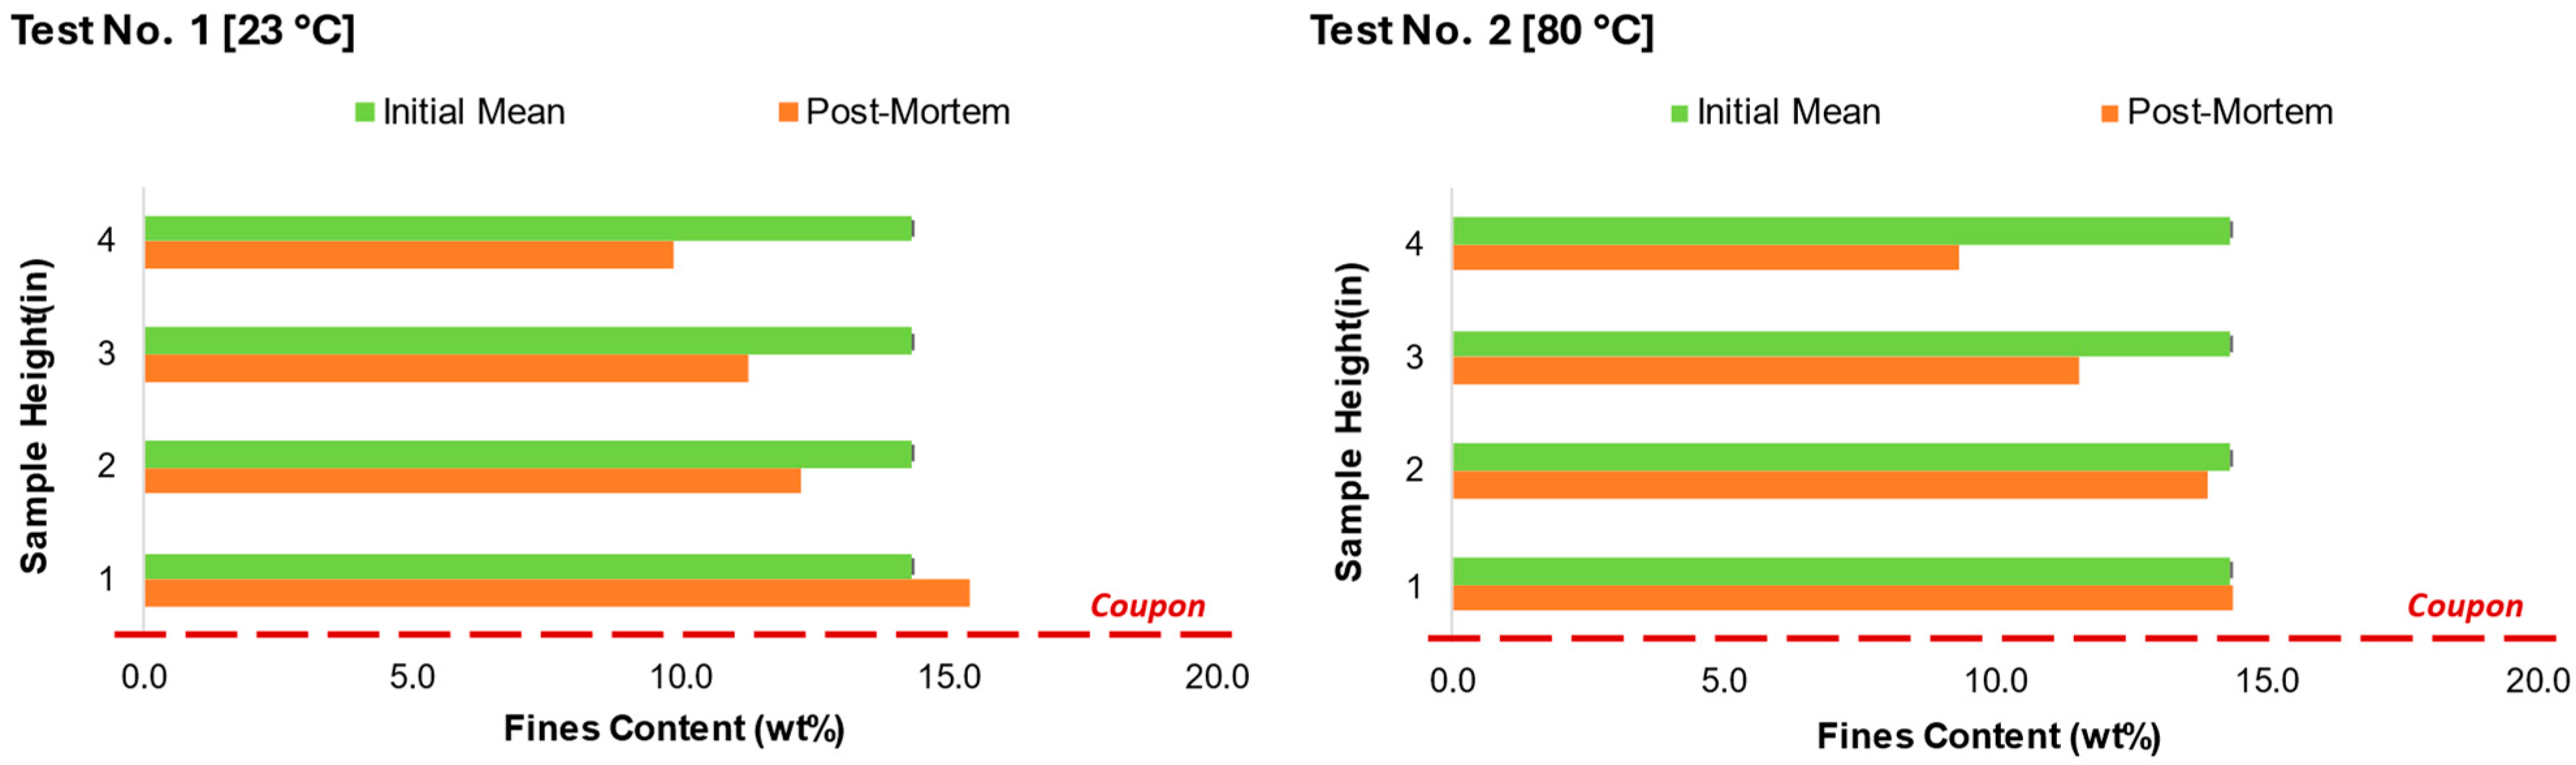
Post-test fines retention profiles (
Figure 19) reinforce the differences in particle interactions and flow behaviour. In this figure, the post-mortem fine content of each layer is compared to the initial mean value across all layers. In Test No. 1, fines accumulated in the bottom 2 inches of the sand pack, indicating that whilst detachment occurred, fine–fine cohesion and slow velocity led to retention near the screen. Once detached, fines did not remain dispersed; instead, their movement promoted bridging at pore restrictions or screen slots. This suggests attractive fine–fine interactions dominated at restrictions. In Test No. 2, fines content decreased mostly across top intervals, demonstrating that repulsive forces (both fine–grain and fine–fine) combined with high temperature allowed fines to remain mobile and separated. In Test No. 1, in the bottom layer, fines build up due to multi-particle bridging and plugging. However, in Test No. 2, in the bottom layer, fines build up due to clogging of high transport of fines and flow convergence, even though most fines are mobile.
The results show that under SAGD conditions, where the temperature is high, although mobilised fines are dispersed and move faster, there is still a high risk of near-wellbore plugging and clogging if sand screens are not properly designed, due to the large volume of fines migrating through the system.
The findings of this study are in strong agreement with both prior experimental investigations and field observations concerning fines migration under SAGD conditions. Laboratory studies have consistently shown that elevated temperature and low salinity significantly influence fines mobilisation and transport. Experimental work [
29,
36,
37] demonstrated that thermal effects can weaken interparticle bonds, while low salinity increases electrostatic repulsion, both contributing to enhanced fines’ detachment. The results follow the same trends, confirming that under SAGD-relevant flow and temperature conditions, there is a substantial risk of near-wellbore damage due to higher fines mobilisation and accumulation. These laboratory findings are further supported by field-scale observations reported, which documented permeability loss, screen plugging, and production decline in SAGD operations due to fines migration [
50,
51,
52]. These field studies highlight that even with enhanced dispersion of fines under thermal loading, improper sand control design remains a key contributor to long-term well performance issues.
4.4. Uncertainty Analysis
A total measurement error of approximately 3%, as shown in
Figure 10 and
Figure 14 (as examples), is estimated for pressure measurements, which is attributed to several contributing factors, as described here. The target flow rate of 2340 mL/hr could be maintained for 5 min by switching between two metering pumps due to their limited capacity of 200 mL. This could generate short time–flow fluctuations within the sample that influenced the pressure differential readings. The differential pressure data is also associated with an instrument error of ±0.035 psi.
To account for viscosity variation at an elevated temperature, industrial standard IAPWS-IF97 [
53] was utilised for permeability calculations rather than the direct measurement of it. The effect of mobilised fine particles on the viscosity of the carrier fluid (brine) was not investigated in the tests. Therefore, the pressure drops observed may partly result from the viscosity increase caused by fines transport within the porous medium.
The produced fines concentration measurements were conducted at the outlet line connected to the sand trap bottom, not at a location just below the sand control screen. A constant produced fine concentration rate was assumed during each sampling interval. It was ensured that consistency was maintained in the tests to compare the results. However, the measured NTU values were associated with a turbidimeter calibration error of ±0.1% (10 NTU).
The initial fines content measurements based on four samples taken during compaction resulted in a mean value of 14.33 wt% with a standard deviation of 2.33 wt%, as shown in
Figure 19.
5. Conclusions
The HP-HT testing facility offers several unique advantages for laboratory testing, including high pore volume injection, utilisation of sand-pack sample, and evaluation of the flow performance of sand control screens under an augmented-temperature environment. This novel experimental approach enabled a deeper understanding of the underlying physics governing fines mobilisation under increased temperature effects on a specific synthetic sand pack subjected to constant flow conditions. Key insights derived from these tests are summarised below.
The results demonstrated that salinity shock is the primary trigger for fines mobilisation in unconsolidated sand packs, whilst temperature plays a crucial role in governing the transport behaviour and plugging potential of mobilised fines. Under SAGD-like conditions (high temperature and low salinity), fines are more readily detached and remain better dispersed due to increased thermal agitation. Despite improved mobility, the cumulative fines flux toward the screen is significantly higher, increasing the likelihood of transient fines accumulation near the screen face. In contrast, under low-temperature conditions, fines tend to migrate slowly and accumulate more readily, leading to earlier and sharper pressure build-up due to localised bridging. The results indicate that, although high temperature enhances fines transport efficiency, screen plugging remains a critical risk if the screen design does not account for the volume and dynamics of fines’ flow in the near-wellbore region.
In this study, the quantity of mobilised fines was relatively limited, as the experiments were conducted over a small area and a few inches near the wellbore. This controlled scale facilitated the investigation of fines migration processes under SAGD-relevant conditions. However, in field-scale operations, fines migration can extend over much larger distances, often spanning meters from the wellbore. Such extended migration can result in a substantially higher volume of fines moving from the reservoir toward the sand screen. Consequently, the potential for near-wellbore plugging and clogging is likely to be greater in actual reservoir conditions than what is observed in laboratory-scale tests. It underscores the importance of designing and optimising sand control devices based on assessments that accurately capture the combined effects of temperature, salinity, flow rate, and the spatial extent of fines migration. Without such realistic considerations, there is a significant risk of severe plugging and associated declines in well productivity, due to the underestimation of critical factors influencing this phenomenon.
To further improve the understanding, future experiments should replicate SAGD conditions more closely. This includes conducting tests at higher field-representative temperatures (200 °C–240 °C). These efforts would support the development of optimised screen designs and operational protocols to minimise screen plugging and sustain production in SAGD operations.


