Abstract
During the 28th Conference of the Parties (COP28), organized under the United Nations Framework Convention on Climate Change and hosted by the United Arab Emirates, member nations reached a global agreement to begin transitioning away from fossil fuel dependence, forcing the Gulf Cooperation Council (GCC) countries to balance their commitment to a green transition with the need to secure short-term energy supplies. This study highlights the challenges facing the GCC’s efforts to expand renewable energy, even as the region continues to have a significant influence over international energy markets. This study utilizes dynamic panel estimation over the period 2003 to 2022, focusing on the core pillars of the Energy Transition Index to analyze the evolving renewable energy use in the GCC. The results present a clear and optimistic perspective on the region’s renewable energy prospects. Despite the continued dependence on fossil fuels, the findings indicate that, if effectively managed, oil and gas revenues can serve as strategic instruments to support the transition toward cleaner energy sources. These insights offer policymakers robust guidance for long-term energy planning and highlight the critical importance of international collaboration in advancing the GCC’s sustainable energy transition.
1. Introduction
Shifting to cleaner energy sources is essential for both environmental sustainability and economic progress. Transitioning from fossil fuels to renewable energy plays an important role in driving climate solutions, reducing pollution, and protecting ecosystems. Since fossil fuel consumption is a major contributor to greenhouse gas emissions and global warming, adopting cleaner alternatives can significantly cut carbon emissions, improve air quality, and preserve natural habitats.
This transition also aligns with the United Nations Sustainable Development Goals (SDGs), particularly Goal 7 (Affordable and Clean Energy) and Goal 13 (Climate Action) [1]. Expanding access to sustainable energy is a key factor in achieving various other SDGs, including poverty reduction, gender equality, improved healthcare, and the development of sustainable cities. By prioritizing clean energy, countries can drive economic growth while ensuring a healthier and more resilient future.
Global instability has made it harder for countries to navigate energy transitions while adapting to an increasingly complex global landscape. The concept of the “polycrisis” has forced governments to reassess their financial priorities, focusing on immediate energy security and economic stability. At the same time, this situation has sparked discussions about the evolving dynamics of the “energy triangle” [2,3]. Where the focus was once primarily on access, it has now expanded to include equity, inclusivity, and long-term economic growth.
The GCC countries are some of the most important players in the world of oil and gas. Due to their massive oil and gas reserves, advanced technology, and key location between East and West, they have built a powerful presence in the energy market. Saudi Arabia leads the way, with huge oil fields like Ghawar and Safaniya that are known around the world. Kuwait is not far behind, with its Burgan Field, one of the largest oil fields on the planet. The UAE also plays a major role, especially with the Zakum Field in its portfolio. Even Bahrain and Oman, though smaller producers, contribute meaningfully and help shape the energy dynamics of the region. Together, the GCC countries are not just energy-rich; they are considered global oil giants.
In recent years, the Gulf Cooperation Council (GCC) countries have made notable strides in shaping their national climate policies and reinforcing their environmental commitments [4]. As global climate concerns intensify, these issues have taken on increased significance within the region’s energy and environmental agendas. This shift is evident in both national development plans and the commitments made under the United Nations Framework Convention on Climate Change (UNFCCC). The growing momentum toward building diversified, low-carbon, and resource-efficient economies reflects not only the urgency of addressing climate change, but also a strategic response to evolving global energy markets, the pursuit of long-term economic resilience, and the realization of ambitious national visions.
As highlighted by [5,6], many regional initiatives are geared toward fostering innovation and technological advancement while creating mutually beneficial opportunities through international collaboration. Key areas of focus include hydrogen development, carbon trading, and broader sustainability partnerships. The selection of the United Arab Emirates as the host of the COP28 in December 2023 further signals the region’s growing intent to play a leading role in global climate action, not only as a traditional energy supplier, but also as an active and forward-looking participant in shaping the future of international climate policy (“COP28: What Was Achieved and What Happens Next?”. https://unfccc.int/cop28/5-key-takeaways, accessed on 15 April 2025).
The real challenge, however, lies in moving beyond ambitious targets to tangible implementation. This includes addressing greenhouse gas emissions, improving energy efficiency, and accelerating the adoption of renewable energy. A comprehensive and well-coordinated approach through policies, initiatives, and collaborations with leading climate-focused nations could position the GCC as a major contributor to global climate action. A unified “GCC Climate Framework,” for instance, could help address climate challenges at both the national and regional levels while also contributing valuable insights, research, and technological advancements to the broader energy transition, keeping the Paris Agreement’s 1.5 °C goal within reach.
GCC countries currently derive between 15% and 40% of their GDP, and nearly all government revenue, from fossil fuel exploitation. According to [7], all GCC nations, except Qatar, have announced net-zero emissions targets, aiming for either 2050 or 2060. The United Arab Emirates and Oman plan to reach net zero by 2050, while Bahrain, Kuwait, and Saudi Arabia have set their goals for 2060.
Recognizing this challenge, these nations have been working toward economic diversification by developing alternative revenue streams such as service hubs, tourism, hospitality, and business centers. The UAE and Qatar have made significant strides in reducing their dependence on fossil fuels, while Saudi Arabia and Kuwait have progressed at a slower pace.
The shift toward renewable energy is now happening faster than previously anticipated, requiring GCC countries to reassess their economic visions and investment strategies to accelerate the transition. Fortunately, their substantial financial reserves, sovereign wealth funds, and past investments in infrastructure, education, and healthcare provide a strong foundation for successfully evolving into advanced economies without relying on fossil income.
Despite these advantages, the urgency of diversifying remains critical. Without swift and strategic action, living standards are at risk of declining. To ensure long-term economic sustainability, GCC nations must prioritize investments in sectors that offer the highest returns in terms of competitiveness and future growth [8].
The World Economic Forum’s 2023 report on advancing energy transitions notes that, despite progress over the past ten years, the global shift toward sustainable energy has slowed down, largely due to geopolitical tensions and the persistent energy crisis.
The Energy Transition Index, which assesses 120 countries based on their current energy systems and readiness for change, highlights that many nations are now prioritizing energy security over equity in the transition process. The Energy Transition Index (ETI) framework is a widely used tool that takes a comprehensive approach to balancing three key aspects of the energy landscape: equity, security, and sustainability. At the same time, it leverages transition enablers to adapt to the energy sector’s evolving demands.
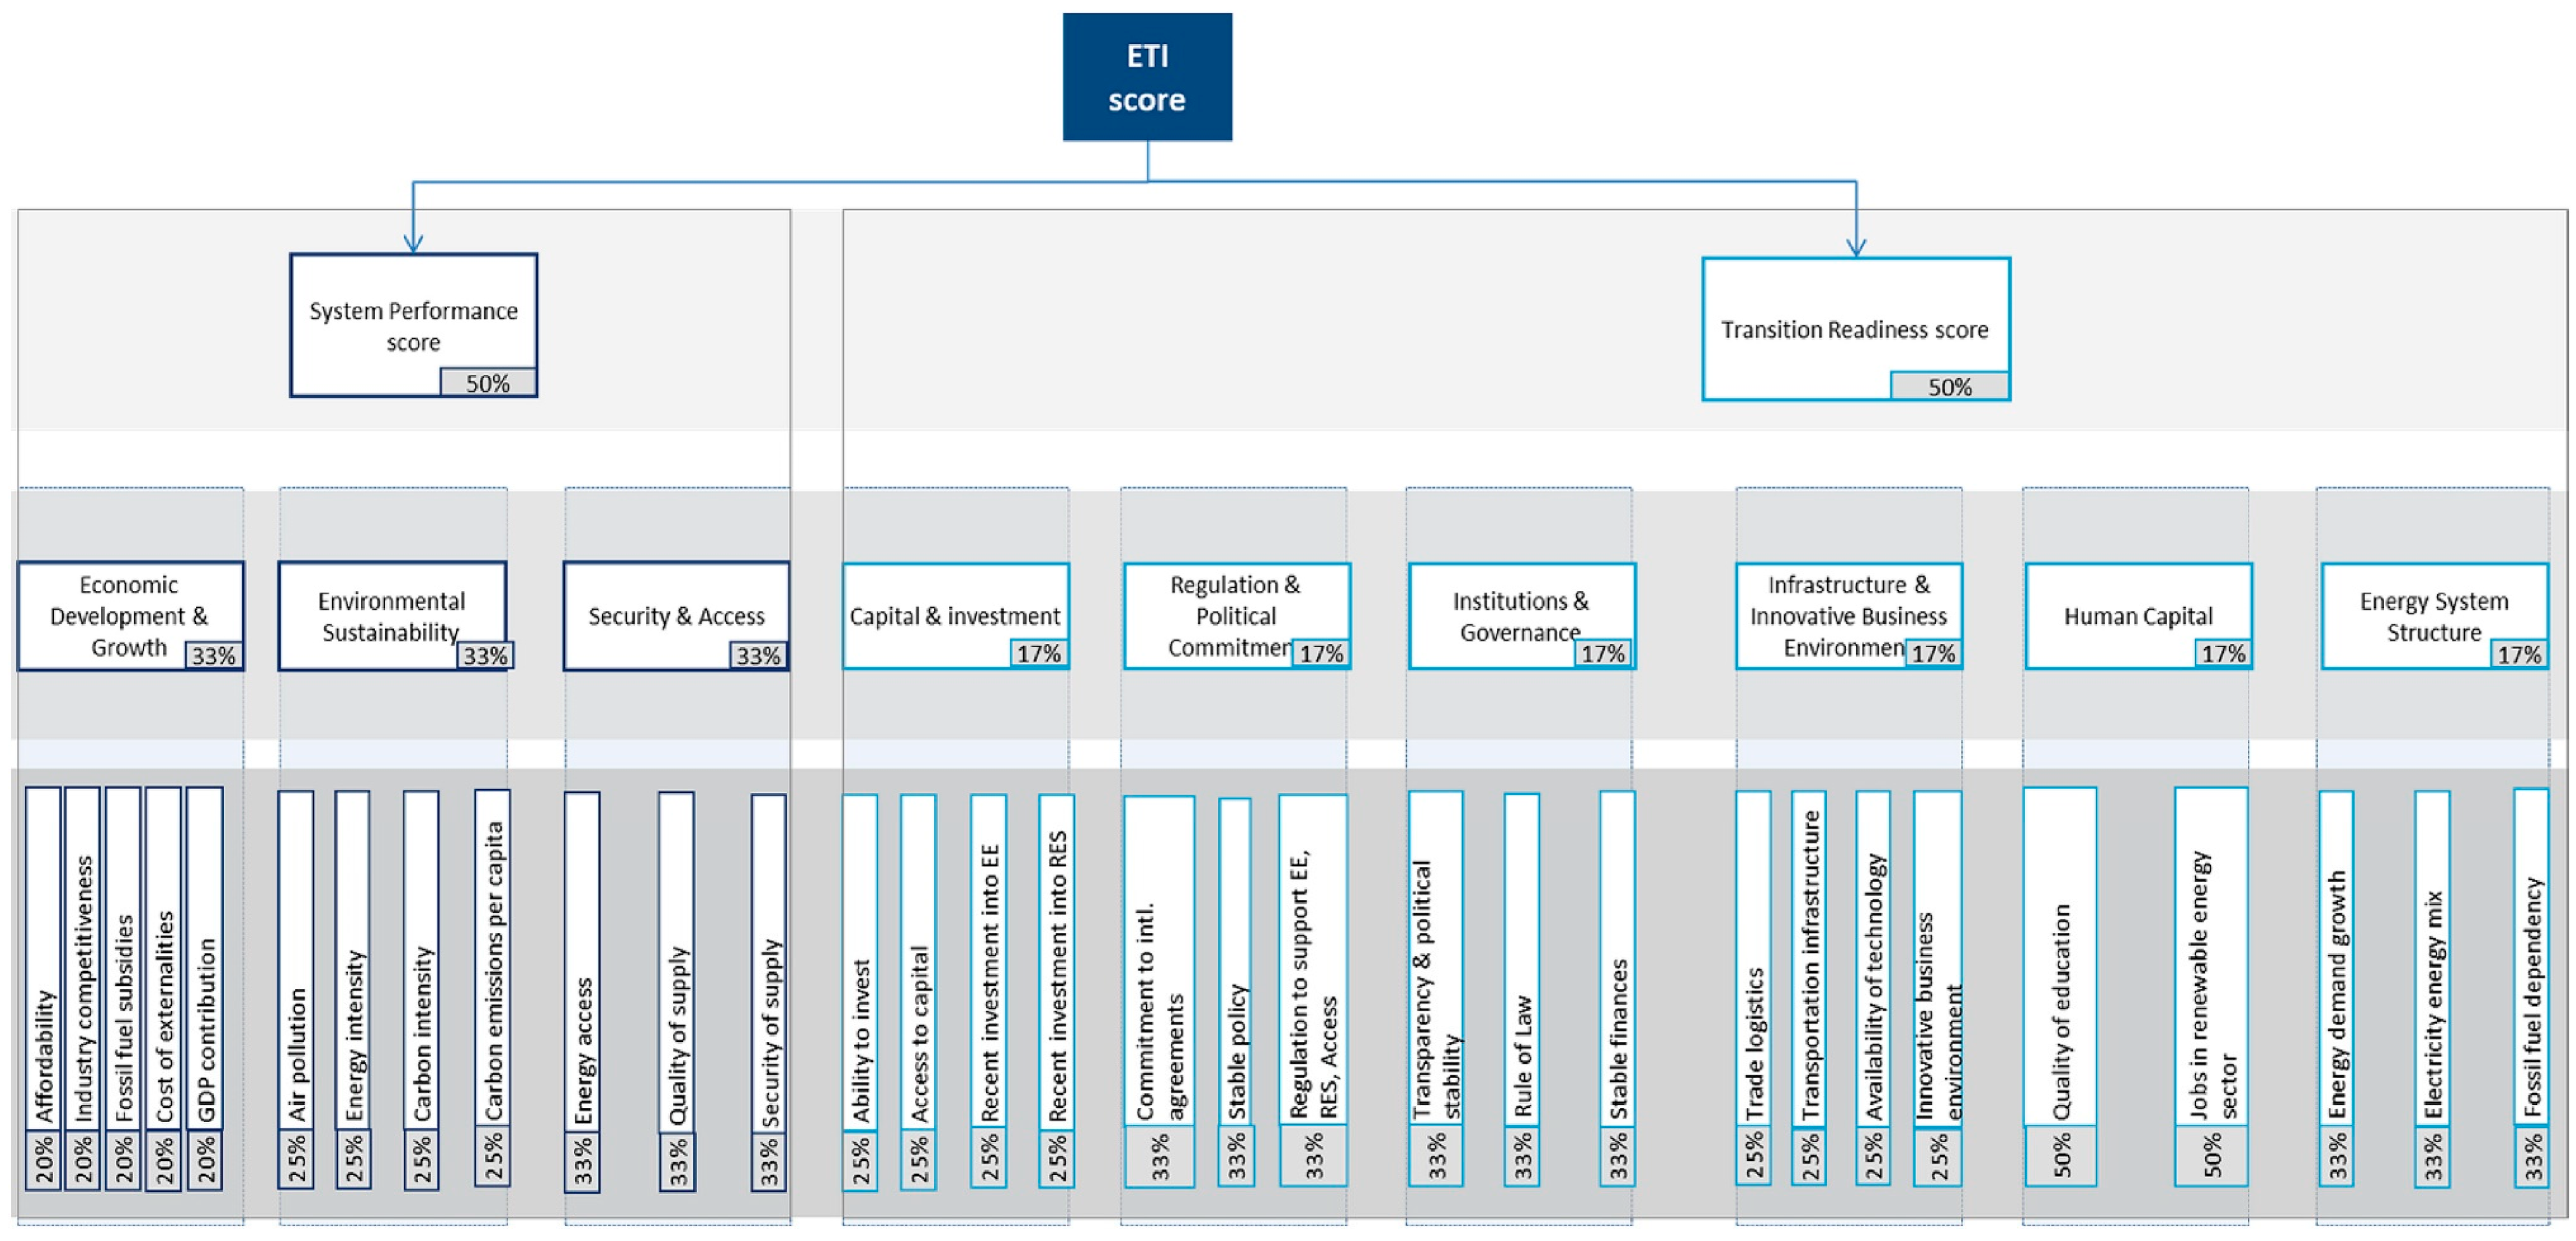
The primary value of the Energy Transition Index (ETI) lies in its conceptual framework. This framework outlines key dimensions and sub-indices, offering a structured approach to understanding the interconnections between energy transition, economic factors, and societal impacts, going beyond the technological aspects of the energy system [9]. The practice of assigning equal weights to variables in composite indices has been a topic of discussion in [10,11], particularly regarding the reliability and interpretation of overall scores. However, due to the absence of comprehensive empirical data on the relative significance of these variables across different dimensions and countries covered by the ETI, an equal-weighting approach has been applied to the nine pillars (the ETI’s nine pillars are economic development and growth, environmental sustainability, security and access, capital and investment, regulation and political commitment, institutions and governance, infrastructure and innovative business environment, human capital, and energy system structure), as illustrated in Figure 1. The ETI aims to promote an inclusive, collaborative approach to the energy transition, ensuring that diverse stakeholders work together while considering the complex interconnections within the energy system.
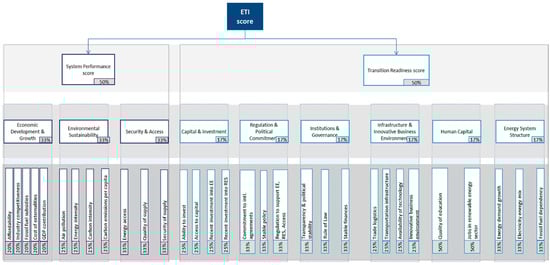
Figure 1.
Pillars and indicators of the Energy Transition Index (ETI). Source: World Economic Forum (2024).
This paper explores how each of the nine Energy Transition Index (ETI) pillars influences the growth of renewable energy consumption across the GCC countries. As the region moves forward with its energy transition goals, it becomes increasingly important to understand which factors play the most significant role in supporting this shift. By evaluating each pillar, ranging from economic development and investment to governance, infrastructure, and environmental sustainability, we aim to identify which areas offer the greatest potential for accelerating renewable energy adoption.
Research suggests that pillars like institutions and governance, capital and investment, and infrastructure are particularly influential. For example, ref. [6] emphasizes the importance of strong policy frameworks and effective governance in attracting investment and enabling long-term renewable energy planning. Similarly, ref. [12] highlights how access to financing and solid infrastructure can make a real difference in scaling up clean energy across emerging markets, including those in the GCC.
At the same time, other scholars such as [13] point out that energy transitions are complex and often shaped by broader social, political, and cultural dynamics. In the case of the GCC, where fossil fuels remain central to economic models and public life, ref. [14] argues that deeper systemic changes, like reforming energy subsidies and shifting public attitudes, are just as critical as technical and financial improvements.
Through this study, we offer a clearer picture of which pillars are most strongly linked to renewable energy progress in the GCC countries.
Starting in 2021, the Gulf Cooperation Council (GCC) countries began changing their approach to energy policies quite noticeably [7]. At the COP26 (summit in Glasgow in October of that year), the UAE made a strong commitment to reach net-zero carbon emissions by 2050 [15]. Following that, Saudi Arabia and Bahrain also announced their plans to achieve net zero, targeting the year 2060 for this milestone. Qatar also introduced a national climate action plan aimed at cutting greenhouse gas emissions by 25% by 2030. The following year, during COP27, Kuwait and Oman set their net-zero targets for 2060 and 2050, respectively. As shown in Table 1, all GCC nations have established specific renewable energy goals, with Qatar being the only exception in terms of formal net-zero commitments under the United Nations Framework Convention on Climate Change (UNFCCC).

Table 1.
GCC capacity of renewable energy.
According to [16], GCC countries have made remarkable progress in renewable energy, with installed capacity expanding from nearly zero in 2013 to over five GW by 2022. Despite this growth, renewables still make up only about 3% of the region’s total installed power generation capacity. However, the findings also point to numerous opportunities for the GCC to accelerate its energy transition and further integrate sustainable energy solutions into its grid. As mentioned earlier, the shift away from carbon-based energy sources is driven by the commitment to global climate initiatives, the anticipated decline in oil and gas investment returns, and the necessity of diversifying local economies [17]. A particularly strong driver of this transition is the growing cost of fossil fuel extraction. Currently, around 15.5% of the total energy produced from oil liquids is required for their production. However, by 2050, this figure is projected to rise dramatically, and production will consume nearly half of the gross energy output due to increasing extraction challenges as natural reserves dwindle [18].
This research plays a vital role in supporting the global push toward achieving the Sustainable Development Goals (SDGs), with a strong focus on promoting sustainable and renewable energy. It directly contributes to SDG 7, which aims to ensure access to affordable, reliable, and modern energy for all. By offering empirical insights into how different components of the Energy Transition Index (ETI) influence the shift to cleaner energy, the study sheds light on the key drivers of renewable energy progress across the GCC countries. Notably, it finds that six out of the nine ETI pillars, economic development, environmental sustainability, capital and investment, institutions and governance, business environment and infrastructure, and energy system structure, have significant potential to accelerate the region’s transition to clean energy and help reduce the harmful impacts of climate change. The paper is structured as follows: Section 2 reviews the existing literature, while Section 3 outlines the methodology and details the variables used in the analysis. Section 4 presents the results, and finally, Section 5 summarizes the key findings, offers practical recommendations, and discusses the study’s limitations.
2. Literature Review
Addressing the climate crisis requires aligning energy transitions with the SDG 7 strategy [19]. The role of research extends beyond proposing solutions to facilitate this shift. It also involves detecting key factors influencing the energy transition process and determining the most effective strategies. This paper examines the progression of renewable energy adoption by analyzing variables widely recognized in the literature as significant to the transition process. Until the late 2010s, most research on green energy centered primarily on production. However, since 2020, there has been a growing emphasis on consumption-related aspects. A large number of studies consider renewable energy consumption to be a key influencing factor in their research models [20,21]. At the same time, a notable body of research explores renewable energy consumption as a dependent variable [22,23].
2.1. Renewable Energy Consumption, Economic Growth, and Investment
The link between renewable energy consumption and economic growth has been widely explored in the existing literature. Much of the focus has been on the broader relationship between energy use and the progress of economic development. Ref. [24] provided a comprehensive review of existing research, organizing it based on key hypotheses that explore this dynamic link. The feedback hypothesis suggests a two-way relationship between energy consumption and economic development, where changes in energy usage directly impact economic development and vice versa. In ref. [25], the authors noted that while much of the existing research suggests that economic growth drives green energy use, they highlighted the importance of considering additional factors. They highlighted varying interpretations that emphasize the complex relationship between economic factors, particularly economic imbalances. Their findings revealed that rising unemployment can hinder renewable energy use, whereas strong economic growth and employment in advanced technology areas serve as key catalysts for the transition to renewables, a conclusion that was also supported by [26]. Similarly, in ref. [27], researchers found that economic development plays a fundamental role in encouraging nations to shift toward cleaner energy sources. This aligns with the argument presented in [25] that the connection between economic growth and renewable energy is multifaceted. Expanding on this idea, ref. [28] suggests that long-term economic growth may be constrained by the limitations imposed by economic growth targets. A notable study analyzing the relationship between renewable energy and economic development used quarterly data from 1972 to 2011. According to [29], a feedback effect exists between renewable energy and economic growth, while other variables maintain a long-term correlation. Similarly, research on Pakistan’s energy landscape found a bidirectional relationship between energy consumption and economic growth. However, it also highlighted that increased energy use contributes to environmental degradation [30]. To ensure sustainable economic growth without harming the environment, a significant share of energy must come from renewable sources.
In ref. [31], researchers analyzed carbon emissions across various African nations from 2000 to 2019, uncovering a bidirectional relationship between capital investment and renewable energy consumption. However, they also found that investment directly contributes to higher greenhouse gas emissions. Similarly, the authors of ref. [32] suggested that while investment supports business growth and improves energy efficiency, it can also drive economic expansion, which in turn increases greenhouse gas emissions. Nonetheless, their findings indicate that economic development enhances energy efficiency, ultimately fostering the growth of renewable energy sources. The authors of ref. [33] reinforced this perspective through their research on OECD countries, highlighting how multinational corporations, key drivers of investments, often introduce advanced environmental technologies and sustainable management systems. As a result, the negative environmental effects of economic growth can be counterbalanced by the adoption of greener solutions [32]. In a study covering 74 countries from 1985 to 2012, researchers further demonstrated that more investment in the energy sector reduces reliance on non-renewable energy while boosting renewable energy consumption. However, they emphasized that investment impact varies depending on the country’s level of economic development, with less economically advanced nations showing less consistent outcomes.
2.2. Renewable Energy Consumption, Institutional Stability, and Governance
Political stability, governance structure, and democracy play crucial roles in the relationship between energy consumption and economic growth. Ref. [34] examined data from 16 Sub-Saharan countries to explore how regime type and trade openness influence this dynamic. The authors’ findings suggest that democracy significantly moderates the link between energy consumption and economic growth. In another study, ref. [35], researchers investigated the impact of renewable and non-renewable energy within different regime types across 30 Sub-Saharan countries from 1980 to 2012. Various tests confirmed a long-term relationship between these factors, showing that democratic nations experience higher economic growth rates than autocratic ones. Robust institutions play a crucial role in shaping comprehensive environmental policies and driving the adoption of cleaner technologies, ultimately reducing pollution and preserving natural resources [36,37]. By defining property rights and establishing governance frameworks, these institutions help prevent resource overuse and promote sustainable management practices [38,39]. Additionally, they foster innovation in green technologies by offering financial incentives, implementing supportive policies, and encouraging collaboration between research institutions and businesses.
An increasing body of research has explored how institutional quality influences progress in green growth. For example, ref. [40] highlighted that factors such as government effectiveness and the rule of law are essential in improving environmental quality and fostering green growth in developing nations. Ref. [41] found that strong institutions and human capital significantly contributed to reducing the ecological footprint in emerging economies between 1984 and 2017. Similarly, the authors of ref. [37] have shown that institutional quality enhances environmental outcomes by effectively implementing economic and environmental policies, including financial support mechanisms. Ref. [38], examining China’s manufacturing sector from 2003 to 2016, revealed that environmental regulations positively impact green total factor productivity (GTFP), further emphasizing the role of strong institutions in advancing sustainability [42].
2.3. Renewable Energy Consumption, Sustainability, and Structure of Energy System
Renewable energy plays a vital role in mitigating environmental degradation and supporting the transition to sustainable energy sources [43]. Over the past two decades, extensive research has explored the relationship between energy consumption and its impact on the environment, with a strong focus on the role of renewables. These studies span diverse regions, incorporate various influencing factors, and employ different econometric methods.
The GCC countries are among the world’s largest power markets, with energy demand expected to grow significantly by 2030. Like their power production and generation systems, energy consumption in the region remains heavily reliant on oil and gas as primary sources [7].
A study [44] highlighted that the building sector in Saudi Arabia accounts for 79.5% of total energy consumption, with heating, ventilation, and air conditioning (HVAC) alone consuming 70%. However, when measuring energy use per subscriber, the government sector emerges as the largest consumer of electricity in the GCC. Notably, recent trends indicate a decline in energy consumption within the government sector. Given the substantial potential for energy savings in the region, experts recommend diversifying energy sources, reducing dependence on oil, and exploring renewable alternatives to ensure a more sustainable energy future.
2.4. Renewable Energy Consumption, Infrastructure, and Human Capital
The relationship between human capital and energy consumption has been widely studied, though most of the literature has focused on global or non-GCC contexts. At the macro level, earlier studies in China and across OECD countries such as [33,34] reported no direct link between human capital and total energy consumption. However, accumulated human capital and effective knowledge transfer have been shown to support energy efficiency and reduce dependence on traditional energy sources.
Recent studies have begun to examine how human capital affects the adoption of renewable energy, yielding mixed results [35,37]. Their findings suggest that higher educational achievement can drive renewable energy use, while others point to indirect effects shaped by broader policy and institutional contexts. At the micro level, individuals with greater ecological awareness, often linked to their high level of education, are more likely to adopt energy-saving practices [38].
While these insights are useful, research on the Gulf Region is essential to understanding how human capital operates in a rentier state context. Ref. [6] notes that in Gulf states, despite efforts to invest in education and training, human capital has not yet been fully leveraged to support the clean energy transition. Furthermore, ref. [45] highlights that public awareness and environmental education initiatives remain limited, which restricts bottom-up pressure for the adoption of renewables.
In the GCC region, meeting the rising energy demand requires heavy investment in infrastructure. Unlike many developing nations, GCC economies have the financial capacity but face structural and political constraints. Fossil fuel subsidies, for instance, remain a major barrier to renewable energy commitments. These subsidies keep conventional energy prices artificially low, thereby undermining the economic competitiveness of renewable alternatives [14]. Furthermore, institutional inertia, stemming from centralized governance, vested interests, and slow regulatory change, limits the pace of transition [46].
Investment plays a dual role: it supports energy supply expansion while also serving as a tool for carbon mitigation, if directed toward clean technologies. For instance, ref. [40] showed that while energy investments in China initially raised emissions, technological progress helped reverse this trend. Ref. [41] found that infrastructure investments in rail helped reduce environmental impacts, unlike investments in road and air transport.
In the context of developing economies, including parts of the GCC, ref. [42] emphasized that private investment in renewables is shaped not only by financial incentives but also by regulatory certainty. Yet, many high-income countries, including GCC countries, continue to invest heavily in fossil fuel infrastructure due to legacy systems and long-standing economic models based on hydrocarbon exports.
3. Materials and Methods
3.1. Data and Variable Description
The study utilizes a balanced panel dataset consisting of six Gulf Cooperation Council (GCC) nations (Bahrain, Kuwait, Oman, Qatar, Saudi Arabia, and the United Arab Emirates) spanning the years 2003 to 2022, yielding a total of 120 country-year observations. The data were compiled from highly reputable and internationally recognized sources including the World Bank’s World Development Indicators (WDI), the International Monetary Fund (IMF), the United Nations Development Programme (UNDP), the United Nations Conference on Trade and Development (UNCTAD), the International Energy Agency (IEA), and the United Nations Environment Programme (UNEP). The study period was selected based on the availability of relevant variables across all countries. The selection of this region is based on its strategic importance as a group of hydrocarbon-dependent economies actively pursuing long-term energy diversification, as reflected in national initiatives, such as “Saudi Vision 2030 (https://www.vision2030.gov.sa/en, accessed on 30 April 2025)”, “UAE Energy Strategy 2050 (https://u.ae/en/about-the-uae/strategies-initiatives-and-awards/strategies-plans-and-visions/environment-and-energy/uae-energy-strategy-2050, accessed on 30 April 2025)”, and “Qatar National Vision 2030 (https://www.gco.gov.qa/en/state-of-qatar/qatar-national-vision-2030/our-story/, accessed on 30 April 2025)”. Studying factors driving this energy transition in these countries provides valuable insight into the challenges and opportunities of reducing fossil fuel dependency in resource-rich nations. Table 2 presents concise summaries of the study’s variables and their respective data sources.
Table 2.
Variable definitions and data sources.
Each of the independent variables listed above represents a different pillar from the ETI score developed by the World Economic Forum (2024), as illustrated in Figure 1.
The study adds urbanization and material footprint as control variables to control for other factors impacting renewable energy use. Urbanization is measured as a population in the largest city (% of urban population); as urbanization increases, cities experience higher energy consumption. This can drive the need for sustainable energy sources like renewable energy. Also, urban areas tend to have more energy-intensive lifestyles, leading to an increased reliance on electricity from both conventional and renewable sources. Material footprint refers to the total raw materials extracted to meet the consumption demands of the economy. It includes biomass, fossil fuels, metal ores, and non-metallic minerals. As economies shift from fossil fuels to renewables, there is a higher demand for clean energy technologies, which increases the material footprint.
3.2. Model Specification
The empirical model used to examine the determinants of energy transition is specified as
where subscripts i and t stand for country and time, respectively. is the parameters of the model , and is the error term. The dependent variable is renewable energy consumption, RENCit, and the explanatory variables are FEXit, fuel exports; CO2it, carbon dioxide emissions; EMDit, the import diversification index; FIDit, the financial institutions’ depth; PSit, political stability and absence of violence/terrorism; LAWit, the rule of law index; FBSit, fixed broadband subscriptions; HCit, human capital; and ESSit, the energy system structure. We use as control variables URBit, urbanization; and MFPit, material footprint.
3.3. Estimation Procedure
To empirically examine the determinants of the energy transition in the GCC countries, the study adopts both static and dynamic panel data models. Equation (1) is estimated using both static and dynamic panel data techniques.
3.3.1. Fixed and Random Effect Models
First, the study applied fixed effect (FE) and random effect (RE) models to capture the relationships between the explanatory variables and renewable energy consumption (RENC), as specified in Equations (2) and (3). Both fixed effect (FE) and random effect (RE) estimators control for unobserved country-specific characteristics. The Hausman test [47] was then used to choose between the FE model and the RE model. The fixed effect model allows the intercept to differ between countries; it is useful for controlling for time-invariant characteristics, such as the quality of institutions or geographical factors, which may vary among countries but remains constant over the years. The random effect model is appropriate if we believe that unobserved variability is uncorrelated with the independent variables; it preserves the estimates’ efficacy [48]. The Hausman test evaluates whether the unique errors (individual effects) are correlated with the regressors. The null hypothesis assumes no correlation between the individual effects and the explanatory variables, which supports the use of the RE model. The rejection of the null hypothesis implies that such correlation exists, thereby indicating that the FE model provides more consistent and reliable estimates. Based on the test results, the fixed effect model was selected for the baseline analysis.
The fixed effect (FE) model specification is as follows:
where
is the country’s specific intercept.
The random effect (RE) model specification is as follows:
where
is the stochastic ingredient that differs across countries.
3.3.2. Robust Estimation with Driscoll–Kraay Standard Errors
Given the potential presence of heteroskedasticity, autocorrelation, and cross-sectional dependence in macro-panel data, this study adopts Driscoll–Kraay standard errors [49] to address these issues and ensure robustness. This method is particularly appropriate in panels with a large time dimension and relatively few cross-sections, as is the case in this study. The Driscoll–Kraay approach enhances the reliability of inference by correcting standard errors without altering coefficient estimates.
3.3.3. Dynamic Panel Estimation Using Difference Generalized Method of Moments (GMM)
Due to the likelihood of the existence of dynamic effects and probable endogeneity, the generalized method of moments (GMM) approach proposed by [50] was chosen, since it successfully handles these issues while assuring robust and accurate results. To enhance the analysis, the study employs a generalized method of moments (GMM) panel technique. The difference GMM estimator is employed with robust standard errors, which correct for heteroskedasticity and autocorrelation in the error terms. This method is particularly suited to panels with a small number of cross-sections (countries) and a relatively large number of time periods, as is typical for GCC datasets. Instrumental variables are generated from lagged levels and differences of the endogenous variables to address potential simultaneity bias and omitted variable bias. The GMM model specified in Equation (4) includes the lagged dependent variable :
where
is the one-period lag of the dependent variable “renewable energy consumption”. The inclusion of the lagged dependent variable allows the model to account for dynamic behavior and inertia in the energy transition processes. The validity of the GMM specification is confirmed by the Arellano–Bond AR(2) test, and by the model’s Wald statistics.
Together, the fixed effect model, the Driscoll–Kraay standard errors, and the robust difference GMM approach provide a comprehensive framework for examining the robustness and validity of the estimated relationships.
4. Results and Discussion
Prior to starting the results discussion, the study provides summary statistics on the selected variables and their correlations.
4.1. Descriptive Statistics and Correlations
Table 3 displays the descriptive statistics for the variables incorporated in the analysis. Renewable energy consumption (RENC) exhibits a low mean value of 0.0682, reflecting the limited use of renewables in the GCC region. The wide standard deviation in variables such as the energy system structure (ESS) and fixed broadband subscriptions (FBS) indicates considerable heterogeneity across countries and time. Variables like rule of law (LAW) and human capital (HC) show more moderate variation, suggesting some stability in institutional and educational factors.
Table 3.
Descriptive analysis.
The correlation matrix in Table 4 reveals several noteworthy relationships. Key economic indicators, such as fuel exports (FEX), exhibit negative correlations with RENC, indicating that resource-intensive patterns may hinder renewable energy adoption. In contrast, positive correlations are observed between RENC and variables such as financial institutions’ depth (FID), rule of law (LAW), energy system structure (ESS), and digital infrastructure (FBS), suggesting that institutional quality, financial development, and technological readiness are positively associated with the energy transition. Importantly, none of the pairwise correlations among the independent variables exceed the 0.8 threshold, implying the absence of severe multicollinearity and confirming the suitability of the dataset for regression analysis.
Table 4.
Correlation analysis.
The correlation matrix presented in Table 4 below indicates that the economic development and growth pillar, FEX; the security and access pillar, EMD; urbanization, URB; and material footprint, MFP, exhibit negative correlations with renewable energy consumption. Conversely, the pillars of environmental sustainability, CO2; capital and investment, FID; regulation and political commitment, POL; institution and governance, LAW; infrastructure and innovative business environment, FBS; human capital, HC; and energy system structure, ESS, demonstrate positive correlations with renewable energy consumption. Furthermore, no significant (r > 0.8) linear correlations among the independent variables seem to contribute to the issue of multicollinearity.
4.2. Model Selection (Hausman Test)
To determine the convenient estimation method between the random effect and fixed effect methods, the Hausman test was utilized. The null hypothesis for this test is that the random effect is preferred over a fixed effect (see Appendix A).
Due to the Hausman test p-value of (0.00), which is less than (0.05), the null hypothesis is rejected, and it is affirmed that the fixed effect method is a suitable method for this test. Following that, the fixed effect method is applied to estimate the effects of the selected exogenous variables on energy transitions in GCC countries. The results are shown in Table 5.
Table 5.
Hausman test result.
4.3. Fixed Effect Results
The fixed effect estimation offers significant insights into the underlying factors influencing the energy transition in GCC countries. The high R-squared value (0.91) and significant F-statistics confirm the robustness of the model and the collective explanatory power of the independent variables.
The analysis reveals that fuel exports (FEX) have a significant positive impact on the energy transition (β = 0.0044, p < 0.01). The positive effect of fuel exports (FEX) on renewable energy consumption presents an interesting dynamic, particularly in resource-rich economies such as those in the GCC. One key transmission mechanism lies in the potential for oil and gas revenues to finance investments in clean energy infrastructure. When managed effectively, resource rents can provide governments with finance to diversify their energy mix, invest in R&D, and support large-scale renewable energy projects [51,52]. This concept aligns with the “resource-financed diversification” model, where hydrocarbon wealth is strategically leveraged to build capacity in non-oil sectors, including renewables [53].
However, the relationship between fuel exports and renewable energy is not always positive. In some cases, a high dependence on fossil fuel exports may weaken incentives to pursue structural energy reforms, particularly when fossil fuel subsidies remain in place or when institutional quality is low. Moreover, revenue volatility associated with global oil price fluctuations can disrupt long-term planning for clean energy investment [54]. Thus, the net impact of FEX on renewable energy consumption depends not only on the volume of revenues but also on governance, policy choices, and the broader macroeconomic environment.
Conversely, CO2 emissions (CO2) exert a negative and statistically significant effect (β = −0.0045, p < 0.01), implying that higher carbon intensities are associated with slower progress in the energy transition. This finding highlights the structural challenge of decarbonization in rentier economies where fossil fuel consumption remains embedded in production and consumption patterns. The result aligns with [55], whose authors emphasize the inertia created by emission-intensive industries in fossil fuel-dependent economies.
The import diversification index (EMD), although theoretically relevant, does not show a statistically significant relationship. This may suggest that existing diversification efforts within the GCC are not yet sufficiently green-oriented or impactful in redirecting energy use toward renewables. Many diversification strategies still focus on energy-intensive sectors such as petrochemicals and heavy manufacturing [56], limiting their immediate relevance to energy transition goals.
The coefficient for financial institutions’ depth (FID) is both positive and significant (β = 0.4968, p < 0.01), underscoring the crucial role of a well-developed financial sector in facilitating investment in green technologies and infrastructure. As noted by Sadorsky (2010) [57], deeper financial systems enhance the ability of firms and governments to finance clean energy projects, thus accelerating the transition process.
Moreover, the rule of law (LAW) and fixed broadband subscriptions (FBS) exhibit statistically significant positive relationships with the dependent variable. The former reflects the role of institutional quality and regulatory enforcement in shaping energy policy outcomes [58], while the latter indicates that ICT infrastructure and digitalization can promote energy efficiency and innovation [59]. Together, these results highlight that the energy transition is not merely a technological challenge but also an institutional and governance-driven process.
Human capital (HC) and political stability (POL) do not present statistically significant effects in this model. While these variables are important in the broader context of sustainable development, their limited variation or indirect linkage to short-term energy transition metrics may account for their statistical insignificance in this case. Human capital in the GCC is often constrained by mismatches between education systems and labor market demands, especially in technical and green economy fields.
The findings further show that urbanization (URB) and the energy system structure (ESS) are strong positive contributors to energy transition. Urbanization (β = 0.0119, p < 0.01) is often accompanied by improvements in public infrastructure and energy management systems, making cities more capable of integrating renewable energy. Similarly, ESS (β = 0.0514, p < 0.01) reflects the critical importance of reliable, modern energy systems for integrating renewable sources and reducing dependency on fossil fuels, echoing recommendations from [60].
Material footprint (MFP) demonstrates marginal significance (β = 0.0009, p = 0.059), suggesting a potential but not yet strong influence of efficiency improvements and sustainable consumption practices. As productivity gains and circular economy initiatives expand, the influence of the material footprint is likely to grow over time [61].
In summary, the findings emphasize that a successful energy transition in the GCC depends on financial sector development, institutional strength, technological infrastructure, and strategic investment of fuel revenues. However, persistent challenges such as high CO2 emissions, limited human capital readiness, and the carbon intensity of diversification strategies must be addressed through comprehensive and long-term policy frameworks.
To enhance the accuracy of the results, we present the findings of the random effects model in Appendix B.
4.4. Robustness Checks (Driscoll–Kraay and GMM)
To ensure the reliability and validity of the fixed effect results, additional robustness checks were conducted using the Driscoll–Kraay standard errors and the generalized method of moments (GMM) with robust standard errors. These techniques account for potential autocorrelation, heteroskedasticity, and cross-sectional dependence, which are common concerns in macro-panel datasets, especially those with relatively small cross-sections and large time dimensions, as in the case of GCC countries. This study uses the fixed effect and Driscoll–Kraay standard errors to examine the main hypothesis of the model under study. Driscoll–Kraay standard error estimators are consistent with heteroskedasticity and autocorrelation, “mitigating potential bias”, in addition to being robust to cross-sectional dependences.
The coefficient of the lagged dependent variable in the difference GMM results is 0.99, with a p-value < 0.01, indicating the persistence of renewable energy consumption and underscoring the necessity of considering dynamic effects. The results of the difference GMM model offer the most credible inference for dynamic relationships by employing internal instruments to address endogeneity issues. The validity of the GMM specification is supported by the Arellano–Bond AR(2) test (p-value > 0.05), indicating no second-order autocorrelation.
Across both models, fuel exports as a percentage of merchandise exports (FEX) remain positively and significantly associated with energy transition, confirming the earlier finding that economic growth driven by natural resources can support clean energy investments when managed effectively. This reinforces the notion that resource wealth, when aligned with environmental goals, may act as a facilitator rather than a barrier to a sustainable transition.
CO2 emissions (CO2) continue to exhibit a significant negative impact in both models (p < 0.05), though the magnitude slightly declines under the GMM specification. This persistence underscores the systemic challenges posed by carbon-intensive development patterns and highlights the urgent need for decarbonization strategies.
The significance of financial institutions’ depth (FID) in both models further confirms its critical role in channeling investments into green technologies and infrastructure. Notably, its coefficient slightly reduces under the GMM, suggesting some sensitivity to model specification, but the direction and significance remain intact.
An important divergence appears in the treatment of political stability (POL). While previously insignificant in fixed effects and Driscoll–Kraay estimations, it becomes statistically significant and negatively associated with energy transition in the GMM model. This counterintuitive result may reflect the institutional rigidities that come with highly stable political environments in rentier states, potentially inhibiting the dynamism needed to push forward disruptive energy reforms.
The rule of law (LAW) consistently remains a positive and significant contributor across both models, reinforcing the central role of institutional quality and legal enforcement in facilitating environmental and energy reforms. Similarly, urbanization (URB) is positively and strongly significant in both estimations, underscoring how urban development continues to be a platform for adopting clean energy solutions and infrastructure.
Some variables show model-dependent behavior. Fixed broadband subscriptions (FBS), while significant in the Driscoll–Kraay model, lose their significance under the GMM, suggesting that the digital infrastructure’s influence may be more short-term or indirect than directly causal in energy transition outcomes. Likewise, the energy system structure (ESS), which had the strongest effect under the original model and Driscoll–Kraay, becomes statistically insignificant in the GMM model. This could point to issues of endogeneity or measurement lag, suggesting that improvements in energy systems take time to translate into measurable transition outcomes.
Interestingly, human capital (HC) shows weak significance only under the GMM specification (p ≈ 0.093), hinting at a potential longer-term or lagged effect of educational and skill development in supporting the energy transition.
The Arellano–Bond test for autocorrelation in the first-differenced residuals was conducted to evaluate the validity of the moment conditions and the reliability of the difference GMM estimator. The results, reported in Table 6, show that the AR(1) statistic yielded a z-value of −1.5463 with a p-value of 0.1220, indicating that first-order serial correlation was not statistically significant. Although some degree of AR(1) is typically expected due to the differencing process, the lack of significance here may reflect low variation in the differenced residuals or instrument weakness. More importantly, the AR(2) statistic, which tests for second-order serial correlation, was also not significant (z = −0.17695, p = 0.8596), confirming that the instruments used in the model are valid and the moment conditions are appropriately specified. The results reported in Table 6 show that the AR(1) statistic yielded a z-value of −1.5463 with a p-value of 0.1220, indicating that first-order serial correlation was not statistically significant. Although some degree of AR(1) is typically expected due to the differencing process, the lack of significance here may reflect low variation in the differenced residuals or instrument weakness.
Table 6.
Fixed effect results.
Overall, the robustness checks in Table 7 validate the central findings of the fixed effect model while also uncovering additional insights into dynamic and institutional aspects of energy transition in the GCC. The consistency of key variables across models strengthens the reliability of the results, while variations in others provide directions for future research and policy adjustments.
Table 7.
GMM and Driscoll–Kraay standard error results.
5. Conclusions, Recommendations, and Limitations
This paper presents a favorable outlook for clean energy development in the GCC region. While these countries are still closely tied to oil and gas, the results show that fossil fuel revenues do not have to be a barrier to change. If managed strategically, oil and gas revenues can become a driving force behind the shift to renewable energy in the GCC. Instead of seeing fossil fuel wealth as something that holds the region back, it can be part of the solution, helping to finance cleaner technologies, modern energy systems, and innovation across different sectors. We are already seeing some of this in action. Countries like the UAE, Saudi Arabia, and Qatar are using their sovereign wealth funds, much of which comes from oil, to invest in solar, wind, and hydrogen projects, both at home and abroad. These funds do not just have to go toward building power plants, either. They can also support research, training, and new jobs in the green economy. This kind of investment helps lay the groundwork for a long-term shift, ensuring that people have the skills and opportunities needed to thrive in a low-carbon future. Redirecting even a portion of fossil fuel income toward subsidies for renewables, better energy storage, or smarter power grids could go a long way toward speeding up the transition, without causing too much economic disruption. It is about using the region’s existing strengths to build something more sustainable and resilient.
GCC countries are starting to take more concrete action on climate change through both national targets and regional cooperation. The UAE and Oman set goals to reach net-zero emissions by 2050, while Saudi Arabia has pledged to get there by 2060. Saudi Arabia is also behind the Middle East Green Initiative, which aims to boost regional collaboration on environmental efforts. Several GCC states have signed on to the Global Methane Pledge, committing to reduce methane emissions by 30% by 2030. In parallel, there has been growing interest and investment in low-carbon solutions like green hydrogen, circular carbon economy approaches, carbon trading, and improving energy efficiency at home. Efforts to diversify GCC economies are already underway, but many are still centered on energy-heavy industries. That limits their immediate contribution to clean energy goals. On a more positive note, the region’s strong financial sector stands out as a major asset. Access to capital and well-developed financial institutions can help accelerate investments in green projects and technologies. Good governance, institutional strength, and the growth of digital infrastructure also provide a strong foundation for cleaner energy systems.
Although the study found that education and political stability had less short-term influence, the long-term role of education and workforce development should not be underestimated. Building skills for the green economy will be essential not just for the GCC but globally. All governments and universities should work together to prepare students and workers for careers in renewable energy, clean tech, and sustainable industries.
The GCC has a significant opportunity to lead by example, demonstrating how oil wealth can be utilized not to delay the clean energy transition but to advance it. Other countries can also learn from these experiences. What is most important now is converting ambition into action: intensifying efforts on emissions reductions, investing in education and green jobs, and establishing financial and policy frameworks where clean energy can flourish at scale. In short, the transition to renewable energy is not just about switching technologies; it is about reshaping systems, institutions, and priorities. And the faster the world moves in that direction, the better the chance of building a sustainable and inclusive future.
Like any study, this research has its limitations. Its focus is confined to a specific group of GCC countries, which leaves room for further exploration. Expanding this analysis to other regions could offer valuable insights, whether by examining OECD countries with similar characteristics or contrasting findings with nations in Africa and South America. A compelling direction for future research would be to investigate potential trade-offs between the adoption of renewable energy and reductions in CO2 emissions. Given the uncertainties and mixed findings surrounding renewable energy (as highlighted in the Section 2), along with the reliance on aggregated energy data, this study underscores the importance of conducting further analyses using more detailed, disaggregated data. Another key limitation of this study is the absence of Computable General Equilibrium (CGE) or Input–Output (IO) modeling, which are useful for capturing whole-economy effects of energy transitions. Due to the unavailability of consistent Social Accounting Matrices (SAMs) for GCC countries, such models could not be implemented. Future research may incorporate CGE or IO approaches when comprehensive SAM data become accessible. Also, we use the percentage of population in the largest city as a proxy for urbanization. Although this captures spatial concentration, it may not fully reflect urban energy demand dynamics. Future research could address these limitations by using more detailed indicators, such as urban energy consumption per capita, when available. Finally, we note that the difference GMM estimation was conducted using xtabond, which does not support the Hansen test for instrument validity. Although the Sargan test was applied, this limitation should be addressed in future studies by using the xtabond2 command to enable more robust diagnostics in small-sample panels.
Author Contributions
Conceptualization, J.B.; Methodology, M.E.; Software, M.E.; Validation, J.B. and M.E.; Formal analysis, J.B. and M.E.; Investigation, J.B.; Writing—original draft, J.B. and M.E.; Writing—review & editing, J.B. and M.E.; Visualization, J.B.; Funding acquisition, M.E. All authors have read and agreed to the published version of the manuscript.
Funding
This research was funded by Princess Nourah bint Abdulrahman University Researchers Supporting Project number (PNURSP2025R866), Princess Nourah bint Abdulrahman University, Riyadh, Saudi Arabia.
Data Availability Statement
This can be found at https://databank.worldbank.org/source/world-development-indicators, https://unctadstat.unctad.org/datacentre/dataviewer/US.ConcentDiversIndices, https://legacydata.imf.org/?sk=f8032e80-b36c-43b1-ac26-493c5b1cd33b&sid=1481126573525, https://www.iea.org/data-and-statistics/data-sets, https://hdr.undp.org/data-center/documentation-and-downloads, and https://www.unep.org/publications-data, accessed on 10 April 2025.
Acknowledgments
The authors extend their appreciation to the Princess Nourah bint Abdulrahman University Researchers Supporting Project Number (PNURSP2025R866), Princess Nourah bint Abdulrahman University, Riyadh, Saudi Arabia.
Conflicts of Interest
The authors declare no conflicts of interest.
Appendix A. Hausman Test Specification
The Hausman test is employed to determine whether the fixed effect (FE) or random effect (RE) model is more appropriate for panel data estimation. It tests the null hypothesis that the individual effects are uncorrelated with the explanatory variables.
where
- : Coefficient vector from the random effect estimator.
- : Coefficient vector from the fixed effect estimator.
- : Covariance matrix of the RE estimates.
- : Covariance matrix of the FE estimates.
The Hausman statistic H follows a chi-square distribution with degrees of freedom equal to the number of regressors in the model.
Interpretation:
- Null Hypothesis (H0): The random effect model is appropriate (no correlation between individual effects and regressors).
- Alternative Hypothesis (H1): The fixed effect model is appropriate (correlation exists between individual effects and regressors).
- Decision Rule: If the p-value < 0.05, reject the null hypothesis and use the fixed effect model.
Appendix B. Random Effect Results
| Variable | Coefficient | z | p > |z| |
| FEX | 0.0006 | 1.37 | 0.172 |
| CO2 | 0.0016 | 1.60 | 0.110 |
| EMD | −0.1937 | −1.21 | 0.226 |
| FID | 0.0816 | 0.79 | 0.427 |
| POL | 0.0789 *** | 4.32 | 0.000 |
| LAW | −0.0123 | −0.26 | 0.792 |
| FBS | 0.0050 *** | 4.06 | 0.000 |
| HC | 0.0058 | 0.75 | 0.451 |
| ESS | 0.0616 *** | 15.91 | 0.000 |
| URB | 0.0007 | 1.39 | 0.163 |
| MFP | −0.0008 * | −1.83 | 0.068 |
| Cons | −0.0861 | −0.68 | 0.494 |
| R2 | 0.84 | ||
| Wald chi2(11) | 750.81 (0.000) | ||
| Estimation was performed by authors using Stata 13. Note: p < 0.10 (*), p < 0.01 (***). | |||
References
- Cappellaro, F.; D’Agosta, G.; De Sabbata, P.; Barroco, F.; Carani, C.; Borghetti, A.; Lambertini, L.; Nucci, C.A. Implementing energy transition and SDGs targets throughout energy community schemes. J. Urban Ecol. 2022, 8, juac023. [Google Scholar] [CrossRef]
- Caineng, Z.; Shixiang, L.; Hanlin, L.; Feng, M. Revolution and significance of “Green Energy Transition” in the context of new quality productive forces: A discussion on theoretical understanding of “Energy Triangle”. Pet. Explor. Dev. 2024, 51, 1611–1627. [Google Scholar]
- Wang, C. High-quality development of China’s new energy industry: Progress, challenges and countermeasures. Contemp. Econ. Manag 2024, 46, 1–9. [Google Scholar]
- Nassar, A.K. Strategic energy transition in the Gulf Cooperation Council: Balancing economic, social, political, and environmental dynamics for sustainable development. Int. J. Green Energy 2025, 22, 1570–1586. [Google Scholar] [CrossRef]
- Alnaser, N.W.; Albuflasa, H.M.; Alnaser, W.E. The transition in solar and wind energy use in Gulf Cooperation Council countries (GCCC). Renew. Energy Environ. Sustain. 2022, 7, 4. [Google Scholar] [CrossRef]
- Al-Sarihi, A.; Mansouri, N. Renewable energy development in the Gulf cooperation council countries: Status, barriers, and policy options. Energies 2022, 15, 1923. [Google Scholar] [CrossRef]
- Islam, M.T.; Ali, A. Sustainable green energy transition in Saudi Arabia: Characterizing policy framework, interrelations and future research directions. Next Energy 2024, 5, 100161. [Google Scholar] [CrossRef]
- Sanfilippo, A.; Vermeersch, M.; Benito, V.B. Energy transition strategies in the Gulf Cooperation Council countries. Energy Strategy Rev. 2024, 55, 101512. [Google Scholar] [CrossRef]
- Singh, H.V.; Bocca, R.; Gomez, P.; Dahlke, S.; Bazilian, M. The energy transitions index: An analytic framework for understanding the evolving global energy system. Energy Strategy Rev. 2019, 26, 100382. [Google Scholar] [CrossRef]
- Seth, S.; McGillivray, M. Composite indices, alternative weights, and comparison robustness. Soc. Choice Welf. 2018, 51, 657–679. [Google Scholar] [CrossRef]
- Greco, S.; Ishizaka, A.; Tasiou, M.; Torrisi, G. On the methodological framework of composite indices: A review of the issues of weighting, aggregation, and robustness. Soc. Indic. Res. 2019, 141, 61–94. [Google Scholar] [CrossRef]
- Taghizadeh-Hesary, F.; Yoshino, N. Sustainable solutions for green financing and investment in renewable energy projects. Energies 2020, 13, 788. [Google Scholar] [CrossRef]
- Cherp, A.; Vinichenko, V.; Jewell, J.; Brutschin, E.; Sovacool, B. Integrating techno-economic, socio-technical and political perspectives on national energy transitions: A meta-theoretical framework. Energy Res. Soc. Sci. 2018, 37, 175–190. [Google Scholar] [CrossRef]
- Fattouh, B.; El-Katiri, L. A Brief Political Economy of Energy Subsidies in the Middle East and North Africa. 2015. Available online: https://iris.who.int/handle/10665/346168 (accessed on 30 April 2025).
- World Health Organization. COP26 Special Report on Climate Change and Health: The Health Argument for Climate Action; World Health Organization: Geneva, Switzerland, 2021. [Google Scholar]
- IRENA. Renewable Energy Market Analysis: GCC 2023; International Renewable Energy Agency: Masdar City, United Arab Emirates, 2023. [Google Scholar]
- Delannoy, L.; Longaretti, P.-Y.; Murphy, D.J.; Prados, E. Assessing global long-term EROI of gas: A net-energy perspective on the energy transition. Energies 2021, 14, 5112. [Google Scholar] [CrossRef]
- Al-Maamary, H.M.; Kazem, H.A.; Chaichan, M.T. The impact of oil price fluctuations on common renewable energies in GCC countries. Renew. Sustain. Energy Rev. 2017, 75, 989–1007. [Google Scholar] [CrossRef]
- Song, X.; Chen, Z. Pathways for an island energy transition under climate change: The case of Chongming Island, China. Front. Energy Res. 2023, 11, 1126411. [Google Scholar] [CrossRef]
- Alola, A.A.; Bekun, F.V.; Sarkodie, S.A. Dynamic impact of trade policy, economic growth, fertility rate, renewable and non-renewable energy consumption on ecological footprint in Europe. Sci. Total Environ. 2019, 685, 702–709. [Google Scholar] [CrossRef] [PubMed]
- Zafar, M.W.; Shahbaz, M.; Sinha, A.; Sengupta, T.; Qin, Q. How renewable energy consumption contribute to environmental quality? The role of education in OECD countries. J. Clean. Prod. 2020, 268, 122149. [Google Scholar] [CrossRef]
- Bekun, F.V.; Alola, A.A. Determinants of renewable energy consumption in agrarian Sub-Sahara African economies. Energy Ecol. Environ. 2022, 7, 227–235. [Google Scholar] [CrossRef]
- Polcyn, J.; Us, Y.; Lyulyov, O.; Pimonenko, T.; Kwilinski, A. Factors influencing the renewable energy consumption in selected European countries. Energies 2021, 15, 108. [Google Scholar] [CrossRef]
- Bhattacharya, M.; Paramati, S.R.; Ozturk, I.; Bhattacharya, S. The effect of renewable energy consumption on economic growth: Evidence from top 38 countries. Appl. Energy 2016, 162, 733–741. [Google Scholar] [CrossRef]
- Tu, Y.-X.; Kubatko, O.; Piven, V.; Sotnyk, I.; Kurbatova, T. Determinants of renewable energy development: Evidence from the EU countries. Energies 2022, 15, 7093. [Google Scholar] [CrossRef]
- Grabara, J.; Tleppayev, A.; Dabylova, M.; Mihardjo, L.W.; Dacko-Pikiewicz, Z. Empirical research on the relationship amongst renewable energy consumption, economic growth and foreign direct investment in Kazakhstan and Uzbekistan. Energies 2021, 14, 332. [Google Scholar] [CrossRef]
- Wong, S.L.; Chang, Y.; Chia, W.-M. Energy consumption, energy R&D and real GDP in OECD countries with and without oil reserves. Energy Econ. 2013, 40, 51–60. [Google Scholar]
- Chai, J.; Wu, H.; Hao, Y. Planned economic growth and controlled energy demand: How do regional growth targets affect energy consumption in China? Technol. Forecast. Soc. Chang. 2022, 185, 122068. [Google Scholar] [CrossRef]
- Shahbaz, M.; Loganathan, N.; Zeshan, M.; Zaman, K. Does renewable energy consumption add in economic growth? An application of auto-regressive distributed lag model in Pakistan. Renew. Sustain. Energy Rev. 2015, 44, 576–585. [Google Scholar] [CrossRef]
- Mirza, F.M.; Kanwal, A. Energy consumption, carbon emissions and economic growth in Pakistan: Dynamic causality analysis. Renew. Sustain. Energy Rev. 2017, 72, 1233–1240. [Google Scholar] [CrossRef]
- Chidiebere-Mark, N.M.; Onyeneke, R.U.; Uhuegbulem, I.J.; Ankrah, D.A.; Onyeneke, L.U.; Anukam, B.N.; Chijioke-Okere, M.O. Agricultural production, renewable energy consumption, foreign direct investment, and carbon emissions: New evidence from Africa. Atmosphere 2022, 13, 1981. [Google Scholar] [CrossRef]
- Doytch, N.; Narayan, S. Does FDI influence renewable energy consumption? An analysis of sectoral FDI impact on renewable and non-renewable industrial energy consumption. Energy Econ. 2016, 54, 291–301. [Google Scholar] [CrossRef]
- Ahmad, M.; Khan, Z.; Rahman, Z.U.; Khattak, S.I.; Khan, Z.U. Can innovation shocks determine CO2 emissions (CO2e) in the OECD economies? A new perspective. Econ. Innov. New Technol. 2021, 30, 89–109. [Google Scholar] [CrossRef]
- Adams, S.; Klobodu, E.K.M.; Opoku, E.E.O. Energy consumption, political regime and economic growth in sub-Saharan Africa. Energy Policy 2016, 96, 36–44. [Google Scholar] [CrossRef]
- Adams, S.; Klobodu, E.K.M.; Apio, A. Renewable and non-renewable energy, regime type and economic growth. Renew. Energy 2018, 125, 755–767. [Google Scholar] [CrossRef]
- Acemoglu, D.; Robinson, J. The Role of Institutions in Growth and Development. In Review of Economics and Institutions; World Bank Publications: Washington, DC, USA, 2010; Volume 1. [Google Scholar]
- Shahbaz, M.; Balsalobre, D.; Shahzad, S.J.H. The influencing factors of CO 2 emissions and the role of biomass energy consumption: Statistical experience from G-7 countries. Environ. Model. Assess. 2019, 24, 143–161. [Google Scholar] [CrossRef]
- Li, Y.; Li, S. The influence study on environmental regulation and green total factor productivity of China’s manufacturing industry. Discret. Dyn. Nat. Soc. 2021, 2021, 5580414. [Google Scholar] [CrossRef]
- Teklie, D.K.; Yağmur, M.H. The Role of Green Innovation, Renewable Energy, and Institutional Quality in Promoting Green Growth: Evidence from African Countries. Sustainability 2024, 16, 6166. [Google Scholar] [CrossRef]
- Tawiah, V.; Zakari, A.; Adedoyin, F.F. Determinants of green growth in developed and developing countries. Environ. Sci. Pollut. Res. 2021, 28, 39227–39242. [Google Scholar] [CrossRef]
- Ahmad, M.; Ahmed, Z.; Yang, X.; Hussain, N.; Sinha, A. Financial development and environmental degradation: Do human capital and institutional quality make a difference? Gondwana Res. 2022, 105, 299–310. [Google Scholar] [CrossRef]
- Degbedji, D.F.; Akpa, A.F.; Chabossou, A.F.; Osabohien, R. Institutional quality and green economic growth in West African economic and monetary union. Innov. Green Dev. 2024, 3, 100108. [Google Scholar] [CrossRef]
- Xuan, V.N. Toward a sustainable future: Determinants of renewable energy utilisation in Canada. Energy Rep. 2025, 13, 1308–1320. [Google Scholar] [CrossRef]
- Aldhubaib, H.A. Electrical energy future of Saudi Arabia: Challenges and opportunities. Front. Energy Res. 2022, 10, 1005081. [Google Scholar] [CrossRef]
- Reiche, D. Energy Policies of Gulf Cooperation Council (GCC) countries—Possibilities and limitations of ecological modernization in rentier states. Energy Policy 2010, 38, 2395–2403. [Google Scholar] [CrossRef]
- Krane, J. Political enablers of energy subsidy reform in Middle Eastern oil exporters. Nat. Energy 2018, 3, 547–552. [Google Scholar] [CrossRef]
- Hausman, J.A. Specification tests in econometrics. Econom. J. Econom. Soc. 1978, 46, 1251–1271. [Google Scholar] [CrossRef]
- Bajrami, R.; Tafa, S.; Gashi, A.; Hashani, M. Analysing the impact of money supply on economic growth: A panel regression approach for Western Balkan countries (2000–2023). Reg. Sci. Policy Pract. 2025, 17, 100159. [Google Scholar] [CrossRef]
- Driscoll, J.C.; Kraay, A.C. Consistent covariance matrix estimation with spatially dependent panel data. Rev. Econ. Stat. 1998, 80, 549–560. [Google Scholar] [CrossRef]
- Arellano, M.; Bover, O. Another look at the instrumental variable estimation of error-components models. J. Econom. 1995, 68, 29–51. [Google Scholar] [CrossRef]
- Delechat, M.C.C.; Melina, M.G.; Newiak, M.M.; Papageorgiou, M.C.; Spatafora, M.N. Economic Diversification in Developing Countries: Lessons from Country Experiences with Broad-Based and Industrial Policies; International Monetary Fund: Washington, DC, USA, 2024. [Google Scholar]
- Van der Ploeg, F.; Venables, A.J. Harnessing windfall revenues: Optimal policies for resource-rich developing economies. Econ. J. 2011, 121, 1–30. [Google Scholar] [CrossRef]
- Jolo, A.M.; Ari, I.; Koç, M. Driving factors of economic diversification in resource-rich countries via panel data evidence. Sustainability 2022, 14, 2797. [Google Scholar] [CrossRef]
- Arezki, R.; Blanchard, O. Seven Questions about the Recent Oil Price Slump. IMFdirect-IMF Blog 2014, 22. Available online: https://www.imf.org/en/Blogs/Articles/2014/12/22/seven-questions-about-the-recent-oil-price-slump (accessed on 30 April 2025).
- Alola, A.A.; Akadiri, S.S.; Usman, O. Domestic material consumption and greenhouse gas emissions in the EU-28 countries: Implications for environmental sustainability targets. Sustain. Dev. 2021, 29, 388–397. [Google Scholar] [CrossRef]
- Hvidt, M. Economic Diversification in GCC Countries: Past Record and Future Trends; LSE Research Online Documents on Economics 55252; London School of Economics and Political Science, LSE Library: London, UK, 2013. [Google Scholar]
- Sadorsky, P. The impact of financial development on energy consumption in emerging economies. Energy Policy 2010, 38, 2528–2535. [Google Scholar] [CrossRef]
- Chien, F.; Ajaz, T.; Andlib, Z.; Chau, K.Y.; Ahmad, P.; Sharif, A. The role of technology innovation, renewable energy and globalization in reducing environmental degradation in Pakistan: A step towards sustainable environment. Renew. Energy 2021, 177, 308–317. [Google Scholar] [CrossRef]
- International Energy Agency. World Energy Outlook 2022; International Energy Agency (IEA): Paris, France, 2022. [Google Scholar]
- IRENA. World Energy Transitions Outlook: 1.5 °C Pathway; International Renewable Energy Agency: Masdar City, United Arab Emirates, 2022. [Google Scholar]
- Grossman, G.M.; Krueger, A.B. Economic growth and the environment. Q. J. Econ. 1995, 110, 353–377. [Google Scholar] [CrossRef]
Disclaimer/Publisher’s Note: The statements, opinions and data contained in all publications are solely those of the individual author(s) and contributor(s) and not of MDPI and/or the editor(s). MDPI and/or the editor(s) disclaim responsibility for any injury to people or property resulting from any ideas, methods, instructions or products referred to in the content. |
© 2025 by the authors. Licensee MDPI, Basel, Switzerland. This article is an open access article distributed under the terms and conditions of the Creative Commons Attribution (CC BY) license (https://creativecommons.org/licenses/by/4.0/).