1. Introduction
Recent technological advancements, particularly in artificial intelligence, have significantly increased computing power demands, leading to greater heat flux densities in electronic devices and creating critical thermal management challenges [
1]. High temperatures are responsible for approximately 55% of electronic equipment failures, with reliability declining by 5% for every 1 °C rise in operating temperature between 70 °C and 80 °C [
2]. Microchannel heat sinks (MCHSs) are a promising solution for addressing thermal management challenges, offering superior thermal performance and high surface-to-volume ratios [
1]. Triply periodic minimal surface (TPMS) heat sinks outperform conventional designs by enhancing thermal exchange through their architected, interconnected, and porous structures. Their high surface area to volume ratio significantly improves heat dissipation efficiency [
3]. TPMS designs can enhance heat transfer by a factor of 10–100 in comparison to the traditional microchannel heat exchangers, making them effective for advanced thermal management. These structures, naturally occurring in systems such as biological membranes and rock crystals, offer remarkable structural strength while minimizing material usage [
4].
TPMS are mathematically defined surfaces characterized by minimal surface area within specific boundaries and zero mean curvature. TPMS designs are categorized into various forms, including Gyroid, Schwarz-p, Schwarz Diamond, and Schoen I-WP. Each of these designs is characterized by unique mathematical equations that define their surfaces. They are extensively used for applications requiring high porosity and structural efficiency [
5,
6]. Al-Ketan and Abu Al-Rub [
7] introduced MSLattice, a free software developed in MATLAB for designing 3D-printable lattices based on TPMS structures. The tool supports both uniform and functionally graded lattices using two network types: sheet networks and solid networks.
There are different designs of TPMS; the most common is the Gyroid structure. Saghir et al. [
8] conducted an experimental and numerical study comparing the thermal and hydraulic performance of metal foam and Gyroid TPMS structures under identical conditions. Both structures were evaluated for various heat fluxes and flow rates, with porosities of 0.7, 0.8, and 0.9. The results showed that the Gyroid structure achieved a uniform temperature distribution by breaking the thermal boundary layer, unlike the metal foam, which exhibited non-uniform cooling and thermal boundary development along the flow. Despite an 18% higher pressure drop in the Gyroid, its Nu number and overall cooling performance outperformed the metal foam. They also explored the effectiveness of using TPMS in forced convection cooling applications, focusing on Gyroid structures with porosities of 0.7, 0.8, and 0.9 [
9]. Using 3D-printed porous aluminum, experiments were conducted with distilled water as the cooling. A porosity of 0.8 was identified as optimal for heat dissipation in small surface cooling applications, balancing thermal performance and pressure drop.
Compared to conventional pin fin heat sinks (PHSs), Gyroid triply periodic minimal surface heat sinks (GHSs) demonstrate great thermo-hydraulic performance. Ansari and Duwig [
10] investigated the GHS for electronic cooling and observed its advantages in terms of thermal efficiency and fluid flow. The GHS demonstrated great thermal performance across all porosities and flow rates. However, the improved performance came with higher pumping power requirements. Under non-uniform heating, the GHS reduced hotspot temperature rises by 30% and minimized temperature variation among hotspots by up to 17.3% compared to the PHS. Chen et al. [
11] investigated a Gyroid-fin heat sink (HS) designed using the Gyroid-TPMS to replace conventional plate-fin HSs for cooling integrated power chips. The Gyroid-fin HS demonstrated better performance, achieving a maximum surface temperature difference of 4.7 °C, significantly lower than the 10.31 °C of the plate-fin HS.
A novel design is introduced by Tang et al. [
12], where fin structures are incorporated into Gyroid-type TPMS heat sinks to enhance convective heat transfer performance. Numerical simulations evaluated the effects of fin height (HTFS-Gyroid) on heat transfer and flow resistance under constant wall temperature conditions using air as the working fluid. Results demonstrated that increasing HTFS-Gyroid from 0 mm to 1.6 mm enhanced the average surface convective heat transfer coefficient by 27.4–34.6%. Simultaneously, the pressure drop increased significantly, ranging from 14.7 to 108.4%, depending on the evaluation method. The effect of a new design on the heat dissipation performance of a gallium-based heat sink was studied by Al-Omari et al. [
13] with Primitive TPMS structures under a heat flux of 15 W/cm
2. Two configurations, full TPMS structure filling and partial filling with a single TPMS layer, were compared for their effectiveness in dissipating heat. The results demonstrated that the full TPMS structure filling option significantly improved heat dissipation through conduction, achieving up to a 13% reduction in peak temperatures compared to cases without TPMS structures.
Regarding Schwartz-D structures, Shen et al. [
14] investigated their thermal performance as an alternative heat sink geometry for liquid cooling, effectively addressing the limitations of conventional designs. Through numerical and experimental analyses, the study revealed that the intertwined interior of Schwartz-D enhances cross-sectional coolant mixing, improving thermal performance at high Biot numbers. Compared to pin fins, Schwartz-D structures reduced thermal resistance by 24% and improved temperature uniformity by 73%. Chi et al. [
15] proposed a multi-morphological design method for TPMS-based microchannels to optimize thermal performance in heat sinks for high heat flux applications. The study employed homogenization analysis to evaluate the thermal performance of Primitive and Gyroid TPMS structures under varying porosity. Results indicated that Primitive structures perform better at porosities below 48%, while Gyroid structures excel above this threshold. Zhang et al. [
16] conducted a numerical study to investigate the anisotropy in thermo-fluid behavior of TPMS-based sandwich panels using Gyroid and Diamond structures with rotation angles from 0° to 90°. Computational fluid dynamics simulations examined flow field characteristics, pressure drops, and heat transfer rates under isothermal conditions. The study revealed that both TPMS structures exhibited 45° symmetry in thermal and hydraulic behavior due to their geometric properties. Diamond consistently outperformed Gyroid in heat transfer.
Various designs of TPMS have been analyzed and compared to assess their thermal and hydraulic efficiency in different cooling applications. Kwasi-Effah et al. [
17] investigated the thermo-hydraulic performance of different TPMS structures, focusing on G-Prime 1, G-Prime 2, FRD, FRD Prime, Diamond, Gyroid, and Primitive Schwartz, all generated using LattGen software. Results revealed that G-Prime 2 and FRD Prime showed the highest heat transfer performance, indicated by better Nu numbers, but also incurred higher pressure drops. Gyroid and Diamond provided a balanced performance.
The convective heat transfer performance of three TPMS including Diamond, Gyroid, and IWP are compared with the fin-based heat sink by Tang et al. [
18]. They assessed the heat dissipation capacity under air flow with a Re number range of 166 to 940. Results showed that TPMS heat sinks outperformed the fins model in heat transfer, with average convective heat transfer coefficients being 85–207% higher for Diamond, 55–137% higher for Gyroid, and 16–55% higher for IWP. Baobaid et al. [
3] conducted a numerical study to evaluate the thermal and fluid flow performance of TPMS-based heat sinks, including Diamond-Solid, Gyroid-Solid, and Gyroid-Sheet designs, under natural free convection conditions. TPMS-based heat sinks outperformed conventional pin-fin designs by 35–50%. The Gyroid-Sheet design demonstrated better thermal performance when both the top and bottom enclosure surfaces were open but showed higher surface temperatures when only the sides and top were open due to increased hydraulic resistance.
The performance of TPMS heat sinks can be enhanced through various optimization methods, which have recently been the focus of several studies to improve their overall effectiveness. Modrek et al. [
19] developed a multi-objective topology optimization framework for designing lightweight TPMS-based passive heat sinks that optimize both thermal dissipation and structural integrity. The optimization employed the Solid Isotropic Method of Penalization (SIMP) approach, using a weighted sum method, to obtain Pareto-optimal designs. Primitive, Diamond, Gyroid, and IWP TPMS structures were mapped from the topology-optimized outputs using a novel density mapping method, and their thermal and structural performances were analyzed. Modrek et al. [
20] developed a methodology to design additively manufactured porous heat sinks using topology optimization and TPMS structures. The study employed SIMP and unit cell homogenization approaches to optimize thermal performance by minimizing thermal compliance within a constrained design domain. The gradient-based mapping to Gyroid-Sheet structures outperformed Gyroid-Solid designs, exhibiting higher effective thermal conductivity and maintaining lower temperatures under constant heat flux. A three-dimensional multi-scale topology optimization method is introduced by Luo et al. [
21] to enhance natural convection heat transfer in porous heat sinks by integrating the lattice Boltzmann method at the pore scale with a level-set-based topology optimization approach at the representative elementary volume scale. The study investigates six predetermined unit cells and the Primitive cell, a TPMS type, demonstrated better thermal conductivity and overall heat transfer performance.
Despite the thermal performance of commonly studied TPMS geometries such as Gyroid, Diamond, and Primitive, these designs may face challenges related to less thermal uniformity under varying flow conditions. Moreover, most previous works have focused on numerical studies, with fewer experimental validations, especially for designs incorporating gradient porosity. There remains a gap in exploring alternative TPMS structures that could offer improved thermal uniformity. These insights from the literature highlight the need for experimental investigations of less-explored TPMS types, such as the Fischer–Koch S (FKS) structure, which may offer different heat transfer characteristics due to their distinct geometry.
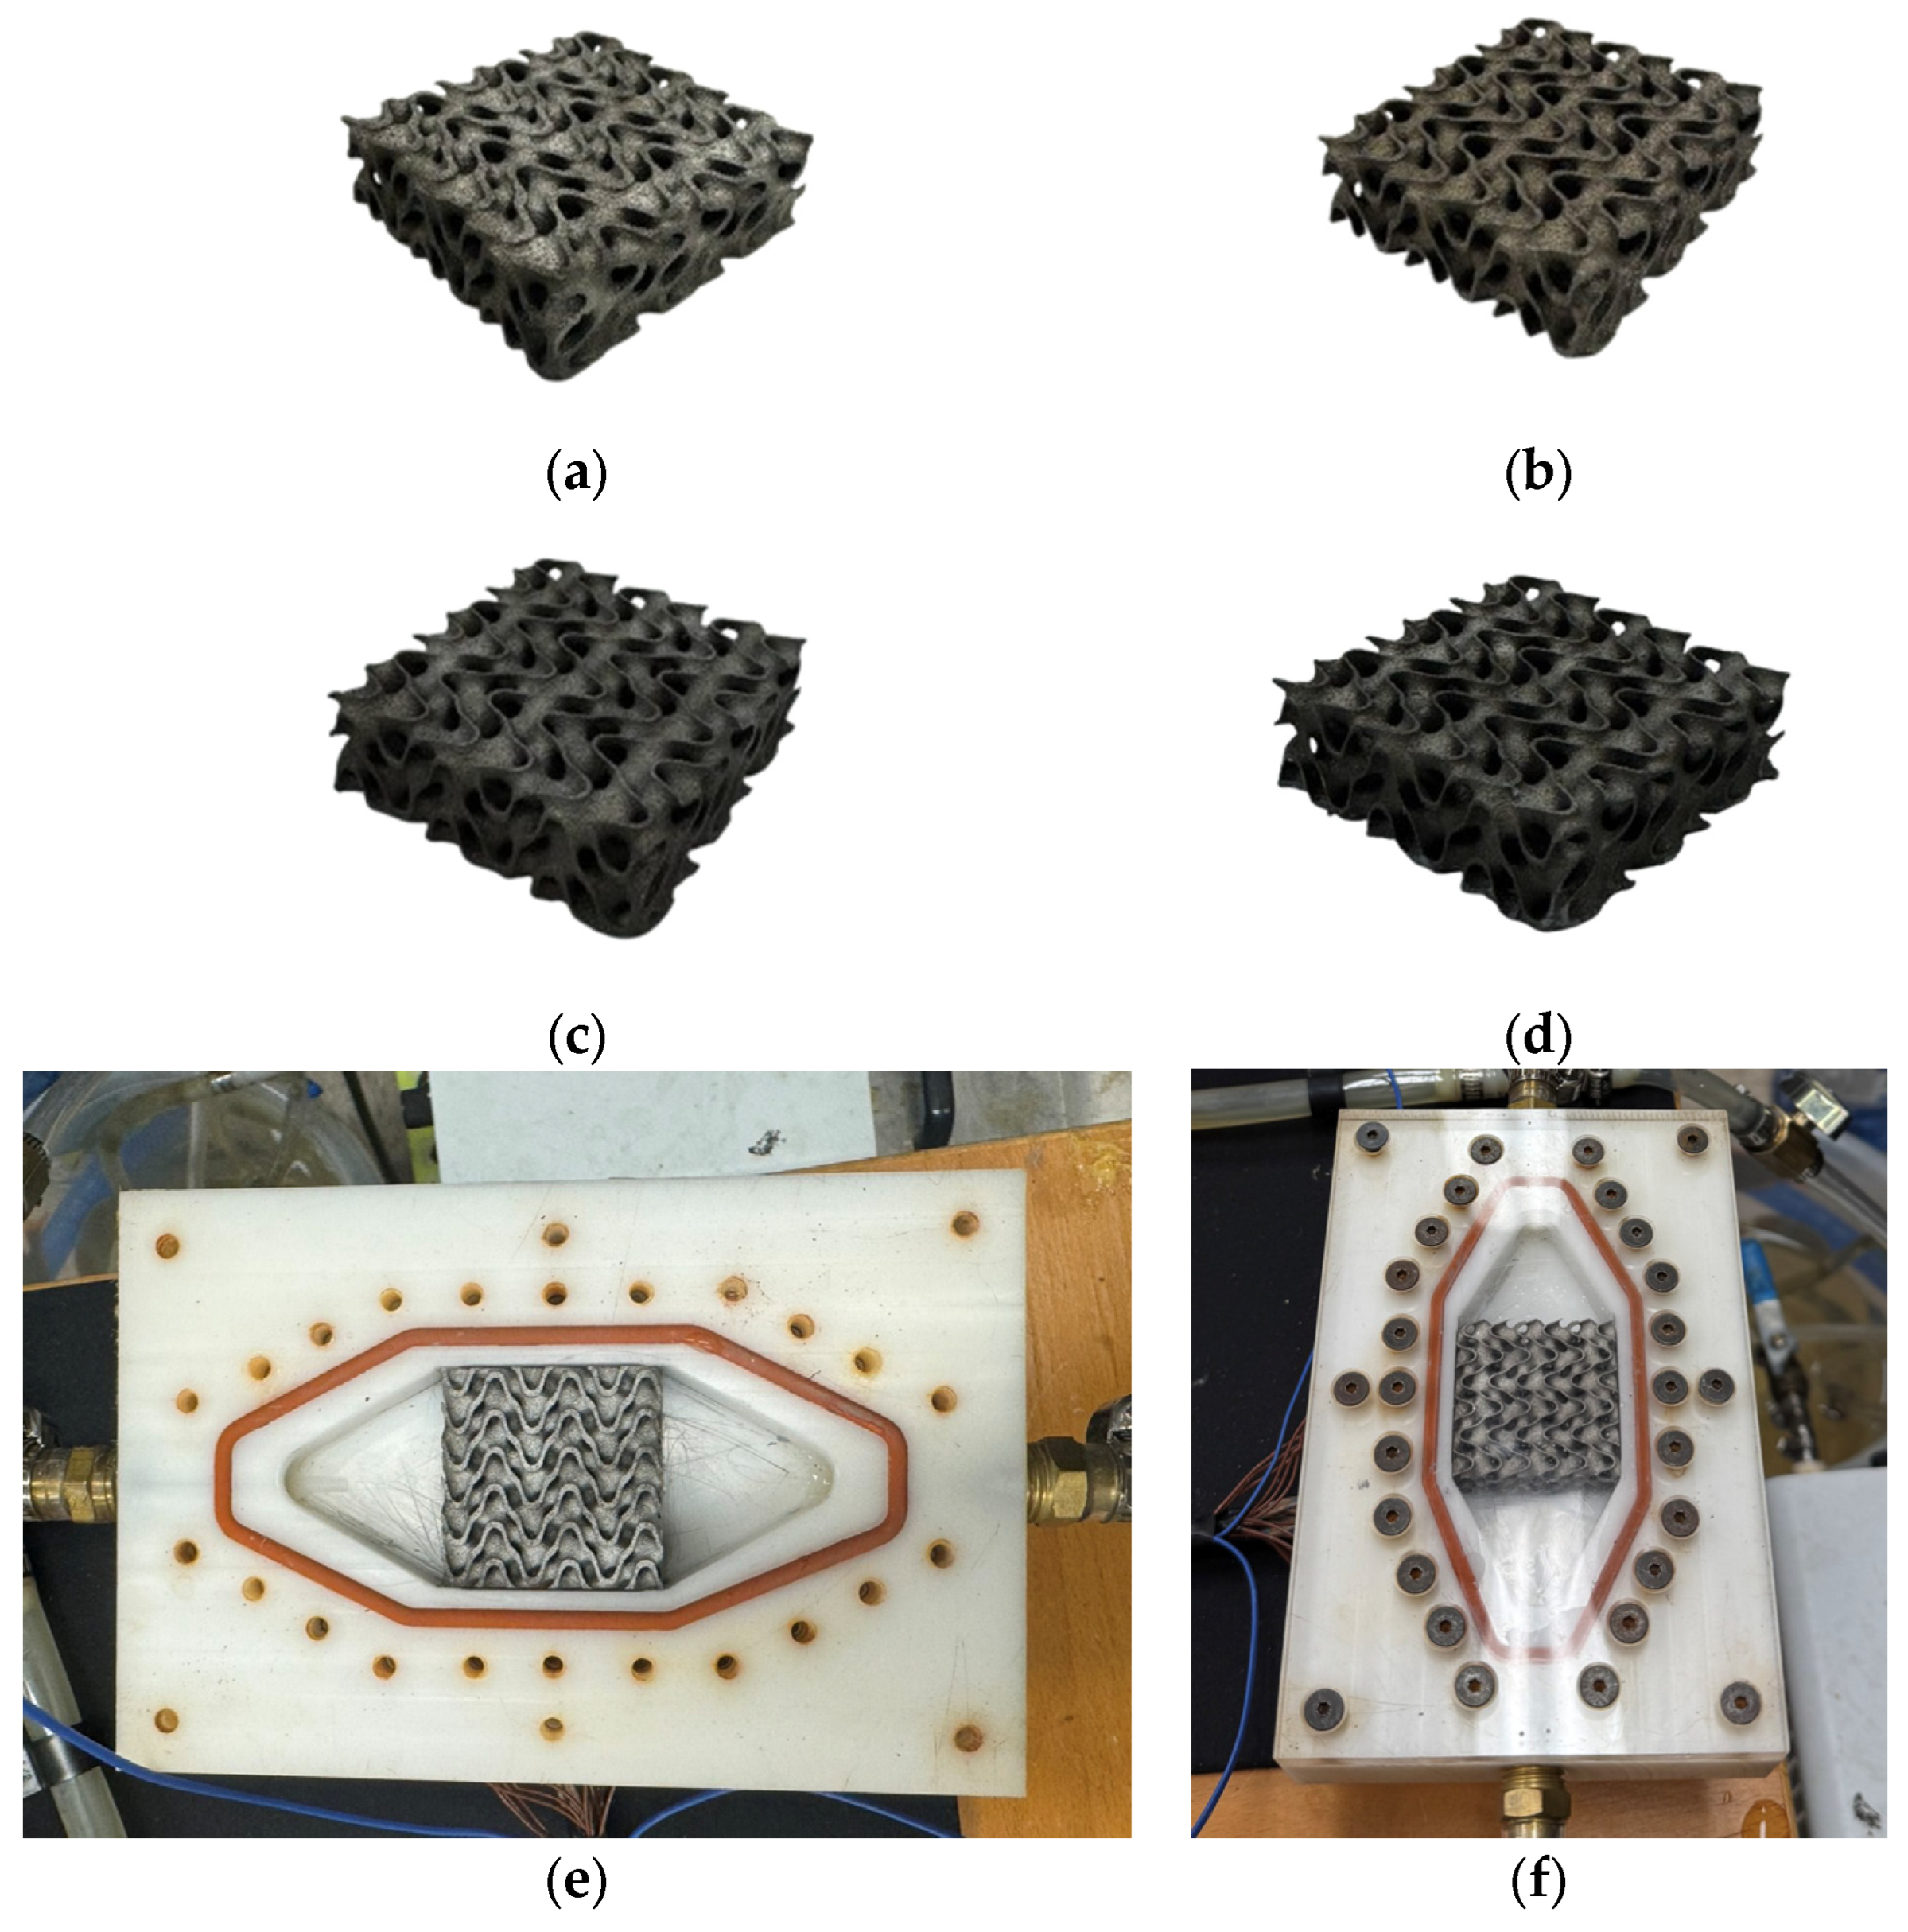
While various TPMS-based heat sink geometries such as Gyroid, Diamond, and Primitive have been extensively investigated for their thermal and hydraulic performance, the Fischer–Koch S (FKS) structure remains largely unexplored in this context. In this study, a new design of FKS-TPMS heat sinks is introduced, featuring three with uniform porosities of 0.6, 0.7, and 0.8, and a fourth featuring a gradient porosity design varying from 0.6 to 0.8. The purpose of the gradient design is to improve heat transfer by gradually changing the flow conditions along the channel, which helps prevent the formation of a fully developed flow and maintains better cooling. All designs were experimentally tested using water as the working fluid under laminar flow conditions across a range of flow rates. To provide a comprehensive performance evaluation, the thermal and hydraulic behavior of the FKS-TPMS heat sinks was also compared to that of a conventional straight-channel heat sink of identical dimensions and working conditions. Moreover, a Temporal Convolutional Network (TCN) method has been introduced to predict the steady-state temperature of the heat sink at the early stage of each test, which can contribute to an efficient experimental process and validation.
3. Results and Discussion
This section presents the experimental results for the FKS-TPMS heat sink design with four different porosities, tested under a range of laminar flow rates. Numerical simulations were conducted to compare the performance of the proposed FKS-TPMS design with that of a conventional straight-channel heat sink under identical operating conditions. Key performance parameters, including temperature distribution along the flow direction, thermal resistance, Nusselt number, and heat transfer coefficient, were analyzed to provide a comprehensive evaluation of the thermal and hydraulic behavior of the new design.
3.1. Temperature Distribution
The thermal performance of four FKS-TPMS heat sink designs was evaluated under different porosity configurations: P6, P7, P8, and P678, corresponding to porosities of 0.6, 0.7, 0.8, and a gradient porosity varying from 0.6 to 0.8 along the flow direction, respectively. Three mass flow rates of 0.012, 0.015, and 0.019 kg/s were experimentally tested. Surface temperatures were measured at seven locations along the flow direction using thermocouples.
Figure 7 illustrates the difference in the temperature distribution across the heat sink surface and inlet temperature for all four designs. A key characteristic of TPMS-based designs is enhanced temperature uniformity. Among the tested cases, the highest surface temperature variation was observed in the P6 design, with a difference of 1.8 °C between the hottest and coolest points at a mass flow rate of 0.015 kg/s. On average, the temperature difference variation across the surface was 1.05, 1.20, 1.68, and 1.16 °C for P8, P7, P6, and P678, respectively. These results indicate that the gradient porosity design offers improved temperature uniformity compared to the uniform-porosity configurations. The enhanced uniformity in TPMS heat sinks is attributed to their ability to disrupt the thermal boundary layer and improve local heat transfer by promoting flow mixing. This effect helps mitigate hotspot formation, a common limitation in traditional straight-channel heat sinks where developing flow can lead to non-uniform temperature distribution.
In addition to uniformity, lower surface temperature is another key indicator of thermal performance. Across all designs, increasing the mass flow rate consistently led to lower surface temperatures, as expected due to higher convective heat transfer. As shown in
Figure 7a, the P8 design with a porosity of 0.8 exhibited the highest surface temperatures across all mass flow rates, with values ranging from 22.8 to 23.4 °C at 0.012 kg/s, and decreasing to the range of 19.9 to 20.5 °C at 0.019 kg/s. In contrast, the P6 design demonstrated the best thermal performance, with surface temperatures’ differences ranging from 13.1 to 14.2 °C at 0.019 kg/s, as shown in
Figure 7c. At the lowest mass flow rate of 0.012 kg/s, the temperature difference rose to a range of 14.9 to 16.2 °C. At lower porosity, the structure guides the fluid through more complex flow paths, increasing both contact time and surface interaction, which enhances heat transfer. TPMS designs are especially appealing in thermal applications due to their unique geometry, defined by zero Gaussian curvature and continuous, non-overlapping 3D repetition. These structures enable the development of compact, high-performance heat sinks. The FKS-TPMS designs used in this study leverage these mathematical geometries to provide efficient thermal management.
3.2. Overall Thermal Resistance
One of the key indicators of heat sink performance is its thermal resistance, as a lower thermal resistance corresponds to improved heat dissipation and lower surface temperatures. Although several parameters influence thermal resistance, in this study, all heat sinks were made from the same material with identical thermal conductivity. Therefore, the variation in performance is attributed to geometric differences, particularly porosity.
Figure 8a–c illustrates the change in thermal resistance along the flow direction, measured at thermocouple positions on the heat sink surface, for mass flow rates of 0.012, 0.015, and 0.019 kg/s, respectively.
Higher thermal resistance indicates greater resistance to heat transfer and thus lower thermal performance. The results show that thermal resistance increases with porosity, meaning that designs with lower porosity offer better thermal performance. Among all designs, the FKS-TPMS with a porosity of 0.8 consistently showed the highest thermal resistance, reaching up to 0.43 °C/W at the lowest mass flow rate of 0.012 kg/s. In contrast, the lowest thermal resistance was measured for the P6 design, with a minimum of 0.23 °C/W at the highest mass flow rate of 0.019 kg/s. These results demonstrate that decreasing porosity improves the thermal performance of the FKS-TPMS heat sinks and contributes to lower surface temperatures. The gradient porosity design showed better performance than both P8 and P7, especially at higher mass flow rates of 0.015 and 0.019 kg/s, maintaining lower thermal resistance across the measurement points. Moreover, thermal resistance decreases with the increasing mass flow rate for all designs due to enhanced convective heat transfer.
Figure 9 presents the average thermal resistance values for the four FKS-TPMS heat sinks (designs P6, P7, P8, and P678) under three mass flow rates: 0.012, 0.015, and 0.019 kg/s. As discussed earlier, increasing the mass flow rate consistently reduces thermal resistance across all designs due to improved convective heat transfer. Among the configurations, P6 consistently exhibits the lowest thermal resistance, achieving a 31.8% reduction compared to P8 at the highest flow rate of 0.019 kg/s. Even at the lowest mass flow rate of 0.012 kg/s, P6 outperforms P8 with a 32.6% lower thermal resistance, highlighting its superior thermal performance. Additionally, the P678 gradient design shows improved performance at higher mass flow rates, approaching the efficiency of P6. These results confirm that the lower-porosity structure of P6 delivers the most effective thermal performance overall, while the gradient porosity becomes beneficial as the mass flow rate increases.
3.3. Comparison with the Straight Channel Heat Sink
To better evaluate the performance enhancement offered by the FKS-TPMS heat sink, its surface temperature distribution was compared with that of a conventional Straight Channel Heat Sink (SCHS). The traditional design features identical dimensions and boundary conditions, allowing for a direct comparison. Numerical simulations were conducted in COMSOL to replicate the same mass flow rates used in the experimental evaluation of the FKS-TPMS designs. The straight-channel heat sink had previously been tested experimentally by the authors under varying mass flow rates, using the same heat flux and geometric configuration. To ensure the validity of the simulation approach, the numerical results were first validated against experimental data. As shown in
Figure 10, there is a good agreement between the numerical and experimental results, confirming the accuracy of the model. With the numerical model validated, it was used to directly compare the performance of the FKS-TPMS and straight-channel heat sinks under identical flow conditions.
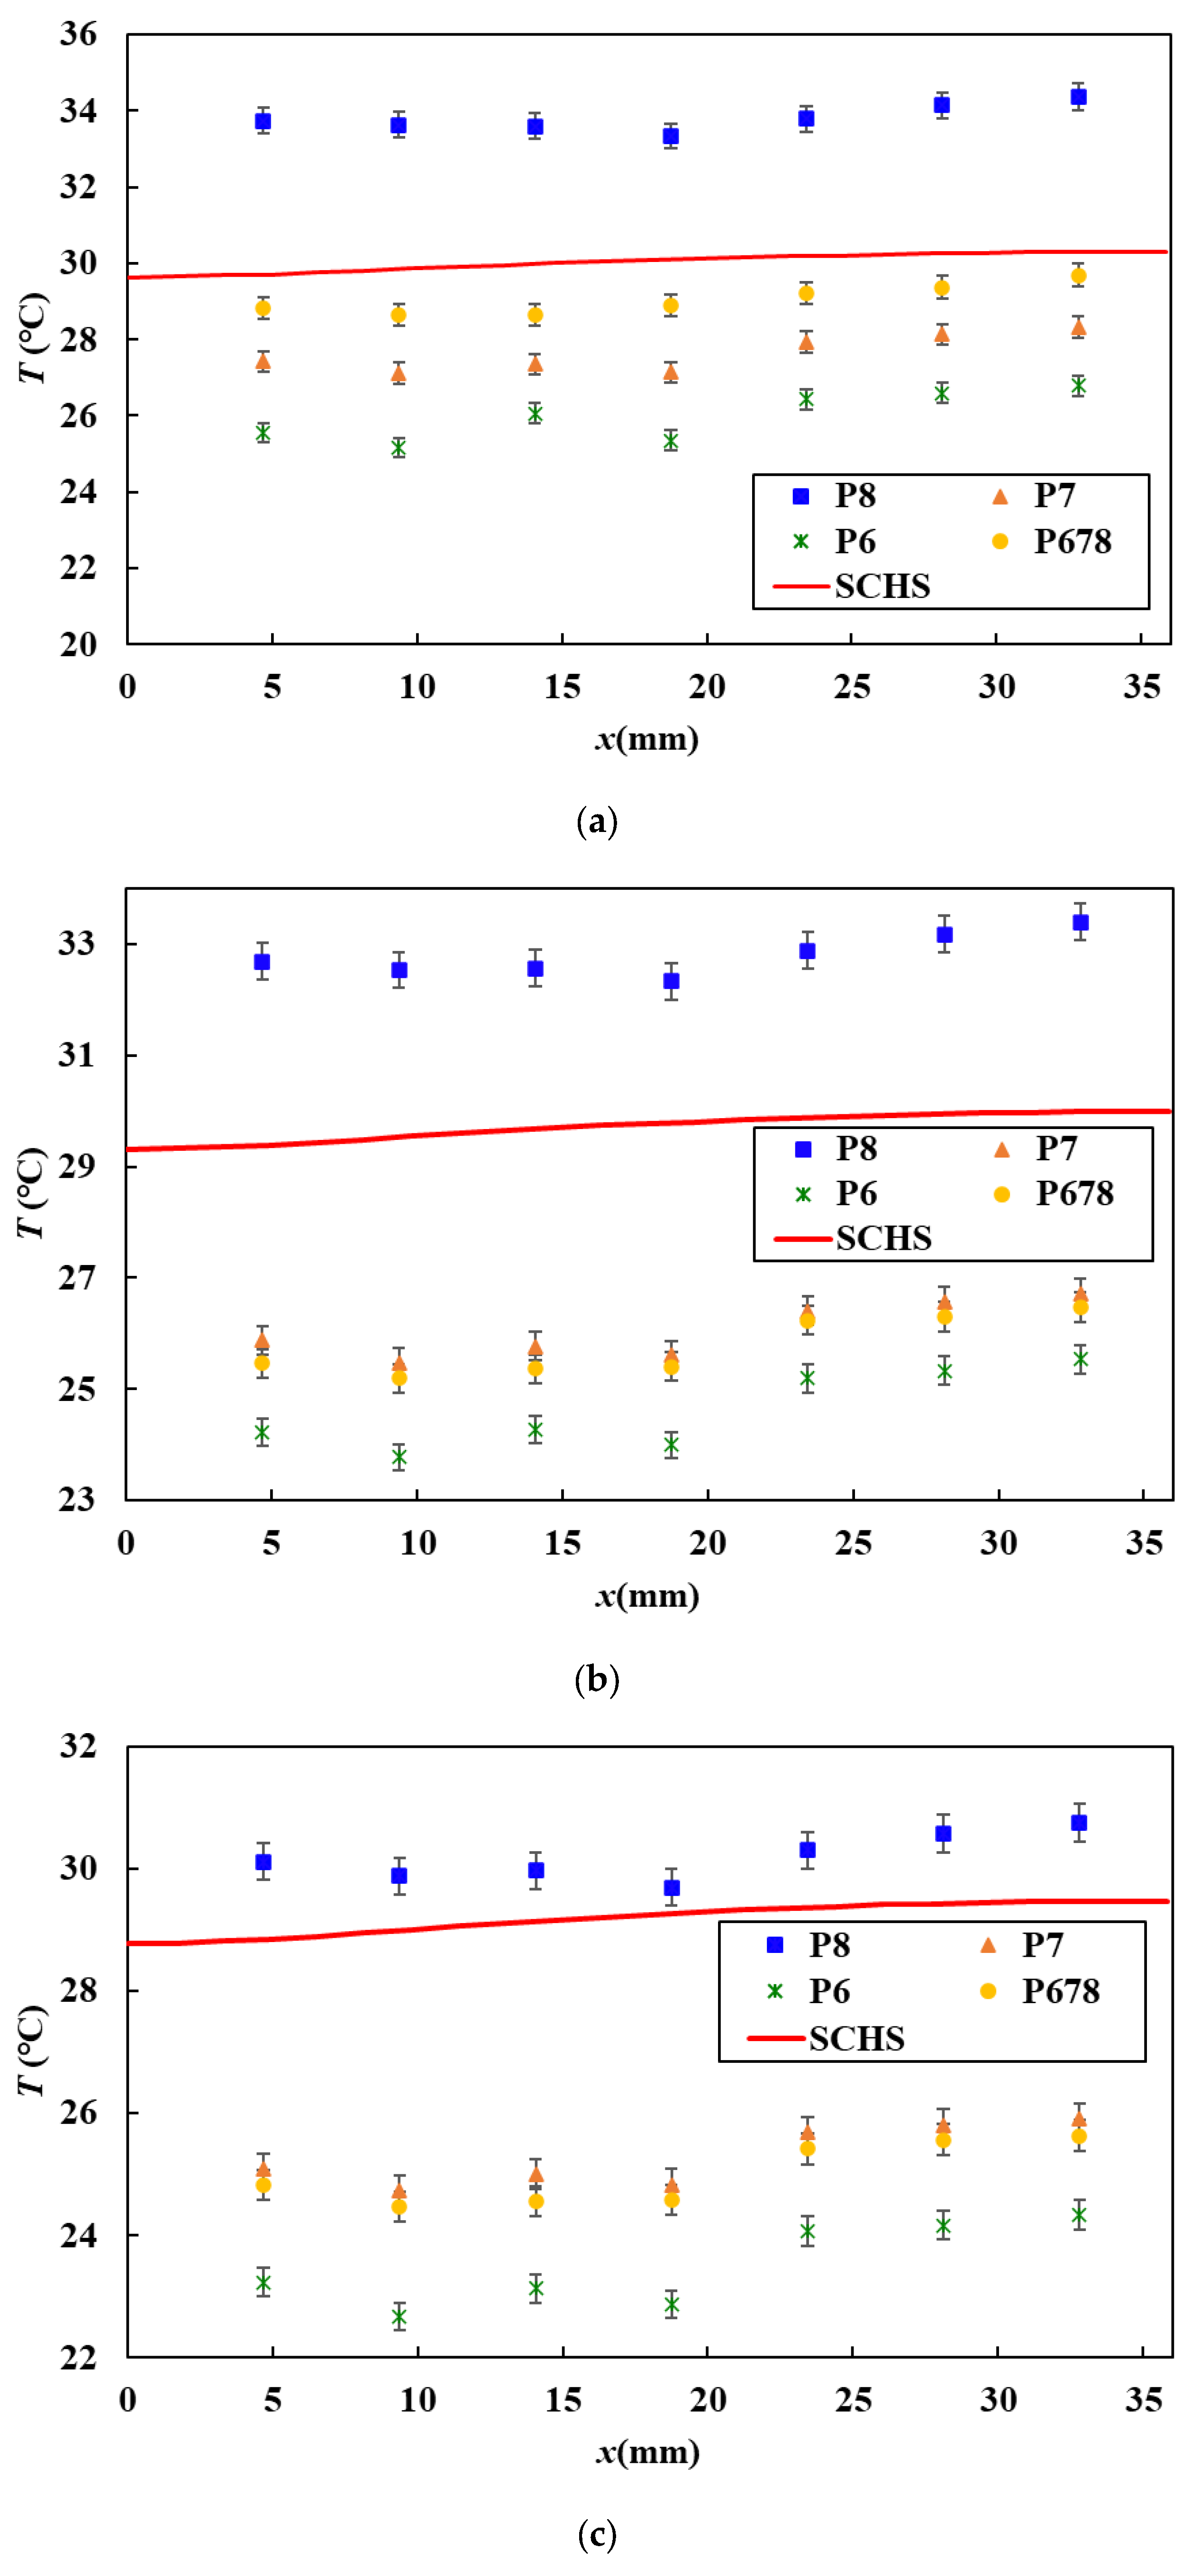
Figure 11 illustrates the surface temperature distribution of the FKS-TPMS heat sink designs compared to a conventional straight-channel heat sink under mass flow rates of 0.012, 0.015, and 0.019 kg/s. As shown in
Figure 11a–c, the SCHS consistently exhibits higher surface temperatures than the P6, P7, and P678 designs across the flow direction, indicating lower heat dissipation performance. These TPMS designs outperform the SCHS in all tested conditions. Among all configurations, P6 consistently shows the lowest surface temperatures, confirming the thermal benefits of lower porosity in enhancing heat transfer. The P678 gradient design also performs well, particularly at the higher mass flow rates of 0.015 and 0.019 kg/s.
At the lowest mass flow rate of 0.012 kg/s,
Figure 11a, the average surface temperature of the P6 heat sink is 13.4% lower than that of the SCHS. As the mass flow rate increases, this difference becomes more pronounced: at 0.015 kg/s, the average temperature is 17.2% lower, and at 0.019 kg/s, it reaches a 19.5% reduction compared to the SCHS. These results demonstrate that the thermal performance advantage of TPMS heat sinks, particularly P6, becomes more significant with increasing mass flow rate. To have further comparison with the SCHS and better understand the impact of porosity and flow rate, the performance of the P7 design was also evaluated. Although its performance is slightly behind that of P6. At the lowest mass flow rate of 0.012 kg/s, P7 achieves an average surface temperature that is 7.8% lower than that of the SCHS. As the mass flow rate increases, the advantage becomes more evident: at 0.015 kg/s, the reduction reaches 12.3%
, and at 0.019 kg/s, it improves further to 13.4%
. These results demonstrate that the TPMS structure of P7 provides enhanced heat transfer performance compared to the conventional straight-channel design, particularly at higher mass flow rates. To provide further insight into the effectiveness of the FKS-TPMS design, its thermal performance was compared with that of a Gyroid TPMS heat sink previously studied under the same experimental conditions [
9]. Both designs shared the same dimensions, porosities, heat flux, and test system. At a porosity of 0.7 and flow rates of 11.78 and 19.65 cm
3/s, the Gyroid structure reached average surface temperatures of 29.55 °C and 28.32 °C, respectively. However, under the same conditions, the FKS-TPMS design achieved lower average temperatures of 27.63 °C and 25.29 °C, indicating enhanced thermal performance. These results confirm that the FKS-TPMS offers better cooling performance than the Gyroid structure under identical working conditions, highlighting the benefit of the FKS geometry in improving convective heat transfer.
3.4. Thermal Performance Analysis
The thermal performance of the newly developed FKS-TPMS heat sinks was evaluated and compared to a conventional straight-channel heat sink in terms of convective heat transfer coefficient and Nusselt number. These two parameters provide key insights into the effectiveness of each design in enhancing heat dissipation under varying flow conditions of 0.012 to 0.015 kg/s.
Figure 12 presents the convective heat transfer coefficient for the FKS-TPMS heat sinks with four different porosities under varying mass flow rates of 0.012, 0.015, and 0.019 kg/s. As expected, in all cases, the heat transfer coefficient increases with an increasing mass flow rate, which corresponds to greater convective capacity and results in lower surface temperatures. The results also show a clear correlation between the porosity and heat transfer performance. As porosity decreases, the heat transfer coefficient increases. The heat sink with the highest porosity of 0.8 consistently exhibits the lowest heat transfer coefficient, while the P6 design shows the highest across all mass flow rates.
At the lowest mass flow rate of 0.012 kg/s, reducing the porosity from 0.8 to 0.7 increases the heat transfer coefficient by 35.24%, and further reducing from 0.8 to 0.6 results in a 54.46% improvement. This highlights the significant impact of lower porosity on enhancing convective performance, even at low mass flow rates. At a mass flow rate of 0.015 kg/s, the trend continues: the heat transfer coefficient for P7 increases by 40.9% compared to P8, while P6 shows a 50.88% increase relative to P7. These differences confirm that lower porosity enhances fluid–surface interaction, leading to more efficient thermal exchange. The P678 design, which features a gradient porosity, performs between P7 and P6 in all cases, at the highest mass flow rate of 0.019 kg/s, its performance exceeds that of P7.
To further evaluate convective heat transfer performance,
Figure 13 presents the average Nu number ratio (Nu/Nu
s) for each FKS-TPMS design compared to (SCHS), under identical mass flow rates and heat flux conditions. A ratio greater than one indicates improved convective performance over the SCHS. As shown, the FKS-TPMS heat sinks outperform the SCHS in most configurations. Specifically, the P6, P7, and P678 design all exhibit Nu/Nu
s ratios greater than one, confirming their enhanced heat transfer capabilities. Among them, P6 demonstrates the highest performance, with the ratio increasing from 1.29 at 0.012 kg/s to 1.40 at 0.019 kg/s, indicating a consistent advantage across all flow conditions.
The P678 design, featuring a gradient porosity structure, also shows notable and consistent performance. Starting at 1.11 for 0.012 kg/s, its ratio reaches 1.29 at 0.019 kg/s with higher mass flow rates. In contrast, the P8 design, which has the highest porosity of 0.8, exhibits Nu/Nus ratios below one, indicating lower convective heat transfer compared to the SCHS, particularly at low mass flow rates. However, at 0.019 kg/s, the ratio improves to 0.92. The results confirm that FKS-TPMS structures, especially lower-porosity and gradient designs, outperform the SCHS geometry in terms of convective heat transfer. The performance advantage becomes more pronounced as the mass flow rate increases.
3.5. Steady State Temperature Prediction
In the experimental setup, each heat sink design is tested by applying a constant heat flux while a cooling method is introduced, starting from an initial temperature. The surface temperature is measured using thermocouples and continuously recorded every 2 s throughout the test until the system reaches a steady state, which may take up to 60 min depending on the design and cooling conditions. To reduce this testing time, a deep learning model is proposed to predict the final steady-state temperature at earlier stages. A time-series approach is used to model the temperature evolution over time, while mass flow rate and porosity are constant during each test. The Temporal Convolutional Network (TCN) is a deep learning architecture designed for sequence modeling. As a variant of the convolutional neural network (CNN), it uses causal and dilated 1D convolutions, making it well-suited for time series data [
25]. Unlike recurrent architecture, the TCN has a simpler structure and often outperforms traditional recurrent neural networks (RNNs) in various sequence tasks. One of the key features of TCN is causal convolution, which ensures that predictions are based on present and past inputs, preventing information leakage from the future [
26].
Figure 14 presents the architecture of the TCN model.
To predict the steady-state average surface temperature, we developed a hybrid deep learning model that integrates a TCN model with scalar features using multi-input architecture. The model takes two types of input: (1) early-stage surface temperature time series for durations of 10, 20, or 30 min, and (2) scalar features including the mass flow rate and the porosity of the tested sample. Before training, temperature sequences and scalar features were normalized separately. The model uses a TCN with the kernel size of 3, ReLU activation, and dilation factors. The model is trained using the Adam optimizer and means squared error loss. To ensure robust evaluation, a k-fold cross-validation strategy was applied, and performance was measured using a mean absolute error (MAE), root mean square error (RMSE), and R
2, as shown in
Table 1.
The developed hybrid TCN model was applied to predict the steady-state surface temperature of heat sinks under various operating conditions. This approach offers the potential to reduce testing time by estimating the final temperature earlier in the experiment. Additionally, the model can assist in validating the final steady-state temperature in future experimental setups. Three scenarios were examined based on the duration of temperature data collection: 10, 20, and 30 min. As expected, the 30 min input yielded better accuracy, with the MAE of 0.526 °C and the RMSE of 0.797 °C. These results confirm the model’s ability to predict the final steady-state temperature. However, predicting the steady-state temperature from earlier stages is more valuable for reducing experimental time. The 20 min and 10 min models achieved MAEs of 0.628 °C and 0.736 °C, respectively, demonstrating that even shorter input durations can yield reliable predictions. As shown in
Table 1, longer time-series input improves accuracy, but the early predictions remain practical for real-time estimation and experimental optimization. This model shows the potential for extension to additional TPMS designs. Future work may focus on refining prediction using even shorter time intervals and expanding the model across a wider range of geometries, flow conditions, and regimes.
4. Conclusions
This study employed an experimental approach to evaluate the thermal performance of FKS-TPMS heat sinks with four porosity configurations: 0.6, 0.7, 0.8, and a gradient porosity varying along the flow direction. A range of mass flow rates was tested, and the performance was compared with that of a traditional straight-channel heat sink under identical dimensions and operating conditions, using both experimental and numerical methods.
The P8 design with a porosity of 0.8, exhibited the highest temperature difference with inlet flow across all mass flow rates, with values ranging from 22.8 to 23.4 °C at 0.012 kg/s, while the P6 design demonstrated the best thermal performance, with surface temperature differences ranging from 13.1 to 14.2 °C at 0.019 kg/s. At lower porosities, the structure guides the fluid through more complex flow paths, increasing both contact time and surface interaction, which enhances heat transfer. Moreover, results indicate that the gradient porosity design offers improved temperature uniformity compared to the uniform-porosity configurations. Thermal resistance decreased consistently with an increasing mass flow rate for all FKS-TPMS designs. The P6 heat sink achieved the lowest thermal resistance, reaching 0.23 °C/W at 0.019 kg/s, while the P8 design showed the highest, up to 0.43 °C/W at 0.012 kg/s. The P678 gradient design also performed effectively at higher mass flow rates. The P6 design exhibited the greatest performance compared to the SCHS, with average surface temperatures 13.4%, 17.2%, and 19.5% lower than SCHS at mass flow rates of 0.012, 0.015, and 0.019 kg/s, respectively. Moreover, compared to the Gyroid structure studied under the same experimental conditions and porosity, the P7 demonstrated a lower average surface temperature, with approximately 3 °C at the highest flow rate of 0.019 kg/s, highlighting the improved thermal performance of the proposed geometry.
The convective heat transfer performance of the FKS-TPMS heat sinks improved significantly with decreasing porosity and increasing mass flow rate. At 0.012 kg/s, reducing porosity from 0.8 to 0.7 increased the heat transfer coefficient by 35.24%, and a further reduction to 0.6 resulted in a 54.46% improvement. At 0.015 kg/s, the heat transfer coefficient increased by 40.9% for P7 over P8, and by 50.88% for P6 over P7. In terms of the Nu number ratio of KFS-TPM to SCHS, P6 achieved the highest performance, increasing from 1.29 to 1.40 across the tested mass flow rates. The P678 design rose from 1.11 to 1.29, while P7 ranged from 1.14 to 1.23. In contrast, P8 remained below one, improving from 0.84 to 0.92 as the mass flow rate increased. These results confirm that lower-porosity and gradient TPMS designs consistently outperform the SCHS in convective heat transfer, with performance gains more pronounced at higher mass flow rates.
A deep learning model based on a Temporal Convolutional Network (TCN) was developed to predict the steady-state surface temperature of TPMS heat sinks using early-stage time-series experimental data. The model was evaluated under three scenarios, using temperature data from the first 10, 20, and 30 min of testing. The results confirm that the model can reliably estimate final steady-state temperatures with reduced test durations, enabling prediction and supporting validation.
This study presents a framework for evaluating and improving the thermal performance of TPMS-based heat sinks. The results underscore the effectiveness of low-porosity and gradient configurations in enhancing heat transfer. These design tools and methods can be leveraged to advance the development of heat sinks with more efficient cooling performance.
Future Work
The proposed FKS-TPMS design demonstrated potential in improving temperature uniformity along the flow direction and reducing surface temperature under constant heat flux. Future work may explore the performance of this design under non-uniform and fluctuating heat loads to better understand its response to hotspot formation. Additionally, investigating various porosity configurations under these conditions is recommended. The application of topology optimization could further enhance hotspot management and support the development of advanced heat sink solutions. Moreover, developing a power-law correlation between the Nu number, Reynolds number, Prandtl number, and porosity could serve as an empirical approach for characterizing thermal performance. Future work will include a numerical investigation of FKS-TPMS designs to evaluate performance metrics such as the Performance Evaluation Criterion (PEC), enabling the assessment of thermal-hydraulic trade-offs.


