Article

Fault Detection System for Smart City Distribution Networks: A Long Short-Term Memory-Based Approach

by
A. Herrada
1,†,
C. Orozco-Henao
2,†,
Juan Diego Pulgarín Rivera
1,3,*,†,
J. Mora-Flórez
4,† and
J. Marín-Quintero
5,†
1
Department of Electrical and Electronic Engineering, Universidad del Norte, Barranquilla 081007, Colombia
2
School of Electrical, Electronics and Telecommunications Engineering, Universidad Industrial de Santander, Bucaramanga 680002, Colombia
3
Faculty of Engineering, Universidad Distrital Francisco José de Caldas, Bogotá D.C. 110231, Colombia
4
Department of Electrical Engineering, Universidad Tecnológica de Pereira, Pereira 660003, Colombia
5
Energy Department, Universidad de la Costa, Barranquilla 080002, Colombia
*
Author to whom correspondence should be addressed.
These authors contributed equally to this work.
Energies 2025, 18(13), 3453; https://doi.org/10.3390/en18133453
Submission received: 12 November 2024 / Revised: 19 January 2025 / Accepted: 27 January 2025 / Published: 30 June 2025
(This article belongs to the Section F: Electrical Engineering)

Abstract

One of the primary goals of smart cities is to enhance the welfare and comfort of their citizens. In this context, minimizing the time required to detect fault events becomes a crucial factor in improving the reliability of distribution networks. Fault detection presents a notable challenge in the operation of Smart City Distribution Networks (SCDN) due to complex operating conditions, such as changes in the network topology, the connection and disconnection of distributed energy resources (DERs), and varying microgrid operation modes, all of which can impact the reliability of protection systems. To address these challenges, this paper proposes a fault detection system based on Long Short-Term Memory (LSTM), leveraging instantaneous local current measurements. This approach eliminates the need for voltage signals, synchronization processes, and communication systems for fault detection. On the other hand, LSTM methods enable the implicit extraction of features from current signals and classifies normal operation and fault events through a binary classification formulation. The proposed fault detector was validated on several intelligent electronic devices (IED) deployed in the modified IEEE 34-node test system. The obtained results demonstrate that the proposed detector achieves a 90% accuracy in identifying faults using instantaneous current values as short as 1/4 of a cycle. The results obtained and its easy implementation indicate potential for real-life applications.

1. Introduction

1.1. General Context

Over the past decade, advancements in smart technologies and Artificial Intelligence (AI) have driven significant progress in the development of Smart Grids (SG). These technologies have enabled improved monitoring, automation, and control, transforming traditional power systems into more intelligent and adaptive infrastructures [1,2]. Concurrently, growing concerns about sustainability have accelerated the adoption of distributed energy resources (DERs), such as solar panels and wind turbines, as a means to reduce greenhouse gas emissions and enhance energy efficiency. As a result, modern power systems have evolved to integrate DERs and support new concepts like microgrids (MG), which increase the reliability, resilience, efficiency, and flexibility of the grid. These advancements have significantly improved the quality of life in urban areas by reducing power outages and mitigating energy shortages [3,4].
Despite these benefits, the integration of DERs and the adoption of advanced technologies have introduced substantial operational challenges. The bidirectional power flows inherent to DERs, along with the variability of primary energy sources, create complexities in maintaining stable network operation [5]. Additionally, the reconfiguration of networks and the dynamic nature of microgrids add further strain on traditional protection systems, often leading to issues such as protection blinding, false tripping, and synchronization problems. These challenges underscore the need for robust monitoring, automation, and control strategies to address the growing operational demands of modern power systems [6].

1.2. Literature Review

To address the challenges identified in modern power systems, the following review focuses on the relevant literature discussing fault detection methods and strategies. Particular emphasis is placed on disruptive technologies, advanced learning algorithms, and approaches tailored to scenarios such as bidirectional power flows, network reconfiguration, and microgrid operation modes.
The protection of Smart City Distribution Networks (SCDNs), also referred to as Active Distribution Networks (ADNs), presents significant challenges due to their evolving operational conditions. Issues such as bidirectional power flows, variations in short-circuit levels, and the increasing penetration of distributed energy resources (DERs) complicate the performance of traditional protection systems. Specific problems, including protection blinding, unintended isolation, false tripping, and the loss of synchronization during reclosing operations, have been extensively documented in the literature [7,8].
In response to these challenges, various fault detection strategies have been proposed, moving away from conventional protection principles and incorporating disruptive technologies. For example, techniques based on deep learning (DL), traveling waves, phase diagram features, and compressive sensing have shown promise in addressing the limitations of traditional methods [9,10,11,12]. Model-based approaches, such as those described in [13,14], have also been explored.
Among these, Ref. [13] developed a fault detector for microgrids using wavelet transforms and Recurrent Neural Networks (RNNs) of the Gated Recurrent Unit (GRU) type. This approach successfully detects and locates faults using local information, eliminating the need for a communication system. However, its effectiveness is limited by the absence of considerations for system imbalance, demand variability, and DER connection or disconnection. Similarly, Ref. [15] proposed a novel method for detecting and characterizing transient phenomena, such as partial discharges and electrical arcs, using the phase diagram domain for feature extraction and training machine learning models. Although innovative, the focus on transient phenomena limits its application to broader protection challenges.
A two-stage fault location methodology is introduced in [10], where candidate fault sections are initially identified, followed by a compressive sensing-based model to refine the fault location. While this method improves accuracy, it relies heavily on comprehensive measurement data, which may not always be available. In another example, Ref. [11] presented a deep learning-based approach for fault detection, classification, and location in microgrids, achieving a high accuracy even under conditions of signal noise, load variation, and fault impedance. However, the study does not address operational scenarios involving on-grid/off-grid transitions or dynamic topology changes.
Other studies have proposed strategies to enhance fault detection in microgrids and ADNs using machine learning (ML) techniques. For instance, Refs. [16,17] achieved detection accuracies exceeding 96% under complex scenarios, including topology changes, DER connection/disconnection, and load variations. Nevertheless, these approaches often depend on prior event processing and feature selection, which may limit their adaptability. In [18], a method for fast fault detection and location in DC microgrids was proposed, demonstrating improved selectivity by deploying measurement devices at both ends of the line. Despite its advantages, this method does not consider the variability introduced by DER integration or microgrid connection modes.
Deep learning techniques have further contributed to advancing fault detection. For example, Ref. [19] developed a robust scheme for detecting high-impedance faults in hybrid microgrids using Long Short-Term Memory (LSTM) networks. While effective under diverse conditions, its reliance on communication infrastructure and distributed sensors poses limitations. Similarly, Ref. [20] combined the Hilbert–Huang Transform (HHT) with Deep Neural Networks (DNNs), achieving a high accuracy for scenarios involving topological changes and microgrid operation modes. However, it does not address DER-related operational conditions. Finally, Ref. [21] proposed an LSTM-based algorithm for detecting, classifying, and locating faults in microgrids, validated in real-time simulations with response times below 200 ms. Although promising, this approach does not fully account for critical aspects such as the microgrid connection status or generator dynamics.
Table 1 summarizes the key aspects addressed by these fault detection strategies, highlighting unresolved challenges that remain critical for the protection of modern power systems.

1.3. Paper Contributions

This research addresses critical operational challenges in Smart City Distribution Networks (SCDNs), particularly those stemming from the integration of distributed energy resources and microgrid operation modes. By leveraging advanced Long Short-Term Memory (LSTM) networks, the proposed methodology introduces innovative solutions to enhance fault detection in modern power systems. The contributions of this paper are outlined as follows:
  • Comprehensive consideration of operational scenarios: the proposed fault detection strategy explicitly accounts for key operational conditions, including topology changes, DER connection/disconnection, and MG operation modes (on-grid and off-grid), which are critical for the reliable operation of modern power systems;
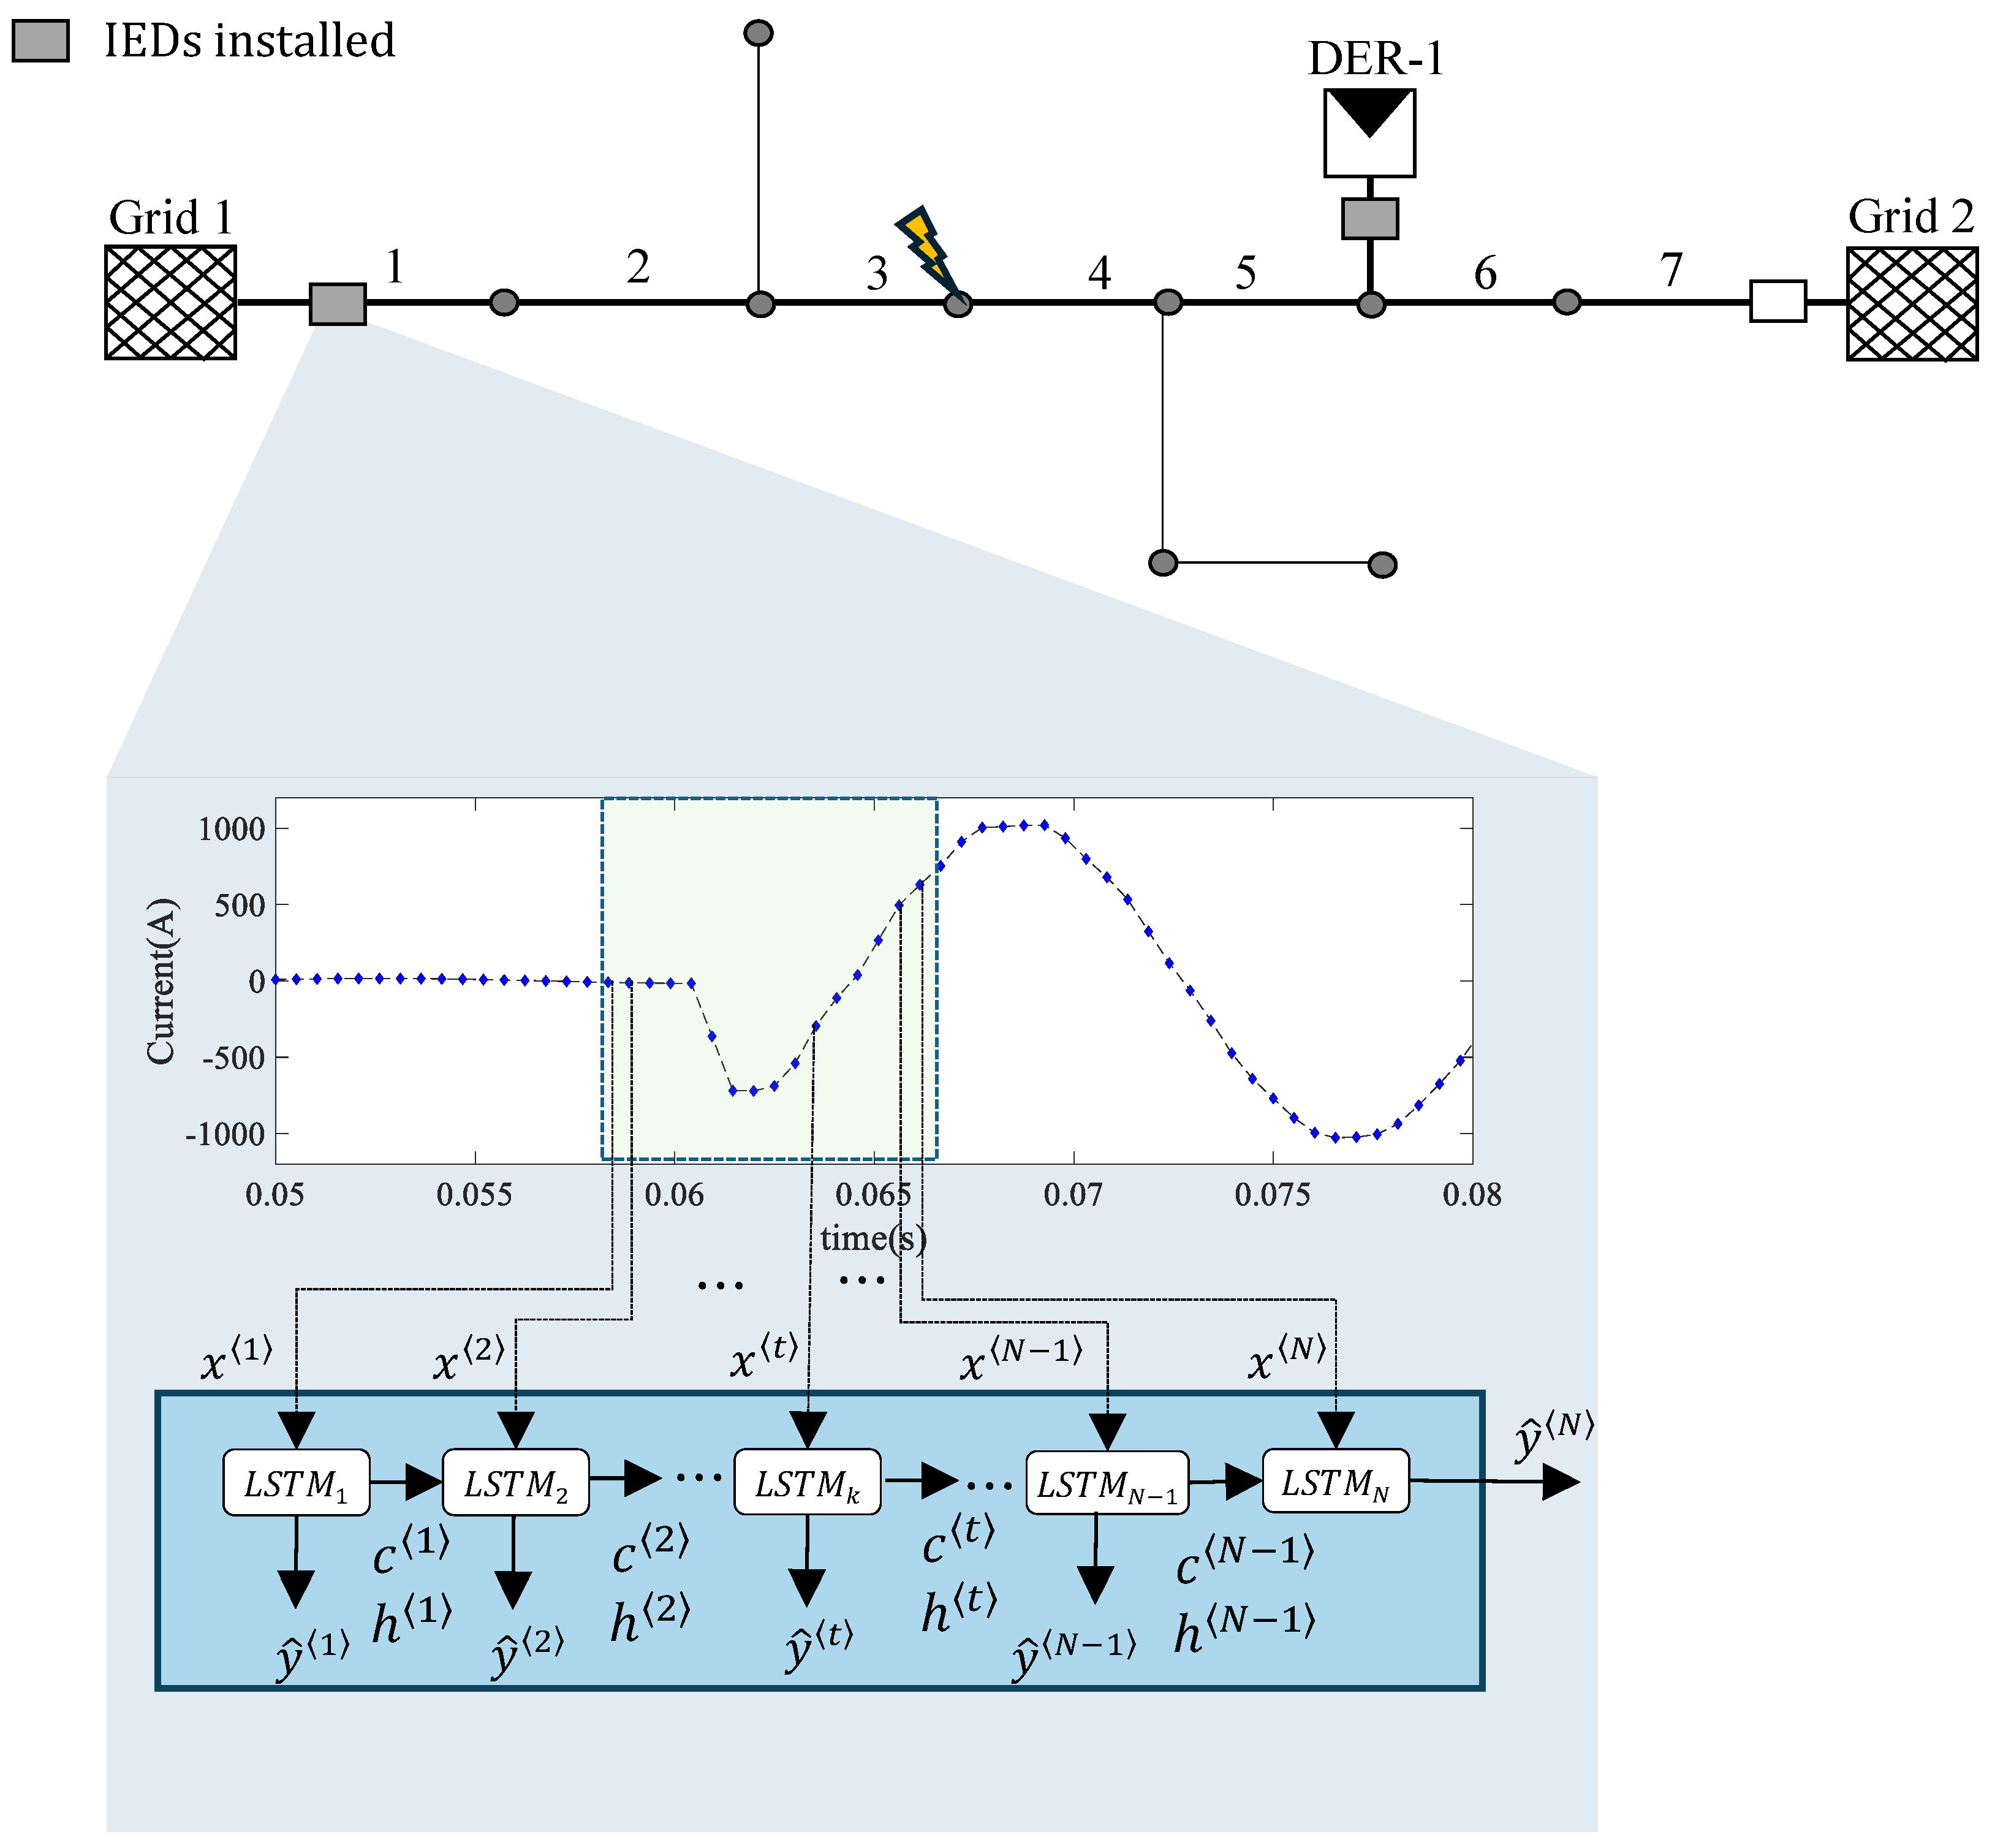
  • Elimination of communication dependencies: by relying solely on instantaneous current measurements obtained locally by intelligent electronic devices (IEDs), the methodology removes the need for communication infrastructure and synchronization processes, thereby simplifying deployment and enhancing reliability;
  • Automation of feature extraction: unlike conventional approaches, the use of LSTM networks enables automatic identification and optimization of the most relevant features for fault detection, bypassing labor-intensive preprocessing and feature engineering stages;
  • Improved reliability-time trade-off: the strategy provides a robust balance between detection accuracy and response time, ensuring rapid and reliable fault identification tailored to the dynamic nature of SCDNs.
By addressing these challenges, the proposed approach not only enhances the protection of modern power systems but also aligns with the increasing demands for efficiency, scalability, and resilience in the context of smart cities.

1.4. Paper Organization

The remainder of this paper is structured as follows: Section 2 provides the theoretical foundation for the LSTM-based fault detection strategy, detailing the key principles and motivations behind its design. Following this, Section 3 describes the proposed detection strategy in depth, highlighting its practical implementation and addressing critical considerations for Smart City Distribution Networks (SCDNs).
To demonstrate the effectiveness of the proposed method, Section 4 presents a detailed case study. This includes the setup, parameters, and scenarios evaluated to validate the approach under realistic operating conditions. The results and their implications are analyzed in Section 5, providing a comprehensive discussion of the method’s performance in addressing the challenges identified earlier.
Finally, Section 6 summarizes the main findings of the study and outlines potential directions for future research, aiming to further enhance fault detection in modern power systems.

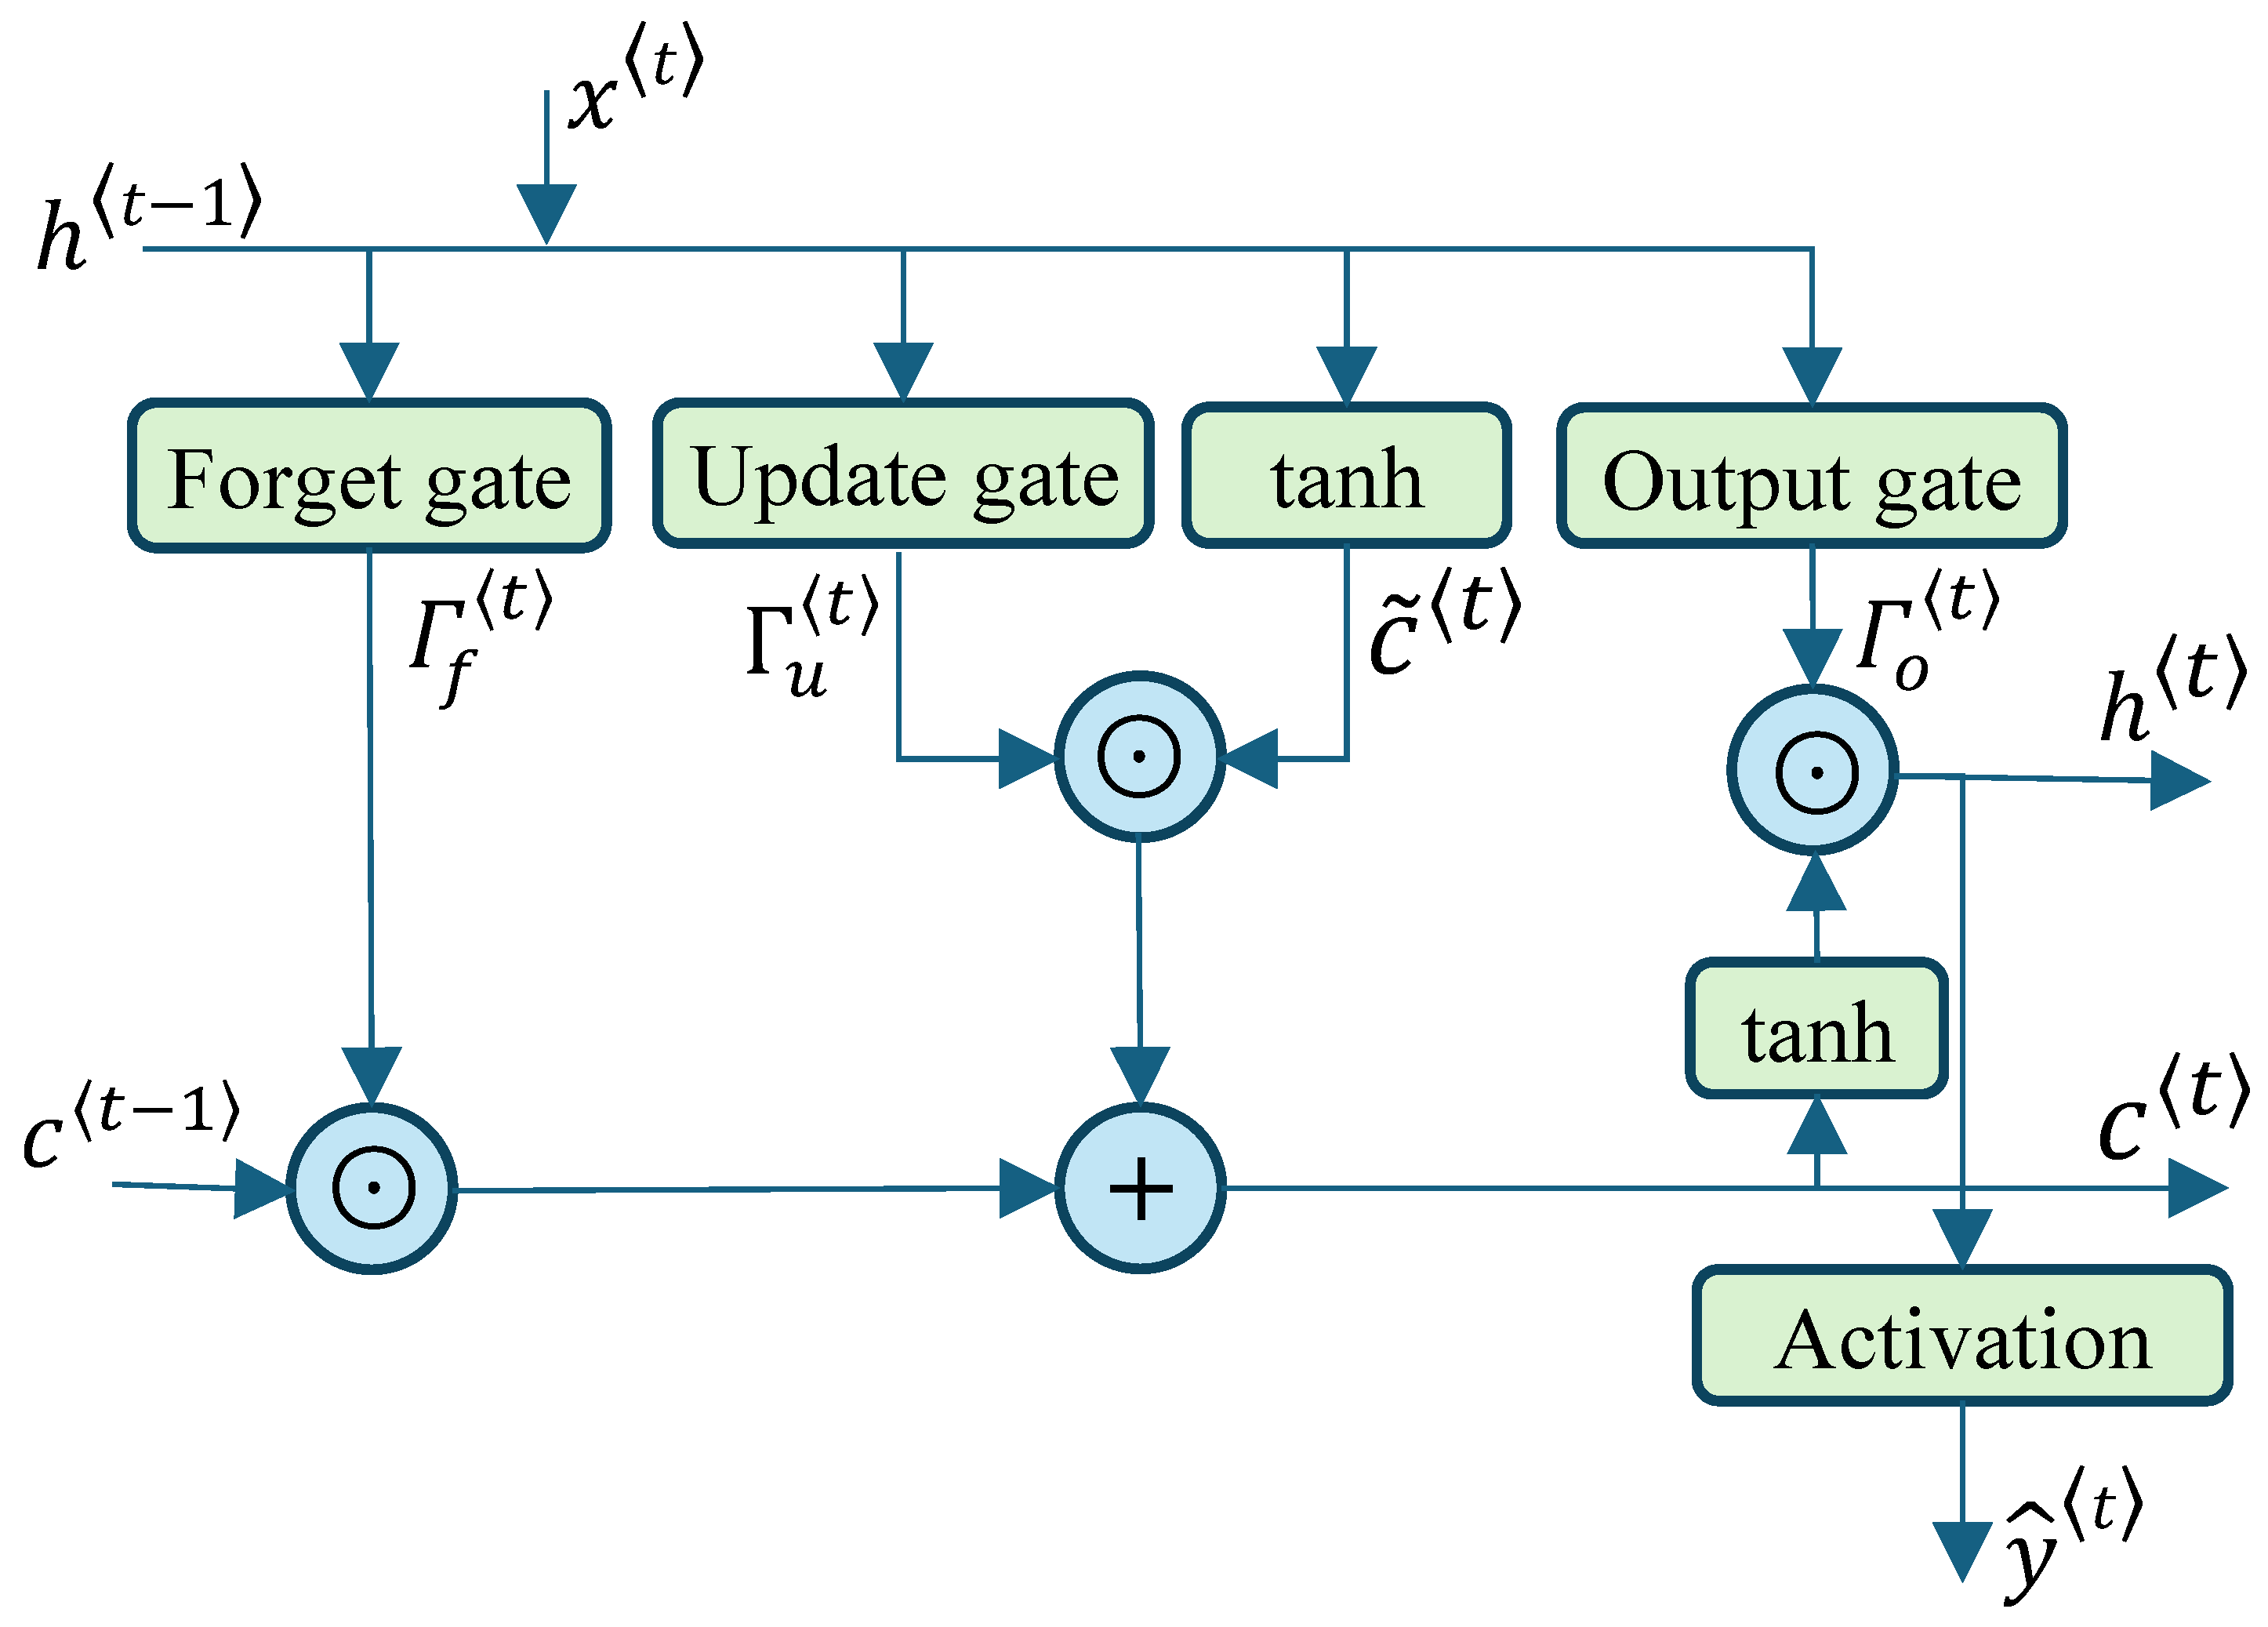
2. Long Short-Term Memory-Based Fault Detection Formulation

Long Short-Term Memory (LSTM) networks represent one of the most robust deep learning techniques, particularly suitable for sequential data analysis, such as processing time-series signals of voltage and current to identify fault events. Their primary advantages include the following:
  • Automatic feature discovery: LSTM networks autonomously identify higher-level features that maximize their performance without requiring human intervention [23];
  • Long-term temporal dependency capture: LSTMs excel in retaining information over extended sequences, thanks to their memory mechanisms.
The architecture of an LSTM network, depicted in Figure 1, consists of a memory cell and three types of gates: input, forget, and output. These components collectively regulate the flow of information, enabling the network to remember or forget specific temporal states and produce outputs based on relevant patterns [24].
Each gate in the LSTM network serves a distinct function:
  • The input gate ( Γ u t ) determines which new information should be added to the memory cell’s state;
  • The forget gate ( Γ f t ) controls which information from the previous memory state should be retained or discarded;
  • The output gate ( Γ o t ) decides which part of the cell state contributes to the output y h t after passing through an activation function.
These mechanisms are mathematically defined by Equations (1)–(6), which describe the state updates and output computations within the LSTM network:
c ˜ t = tanh W c [ a t 1 , x t ] + b c ,
Γ u t = σ W u [ a t 1 , x t ] + b u ,
Γ f t = σ W f [ a t 1 , x t ] + b f ,
Γ o t = σ W o [ a t 1 , x t ] + b o ,
c t = Γ u c ˜ t + Γ f c t 1 ,
a t = Γ o tanh c t .
For fault detection in Smart City Distribution Networks (SCDNs), the LSTM model is hosted and executed on intelligent electronic devices (IEDs). These IEDs, as defined in [25], are devices equipped with processors capable of receiving, processing, and transmitting data or control signals. Figure 2 illustrates an architecture in which multiple LSTM models, hosted on different IEDs, process phase-wise current signals to detect and classify faults.
To ensure robust fault detection, the proposed strategy utilizes a sliding window of N samples, processed sequentially through N interconnected LSTM models. Information from the memory ( c t ) and hidden state ( h t ) of each LSTM is propagated to the next, enabling the network to capture long-term dependencies. The final decision regarding fault or normal operation is made by the output of the last LSTM model, which incorporates the full context of the analyzed sequence.
The fault detection problem is formulated as a binary classification task for each IED. The LSTM model outputs y ^ N , where:
y ^ N = 0 if the event is classified as non-fault , 1 if the event is classified as fault .
This architecture leverages the advantages of LSTM networks to provide accurate, reliable fault detection, addressing the challenges of dynamic operational scenarios in SCDNs.

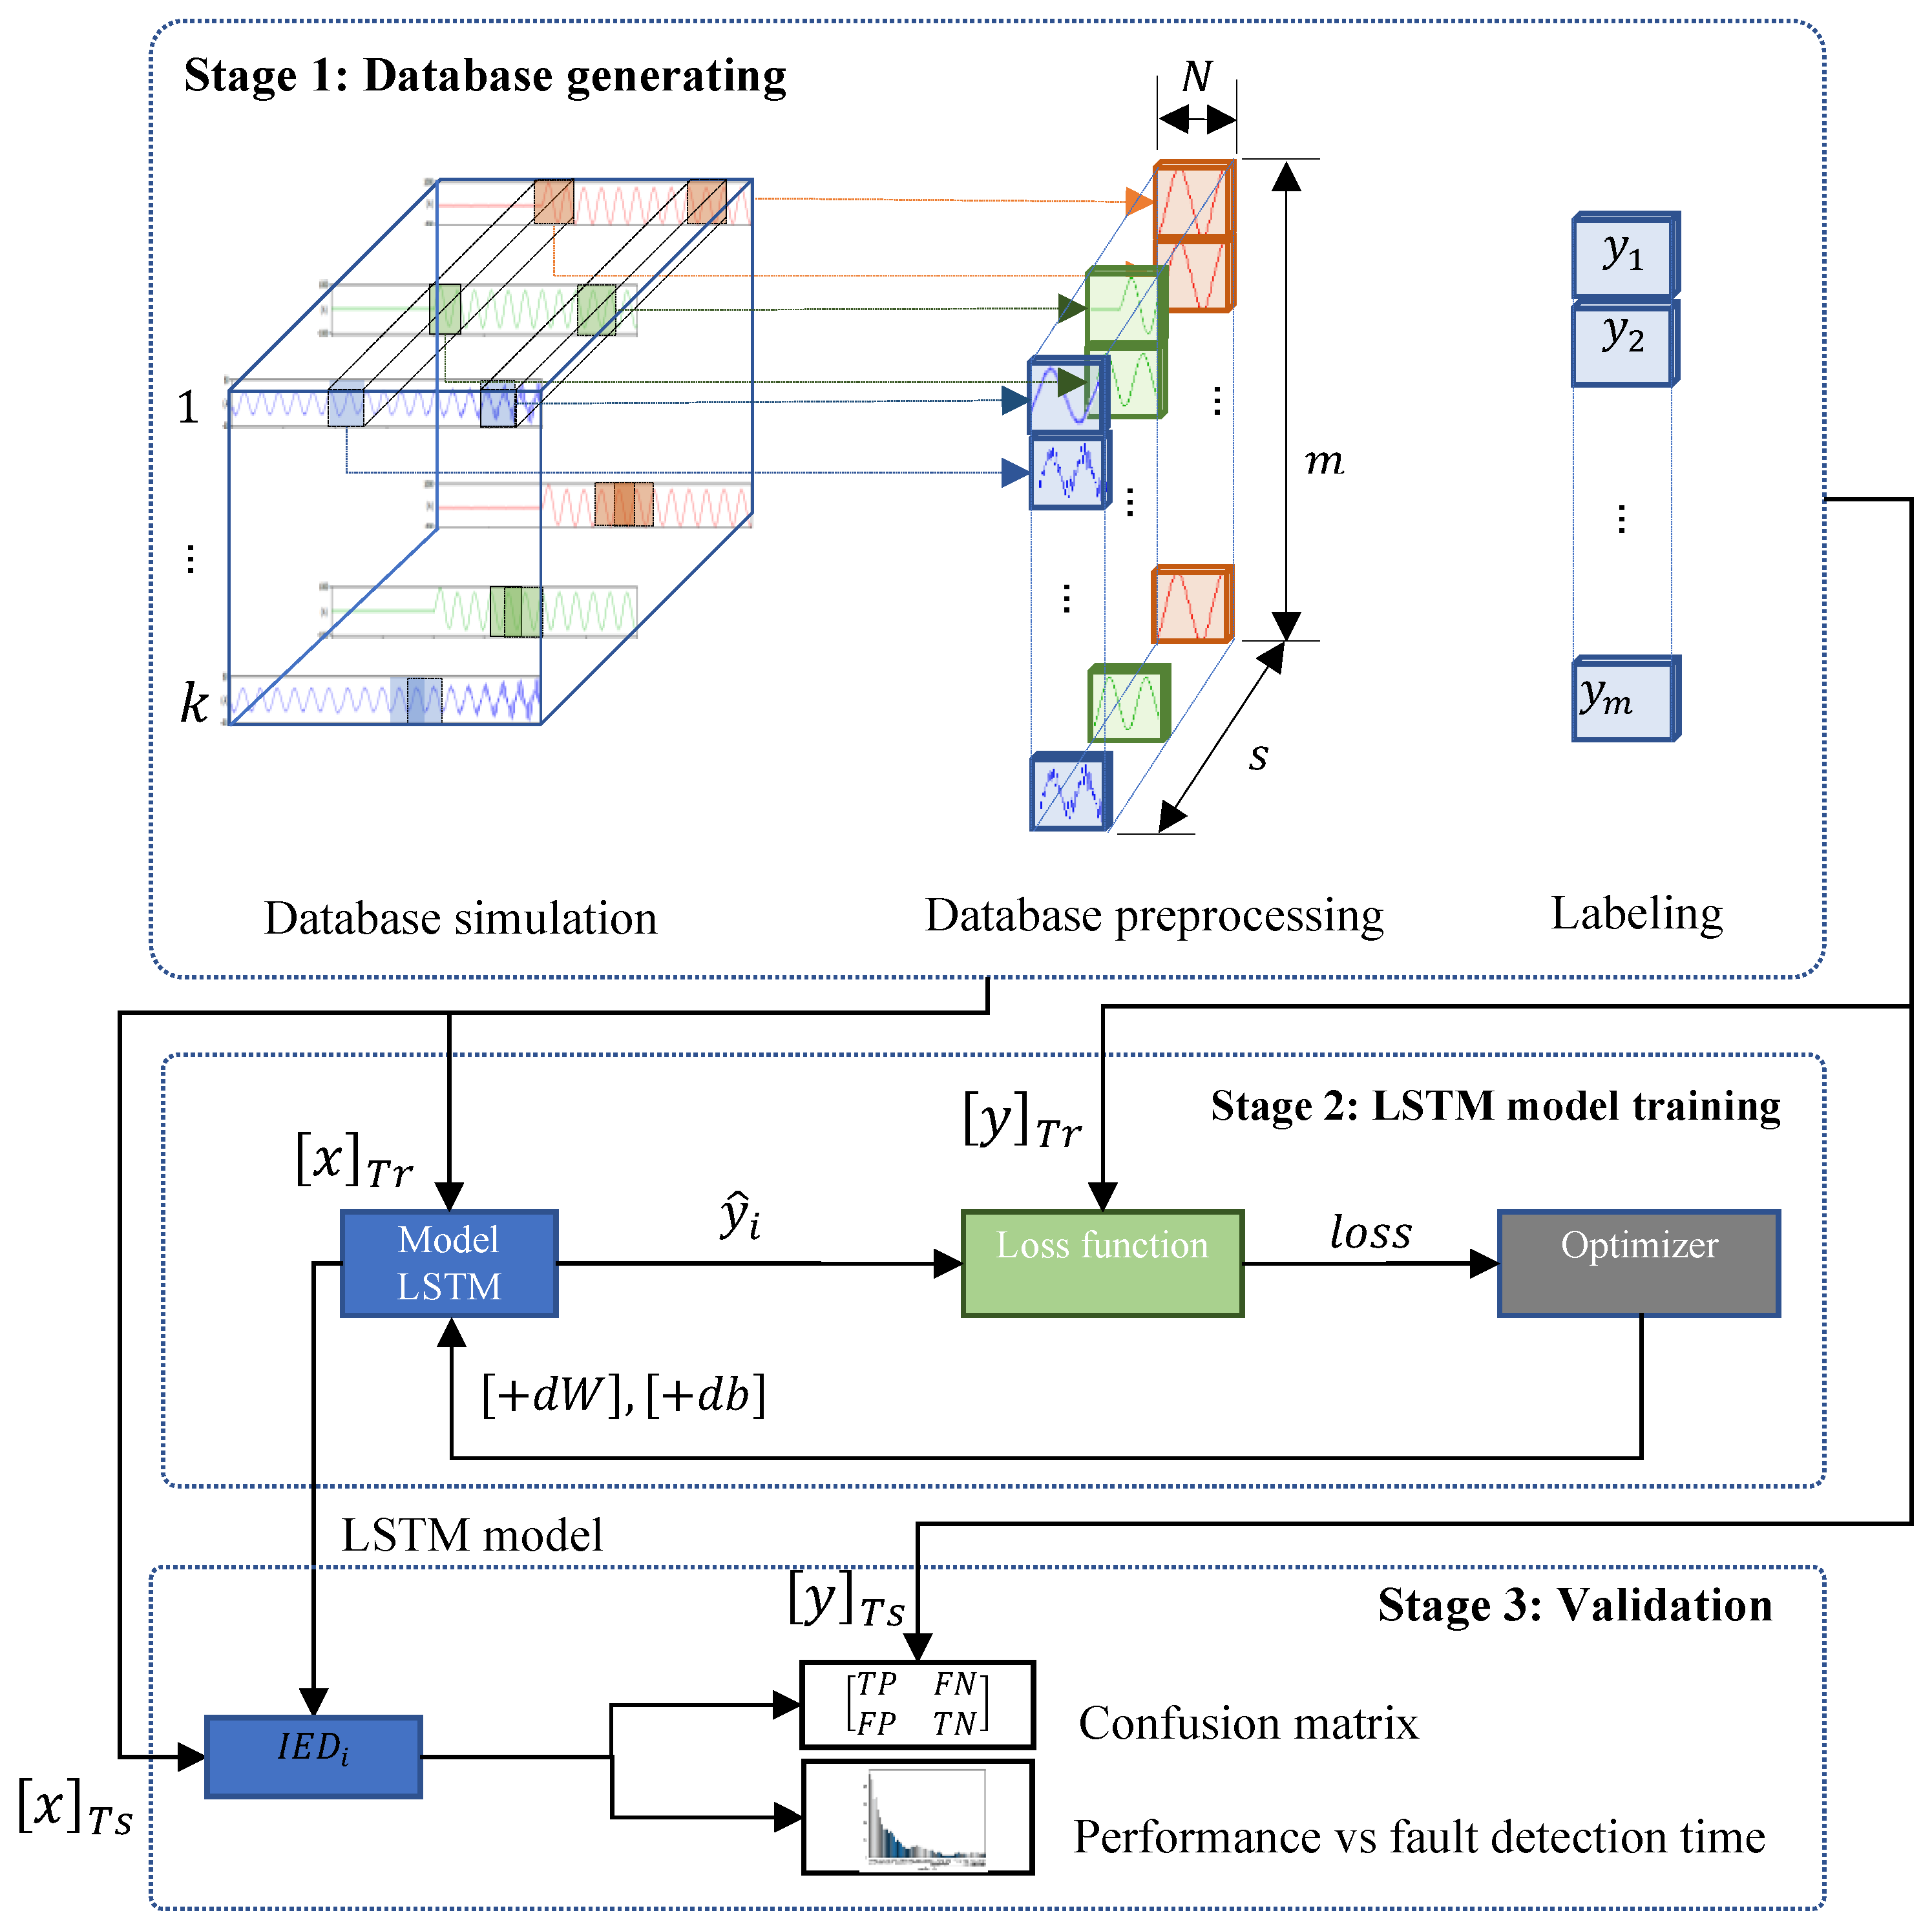
3. Long Short-Term Memory-Based Fault Detection Strategy

Developing an accurate LSTM-based fault detector requires a database of fault and non-fault scenarios that reflect the diverse operating conditions of the ADN. While LSTM models can autonomously identify higher-level features that enhance their performance, these models must first be trained with representative examples to achieve reliability and precision. To address this need, we propose a three-stage strategy tailored to train LSTM models for fault detection at each intelligent electronic device (IED) deployed in the network.
The proposed strategy, illustrated in Figure 3, encompasses database generation, model training, and validation. This methodology ensures that the LSTM models are capable of adapting to the complexity and dynamic nature of modern distribution networks. Section 3.1, Section 3.2 and Section 3.3 provide a detailed explanation of each stage in the process.

3.1. Database Generation

The database generation process is divided into three main steps: database simulation, minibatch creation, and labeling. Each of these steps is crucial to ensure that the LSTM models are trained with representative data, enabling them to effectively detect faults in the ADN.
In the first step, k events are simulated using an Electro-Magnetic Transients Program (EMTP-ATP) tool. This tool employs a cooperative approach where EMTP-ATP acts as the slave software while Python serves as the master software. Python executes a predefined list of normal and fault operating conditions and collects the resulting voltage and current signals from the network buses. The collected data are then processed and organized to meet the requirements of the applied machine learning technique. However, the tool has certain limitations, including the time step and simulation duration, which are proportional to the number of scenarios simulated. Additionally, the tool lacks the ability to incorporate uncertainties in the models of loads and generation.
The simulated events are classified into two types: non-fault and fault. Non-fault events represent variations in the ADN’s normal operating condition due to factors such as load variations, DER connection/disconnection, and topological changes. On the other hand, fault events are caused by single-phase faults, double-phase faults, double-phase-to-ground faults, and three-phase faults under various operating scenarios. The factors influencing these events include fault type, fault resistance, and fault location. Table 2 summarizes the factors and levels considered in the simulation process [17].
In the second step, the dataset is divided into minibatches of dimension ( m , N , s ) to optimize the training process. Here, N represents the number of samples per window, m denotes the number of windows per batch, and s corresponds to the recorded current signals. These windows are extracted from each simulated event, capturing one cycle at 60 Hz and ensuring a sampling frequency of 3840 Hz. The resulting dataset has a dimension of ( k , N , s ) , as depicted in Stage 1 of Figure 3.
The third step involves labeling the extracted data. Each set of m windows is assigned a label indicating whether it corresponds to a fault (1) or non-fault (0) event. The labeled dataset is then divided into training and test subsets, [ x ] T r with [ y ] T r labels and [ x ] T s with [ y ] T s labels, respectively. A common practice is to allocate 80% of the dataset for training and 20% for validation [26].

3.2. LSTM Model Training

The Long Short-Term Memory (LSTM) model comprises an LSTM cell block, a fully connected layer, and a sigmoid activation function. Each LSTM block contains t cells, where t corresponds to the number of samples in a given window. Among these cells, only the hidden state of the 64th LSTM cell is propagated to the subsequent layers. The sigmoid activation function is employed due to the binary classification nature of the fault detection task. Mathematically, the sigmoid function is defined as follows [27]:
σ ( x ) = 1 1 + e x .
During training, the model calculates the Binary Cross Entropy (BCE) loss, which measures the difference between the predicted output, y ^ , and the true label, y. The BCE loss function is given by [28]:
B C E = 1 m i = 1 m y i · log ( y ^ i ) + ( 1 y i ) · log ( 1 y ^ i ) ,
where m represents the number of samples in each minibatch, y is the true label (either 0 or 1), and y ^ is the predicted probability, which ranges between 0 and 1.
The calculated loss is passed to an Adam optimizer, which computes the gradients [ d W , d b ] and updates the weight and bias matrices [ W ] and [ b ] [29]. These updates are performed iteratively across the entire dataset. A single iteration through the entire dataset, including forward passes, loss calculations, and weight updates, constitutes an epoch. The model was trained for one epoch, leveraging the fast convergence of weights for a dataset containing 5600 windows.
Labels in this fault detection system are mutually exclusive. During inference, a label of 1 indicates a faulted state, whereas 0 signifies a non-faulted state. The labels are stored as a vector of dimension ( m , 1 ) , where m is the minibatch size. For instance, a label vector might look like [ 1 , 0 , 1 , 0 , ] , representing the fault or non-fault condition for each sample.
However, the Binary Cross Entropy calculation requires continuous outputs from the model rather than binary labels. During training, the output y ^ t is used directly. After completing an epoch, the model undergoes a validation process using a test dataset to evaluate its performance. To assess binary classification metrics, the continuous outputs are rounded to binary values using the sigmoid function defined in Equation (7).
For this validation, y ^ t is rounded to either 0 or 1 using the sigmoid function, enabling a meaningful evaluation of the detector. The complete process, including the backpropagation loop, is depicted in Figure 4, which also represents the finalized fault detection model.

3.3. Fault Detector Validation
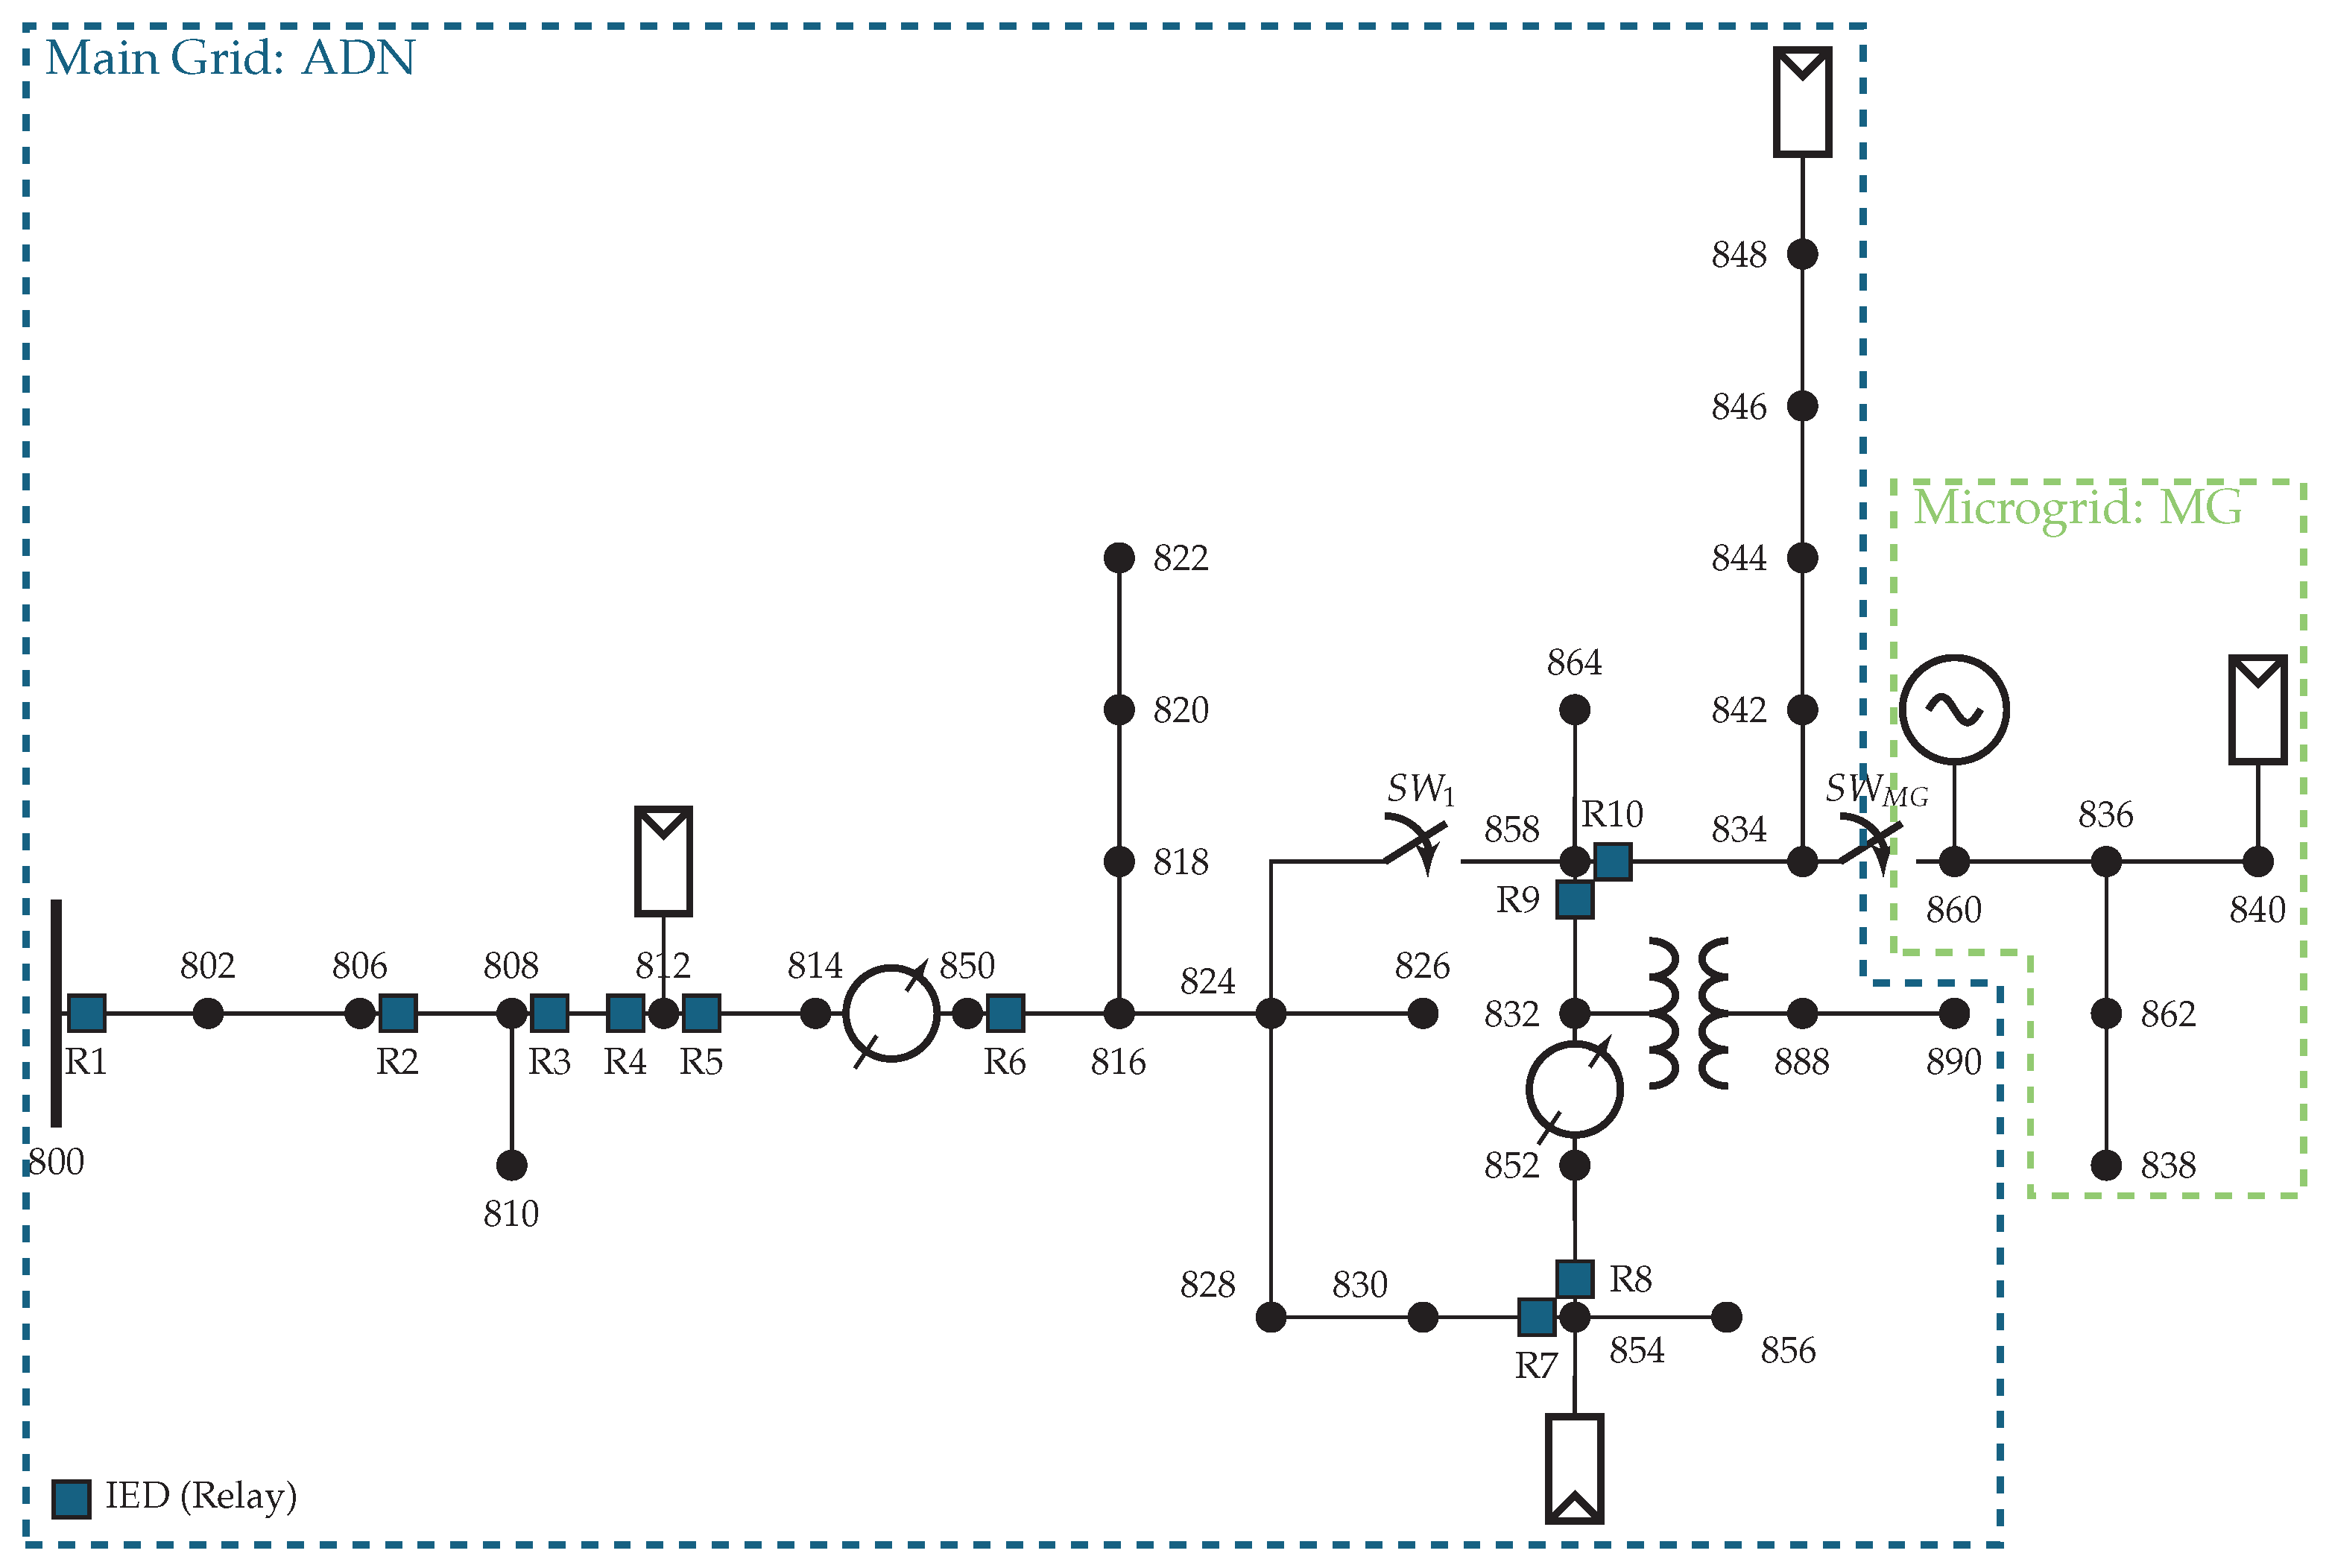
The performance of the fault detector is evaluated in terms of two key metrics: operational speed and reliability. Operational speed is assessed by measuring the number of windows the LSTM detector must process before correctly predicting a fault condition. Reliability, on the other hand, assesses the ability of the detector to correctly classify fault and non-fault events. This includes addressing two potential failure modes of relaying systems: failing to operate when necessary or operating erroneously when not required.
A reliable relaying system must balance two attributes: dependability and safety [30]. According to [31], dependability refers to the certainty that the relay will operate correctly for all fault events within its design scope. Safety, conversely, measures the certainty that the relay will not operate incorrectly during non-fault conditions or for faults outside its intended coverage. It is important to note that improving dependability often comes at the cost of reduced safety.
A quantitative evaluation of these metrics is achieved using a confusion matrix, as shown in Table 3. This matrix categorizes predictions into true positives (TP), false positives (FP), false negatives (FN), and true negatives (TN). True Positives correspond to fault events correctly identified as such, while False Positives represent non-fault events mistakenly classified as faults. Similarly, false negatives occur when faults are not detected, and true negatives represent correct identification of non-fault conditions.
From the confusion matrix, three key performance indicators are derived: accuracy, dependability, and safety. These are mathematically defined as follows:
Accuracy = T P + T N T P + T N + F P + F N ,
Dependability ( TPR ) = T P T P + F N ,
Safety ( TNR ) = T N T N + F P .
During the validation phase, the LSTM model, trained using the Binary Cross Entropy (BCE) loss function, is evaluated on a test dataset. The model produces continuous outputs in the range [0,1], which must be rounded to binary values (0 for non-fault, 1 for fault) to compute the classification metrics. This process ensures an accurate performance assessment of the detector.
A key distinction must be made between evaluating the model at the window level versus the event level. Each event is composed of multiple windows, and evaluating at the window level might obscure significant performance issues at the event level. For instance, a model that produces 10 false positive windows across 10 non-fault events might appear to have a 90% accuracy at the window level. However, this would translate to a 0% accuracy at the event level if each false positive corresponds to a separate event.
Therefore, the validation process accounts for the collective behavior of all windows within each event, providing a comprehensive and meaningful evaluation of the detector’s reliability and operational accuracy.

4. Case Study

The proposed fault detection strategy was validated using a modified IEEE 34-node test feeder operating at a nominal voltage of 24.9 kV [32]. This feeder was selected due to its suitability for simulating real-world operational conditions, characterized by its imbalanced nature and the inclusion of single-phase, two-phase, and three-phase laterals.
To enhance its capabilities, several modifications were applied to the test feeder. These included adding two circuit breakers to simulate topology changes and one circuit breaker to integrate a microgrid (MG) into the Active Distribution Network (ADN). Additionally, five distributed energy resources (DERs) were integrated throughout the network: one synchronous generator-based DER and four converter-integrated DERs (PV systems). The network simulation was conducted using the EMTP-ATP software, selected for its flexibility in developing new components and its low computational cost [33]. The converter-integrated DERs were modeled according to the specifications presented in [34]. The parameters of the DERs are summarized in Table 4.
The proposed strategy was validated by training 10 LSTM models as fault detectors, which were integrated into the 10 IEDs installed in the ADN. Figure 5 illustrates the modified network, including the placement of IEDs and DERs.
In this study, the fault type, fault resistance (ranging from 0 to 50 Ω ), and fault location were considered as factors for simulating fault events. Normal operating conditions (no faults) were modeled using three load levels: high (120–90%), medium (90–60%), and low (60–30%). Each load value could vary by ± 5 % from its initial value, following a skewed normal distribution. A total of 8778 fault events and 8778 non-fault events were simulated, as shown in Table 5. For each event, current signals were recorded at each IED with a sampling frequency of 3840 Hz. Additionally, a set of 62 windows, each containing 64 samples (equivalent to one cycle at 60 Hz), was extracted from each event. For training the LSTM models, 5000 events were randomly selected, while 3000 different events were used for validation, ensuring no overlap with the training data.

5. Results and Discussion

5.1. Confusion Matrix Analysis

The performance of the proposed fault detection strategy is summarized through confusion matrices, as shown in Table 6, Table 7, Table 8 and Table 9. These matrices evaluate the models for each relay (R1 to R10) based on 3000 simulated events at an event level, with 62 windows per event.
The results indicate that relay R1 successfully detected all evaluated fault scenarios (1452) and normal operation scenarios (1548). This performance is summarized in Table 10, where the values for accuracy, dependability, and safety indicators are presented. The model for relay R1 demonstrated perfect accuracy, dependability, and safety. On the other hand, relays R2 to R10 encountered challenges in detecting fault scenarios. For instance, R2 missed 10 fault events, R3 missed 7, and R9 and R10 missed 52 and 58 events, respectively. Despite these challenges, all relays maintained a safety level of 100%, meaning no false positives were recorded. The details of these results are further summarized in Table 10.

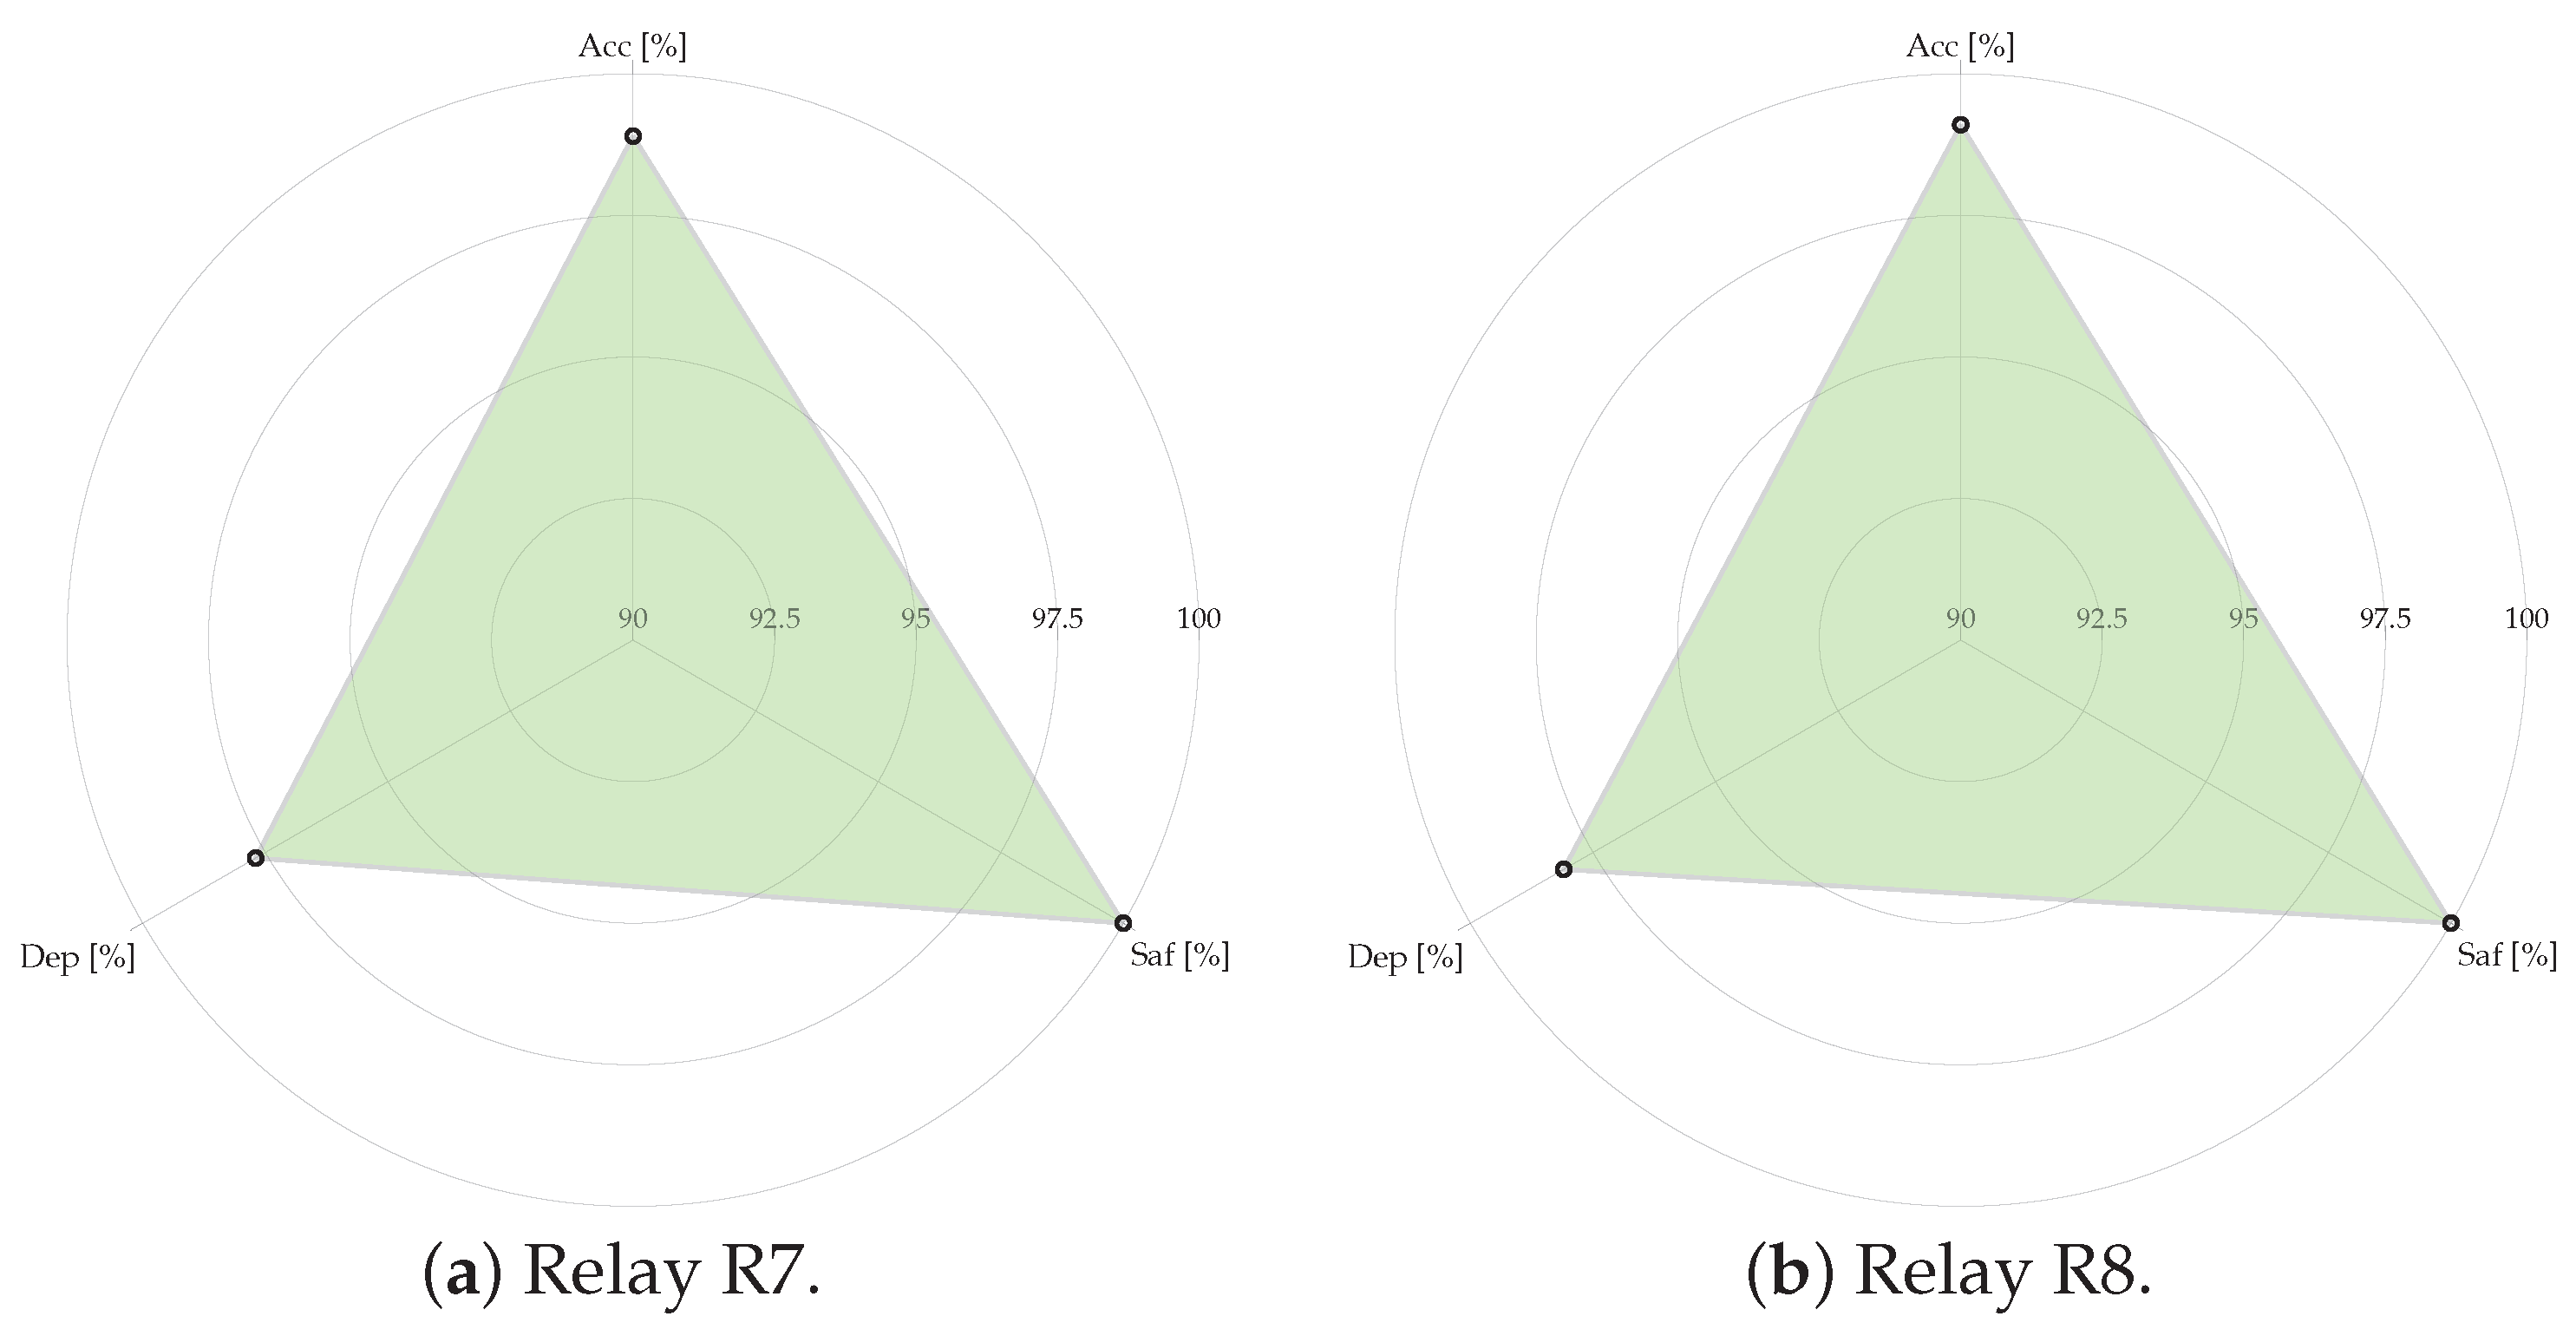
5.2. Performance Metric Analysis

The indicators of accuracy, dependability, and safety for each relay, defined in Equations (9)–(11), are summarized in Table 10. These metrics provide a quantitative evaluation of the fault detection strategy.
To complement these numerical results, Figure 6, Figure 7, Figure 8, Figure 9 and Figure 10 present radar plots that visualize the performance indicators for each relay. These plots offer an intuitive representation of the strengths and weaknesses of the LSTM models:
  • Figure 6 shows that relay R1 achieved perfect scores across all metrics, while R2 demonstrated strong performance with minor reductions in dependability;
  • Figure 7 and Figure 8 highlight the consistent performance of relays R3 to R6, with high accuracy and safety, albeit with slight reductions in dependability;
  • Figure 9 and Figure 10 reveal the challenges faced by relays R7 to R10, particularly R9 and R10, which exhibited the lowest dependability values due to missed fault detections.
These radar plots emphasize the trade-offs inherent in the fault detection strategy. While R1 excels in all metrics, the variability in dependability for relays R9 and R10 highlights the impact of network complexity and fault scenarios on the detection models.

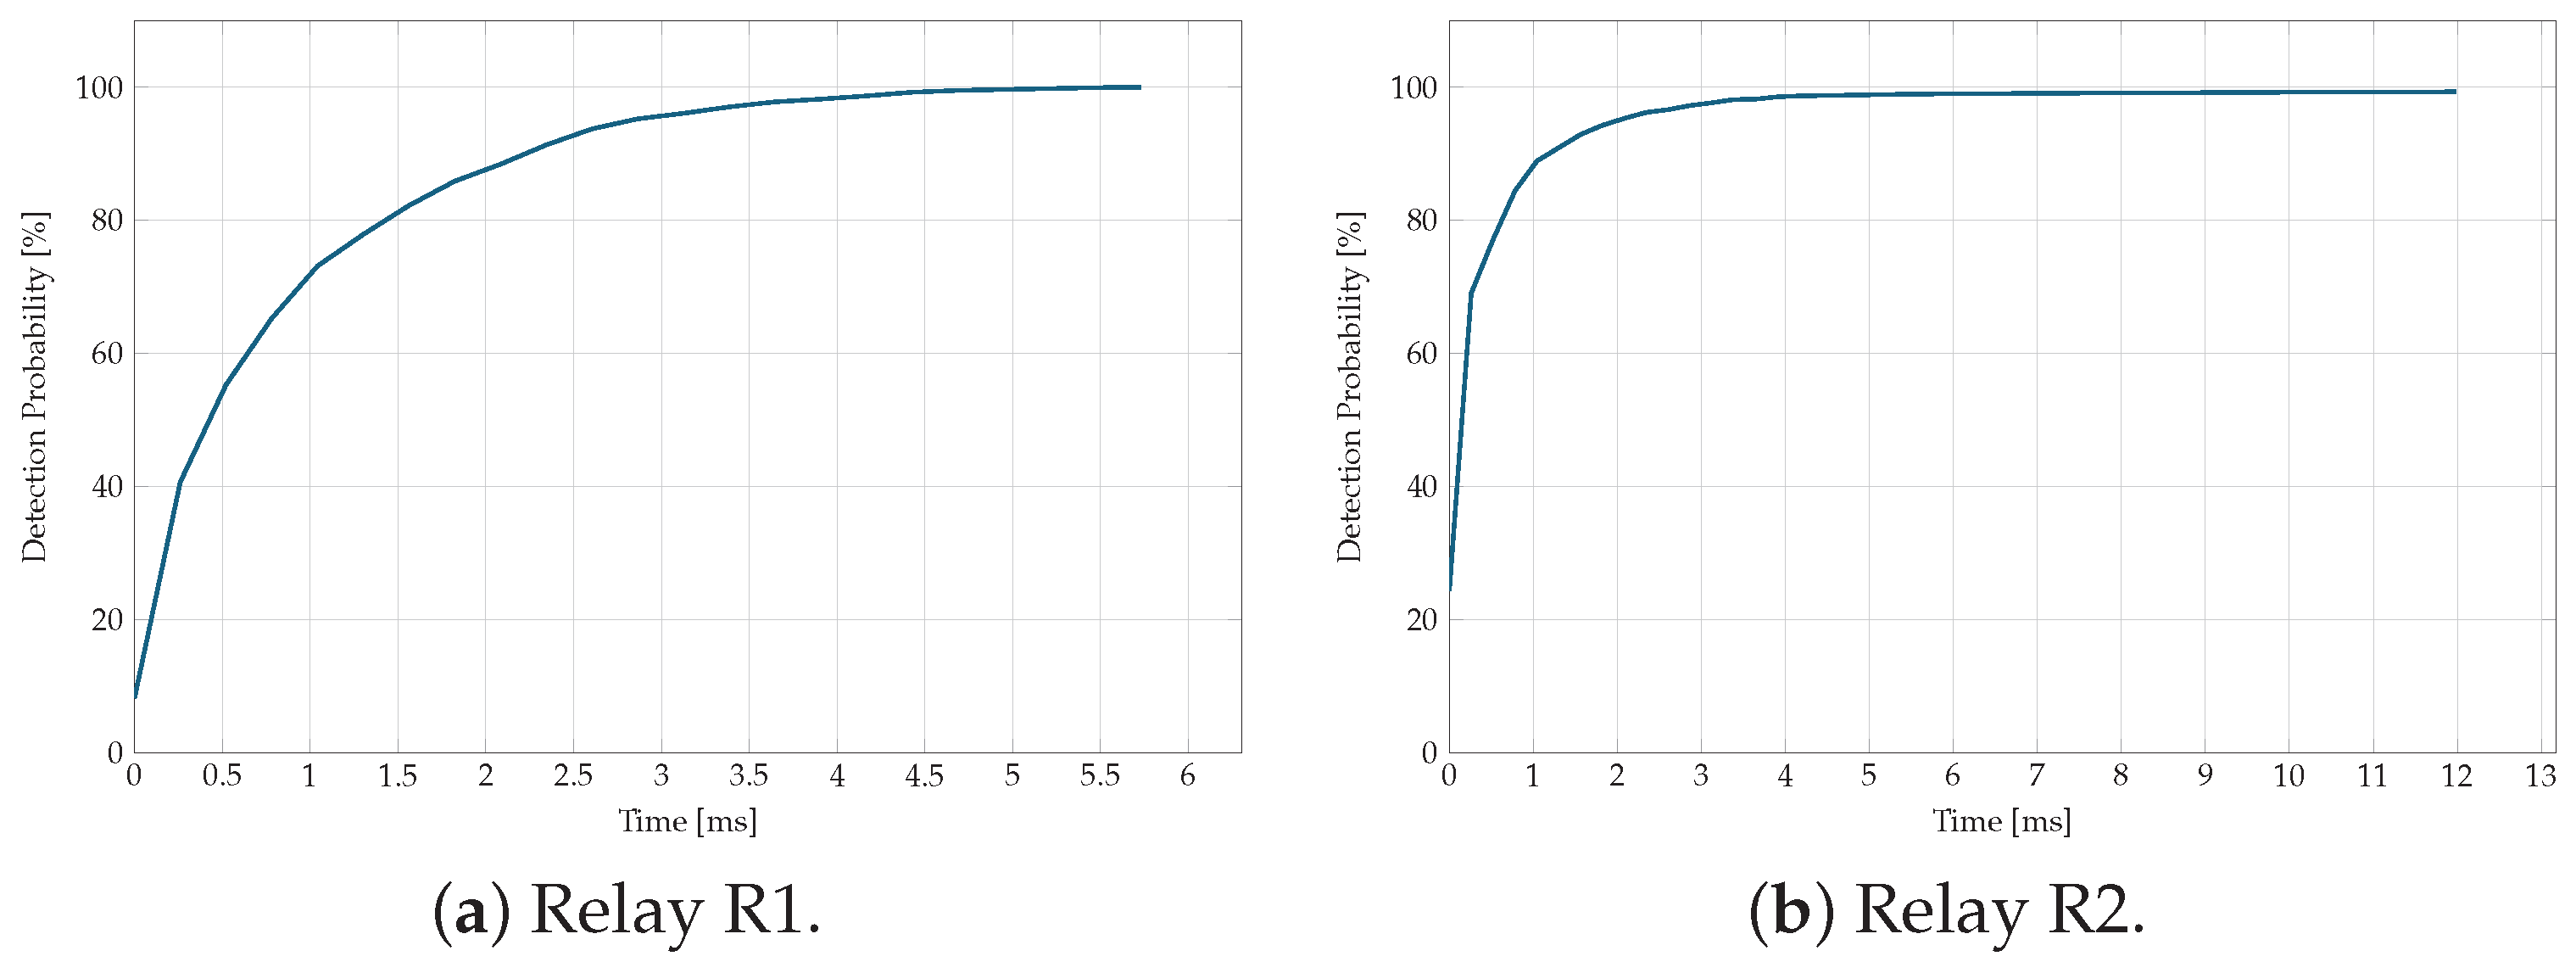
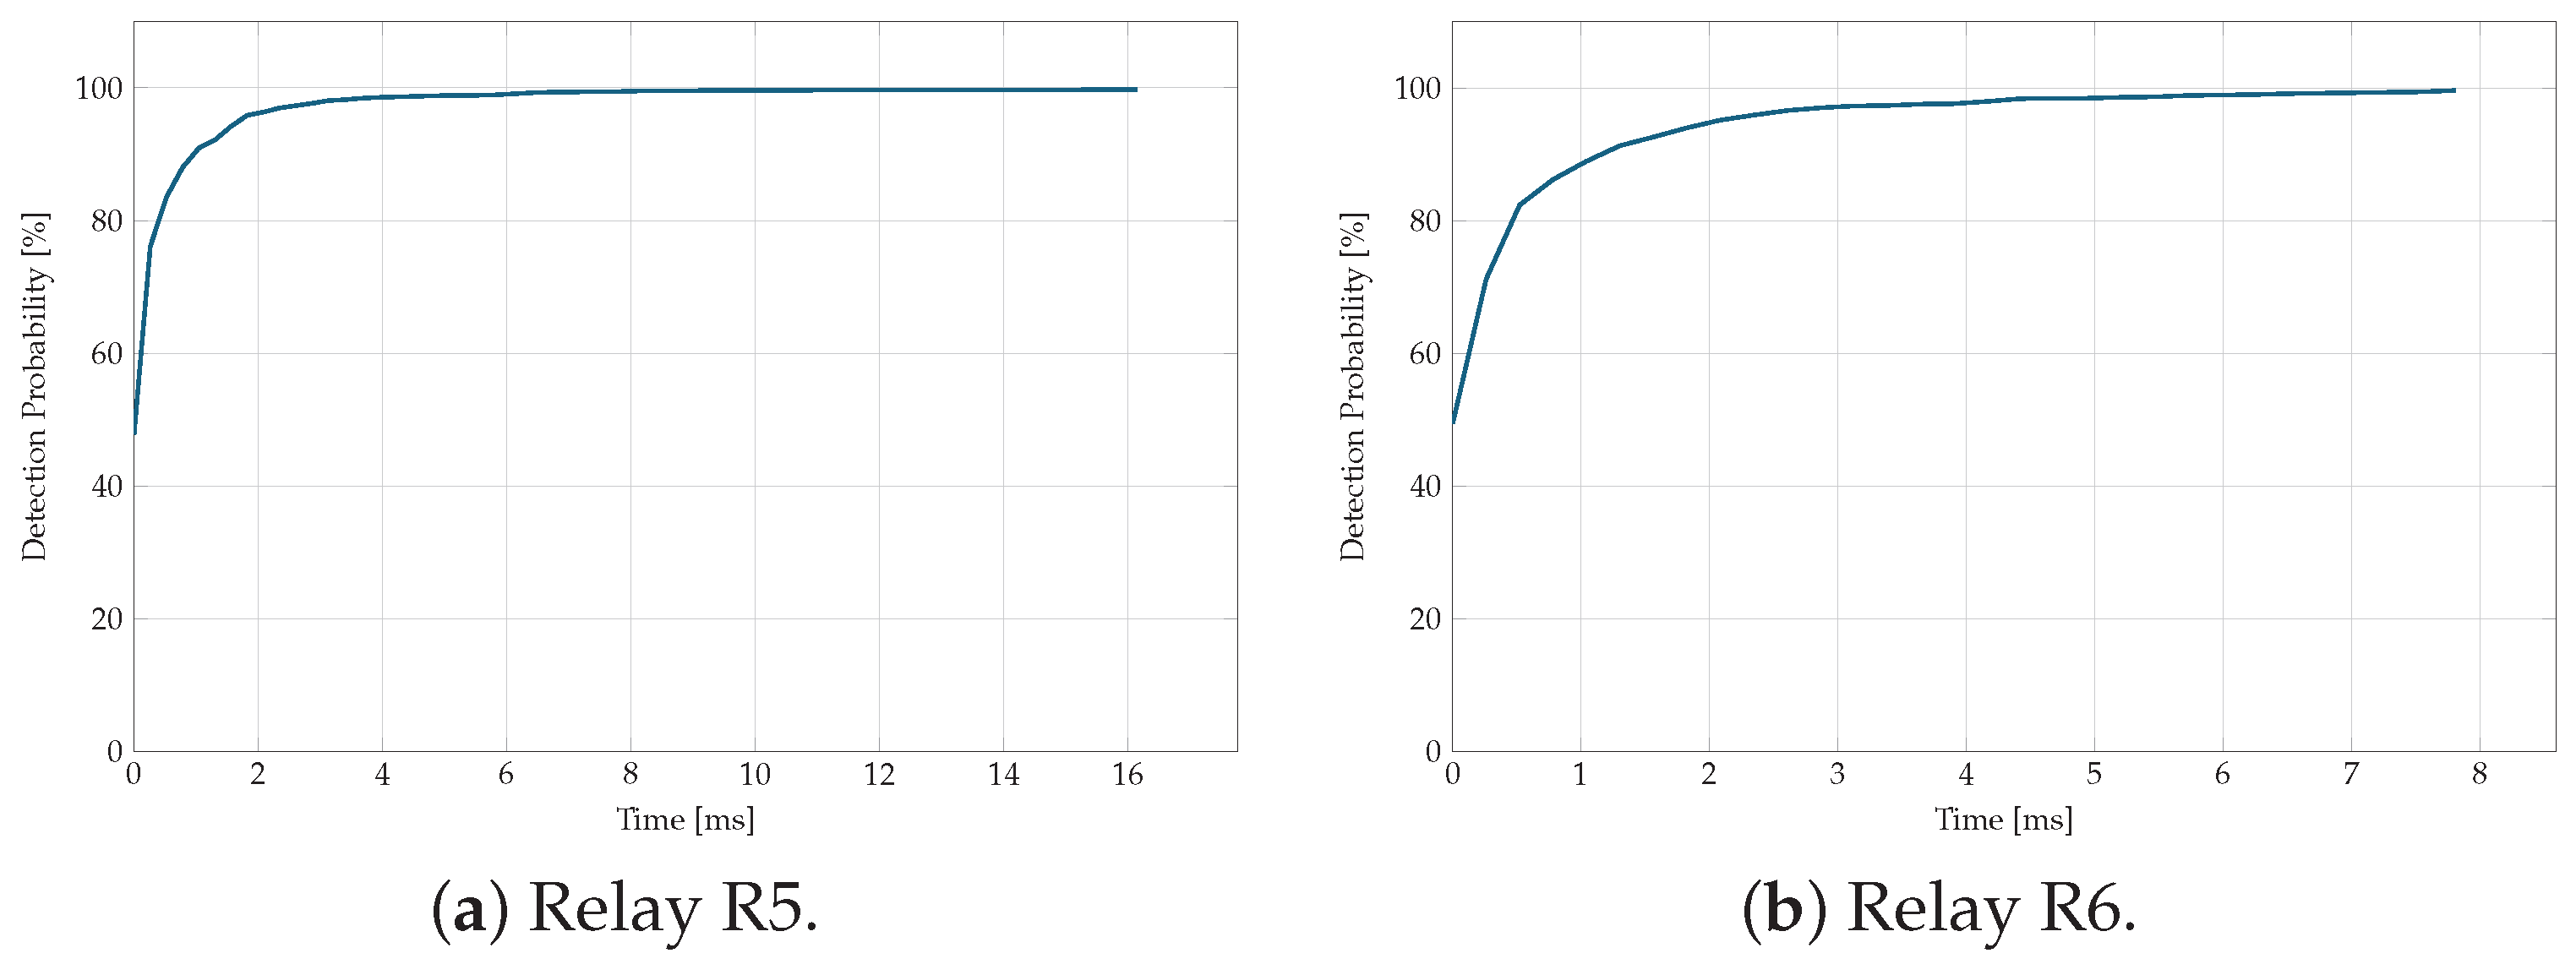
5.3. Detection Speed Analysis

An important aspect of the fault detection strategy is the speed at which the LSTM models identify fault events. Figure 11, Figure 12, Figure 13, Figure 14 and Figure 15 illustrate the detection probability as a function of detection speed for each relay.
The results indicate that, within 5 ms, the models for relays R1 to R8 successfully detected 100% of the fault events evaluated. This demonstrates the rapid fault detection capability of the strategy, requiring only 1/4 of a cycle to identify a fault event. This performance aligns with the indicators presented in Table 10, confirming that the model is both reliable and fast.
For relays R9 and R10, detection speeds were slightly slower. These models detected 96% of fault events within 16 ms, approximately one cycle after the fault occurrence. This slight delay reflects the complexity of the fault scenarios they were tasked with, highlighting the inherent trade-offs between speed and accuracy.

5.4. Discussion on Fault Detection Trade-Offs

The relationship between detection speed, accuracy, and dependability underscores the trade-offs inherent in the proposed strategy. Faster detection speeds reduce the risk of system instability by enabling prompt fault isolation; however, this can impact the selectivity of the protection system. Conversely, optimizing dependability might require additional detection time, particularly in complex fault scenarios. The radar plots and detection speed graphs provide a holistic view of the performance across relays. For example, while relays R1 to R8 achieved near-perfect detection speeds and metrics, R9 and R10 faced challenges due to their location within the network and the complexity of the events they encountered. These findings emphasize the importance of tailoring detection strategies to specific operational conditions and network configurations.

6. Conclusions, Limitations, and Perspectives

6.1. Summary and Key Contributions

This paper presents an LSTM-based fault detection strategy designed for Active Distribution Networks (ADNs) with smart capabilities. The strategy leverages local instantaneous current measurements, eliminating the need for voltage signals, synchronization processes, or communication systems for fault detection. By training LSTM models at the level of individual intelligent electronic devices (IEDs), the method enables decentralized and scalable fault detection. The proposed strategy was validated on a modified IEEE 34-node test feeder, which includes realistic operational features such as unbalanced conditions, microgrid integration, and various distributed energy resources (DERs). The fault detection models achieved high levels of accuracy, dependability, and safety. For example, relays R1 to R6 exhibited safety values of 100% and dependability levels above 99.5%, as shown in Table 10. Even for the more challenging cases, such as relays R9 and R10, the models achieved dependability levels of 96.4% and 96.0%, respectively. These results confirm the robustness and reliability of the proposed strategy under diverse fault and non-fault scenarios. A key observation from the study is the trade-off between detection speed and reliability. The models for IEDs R1 to R8 demonstrated the ability to detect 100% of fault events within 5 ms (1/4 of a 60 Hz cycle), highlighting their rapid fault detection capability. In contrast, IEDs R9 and R10 required up to 16 ms (approximately one cycle) to detect 96% of fault events, reflecting the inherent compromise between detection speed and dependability for certain relays. This trade-off underscores the importance of tailoring the detection strategy to the specific requirements of the network, balancing speed, safety, and dependability.

6.2. Limitations and Future Work

While the proposed method shows promising results, certain limitations must be acknowledged.
1.
Generality of trained models: the trained LSTM models are specific to the IEEE 34-node test feeder and its operational scenarios. Although fine-tuning could adapt these models to other networks, this requires further validation and testing in real-world ADNs;
2.
High-impedance faults (HIF): The training dataset did not include high-impedance faults. As a result, the performance of the proposed strategy under such conditions remains untested. Future work should incorporate HIF scenarios to assess and potentially improve the method’s robustness in these cases;
3.
Impact of model simplifications: The study assumed perfect and consistent signal acquisition at the IED level. Variations in real-world data quality, such as noise or signal distortion, may affect the detector’s performance. Further research should evaluate the strategy under such realistic conditions;
4.
Scalability to larger systems: the application of this strategy to larger or more complex networks, with higher levels of DER integration or increased fault diversity, needs to be investigated to confirm scalability.
In conclusion, the proposed LSTM-based fault detection strategy provides a robust and efficient tool for enhancing the reliability and resilience of ADNs. By eliminating the dependency on communication systems and voltage signals, the method simplifies implementation while maintaining a high detection accuracy and speed. Future research should focus on addressing the identified limitations, exploring additional fault scenarios, and validating the method in real-world systems to ensure its broader applicability.

Author Contributions

Conceptualization, C.O.-H.; methodology, C.O.-H. and A.H.; software, A.H.; validation, J.D.P.R., C.O.-H. and J.M.-Q.; formal analysis, A.H. and J.D.P.R.; investigation, A.H.; resources, J.M.-Q. and A.H.; data curation, A.H.; writing—original draft preparation, C.O.-H., J.D.P.R. and J.M.-F.; writing—review and editing, C.O.-H., J.D.P.R. and J.M.-F.; supervision, C.O.-H., J.M.-Q. and J.D.P.R.; project administration, C.O.-H.; funding acquisition, Not applicable. All authors have read and agreed to the published version of the manuscript.

Funding

This research received no external funding. The Article Processing Charges (APC) was funded by Universidad del Norte.

Data Availability Statement

The data supporting the findings of this study are available from the corresponding author upon reasonable request.

Conflicts of Interest

The authors declare no conflicts of interest.

References

  1. Cisco Systems. Distribution Automation—Secondary Substation Design Guide; Technical Report; Cisco Systems: San Jose, CA, USA, 2019; Available online: https://www.cisco.com/c/en/us/td/docs/solutions/Verticals/Distributed-Automation/Secondary-Substation/DG/DA-SS-DG.pdf (accessed on 23 October 2024).
  2. Omitaomu, O.A.; Niu, H. Artificial Intelligence Techniques in Smart Grid: A Survey. Smart Cities 2021, 4, 548–568. [Google Scholar] [CrossRef]
  3. Almihat, M.G.M.; Kahn, M.T.E.; Aboalez, K.; Almaktoof, A.M. Energy and Sustainable Development in Smart Cities: An Overview. Smart Cities 2022, 5, 1389–1408. [Google Scholar] [CrossRef]
  4. Shojaeiyan, S.; Dehghani, M.; Siano, P. Microgrids Resiliency Enhancement against Natural Catastrophes Based Multiple Cooperation of Water and Energy Hubs. Smart Cities 2023, 6, 1765–1785. [Google Scholar] [CrossRef]
  5. Bahramara, S.; Mazza, A.; Chicco, G.; Shafie-khah, M.; Catalão, J.P.S. Comprehensive review on the decision-making frameworks referring to the distribution network operation problem in the presence of distributed energy resources and microgrids. Int. J. Electr. Power Energy Syst. 2020, 115, 105466. [Google Scholar] [CrossRef]
  6. Hamanah, W.M.; Hossain, M.I.; Shafiullah, M.; Abido, M.A. AC Microgrid Protection Schemes: A Comprehensive Review. IEEE Access 2023, 11, 76842–76868. [Google Scholar] [CrossRef]
  7. ABB. Smart City Power Distribution; Technical Report; ABB, 2019. Available online: https://new.abb.com/docs/librariesprovider84/default-document-library/smart.pdf?sfvrsn=45a7c116_2 (accessed on 12 November 2024).
  8. Altaf, M.W.; Arif, M.T.; Islam, S.N.; Haque, M.E. Microgrid Protection Challenges and Mitigation Approaches—A Comprehensive Review. IEEE Access 2022, 10, 38895–38922. [Google Scholar] [CrossRef]
  9. Pothisarn, C.; Lertwanitrot, P.; Ngaopitakkul, A. A phase diagram approach to the detection and location of faulty capacitor units in A 115-kV capacitor bank based on unbalanced current arguments. Heliyon 2023, 9, e14589. [Google Scholar] [CrossRef]
  10. Li, C.; Wu, Q.; Zhang, L.; Shan, H.; Mai, Z.; Xu, X. Two-stage fault section location for distribution networks based on compressed sensing with estimated voltage measurements. Electr. Power Syst. Res. 2023, 223, 109702. [Google Scholar] [CrossRef]
  11. Sapountzoglou, N.; Lago, J.; De Schutter, B.; Raison, B. A generalizable and sensor-independent deep learning method for fault detection and location in low-voltage distribution grids. Appl. Energy 2020, 276, 115299. [Google Scholar] [CrossRef]
  12. Ajra, Y.; Hoblos, G.; Al Sheikh, H.; Moubayed, N. A Literature Review of Fault Detection and Diagnostic Methods in Three-Phase Voltage-Source Inverters. Machines 2024, 12, 631. [Google Scholar] [CrossRef]
  13. Yu, J.J.Q.; Hou, Y.; Lam, A.Y.S.; Li, V.O.K. Intelligent fault detection scheme for microgrids with wavelet-based deep neural networks. IEEE Trans. Smart Grid. 2019, 10, 1694–1703. [Google Scholar] [CrossRef]
  14. Kim, W.H.; Kim, J.Y.; Chae, W.K.; Kim, G.; Lee, C.K. LSTM-Based Fault Direction Estimation and Protection Coordination for Networked Distribution System. IEEE Access 2022, 10, 40348–40357. [Google Scholar] [CrossRef]
  15. Stanescu, D.; Digulescu, A.; Ioana, C.; Serbanescu, A. Transient power grid phenomena classification based on phase diagram features and machine learning classifiers. In Proceedings of the 2022 30th European Signal Processing Conference (EUSIPCO), Belgrade, Serbia, 29 August–2 September 2022; pp. 1676–1680. [Google Scholar] [CrossRef]
  16. Marín-Quintero, J.; Orozco-Henao, C.; Velez, J.C.; Bretas, A.S. Micro grids decentralized hybrid data-driven cuckoo search based adaptive protection model. Int. J. Electr. Power Energy Syst. 2021, 130, 106960. [Google Scholar] [CrossRef]
  17. Cepeda, C.; Orozco-Henao, C.; Percybrooks, W.; Pulgarín-Rivera, J.D.; Montoya, O.D.; Gil-González, W.; Vélez, J.C. Intelligent fault detection system for microgrids. Energies 2020, 13, 1223. [Google Scholar] [CrossRef]
  18. Reddy, O.Y.; Chatterjee, S.; Chakraborty, A.K.; Bhowmik, A.R. Fault detection and location estimation for LVDC microgrid using self-parametric measurements. Int. Trans. Electr. Energy Syst. 2020, 30, 1–13. [Google Scholar] [CrossRef]
  19. Rameshrao, A.G.; Koley, E.; Ghosh, S. A LSTM-based approach for detection of high impedance faults in hybrid microgrid with immunity against weather intermittency and N-1 contingency. Renew. Energy 2022, 198, 75–90. [Google Scholar] [CrossRef]
  20. Aqamohammadi, A.R.; Niknam, T.; Shojaeiyan, S.; Siano, P.; Dehghani, M. Deep Neural Network with Hilbert–Huang Transform for Smart Fault Detection in Microgrid. Electronics 2023, 12, 499. [Google Scholar] [CrossRef]
  21. Roy, B.; Adhikari, S.; Datta, S.; Devi, K.J.; Devi, A.D.; Alsaif, F. Deep Learning Based Relay for Online Fault Detection, Classification, and Fault Location in a Grid-Connected Microgrid. IEEE Access 2023, 11, 62674–62696. [Google Scholar] [CrossRef]
  22. Marín-Quintero, J.; Orozco-Henao, C.; Percybrooks, W.S.; Vélez, J.C.; Montoya, O.D.; Gil-González, W. Toward an adaptive protection scheme in active distribution networks: Intelligent approach fault detector. Appl. Soft Comput. 2020, 98, 106839. [Google Scholar] [CrossRef]
  23. Ozcanli, A.K.; Baysal, M. Islanding detection in microgrid using deep learning based on 1D CNN and CNN-LSTM networks. Sustain. Energy Grids Netw. 2022, 32, 100839. [Google Scholar] [CrossRef]
  24. Bengio, Y. Practical Recommendations for Gradient-Based Training of Deep Architectures. In Neural Networks: Tricks of the Trade, 2nd ed.; Montavon, G., Orr, G.B., Müller, K.R., Eds.; Springer: Berlin/Heidelberg, Germany, 2012; pp. 437–478. [Google Scholar] [CrossRef]
  25. Hor, C.L.; Crossley, P.A. Knowledge extraction from intelligent electronic devices. In Transactions on Rough Sets III; Springer: Berlin/Heidelberg, Germany, 2005; pp. 82–111. [Google Scholar]
  26. Shahin, M.A.; Holger, M.R.; Jaksa, M.B. Data Division for Developing Neural Networks Applied to Geotechnical Engineering. J. Comput. Civ. Eng. 2004, 8, 105–114. [Google Scholar] [CrossRef]
  27. Sak, H.; Senior, A.; Beaufays, F. Long Short-Term Memory Based Recurrent Neural Network Architectures for Large Vocabulary Speech Recognition. arXiv 2014, arXiv:1402.1128. [Google Scholar]
  28. Mao, A.; Mohri, M.; Zhong, Y. Cross-Entropy Loss Functions: Theoretical Analysis and Applications. arXiv 2023, arXiv:2304.07288. [Google Scholar]
  29. Kingma, D.P.; Ba, J. ADAM: A method for stochastic optimization. arXiv 2015, arXiv:1412.6980. [Google Scholar]
  30. Institute of Electrical and Electronics Engineers (IEEE). IEEE standard dictionary of electrical and electronics terms. IEEE Trans. Power Appar. Syst. 1980, PAS-99, 37a. [Google Scholar] [CrossRef]
  31. Phadke, A.G.; Horowitz, S.H. Power System Relaying; Wiley: Hoboken, NJ, USA, 2008. [Google Scholar]
  32. IEEE Power and Energy Society. IEEE 34 Node Test Feeder. IEEE Power and Energy Society: Piscataway, NJ, USA, 2010. Available online: https://cmte.ieee.org/pes-testfeeders/resources/ (accessed on 23 March 2024).
  33. Hoidalen, H.K. ATPDraw Windows Version 7.2; NTNU: Trondheim, Norway, 2020; Available online: https://www.atpdraw.net/ (accessed on 23 March 2025).
  34. Plet, C.A.; Green, T.C. Fault response of inverter interfaced distributed generators in grid-connected applications. Electr. Power Syst. Res. 2014, 106, 21–28. [Google Scholar] [CrossRef]
Figure 1. LSTM architecture.
Energies 18 03453 g001
Figure 2. Architecture of multiple LSTMs connected in series for fault detection.
Energies 18 03453 g002
Figure 3. LSTM-based fault detector methodology.
Energies 18 03453 g003
Figure 4. Flowchart for binary classifier-LSTM-based fault detector training setup.
Energies 18 03453 g004
Figure 5. Modified IEEE 34 test feeder with smart network capabilities.
Energies 18 03453 g005
Figure 6. Performance indicators for relays R1 and R2.
Energies 18 03453 g006
Figure 7. Performance indicators for relays R3 and R4.
Energies 18 03453 g007
Figure 8. Performance indicators for relays R5 and R6.
Energies 18 03453 g008
Figure 9. Performance indicators for relays R7 and R8.
Energies 18 03453 g009
Figure 10. Performance indicators for relays R9 and R10.
Energies 18 03453 g010
Figure 11. Detection probability vs. detection speed for relays R1 and R2.
Energies 18 03453 g011
Figure 12. Detection probability vs. detection speed for relays R3 and R4.
Energies 18 03453 g012
Figure 13. Detection probability vs. detection speed for relays R5 and R6.
Energies 18 03453 g013
Figure 14. Detection probability vs. detection speed for relays R7 and R8.
Energies 18 03453 g014
Figure 15. Detection probability vs. detection speed for relays R9 and R10.
Energies 18 03453 g015
Table 1. Aspects considered to develop the proposed methodology.
Aspects ConsideredReviewed Methods and References
[13] [11] [16] [22] [17] [18] [19] [20] [21] [14]PM 1
Network-Related Aspects
MG Mode (On/Off-Grid)
Network Reconfiguration
Unbalance
Load Variability
DER Status (Conn./Disc.)
Comprehensive Fault Coverage
Communication and Performance Aspects
Communication-Free Approach
No Feature Selection Required
Reliability-Time Trade-Off
1 PM stands for proposed methodology.
Table 2. Commonly used factors in ADN operating scenarios.
GroupFactorLevels
No-fault operationLoad changeHigh (120–90%), mid (90–60%),
low (60–30%). Change by ±5%
from its initial value
Topology changeReconfiguration—section cut off—off grid
Cut off generationAt least one DG to time
Capacitor switchingAt least one to time
Operation mode microgridOn-grid/off-grid
Fault operationType of faultSingle-phase faults, double-phase
faults, double-phase-to-ground faults
and three-phase faults
Fault locationOverall distribution lines
Fault resistance0 Ω to 100 Ω
Fault location over line section0% to 50%
Table 3. Confusion matrix.
Prediction
PositiveNegativeTotal
LabelPositiveTrue positive (TP)False negative (FN)TP + FN
NegativeFalse positive (FP)True negative (TN)FP + TN
TotalTP + FPFN + TN
Table 4. DER parameters.
ParameterCIDER-1CIDER-2CIDER-3CIDER-4
P n o m [kW]200100100100
V n o m [V]400400400400
f [Hz]60606060
I T h d [pu]1.61.61.61.6
I s a t [pu]2.02.02.02.0
Table 5. Validated operational conditions.
GroupFactorLevelScenarios
No-fault operationLoad change by ± 5 % from its initial valueHigh (120–90%)8778
Medium (90–60%)
Low (60–30%)
Fault operationType of faultSingle-phase faults8778
Double-phase faults
Double-phase-to-ground faults
Three-phase faults
Fault locationThree-phase nodes (32 nodes)
Fault resistance Ω to 50  Ω in steps of 10  Ω
Table 6. Confusion matrices for relays R1, R2, and R3.
True labelPredicted Label
Relay R1Relay R2Relay R3
FaultNo FaultFaultNo FaultFaultNo Fault
Fault1452014421014457
No Fault015480154801548
Table 7. Confusion matrices for relays R4, R5, and R6.
True labelPredicted Label
Relay R4Relay R5Relay R6
FaultNo FaultFaultNo FaultFaultNo Fault
Fault144481448414475
No Fault015480154801548
Table 8. Confusion matrices for relays R7 and R8.
True labelPredicted Label
Relay R7Relay R8
FaultNo FaultFaultNo Fault
Fault141933142527
No Fault0154801548
Table 9. Confusion matrices for relays R9 and R10.
True labelPredicted Label
Relay R9Relay R10
FaultNo FaultFaultNo Fault
Fault140052139458
No Fault0154801548
Table 10. Performance indicators for relays in the case study.
RelayAccuracy [%]Dependability [%]Safety [%]
R1100.0100.0100.0
R299.799.3100.0
R399.899.5100.0
R499.799.4100.0
R599.999.7100.0
R699.899.7100.0
R798.997.7100.0
R899.198.1100.0
R998.396.4100.0
R1098.196.0100.0
Disclaimer/Publisher’s Note: The statements, opinions and data contained in all publications are solely those of the individual author(s) and contributor(s) and not of MDPI and/or the editor(s). MDPI and/or the editor(s) disclaim responsibility for any injury to people or property resulting from any ideas, methods, instructions or products referred to in the content.

