Article

The Steady-State and Dynamic Characteristics of a Humidity-Sensitive Air Inlet: Modeling Based on Measurements

Faculty of Environmental Engineering, Warsaw University of Technology, 00-661 Warsaw, Poland
*
Author to whom correspondence should be addressed.
Energies 2025, 18(13), 3444; https://doi.org/10.3390/en18133444
Submission received: 3 April 2025 / Revised: 5 June 2025 / Accepted: 18 June 2025 / Published: 30 June 2025
(This article belongs to the Section G: Energy and Buildings)

Abstract

This paper presents the airflow characteristics of humidity-sensitive air inlet. This type of air inlets and exhausts are often part of demand control ventilation, especially in dwellings where humidity is an important indicator of ventilation needs. Humidity-controlled ventilation is one of the simplest implementations of smart ventilation, even in the case of a natural ventilation system. This type of solution leads to decreased energy consumption and increases the indoor air quality. A description of airflow characteristics is crucial for resolving these issues. The presented characteristics are based on the measurements of the indoor/outdoor relative humidity, airflow, and pressure drop across the air inlet. The characteristics are described based on a general power law flow model (V = C·∆pn), which is the most suitable, for example, for the CONTAM multizone indoor air quality and ventilation analysis computer program. The characteristics include relationships between the indoor and outdoor relative humidity, hysteresis, and dynamic changes in indoor relative humidity. The simplified and complex formulas are presented. The accuracy of the airflow calculation based on these formulas is discussed.

1. Introduction

Constantly increasing heating costs have led to the search for more efficient and technically more advanced solutions, allowing for a better use of financial resources. On the one hand, these are solutions for new construction (higher thermal insulation of external partitions, tight doors and windows); on the other hand, more and more sophisticated heating and ventilation systems are being introduced. In housing construction, central heating systems that are equipped with extensive control systems are already standard. Also, demand-controlled ventilation is very popular. One of them is humidity-controlled ventilation, invented almost 40 years ago and still available on the market [1,2,3,4,5]. Its advantage is the ability to adjust the intensity of air exchange depending on the needs indicated by the level of indoor relative humidity [6,7,8,9,10,11]. This system can be used for new and modernized buildings [12,13], as well. One of the elements of this system is air inlets that are equipped with a polyamide tape reacting to the relative humidity of the indoor air. Until now, papers describing the dynamic and steady-state flow characteristics of this type of air inlet have not been published. There are only reports of measurements of the nominal response curves of humidity-controlled air inlets [14] and field tests focusing on the conditions of functioning of the humidity-controlled ventilation system as a whole [15,16,17], also including analyses of the long-term durability of the system [18,19]. There are also simulation results for humidity-controlled ventilation [10,20,21,22,23,24,25], but these are based only on nominal response curves. The dynamic behavior of air inlets may be a significant complement to the information that is used for simulation. Currently, significant progress has also been made in simulation programs. Currently, most known programs, in particular CONTAM [26], allow for calculations to be made for the flow characteristics depending on the indoor humidity. This dependence on flow characteristics may also be implemented for supply and exhaust elements [10,27,28] and can at the same time be used to calculate the indoor air humidity or other indoor contaminant concentrations. This can be useful for any type of simulation and modeling, such as infiltration, natural ventilation, and the air tightness of a building [29]. The mathematical model for this type of air inlets may also be a significant factor in the calculation of ventilation and corresponding building energy performances, as required by the Energy Performance of Buildings Directive [30] and its updates in the directive on energy efficiency and amending regulation [31].
This paper presents an analysis of research on humidity-sensitive air inlets. This research identified the steady-state and dynamic characteristics of air inlets, which may be useful for the modeling and simulation of humidity-controlled ventilation. Taking into account future applications, it was decided to present the air inlet properties using the general power law equation [26,32]:
V = C · p n
where
  • V—The ventilation airflow, m3/h.
  • C—The flow characteristic parameter, m3/(h∙Pan).
  • p—The pressure drop across the air inlet, Pa.
  • N—The exponent of flow characteristic.
  • and parameter C will be considered as a function of
  • The indoor relative humidity φi and indoor air temperature Ti.
  • The temperature difference between the indoor and outdoor ∆T.
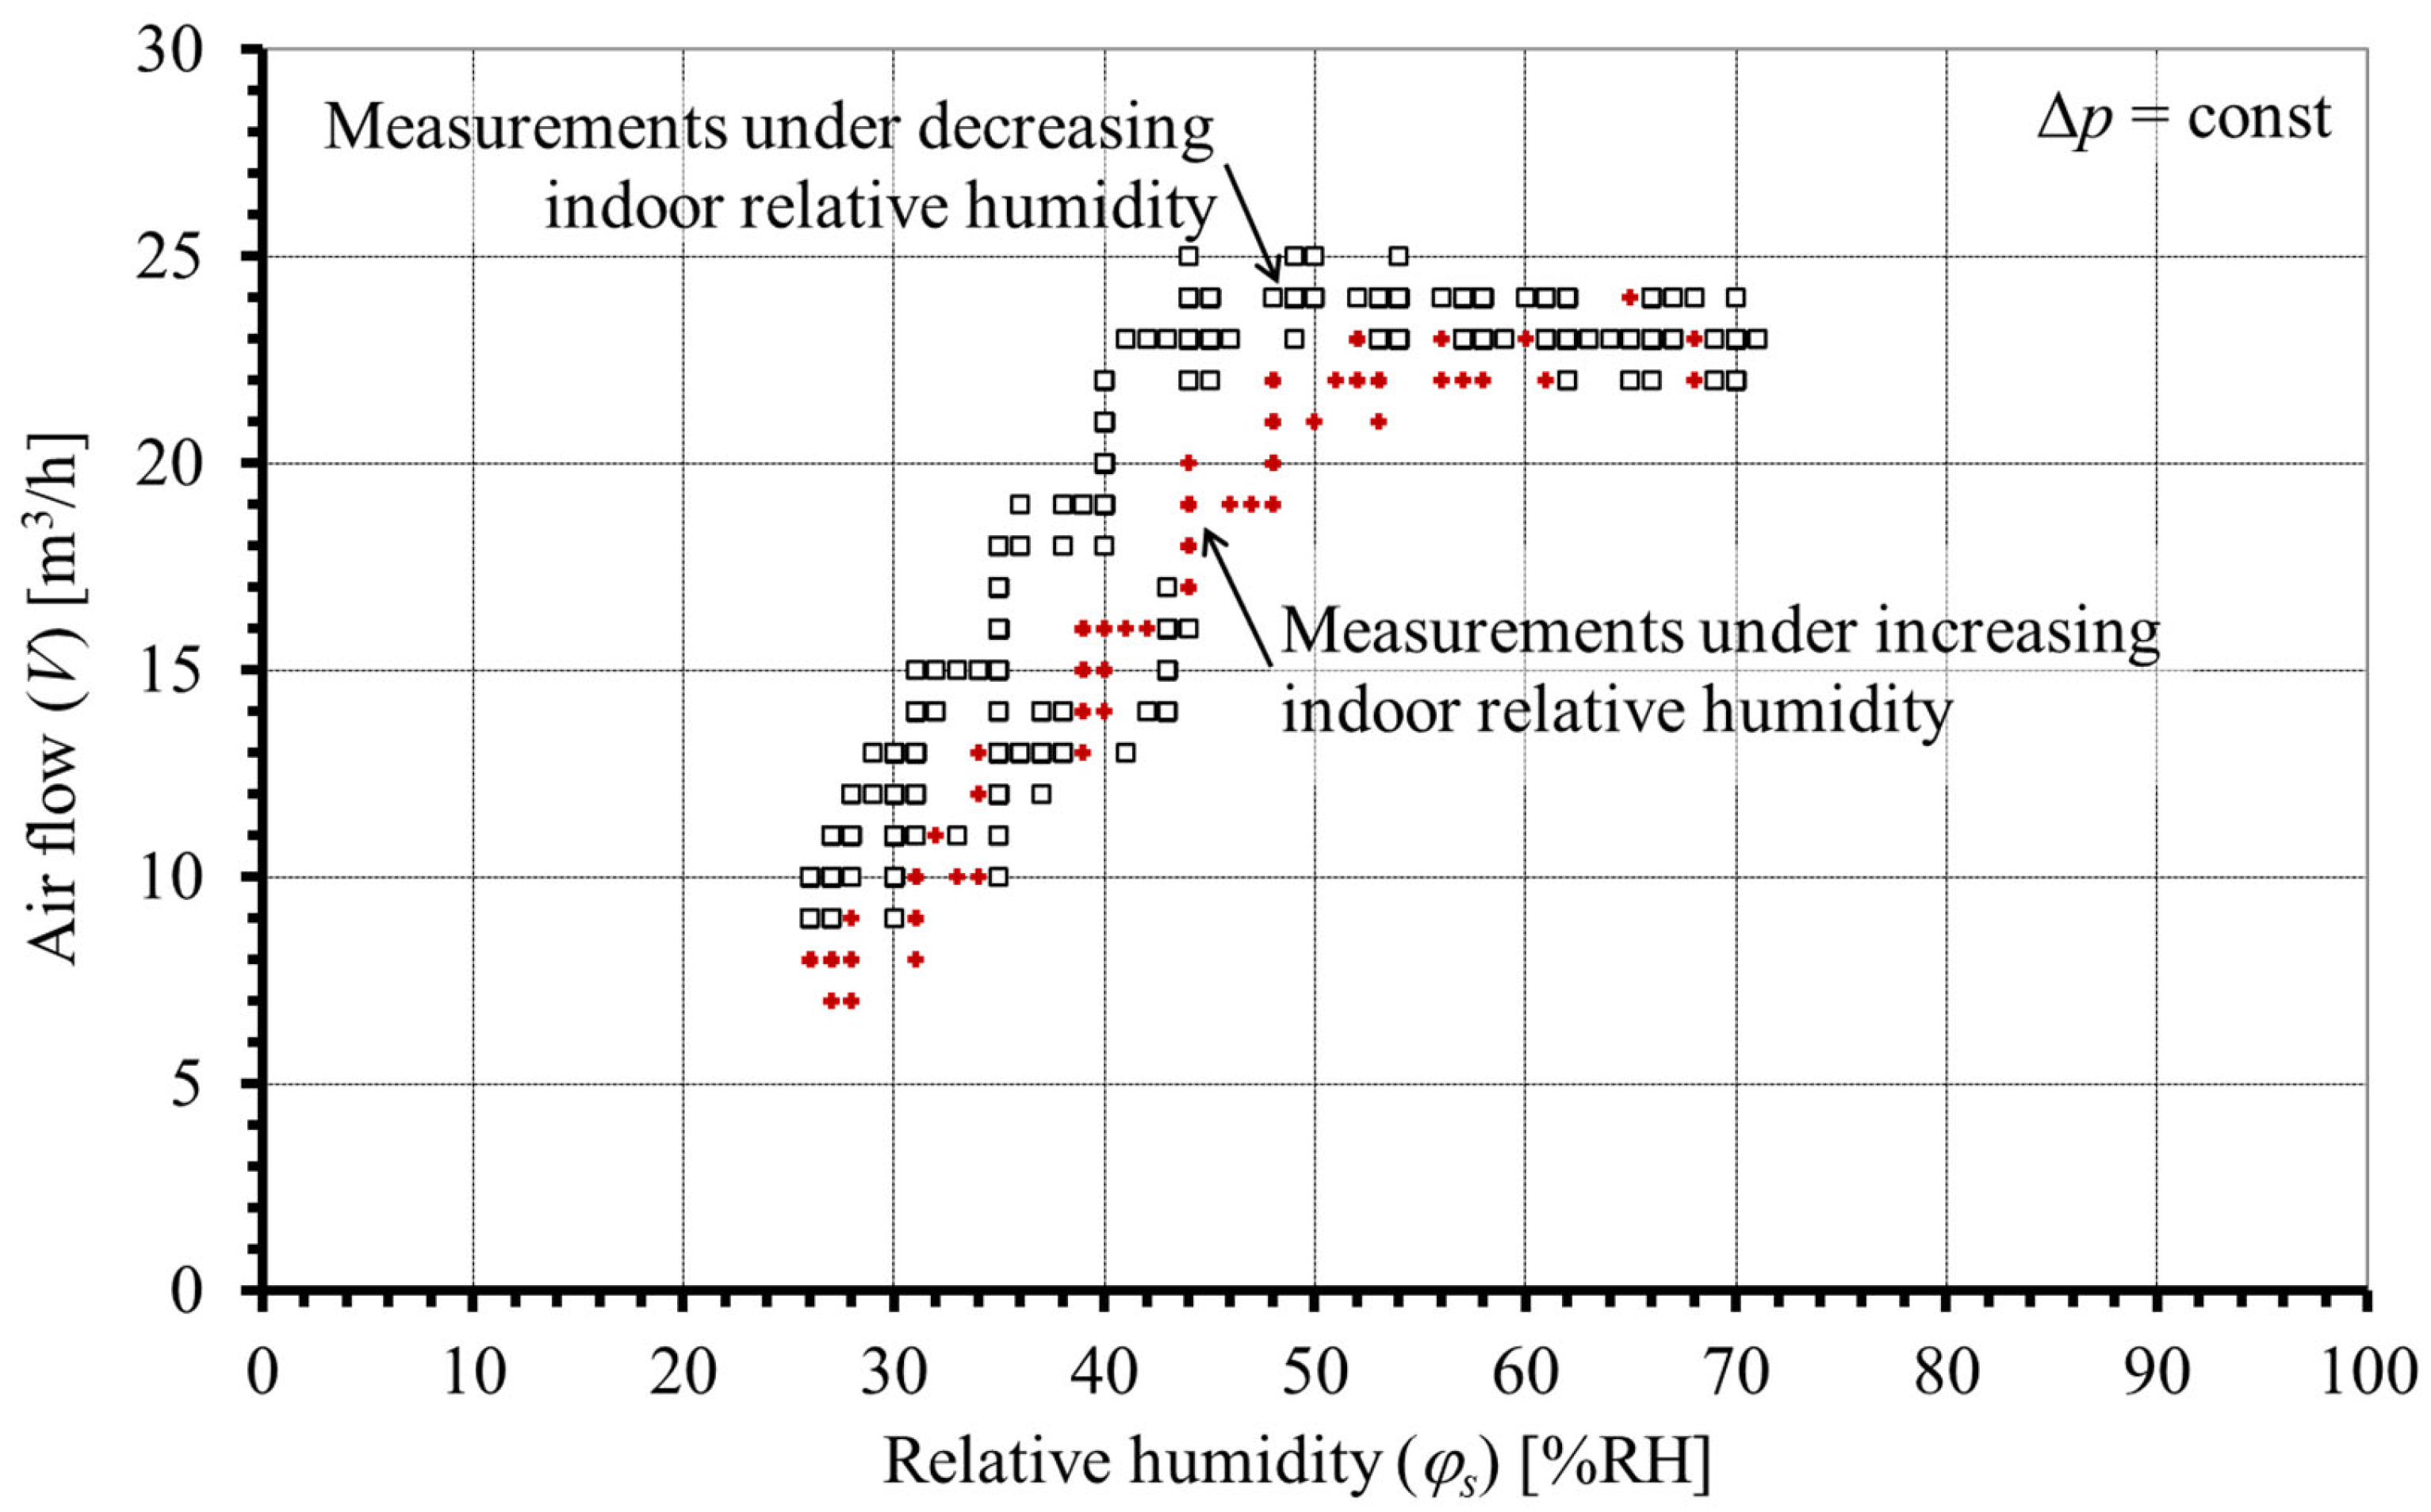
  • Hysteresis V = f(φi)p =const.
  • The dynamic properties of the air inlet.
  • and the exponent n is assumed to be a constant value.

2. Materials and Methods

A typical humidity-sensitive air inlet, adapted for operation under natural ventilation conditions, was selected for analysis. It is a wall air inlet with the dimensions of 312 × 64 × 27 mm. The installation diagram of the air inlet, together with the most important symbols, is presented in Figure 1.
The inlet’s nominal airflow (V) at a pressure difference (∆p) of 10 Pa is 10 m3/h for indoor relative humidity (φi) below 35%RH and 25 m3/h for φi above 70%RH.
The analysis was carried out on the basis of a measuring program covering the following series:
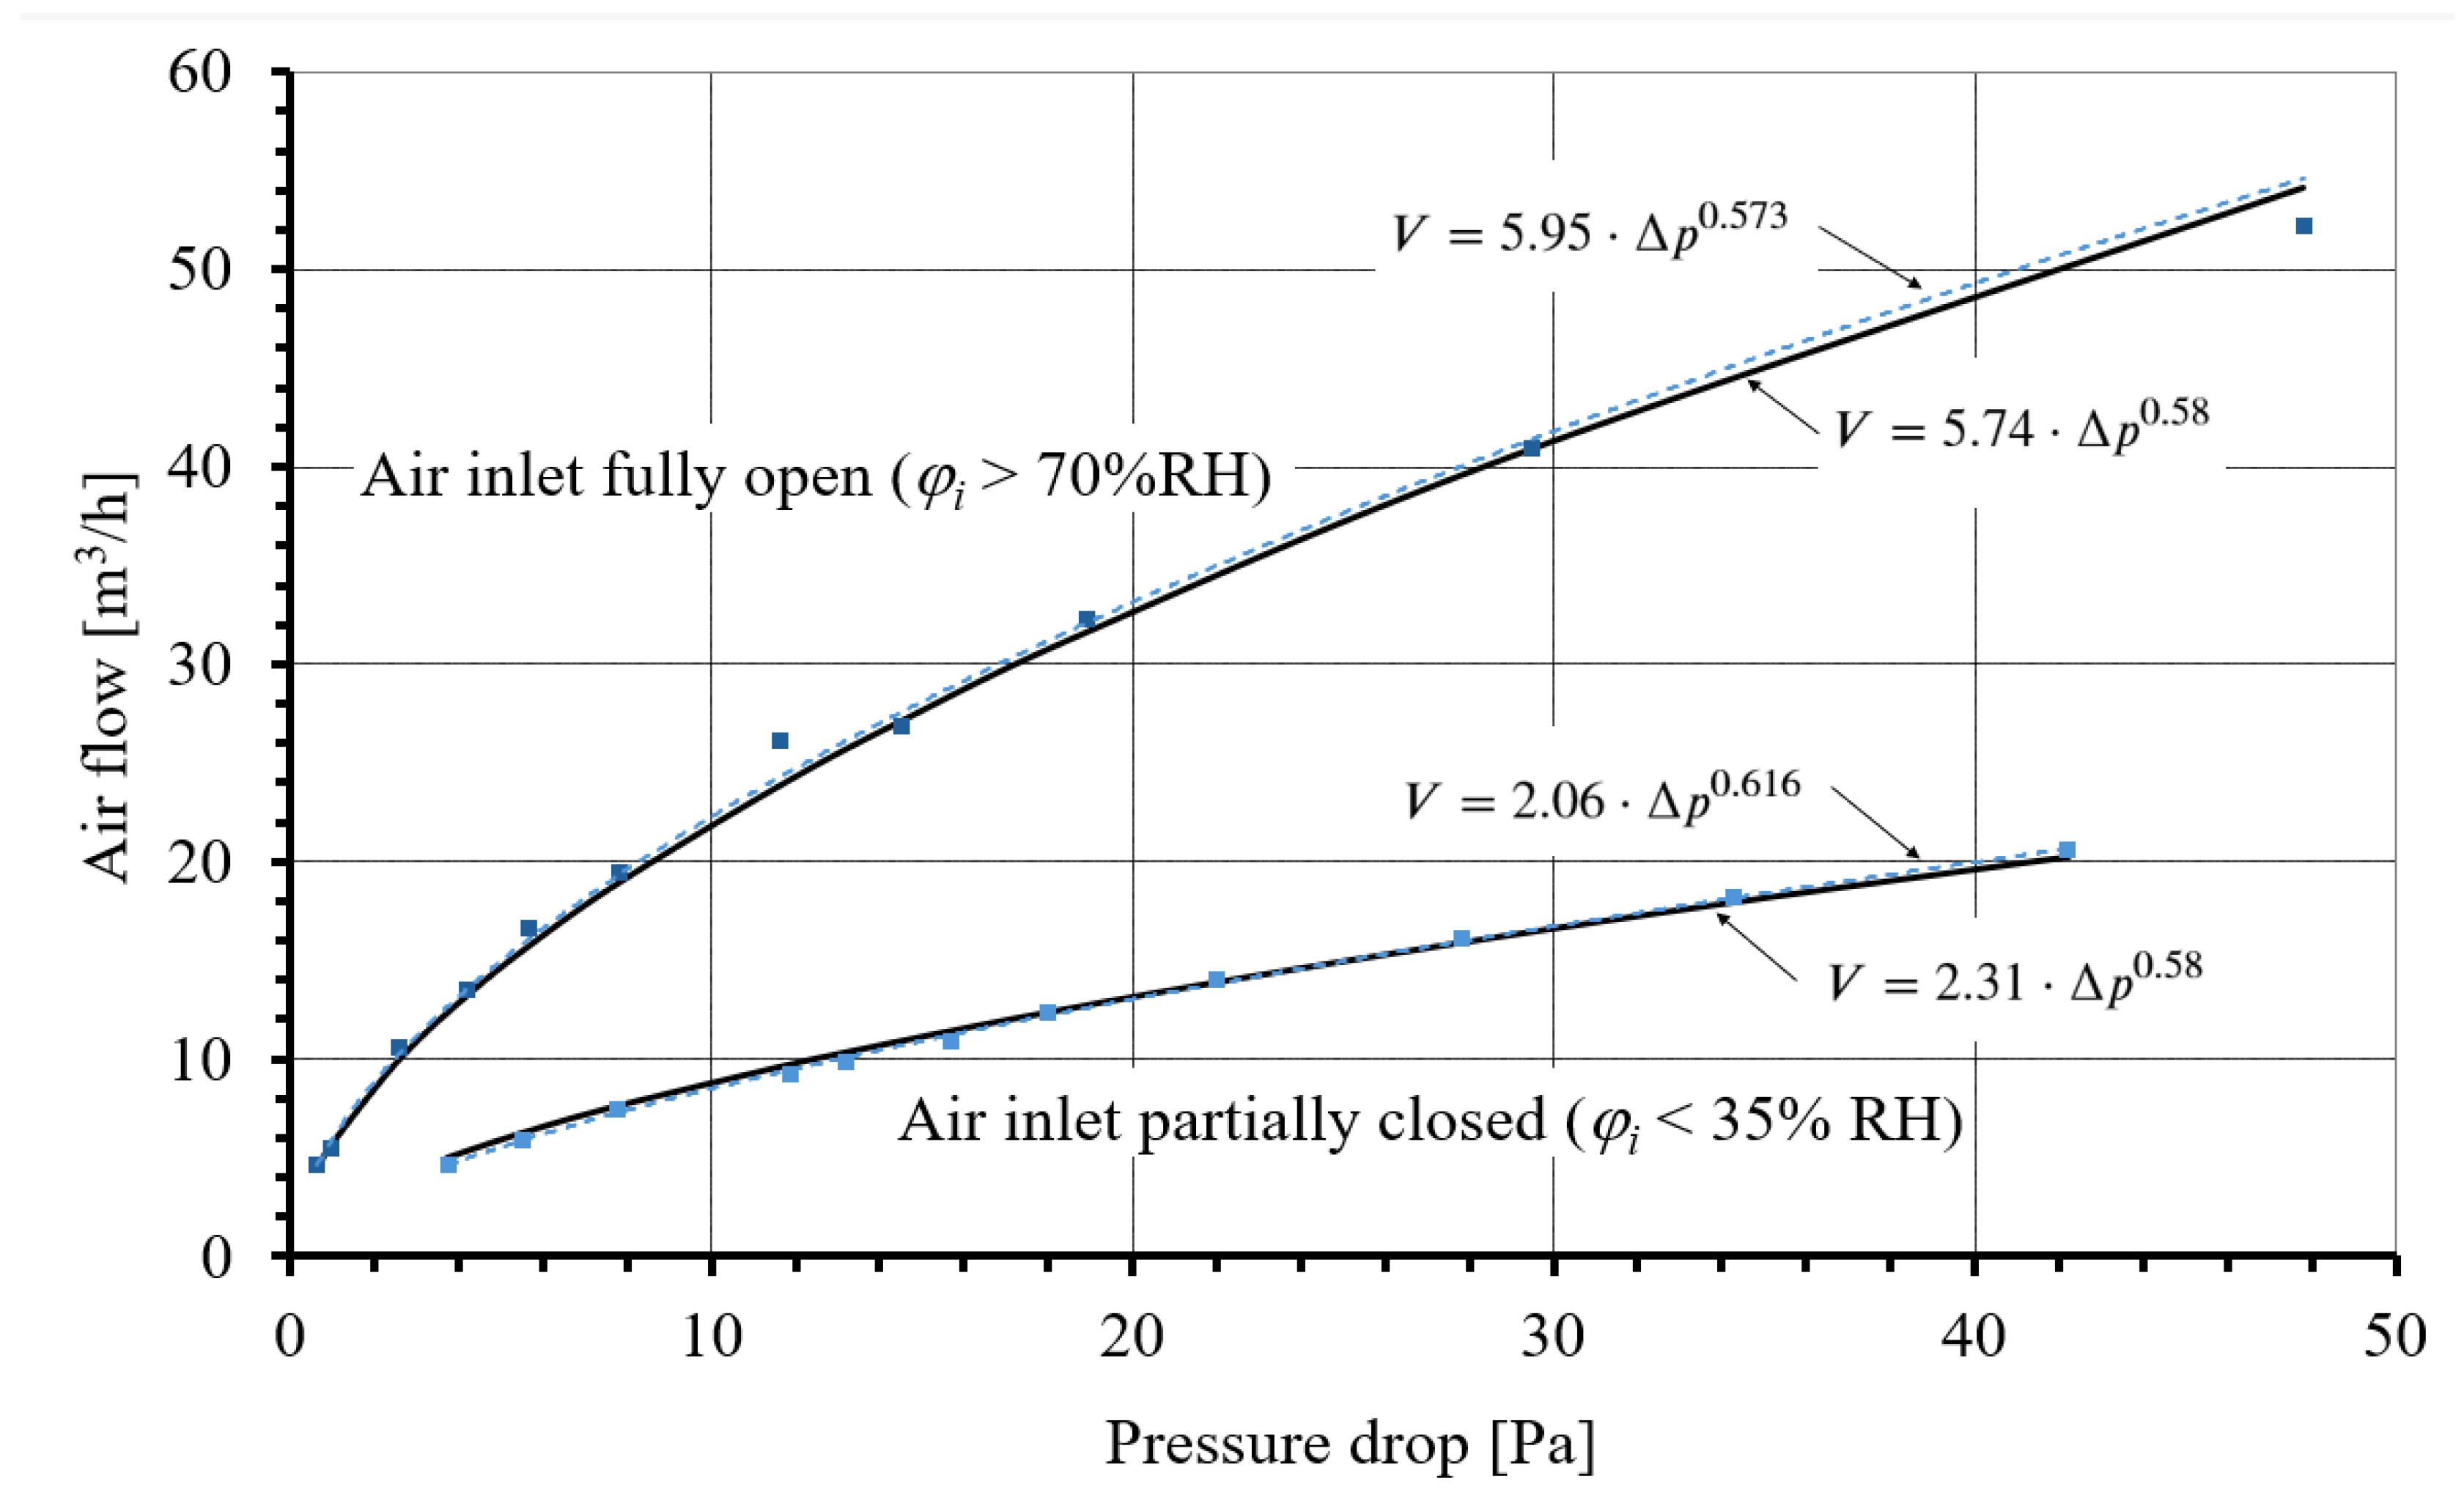
  • Measuring series I: Measurement of the pressure drop across the air inlet and the corresponding airflow through the fully open (φi above 70%RH) and partially closed (φi below 35%RH) air inlet. The measurement results are shown in Figure 2.
  • Measuring series II: Measurement of the airflow through the air inlet under steady-state conditions and under increasing/decreasing indoor relative humidities, a constant pressure drop across the air inlet of 10 Pa, an indoor temperature (Ti) of 21.5 °C, and an outdoor temperature (Te) of 21.5 °C and 10 °C. The measurement results are shown in Figure 3 and Figure 4.
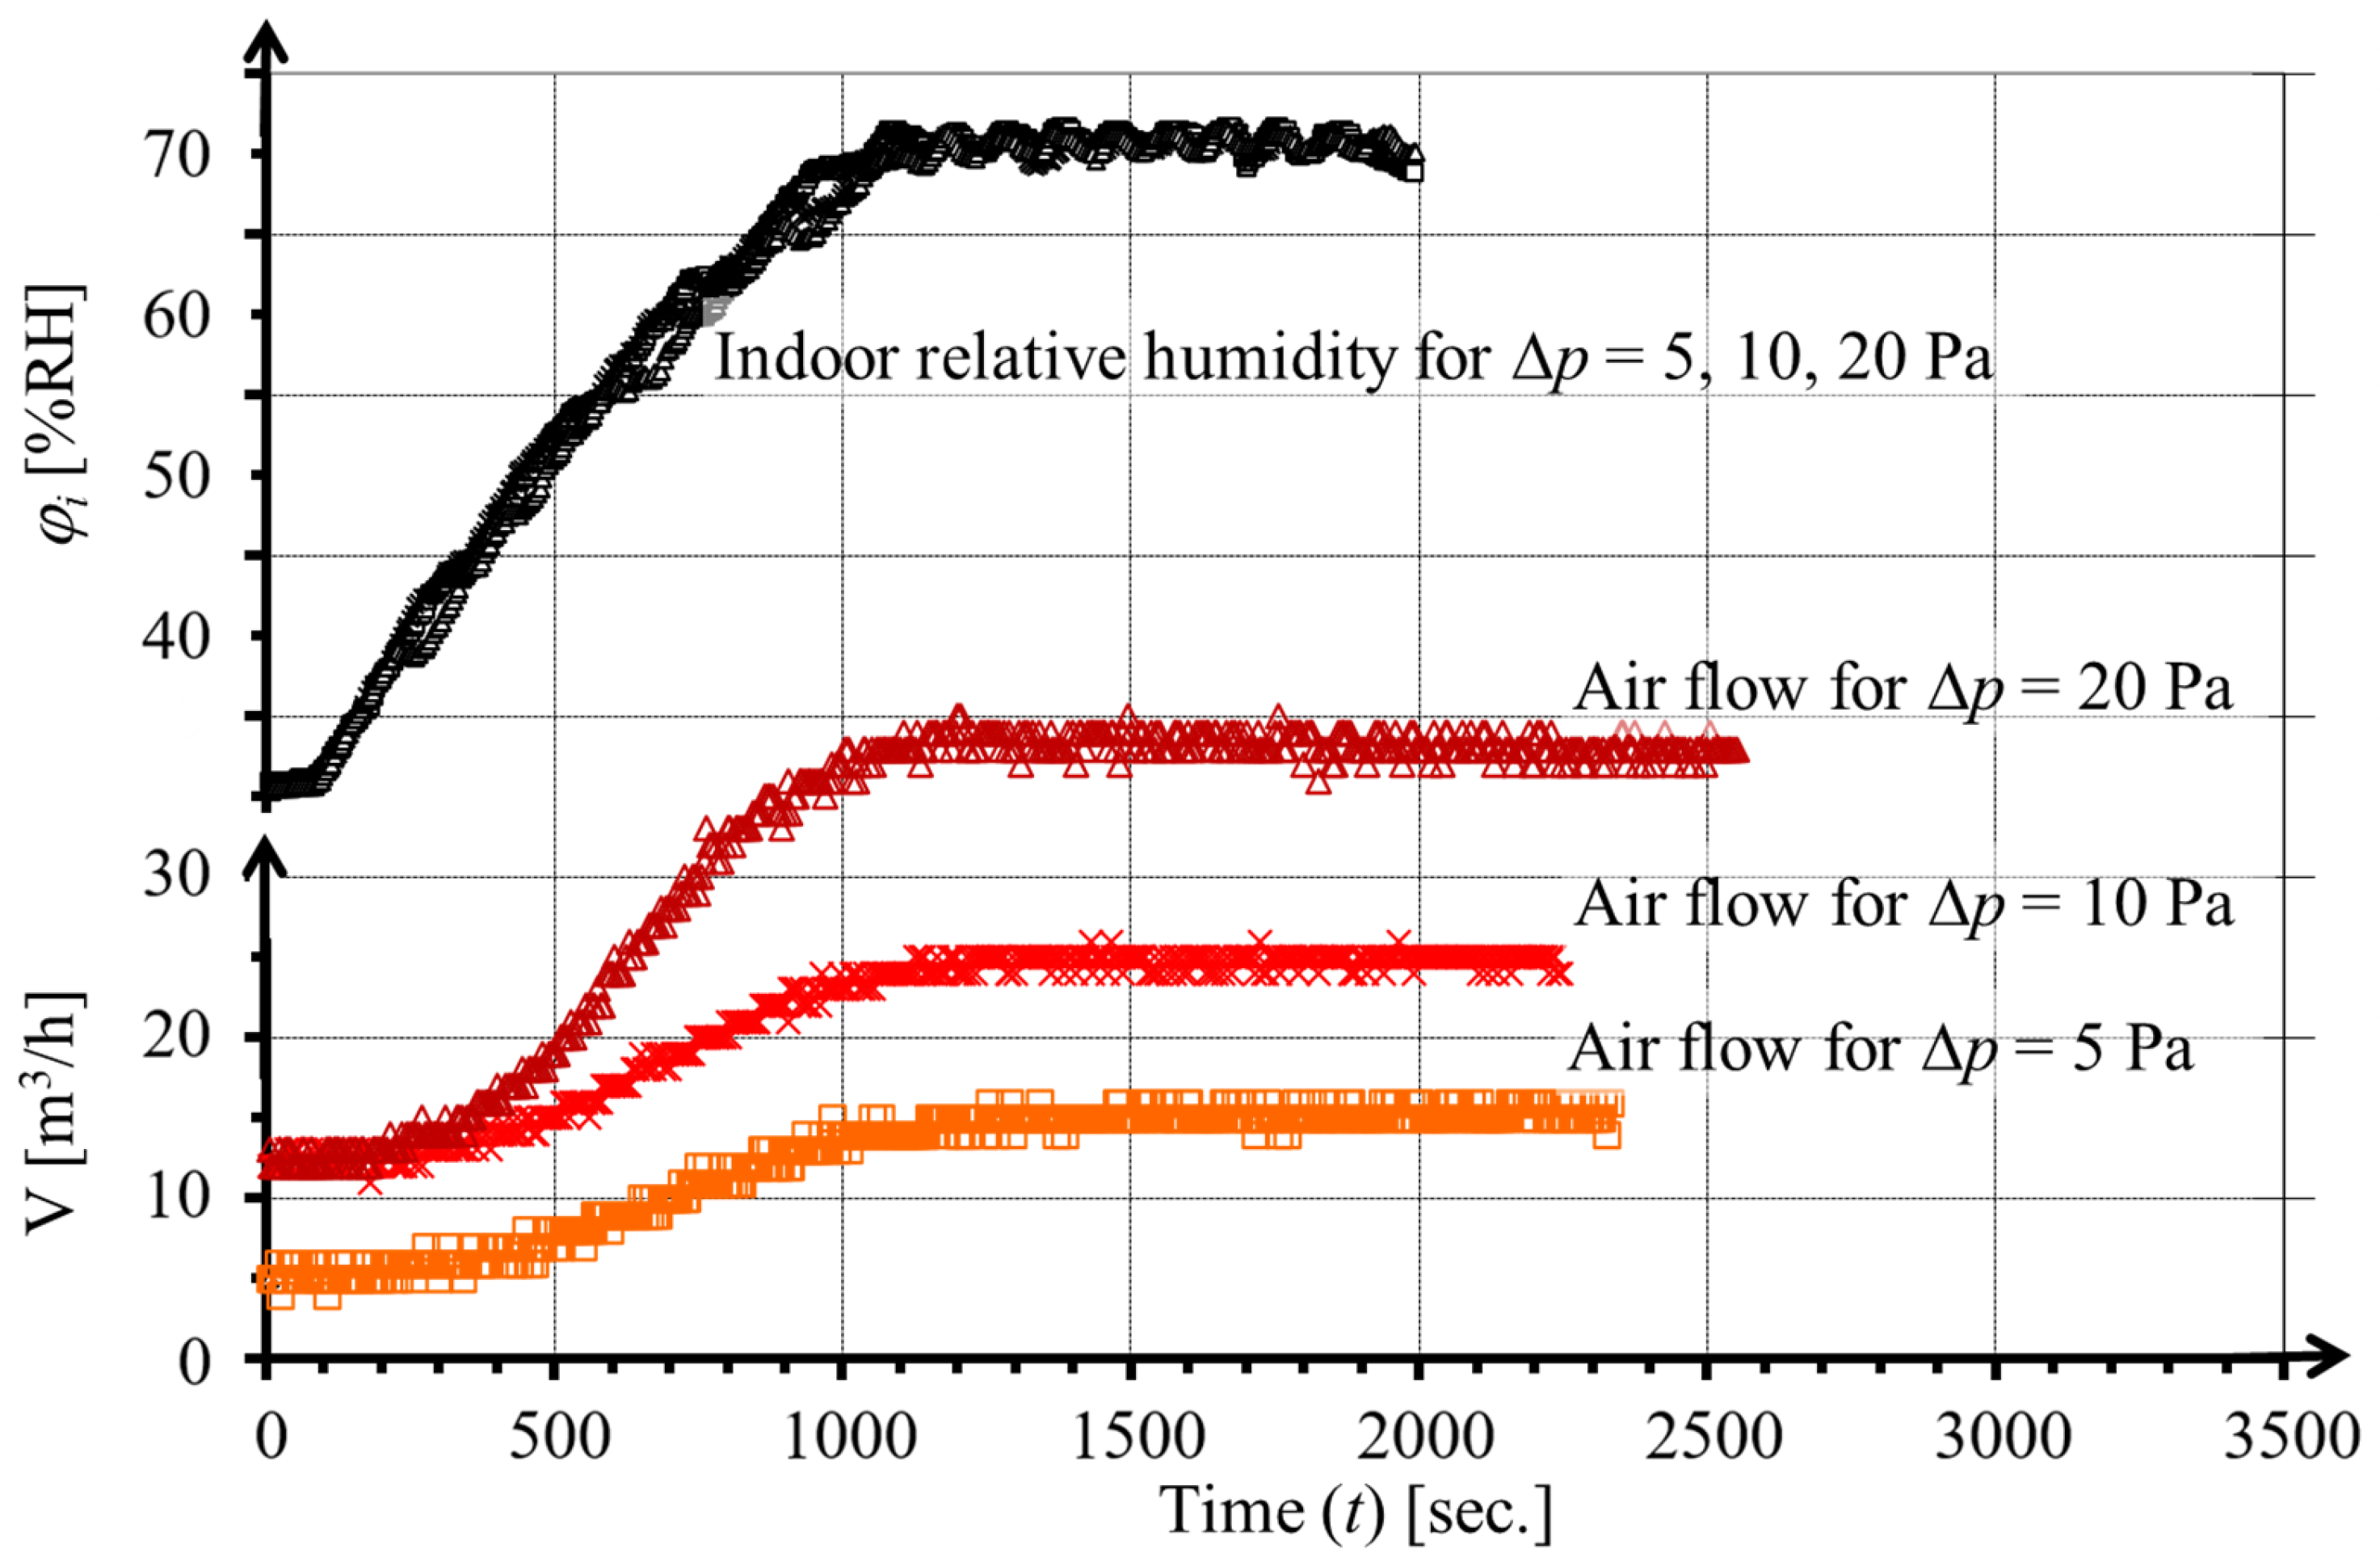
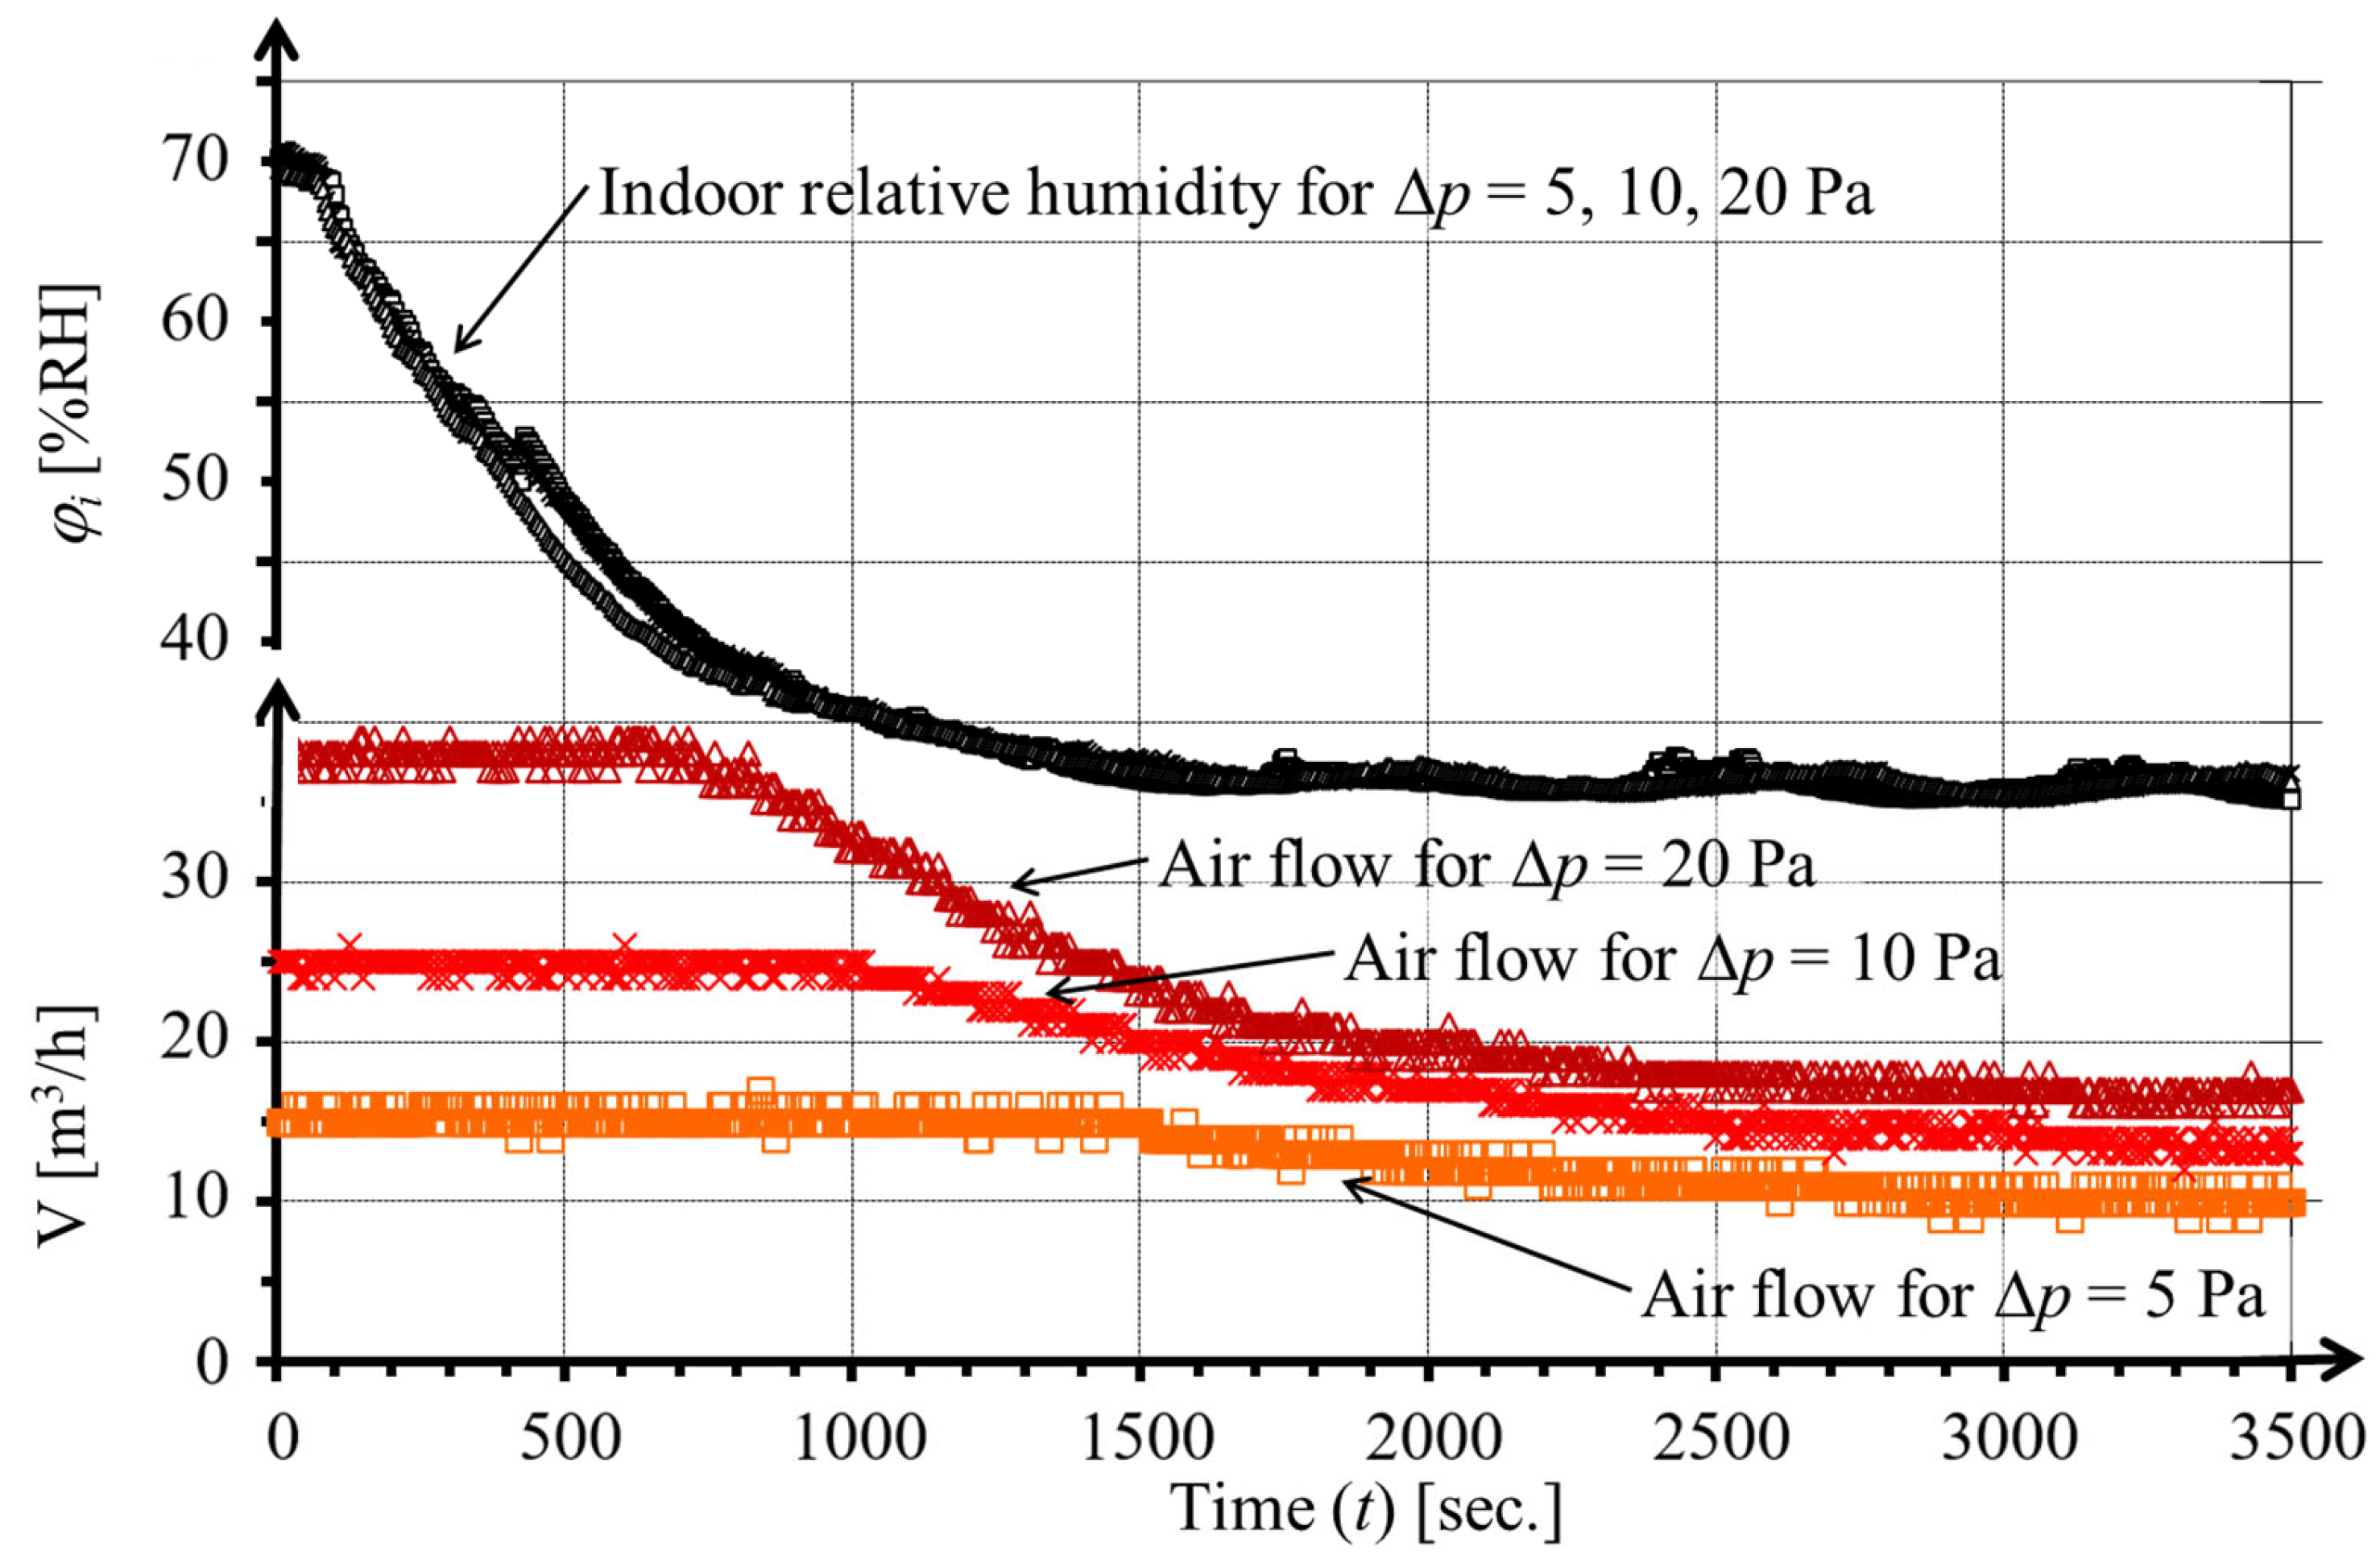
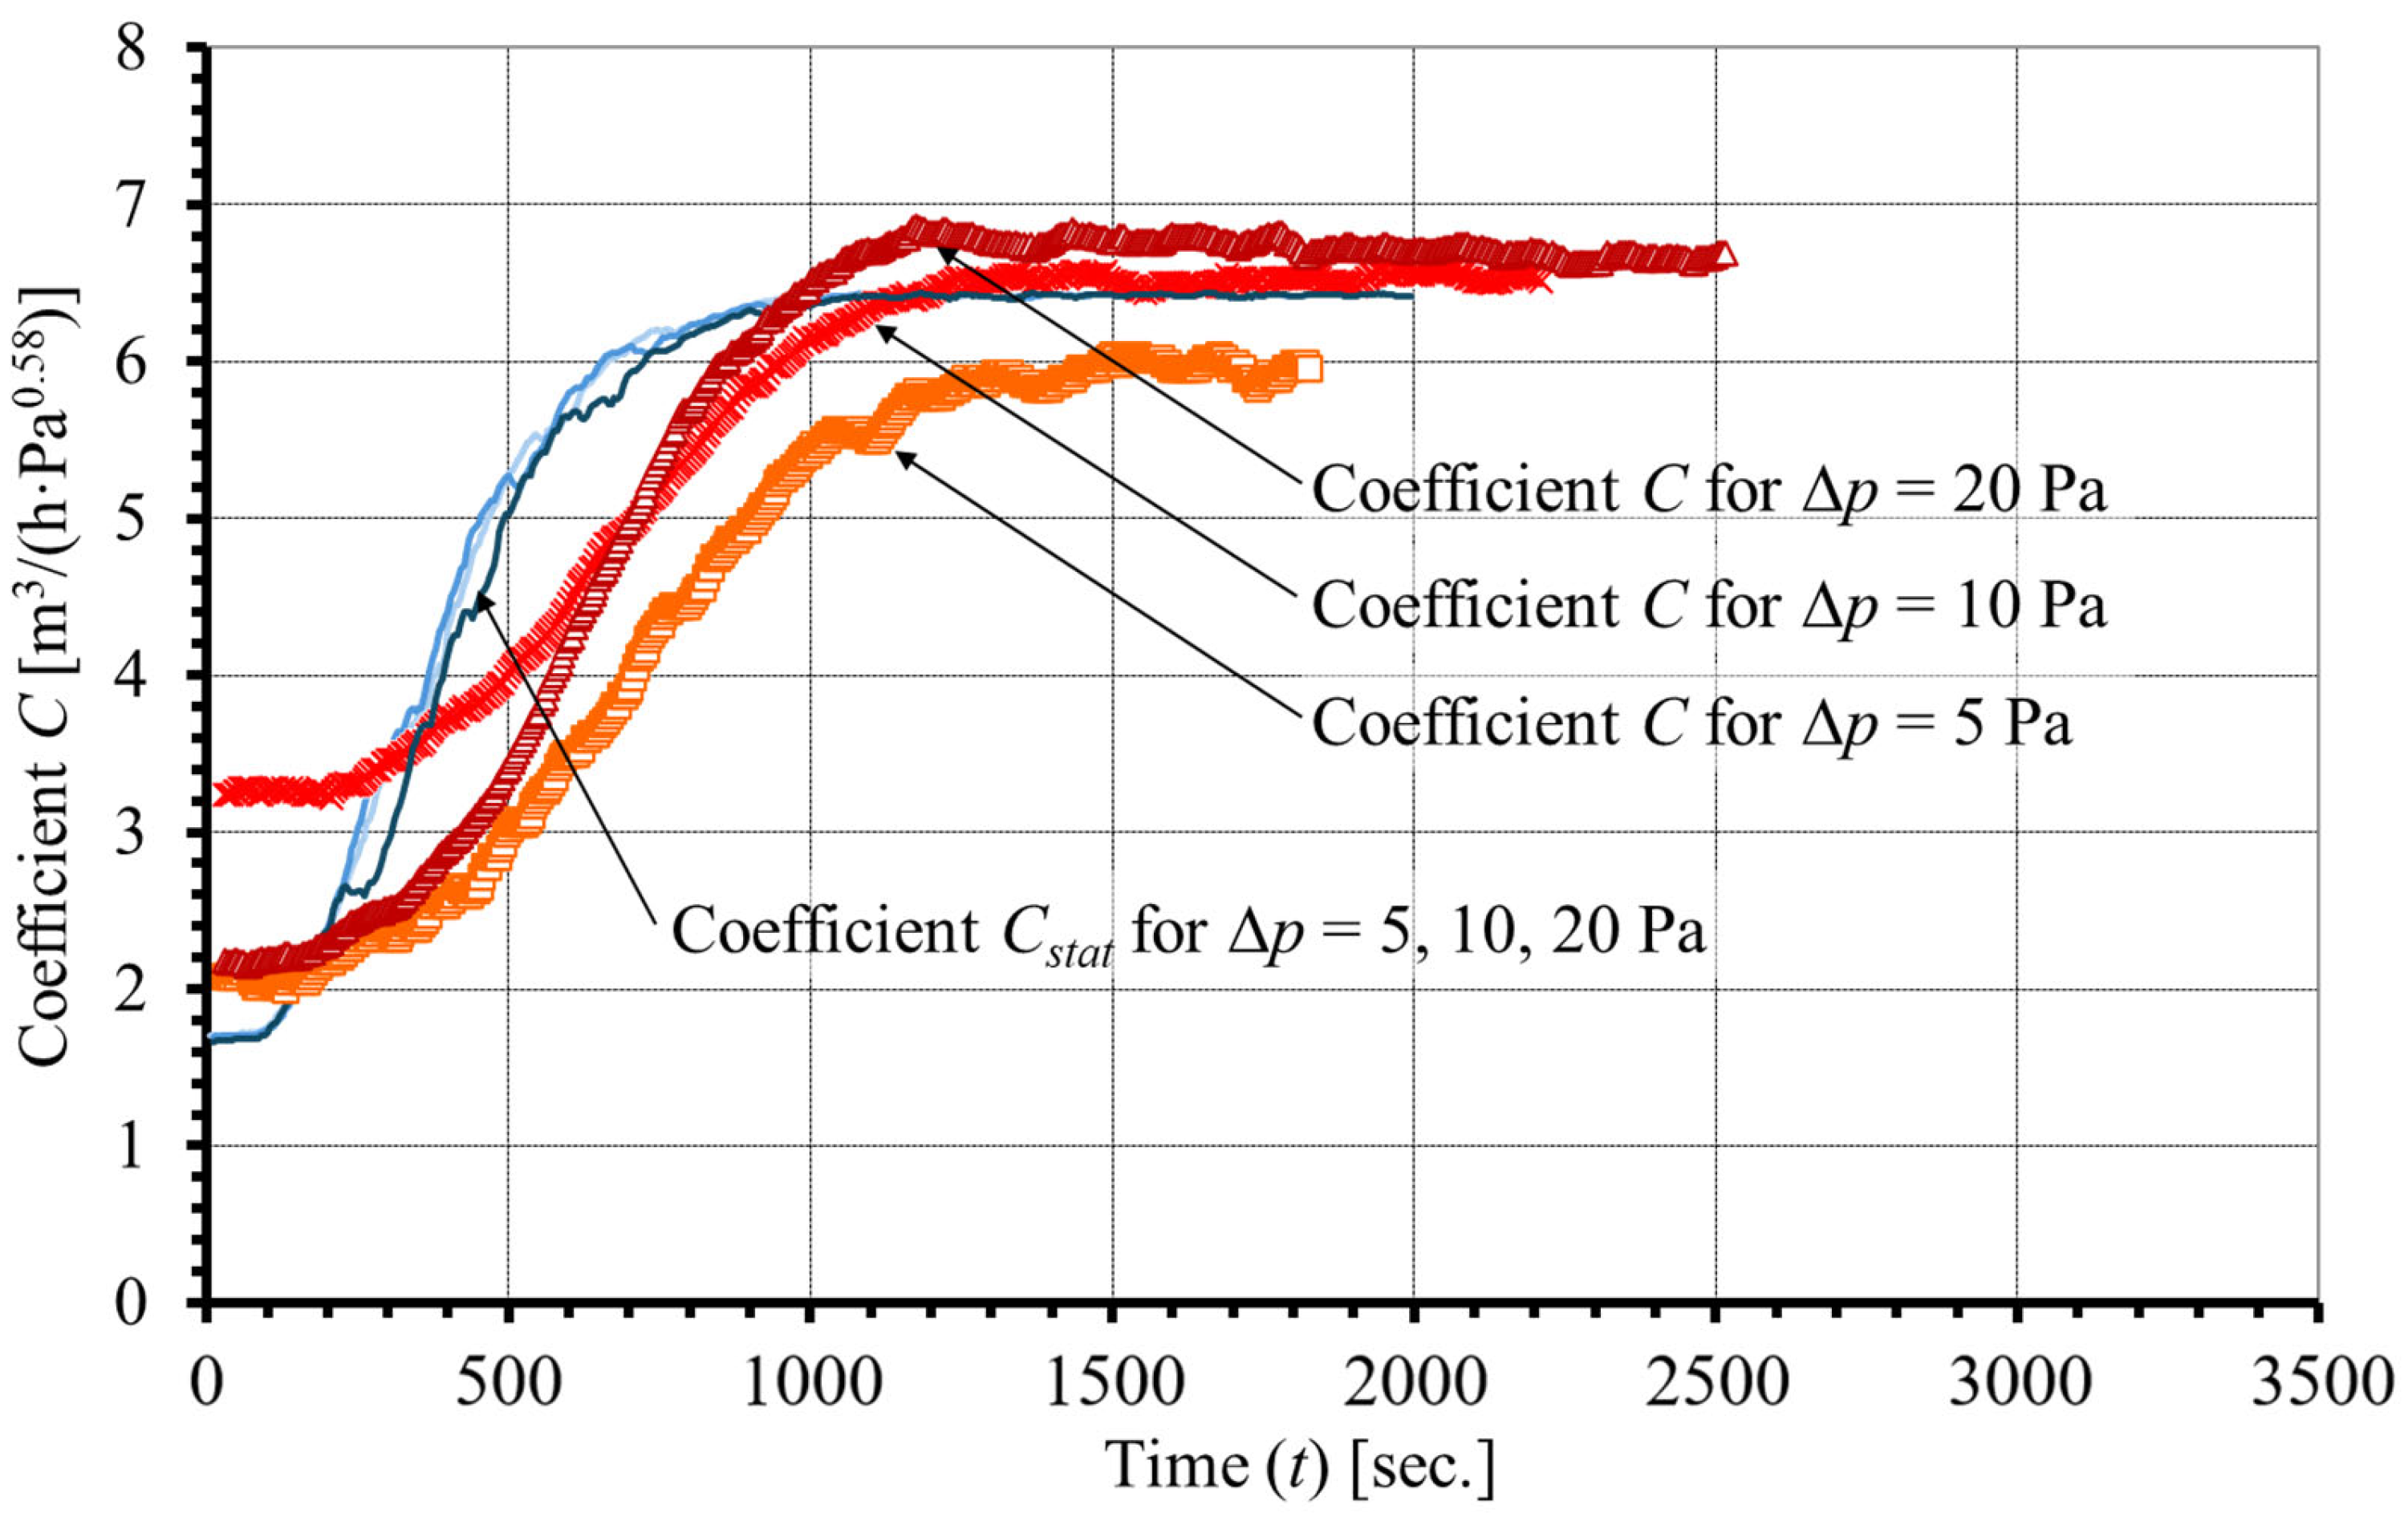
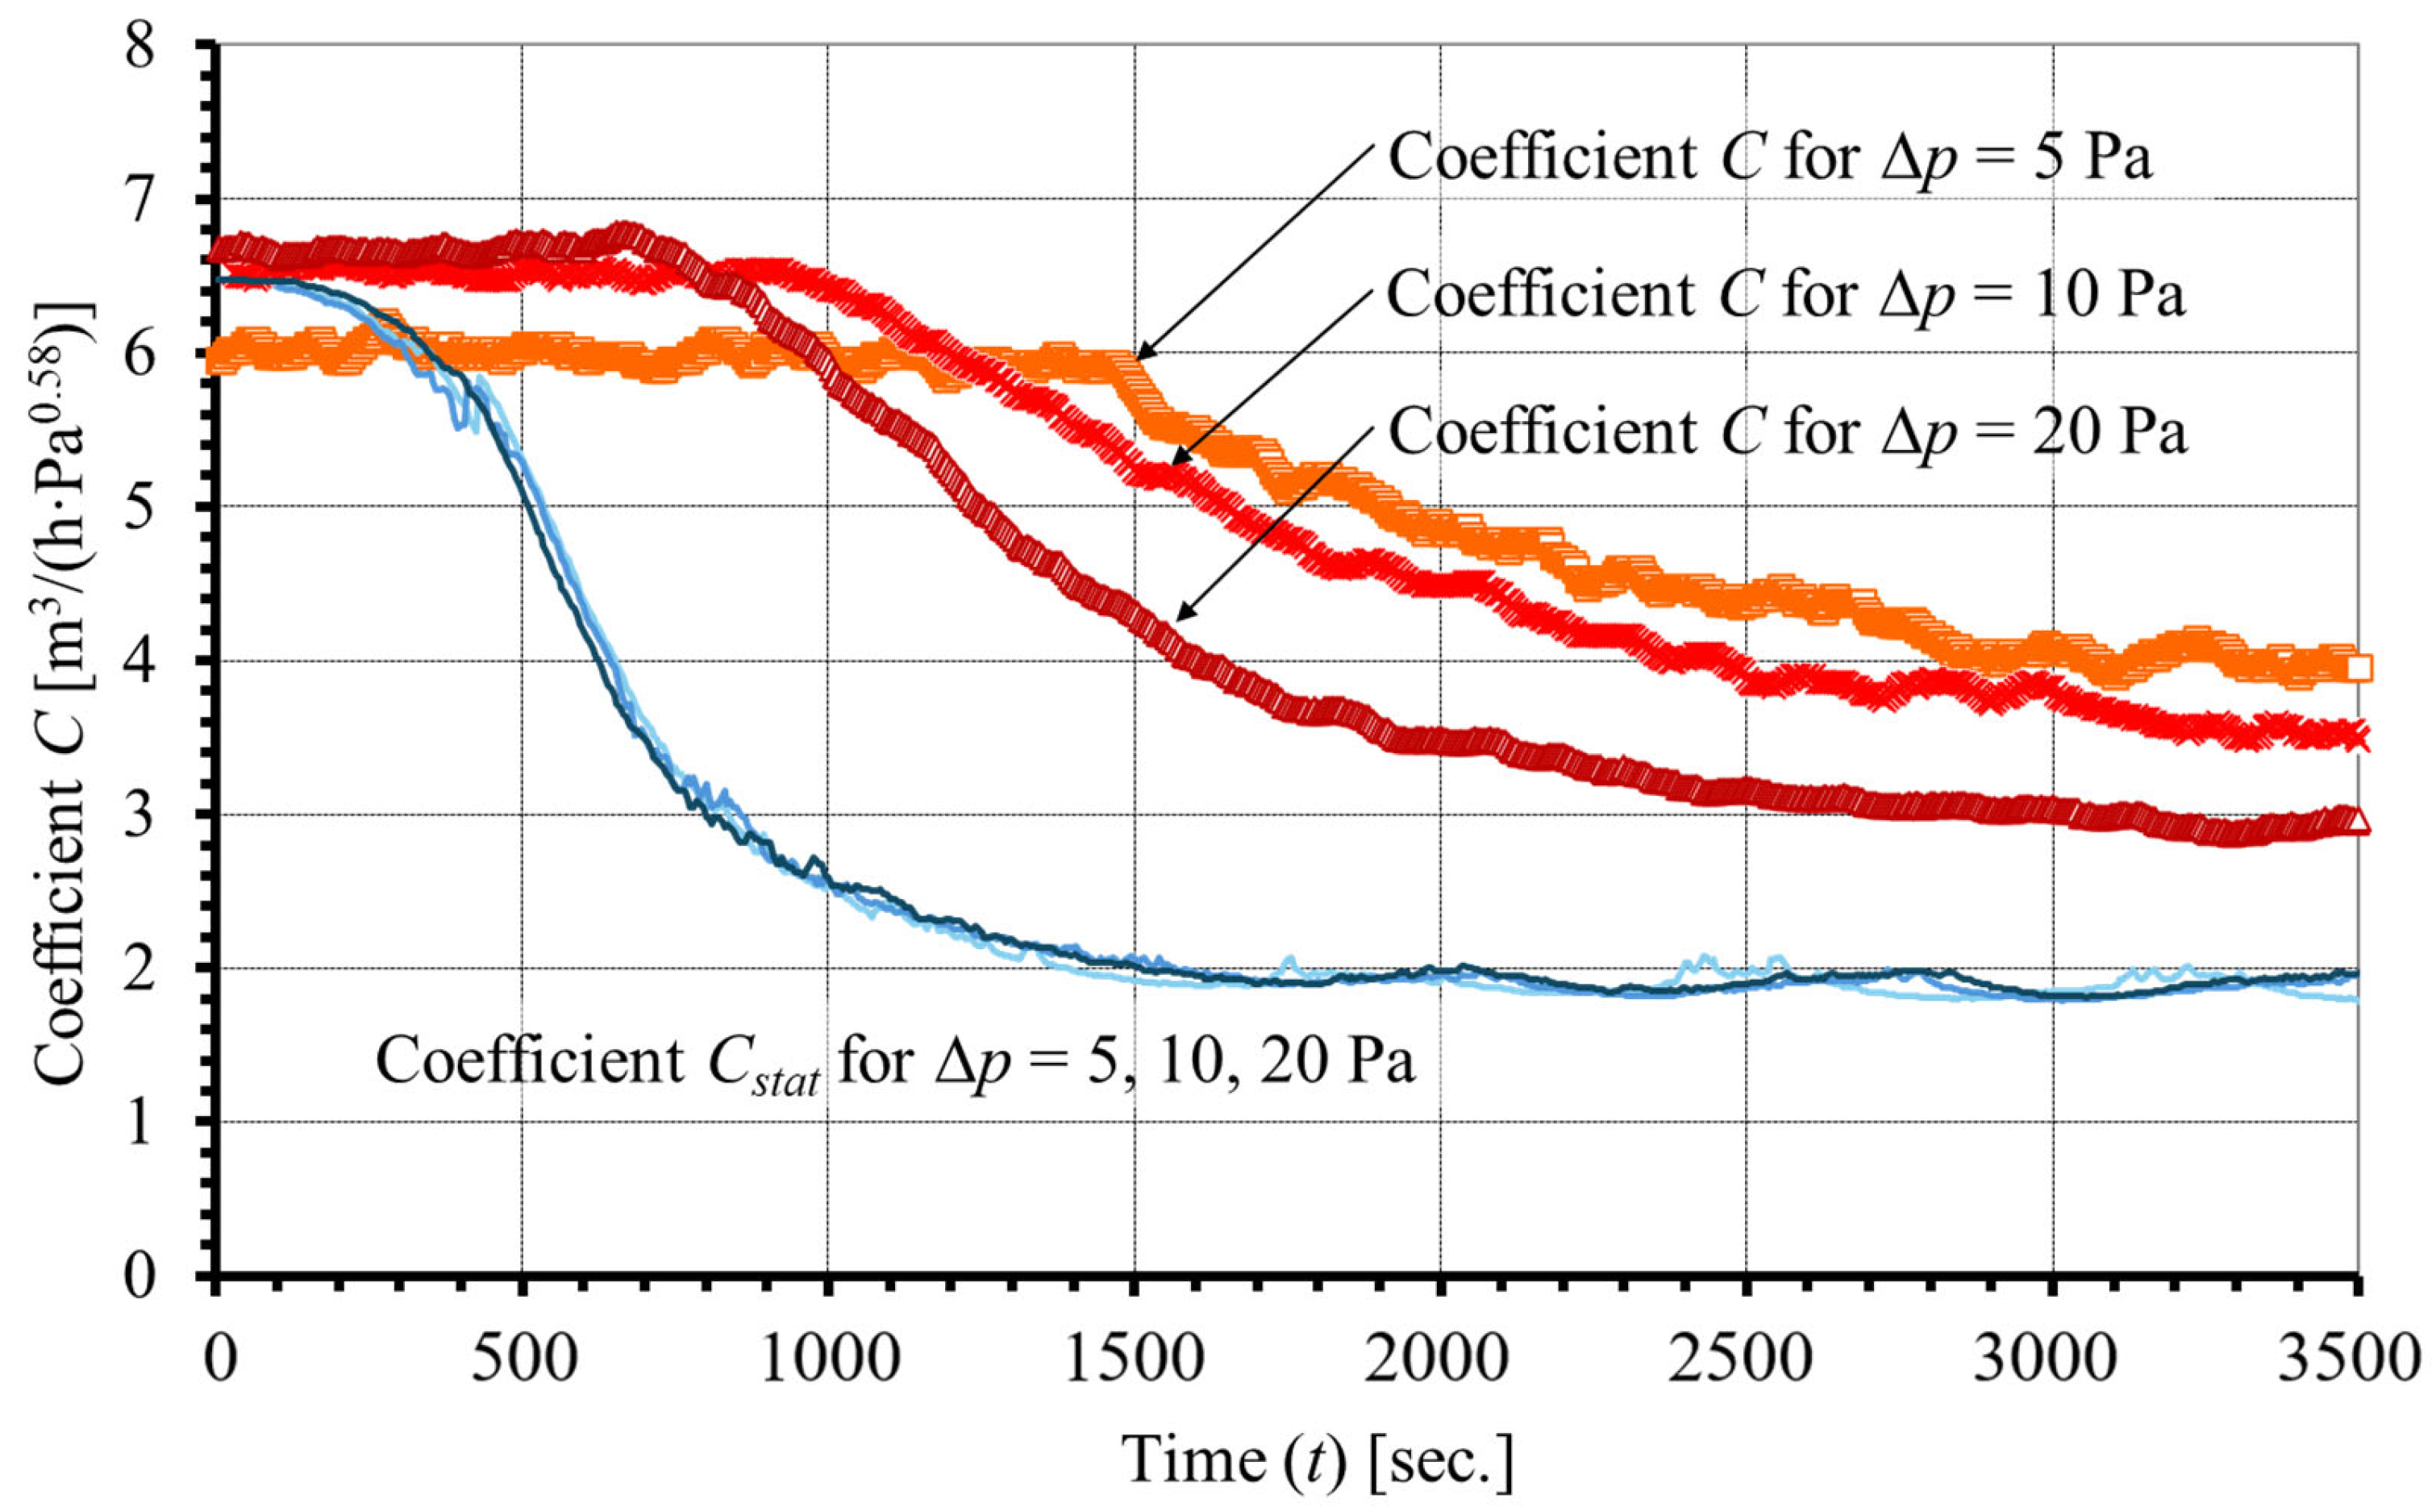
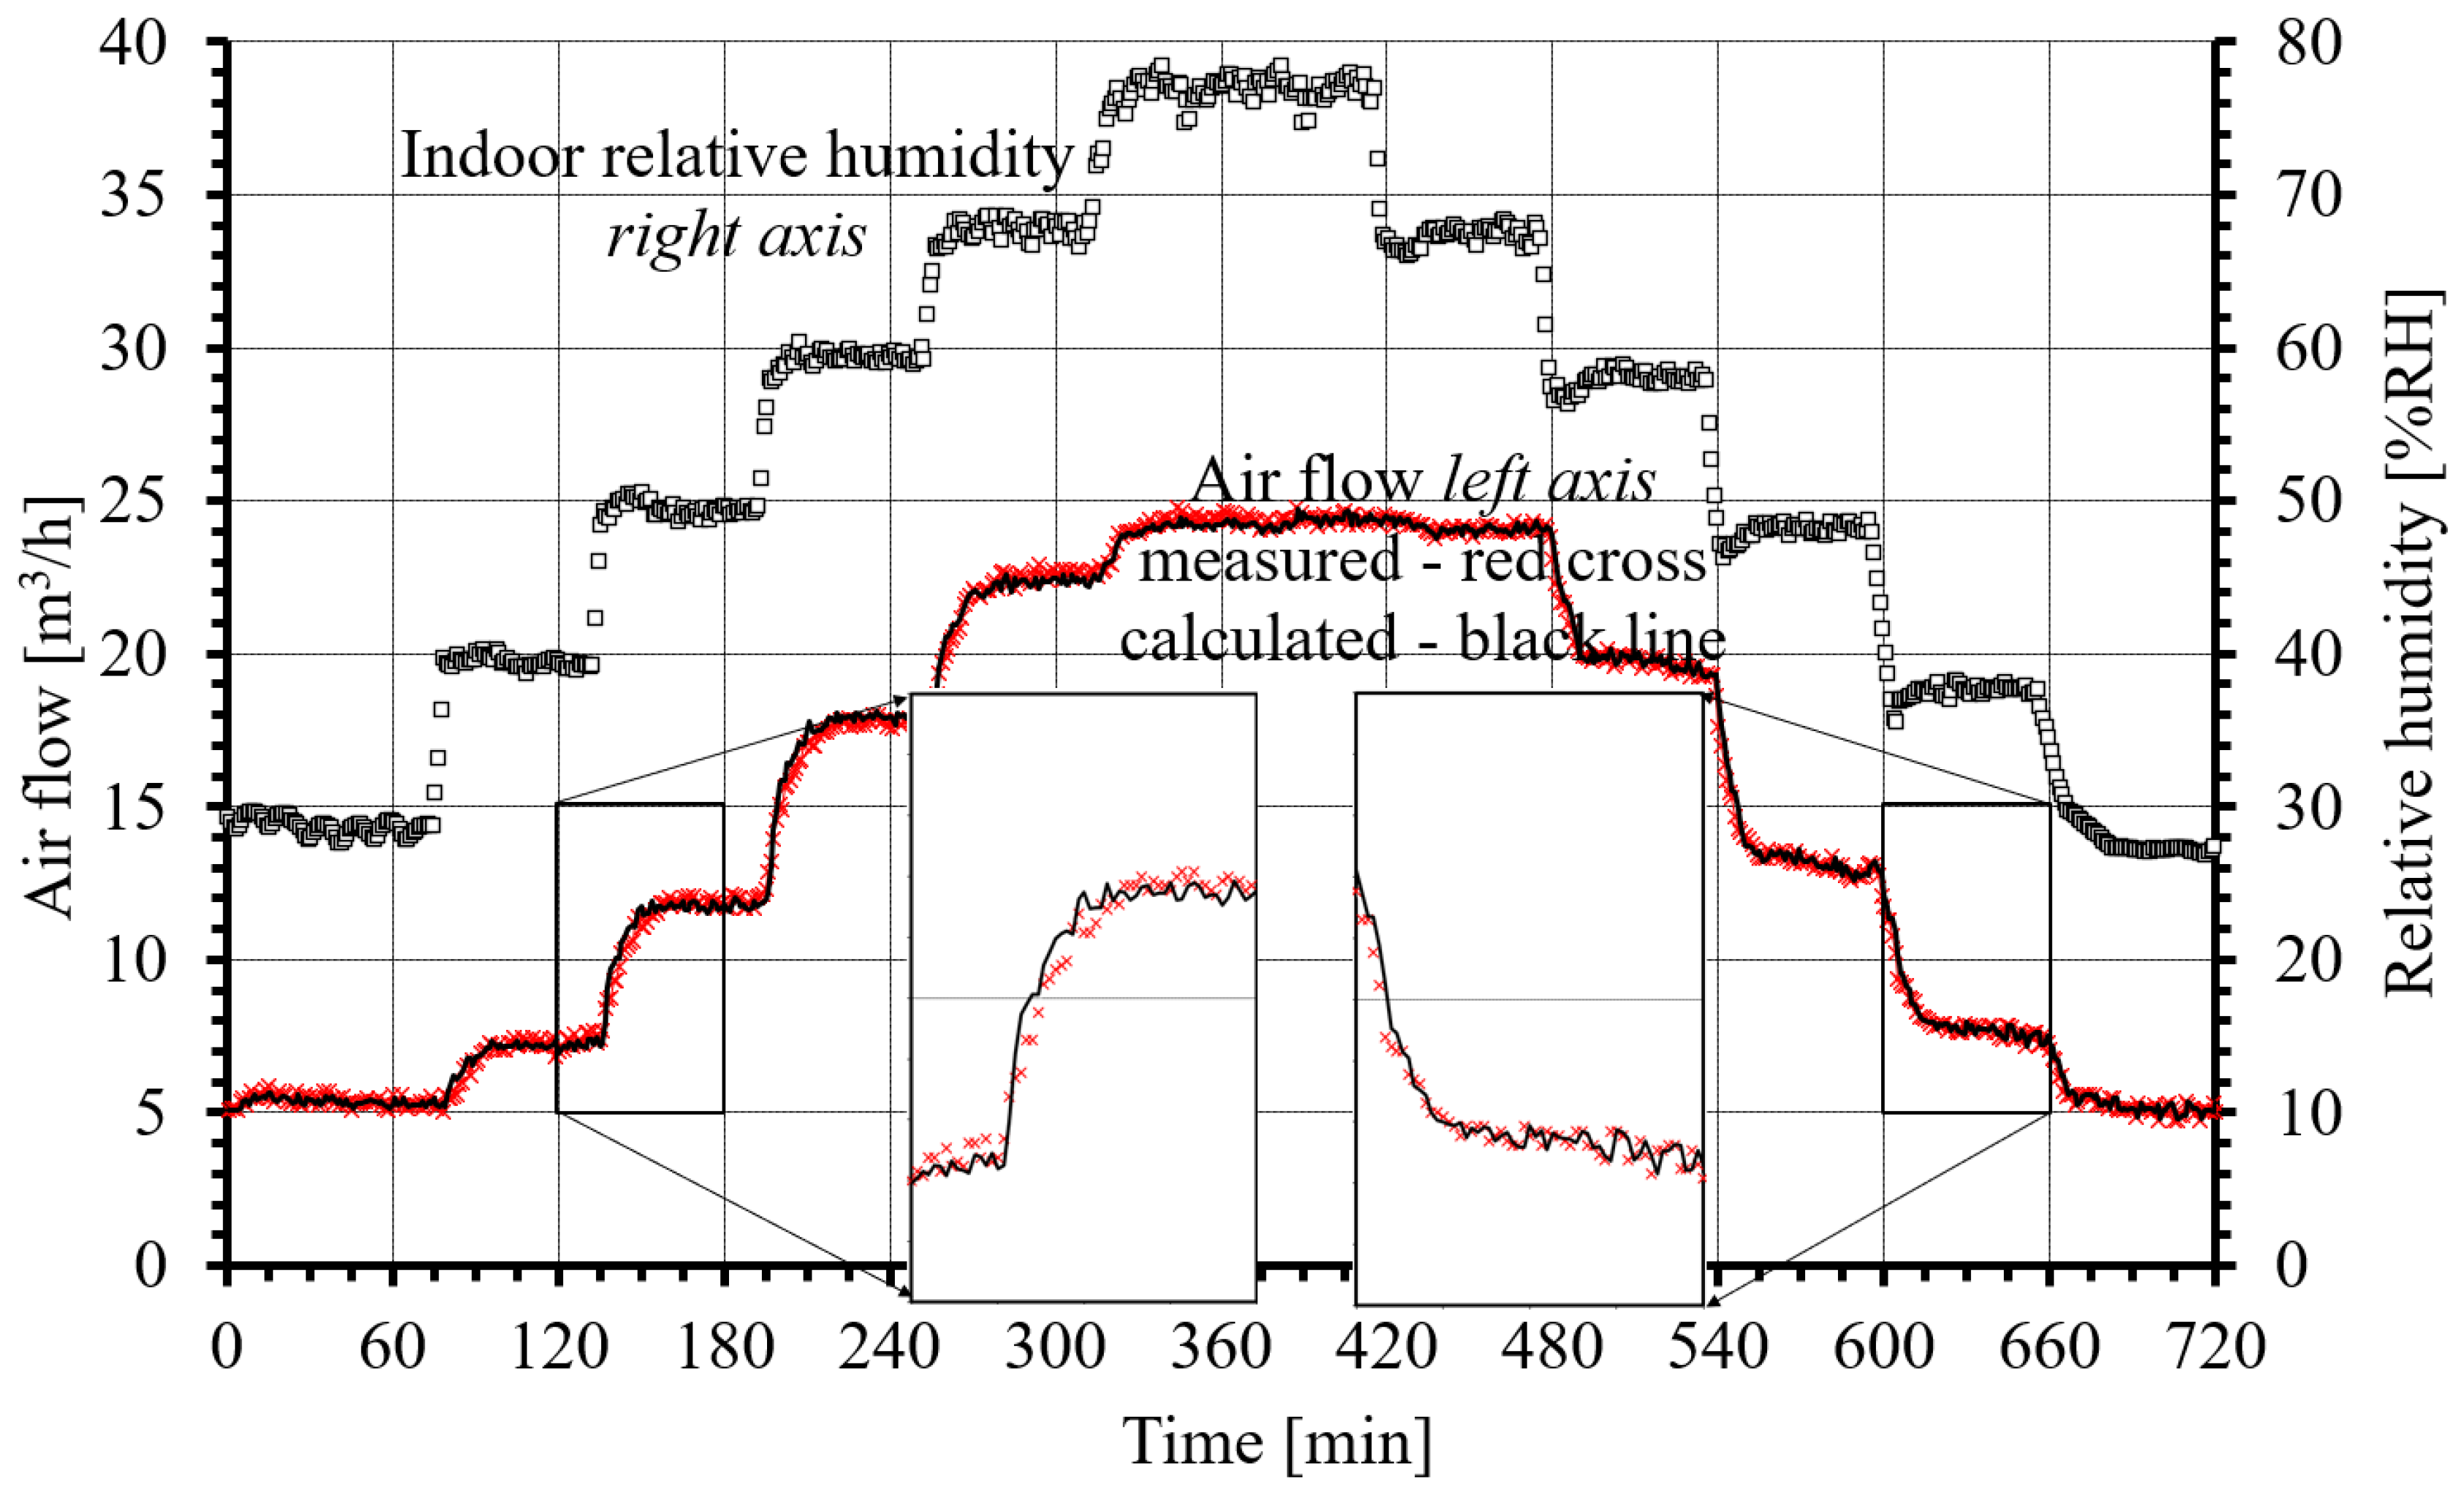
  • Measuring series III: Measurement of the time series (sampling time 5 s) of the airflow through the air inlet at a step increase and decrease in indoor relative humidity at a pressure drop at the air inlet of 5, 10, 20 Pa, an indoor temperature of 21.5 °C, and a temperature before the air inlet of 10 °C. The measurement results are shown in Figure 5 and Figure 6.
Data from measurement series I–III were the basis for developing steady-state and dynamic characteristics of a humidity-sensitive air inlet.

3. Results

3.1. Steady-State Properties

The steady-state properties were calculated based on the first series of measurements (Figure 2) using the method of least squares. For a fully open air inlet (φi above 70%RH), the following relation was obtained:
V = 5.95 · p 0.573 ( with   R 2 = 0.999 )
while for a partially closed air inlet (φi below 35%RH), the following was obtained:
V = 2.06 · p 0.616 ( with   R 2 = 0.999 )
However, assuming a constant value of the exponent n for both cases, Equations (2) and (3) lead to the following relationships:
V = 5.74 · p 0.58 ( with   R 2 = 0.995 )
V = 2.31 · p 0.58 ( with   R 2 = 0.995 )
This assumption increases the inaccuracy expressed in the sum of squares of residues by 12%, corresponding to a change in the average square error from 0.29 m3/h to 0.31 m3/h (in the range of 1 ÷ 45 Pa). The value of n was chosen to be 0.58 to minimalize the relative error with an increase in the C value; i.e., for larger airflow values, it is proportionally smaller. Considering the benefits of making the exponent n independent of other parameters, the increase in inaccuracy presented above (on average of 0.02 m3/h) is acceptable. The calculation results are illustrated in Figure 7.
The next issue is determining the relationship C = f(φi)p =const under steady-state conditions. The following equation was used for describing this relationship:
C = e u 0 · φ s + u 1 1 + e u 0 · φ s + u 1 · u 2 + u 3
where
  • φs—The relative humidity of air resulting from the moisture content of the indoor air and the air temperature surrounding the polyamide tape Ts (relationship (7)).
  • u—The coefficient vector.
The polyamide tape regulating the air inlet opening reacts to the air’s relative humidity resulting from the indoor air’s moisture content and the air temperature surrounding the tape, Ts. This temperature can be determined by the following relationship [14]:
T s = T i 0.25 · T
Taking into account relationship (7), the results of the second measurement series were calculated using the method of least squares, and the following coefficients of Equation (6) were obtained:
  • u0 = −13.63; u1 = 7.36; u2 = 5.27; and u3 = 6.51 for increasing the relative humidity value.
  • u0 = −15.03; u1 = 7.55; u2 = 5.27; and u3 = 6.51 for decreasing the relative humidity.
  • u0 = −14.00; u1 = 7.33; u2 = 5.27; and u3 = 6.51 without distinguishing the indoor air’s increase or decrease in relative humidity.
The results of the calculations are shown in Figure 8.

3.2. Dynamic Properties

Taking into account Equation (1), dynamic properties may result from changes in parameter C or changes in the pressure difference. From a practical point of view, reactions to changes in ∆p are immediate, while the dynamic properties associated with parameter C (previously determined for steady-state conditions) may be relevant.
Trying to eliminate information that did not affect the dynamics of the process from the results of the third measurement series (Figure 5 and Figure 6), the following were calculated:
  • The relative humidity of the indoor air was recalculated to C values corresponding to the steady-state conditions (Equation (6)).
  • The airflow (V) flowing through the air inlet to the Cstat values corresponding to the pressure difference (relationships (4), (5)).
The above calculation allows us to determine the input signal as Cstat values and output signals as C values at 5, 10, and 20 Pa. The calculation results are shown in Figure 9 and Figure 10.
Figure 9 and Figure 10 show that while the differences in the response signal for 5, 10, and 20 Pa are not significant when the relative humidity in the room increases and the forcing signal decreases, the response signal depends on the pressure difference at the air inlet. Moreover, it can be seen that the forcing signal is approximately of an order of at least II, while the response signals are at least of an order of III with a delay.
The ARMA model with a delay was selected for the description of dynamic properties presented above. The order of the model is at least first, with a signal sampling time of 1 min. The general equation of such a model can be written as follows [33]:
C t = k = 1 r a k · C t k · t + k = 1 r b k · C s t a t t k · t d
where
  • Cstat—Coefficient C, calculated for steady-state conditions (Equation (6)).
  • t—The time moment (sampled time: 1 min).
  • r—The model order.
  • d—The delay time, min.
  • a, b—Coefficients.
The method of least squares was used, and the following values of the parameters of Equation (8) were obtained:
  • For an increase in the indoor relative humidity:
    r = 1.
    d = 3 min.
    a1 = 0.620.
    b0 = 0.497; b1 = −0.177.
  • For an decrease in the indoor relative humidity:
    r = 1.
    d = 65.7∙(∆p)−1 + 5.00; rounded to the nearest integer; for example, for ∆p = 5 Pa, d = 18 min, ∆p = 10 Pa, d = 12 min, ∆p = 20 Pa, and d = 8 min.
    a1 = 0.970.
    b0 = 0.0177∙∆p + 0.0638; b1 = −0.0177∙∆p − 0.0338.

3.3. Flow Characteristics

Defining Equations (6) and (8) together with the previously calculated coefficients allows us to define Equation (1) for dynamic indoor relative humidity increase and decrease scenarios. The complete equation describing the considered properties of a hydrosensitive air inlet is
V t =     a 0 · V t t p t t 0.58 + k = 0 1 b k · e u 0 · φ s t k · t d + u 1 1 + e u 0 · φ s t k · t d + u 1 · u 2 + u 3     · p t 0.58
where
  • φs—The relative humidity of the air, resulting from the moisture content of the indoor air and the air temperature surrounding the polyamide tape Ts (relationship (7)).
  • a, b, u, d—The coefficient vectors determined in Section 3.1 and Section 3.2, in general being functions of ∆p and the direction of change φi (increase or decrease in the indoor relative humidity).

4. Discussion

Equation (9) was verified using the previously unused results from the second measurement series. The verification results are illustrated in Figure 11. The chart presents the time series of the indoor relative humidity and the airflow through the real air inlet, together with the airflow calculated from relationship (9).
Due to the complex nature of relationship (9), it is interesting to find the simplifications and corresponding errors.
The first possible simplification may be omitting the dependence of the coefficient b and delay d on the pressure drop (∆p) across the air inlet (b and d’s values should then correspond to the ∆p typical for the operating conditions of a particular air inlet) and omitting the hysteresis. Relationship (9), for ∆p = 10 Pa (the reference value for available data used in verification) will then take the following form:
V t = (     0.795 · V t t p t t 0.58 + + 0.368 · e 14.0 · φ s t 7 · t + 7.33 1 + e 14.0 · φ s t 7 · t + 7.33 · 5.27 + 6.51 +   0.163 · e 14.0 · φ s t 8 · t + 7.33 1 + e 14.0 · φ s t 8 · t + 7.33 · 5.27 + 6.51   · p t 0.58
Continuing to simplify relation (10), the description of the dynamic properties can be omitted. This will allow us to simplify Equation (10) to the following form:
V = e 14.0 · φ s + 7.33 1 + e 14.0 · φ s + 7.33 · 5.27 + 6.51 · p t 0.58
The values of errors that are made when describing the flow characteristics for each of relationships (9), (10), and (11) are presented in Table 1.
The results summarized in Table 1 confirm the fact that the most accurate flow characteristics of the air inlet are described by relationship (9). Notably, a small loss of accuracy is caused by the use of Equation (10). In both cases, the errors in determining V are below the error of the measuring devices. When commenting on the effect of relationship (11), attention should be paid to not including the description of dynamic properties. Therefore, the results of verification largely depend on the course of the verification data variability. Therefore, these data should be as close as possible to the characteristic humidity conditions for internal rooms, and, of course, the time series of indoor relative humidity presented in Figure 11 (which was used for verification) does not meet this requirement.

5. Conclusions

Based on the measurements, the following can be stated:
  • The air inlet reacts to changes in relative humidity of the air (surrounding the polyamide tape) in the range from 30% RH (20% opening of the air inlet) to about 75% RH, which corresponds to the maximum opening.
  • There is a hysteresis in the course of the V = f(φi)p =const characteristic, which can be seen in Figure 8.
The dynamic properties of the air inlet (the response of the airflow to a step change in the indoor relative humidity) satisfactorily describe the first-order ARMA model with a delay (the input signal to the model are C values corresponding to the steady-state conditions for a given humidity). The delay is about 3 min for increasing the indoor relative humidity and slightly depends on the pressure drop. The delay is from 8 (for ∆p = 20 Pa) to 18 min (for ∆p = 5 Pa) for a relative humidity decrease.
The proposed relationships are characterized by high accuracy in determining V, but verification should be continued and take into account the dynamics of the typical course of the indoor relative humidity.
The presented equations describing the flow characteristics of the humidity-sensitive air inlet may be useful input data for simulating humidity-controlled ventilation, for example in CONTAM 3.4 [26] software. This should significantly improve comparative analyses of different types of ventilation, including smart ones [4,5,7,8,10,11,34].

Author Contributions

Conceptualization, M.M.; methodology, M.M.; validation, M.M. and P.N.; investigation, M.M. and P.N.; data curation, M.M.; writing—original draft preparation, M.M.; writing—review and editing, M.M. and P.N.; visualization, M.M. and P.N.; funding acquisition, M.M. and P.N. All authors have read and agreed to the published version of the manuscript.

Funding

This paper was co-financed under a research grant from the Warsaw University of Technology supporting the scientific activity in the discipline of Civil Engineering, Geodesy and Transport and Environmental Engineering, Mining and Energy.

Data Availability Statement

The raw data supporting the conclusions of this article will be made available by the authors on request.

Conflicts of Interest

The authors declare no conflicts of interest.

References

  1. Jardinier, L. Humidity sensitive system is 20 years old. In Proceedings of the 23rd AIVC Conference, Washington, DC, USA, 12–14 October 2003. [Google Scholar]
  2. Savin, J.L.; Jardinier, M. Humidity controlled exhaust ventilation in moderate climate. AIVC VIP 2009, 31, 12. [Google Scholar]
  3. Guyot, G.; Walker, I.; Sherman, M.H. Performance based approaches in Standards and Regulations for smart ventilation in residential buildings: A summary review. Int. J. Vent. 2018, 18, 96–112. [Google Scholar] [CrossRef]
  4. Guyot, G.; Leprince, V.; Poirier, B.; Kolarik, J. State-of-the art on the use of performance-based approaches for residential ventilation in 2024. REHVA Eur. HVAC J. 2025, 62, 16–19. [Google Scholar]
  5. Andrade, R.; Guyot, G. IEQ and energy performance of residential smart ventilation strategies in France. In Proceedings of the 44th AIVC 12th TightVent & 10th Venticool Conference “Retrofitting the Building Stock: Challenges and Opportunities for Indoor Environmental Quality “, Dublin, Ireland, 9–10 October 2024. [Google Scholar]
  6. Woloszyn, M.; Kalamees, T.; Abadie, M.; Steeman, M.; Sasic Kalagasidis, A. The effect of combining a relative-humidity-sensitive ventilation system with the moisture-buffering capacity of materials on indoor climate and energy efficiency of buildings. Build. Environ. 2009, 44, 515–524. [Google Scholar] [CrossRef]
  7. Miracco, G.; Nicoletti, F.; Ferraro, V.; Kaliakatsos, D. Innovative Mechanical Ventilation Control for Enhanced Indoor Air Quality and Energy Efficiency. Energy Eng. 2025, 122, 861. [Google Scholar] [CrossRef]
  8. Psomas, T.; Teli, D.; Langer, S.; Wahlgren, P.; Wargocki, P. Indoor humidity of dwellings and association with building characteristics, behaviors and health in a northern climate. Build. Environ. 2021, 198, 107885. [Google Scholar] [CrossRef]
  9. Liu, P.; Alonso, M.J.; Mathisen, H.M.; Halfvardsson, A. Understanding the role of moisture recovery in indoor humidity: An analytical study for a Norwegian single-family house during heating season. Build. Environ. 2023, 229, 109940. [Google Scholar] [CrossRef]
  10. Poirier, B.; Guyot, G.; Woloszyn, M. Uncertainty quantification: For an IAQ and energy performance assessment method for smart ventilation strategies. Build. Environ. 2024, 266, 112115. [Google Scholar] [CrossRef]
  11. Tognon, G.; Marigo, M.; De Carli, M.; Zarrella, A. Mechanical, natural and hybrid ventilation systems in different building types: Energy and indoor air quality analysis. J. Build. Eng. 2023, 76, 107060. [Google Scholar] [CrossRef]
  12. Mijakowski, M.; Sowa, J. An attempt to improve indoor environment by installing humidity-sensitive air inlets in a naturally ventilated kindergarten building. Build. Environ. 2017, 111, 180–191. [Google Scholar] [CrossRef]
  13. Cho, H.; Cabrera, D.; Sardy, S.; Kilchherr, R.; Yilmaz, S. Evaluation of performance of energy efficient hybrid ventilation system and analysis of occupants’ behavior to control windows. Build. Environ. 2021, 188, 107434. [Google Scholar] [CrossRef]
  14. Jardinier, L.; Jardinier, M.; Savin, J.L.; Siret, F. Hygrothermal behavior of a humidity controlled air inlet. In Proceedings of the 23rd AIVC Conference, Washington, DC, USA, 12–14 October 2003. [Google Scholar]
  15. Parekh, A.; Ruest, K.; Lemoine, Y. Operating characteristics and performance of the AERECO humidity-controlled ventilation system. In Phase II: Monitoring and Performance Analisis, Efficiency and Alternative Energy Technology Branch Energy, Mines and Resources Canada; Scanada Consultants Ltd.: Ottawa, ON, Canada, 1990. [Google Scholar]
  16. Berthin, S.; Savin, J.L.; Jardinier, M. Measurements on humidity controlled ventilation systems in 55 occupied apartments. In Whole Building Heat, Air and Moisture Response; Publications and Work Reports, Annex 41; Aereco S.A.: Collégien, France, 2007. [Google Scholar]
  17. Guyot, G. Lessons learned from a ten-year monitoring in residential buildings equipped with humidity based demand controlled ventilation in France. In Proceedings of the 40th AIVC Conference ”From Energy Crisis to Sustainable Indoor Climate 40 Years of AIVC”, Ghent, Belgium, 15 October 2019; Available online: https://hal.science/hal-02348874v1 (accessed on 17 May 2025).
  18. Guyot, G.; Jardinier, E.; Parsy, F.; Berthin, S.; Roux, E.; Charrier, S. Smart Ventilation Performance Durability Assessment: Preliminary Results from a Long-Term Residential Monitoring of Humidity-Based Demand-Controlled Ventilation. In Proceedings of the IAQ 2020: Indoor Environmental Quality Performance Approaches Transitioning from IAQ to IEQ, AIVC-ASHRAE, Athens, Greece, 14–16 September 2020. [Google Scholar]
  19. Mélois, A.; Legree, M.; Rios Mora, S.; Depoorter, J.; Jardinier, E.; Berthin, S.; Parsy, F.; Guyot, G. Durability of humidity-based ventilation components after 13 years of operation in French residential buildings-Assessment of components performance in laboratory. Energy Build. 2023, 292, 113154. [Google Scholar] [CrossRef]
  20. Woloszyn, M.; Shen, J.; Mordelet, A.; Brau, J. Numerical simulations of energy performance of a ventilation system controlled by relative humidity. In Proceedings of the AIVC Conference ‘Ventilation in Relation to the Energy Performance of Buildings’, Brussels, Belgium, 21–23 September 2005. [Google Scholar]
  21. Sowa, J.; Mijakowski, M. Humidity-Sensitive, Demand-Controlled Ventilation Applied to Multiunit Residential Building-Performance and Energy Consumption in Dfb Continental Climate. Energies 2020, 13, 6669. [Google Scholar] [CrossRef]
  22. Savin, J.L.; Laverge, J. Demand-controlled ventilation: An outline of assessment methods and simulations tools. In Proceedings of the AIVC & TIGHTVENT, Montreal, QC, Canada, 12–13 October 2011. [Google Scholar]
  23. Van Den Bossche, N.; Janssens, A.; Heijmans, N.; Wouters, P. Performance Evaluation of Humidity-Controlled Ventilation Strategies in Residential Buildings. In Proceedings of the Buildings X Conference, Clearwater Bach, FL, USA, 2–7 December 2007; Oak Ridge National Laboratory: Oak Ridge, TN, USA, 2007. [Google Scholar]
  24. Baptiste, P.; Jakub, K.; Guyot, G.; Woloszyn, M. Design of residential ventilation systems using performance-based evaluation of Indoor Air Quality: Application to a Danish study case. E3S Web Conferences. 2022, 362, 09004. [Google Scholar] [CrossRef]
  25. Poirier, B.; Guyot, G.; Woloszyn, M.; Geoffroy, H.; Ondarts, M.; Gonze, E. Development of an assessment methodology for IAQ ventilation performance in residential buildings: An investigation of relevant performance indicators. J. Build. Eng. 2021, 43, 103140. [Google Scholar] [CrossRef]
  26. Dols, W.S.; Polidoro, B.J. CONTAM User Guide and Program Documentation, Version 3.4; NIST Technical Note 1887; National Institute of Standards and Technology: Gaithersburg, MD, USA, August 2020; Section Airflow Element Types; pp. 52–54. [Google Scholar] [CrossRef]
  27. Mijakowski, M.; Sowa, J. Modelowanie wilgotności względnej powietrza w budynkach – możliwości i ograniczenia programu CONTAMW 3.0. Fiz. Budowli w Teor. i Praktyce 2011, VI, 79–84. [Google Scholar]
  28. Sowa, J.; Mijakowski, M. Whole year simulation of humidity based demand controlled hybrid ventilation in multiapartment building. In Proceedings of the 32nd AIVC Conference “Towards Optimal Airtightness Performance”, Brussels, Belgium, 12–13 October 2011. [Google Scholar]
  29. Heim, D.; Miszczuk, A. Modelling building infiltration using the airflow network model approach calibrated by air-tightness test results and leak detection. Build. Serv. Eng. Res. Technol. 2020, 41, 681–693. [Google Scholar] [CrossRef]
  30. Directive 2010/31/EU of the European Parliament and of the Council of 19 May 2010 on the Energy Performance of Buildings (Recast). Available online: https://eur-lex.europa.eu/legal-content/EN/TXT/?uri=OJ:L:2010:153:TOC (accessed on 3 April 2025).
  31. Directive (EU) 2023/1791 of the European Parliament and of the Council of 13 September 2023 on Energy Efficiency and Amending Regulation (EU) 2023/955 (Recast) (Text with EEA Relevance). Available online: https://eur-lex.europa.eu/legal-content/EN/TXT/?uri=OJ:L:2023:231:TOC (accessed on 3 April 2025).
  32. Ventilation and Infiltration. In 2009 ASHRAE Handbook Fundamentals; American Society Of Heating Refrigerating And Air-Conditioning Engineers: Atlanta, GA, USA, 2009; Chapter 16.
  33. Janiszowski, K. Podstawy Wyznaczania Opisu I Sterowania Obiektów Dynamicznych; Wydawnictwo Politechniki Warszawskiej: Warszawa, Poland, 2008. [Google Scholar]
  34. Jonge De, K.; Ghijsels, J.; Laverge, J. Energy savings and exposure to VOCs of different household sizes for three residential smart ventilation systems with heat recovery. Energy Build. 2023, 290, 113091. [Google Scholar] [CrossRef]
Figure 1. Installation diagram of the air inlet, together with the most important symbols.
Energies 18 03444 g001
Figure 2. Measurement results: air inlet flow characteristics.
Energies 18 03444 g002
Figure 3. Measurement results: dependence of the airflow on humidity with a constant pressure drop across the air inlet for Ti = Te = 21.5 °C.
Energies 18 03444 g003
Figure 4. Measurement results: dependence of the airflow on the humidity with a constant pressure drop across the air inlet for Ti = 21.5 °C and Te = 10.0 °C.
Energies 18 03444 g004
Figure 5. Measurement results: time series of the airflow through the air inlet during the increase in indoor relative humidity.
Energies 18 03444 g005
Figure 6. Measurement results: time series of the airflow through the air inlet during the decrease in indoor relative humidity.
Energies 18 03444 g006
Figure 7. Power law model of airflow.
Energies 18 03444 g007
Figure 8. Coefficient C as a function of indoor relative humidity φs (formula (6)).
Energies 18 03444 g008
Figure 9. Input signal (Cstat) and output signals (C at 5, 10, and 20 Pa) for the step increase in φi from 30 to 70%RH.
Energies 18 03444 g009
Figure 10. Input signal (Cstat) and output signals (C at 5, 10, and 20 Pa) for the step decrease in φi from 70 to 30%RH.
Energies 18 03444 g010
Figure 11. Time series of measured indoor relative humidity and airflow, together with calculated airflow.
Energies 18 03444 g011
Table 1. List of errors for describing flow characteristics according to Equations (9)–(11).
ParameterValue for Equation (9)Value for Equation (10)Value for Equation (11)
Residuum sum of squares4219464521,950
Mean square error, [m3/h]0.6990.7331.594
Average value of absolute value of residuum, [m3/h]0.5170.5841.168
Maximum of absolute value of residuum, [m3/h]2.9453.0786.587
Standard deviation of the absolute value of residuum, [m3/h]0.4700.4431.084
Coefficient R20.9910.9900.954
Disclaimer/Publisher’s Note: The statements, opinions and data contained in all publications are solely those of the individual author(s) and contributor(s) and not of MDPI and/or the editor(s). MDPI and/or the editor(s) disclaim responsibility for any injury to people or property resulting from any ideas, methods, instructions or products referred to in the content.

