Abstract
Rooftop photovoltaic (PV) panel systems have become a key component in green building design, driven by new building sustainability measures advocated worldwide. The shading generated by the rooftop PV panel arrays can impact their annual heating and cooling load, as well as their overall thermal performance. This paper presents a long-term experimental investigation into the changes in roof temperature caused by PV panels. The experiment was conducted over the course of a year, with measurements taken on four sample days each month. The study is based on measurements of the covered roof temperature, the uncovered roof temperature, PV surface temperature, ambient air temperature, as well as solar irradiation, wind speed, and rainfall. The results reveal that the annual energy savings (MJ/m2) in the cooling load due to the covered roof are about 26% higher than the energy loss from the heating load due to shading. The study shows that the effect of the rooftop PV panels on the house’s total heating and cooling load savings is between 5.3 to 6.1%. This difference is significant in thermal performance analyses, especially if most of the roof is covered by PV panels.
1. Introduction
Residential applications of PV systems have increased significantly over the last decade, with most installations placed on dwelling roofs that receive the highest solar irradiation. Recent studies have shown that rooftop PV systems can affect passive thermal performance due to the roof shading provided by the PV panel installation. Numerous studies conducted in different climates have demonstrated that PV panels significantly influence heating and cooling loads by altering roof surface temperatures, heat fluxes, and internal thermal gains.
A simulation model was developed to assess the cooling load and heat loads associated with an inclined PV roof structure [1]. The study found that installing rooftop PV panels can reduce the cooling load by up to 35% for the specific roof design analyzed. Key factors influencing the building’s thermal and energy performance included the air gap between the PV panels and the roof surface, as well as the roof’s inclination angle. In a separate study, Kotak et al. [2] used a computer simulation to investigate the impact of rooftop PV panels on the cooling load of a flat-roofed house. Their findings also indicated a notable reduction in cooling load due to the shading effect provided by the PV panels. However, their heat transfer model did not account for insulation on the roof or ceiling beneath the PV array.
Dominguez et al. [3] modelled the effect of solar PV panels on roof heat transfer using experimental data from California. The results revealed that daytime ceiling temperatures beneath PV arrays were about 2.5 K cooler than parts of the ceiling below the uncovered roof, with a significant reduction in roof heat flux. At night, the effect was reversed, where the ceiling beneath the panels had a higher temperature than the ceiling below the exposed roof. The simulations indicated that installing PV panels on the roof could reduce the building’s cooling load by 38%.
In Greece, Kapsalis and Karamanis [4] investigated the effect of rooftop PV panels on a building’s energy demand. They found that PV panel shading reduced the cooling load by 17.8% but increased the heating load by 6.7%. During the day, the exposed roof temperature was 8.3–12.9 °C lower than the roof covered with PV panels, while at night, it was 1.7–4 °C higher, depending on the season. Buonomano et al. [5] conducted a simulated study in Italian cities to evaluate the integration of hybrid solar panels PVT into building envelopes and their effect on heating and cooling loads. They found that PVT panels had a passive effect on the building’s thermal performance, leading to higher cooling demands and lower heating demands. Wang et al. [6] investigated the shading effects of PV panels (flat and tilted) on building energy consumption and roof thermal performance through a single-day experiment in Shaanxi, China. The study revealed that PV panel shading significantly reduced cooling loads while slightly increasing heating loads compared to the uncovered roof. The heat gain through flat and tilted overhead PV roofs was reduced by 67.1 and 59%, respectively. Furthermore, the daily cooling load of the flat overhead PV roof decreased by 77.4%, while that of the tilted overhead PV roof was reduced by 69.4%.
In Australia, Odeh S. [7] assessed the thermal performance of dwellings at various sites. The study found that in cooler climates, such as Sydney and Melbourne, PV panel shading could increase heating loads during winter by blocking solar radiation from reaching the roof. In hotter climates like Townsville, however, the shading effect significantly reduced cooling loads, resulting in substantial energy savings. The analysis indicated that the overall change in cooling and heating loads due to PV panel addition to the roof ranged from 5 to +8%, depending on the building orientation and site climate.
Shukla et al. [8] carried out an experimental study in New Mexico, showing that daily peak heat flow through the attic ceiling was almost halved when the PV panels were added. The rooftop tiles’ temperature under the panels was up to 13 °C lower than the exposed roof, and heat flow to the conditioned space was reduced by 49%.
Barone et al. [9] developed a thermal performance model analyzing three PV and PV/T system configurations on a building façade in Italy. The results showed that solar collection devices decreased heating loads while increasing cooling loads. In Arizona, Brown et al. [10] examined the effects of PV rooftop panels on building cooling demand and sensible heat flux for a white-roof house model. They found that PV panels could cause an air conditioning energy penalty, with cooling load increases equivalent to 11% of the total electricity generated by the panels. The increase was more pronounced when panels were positioned closer to the roof.
Pandiaraj et al. [11] investigated the heat gain variation in buildings with PV panels in four Indian cities through modeling and experimental measurements. They found that roof-mounted PV panels significantly reduced cooling loads, with infrared imaging showing a 2.5 °C reduction in ceiling temperatures beneath the panels, consistent with Dominguez et al. [3]. Bhuvad and Udayraj [12] studied the annual reduction in roof temperatures due to PV panels experimentally in Raipur, India, and numerically compared with the results in multiple other Indian cities, finding roof and ceiling temperature reductions between 6 and 11 °C and annual cooling load reductions between 70% and 94%.
Ma et al. [13] created a numerical model to analyze rooftop PV panel heat transfer, validated with summer data from Wuhan, China. Shading by tilted PV panels on flat black roofs reduced heat flux by 41.7% and daily indoor heat gain by 74.8%. Vakilinezhad and Ziaee [14] studied the combined effect of PV panel shading and roof materials in Iran. They found that PV shading was most effective on roofs with high solar absorption and low thermal resistance. In warm climates, shading reduced cooling loads, while in cold and moderate climates, it increased heating loads. Zhan et al. [15] investigated the thermal and energy performance of photovoltaic and green roofs in hot-humid climates in China. They found that PV panels enhanced thermal performance compared to conventional roofs, increasing interior surface temperatures by up to 0.4 °C and reducing daily total heat gain by 29.0–39.2%.
The summary of the reviewed literature presented in Table 1 indicates that roof shading by PV panels has both advantages and disadvantages, depending on the building’s climate zone. In warm climates, roof shading enhances thermal performance by reducing cooling loads. In contrast, in cold climates, it may impair thermal performance due to an increase in heating loads. The literature review also highlights a research gap regarding the impact of rooftop shading on building thermal performance, particularly in relation to seasonal variations in weather and their effects on heating and cooling loads.

Table 1.
Summary of literature review findings.
The primary research question of this study is the following: what percentage reduction or increase in cooling and heating loads due to PV panel installation leads to a significant change in building thermal performance and star rating assessment? Additionally, how does this change compare, as a percentage, to the annual energy output of the PV panels?
These questions will be addressed by analyzing long-term temperature measurements of roofs with and without PV panel coverage. The experimental data are then applied to a heat transfer equation and compared with the results of a thermal performance software to estimate the annual impact of rooftop PV panels on cooling and heating loads.
2. Materials and Methods
2.1. Rooftop Experiment Settings
A rooftop PV system located at Sydney latitude (33.87°) facing north, revealed by the yellow rectangle in Figure 1, was selected for the experiment settings for data measurements. The experiment was conducted over the course of a year by averaging the measurements over 10 min each time. Four sample days of each month were used for the sake of analysis and comparison between different months. One of the major elements in this experimental work is to find the effect of weather conditions on roof temperature under and outside the rooftop PV panels.
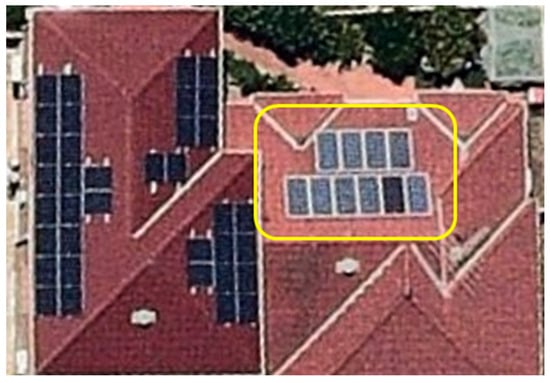
Figure 1.
Rooftop system used for the experiment settings.
Three wireless (INKBIRD IBSTH1) sensors were used to measure the temperature of the PV surface, the roof tiles covered by the PV panel, and the uncovered roof tiles. These three sensors are located on the same roof, highlighted in Figure 1. Other weather data for the location, such as wind speed in m/s, solar irradiation in W/m2, rainfall in mm, and ambient temperature in °C, have also been collected on-site or from local weather stations.
2.2. Roof Thermal Resistance
To study the effect of shading on the house thermal performance, the total thermal resistance of the roof structure setting used in this work is estimated using the roof structure components’ thermal resistances specified in Figure 2 and Table 2 [16].
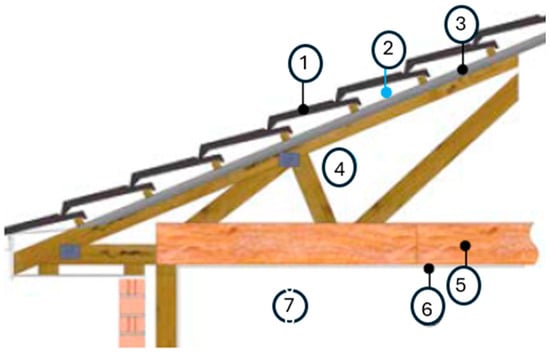
Figure 2.
Roof structure components.
Table 2.
Thermal resistance of the roof structure components.
2.3. Heating and Cooling Load
To estimate the heating and cooling load change due to the rooftop PV installation, the heat transfer rate through the roof structure of Figure 2 is estimated by using the conventional heat transfer rate equation [17], as follows:
where
- —Heat flux (W/m2)
- —Overall heat transfer coefficient (W/m2 °C)
- —Temperature difference between the roof tile and the inner air space (T1–T7)
The inner air space temperature is assumed to be controlled at an average of 21 °C by the air conditioning system throughout the year.
To estimate the overall heat transfer coefficient (, the total thermal resistance (Rt) of the roof structure is estimated from Table 2 using Equation (2),
Rt = R1 + R2 + R3 + R4 + R5 + R6 + R7
The difference in Rt between winter and summer is due to the combined effects of temperature, moisture, material properties, and heat transfer mechanisms.
Where R is the Thermal resistance (m2 °C/W).
Therefore,
Referring to Table 2, the values of U for summer and winter are found to be 0.22 and 0.18 W/m2·°C, respectively.
The total daily heat loss and heat gain (Wh/m2) from the roof were estimated by using the measured temperatures for the covered and uncovered roof for each 10-min (1/6 h) time step and integrating q in Equation (1) for 24 h; therefore,
or
where
- ∆t—Time step 1/6 h (10 min step)
- —Daily heat loss or heat gain from the roof in (Wh/m2).
3. Long-Term Measurements and Results
The Effect of Different Weather Conditions on Roof Temperatures
The effect of weather conditions on the covered roof is investigated across different seasons. A four-day sample of data from the summer and winter seasons is presented in Figure 3 and Figure 4. It is evident that changes in wind speed and rainfall have a significantly lesser impact on the covered roof temperature compared to solar irradiation and ambient temperature. Overall, the roof temperature trend closely follows that of solar irradiation and ambient temperature. However, it is clear that the temperatures of both the covered and uncovered roofs are not significantly affected by instantaneous changes in weather conditions, due to the thermal capacity of the roof tiles. Figure 3 and Figure 4 also show that the temperature difference between the covered and uncovered roofs is greater during the daytime than at night, with this difference being more pronounced on summer days.
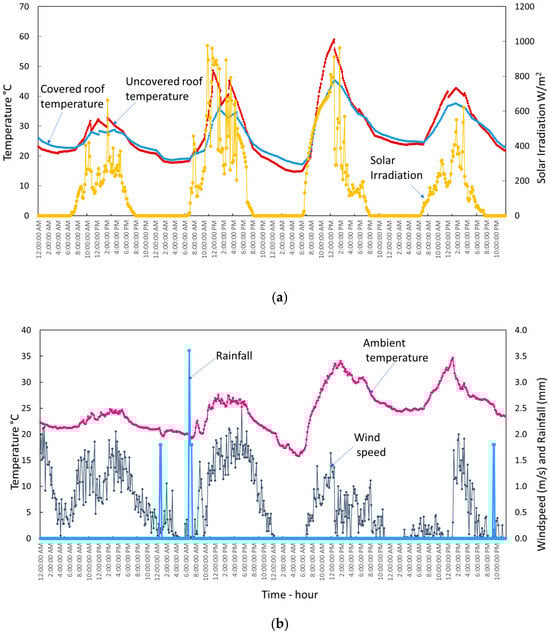
Figure 3.
Roof temperature variation with weather conditions, summer days in January; (a) Total solar irradiation and roof temperature; (b) Ambient temperature, rainfall, and windspeed.
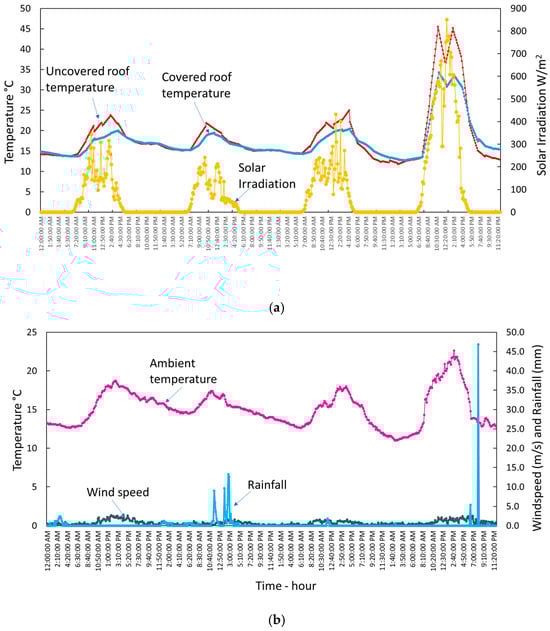
Figure 4.
Roof temperature variation with weather conditions, winter days in August; (a) Total solar irradiation and roof temperature; (b) Ambient temperature, rainfall, and windspeed.
A sample day was selected from each season to show the change in temperature difference between the uncovered and covered roof during the 24 h. Figure 5 shows that the maximum temperature difference takes place at midday in all seasons. However, after sunset, the temperature of the covered roof becomes higher than that of the uncovered roof, which explains the negative values shown in Figure 5. The main reason for this behavior is the reduced heat loss through long-wave infrared radiation from the covered roof during nighttime. The distance between the PV panel and the roof surface is approximately 10 cm, providing shading during the day and reducing the roof temperature. Conversely, at night, the PV panel captures infrared radiation emitted from the roof and reflects it back to the roof surface. In contrast, the uncovered roof exchanges heat directly with the sky without any obstruction, which allows the roof surface to lose more heat. Figure 5 reveals that the maximum difference between the uncovered and covered roof temperatures in daytime ranges between 5 °C in winter and 20 °C in summer, while the difference becomes much lower at night and ranges between 1 °C in winter and 3 °C in summer. From above, we can conclude that there are pros and cons when having a covered roof with PV panels. In summer daytime, the drop in roof temperature reduces the heat transfer rate toward the inner space of the building and hence reduces the required cooling load. However, the reduction in the cooling rate of the covered roof would cause an increase in cooling load during the night hours. Contrary to the summer season, in winter, an increase in heating load could be reported during daytime, affected by the shaded area of the roof that is experiencing lower solar heat gain or lower heat transfer rate toward the inner spaces of the building. To investigate the effect of the rooftop PV panels on the heating and cooling load of the building, a long-term analysis of the energy gained and lost by the roof is conducted and presented in Figure 6. The figure elaborates on the changes in the annual energy consumption by cooling and heating that could happen when installing rooftop panels. The energy savings and energy lost in Figure 6 are plotted against the monthly mean of maximum and minimum ambient temperature extracted from [18]. Energy savings in space cooling are taking place in the months where the maximum mean monthly ambient temperature is higher than the space setting temperature (21 °C). The amount of annual energy saved in space cooling due to the covered roof by the PV panels is found to be around 4.6 MJ/m2, as noted by the positive area of the curve in Figure 6. Contrary to that, the covered roof has a negative impact on energy consumption for space heating, which causes a loss of 2.7 MJ/m2, noted by the negative area of the curve in Figure 6. As a result of these changes in energy consumption in cooling and heating seasons, the annual energy saving is the difference between the saved energy in cooling and the increased energy in heating and found to be around 1.9 MJ/m2 of the roof, which means that the annual energy savings in the cooling load due to the covered roof are about 26% higher than the energy loss from the heating load due to shading.
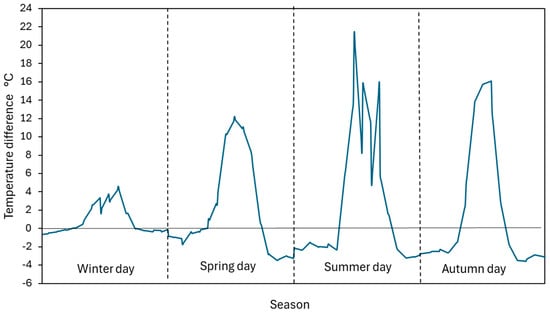
Figure 5.
The temperature difference between the uncovered and covered roof during the sample day of different seasons.
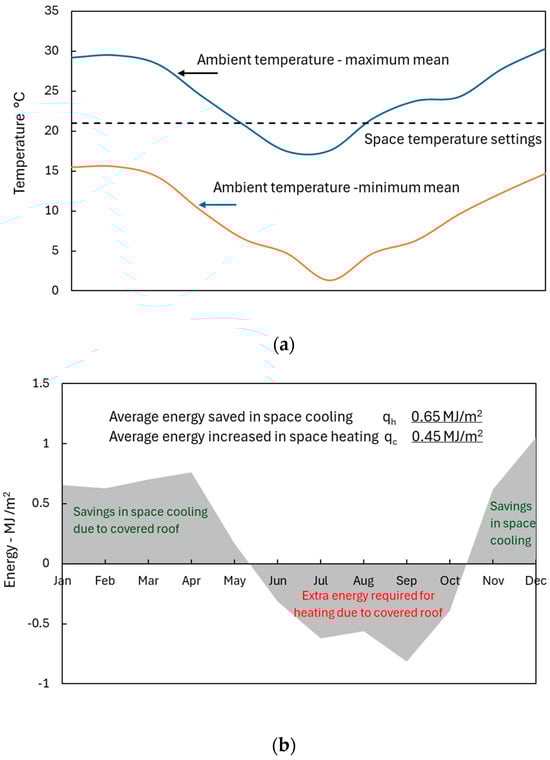
Figure 6.
Energy savings and energy loss due to the covered roof by the PV panels, (a) Ambient and space temperatures, (b) Energy saving and energy loss.
4. Case Study
The experimental results for the heat loss and heat gain of a roof with a PV panel system were used to evaluate their impact on the heating and cooling load of different house designs, utilizing the Accurate Sustainability software (Version 2.4.3.21 SP1) [19]. This software is approved by the Australian Nationwide House Energy Rating Scheme (NatHERS) and is used to assess the thermal performance of houses. It simulates heat transfer within buildings and predicts annual space heating and cooling energy consumption. The complete design of three houses of different floor and roof areas is used in the simulation to find the heating and cooling load (Qh and Qc) for each design. The simulation was conducted at the same latitude and within the same climate zone, with the roof oriented to face north (in line with the sun’s path in the southern hemisphere). Key results, including the thermal performance star ratings, are summarized in Table 3. The values of Qh and Qc are estimated per square meter of the conditioned floor area for the house.
Table 3.
Heating and cooling loads of different house designs (without PV panels).
The NatHERS scheme provides star ratings (out of 10) based on the total annual energy consumption required for space heating and cooling, as illustrated in the graph in Figure 7. The curve becomes more exponential at higher star values, meaning even a slight change in the total annual energy load could move a house from a one-star rating to a higher one. The current minimum star rating for new homes, as set by the Australian National Code [20], is 7 stars. Figure 7 shows the star rating locations of the sample designs provided in Table 3, highlighting that a small decrease in annual energy consumption could shift a rating of 6.8 up to or beyond 7 stars.
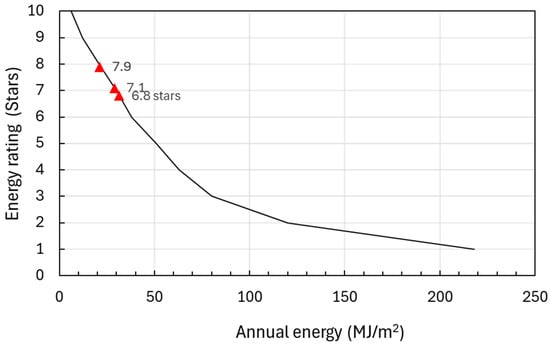
Figure 7.
NatHERS home star rating.
The experimental results on the effect of rooftop PV panels on roof temperature were used to estimate the changes in heating and cooling loads for the different houses designs presented in Table 3. The calculations assumed a uniform roof orientation facing north and a roof insulation value of R4. The following equations were used to estimate new values of Qh and Qc for a house with rooftop PV roof,
where
- Qh,pv—Heating load for rooftop PV house MJ/m2 of conditioned floor area.
- Qc,pv—Cooling load for rooftop PV house MJ/m2 of conditioned floor area.
- Qh—Heating load for house without PV panels, MJ/m2 of conditioned floor area.
- Qc—Cooling load for house without PV panels, MJ/m2 of conditioned floor area.
- Acond—Conditioned floor area (m2).
- Aroof—Roof area covered by PV panels (m2).
- —Energy increased in space heating MJ/m2 of the rooftop PV area.
- —Energy saved in space cooling MJ/m2 of the rooftop PV area.
The differences between roofs with and without PV panels are presented in Figure 8 for the various house floor areas. Although all the houses were assessed within the same climate zone, the heating and cooling loads exhibit different behaviors due to the variations in design and structural materials for each house. Some houses require more energy for space cooling than for space heating (houses 2 and 3), while others display the opposite behavior (house 1). However, applying Equations (6) and (7) reveals that adding PV panels to a roof with an insulation value of R4 has a significant effect on the annual energy load. This is explained by a decrease in space cooling load and an increase in heating load, resulting in a total energy load reduction between 5.3% to 6.1%. This reduction in the total annual energy load due to the inclusion of the PV shading in the thermal analysis could change the star rating of a house. For example, house 1 in Table 3 shows a total energy load dropping below 30 MJ/m2 (see Figure 8), which raised its star rating from 6.8 to above 7 stars, as explained in Figure 7, making it meet the national rating standard.
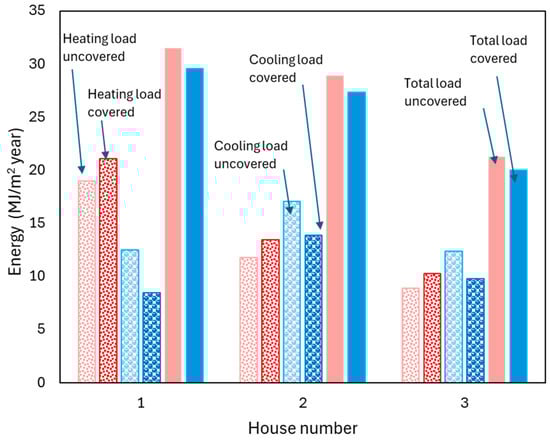
Figure 8.
Change in heating and cooling load for houses with covered and uncovered roofs with PV panels.
The annual energy yield of the rooftop PV system was estimated using Sunny Design software [21], based on the same roof design and climatic conditions. The results show that the change in heating and cooling loads due to the installation of rooftop PV panels is very minor (approximately 0.2%) compared to the energy output of the PV system (820 MJ/m2). This finding reinforces the benefits of rooftop PV installations in buildings and demonstrates that any impact on thermal performance is negligible.
5. Conclusions
This study investigated the impact of rooftop PV panel shading on the thermal behavior of roofs and the resulting changes in the heating and cooling loads of houses. Experimental data collected over the course of a year in Sydney revealed that rooftop PV panels significantly reduce roof surface temperatures during the daytime between 5 and 20 °C, which falls within the same range described by [3,8,11,12], particularly in summer, by providing shading. Conversely, at night, covered roofs exhibit slightly higher temperatures (1–3 °C) than uncovered ones due to reduced long-wave radiation losses. Simulations using the Accurate Sustainability software demonstrated that for houses with R4-insulated roofs, rooftop PV panels decrease the cooling load in summer but increase the heating load in winter, resulting in a net annual energy load reduction of 5.3–6.1%. When comparing the findings of this study with those presented in Table 1 of the literature review, a strong alignment was found with the results of studies [1,2,3,4,6,7,8,9,12,13,14,15], particularly regarding the reduction in heat gain and cooling load resulting from rooftop PV installations.
While the experimental results showed clear temperature differences between covered and uncovered roofs, the effect on the annual energy load of houses was found to be minor if the northern side roof area covered with PV panels is small. Furthermore, the design of some house roofs does not allow enough area for significant PV installation, which could limit the shading effect of the PV panels. Nonetheless, even these minor energy savings can be significant when scaled across star ratings and building sustainability measures. These findings suggest that while rooftop PV systems primarily contribute to renewable electricity generation, their impact on the thermal performance of houses can be relatively significant if the majority of the roof area is covered with PV panels and should be considered alongside other energy efficiency measures in sustainable building design.
Future experimental work could be conducted at different latitudes and with various roof structures to develop a general correlation that could be used in thermal performance software to estimate the impact of rooftop PV panel shading on the thermal behavior of roofs.
Author Contributions
Conceptualization, S.O.; Methodology, S.O.; Formal analysis, L.P.; Investigation, L.P.; Data curation, S.O.; Writing—original draft, S.O. and L.P. All authors have read and agreed to the published version of the manuscript.
Funding
This research received no external funding.
Data Availability Statement
The original contributions presented in the study are included in the article, further inquiries can be directed to the corresponding author.
Conflicts of Interest
The authors declare no conflict of interest.
Nomenclatures
| Acond | Conditioned floor area (m2) |
| Aroof | Roof area covered by PV panels (m2) |
| Heat flux (W/m2) | |
| Energy increased in space heating MJ/m2 of the rooftop PV area | |
| Energy saved in space cooling MJ/m2 of the rooftop PV area | |
| Daily heat loss or heat gain from the roof in (Wh/m2) | |
| Qc | Cooling load for house without PV panels, MJ/m2 of conditioned floor area |
| Qc,pv | Cooling load for rooftop PV house MJ/m2 of conditioned floor area |
| Qh | Heating load for house without PV panels, MJ/m2 of conditioned floor area |
| Qh,pv | Heating load for rooftop PV house MJ/m2 of conditioned floor area |
| R | Thermal resistance (m2 °C/W) |
| Overall heat transfer coefficient (W/m2.°C) | |
| ∆t | Time step |
| Temperature difference between the roof tile and the inner air space |
References
- Yang, H.; Zhu, Z.; Burnett, J.; Lu, L. A Simulation Study on the Energy Performance of Photovoltaic Roofs. ASHRAE Trans. 2001, 107, 129–135. [Google Scholar]
- Kotak, Y.; Gago, E.J.; Mohanty, P.; Muneer, T. Installation of Roof-Top Solar PV Modules and their Impact on Building Cooling Load. Build. Serv. Eng. Res. Technol. 2014, 35, 613–633. [Google Scholar] [CrossRef]
- Dominguez, A.; Kleissl, J.; Luvall, J.C. Effects of solar photovoltaic panels on roof heat transfer. Sol. Energy 2011, 85, 2244–2255. [Google Scholar] [CrossRef]
- Kapsalis, V.; Karamanis, D. On the effect of roof added photovoltaics on building’s energy demand. Energy Build. 2015, 108, 195–204. [Google Scholar] [CrossRef]
- Buonomano, A.; Calise, F.; Ferruzzi, G.; Palombo, A. Innovative technologies for NZEBs: An energy and economic analysis tool and a case study of a non-residential building for the Mediterranean climate. Energy Build. 2016, 121, 318–343. [Google Scholar] [CrossRef]
- Wang, Y.; Wang, D.; Liu, Y. Study on comprehensive energy-saving of shading and photovoltaics of roof added PV module. Energy Procedia 2017, 132, 598–603. [Google Scholar] [CrossRef]
- Odeh, S. Thermal Performance of Dwellings with Rooftop PV Panels and PV/Thermal Collectors. Energies 2018, 11, 1879. [Google Scholar] [CrossRef]
- Shukla, N.; Kapsis, K.; Castleberry, K.; Townsend, T.; Mamishev, A. Thermal impact of adhesive-mounted rooftop PV on underlying roof shingles. Sol. Energy 2018, 174, 957–966. [Google Scholar] [CrossRef]
- Barone, G.; Buonomano, A.; Forzano, C.; Palombo, A. Passive and active performance assessment of building integrated hybrid solar photovoltaic/thermal collector prototypes: Energy, comfort, and economic analyses. Energy 2020, 209, 118435. [Google Scholar] [CrossRef]
- Brown, K.E.; Baniassadi, A.; Pham, J.V.; Sailor, D.J.; Phelan, P.E. Effects of Rooftop Photovoltaics on Building Cooling Demand and Sensible Heat Flux Into the Environment for an Installation on a White Roof. J. Eng. Sustain. Build. Cities 2020, 1, 021001. [Google Scholar] [CrossRef]
- Pandiaraj, S.; Thirumaran, R.; Pandian, A.T.; Ravichandran, R.; Easwaran, R.; Chandran, S.; Subramaniam, U. A study of solar heat gain variation in building applied photovoltaic buildings and its impact on environment and indoor air quality. Energy Sources Part A Recovery Util. Environ. Eff. 2022, 44, 6192–6212. [Google Scholar] [CrossRef]
- Bhuvad, S.S.; Udayraj, N. Investigation of annual performance of a building shaded by rooftop PV panels in different climate zones of India. Renew. Energy 2022, 189, 1337–1357. [Google Scholar] [CrossRef]
- Ma, Z.; Gao, X.; Sun, J.; Wang, Y.; Li, W. Shading effect and energy-saving potential of rooftop photovoltaic on the top-floor room. Sol. Energy 2023, 265, 112099. [Google Scholar] [CrossRef]
- Vakilinezhad, R.; Ziaee, N. Assessing the combined effect of PV panels’ shading and cool materials on building energy loads in different climates. Environ. Dev. Sustain. 2023, 6, 16201–16221. [Google Scholar] [CrossRef]
- Zhan, Q.; Ma, Y.; Lin, Z.; Yin, S.; Xiao, Y. Comparative experimental study on the thermal and energy performance of photovoltaic and green roofs in hot-humid climates. Build. Environ. 2025, 271, 112587. [Google Scholar] [CrossRef]
- Insulation Council of Australia and New Zealand. Insulation Handbook, Part 1: Thermal Performance, Version 3; ICANZ: Melbourne, Australia, 2016; pp. 10–33. [Google Scholar]
- Holman, J.P. Heat Transfer, 10th ed.; McGraw-Hill: New York, NY, USA, 2010. [Google Scholar]
- Bureau of Meteorology. Climate Data Online. Available online: http://www.bom.gov.au/climate/data/ (accessed on 25 May 2025).
- Commonwealth Scientific and Industrial Research Organisation (CSIRO). AccuRate Sustainability, Version 2.4.3.21 SP1; CSIRO Publishing: Clayton, Australia, 2019.
- National Construction Code. Housing Energy Efficiency Handbook; Version 1.1; Australian Building Codes Board: Canberra, Australia, 2024; p. 10. [Google Scholar]
- SMA Solar Technology AG. Sunny Design Software, Version 5.92.1; SMA Solar Technology AG: Niestetal, Germany, 2025.
Disclaimer/Publisher’s Note: The statements, opinions and data contained in all publications are solely those of the individual author(s) and contributor(s) and not of MDPI and/or the editor(s). MDPI and/or the editor(s) disclaim responsibility for any injury to people or property resulting from any ideas, methods, instructions or products referred to in the content. |
© 2025 by the authors. Licensee MDPI, Basel, Switzerland. This article is an open access article distributed under the terms and conditions of the Creative Commons Attribution (CC BY) license (https://creativecommons.org/licenses/by/4.0/).