Article

Waste to Biofuel: Process Design and Optimisation for Sustainable Aviation Fuel Production from Corn Stover

Department of Chemical Engineering, University College London, Torrington Place, London WC1E 7JE, UK
*
Author to whom correspondence should be addressed.
Energies 2025, 18(13), 3418; https://doi.org/10.3390/en18133418
Submission received: 18 May 2025 / Revised: 5 June 2025 / Accepted: 25 June 2025 / Published: 29 June 2025
(This article belongs to the Special Issue Biomass and Waste-to-Energy for Sustainable Energy Production)

Abstract

Addressing the urgent need to decarbonise aviation and valorise agricultural waste, this paper investigates the production of Sustainable Aviation Fuel (SAF) from corn stover. A preliminary evaluation based on a literature review indicates that among various conversion technologies, fast pyrolysis (FP) emerged as the most promising option, offering the highest fuel yield (22.5%) among various pathways, a competitive potential minimum fuel selling price (MFSP) of 1.78 USD/L, and significant greenhouse gas savings of up to 76%. Leveraging Aspen Plus simulation, SAF production via FP was rigorously designed and optimised, focusing on the heat integration strategy within the process to minimise utility consumption and ultimately the total cost. Consequently, the produced fuel exceeded the American Society for Testing and Materials (ASTM) limit for the final boiling point, rendering it unsuitable as a standalone jet fuel. Nevertheless, it achieves regulatory compliance when blended at a rate of up to 10% with conventional jet fuel, marking a practical route for early adoption. Energy optimisation through pinch analysis integrated four hot–cold stream pairs, eliminating external heating, reducing cooling needs by 55%, and improving sustainability and efficiency. Economic analysis revealed that while heat integration slashed utility costs by 84%, the MFSP only decreased slightly from 2.35 USD/L to 2.29 USD/L due to unchanging material costs. Sensitivity analysis confirmed that hydrogen, catalyst, and feedstock pricing are the most influential variables, suggesting targeted reductions could push the MFSP below 2 USD/L. In summary, this work underscores the technical and economic viability of corn stover-derived SAF, providing a promising pathway for sustainable aviation and waste valorisation. While current limitations restrict fuel quality during full substitution, the results affirm the feasibility of SAF blending and present a scalable, low-carbon pathway for future development.

1. Introduction

Fossil fuels have dominated global energy systems for over two centuries, providing accessible and economical energy sources. However, their pervasive utilisation has precipitated significant environmental degradation through greenhouse gas (GHG) emissions and pollutants affecting terrestrial, aquatic, and atmospheric systems.
The 2015 Paris Agreement established critical climate targets: limiting global temperature increases to well below 2 °C above pre-industrial levels while pursuing efforts to restrict warming to 1.5 °C. However, the World Meteorological Organization (WMO)’s State of the Global Climate reported that 2024 was the first full year with a global average temperature more than 1.5 °C above pre-industrial levels (1850–1900), which made it the hottest year in the 175 years of recorded data [1]. Current global warming is already fuelling more dangerous heatwaves, extreme rainfall, severe droughts, melting of glaciers, and rising sea levels. With projections of annual global temperatures for 2025 to 2029 estimated to range from 1.2 °C to 1.9 °C above the 1850–1900 average, urgent actions must be taken to combat escalating global warming [1].
Despite the overwhelming global temperature rise, global efforts to mitigate GHG emissions are accelerating, driven by international agreements, technological innovations, and increased public awareness [2]. Among all sectors, the aviation industry is considered the hardest to decarbonise due to its reliance on high-temperature processes and energy-dense fuels. The aviation sector faces immense pressure to decarbonise, as it contributes approximately 2.5% of global GHG emissions annually [3], with its projected growth posing significant challenges for global emission reduction targets. The International Air Transport Association (IATA) target to achieve net-zero CO2 in the aviation sector by 2050 calls for rigorous transformative shifts in energy production and consumption patterns for this hard-to-abate sector [4]. Unlike other transport sectors, direct electrification and hydrogen propulsion remain largely impractical for long-haul flights, making Sustainable Aviation Fuel (SAF) a critical pathway to achieving net-zero emissions.
Bioenergy systems like SAF production from biomass offer promising pathways to decarbonise the aviation sector by providing renewable alternatives to conventional jet fuels while also mitigating the global waste accumulation problem. Within this context, the type and source of biomass, together with the production pathway, largely determine the real sustainability of SAFs. Hence, careful selection of the feedstock and pathway is required to optimise the system to achieve its full potential.
Various feedstocks have been explored for SAF production, and they are broadly categorised into four generations based on the type of feedstock used for their production. Mainly leveraging their abundance, cost-effectiveness, and sustainability, this study focused on second-generation biofuel feedstocks, which are produced from non-food-based feedstocks (e.g., municipal solid waste (MSW) and agricultural residues), as opposed to the first, third, and fourth generations, which compete with food supplies (e.g., food crops), face scarcity and scalability challenges (e.g., oils and microalgae), and are genetically engineered (e.g., electro-biofuels), respectively. While second-generation biofuel feedstocks like MSW and food waste present unique advantages, agricultural residues appear promising due to their abundance, low cost, and minimal land-use change impact.
Agricultural waste is an abundant waste, with approximately 5 billion tons of residues generated annually [5]. Its generation peaks during harvest seasons, but decentralised production and competing uses, such as animal feed or bedding, limit its availability for bioenergy. Processes like shredding or grinding reduce the size and bulk density of the feedstock, making it easier to transport [6]. While its abundance is unmatched, efficient collection and storage systems are critical to overcoming logistical challenges, mainly during its seasonal production.
Common residues like corn stover (CS), rice straw (RS), wheat straw (WS), and sugarcane bagasse (SB) were prioritised for biofuel production in this study due to their high abundance and consistent availability globally. For instance, CS is a widely available agricultural residue in the United States, accounting for millions of tons annually, while RS and WS dominate in Asia and Europe, respectively, due to extensive rice and wheat cultivation [7] and SB is highly concentrated in sugar-producing regions such as Brazil and India [8]. Moreover, their utilisation reduces environmental issues such as open-field burning of RS and WS, which contributes significantly to air pollution [9]. SB and CS are particularly advantageous due to their relatively centralised availability, which minimises logistical challenges [10]. Additionally, the high biofuel potential of these residues, as demonstrated by the efficiencies of their conversions to SAF, makes them promising [11].
Although SB, RS, WS, and CS are comparable in terms of availability, the cost-effectiveness of acquisition, and overall sustainability, based on their compositions and physical properties [12,13,14,15], CS and SB are the top candidates for SAF production feedstock owing to their energy density and conversion efficiency potential (i.e., high hemicellulose contents, volatile matter contents, and H/C ratios and low ash contents). However, CS is prioritised since the preliminary selection of a feedstock and a process design is a research-based process and research on SAF production from CS is significantly more abundant compared to SB, covering a wide array of conversion processes such as gasification and Fischer–Tropsch (G-FT) synthesis, FP, and alcohol to jet (ATJ), highlighting its versatility. Additionally, techno-economic analyses of CS-based SAF show strong potential for integration with existing agricultural infrastructure [16]. In contrast, while SB is well-studied for biochemical conversions, studies focusing on SAF pathways are limited to fermentation-based ATJ pathways due to its high cellulose content and compatibility with sugarcane processing facilities. Therefore, with significant untapped potential for biofuel production to produce SAF, abundant research availability, and favourable integration feasibility, CS emerged as the most attractive feedstock option for SAF production in this study.
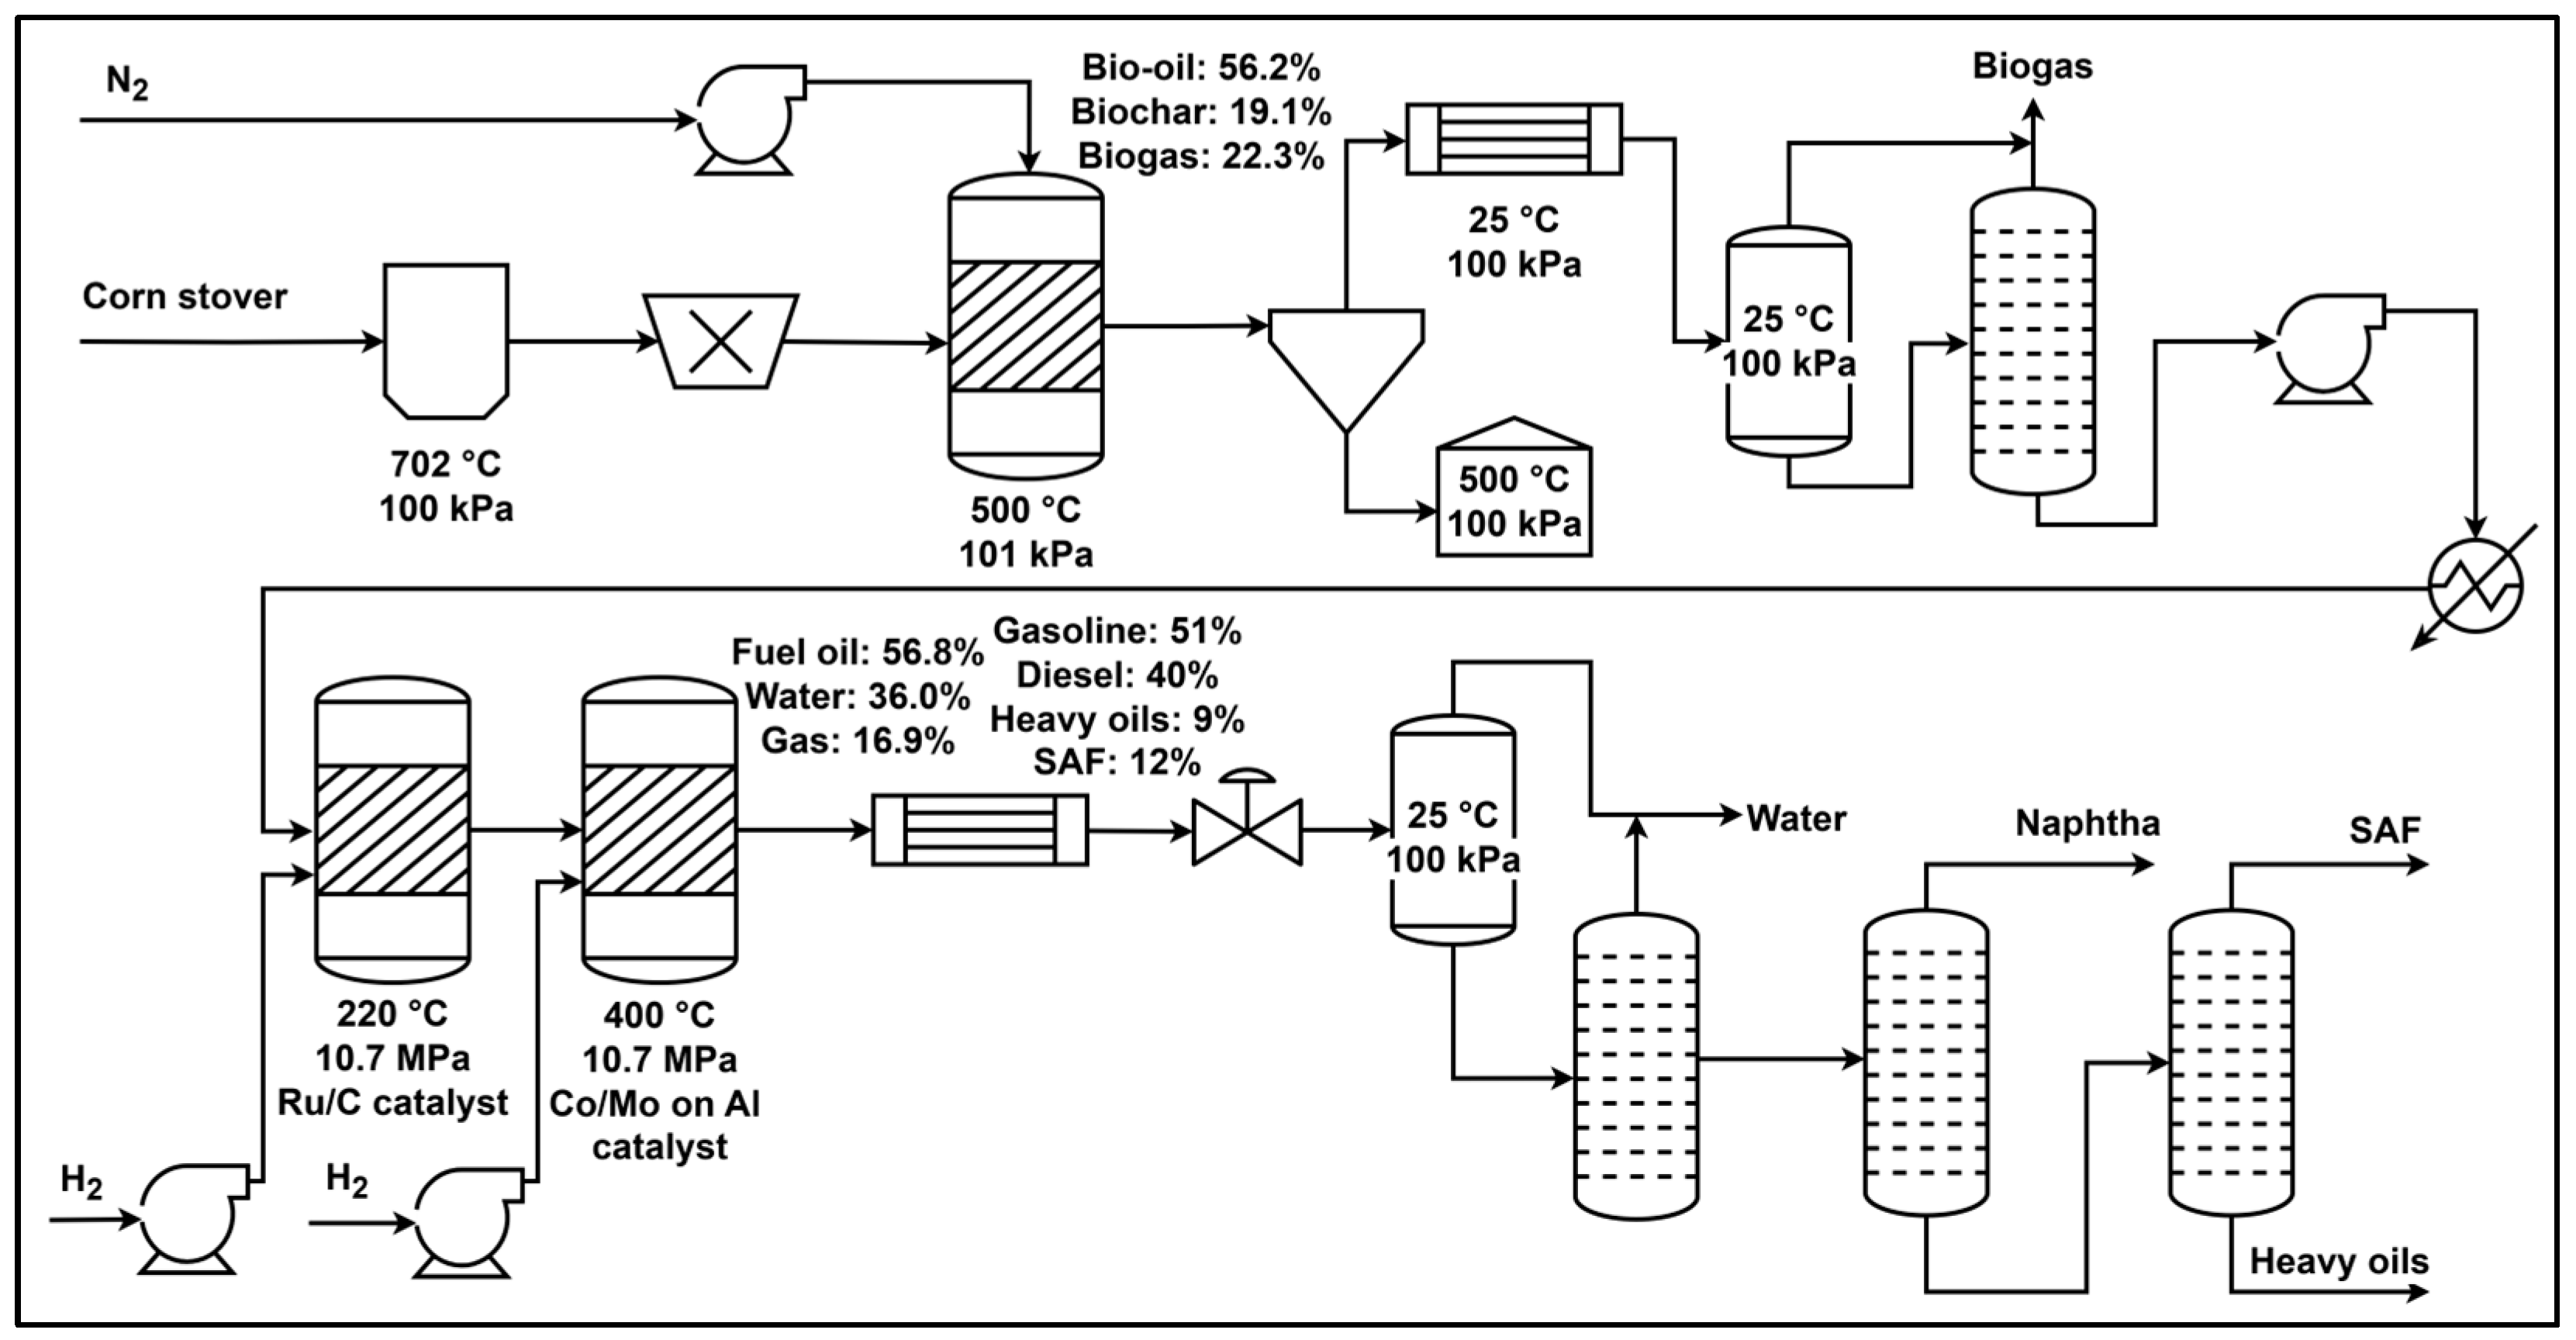
Several thermochemical and biochemical routes have been investigated for converting CS to SAF, including G-FT synthesis, ATJ, and FP. G-FT converts biomass into synthesis gas (syngas: CO + H2) via gasification, followed by Fischer–Tropsch synthesis to make liquid hydrocarbons, including jet fuel [17]. Meanwhile, the ATJ process converts biomass-derived alcohols (ethanol, butanol, and isobutanol) into jet-range hydrocarbons through dehydration, oligomerization, and hydrogenation [18]. Finally, FP involves rapidly heating biomass in the absence of oxygen to decompose it into a mixture of vapours and char. Some of the vapours then condense into bio-oil, which is further upgraded into aviation fuel [19].
Based on a preliminary evaluation of the fuel yields, environmental impacts, economic viability, and technology readiness of the routes from the literature review, FP emerged as a more attractive pathway for SAF production from CS compared to the other two pathways. FP offers the highest fuel yield (22.5% compared to 19.7% and 0.9% for ATJ and G-FT, respectively) among the three pathways, signifying efficient biomass conversion into bio-oil for SAF production [17,18,20,21]. Moreover, a cost reduction opportunities study by Tanzil et al. reported that FP stands out as the most cost-effective pathway, as its MFSP can reach as low as 1.78 USD/Liter when costs are optimised, compared to 2.31 USD/Liter and 1.94 USD/Liter for ATJ and G-FT, respectively [21]. Additionally, FP demonstrates a moderate environmental impact with 68–76% GHG savings, making it a viable option for reducing emissions [22]. Finally, although FP and G-FT are comparable in terms of resource availability, while ATJ is more limited in this regard, FP currently lags behind G-FT in terms of its Fuel Readiness Level (FRL), as its resulting fuel remains in the developmental stage. In contrast, G-FT is nearing commercial maturity. Nonetheless, considering FP’s overall potential and ongoing advancements toward increasing its FRL, it emerged as the most promising pathway for producing SAF from CS.
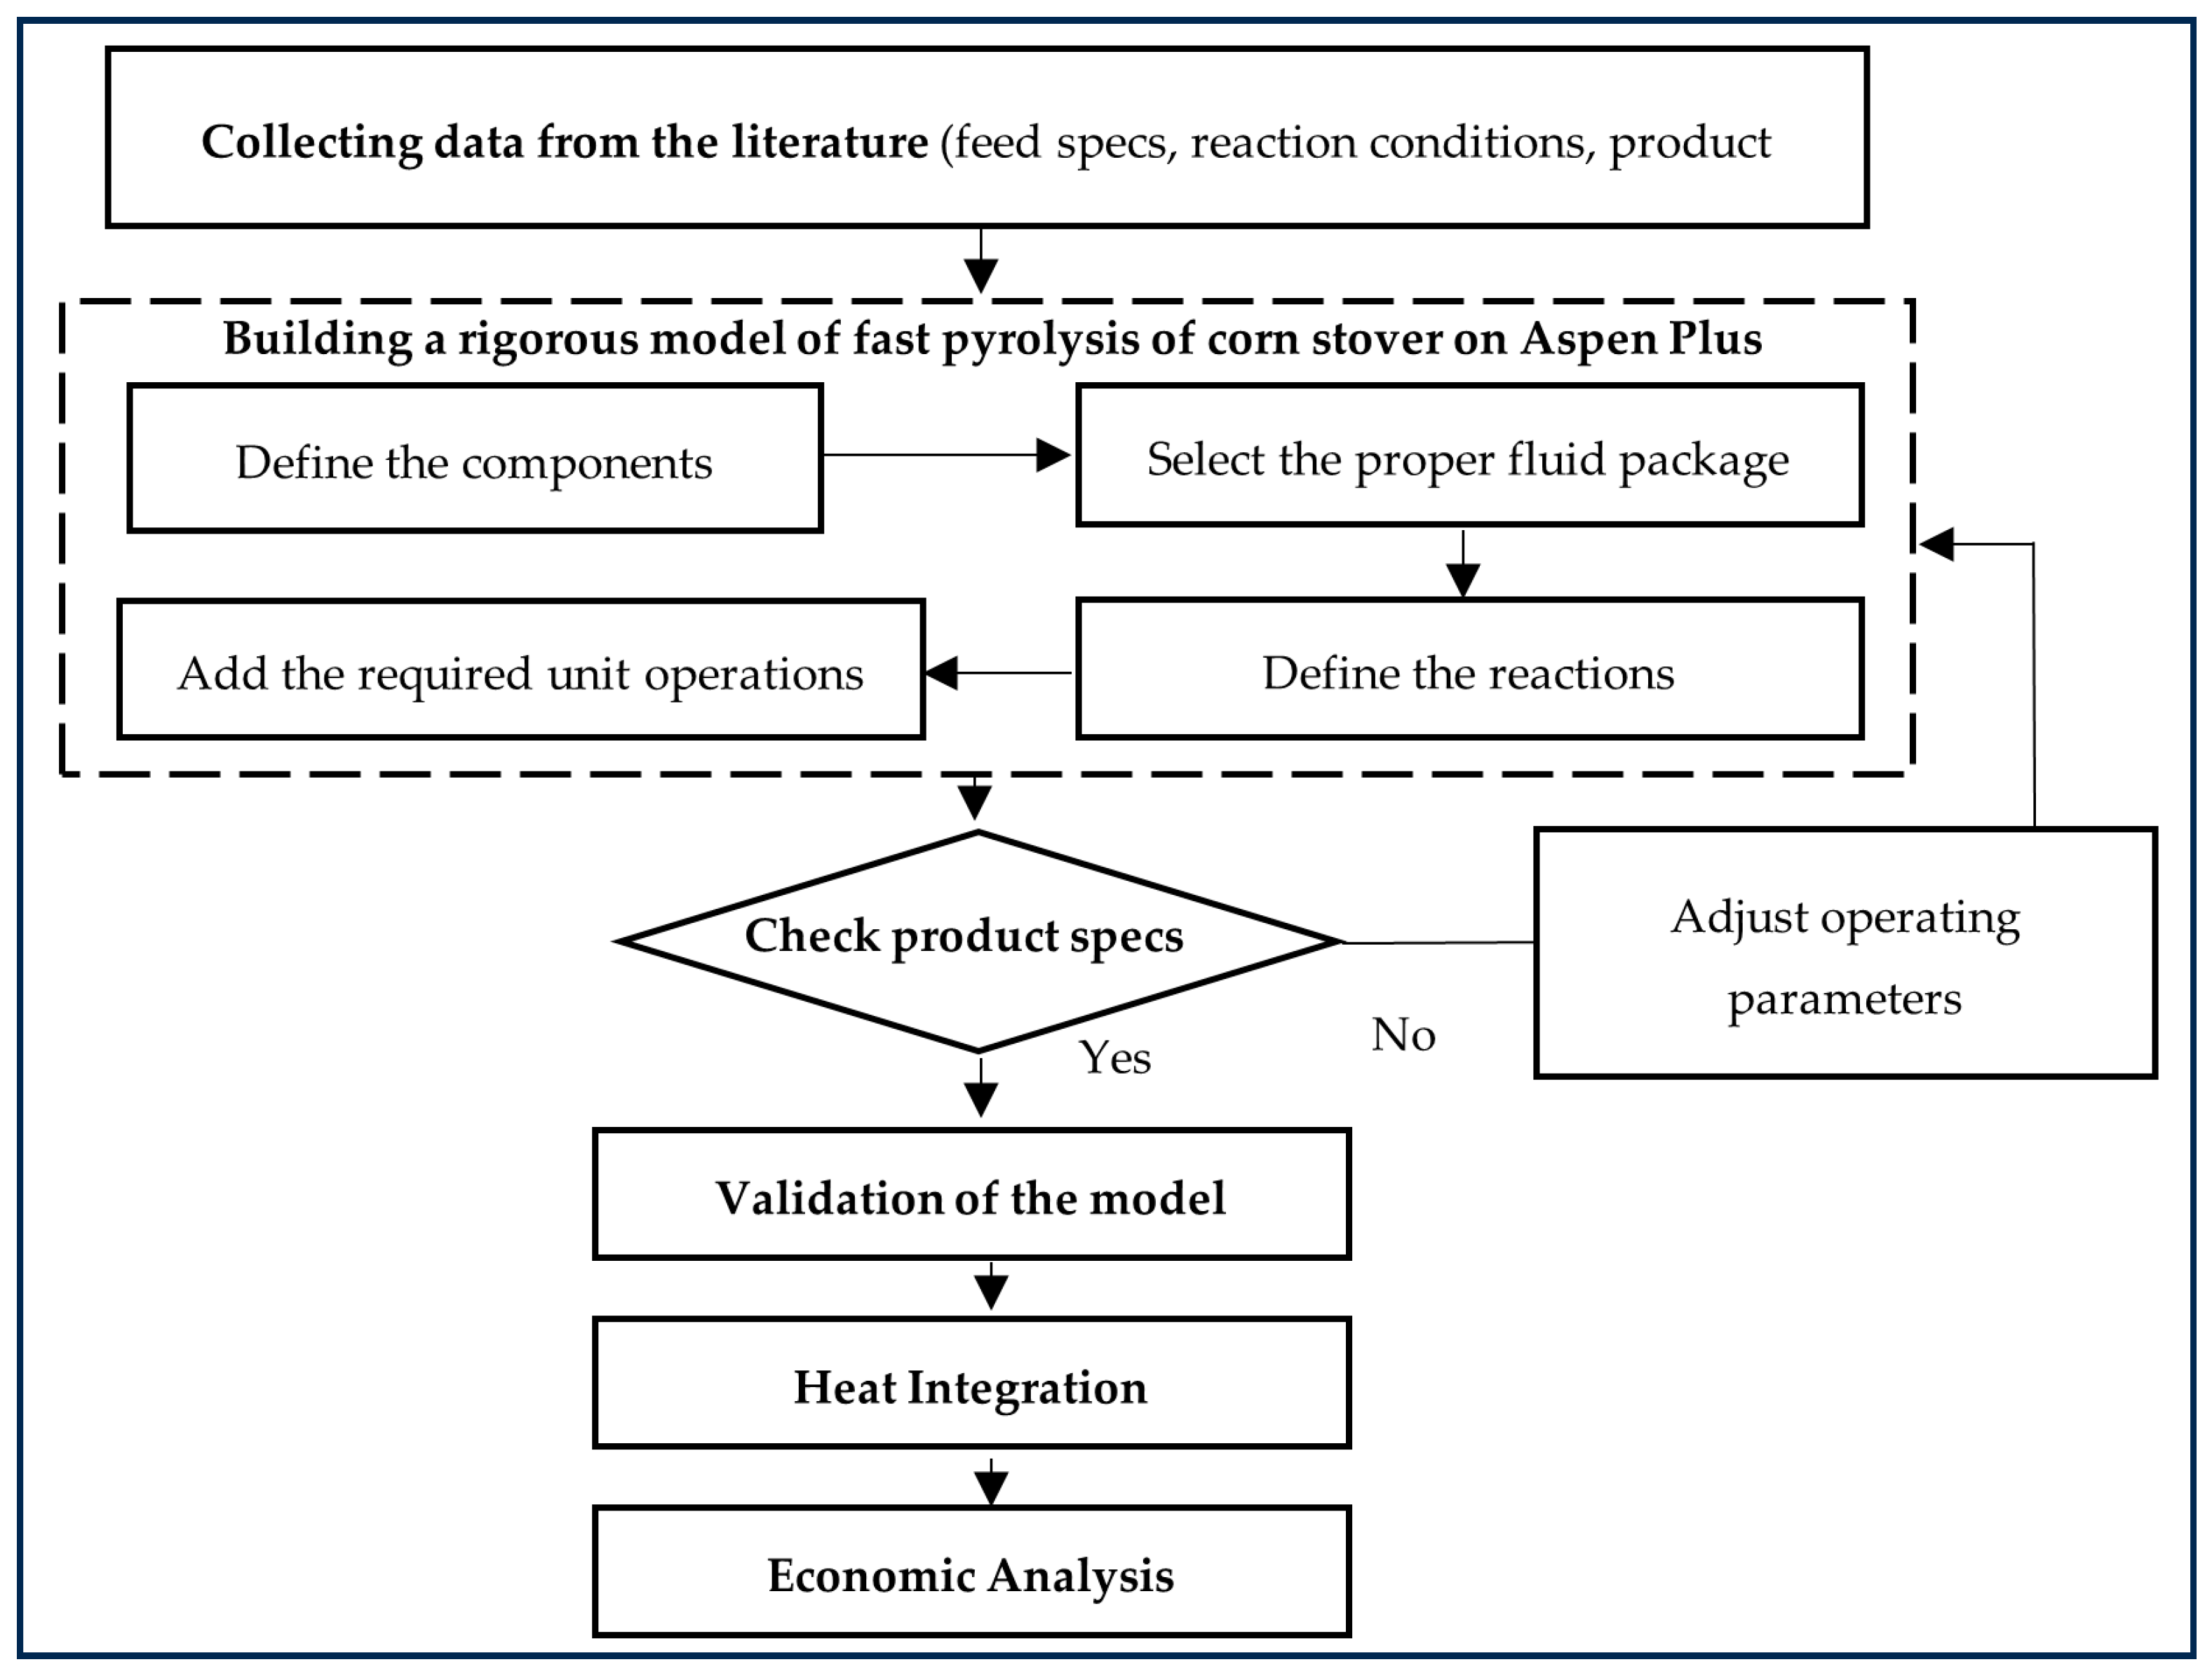
While the technical feasibility of producing SAF from various feedstocks is gaining traction, comprehensive techno-economic analyses, particularly for processing CS via FP, remain crucial for commercial deployment. This study aimed to address this gap by comprehensively designing the process, optimising the process by leveraging a heat integration strategy to minimise utility consumption using Aspen Plus, evaluating its economic viability, and identifying key parameters for scalability, thereby providing valuable insights into the potential of this pathway for SAF production.

2. Methodology

Process design and optimisation for SAF production from CS were carried out according to the steps in Figure 1, and Aspen Plus V12.1 commercial software was used to model the process [23].

2.1. Process Development

A process flow diagram of the FP is presented in Figure 2. The process is divided into four stages: pretreatment of CS, FP of CS, hydrotreatment of bio-oil, and separation of biofuels. Before the biomass undergoes fast pyrolysis, the feedstock needs to be pretreated by grinding it into smaller pieces (0.3 mm) and drying it to reduce moisture, ensuring optimal conditions and efficiency during the FP process.
The FP reactor, which is a fluidised bed reactor, is operating at 500 °C and 101 kPa [20], with nitrogen extracted from the atmosphere, without an additional purchase, as the carrier gas. The products of FP are mainly categorised into three phases, bio-oil, biogas, and biochar, where the main bio-oil compounds are made up of alcohols, esters, acids, phenolics, furans, aromatics, and ketones, while the biogas mainly consists of CO, CO2, H2, methane, and ethylene.
The FP products are sent to a cyclone that is operating at 500 °C and 100 kPa to separate the biochar from the vapour products [19]. The vapour products, which consist of bio-oil and biogas, are condensed at 25 °C to retrieve the condensable part (bio-oil) and further separated through a flash drum and a liquid–liquid separator to achieve high-purity bio-oil.
The separated bio-oil is sent to two-stage hydrotreatment reactors with the reactors operating at 220 °C and 400 °C (at 10.7 MPa), respectively [19,20]. Low-temperature hydrotreatment can be utilised to pretreat unstable bio-oil, targeting the reduction of highly reactive oxygenated compounds before undergoing complete deoxygenation under more intense hydrotreatment conditions.
Finally, the product of the hydrotreatment, upgraded oil ranging from C6 to C18, is separated into its respective fuel types (Naphtha, SAF, and heavy oils) with a flash drum, a liquid–liquid separator, and two serial distillation columns.

2.2. Building the Process Model

2.2.1. Selecting the Thermodynamic Model

The commercial software Aspen Plus [23] was used to simulate the entire process. The NRTL thermodynamic model was used, as it is well-suited for systems such as pyrolysis vapour condensation, which generally function at moderate to low temperatures (ranging from 120 °C down to ice-trap conditions). Furthermore, bio-oil is commonly classified as a highly polar solution, where the presence of electrolytes is typically insignificant. Ultimately, the experimental results obtained by Liu and Wang’s research team showed good agreement with the predictions of the NRTL model, confirming its accuracy in representing the interactions during this process [19].

2.2.2. Feedstock Characterisation

The CS feedstock was modelled via non-conventional components using ultimate and proximate analysis data obtained from a Vario-Micro CHN elemental analyser (Elementar, Rhein-Main-Gebiet, Germany) and the DIN 51718 [24], DIN 51720 [25], and DIN 51719 [26] standard methods reported by A. Elsagan et al., as presented in Table 1 [13]. Additionally, Aspen Plus V12.1, the software used to simulate the process that facilitates accurate component property predictions via databank access, does not have unified molecular formula data for biomass. Hence, MIXCINC (Mixed, Conventional Inert Solid and Non-Conventional Stream) was used as the global stream class. The enthalpy and the density were the two attributes of the non-conventional components calculated via HCOALGEN and DCOALIGT models, respectively. HCOALGEN and DGOALIGT are built-in Aspen Plus property models used to estimate the thermodynamic properties of the feedstock based on its elemental composition. A plant capacity of 600 tonnes/day of CS feedstock was selected based on typical scales for commercial biofuel production.

2.2.3. Fast Pyrolysis (FP) Process Modelling

The FP process was modelled based on the design parameters from Liu and Wang presented in Table 2, assuming the operating conditions of the process are similar since the type of feedstock used shares many similarities with CS [19]. Although Liu and Wang simulated the process for rice husks, the design parameters were applicable, while the feedstock-specific yields of the products were adapted to represent the use of CS. An RYield unit was used to simulate FP of CS as a feedstock and the specific product yield with CS as the feedstock, which were obtained from the work by Howe et al. [20].
The components and composition of the products of FP, namely bio-oil, biogas, and biochar, were assumed to be represented by a pseudo-component approach, as detailed in Table 3. The original yield data was sourced from Heng et al. and adjusted so that the yield of each product type summed to 100%, simplifying the input for the Aspen Plus RYield simulation based on the percentages of the CS bio-oil, biogas, and biochar [20,27]. Bio-oil mainly comprises alcohols, esters, acids, phenolics, furans, aromatics, and ketones, while biogas mainly consists of CO, CO2, H2, methane, and ethylene. Biochar cannot be modelled with chemical compounds due to a lack of unified molecular formula data. Hence, it is modelled by its ultimate analysis data, which are presented in Table 3.

2.2.4. Hydrotreatment (Bio-Oil Upgrading) Modelling

A model simulating hydrotreatment of bio-oil from pine was reported by the National Renewable Energy Laboratory (NREL), and the compounds, model, and yields used in that report are assumed to be applicable to modelling hydrotreatment of CS based on the following reasoning [28]. Based on an elemental study of hydrotreated oils from pine plants and CS by Howe et al., it is reported that both upgraded oils’ elemental compositions vary minimally—despite dissimilar feedstocks—suggesting similar final yields [20]. This is because although pine and CS differ in their raw compositions, the pyrolysis and subsequent hydrotreatment steps standardise their outputs, leading to bio-oils with similar elemental compositions. This outcome is driven by the chemical goals of the upgrading process (e.g., hydrodeoxygenation, hydrogenation, etc.), rather than the feedstock characteristics [29]. The two-stage hydrotreatment units were simulated using RYield with the design parameters in Table 4.

2.2.5. Sustainable Aviation Fuel (SAF) Separation Modelling

The distillation section was modelled according to the design parameters reported by the NREL [28]. However, the objective of this study was to separate the products to obtain biodiesel. Therefore, the parameters were adjusted to fit the objective of the current work, which was to separate SAF (Table 5). The parameters were optimised to achieve maximum separation of hydrocarbons ranging from C7 to C17 for SAF.

2.3. Process Optimisation via Heat Integration

Leveraging Aspen Plus simulation, SAF production via FP was rigorously optimised, focusing on the heat integration strategy within the process with the aim to minimise utility consumption and ultimately the operating and total costs. Heat integration was applied via pinch analysis. This involved recovering heat from hot process streams to meet the energy demands of cold streams within the same system. For instance, the bio-oil stream was heated to 400 °C before entering the hydrotreatment reactor to match its operating conditions.
Pinch analysis was employed to develop a heat exchanger network (HEN) strategy. This method does not account for phase changes in a process, as it assumes a constant heat flux [31]. As a result, it may underestimate or overestimate heat transfer requirements, leading to suboptimal HEN design. Research by Liporace et al. found that failing to account for phase changes can lead to errors in the determination of pinch points, which affect overall utility consumption [32]. Despite this limitation, streams undergoing phase changes were incorporated into the analysis to optimise heat integration. While the presence of non-constant heat flux in these streams may introduce some inaccuracies, this analysis still serves as a useful tool for identifying potential matches and estimating heat transfer between streams.
According to the process flow sheet presented in Figure 3, in total two hot streams and four cold streams were identified, as presented in Table 6.

2.4. Economic Evaluation of Process

An economic evaluation of the SAF production process was essential for assessing its financial feasibility and the MFSP required to achieve a break-even point. This methodology involved calculating the total process cost, which consists of both capital expenditures (CAPEX) and operating expenditures (OPEX), as well as estimating potential income from biofuel sales. This approach provided a comprehensive economic assessment, allowing for cost optimisation and strategic pricing decisions to enhance the project’s viability.
The annual OPEX comprised both fixed and variable operating expenses. The fixed OPEX covered equipment and labour costs (Table 7), which remained constant regardless of the production volume. Additionally, 16% of the labour cost was factored into the fixed costs, covering employee benefits. On the other hand, the variable OPEX fluctuated based on the production volume. Table 8 outlines the variable operating costs, which included the feedstock (factored as an acquisition cost), catalysts, and hydrogen gas for reactions. These expenses were determined by process consumption and the market price. Meanwhile, the costs of the utilities (electricity, steam, and cooling water) were obtained from the Aspen Process Economic Analyzer (APEA) in Aspen Plus V12.1 and were generated based on the process flows [23].
The CAPEX accounted for the initial investment in infrastructure, equipment, and installation. This cost primarily depended on assumptions and estimations that were based on the Inside Battery Limits (ISBL) cost, which was the total cost of the equipment and its installation. The equipment and installation costs were generated and obtained from the APEA for both cases, the base case and the optimised (heat-integrated) case, as listed in Table 9, since different equipment was used in these cases. Equipment costs that were not generated by the APEA and were not reliable were estimated based on market prices.
Consequently, using the ISBL cost as the base value, the total capital investment (TCI) for the project could be calculated using various reasonable assumptions listed in Table 10 [19]. The TCI was determined by combining fixed capital investment (FCI), working capital (WC), and land costs. The total direct cost (TDC) consisted of the ISBL cost, along with additional expenses such as a warehouse (5.7% of the ISBL cost), site development (12.9% of the ISBL cost), and additional piping (6.4% of the ISBL cost). The total indirect cost (TIC) accounted for engineering and supervision (13.7% of the TDC) and construction expenses (34% of the TDC). Adding the TDC and TIC resulted in the total direct and indirect cost (TDIC), which formed the basis for FCI. FCI also included off-site battery limits (OSBLs), contractor costs (5% of the TDIC), and contingency (10% of the TDIC) to cover unforeseen expenses. Additionally, WC was set at 10% of FCI, ensuring sufficient funds for operational needs, while the land cost was estimated at 5% of the ISBL cost. Ultimately, the total CAPEX was derived from the sum of FCI, WC, and land expenses, providing a comprehensive estimate of project investment.
Furthermore, other financial assumptions are listed in Table 11 based on typical scales for a general production plant [19]. The economic analysis was conducted assuming the plant would operate for 8088 h per year. The project was partially financed with a loan covering 60% of the total investment, carrying an interest rate of 6% over a five-year term. While the general plant and steam plant had lifespans of 7 and 20 years, respectively, an 8-year linear depreciation period was derived from a weighted average of general and steam plant lifespans, where the general plant constituted most of the investment. This resulted in a depreciation period that leaned closer to the general plant’s 7-year life while still accounting for the longer life of the steam plant. The construction phase was planned for three years, with investment distributed over time: 30% spent in year 2, another 30% in year 1, and the remaining 40% in year 0 for final payments and test runs. To assess financial feasibility, the analysis applied a discount rate of 10%, ensuring future cash flows were appropriately valued. Additionally, an income tax rate of 30% was considered, which impacted net profitability. These financial parameters provided a structured framework for evaluating project viability, loan repayment schedules, and cost recovery strategies.

3. Results and Discussion

Based on the methodology described in 
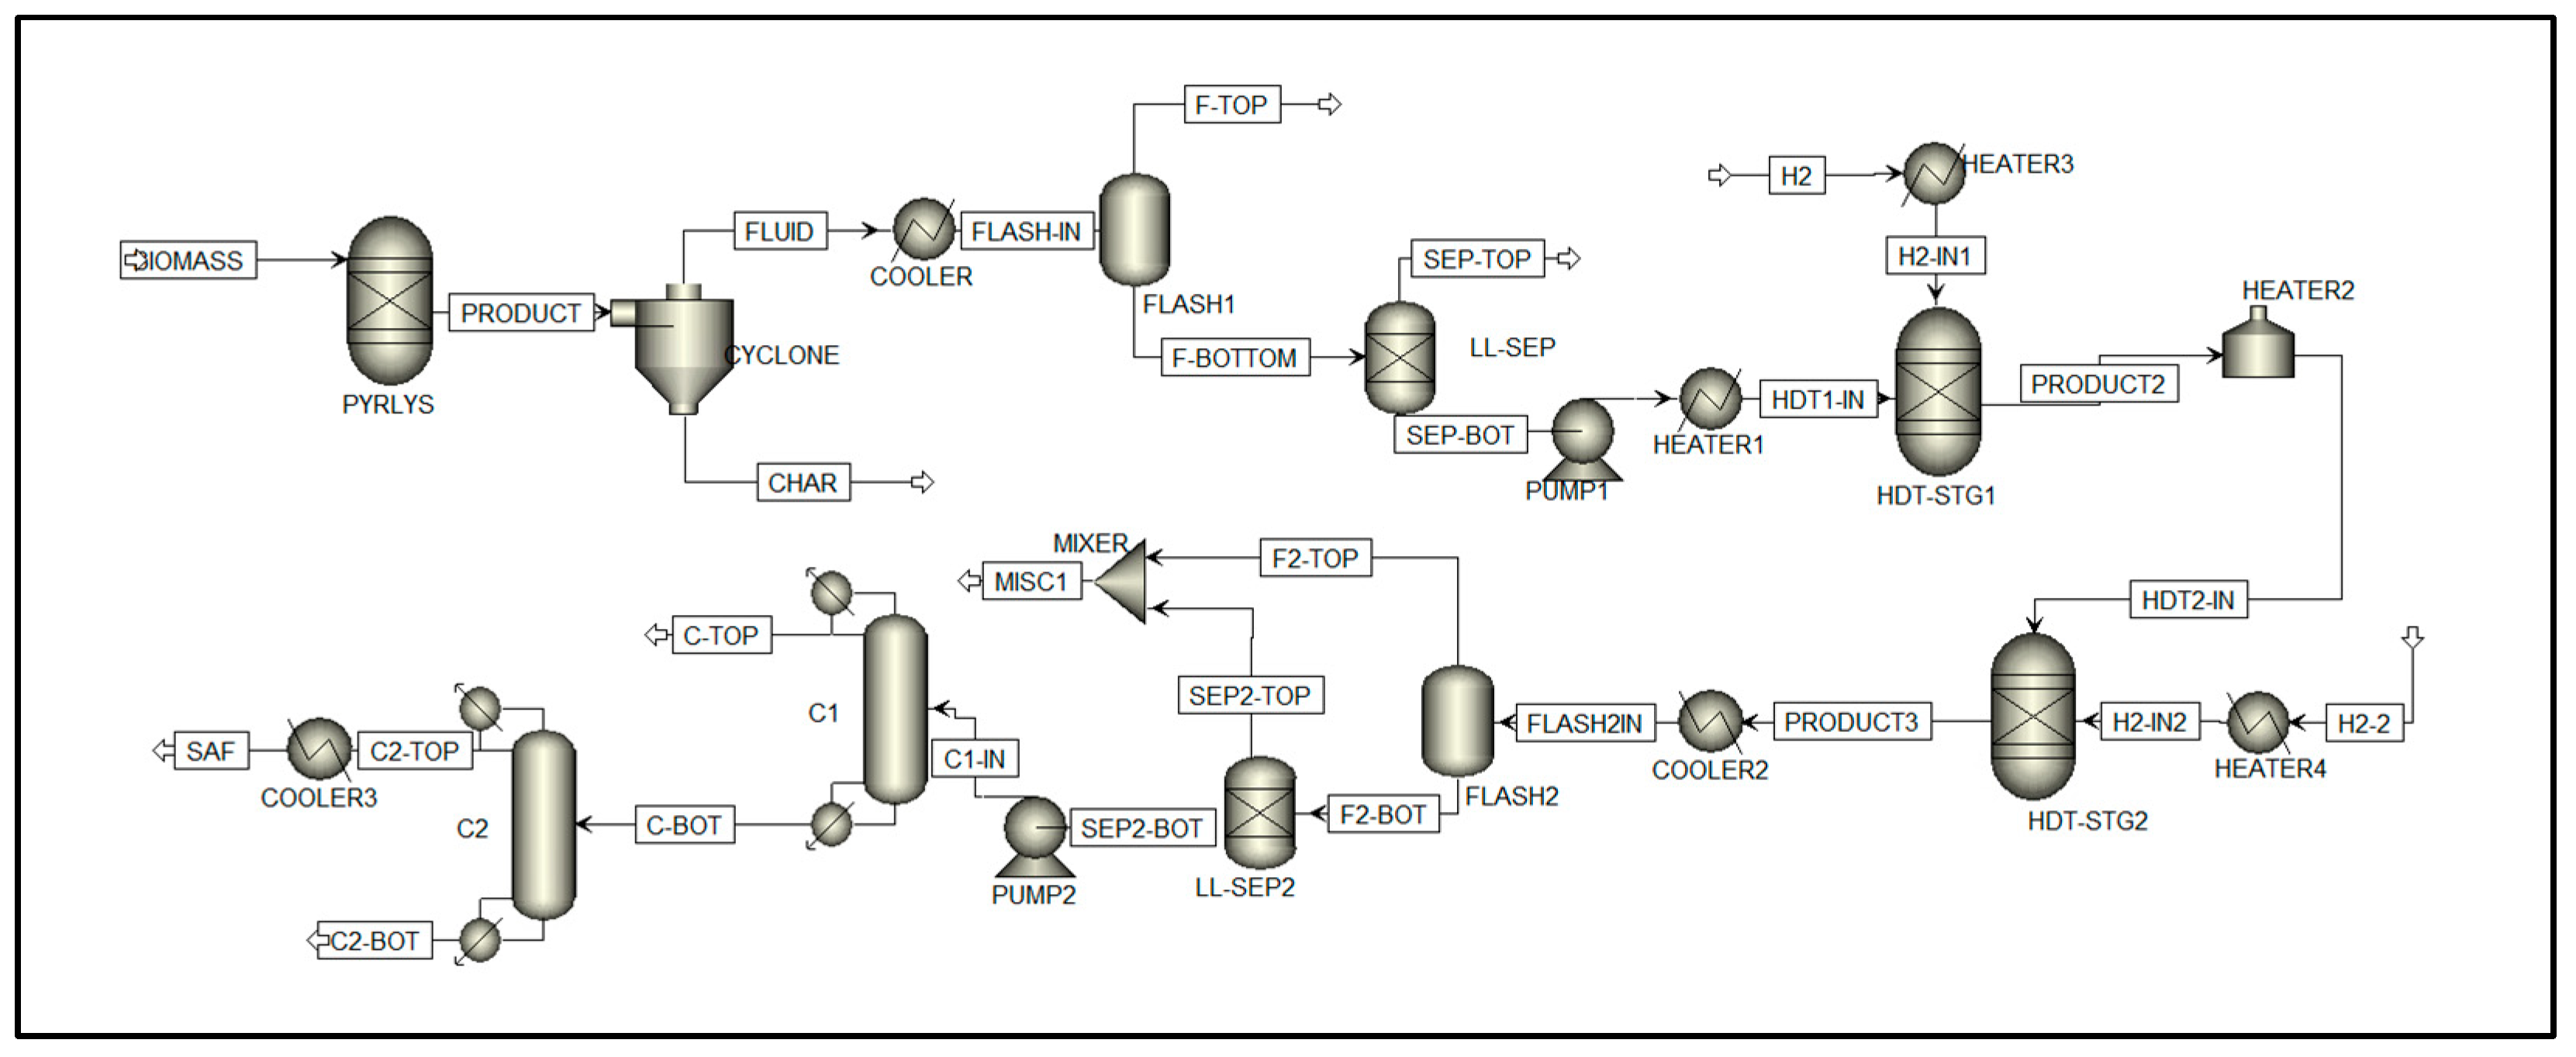
Section 2 for building the Aspen Plus model of the process, Figure 3 presents the Aspen Plus model of the conversion of CS to SAF through FP and hydrotreatment.

3.1. Aspen Plus Model Validation

The primary objective of model validation was to ensure that the simulation results accurately reflect real-world production of SAF. In this study, the hydrotreatment process was modelled using Aspen Plus V12.1, where the reactor was simulated using RYield based on product yields obtained from the literature. As the yield data itself was derived from existing studies, directly comparing the simulation yields with those reported in the literature would have been redundant and not meaningful for validation purposes.
Therefore, to establish the validity of the model, the simulation results were compared to the elemental composition of the final product, SAF (hydrotreated CS bio-oil), reported in the literature, as presented in Table 12. This approach ensured that the model accurately produces SAF with the same composition of carbon, hydrogen, oxygen, nitrogen, and sulphur contents rather than merely reproducing yield data. By doing so, it provided an independent validation method that focused on composition accuracy, which was critical for evaluating the quality and suitability of the SAF for downstream applications.
The comparison between the simulation results and those from the literature in Table 12 demonstrates good agreement. The minor discrepancies between the simulated elemental composition and that from the literature are attributed to differences in process assumptions and model scope. The simulation assumes more efficient hydrotreatment, resulting in near-complete deoxygenation and a slightly higher hydrogen content. The trace sulphur in the simulation may originate from conservative assumptions related to gas clean-up, whereas the literature likely reports post-polishing data with sulphur below detection levels. Despite these minor differences, the close agreement in the carbon and hydrogen contents validates the reliability of the simulation model for predicting SAF composition and the following discussion of the results derived from it.

3.2. An Evaluation of the Properties of Sustainable Aviation Fuel (SAF)

The Aspen Plus simulation results yielded a comprehensive breakdown of the chemical composition of the SAF, including the proportions of paraffins, naphthene, aromatics, oxygenates, and other relevant components, as presented in Table 13. The system was simulated via a steady-state deterministic method using fixed inputs with no variation or uncertainty. Therefore, the results represent a single point of operation.
The critical outcome of the simulation of SAF production from CS was the final composition of the SAF product. To assess its suitability, the properties of the SAF were instead validated based on the final composition of the SAF by comparing the simulation composition with the compositions of jet fuels reported in the literature (100% waste wood-derived (WWD) SAF and 100% conventional jet fuel) [33]. This approach was logical and scientifically sound because the chemical composition directly influences the physical properties and performance characteristics of a fuel. The properties presented in Table 14 reflect the combustion performance, efficiency, fluidity, cold-temperature pumpability performance, and stability of the fuel, which are crucial to characterise the quality of jet fuel.
Upon comparing the composition of the simulation results with two reference fuel compositions (100% WWD SAF and 100% conventional jet fuel) in Table 15, it was observed that the product composition fell within the range between the two reference fuels. Such an outcome indicates that the chemical properties of the produced SAF are between those of the WWD SAF and the petroleum-based fuel.
Therefore, the results indicate that the most practical application of the SAF would be as a blended fuel that could be mixed with conventional jet fuel to form an SAF blend that meets the necessary ASTM standards for aviation fuel. A study by Jeon et al. suggests that a 10% SAF blend with conventional jet fuel offers the optimal jet fuel quality that achieves all ASTM standards, with a final boiling point (FBP) of 299.5 °C [33]. An aviation fuel blend review by Lau et al. confirms the relevancy of the proposed blend, as a blend percentage of 10% is also recommended for SAF produced from Jatropha plants, Babassu seeds, palm kernels, and Lignin-based plants [35]. A low-percentage blend is expected for SAF derived from lignocellulosic biomass, as it tends to have a higher oxygen content and more complex aromatic structures compared to SAF produced from oilseed crops like Canola and Camelina, which comply with the standards as 20% and 50% blends, respectively [35].

3.3. Energy Savings Analysis

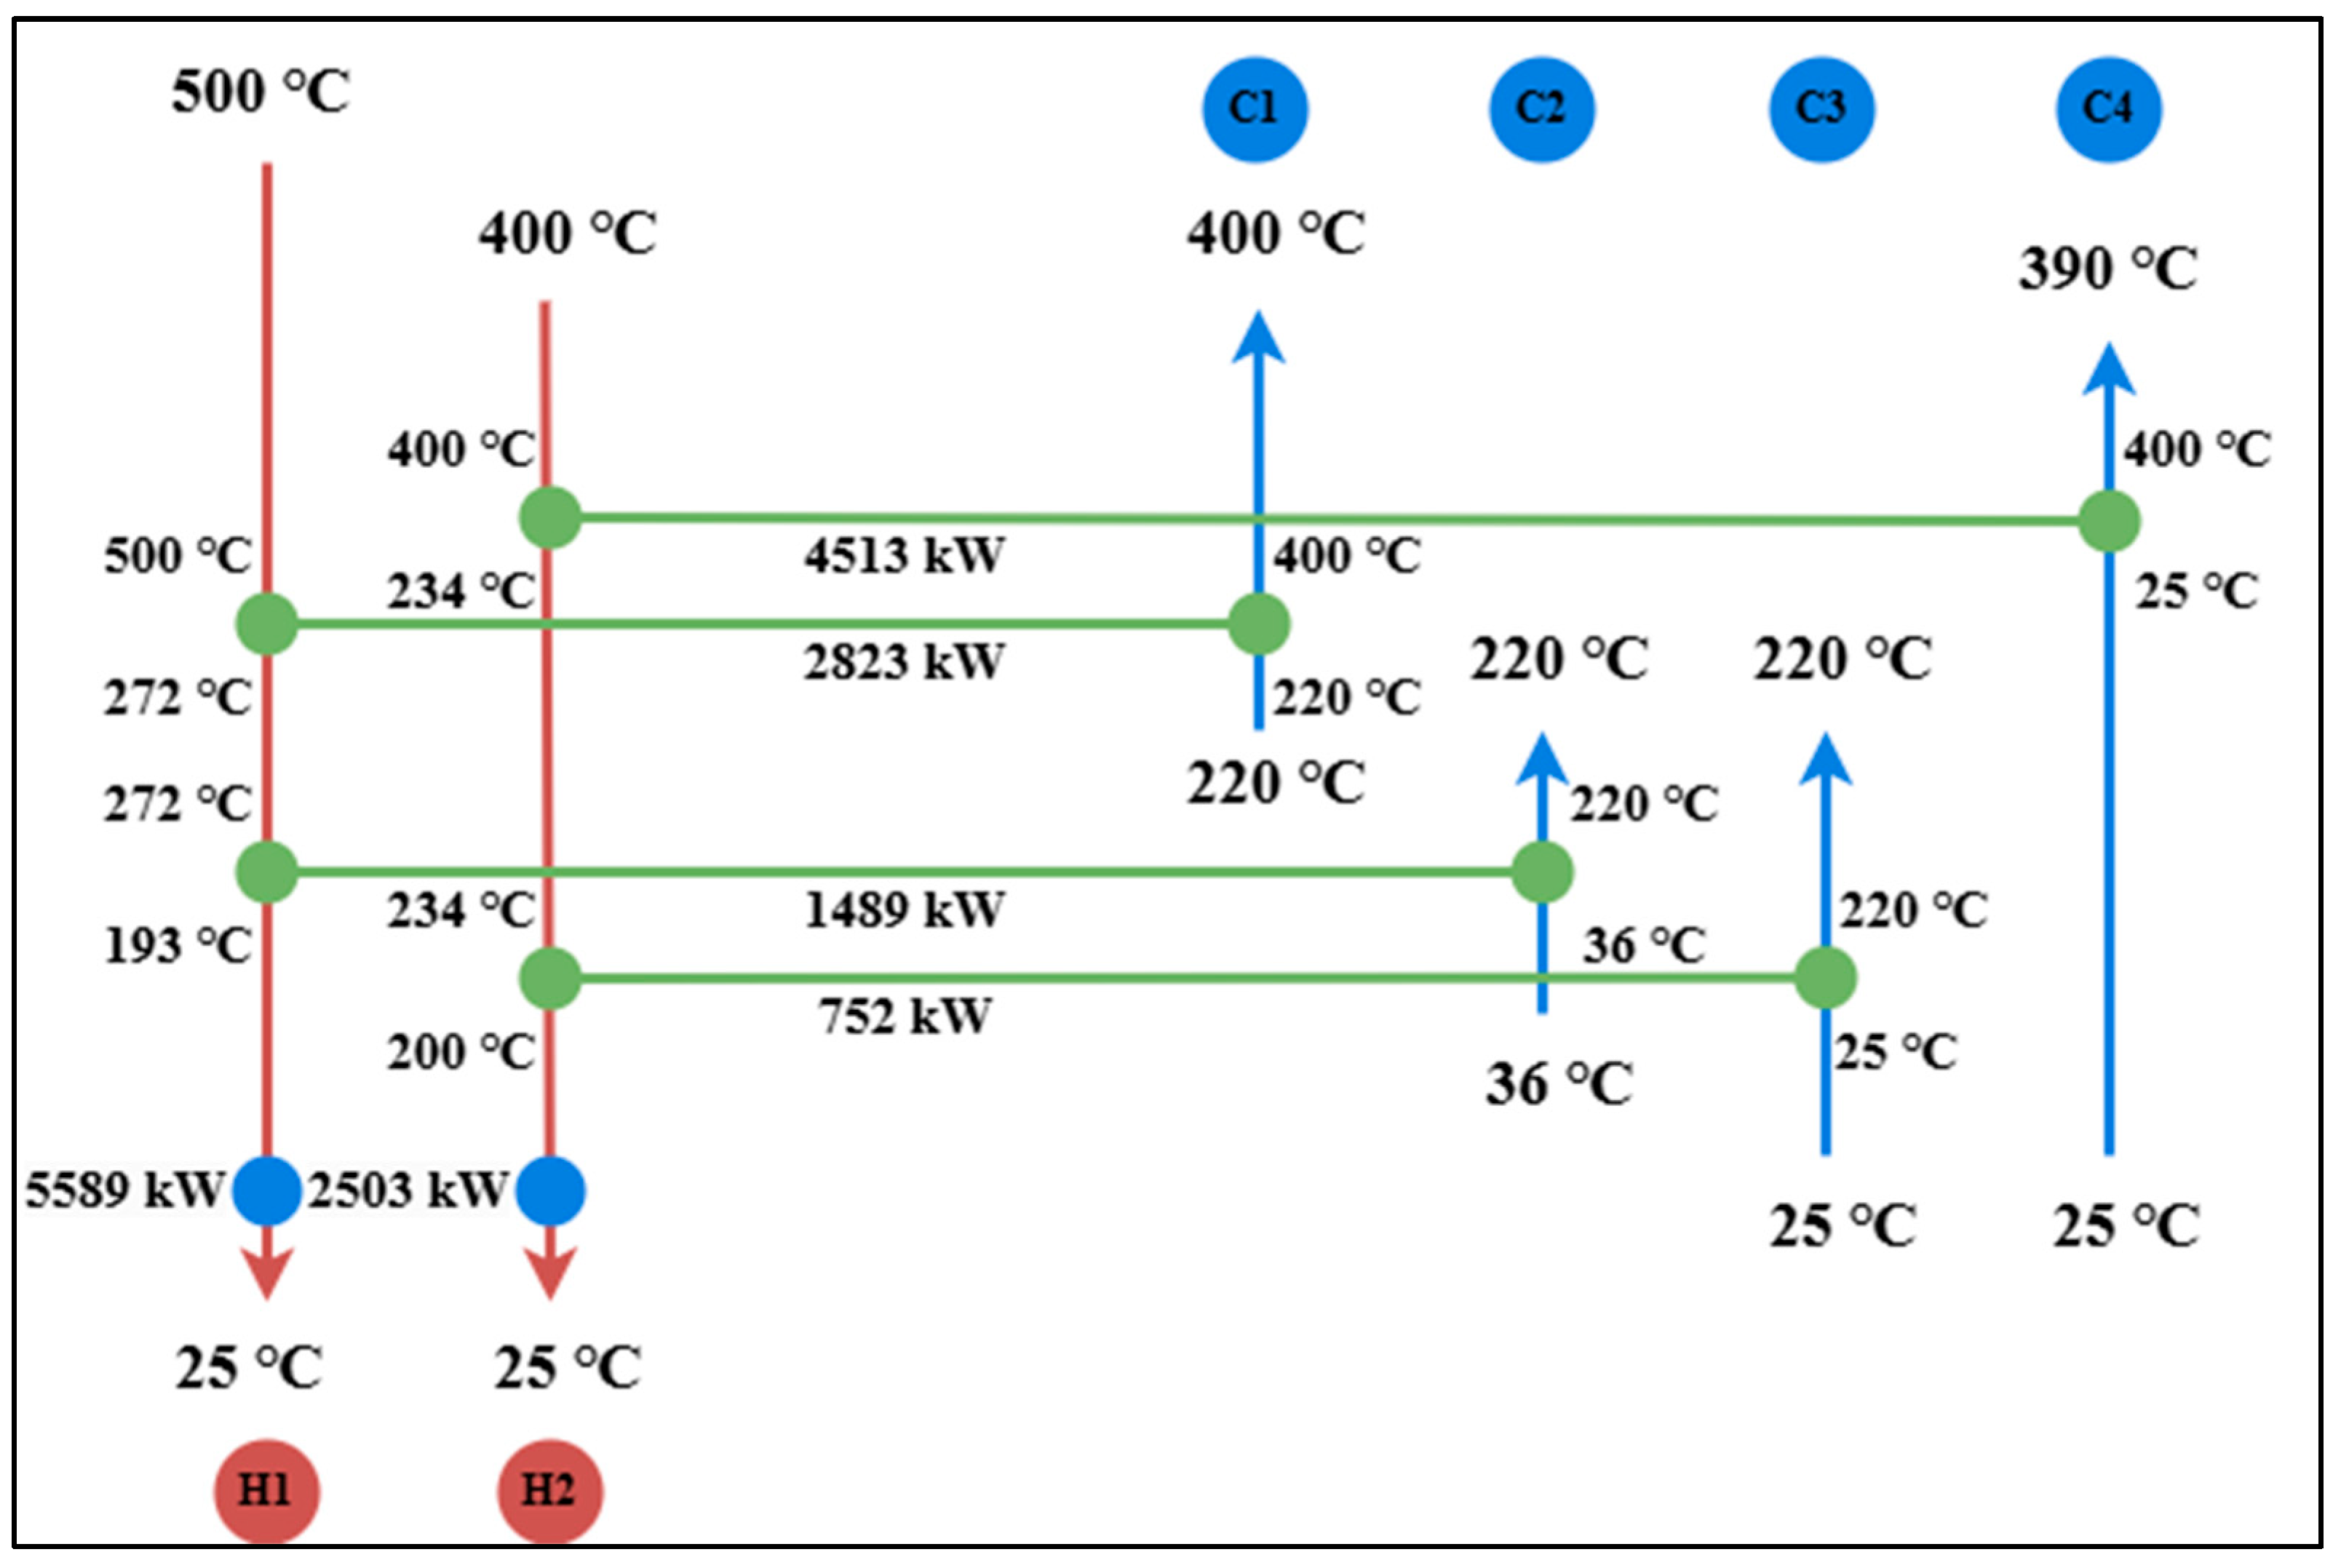
From the pinch analysis, four streams were matched to maximise the heat recovery in the system, and the results are reported in Table 16 and Figure 4.
Each heat source available provides heat to more than one heat-sink stream. On that account, pairing hot streams with cold streams that require higher outlet temperatures needs to be prioritised to avoid outlet temperature cross. As a result, H1 and H2 integrate with C1 and C4 first, respectively, before directing their excess heat to the other two cold streams.
When the heat integration network obtained from the pinch analysis was applied in the Aspen Plus simulation, it was observed that the total cooling utility requirement (8092.12 kW) was slightly higher than the result from the pinch analysis (7967.59 kW). This discrepancy primarily arose because Aspen Plus is capable of accurately modelling phase transitions, including the latent heat that occurs during condensation or vaporisation. Unlike pinch analysis, which assumes constant heat flux, Aspen Plus dynamically calculates the enthalpy changes during phase transformations. This results in a more realistic estimation of the cooling duty.
Despite the discrepancy between the cooling utility requirements obtained from pinch analysis and Aspen Plus simulation, pinch analysis remains an effective and practical method for estimating and designing HENs. The discrepancy observed is relatively small, indicating that pinch analysis still serves as a reliable guide for preliminary HEN design and effectively identifies pinch points and heat recovery potentials, making it useful for conceptual design.
After heat integration optimisation, the utility requirements were significantly reduced from 9701 kW to none for the heating utility and from 17668 kW to 7967 kW for the cooling utility. These remarkable reductions indicate that 9701 kW of energy was successfully integrated between the hot and cold streams, achieving 100% energy savings for the heating utility and 55% savings for the cooling utility.
Consequently, the need for heating utilities such as high-pressure steam and fired heat was eliminated. Additionally, the significant reduction in cooling demand minimised the reliance on cooling utilities. As a result, the types of utilities required were reduced from high-pressure steam, fired heat, cooling water, and refrigerant to just cooling water and refrigerant.

3.4. Economic Analysis

The results of an economic analysis that included the CAPEX and the OPEX for both the base case and the optimised case (after heat integration) are presented in Table 17.
The analysis suggests that the material costs were the dominant contributors to the OPEX in both cases, driven by feedstock acquisition, hydrogen, and catalyst costs, while utility costs were minimal. Despite an 84% reduction in utility costs through optimisation, the overall impact on the total OPEX was negligible due to unchanged material costs.
For the CAPEX, the FCI remained the largest component. Optimisation led to a 12% reduction in the total CAPEX, but its impact was limited relative to the total costs.
Overall, based on the 600 tonnes/day plant capacity and annual SAF production of 32.5 Liters/year, the MFSPs for the base and optimised cases were calculated to be 2.35 USD/Liter and 2.29 USD/Liter, respectively. The MFSP decreased slightly by 6 cents/Liter when optimisation was applied, reflecting a modest economic improvement primarily constrained by high material costs.
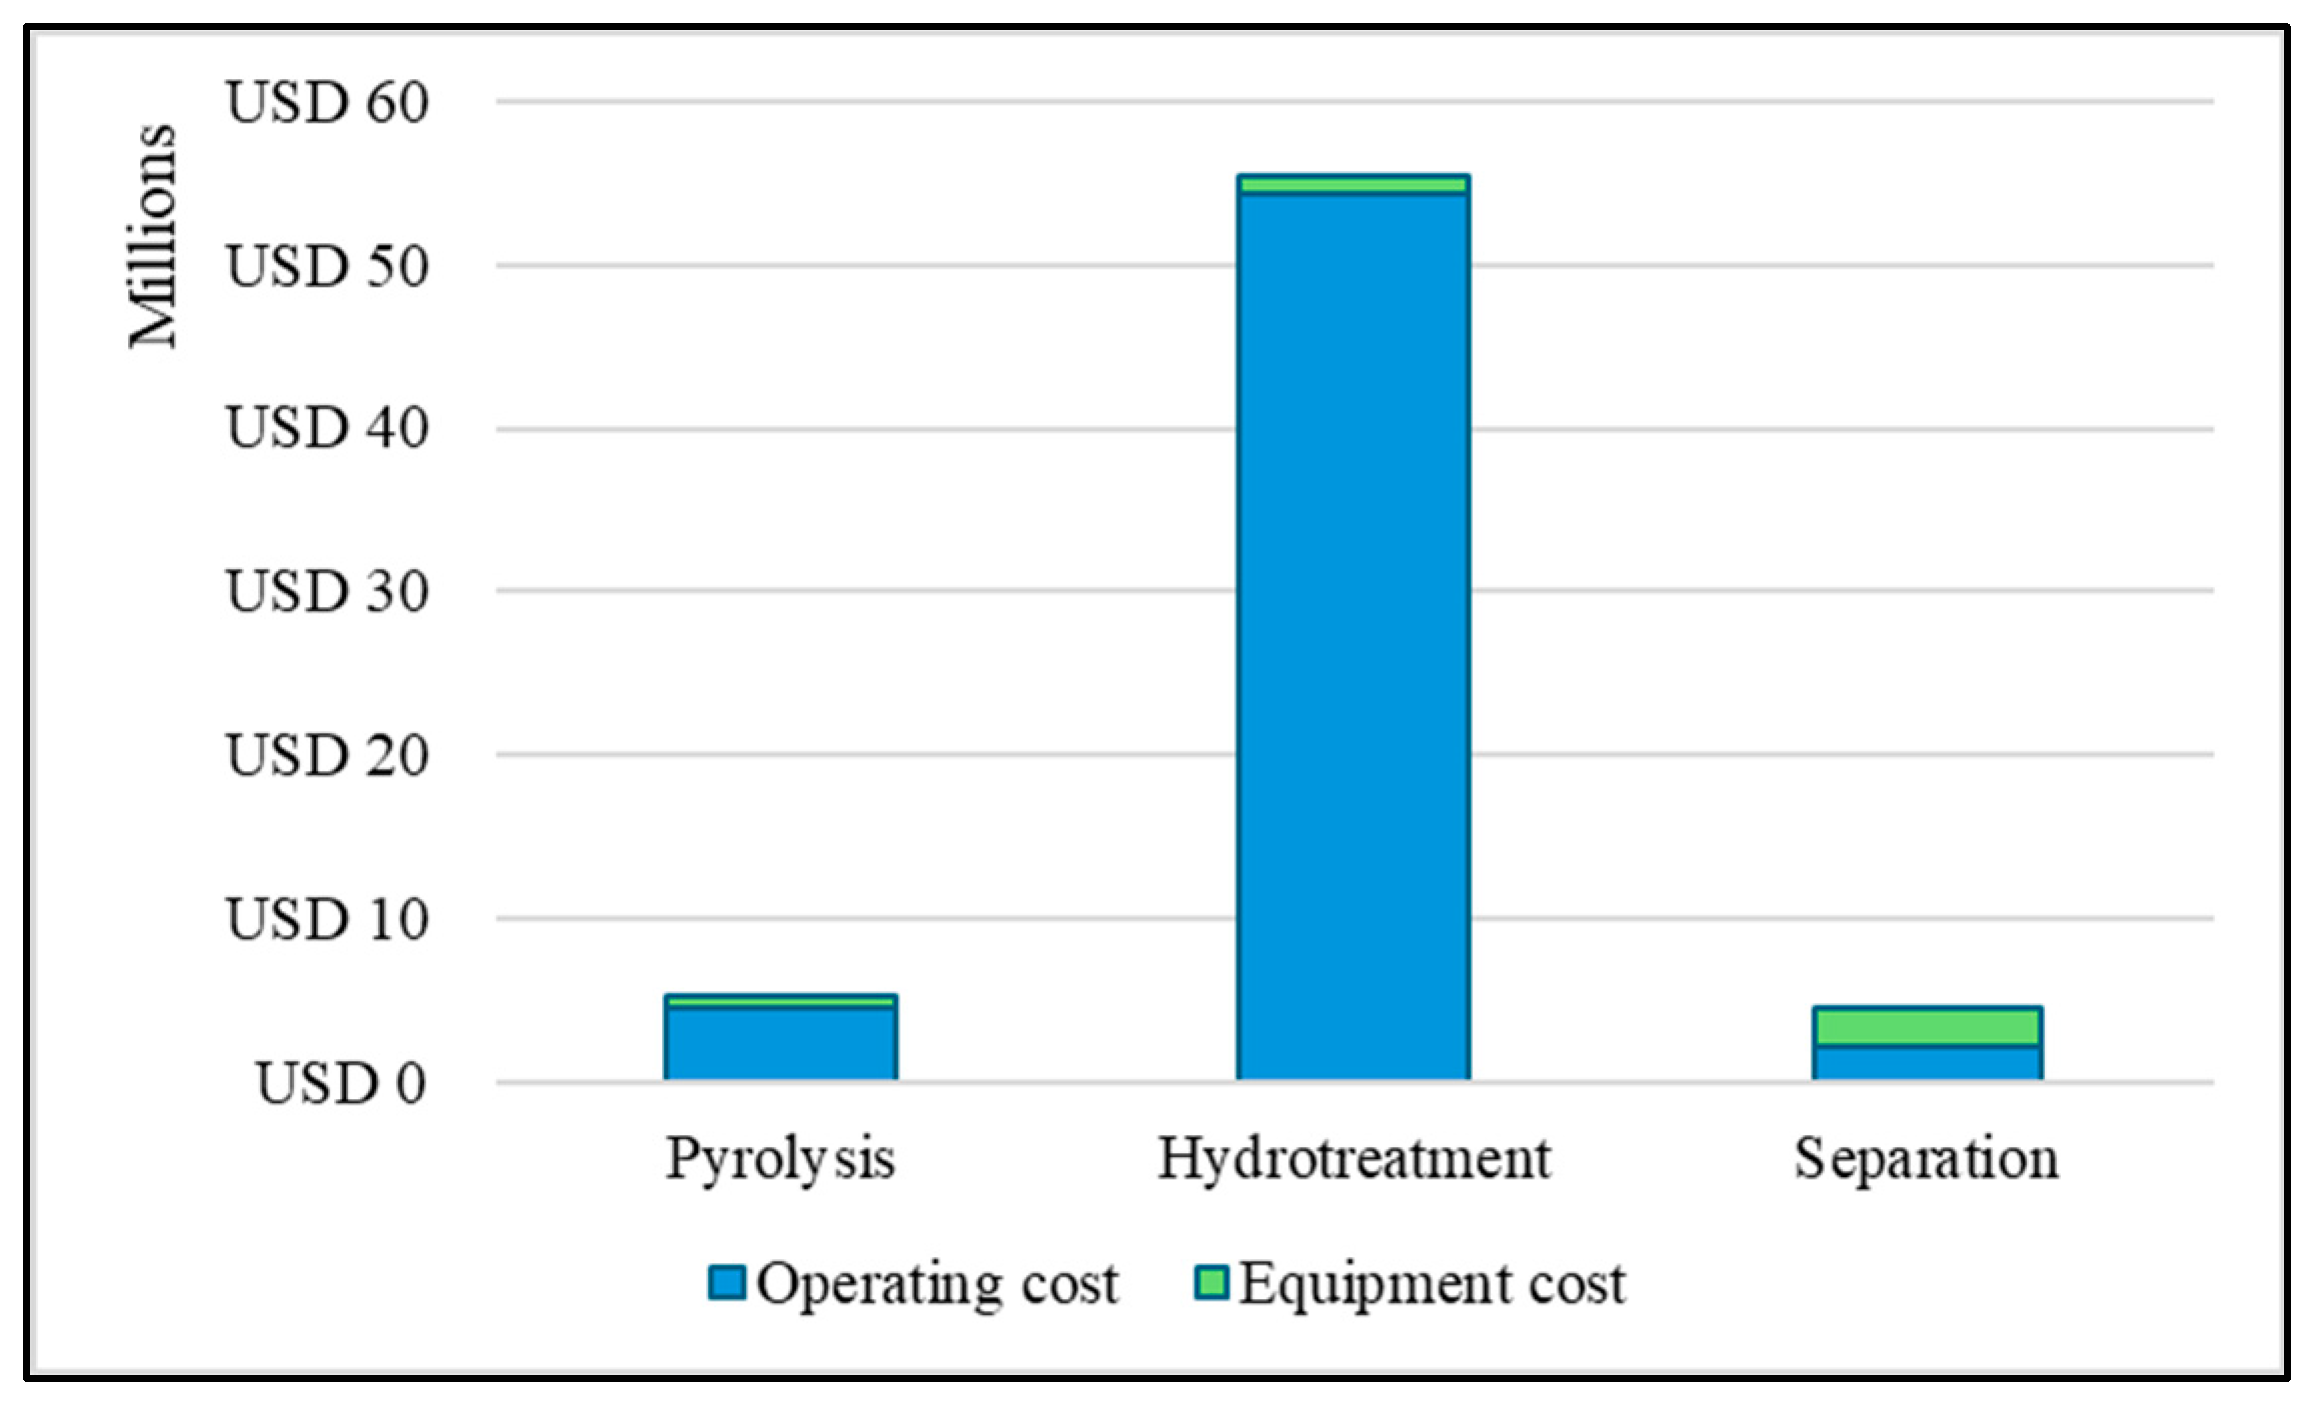
Figure 5 shows the cost distribution between the main steps in SAF production, pyrolysis, hydrotreatment, and separation, where the credits of the feedstock and the product are not included in the distribution. The results indicate that the equipment costs involved for all steps are minimal when compared to the operating costs. For pyrolysis, since nitrogen is extracted from the atmosphere without an additional purchase, the operating cost mainly comes from the utilities. The hydrotreatment operating cost is significantly larger than those of the other two steps due to additional hydrogen and catalyst sourcing, which are the main drivers of the material costs. Finally, the separation of SAF has the lowest operating cost due to its moderate operating temperatures compared to the other units used in the other two steps.
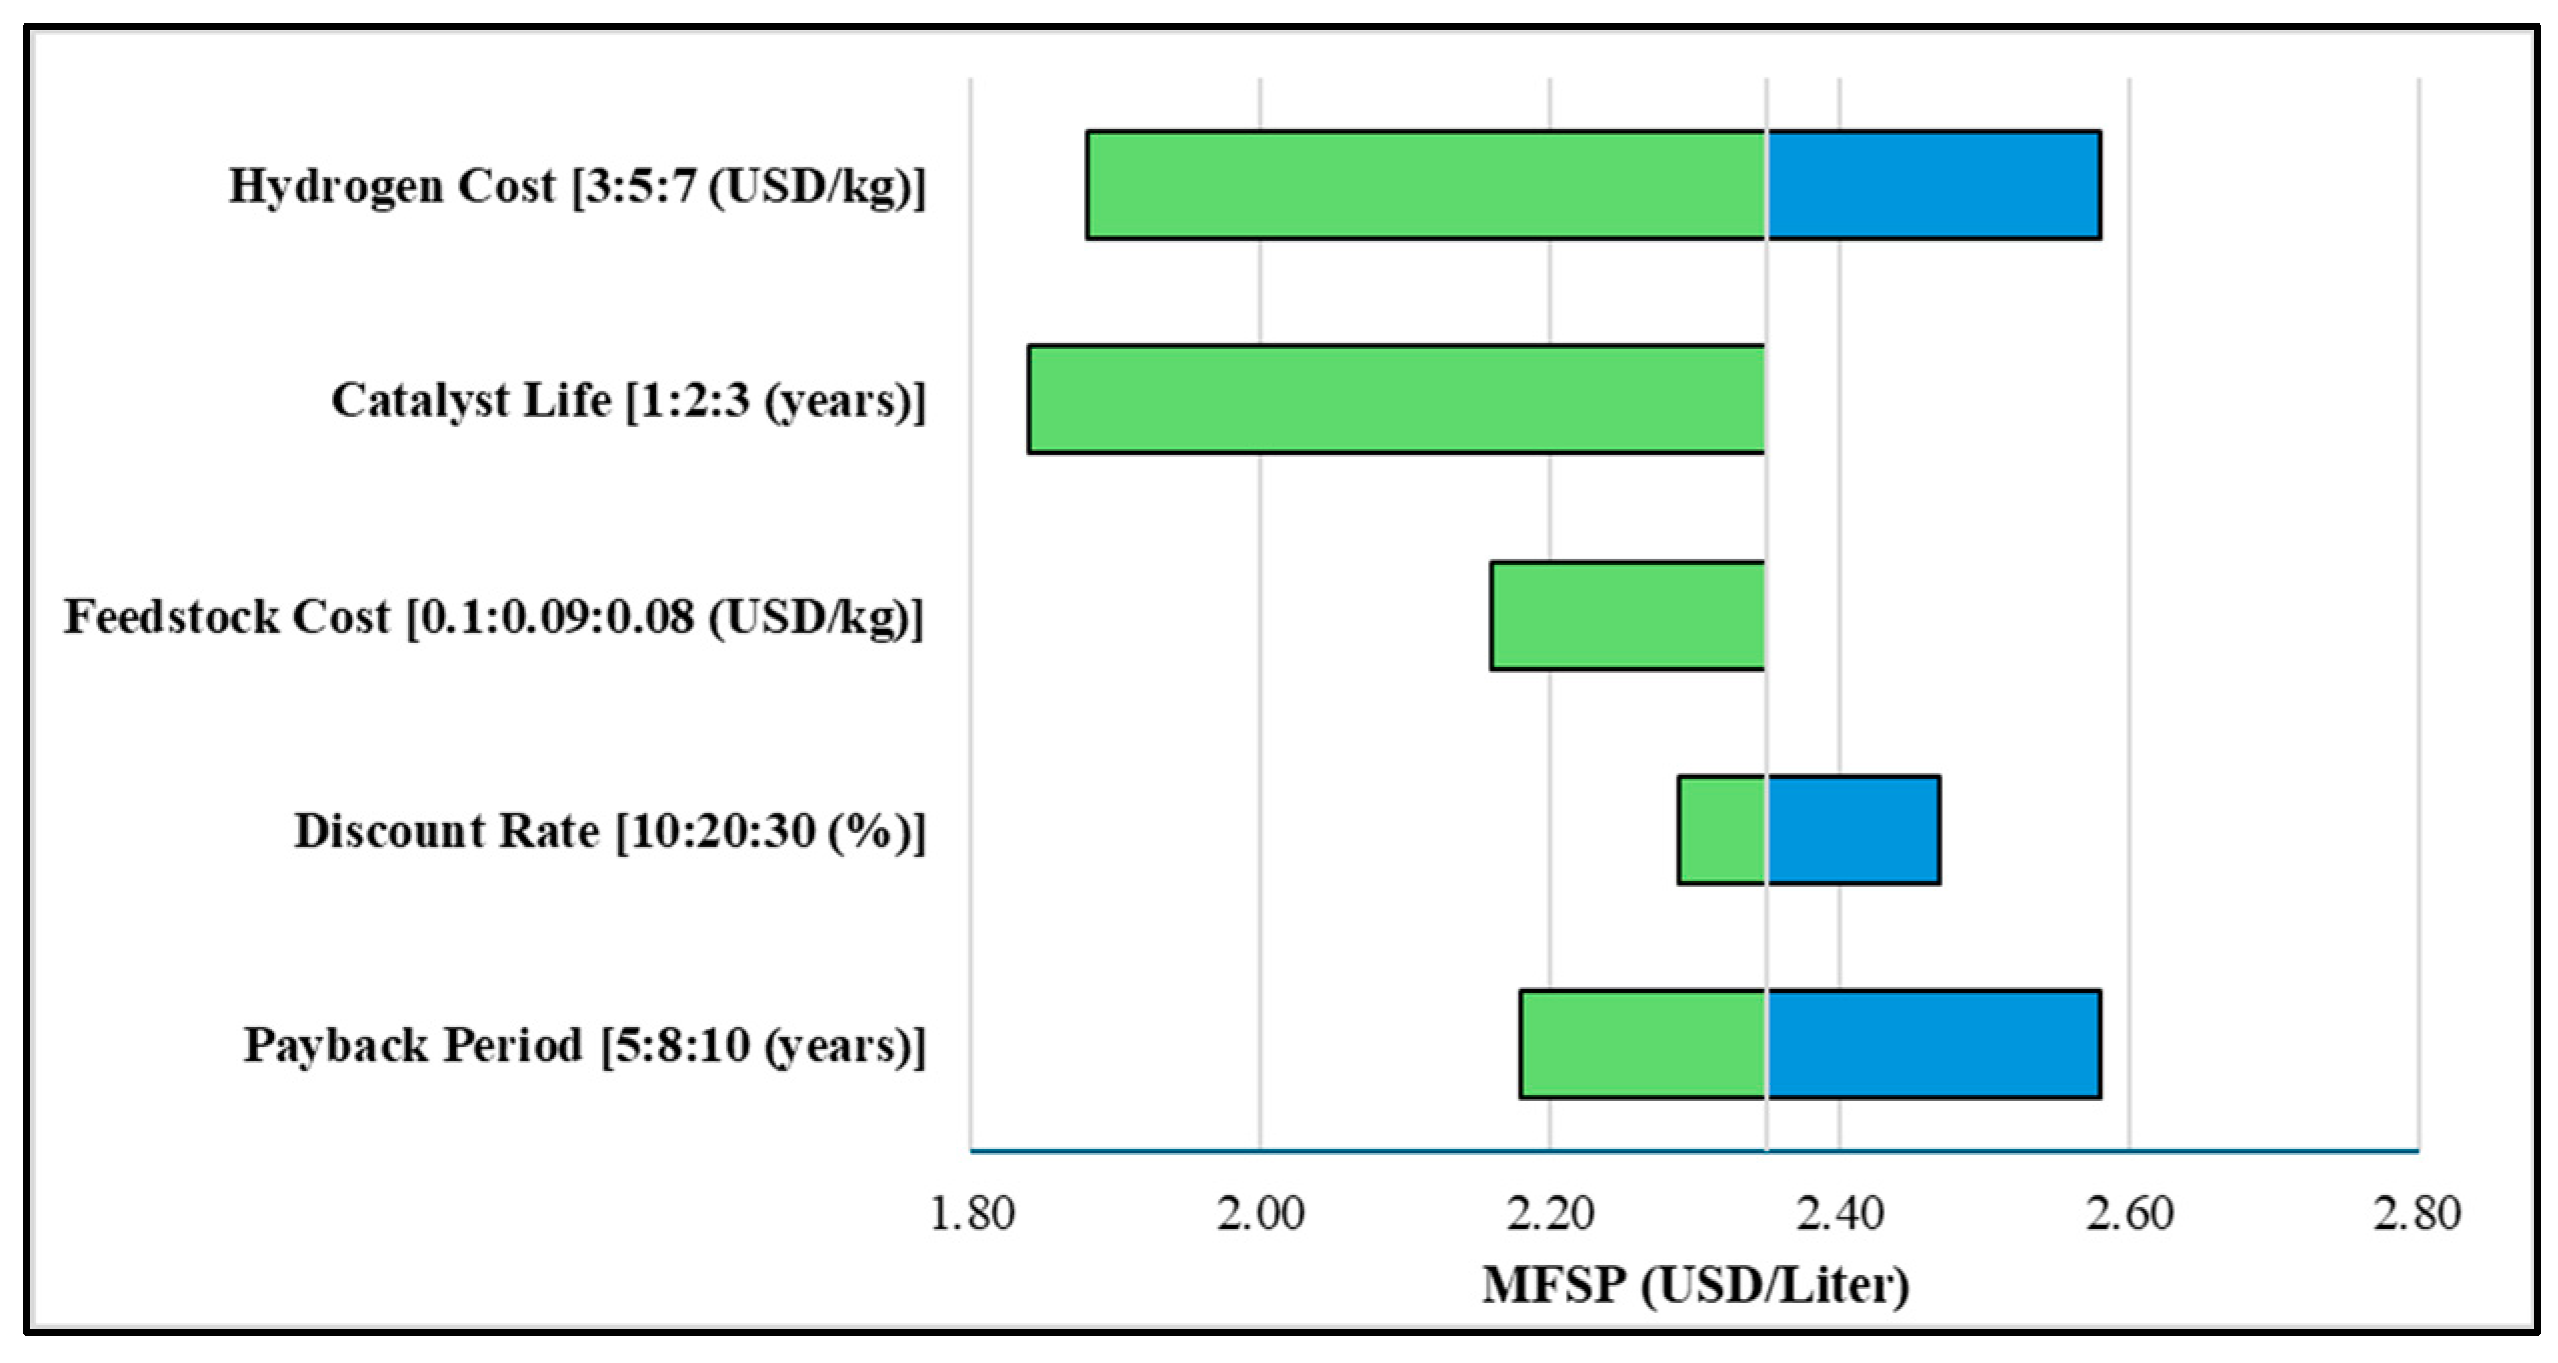
The results of a sensitivity analysis of the cost variables that have the greatest impact on the MFSP are presented in Figure 6. The nominal value of the MFSP is 2.35 USD/Liter, and the possible ranges of the MFSP shown take both cases into account, where the base case represents the maximum value and the optimised case represents the minimum value.
The sensitivity analysis highlights that material-related cost variables have the largest influence on the MFSP. In the original case, conservative assumptions were made by selecting the highest hydrogen cost (7 USD/kg), the shortest catalyst life (1 year), and the highest feedstock cost (0.10 USD/kg), which collectively contributed to a higher MFSP.
However, the analysis implies that optimising these material costs can significantly lower the MFSP. If the hydrogen cost is reduced to 3 USD/kg, the catalyst life is extended to 3 years, and the feedstock cost is lowered to 0.08 USD/kg, the combined effect can bring the MFSP below 2 USD/L, as shown by the lower bounds of the sensitivity bars, which is consistent with the range reported by Tanzil et al. [21]. This suggests that targeted cost reductions for key input materials—whether through improved sourcing, catalyst durability, or feedstock agreements—have the potential to substantially improve the economic feasibility of the fuel production process.
In contrast, the discount rate and payback period have a smaller influence on the MFSP. The original case uses a 10% discount rate and an 8-year payback period. These assumptions position the MFSP closer to the midpoints of their respective sensitivity ranges, indicating that changes in capital recovery conditions are less critical than variations in material costs.
To conclude, this section demonstrates the technical feasibility of producing SAF from CS via FP, followed by hydrotreatment and separation, with Aspen Plus simulations indicating realistic fuel outputs. While the standalone SAF does not meet ASTM standards due to its high FBP, a 10% blend with conventional jet fuel is compliant, highlighting its potential as a transitional solution. Process optimisation through heat integration yielded full heating utility savings and significant cooling savings of 55%, enhancing energy efficiency and sustainability. Economic analysis revealed that while heat integration slashed utility costs by 84%, the MFSP only decreased slightly from 2.35 USD/L to 2.29 USD/L due to unchanging material costs, which were identified as the primary cost drivers. However, sensitivity analysis shows that further cost reductions for feedstock, hydrogen, and catalysts could make SAF more economically competitive.

4. Conclusions

Through an analysis of GHG emissions across various sectors, the aviation industry was recognised as one of the most challenging sectors to decarbonise due to its dependence on high-energy-density fuels and limited alternatives. Simultaneously, the waste management sector was highlighted for substantial GHG emissions from landfills and its potential for valorisation. Utilising the strategic intersection between aviation and waste management, production of SAF from waste feedstocks presents dual benefits. This approach not only mitigates emissions from aviation but also addresses the environmental impact of waste accumulation.
Comprehensive process design of SAF production from CS via FP was implemented in Aspen Plus, which included pyrolysis, hydrotreatment, and separation as the main steps. The results from the simulation indicate that the produced fuel is realistic but does not comply with ASTM specifications as a standalone jet fuel, as it exceeds the final boiling point (FBP) limit. A 10% SAF blend with conventional jet fuel is suggested to enhance fuel quality and satisfy all ASTM requirements. This limitation is expected, as the technology for SAF production from lignocellulosic biomass is relatively young, particularly upgrading oil through hydrotreatment. Nevertheless, the ability to produce an SAF that meets standards in a 10% blend is a promising step forward, offering a transitional pathway toward increased SAF adoption as the technology matures and scalability improves.
To further optimise the process, a heat integration strategy was implemented by combining four pairs of hot and cold streams. This resulted in 100% energy savings for the heating utility and 55% savings for the cooling utility while eliminating the need for high-pressure steam and fired heat in the utility system. Simultaneously, this reduced the reliance on external utilities by maximising heat recovery within the system, making the process more sustainable environmentally and economically.
An economic evaluation was conducted to determine the value of the product. Among the key findings, material costs—particularly those related to hydrogen, catalysts, and feedstock—are the dominant drivers of SAF production economics, significantly influencing the MFSP. Despite the reduction in utility costs, high material costs limited economic improvement, as the MFSP was only reduced from 2.35 USD/L to 2.29 USD/L. However, a sensitivity analysis revealed that targeted cost reductions in material pricing could reduce the MFSP below 2 USD/L, indicating strong potential for economic competitiveness. Although the price of SAF is not yet competitive with conventional jet fuel, its significant advantage in reducing carbon emissions presents a compelling value proposition and serves as a key driver for its adoption.
Overall, the aim of this study to seek sustainable pathways for the transition to a low-carbon energy system while addressing the gap in the technical feasibility of SAF production, particularly for CS via FP, by utilising a waste resource to produce high-value biofuel via an optimised process was achieved. While further improvements are needed to reach its full potential, this work represents a meaningful step forward in advancing sustainable biofuel development.

5. Future Outlook

From the process perspective, the final SAF product from this study exhibits an FBP exceeding the ASTM standard, limiting its direct use as a standalone jet fuel. It is only suitable for use as a blend component, with blends up to 10% in conventional jet fuel meeting standard requirements. Future work should focus on exploring strategies to reduce the FBP of the upgraded oil, such as optimising the hydrotreatment conditions, integrating additional upgrading steps, or tailoring the catalyst selection. Furthermore, the current upgrading process loses carbon as CO2 and CO while removing oxygen, which reduces its efficiency and releases GHGs, indicating the need for technologies that remove oxygen as H2O. These efforts could enable more sustainable production of an SAF that fully complies with ASTM standards for higher blend ratios, and eventually, use as a standalone jet fuel.
From the sustainability perspective, future work should focus on improving supply chains, catalyst life, and feedstock agreements to enhance viability. Additionally, the high hydrogen demand during hydrotreatment remains a critical limitation, indicating the need for process intensification to reduce hydrogen consumption. Finally, future work should also incorporate environmental assessments, such as life cycle analysis (LCA), to quantify the GHG emissions associated with the SAF production process. This would provide critical insight into how effective the pathway is in achieving its intended goal of transitioning to a low-carbon energy system. Evaluating the overall sustainability of the process will help validate its environmental benefits and identify further opportunities for improvement.

Author Contributions

Conceptualization, D.K., A.S. and A.O.; methodology, N.A.N.H., D.K., A.S. and A.O.; software, N.A.N.H.; validation, N.A.N.H., D.K., A.S. and A.O.; formal analysis, N.A.N.H.; investigation, N.A.N.H.; resources, N.A.N.H.; writing—original draft preparation, N.A.N.H.; writing—review and editing, N.A.N.H., D.K., A.S. and A.O. All authors have read and agreed to the published version of the manuscript.

Funding

This research received no external funding.

Data Availability Statement

The original contributions of this study are detailed within the article. For additional information, please contact the author.

Acknowledgments

During the preparation of this manuscript/study, the authors used Aspen Plus V12.1 for the purposes of simulating the process and rendering the economic evaluation of the process. The authors have reviewed and edited the output and take full responsibility for the content of this publication. The authors would like to acknowledge University College London (UCL) for providing access to the Aspen Plus V12.1 software license, which made this research possible.

Conflicts of Interest

The authors declare no conflicts of interest.

Abbreviations

The following abbreviations are used in this manuscript:
FPFast pyrolysis
SAFSustainable aviation fuel
GHGGreenhouse gas
ASTMAmerican Society for Testing and Materials
IATAInternational Air Transport Association
CSCorn stover
RSRice straw
WSWheat straw
SBSugarcane bagasse
G-FTGasification and Fischer–Tropsch
ATJAlcohol to jet
NRELNational Renewable Energy Laboratory
WWDWaste wood-derived
FBPFinal boiling point
HENHeat exchanger network
MFSPMinimum fuel selling price
CAPEXCapital expenditures
OPEXOperating expenditures
TCITotal capital investment
ISBLInside battery limit
FCIFixed capital investment
WCWorking capital

References

  1. World Meteorological Organization (WMO). State of the Global Climate 2024; WMO: Geneva, Switzerland, 2025. [Google Scholar]
  2. UNFCCC. Nationally Determined Contributions (NDCs)|UNFCCC. 2019. Available online: https://unfccc.int/process-and-meetings/the-paris-agreement/nationally-determined-contributions-ndcs (accessed on 7 April 2025).
  3. Ritchie, H. Sector by Sector: Where Do Global Greenhouse Gas Emissions Come From? Our World in Data. 2020. Available online: https://ourworldindata.org/ghg-emissions-by-sector (accessed on 7 April 2025).
  4. International Air Transport Association (IATA). Net Zero 2050: Sustainable Aviation Fuels. 2024. Available online: https://www.iata.org/en/iata-repository/pressroom/fact-sheets/fact-sheet-sustainable-aviation-fuels/ (accessed on 7 April 2025).
  5. Millati, R.; Cahyono, R.B.; Ariyanto, T.; Azzahrani, I.N.; Putri, R.U.; Taherzadeh, M.J. Agricultural, Industrial, Municipal, and Forest Wastes. In Sustainable Resource Recovery and Zero Waste Approaches; Elsevier: Amsterdam, The Netherlands, 2019; pp. 1–22. [Google Scholar]
  6. Mekunye, F.; Makinde, P. Production of Biofuels from Agricultural Waste. Asian J. Agric. Hortic. Res. 2024, 11, 37–49. [Google Scholar] [CrossRef]
  7. Bundhoo, Z.M.A. Potential of bio-hydrogen production from dark fermentation of crop residues: A review. Int. J. Hydrogen Energy 2019, 44, 17346–17362. [Google Scholar] [CrossRef]
  8. Chandel, A.K.; Albarelli, J.Q.; Santos, D.T.; Chundawat, S.P.; Puri, M.; Meireles, M.A.A. Comparative analysis of key technologies for cellulosic ethanol production from Brazilian sugarcane bagasse at a commercial scale. Biofuels Bioprod. Biorefining 2019, 13, 994–1014. [Google Scholar] [CrossRef]
  9. Michailos, S.; Webb, C. Valorization of rice straw for ethylene and jet fuel production: A technoeconomic assessment. In Food Indutry Wastes; Elsevier: London, UK, 2020; pp. 201–221. [Google Scholar]
  10. Rezania, S.; Oryani, B.; Cho, J.; Talaiekhozani, A.; Sabbagh, F.; Hashemi, B.; Rupani, P.F.; Mohammadi, A.A. Different pretreatment technologies of lignocellulosic biomass for bioethanol production: An overview. Energy 2020, 199, 117457. [Google Scholar] [CrossRef]
  11. Deshavath, N.N.; Mahanta, S.R.; Goud, V.V.; Dasu, V.V.; Rao, P.S. Chemical composition analysis of various genetically modified sorghum traits: Pretreatment process optimization and bioethanol production from hemicellulosic hydrolyzates without detoxification. J. Environ. Chem. Eng. 2018, 6, 5625–5634. [Google Scholar] [CrossRef]
  12. Najafi, H.; Sani, A.G.; Sobati, M.A. A comparative evaluation on the physicochemical properties of sugarcane residues for thermal conversion processes. Ind. Crops Prod. 2023, 202, 117112. [Google Scholar] [CrossRef]
  13. Elsagan, Z.A.; Ali, R.M.; El-Naggar, M.A.; El-Ashtoukhy, E.-S.Z.; AbdElhafez, S.E. New perspectives for maximizing sustainable bioethanol production from corn stover. Renew. Energy 2023, 209, 608–618. [Google Scholar] [CrossRef]
  14. Chen, C.; Qu, B.; Wang, W.; Wang, W.; Ji, G.; Li, A. Rice husk and rice straw torrefaction: Properties and pyrolysis kinetics of raw and torrefied biomass. Environ. Technol. Innov. 2021, 24, 101872. [Google Scholar] [CrossRef]
  15. Nath, B.; Bowtell, L.; Chen, G.; Graham, E.; Nguyen-Huy, T. Pyrolytic Pathway of Wheat Straw Pellet by the Thermogravimetric Analyzer. Energies 2024, 17, 3693. [Google Scholar] [CrossRef]
  16. Bittner, A.; Tyner, W.E.; Zhao, X. Field to flight: A techno-economic analysis of the corn stover to aviation biofuels supply chain. Biofuels Bioprod. Biorefining 2015, 9, 201–210. [Google Scholar] [CrossRef]
  17. Swanson, R.M.; Platon, A.; Satrio, J.A.; Brown, R.C. Techno-economic analysis of biomass-to-liquids production based on gasification. Fuel 2010, 59, S11–S19. [Google Scholar] [CrossRef]
  18. Voß, S.; Bube, S.; Kaltschmitt, M. Aviation fuel production pathways from lignocellulosic biomass via alcohol intermediates—A technical analysis. Fuel Commun. 2023, 17, 100093. [Google Scholar] [CrossRef]
  19. Liu, Y.; Wang, W. Process design and evaluations for producing pyrolytic jet fuel. Biofuels Bioprod. Biorefining 2019, 14, 249–264. [Google Scholar] [CrossRef]
  20. Howe, D.; Westover, T.; Carpenter, D.; Santosa, D.; Emerson, R.; Deutch, S.; Starace, A.; Kutnyakov, I.; Lukins, C. Field-to-Fuel Performance Testing of Lignocellulosic Feedstocks: An Integrated Study of the Fast Pyrolysis–Hydrotreating Pathway. Energy Fuels 2015, 29, 3188–3197. [Google Scholar] [CrossRef]
  21. Tanzil, A.H.; Brandt, K.; Wolcott, M.; Zhang, X.; Garcia-Perez, M. Strategic assessment of sustainable aviation fuel production technologies: Yield improvement and cost reduction opportunities. Biomass Bioenergy 2021, 145, 105942. [Google Scholar] [CrossRef]
  22. Han, J.; Elgowainy, A.; Cai, H.; Wang, M.Q. Life-cycle analysis of bio-based aviation fuels. Bioresour. Technol. 2013, 150, 447–456. [Google Scholar] [CrossRef]
  23. Aspen Technology, Inc. Aspen Plus®. Available online: https://www.aspentech.com/en/products/engineering/aspen-plus (accessed on 7 April 2025).
  24. DIN 51718; Determining the Moisture Content of Solid Fuels. Deutsches Institut für Normung: Berlin, German, 2002.
  25. DIN 51720; Determining the Volatile Matter Content of Solid Fuels. Deutsches Institut für Normung: Berlin, German, 2001.
  26. DIN 51719; Determination of Ash in Solid Mineral Fuels. Deutsches Institut für Normung: Berlin, German, 1997.
  27. Heng, L.; Zhang, H.; Xiao, J.; Xiao, R. Life Cycle Assessment of Polyol Fuel from Corn Stover via Fast Pyrolysis and Upgrading. ACS Sustain. Chem. Eng. 2018, 6, 2733–2740. [Google Scholar] [CrossRef]
  28. Dutta, A. Ex Situ and In Situ Catalytic Fast Pyrolysis Models (Aspen Plus Models); OSTI OAI (U.S. Department of Energy Office of Scientific and Technical Information): Golden, CO, USA, 2019.
  29. Schmitt, C.C.; Raffelt, K.; Zimina, A.; Krause, B.; Otto, T.; Rapp, M.; Grunwaldt, J.-D.; Dahmen, N. Hydrotreatment of Fast Pyrolysis Bio-Oil Fractions Over Nickel-Based Catalyst. Top. Catal. 2018, 61, 1769–1782. [Google Scholar] [CrossRef]
  30. Blažek, J.; Kochetkova, D.; Shumeiko, B.; Váchová, V.; Straka, P. Effect of the hydrogen to feedstock ratio on the hydrotreating of the mixture of petroleum middle distillates and rapeseed oil. Paliva 2020, 12, 42–52. [Google Scholar] [CrossRef]
  31. Sinnott, R.K. Process Integration and Pinch Technology page. In Coulson & Richardson’s Chemical Engineering; Elsevier Butterworth-Heinemann: Oxford, UK, 2005; pp. 111–124. [Google Scholar]
  32. Liporace, F.S.; Pessoa, F.L.P.; Queiroz, E.M. Heat Exchanger Network Synthesis Considering Changing Phase Streams. Rev. Eng. Térmica 2004, 3, 87. [Google Scholar] [CrossRef]
  33. Jeon, H.; Youn, J.; Park, J.Y.; Yim, E.-S.; Ha, J.-M.; Park, Y.-K.; Lee, J.W.; Kim, J.-K. Evaluation of the Properties and Compositions of Blended Bio-jet Fuels Derived from Fast Pyrolysis Bio-oil made from Wood According to Aging Test. Korean J. Chem. Eng. 2024, 41, 3631–3646. [Google Scholar] [CrossRef]
  34. ASTM D7566; Standard Specification for Aviation Turbine Fuel Containing Synthesized Hydrocarbons. ASTM International: West Conshohocken, PA, USA, 2024.
  35. Lau, J.I.C.; Wang, Y.S.; Ang, T.; Seo, J.C.F.; Khadaroo, S.N.B.A.; Chew, J.J.; Ng Kay Lup, A.; Sunarso, J. Emerging technologies, policies and challenges toward implementing sustainable aviation fuel (SAF). Biomass Bioenergy 2024, 186, 107277. [Google Scholar] [CrossRef]
Figure 1. The strategy for building and validating the Aspen Plus model of FP of CS.
Energies 18 03418 g001
Figure 2. Overall process flow sheet of SAF production using CS as feedstock.
Energies 18 03418 g002
Figure 3. Aspen Plus flow sheet of process of production of SAF from CS.
Energies 18 03418 g003
Figure 4. A summary of the heat exchanger network design of possible matches between the streams and the remaining cold utility supply required.
Energies 18 03418 g004
Figure 5. The distribution of the operating and equipment costs between the processing steps.
Energies 18 03418 g005
Figure 6. A sensitivity analysis of the cost variables with the greatest impact on the MFSP.
Energies 18 03418 g006
Table 1. Ultimate and proximate analyses for CS (dry basis) [13].
Ultimate AnalysisProximate Analysis
ElementWt %ElementWt %
Carbon41.63Moisture1.00
Hydrogen5.75Volatile matter74.72
Oxygen51.54Fixed carbon18.30
Nitrogen1.08Ash5.99
Sulphur0.62
Table 2. The design parameters of the FP process using CS as the feedstock [19,20].
ParameterType/Value
FeedstockCorn stover
Capacity (tonnes/day)600
Reactor typeBubbling fluidised bed
Reaction   temperature   ( ° C )500
Inlet pressure (kPa)1.013
Carrier gasNitrogen
Oil yield (%)56.2
Char yield (%)19.1
Gas yield (%)22.3
Table 3. Compounds and composition of bio-oil, biogas, and biochar resulting from FP of CS [20,27].
TypeCompoundWt % in Respective Type
Bio-oilFormic acid8.55
Acetic acid4.41
Glycolaldehyde5.97
Hydroxy acetone5.65
Furfural4.97
2(5H)-Furanone 2.62
Levoglucosan9.41
Glucose 8.19
Phenol5.58
Guaiacol9.04
Xylenol8.26
Eugenol8.07
Water19.28
BiogasCarbon dioxide40.60
Carbon monoxide38.34
Methane0.73
Ethylene0.80
Hydrogen11.03
Propane1.20
Ammonia6.31
Sulphur dioxide0.40
Hydrogen sulphide 0.60
BiocharCarbon54.70
Hydrogen2.60
Oxygen24.80
Nitrogen0.00
Sulphur0.07
Ash17.85
Table 4. The design parameters of the first and second stages of the hydrotreatment process [19,20,30].
ParameterFirst Stage Second Stage
FeedstockPyrolytic oilMild hydrotreated oil
Reaction temperature (°C)220400
Inlet pressure (MPa)10.710.7
Inlet gasHydrogenHydrogen
CatalystRu/CCo/Mo on Al
H2-to-oil ratio (m3/m3)240500
Table 5. The design parameters of the columns for SAF separation.
ParameterColumn 1Column 2
Number of stages2027
Feed stage615
Reflux ratio0.951
Top stage pressure241 kPa103 kPa
Column pressure drop34 kPa34 kPa
CondenserTotalTotal
ReboilerKettleKettle
Table 6. The streams involved in the pinch analysis.
StreamTin (°C)Tout (°C)Heat Duty (kW)Heat Flux (kW/°C)
H1 (through Cooler 1)50025−9901.7720.8
H2 (through Cooler 2)38925−7766.5821.3
C1 (through Heater 2)2204002823.2415.7
C2 (through Heater 1)362201489.228.1
C3 (through Heater 3)25220751.763.9
C4 (through Heater 2)253904512.8912.4
Table 7. A list of the fixed OPEX values [19].
Position Amount Unit Cost (USD per Year)
Vice plant manager 3 61,563
Maintenance supervisor 1 19,788
Maintenance engineer 3 18,469
Maintenance technician 5 15,391
Plant supervisor 2 21,987
Plant engineer 5 20,228
Plant technician 7 17,590
Yard employees 2 9674
Accountant and secretaries 3 14,072
Plant manager 1 70,358
Table 8. A list of the variable OPEX values [19,23].
Material Consumption Unit Cost (USD per Unit)
Feedstock 25,000.00 kg/h 0.10/kg
Hydrogen 411 kg/h 7.00/kg
Ru/C catalyst6859.00 kg/year 3183.33/kg
CoMo on Al catalyst4063.00 kg/year 200.00/kg
Wastewater treatment chemicals 5.00 kg/h 6.65/kg
Electricity 179.14 kW 13.88/h
Cooling water 1748.00 L/h 46.14/h
Refrigerant 5.00 kg/h 0.95/h
High-pressure steam 3328.60 kWh 50.88/h
Fired heat 4.44 kg/h 114.73/h
Table 9. A list of the equipment and installation costs for the base case and the optimised case extracted from the APEA in Aspen Plus V12.1 [23].
UnitBase Case Optimised Case
Equipment Installation Equipment Installation
Column 1 USD 293,900.00 USD 808,600.00 USD 293,900.00 USD 808,600.00
Column 2 USD 190,500.00 USD 656,800.00 USD 190,500.00 USD 656,800.00
Cooler 1 USD 59,200.00 USD 239,400.00 USD 45,500.00 USD 144,800.00
Cooler 2 USD 33,700.00 USD 231,200.00 USD 104,500.00 USD 256,100.00
Cooler 3 USD 11,100.00 USD 76,900.00 USD 11,100.00 USD 76,900.00
Cyclone USD 52,911.85 USD 26,455.93 USD 52,911.85 USD 26,455.93
Dryer USD 14,146.00 USD 7073.00 USD 14,146.00 USD 7073.00
Flash 1 USD 21,900.00 USD 136,400.00 USD 21,900.00 USD 136,400.00
Flash 2 USD 22,300.00 USD 136,900.00 USD 22,300.00 USD 136,900.00
Grinder USD 28,000.00 USD 14,000.00 USD 28,000.00 USD 14,000.00
Hydrotreater (Stage 1) USD 125,900.00 USD 306,600.00 USD 125,900.00 USD 306,600.00
Hydrotreater (Stage 2) USD 183,700.00 USD 468,900.00 USD 183,700.00 USD 468,900.00
HEX 1/Heater 1 * USD 27,800.00 USD 119,900.00 USD 87,200.00 USD 520,400.00
HEX 2/Heater 2 * USD 687,600.00 USD 412,560.00 USD 19,300.00 USD 121,800.00
HEX 3/Heater 3 * USD 33,400.00 USD 147,800.00 USD 51,700.00 USD 288,900.00
HEX 4/Heater 4 * USD 73,000.00 USD 342,600.00 USD 19,100.00 USD 121,400.00
LL (Separator 1) USD 17,600.00 USD 122,500.00 USD 17,600.00 USD 122,500.00
LL (Separator 2) USD 21,900.00 USD 136,400.00 USD 21,900.00 USD 136,400.00
Pump 1 USD 107,300.00 USD 155,100.00 USD 107,300.00 USD 155,100.00
Pump 2 USD 5700.00 USD 37,500.00 USD 5700.00 USD 37,500.00
Pyrolysis Reactor USD 416,730.81 USD 375,057.73 USD 416,730.81 USD 375,057.73
*: A heater was used in the base case, while a heat exchanger (HEX) was used in the optimised case.
Table 10. The assumptions of the total CAPEX [19].
Parameter Assumption
Total direct cost (TDC)
Inside battery limits Equipment with installation cost
Warehouse 5.7% of ISBL cost
Site development 12.9% of ISBL cost
Additional piping 6.4% of ISBL cost
Total indirect cost (TIC)
Engineering and supervision 13.7% of TDC
Construction expense 34% of TDC
Total direct and indirect cost (TDIC) TDC + TIC
Contractors 5% of TDIC
Contingency 10% of TDIC
Fixed capital investment (FCI) TDIC + OSBLs + contractors + contingency
Working capital (WC) 10% of FCI
Land 5% of ISBL cost
Total CAPEX FCI + WC + land
Table 11. The financial assumptions [19].
ParameterAssumption
Base year2025
Operating hours per year8088
Loan amount60%
Loan interest6%
Loan term5 years
Working capital (% of FCI)10%
Depreciation period8 years (linear)
General plant7 years
Steam plant20 years
Construction period3 years
% spent in year 230%
% spent in year 130%
% spent in year 040%
Discount rate10%
Income tax rate30%
Table 12. Elemental composition of final SAF product.
ComponentDaniel Howe et al. [20]This Paper
C (wt %) 85.30 85.50
H (wt %) 12.89 14.43
O (wt %) 0.66 0.01
S (wt %) 0.00 0.07
N (wt %) 0.00 0.00
Table 13. The compounds and composition of the final SAF product (after separation).
Compound GroupModel CompoundFormulaWt %
Normal paraffinHexaneC6H140.00
DodecaneC12H2621.02
OctadecaneC18H380.00
1so-paraffin3-Methyl hexaneC7H1612.79
4-methylnonaneC10H2219.80
CyclopentaneCyclopentane, ethylC7H146.86
1-methyl-I-ethyl cyclopentaneC8H169.99
CyclohexaneCyclohexaneC6H120.01
Cyclohexane, butyl-C10H207.59
1,1-Bi-cyclohexylC12H222.03
Cyclo-C7+1,3-dimethyladamantaneC12H204.67
AromaticsO-xyleneC8H100.01
Benzene, I-ethenyl-4-ethyl-C10H126.05
Heavies4-methylphenanthreneC15H120.00
PyreneC16H100.00
Diphenyl1,2-DiphenylethaneC14H140.00
Indanes and indeneIndaneC9H104.17
1 H-Indene, 1,2,3-trirnethyl-C12H140.87
1,2,3,4 NaphthaleneI-n-Hexy1-1,2,3,4-TetrahydronaphthaleneC16H240.00
NaphthaleneNaphthalene, 2,7-dimethylC12H120.28
PNAsNaphthalene, 1-phenyl-C16H120.00
Oxygenate5-Methyl-2-(1-methylethyl)-phenolC10H14O3.32
Nitrogen compounds2,4,6-trimethylpyridineC8H11N0.54
Sulphur compoundsDibenzothiopheneC12H8S0.00
Table 14. A comparison between the jet fuel properties required by ASTM D7566 and the properties of jet fuel from 100% waste wood-derived (WWD) SAF and 100% conventional jet fuel from the literature [33].
PropertyUnitRequirement
(ASTM D7566 [34])
WWD SAFConventional Jet Fuel
TANmg KOH/gMax 0.100.0230.001
Density at 15 °Ckg/m3775–840801.4793.6
Freezing point°CMax −47Over −100−51.5
Viscosity at −20 °Cmm/s2Max 8.03.213.537
Water contentmg/kgMax 754225
FBP°CMax 300312296.6
Table 15. A comparison of the SAF composition in this paper with the compositions of 100% waste wood-derived (WWD) SAF and 100% conventional jet fuel from the literature [33].
WWD SAF Conventional Jet Fuel This Paper
Paraffins (%) 24.7 62.4 53.6
Naphthene (%) 58.1 13.3 31.2
Aromatics (%) 2.0 21.6 11.1
Oxygenates (%) 3.3 1.6 3.3
Others (%) 0.9 0.1 0.8
Table 16. Stream pairing for HEN design.
No.StreamsHeat Transfer Available (kW)Hot Stream Outlet T (°C)Cold Stream
Outlet T (°C)
1 H1 and C1 2823.24 272 220
2 H1 and C2 1489.22 193 400
3 H2 and C3 751.76 234 220
4 H2 and C4 4512.89 200 390
Table 17. A breakdown of the economic analysis results.
ItemsBase CaseOptimised Case
Variable OPEX (MM USD/Year)
Material66.52 66.52
Utilities 1.99 0.33
Fixed OPEX (MM USD/year)
Labour 0.73 0.73
Other overhead 0.41 0.41
CAPEX (MM USD)
ISBL cost7.39 5.92
FCI 18.6 14.94
WC 1.86 1.49
Land 0.37 0.30
MFSP (USD/L)
SAF 2.35 2.29
Disclaimer/Publisher’s Note: The statements, opinions and data contained in all publications are solely those of the individual author(s) and contributor(s) and not of MDPI and/or the editor(s). MDPI and/or the editor(s) disclaim responsibility for any injury to people or property resulting from any ideas, methods, instructions or products referred to in the content.

