Article

Effects of Natural Fractures on Coal Drilling Response: Implications for CBM Fracturing Optimization

1
School of Earth Resources, China University of Geosciences, Wuhan 430074, China
2
Research Institute of Petroleum Exploration & Development, PetroChina, Beijing 100083, China
3
Wuhan Center of Geological Survey, China Geological Survey, Wuhan 430205, China
*
Author to whom correspondence should be addressed.
Energies 2025, 18(13), 3404; https://doi.org/10.3390/en18133404 (registering DOI)
Submission received: 3 June 2025 / Revised: 24 June 2025 / Accepted: 25 June 2025 / Published: 27 June 2025
(This article belongs to the Section H: Geo-Energy)

Abstract

The efficiency of coalbed methane (CBM) extraction is closely related to the drilling response of coal seams, which is significantly influenced by natural fracture development of coal seams. This work investigated 11 coal samples from the Baode, Xinyuan, and Huolinhe mines, employing quantitative fracture characterization, acoustic wave testing, drilling experiments, and cuttings analysis to systematically reveal the relationships and mechanisms between fracture parameters and coal drilling response characteristics. The result found that acoustic parameters (average wave velocity v and drilling surface wave velocity v0) exhibit significant negative correlations with fracture line density (ρ1) and area ratio (ρ2) (|r| > 0.7), while the geological strength index (GSI) positively correlates with acoustic parameters, confirming their utility as indirect indicators of fracture development. Fracture area ratio (ρ2) strongly correlates with drilling cuttings rate q (r = 0.82), whereas GSI negatively correlates with drilling rate w, indicating that highly fractured coal is more friable but structural stability constrains drilling efficiency, while fracture parameters show limited influence on drill cuttings quantity Q. Cuttings characteristics vary with fracture types and density. Type I coal (low-density coexisting exogenous fractures and cleats) produces cuttings dominated by fine particles with concentrated size distribution (average particle size d ≈ 0.52 mm, crushability index n = 0.46–0.61). Type II coal (exogenous-fracture-dominant) exhibits coarser particle sizes in cuttings (d ≈ 0.8 mm, n = 0.43–0.53). Type III coal (dense-cleat-dominant) drill cuttings are mainly coarse particles and are concentrated in distribution (d ≈ 1.53 mm, n = 0.72–0.98). Additionally, drilling response differences are governed by the coupling effects of vitrinite reflectance (Ro), density, and firmness coefficient (f), with Huolinhe coal being easier to drill due to its lower Ro, f, and density. This study elucidates the mechanism by which fracture development affects coal drilling response through multi-parameter correlation analysis, while also providing novel insights into the optimization of fracturing sweet spot selection for CBM development.

1. Introduction

Coalbed methane (CBM), as a clean and efficient unconventional natural gas resource, plays a pivotal role in the global energy landscape. China possesses abundant CBM reserves, primarily distributed across multiple typical CBM basins, including the Qinshui Basin, Eastern Margin of the Ordos Basin, Junggar Basin, and Erlian Basin (Figure 1) [1,2,3,4,5]. Among them, the Qinshui and Ordos Basins are dominated by medium- and high-rank coal and have achieved large-scale commercial development. While the Erlian Basin, as a low-rank coal enrichment area, exhibits enormous development potential due to its extensive coal-bearing areas and thick coal seams, its current exploration level remains low [6]. The development of CBM in these basins holds significant importance for alleviating domestic energy pressure, optimizing the energy consumption mix, and advancing energy conservation and emission reduction. However, CBM extraction efficiency is profoundly influenced by drilling response, which in turn is largely affected by the degree of its fracture development. The presence and configuration of coal fractures not only dictate the ease of coal fragmentation but also directly affect the effectiveness of critical engineering processes, such as drilling and hydraulic fracturing fracture propagation [7,8,9]. Consequently, research on the drilling response characteristics of coals with varying fracture systems carries substantial theoretical and practical implications for enhancing CBM development efficiency.
Extensive research has been conducted by domestic and international scholars on coal rock fractures and drillability. In the field of fracture characterization, Deisman et al. [10] proposed the Geological Strength Index (GSI), providing a novel methodology to quantify the influence of fractures on the mechanical properties of coal reservoirs. Sui et al. [11] innovatively integrated multiple geometric analysis approaches, achieving refined characterization of fracture networks. The application of scanning electron microscopy (SEM) and computed tomography (CT) scanning technologies has further advanced coal rock fracture research into a quantitative phase [12,13,14,15]. Hu et al. [12] utilized SEM to obtain fracture width and density parameters, comprehensively characterizing fracture development through a fracture development index. Zhang and Tian et al. [16,17] established image-analysis-based quantitative fracture characterization systems using industrial micro-CT and full-diameter CT scanning, respectively.
Regarding drillability evaluation, rock drillability classification reflects the difficulty of rock fragmentation, which is influenced not only by drilling techniques and operational measures but also by the intrinsic mechanical properties of the rock itself [18]. Karasawa et al. [19] developed a computational model for rock drillability strength through laboratory drilling experiments, while Wang et al. [20] further deepened the quantitative correlations between drilling parameters and rock mechanical properties. Traditional drillability evaluation relies on parameters like weight on bit, rotational speed, and drilling rate [21], but this approach has limitations. Xie et al. [22] proposed a coal rock drillability classification method based on mechanical specific energy (MSE) theory, and Liu et al. [23,24] introduced intelligent algorithm-driven identification techniques, both of which have pioneered new pathways for drillability assessment. Additionally, Zhu et al. [25] investigated the distribution characteristics of nano-to-microscale coal dust particles under varying cutting and drilling parameters, offering microscopic insights for drilling process optimization. Geng et al. [26] analyzed the dynamic evolution of drilling parameters during borehole enlargement in tectonically deformed coals, enhancing the understanding of drillability under complex geological conditions.
Furthermore, significant advancements have been made in studying the particle size distribution and morphological features of coal cuttings, which are direct byproducts of drilling operations. Xiao, Zhang, and Wolf et al. [27,28,29] systematically revealed the particle size, morphology, and fractal characteristics of coal cuttings through image processing technologies. The Rosin–Rammler particle size distribution model has been widely adopted as a mathematical tool to quantitatively characterize the multi-scale particle size distribution of coal cuttings [30,31]. Kumar et al. [30] combined sieve experiments with this model to analyze coarseness index, mean particle size, and specific surface area, elucidating their quantitative correlations with drilling rates. Zhou et al. [32] employed field tests and the Rosin–Rammler model to clarify variations in cutting particle size and volume with borehole depth. Wang et al. [33] proposed a fractal particle size distribution model, providing a novel quantitative perspective for cutting particle analysis. Moreover, Zhao and Lv et al. [34,35] established mathematical relationships between coal structure and cutting particle size, linking cutting studies to the macroscopic properties of coal masses and broadening the application scope of this research domain. It is worth noting that drill cuttings also show great potential in reservoir physical property evaluation. Haghshenas et al. [36] developed a dual-porosity numerical model combined with low-pressure adsorption experiments, providing an effective method for quantitatively evaluating reservoir heterogeneity using small samples of drill cuttings from horizontal wells.
Previous studies have primarily focused on coal rock fracture characterization methods, drillability evaluation indices, and cuttings particle size characteristics. However, research on the intrinsic relationship between fracture development degree and coal drilling response characteristics remains limited, particularly regarding the quantitative correlation between cuttings particle size distribution and fracture parameters. Therefore, in this study, low-, medium-, and high-rank coal samples were selected to ensure distinct fracture development characteristics. Through fracture characterization, acoustic testing, drilling experiments, and cuttings analysis, a systematic investigation was conducted to evaluate the drilling response characteristics of coals with different fracture features. The work aims to reveal quantitative relationships among fracture parameters, acoustic parameters, drilling parameters, and cutting parameters, thereby clarifying the mechanism by which fracture development affects coal drilling response and providing guidance for the optimization of fracturing sweet spots in CBM development.

2. Experimental Materials and Procedures

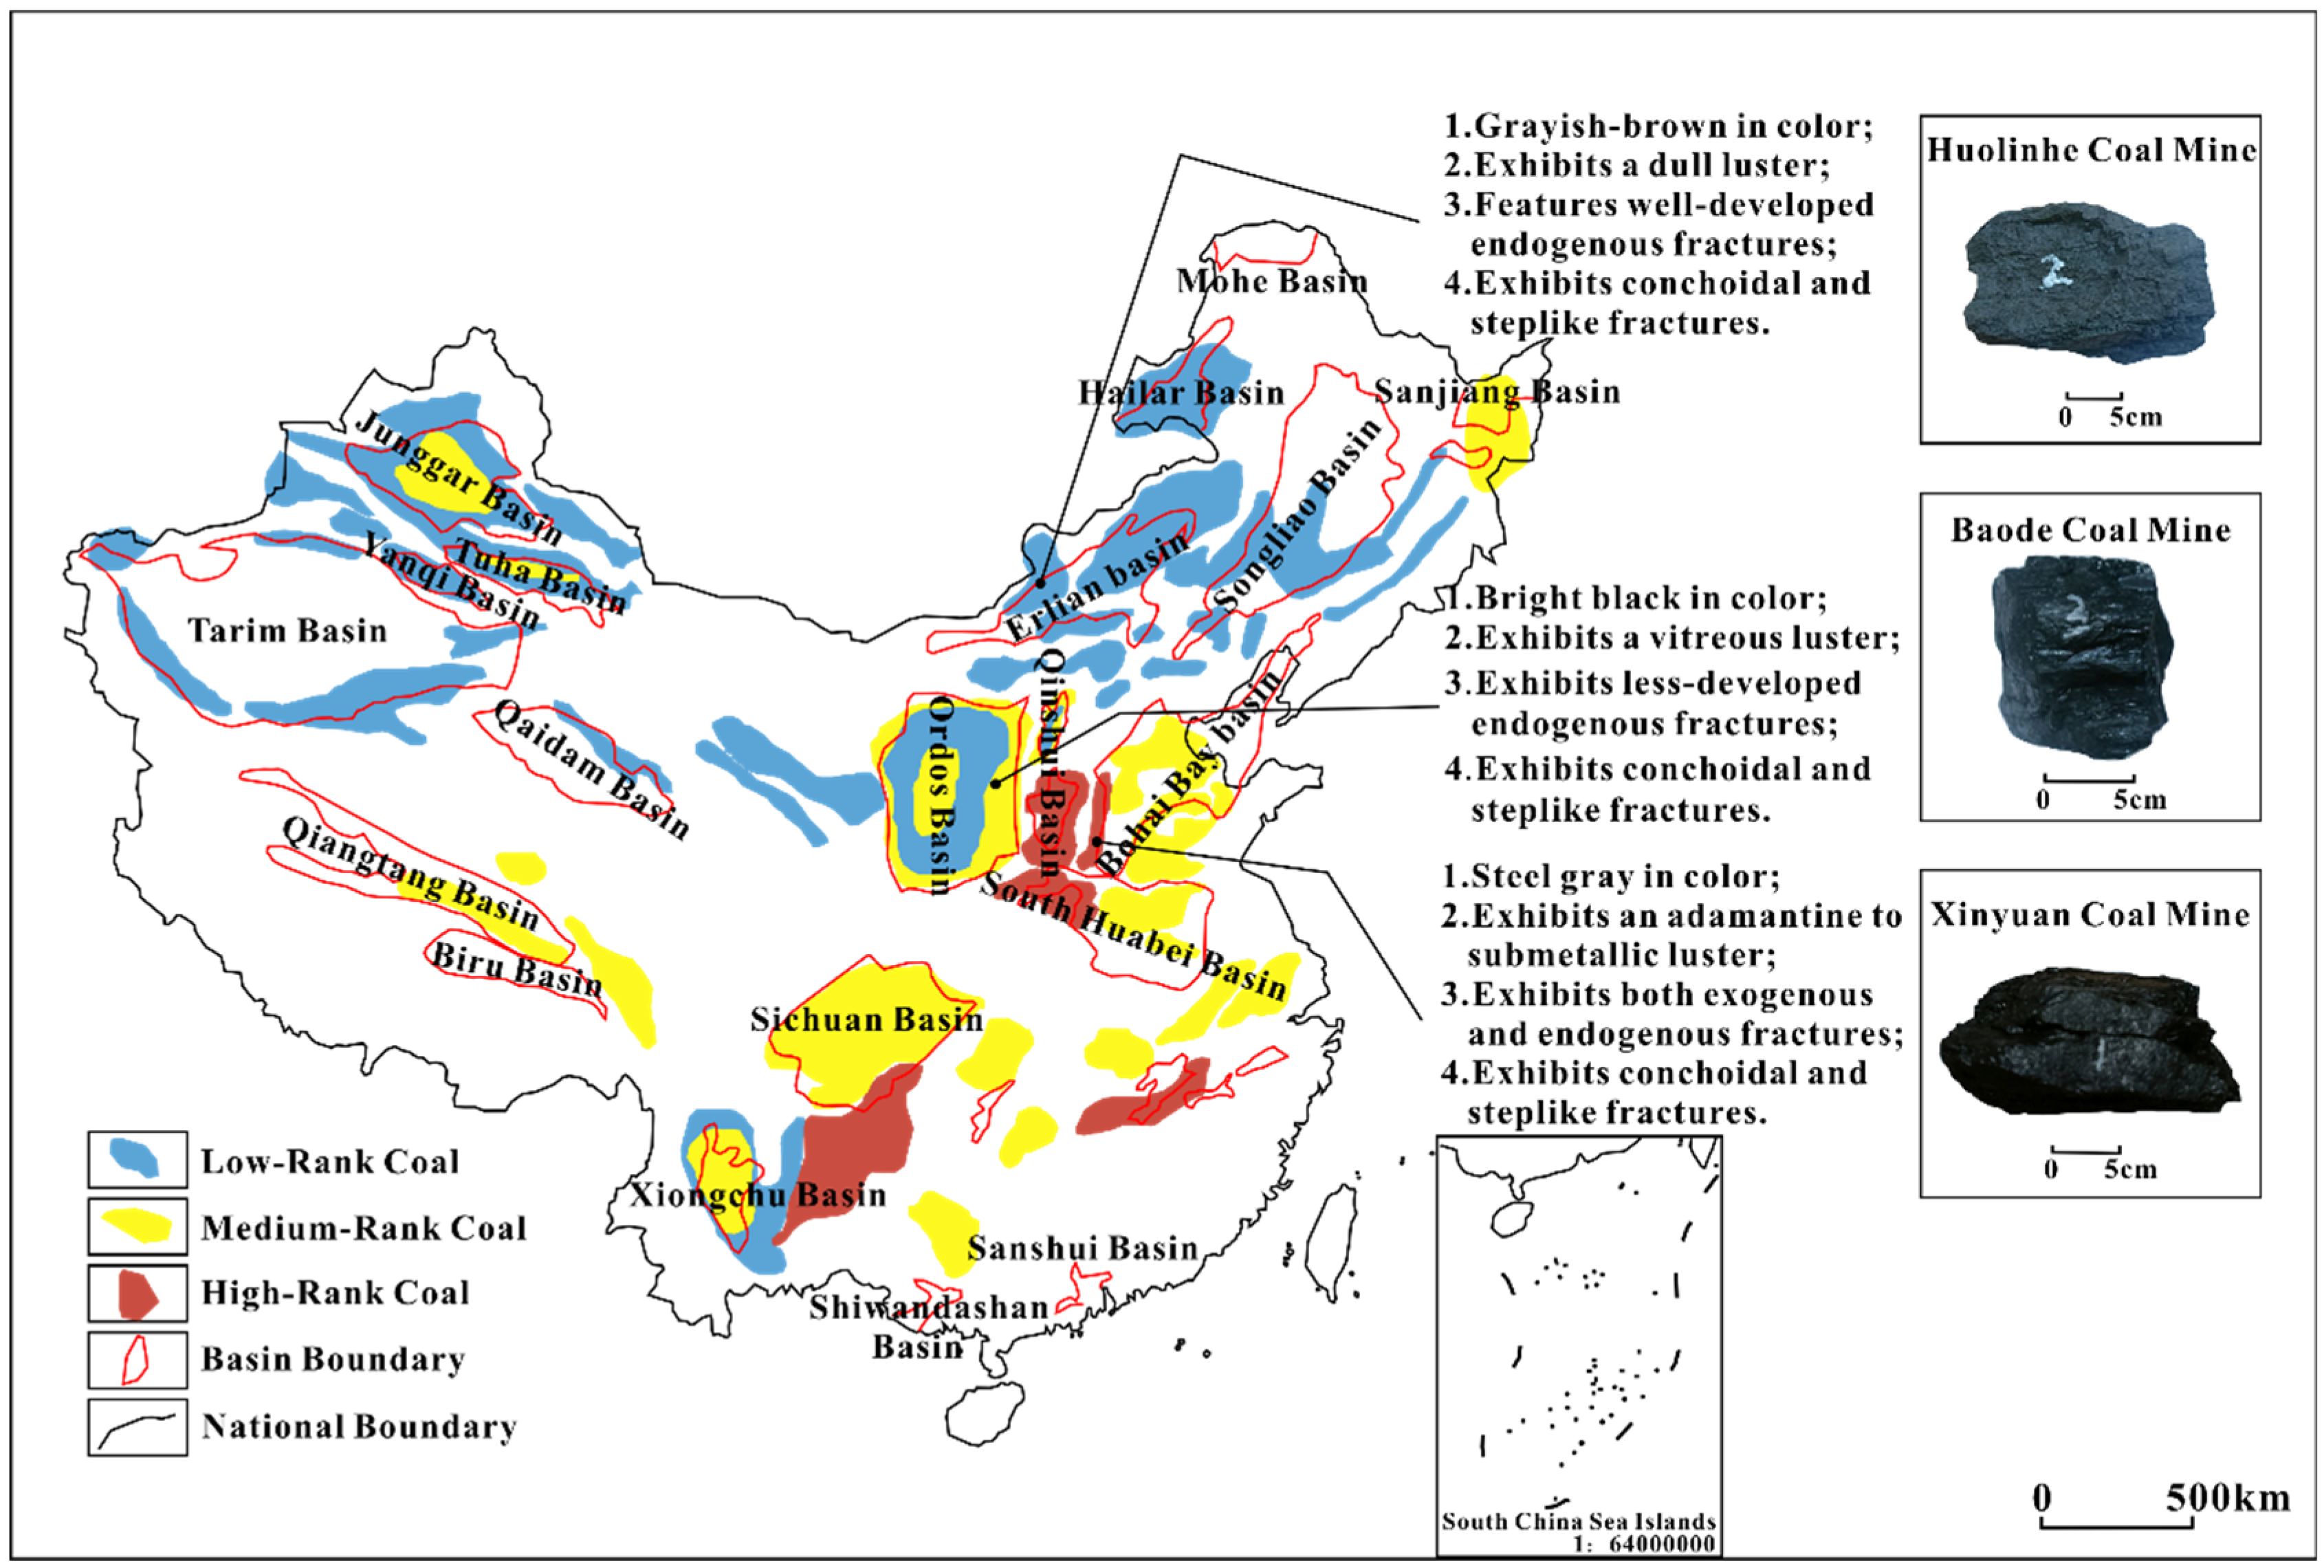
2.1. Experimental Samples

The coal samples analyzed in this study were collected from three mining sites: Baode Mine, Xinyuan Mine, and Huolinhe Mine (Figure 1). Among them, Huolinhe Mine represents low-rank coal, Baode Mine medium-rank coal, and Xinyuan Mine high-rank coal. The significant differences in metamorphic degree among these coal ranks lead to obvious variations in the development characteristics of their natural fractures. Table 1 presents the ash yield and organic maceral compositions of coal samples from three mining areas. Through proximate analysis of coal, the ash yield on an air-dried basis (Aad) is used to approximately characterize the mineral content, among which Xinyuan Mine shows the highest ash yield, indicating the highest mineral content. In Xinyuan and Baode mines, vitrinite dominates the macerals with inertinite as the secondary component. In contrast, Huolinhe samples are primarily composed of vitrinite, with inertinite constituting a minor proportion.
A total of 11 coal specimens were prepared, comprising 3 from Baode, 5 from Xinyuan, and 3 from Huolinhe. A letter-based coding system was established using the initials of each mine: B for Baode (labeled B-1 to B-3), X for Xinyuan (X-1 to X-5), and H for Huolinhe (H-1 to H-3). During sample preparation, coal blocks were cut into cuboids with six relatively flat surfaces, and three characteristic structural planes were defined: Plane 1 as the vertical plane perpendicular to bedding planes (stratigraphic orientation), Plane 2 as the strike-aligned plane with face cleats, and Plane 3 as the strike-aligned plane with butt cleats (Figure 2).

2.2. Experimental Procedures

The study first conducted macroscopic description and analysis of coal rock fracture characteristics, statistically calculating fracture line density ρ1, geological strength index (GSI), and fracture area ratio ρ2 to achieve quantitative fracture characterization. Following fracture characterization, the cut cubic coal rocks underwent acoustic emission testing to record wave velocity data. Subsequently, drilling tests were performed on the coal rocks with relevant data recorded. Finally, quantitative analysis was conducted on drill cuttings generated during the drilling process (Figure 3).
(1)
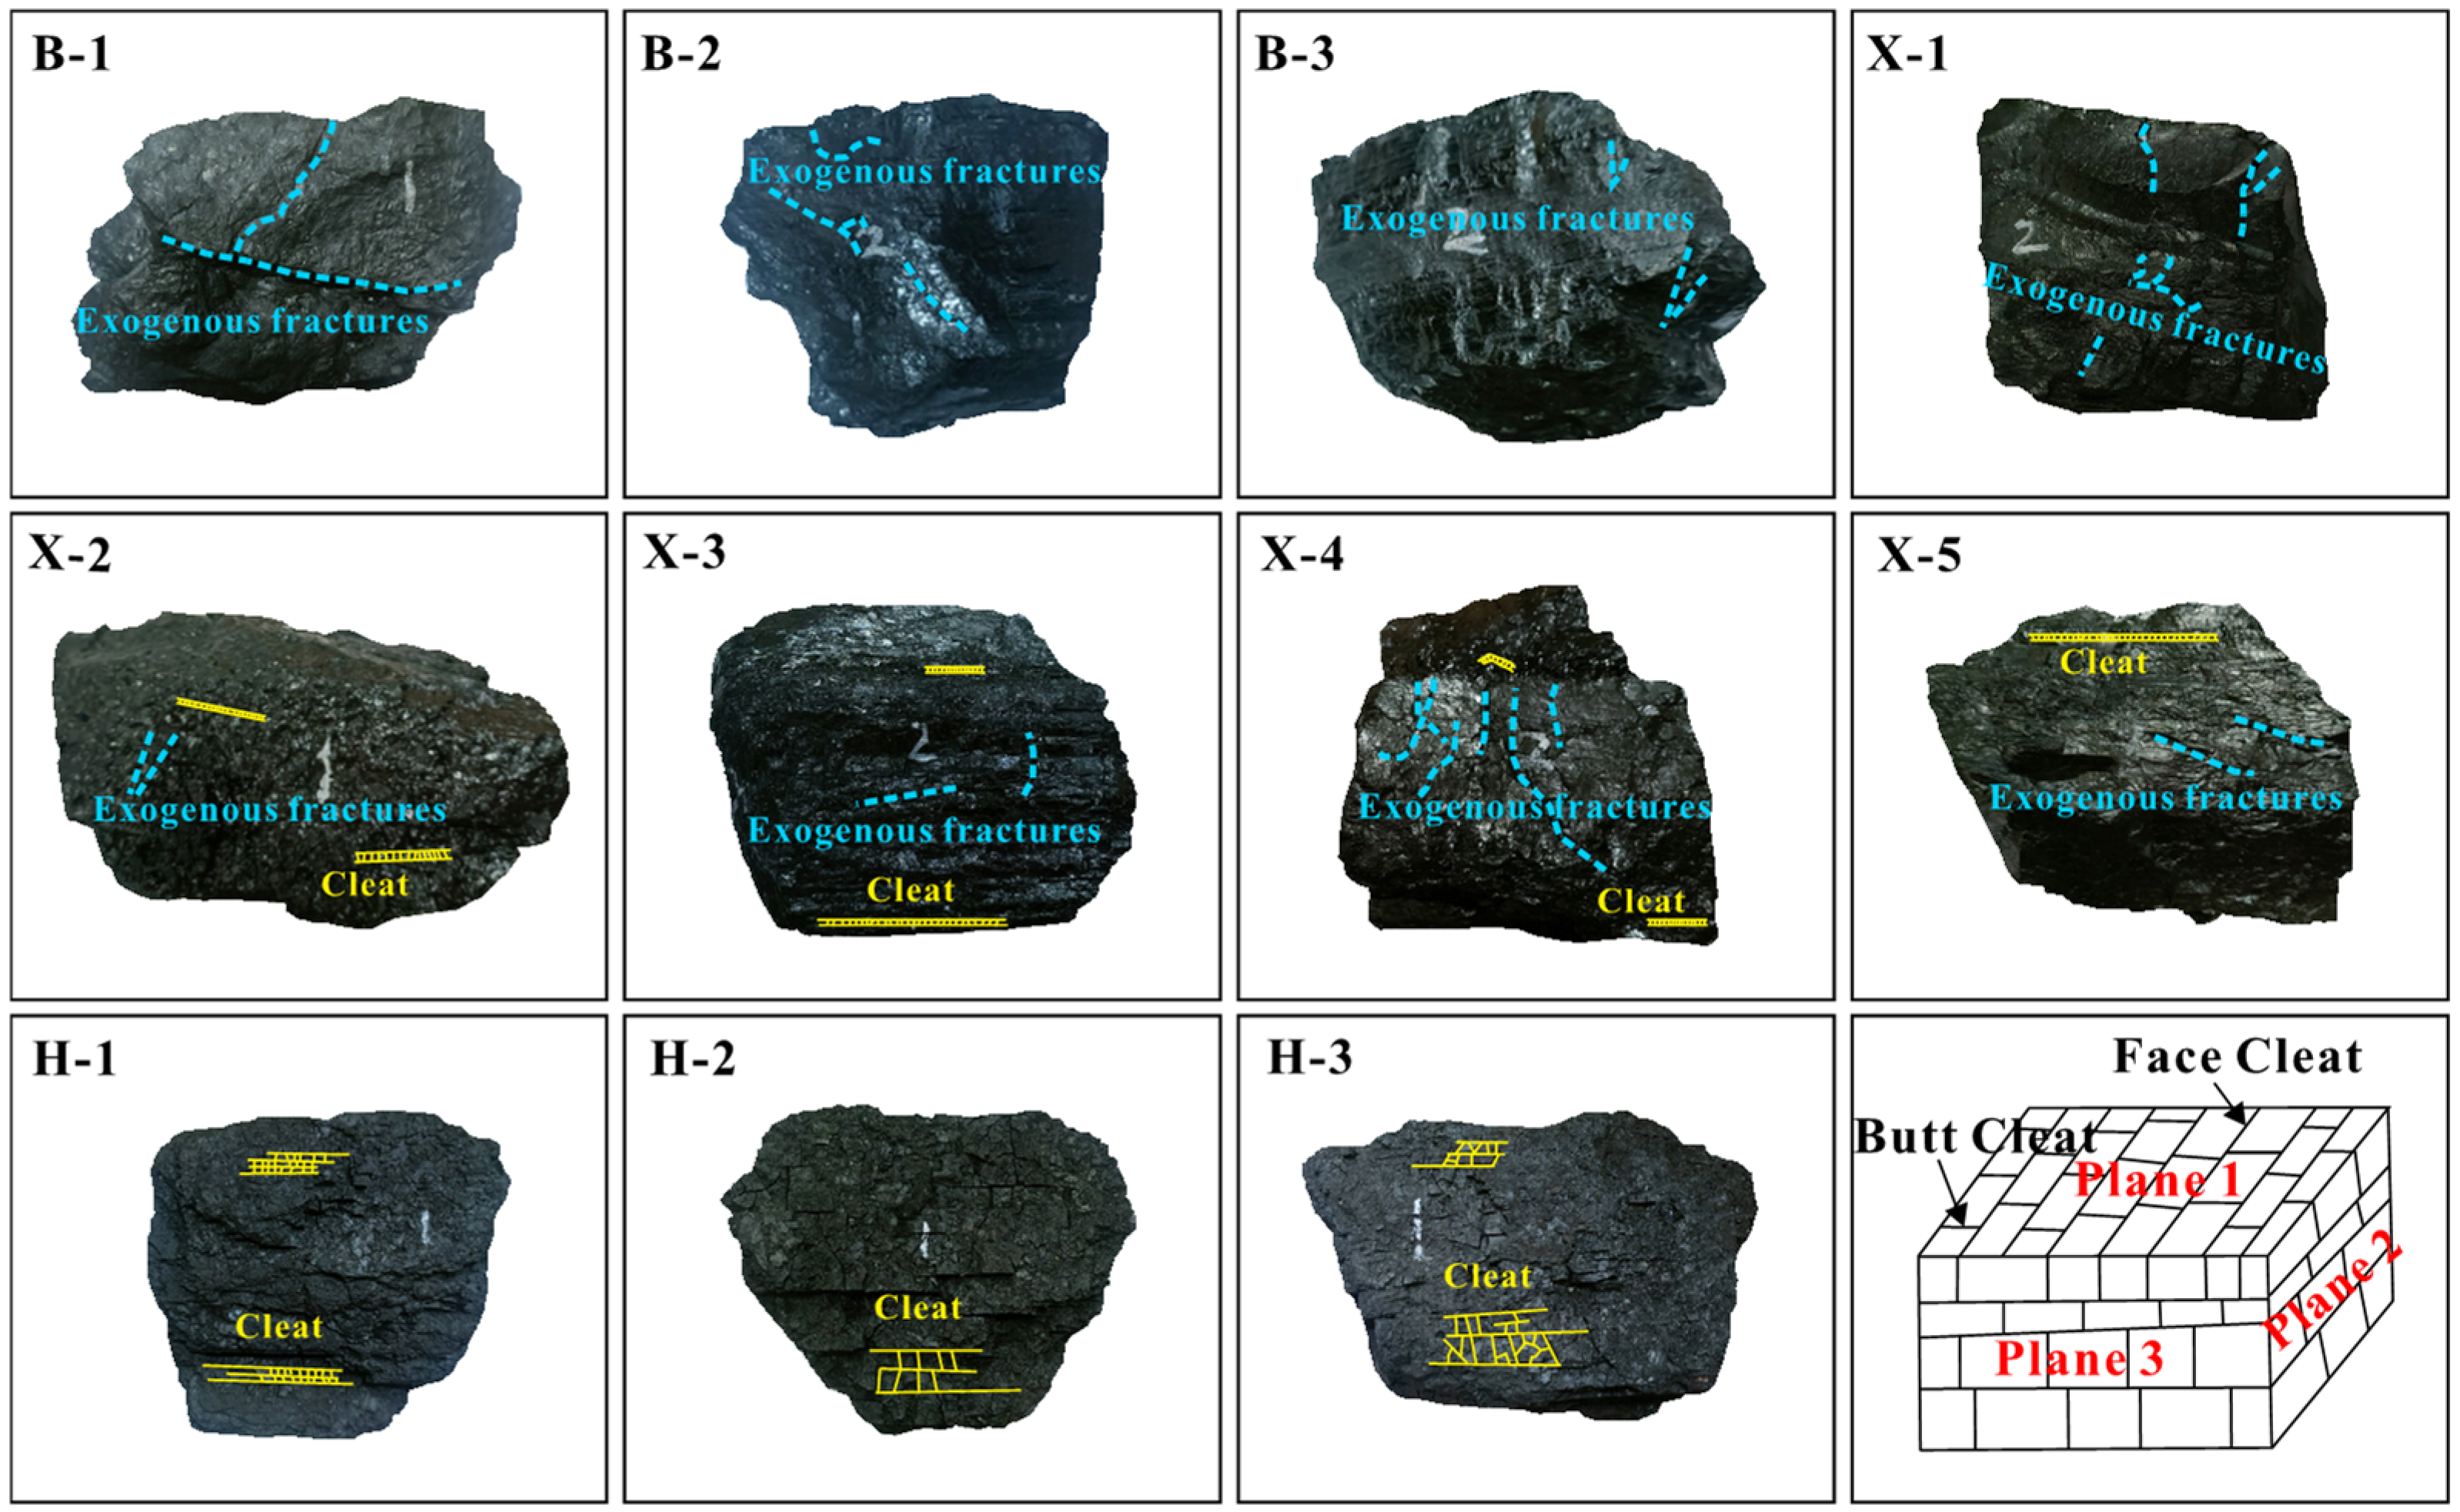
Fracture characteristics description and analysis
Fracture characteristics of coal rocks were described and analyzed, measuring parameters such as length, frequency, and aperture for exogenous fractures and endogenous fractures (face cleats, butt cleats). Fracture line density ρ1 and fracture area ratio ρ2 were calculated using Equations (1) and (2):
ρ 1 = i = 1 n L i S
In the formula: ρ1 stands for the fracture line density of coal rock, cm/cm2; S represents the surface area of coal rock, cm2; Lᵢ refers to the length of exogenous or endogenous fractures, cm.
ρ 2 = l 1 k 1 + l 2 k 2 + l 3 k 3 S 0 × 100 %
where ρ2 denotes the fracture area ratio, %; l1, l2, and l3 represent the total lengths of exogenous fractures, butt cleats, and face cleats, respectively, cm; k1, k2, and k3 indicate the apertures of exogenous fractures, butt cleats, and face cleats, respectively, cm; S0 is the total surface area of the six faces of the coal sample, cm2.
The Geological Strength Index, proposed by Hoek et al. [37], reflects rock integrity, surface roughness, and fracture development. The quantitative evaluation dimensions and corresponding features of GSI estimates can be visually presented through the grading system in Figure 4 [38,39].
(2)
Acoustic wave testing of fractured coal rocks
After cutting coal rocks into cubic shapes with six relatively flat faces, acoustic wave testing was conducted. The ultrasonic testing instrument operates based on the principle that ultrasonic wave propagation velocity and energy attenuation vary in different media. Ultrasonic waves emitted by the instrument penetrate the rock samples, and the receiving end acquires and processes acoustic signals to derive data related to rock acoustic properties, assisting in understanding rock structure and fracture development characteristics.
Acoustic wave tests were conducted on three groups of characteristic structural planes (Plane 1, Plane 2, and Plane 3; Figure 2) to obtain longitudinal wave velocity data. The RSM-SY5 intelligent acoustic wave detector was used in this study. Before testing, the parameters were set as follows: single-channel configuration, low voltage for transmission, a sampling interval of 1 μs, a transmit pulse width of 10 μs, and a recording length (total acquired data volume) of 2048. After parameter setup, the transmitting/receiving sensors were closely attached to the coal rock surface and aligned along the same central axis to perform the tests and record the data. After data processing, the average wave velocity v of the three groups of characteristic structural planes (Plane 1, Plane 2, and Plane 3) was obtained. Among them, the wave velocity of the drilling operation plane (Plane 2) was defined as v0. Since it is consistent with the drilling direction, v0 can reflect the wave velocity characteristics of the coal rock along the drilling path.
(3)
Drilling tests of fractured coal rocks
After acoustic wave testing, cubic coal rocks were subjected to drilling tests. In this experiment, drilling tests were performed on coal rock Plane 2 (Figure 2) using a 3 cm diameter drill bit. Data such as drilling time and hole depth were recorded during the drilling process. Drilling parameters were then calculated, including drill cuttings quantity Q (g/cm), drilling rate w (cm/s), and cuttings rate q (g/s), where Q represents the mass of cuttings generated per unit hole length, w denotes the depth drilled per unit time, and q indicates the mass of cuttings produced per unit time.
(4)
Drill cuttings data processing
Select one standard sieve for each of the following aperture sizes: 4.75 mm (4 mesh), 2 mm (10 mesh), 1.18 mm (16 mesh), 0.25 mm (60 mesh), 0.15 mm (100 mesh), and 0.075 mm (200 mesh). Screen the drill cuttings generated during the drilling process and calculate the mass percentage of each particle size fraction.
Additionally, the average particle size of drill cuttings can be calculated based on Equation (3) [34]:
d 0 = 1 2 i = 1 n Δ Q i x i + x i 1
where d0 is the average grain size of the drill cuttings, mm; xi and xi-1 are the upper and lower limits of the ith grain size interval, respectively; ΔQi is the relative amount within the ith grain size interval Δxi.
To further analyze the distribution characteristics of drill cuttings particle size, the Rosin–Rammler (R-R) model was employed [40,41]. The mathematical expression of this model is:
F d = 1 e x p [ ( d d 50 ) n ]
In the formula, F(d) represents the cumulative mass percentage of particles with a diameter less than d, %; d is the particle size, mm; d50 is the median size, which corresponds to the particle size of coal rock cuttings when the cumulative mass distribution reaches 50%, mm; n is the fragmentation index, which characterizes the degree of particle size concentration, that is, the larger the value of n, the more concentrated the particle size distribution.
For ease of calculation, Equation (4) can be transformed into the following form:
y = l n l n 1 F d = n l n d + λ
λ = n l n ( d 50 )
where λ represents the fragmentation degree index, where a larger value of λ indicates a higher proportion of small particles in the drill cuttings. A linear regression equation of lnd–y is established based on the particle size distribution data of the drill cuttings to fit and obtain the slope n and the intercept λ. Finally, d50 can be calculated using Equation (6).

3. Experimental Results

3.1. Quantitative Characterization of Fractures Based on Acoustic Parameters

After conducting acoustic wave tests on three groups of characteristic structural planes (Plane 1, Plane 2, and Plane 3) in coal rock, P-wave velocity data were obtained in different directions. Table 2 shows the velocity values for three directions in partial samples, where the wave velocity of Plane 2 is consistent with the drilling direction, directly reflecting the acoustic wave propagation characteristics of coal rock along the drilling path. As shown in the table, the velocity differences between different structural planes are significant. For example, the velocity of Plane 2 in Sample B-3 (2392 m/s) is significantly higher than that of Plane 1 (777 m/s) and Plane 3 (1581 m/s), indicating that the fracture development in coal rock has obvious directionality, leading to anisotropic characteristics of acoustic wave propagation. Figure 5 shows the waveform diagrams of three structural planes taking Sample X-2 as an example. Among them, the waveform of Plane 2 attenuates slowly and has relatively high energy, while the waveforms of Plane 1 and Plane 3 attenuate rapidly. This indicates that the fractures in the direction of Plane 2 cause less interference to the acoustic wave propagation path, resulting in high acoustic wave propagation efficiency.
Figure 6 presents the quantitative relationship curves between fracture line density (ρ1) and acoustic parameters (v, v0). To differentiate the sample origins from different coal mines, color coding is employed for identification in the figure: green denotes samples from the Xinyuan Coal Mine, orange represents those from the Baode Coal Mine, and purple signifies samples from the Huolinhe Coal Mine. The fitted functions can reflect the variation trends of acoustic parameters with fracture line density. Specifically, ρ1 shows a linear negative correlation with v (R2 = 0.577), while ρ2 exhibits a non-linear negative correlation with v0 (R2 = 0.813), indicating that both v and v0 decrease with increasing fracture line density. The most direct reason is that higher fracture line density leads to more air voids in coal rock, which enhances the impedance to acoustic wave propagation and results in reduced wave velocities.
Figure 7 illustrates the relationship between fracture area ratio (ρ2) and acoustic parameters, which follows a similar trend to the variation with fracture line density in Figure 6. The data trends in the figure can be fitted using logarithmic functions with all R2 values exceeding 0.664, indicating good fitting effects. According to the fitted functions, both v and v0 exhibit downward trends with increasing ρ2. Specifically, when ρ2 increases from 0.22% to 0.88%, v decreases from 2543 m/s to 1183 m/s, while v0 decreases from 2326 m/s to 1147 m/s. Therefore, increasing the fracture area ratio similarly interferes with acoustic wave propagation and reduces wave velocities, further demonstrating the significant influence of fracture development degree on acoustic wave propagation velocity.
From the relationship between the GSI and acoustic parameters in Figure 8, both v and v0 show an upward trend with the increase in GSI. The fitted relationship between v and GSI is y = 1.98e0.078x (R2 = 0.81), indicating a good fit. For v0 and GSI, the relationship is y = 2.87e0.072x (R2 = 0.52). This indicates that the higher the GSI, the more stable the overall structure of coal rock, which is more conducive to the propagation of acoustic waves and accelerates the speed of wave propagation.

3.2. Correlations Between Fractures and Drilling Parameters

Table 3 presents the drilling parameters of coal rocks. Figure 9, Figure 10 and Figure 11 are plotted based on drilling and fracture parameter data, visually illustrating the variation relationships between fracture parameters and acoustic parameters.

3.2.1. Fracture Line Density and Drilling Parameters

Figure 9 illustrates the relationship between fracture line density (ρ1) and drilling parameters (Q, w, and q). Image analysis reveals that, as ρ1 increases, Q, w, and q exhibit variations; however, the effect of linear fitting is weak (R2 ≤ 0.375). Despite this, a weak positive correlation is observed between ρ1 and Q, w, and q, indicating that increases in ρ1 correspond to elevated values of Q, w, and q.
Normally, an increase in ρ1 may make coal rock more prone to fragmentation, thereby affecting these parameters during drilling. However, during the drilling process, the spatial position of the fractures may have an impact on the drilling parameters. When the spatial position of the fractures is favorable for the drill bit to drill, a large amount of large-diameter drill cuttings are generated, but they are not within the statistical range, resulting in a decrease in the amount of drill cuttings. Conversely, when the spatial position of the fractures is unfavorable, it may increase. The drilling rate may also change due to the obstruction or guidance of fractures on the drill bit. If the direction of the fractures is favorable to the drilling direction, the drilling rate may increase; otherwise, it may decrease. The drilling cuttings rate will also be affected accordingly.

3.2.2. Fracture Area Ratio and Drilling Parameters

According to the quantitative results in Figure 10, it is evident that ρ2 is also positively correlated with Q, w, and q. The reason for this positive correlation may be that, as the fracture area ratio increases, there are more discontinuities within the coal rock, making it more prone to fragmentation. Specifically, the linear fitting yields a relationship between ρ2 and q as y = 0.155x + 0.085 with R2 = 0.676, indicating a moderate fit between these two parameters. However, the coefficients of determination for ρ2 with Q and w are 0.34 and 0.42, respectively, suggesting weak fits. This discrepancy may also be due to the complex spatial distribution of fractures, which can hinder or promote drill bit penetration, leading to fluctuations in w. When fractures are conducive to drilling, larger-sized cuttings (>4.75 mm) are produced. However, due to the experimental screening range being limited to ≤4.75 mm, these coarse particles were not included in the statistics, resulting in lower Q values. Conversely, higher Q values occur under opposite conditions, explaining why the fitting effects of ρ2 with Q and w are weak.

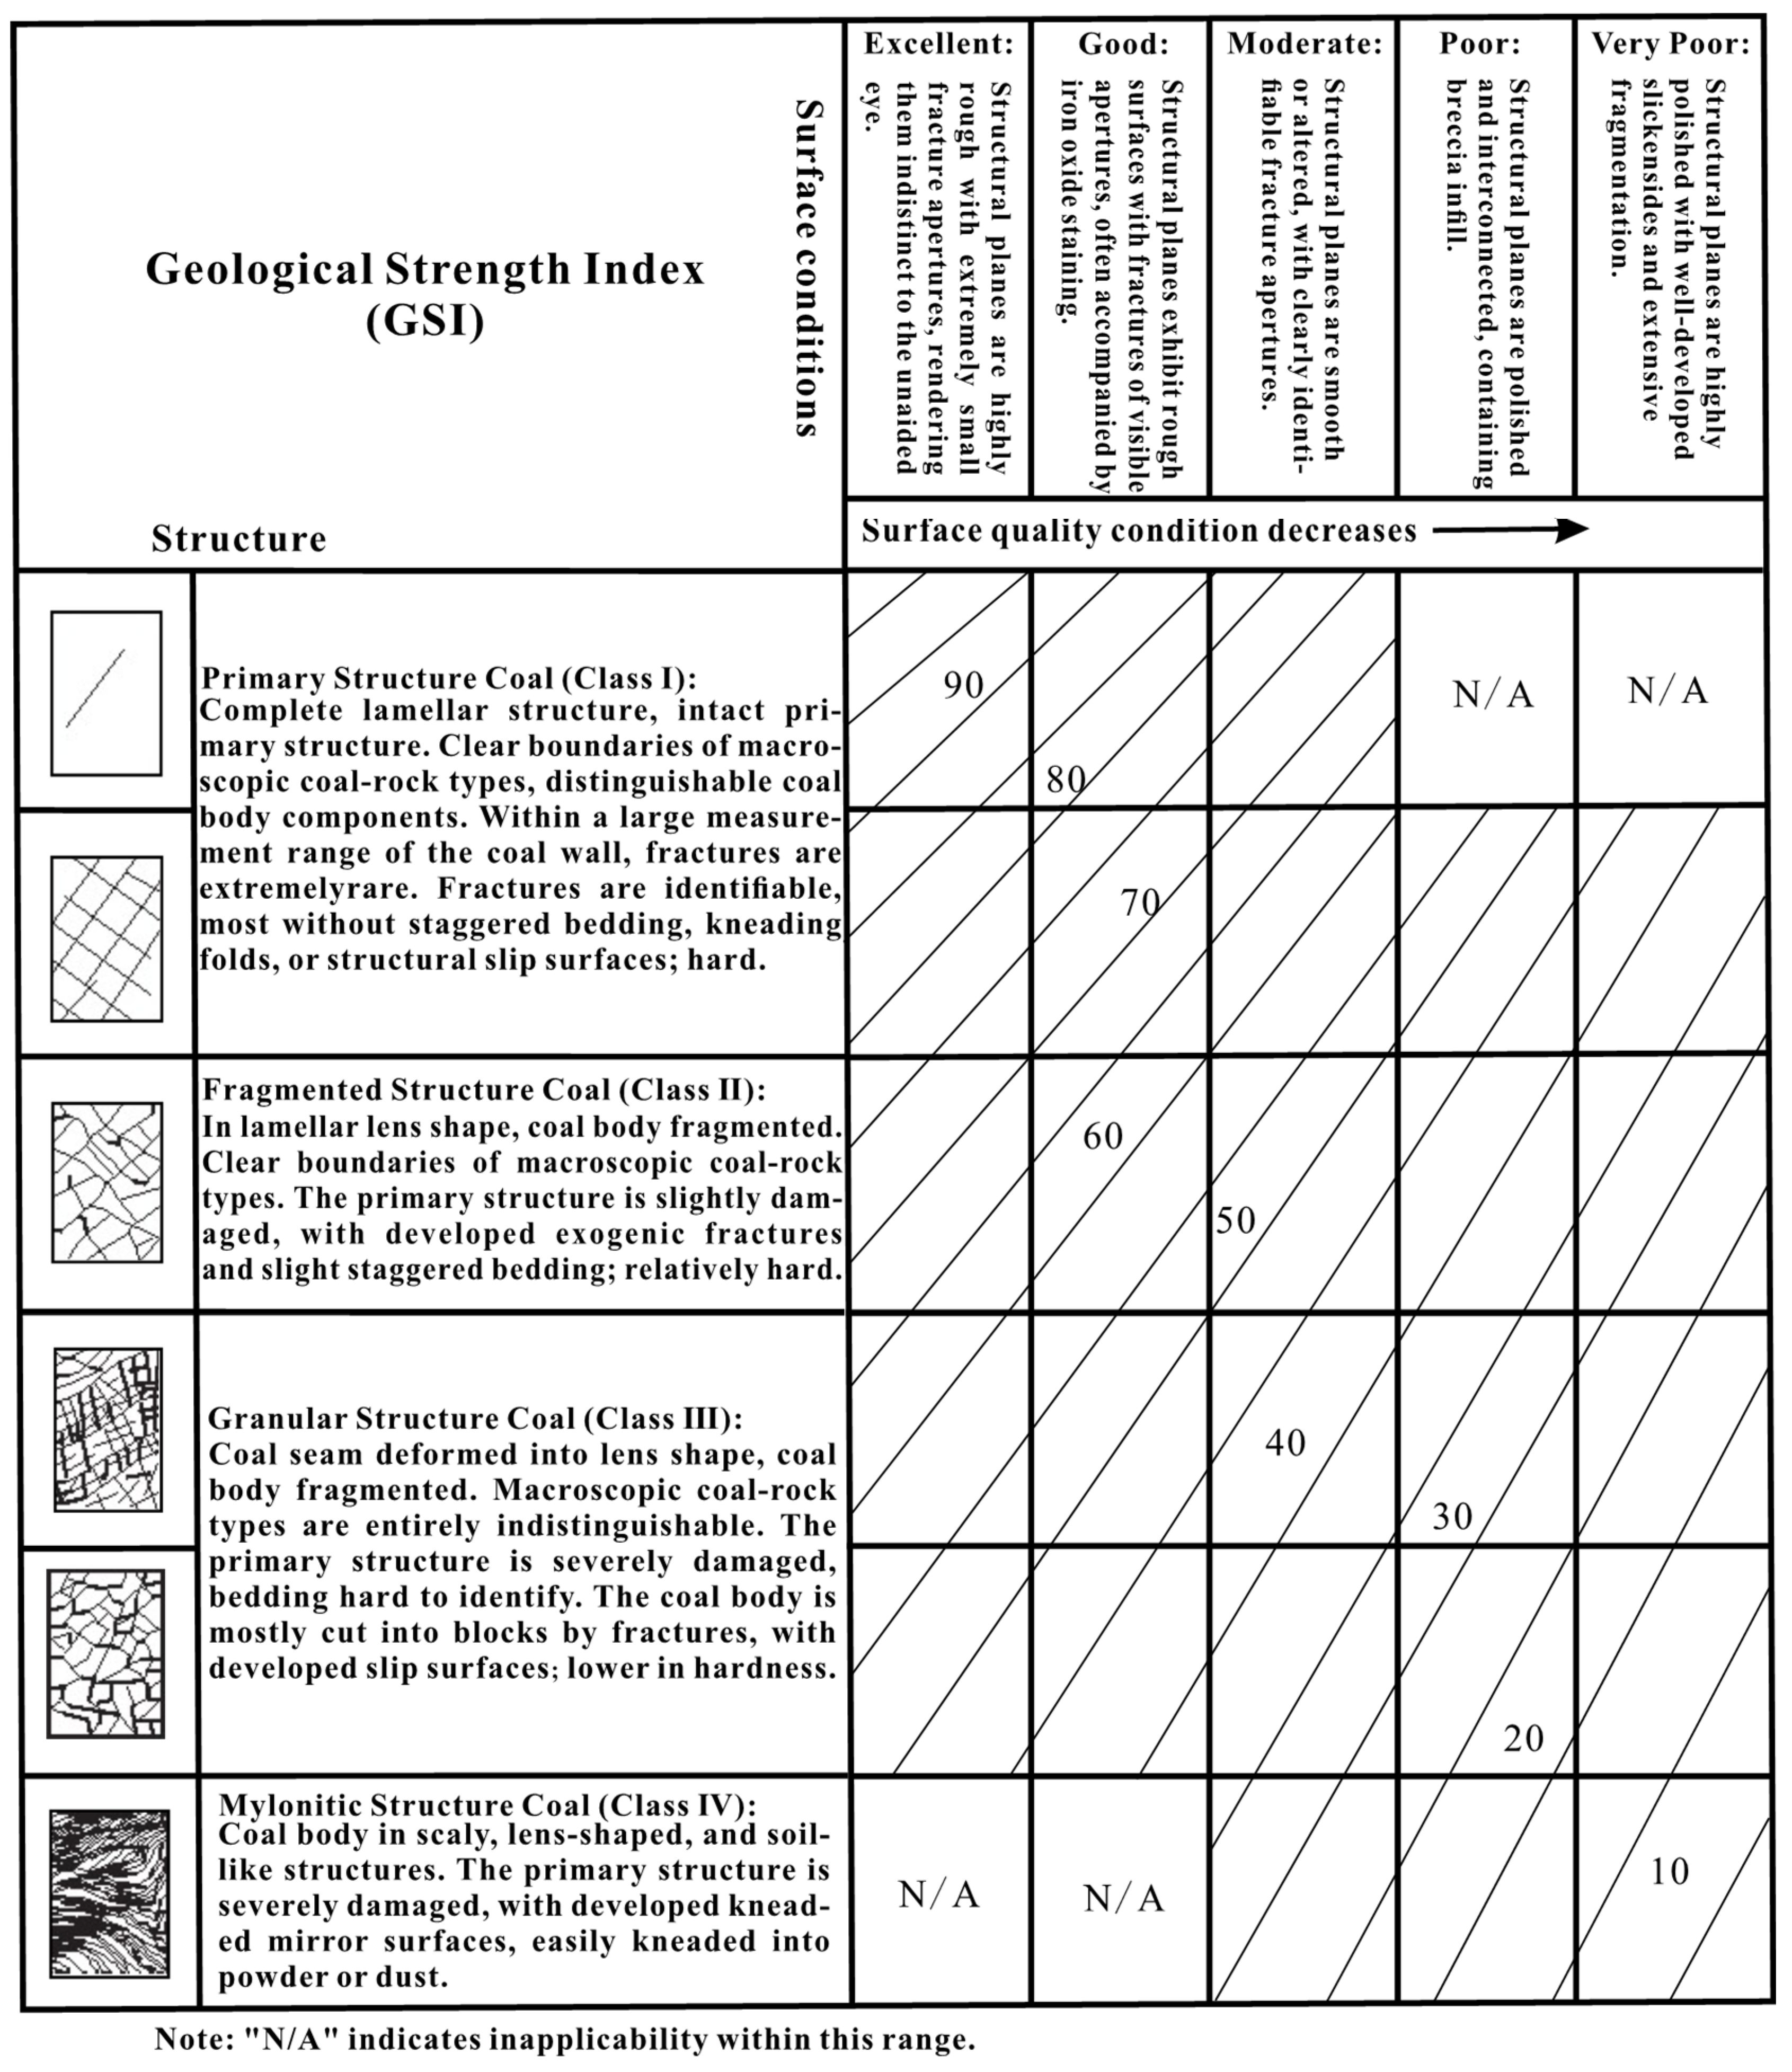
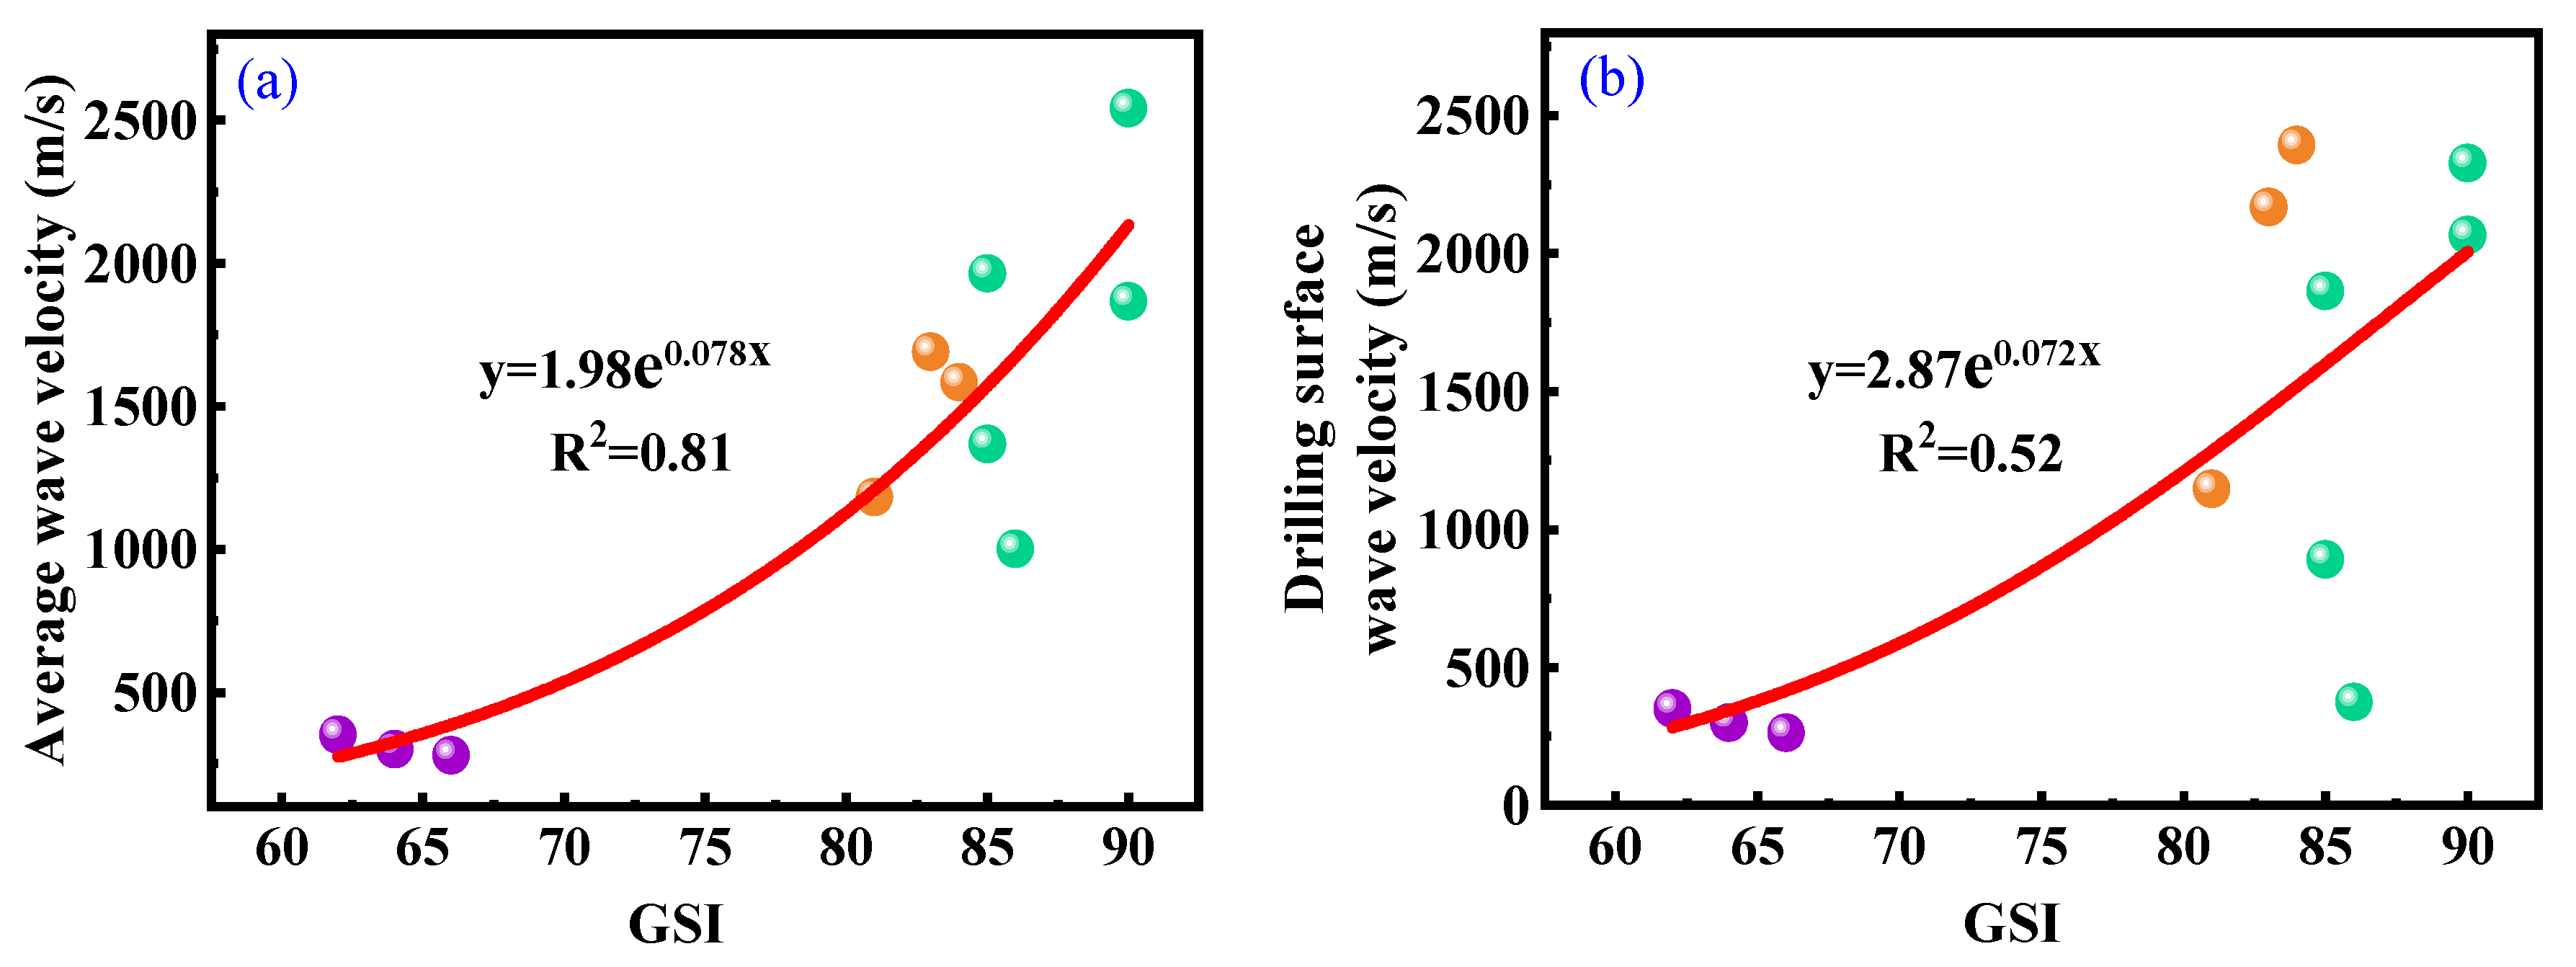
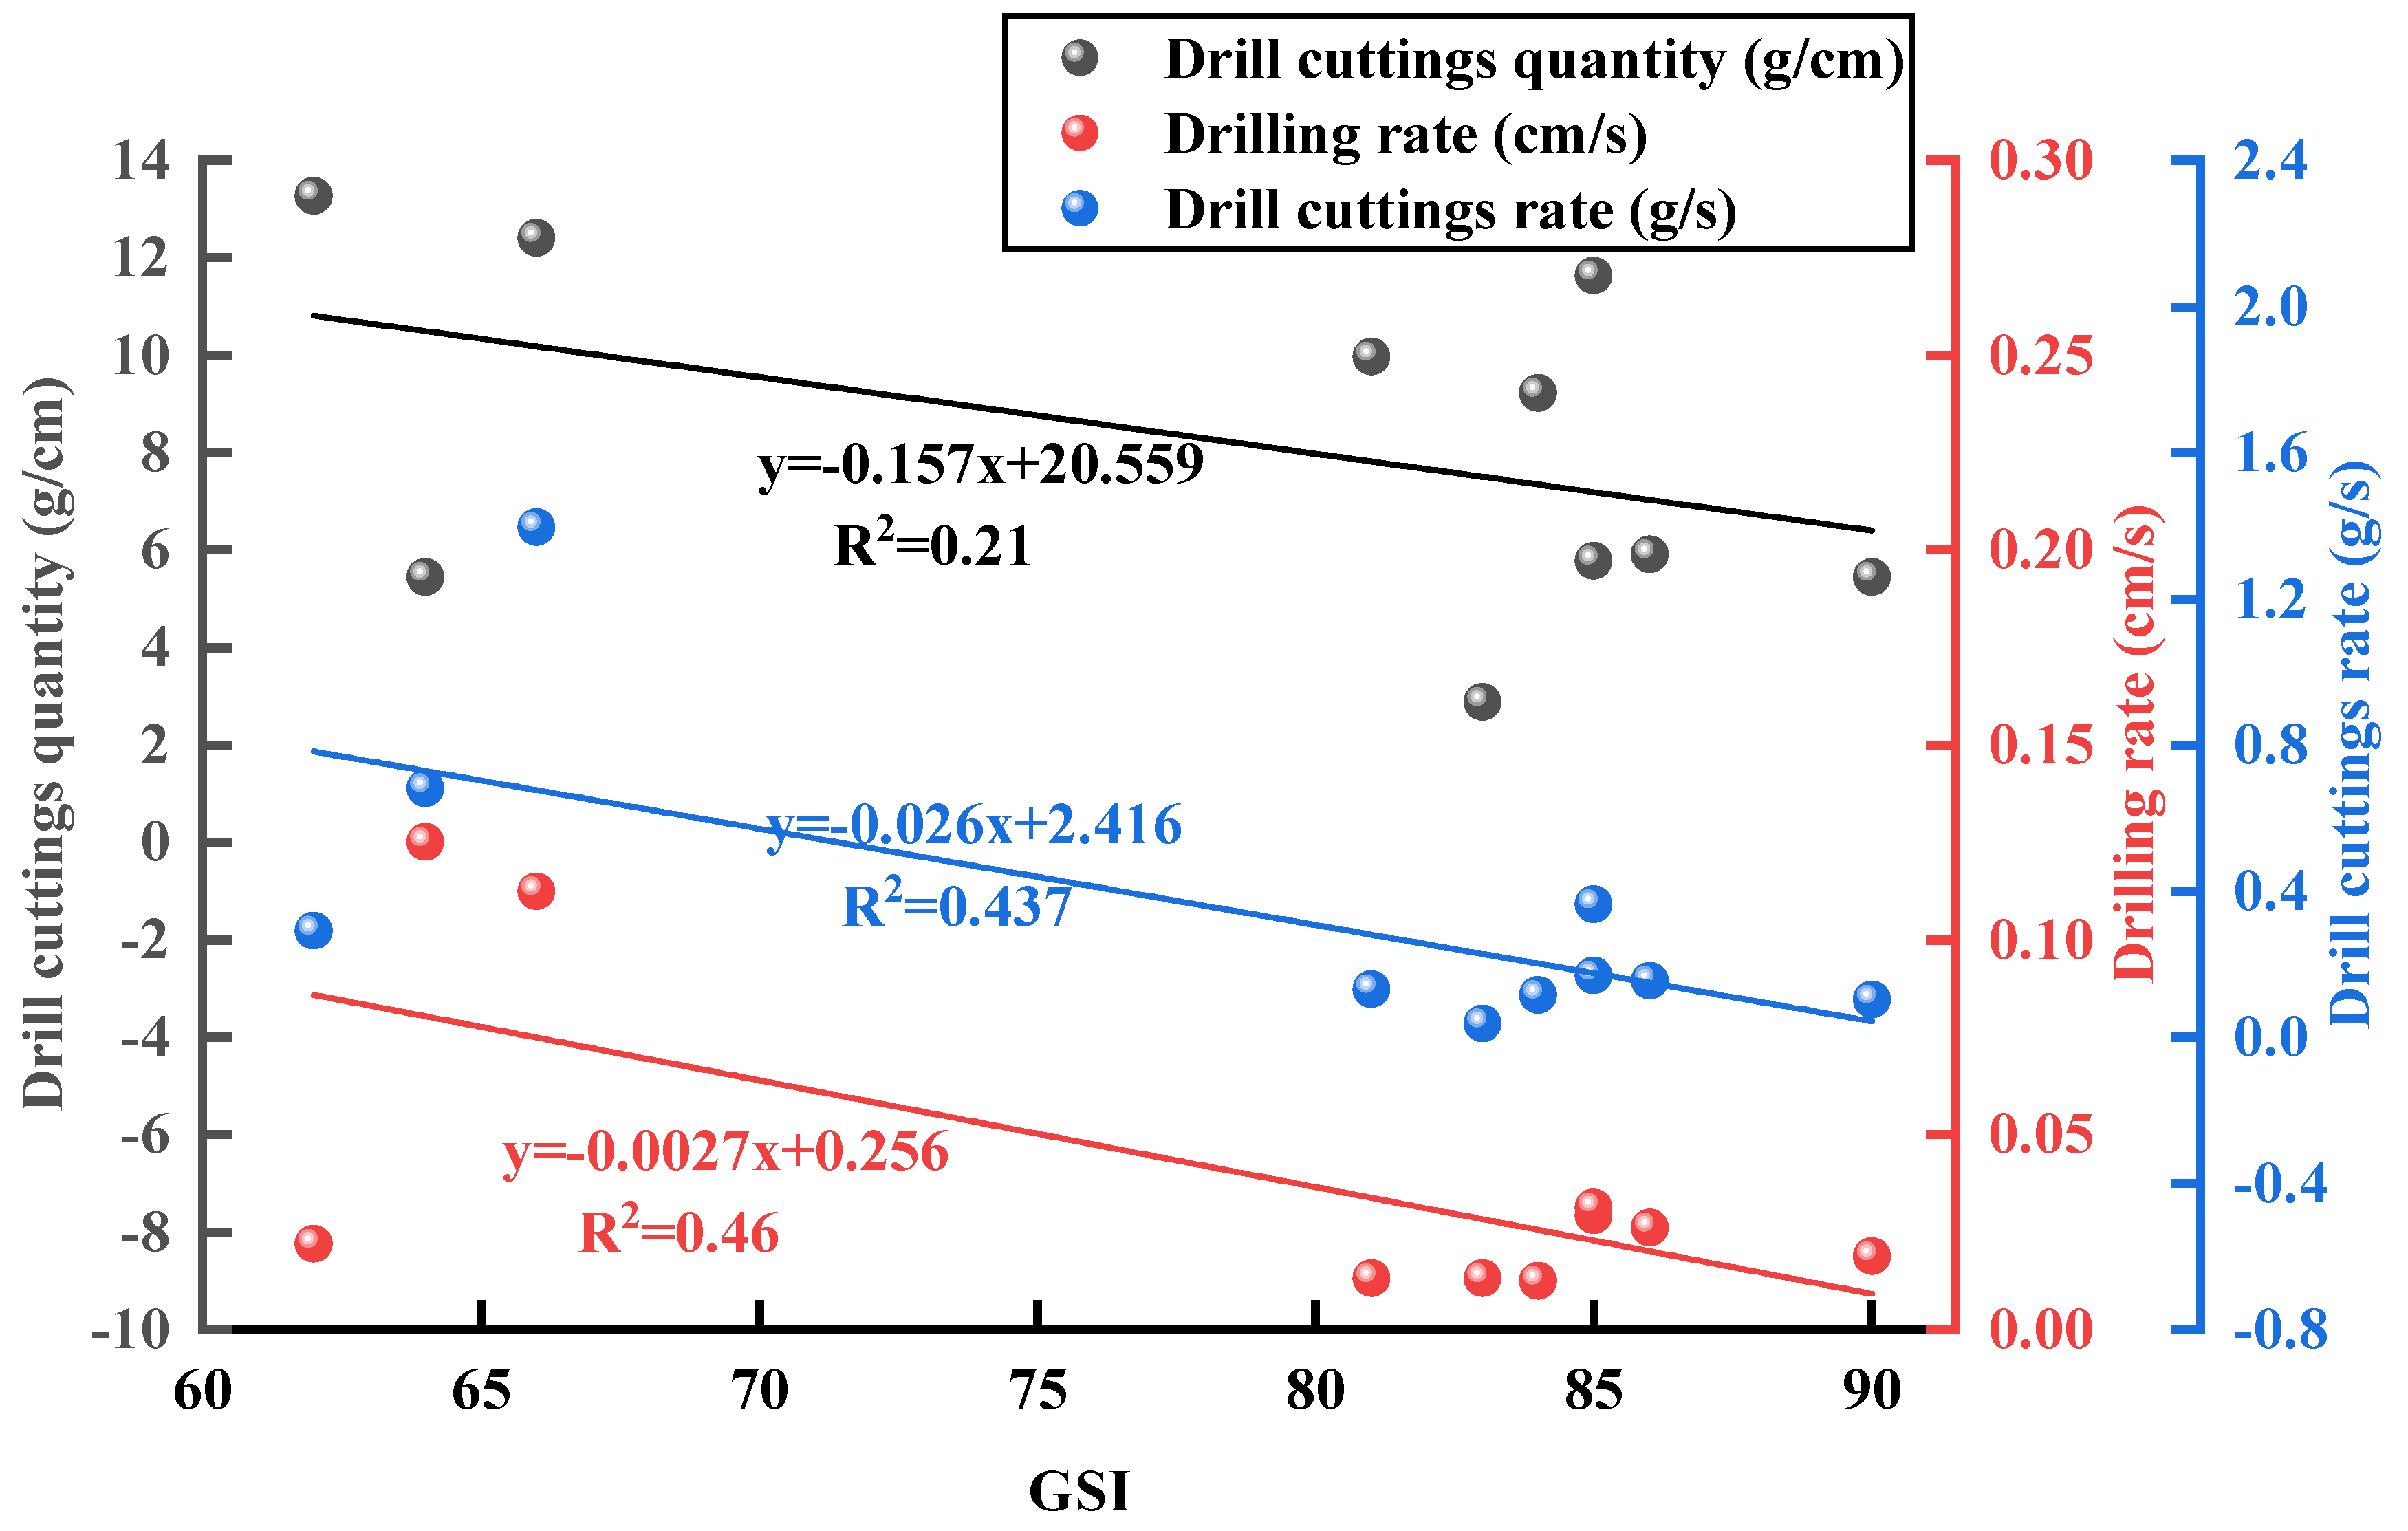
3.2.3. Geological Strength Index and Drilling Parameters

Figure 11 reflects the relationship between GSI and drilling parameters. According to the linear fitting curve, the fitting effect between GSI and Q, w, and q is weak (R2 between 0.21 and 0.46) but overall manifests a negative correlation, meaning that, as GSI increases, Q, w, and q show a decreasing trend. There is a negative correlation between GSI and drilling parameters, which may be due to the fact that the larger the GSI, the more stable the structure of the coal rock and the greater the resistance that the drill bit needs to overcome, resulting in a decrease in the amount of cuttings and drilling rate.

3.3. Correlations Between Fractures and Cuttings Parameters

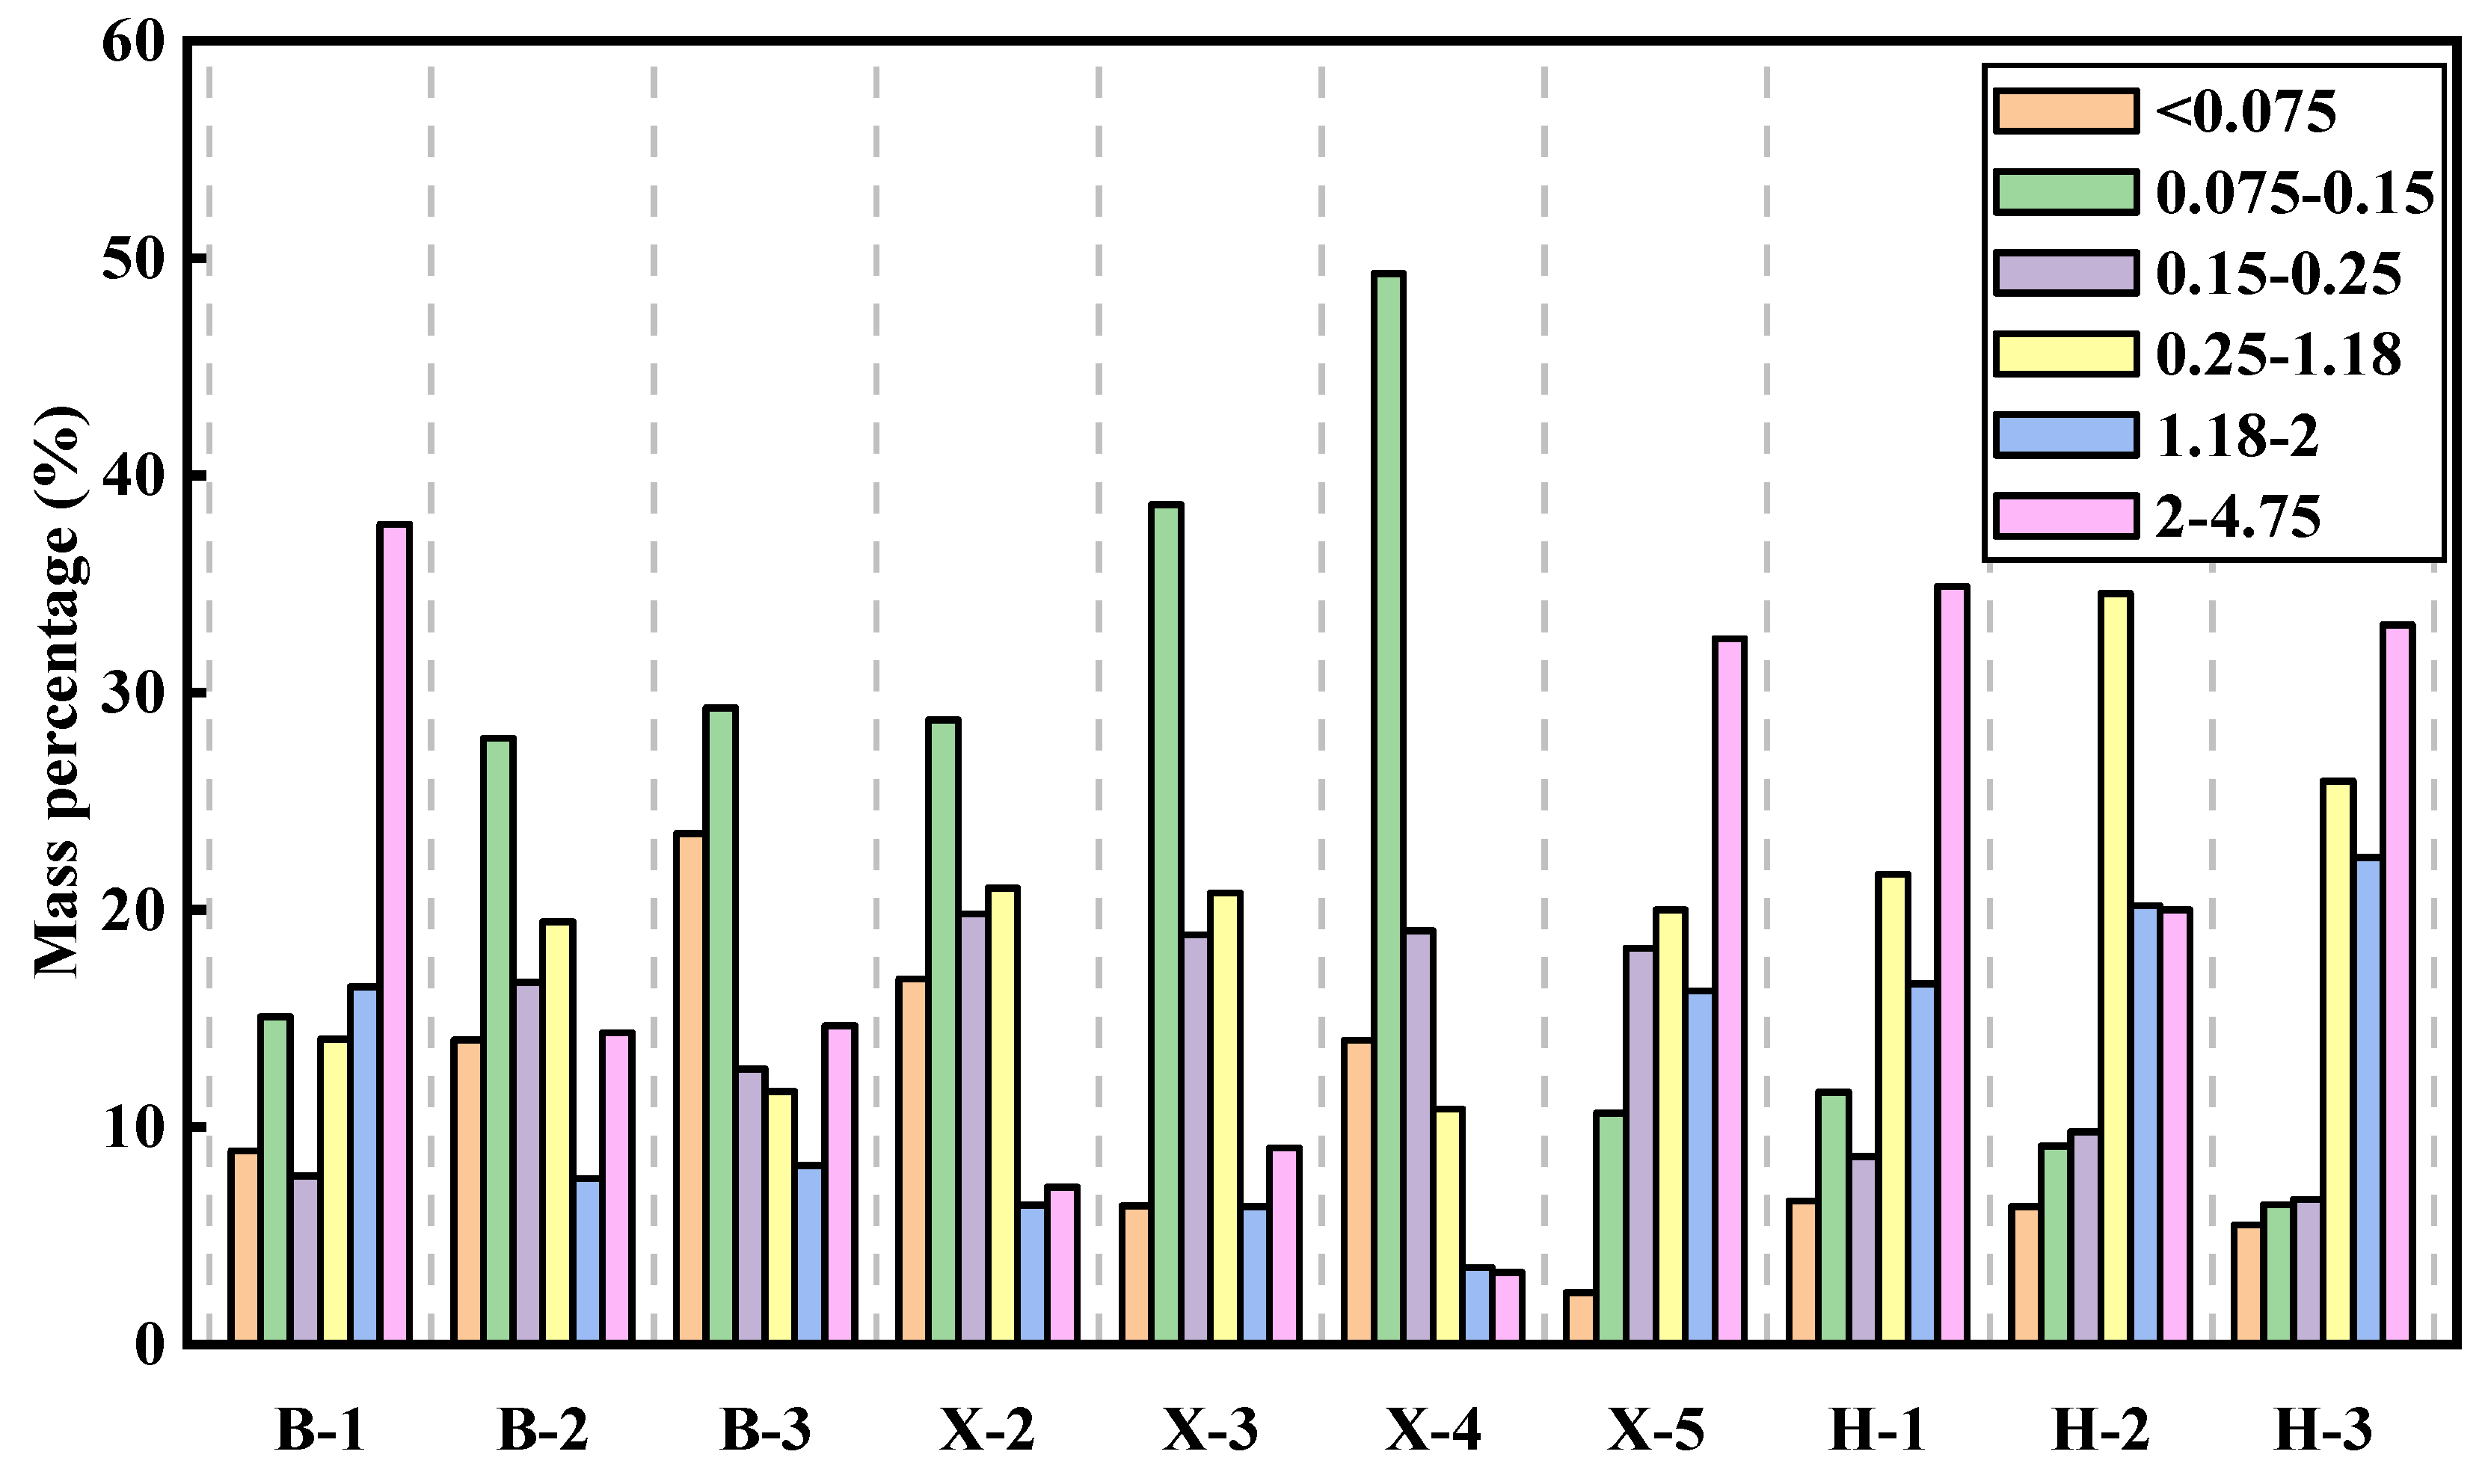
3.3.1. Characteristics of Cuttings Particle Size Distribution

Figure 12 visually displays the particle size distribution of coal cuttings from three mining areas after sieve analysis, while Figure 13 presents histograms of cuttings size distributions for coals with distinct fracture characteristics post-drilling. Analysis reveals significant variations in the percentage of cuttings across different particle size ranges among samples. For instance, in the 2–4.75 mm size range, Sample B-1 accounts for 37.74%, whereas Sample X-4 constitutes only 3.31%. This disparity reflects regional differences in the abundance of coarse-grained cuttings generated during drilling-induced fragmentation, implying that the intrinsic properties of coal rock strongly influence cuttings size distribution. The observed variations may stem from differences in structural integrity, hardness, and fracture development intensity among coals from different mining areas, which govern particle size generation during mechanical breakage processes.
Although coal rock samples from the same mining area exhibit certain regional similarities in the particle size distribution of cuttings, significant individual differences still exist. Taking Baode mining area as an example, the proportion of particles <0.25 mm in the cuttings of samples B-2 and B-3 reached 58.59% and 65.46%, respectively, showing dominance of fine particles; however, the proportion for Sample B-1 in this size range is only 31.73%, with its cuttings dominated by coarse particles (0.25–4.75 mm). Samples from Xinyuan mining area display stronger heterogeneity: fine particle (<0.25 mm) proportions in X-2, X-3, and X-4 exceed 63.84%, whereas X-5 has only 31.26% in this fraction, with coarse particles (0.25–4.75 mm) accounting for as much as 68.74%. H-1, H-2, and H-3 samples from Huolinhe mining area uniformly exhibit high coarse particle proportions, with cuttings in the 0.25–4.75 mm range accounting for over 73.13%. These results indicate that mining area origin exerts macroscale control over the cuttings particle size distribution, but local heterogeneities in coal rock properties (e.g., fracture development degree, mineral composition differences) may lead to significant variations among samples from the same mining area.

3.3.2. Relationship Between Fractures and Cuttings Parameters

Through the analysis of Figure 14, Figure 15 and Figure 16, it is found that there is a certain relationship between the fracture parameters (ρ1, GSI, ρ2) and the cuttings parameters (average particle size d, crushability index n, crushing degree index λ, median diameter d50). Among them, in Figure 14, the linear fitting effect of the fracture line density ρ1 with d, n, λ, and d50 is poor (R2 ≤ 0.221), indicating poor correlation.
In the fitting relationships between fracture area ratio ρ2 and d, n, λ, d50 (Figure 15), the fitting effect with n is moderate (Figure 15b), while the fitting effects with d, λ, and d50 are weaker (Figure 15a,c,d). Specifically, the fitting function for ρ2 and n is y = 0.067x + 0.545 with R2 = 0.536, indicating a linear positive correlation. This means that larger ρ2 values lead to a narrower particle size distribution of cuttings after coal rock fragmentation, signifying improved uniformity in fragment sizes. However, ρ2 has a relatively low impact on d, λ, and d50.
The fitting results between GSI and four drilling parameters (d, n, λ, d50) are shown in Figure 16. The fitting effect with n is moderate (R2 = 0.561, Figure 16b), whereas the fitting effects with d, λ, and d50 are weaker (Figure 16a,c,d). In particular, GSI exhibits a negative correlation with n, meaning that larger GSI values correspond to a more dispersed particle size distribution of cuttings after coal rock fragmentation. The fitting effect between GSI and d, λ, d50 is poor, indicating that the impact of GSI changes on d, λ, d50 is not as significant as on n.

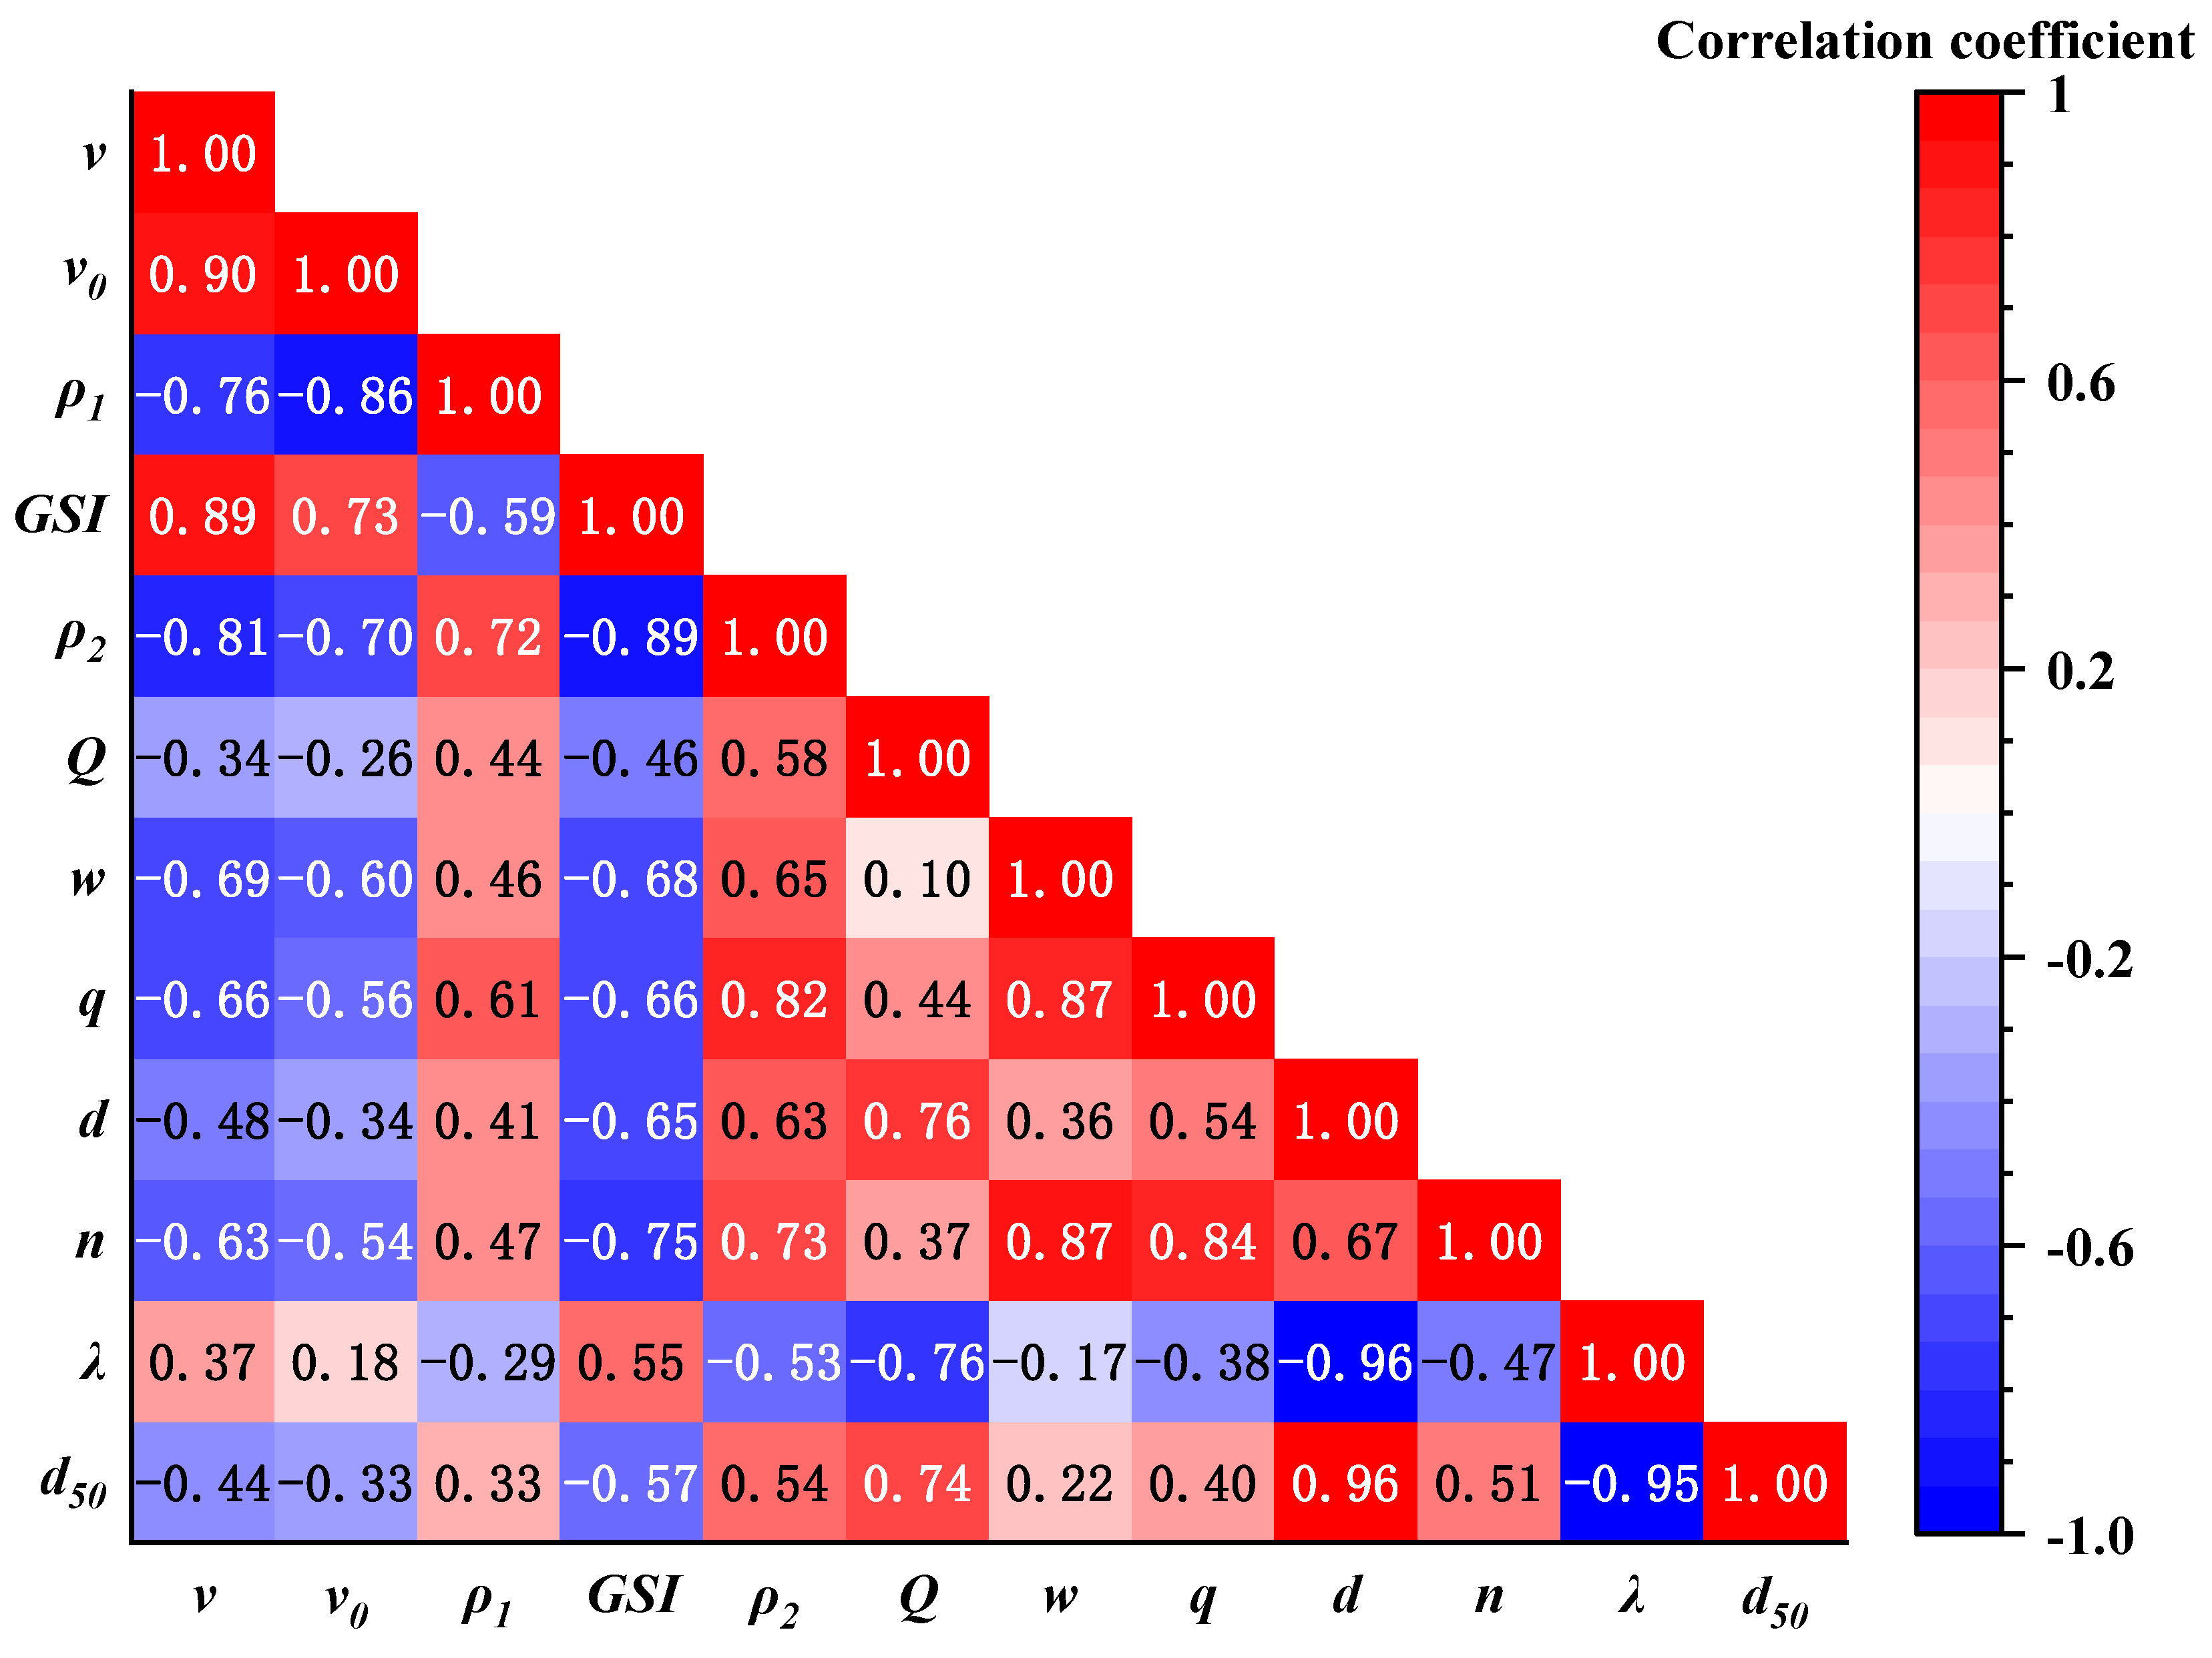
3.4. Correlation Analysis Among Fractures, Acoustic Parameters, Drilling Parameters, and Cuttings Parameters

Using OriginPro 2021 data analysis software, Pearson correlation coefficient (r) analysis was conducted on the experimental data of acoustic parameters, drilling parameters, and cuttings characteristic parameters. This systematically quantified the linear correlations between variables. Specifically, |r| > 0.7 indicates a strong correlation, 0.5 < |r| ≤ 0.7 a moderate correlation, 0.3 < |r| ≤ 0.5 a weak correlation, and |r| ≤ 0.3 an extremely weak correlation. The correlations were visually presented by plotting a correlation heatmap (Figure 17). The correlation heatmap visually presents the correlation between variables in terms of color depth, with warm tones representing positive correlation and cool tones representing negative correlation. The darker the color, the stronger the correlation. The variables included in Figure 17 are acoustic parameters (average wave velocity v, drilling surface wave velocity v0), fracture parameters (fracture line density ρ1, Geological Strength Index GSI, fracture area ratio ρ2), drilling parameters (drill cuttings quantity Q, drilling rate w, drill cuttings rate q), and cuttings parameters (average particle size d, crushability index n, crushing degree index λ, median diameter d50).
The heatmap analysis reveals that the absolute values of correlation coefficients between fracture parameters and acoustic parameters all exceed 0.7, indicating strong correlations. Specifically, acoustic parameters v and v0 exhibit significant negative correlations with ρ1 and ρ2 (dark cool tones), consistent with previous analyses: increased fracture length and area density severely impede acoustic wave propagation, leading to reduced wave velocity. Conversely, v and v0 show positive correlations with GSI (warm tones), suggesting that higher GSI values correspond to more stable coal rock structure, which facilitates acoustic wave propagation and thereby increases wave velocity.
The correlations between fracture parameters and drilling parameters are moderately weak overall. Specifically, ρ1 shows weak to moderate correlations with Q, w, and q (r = 0.44, 0.46, 0.61); GSI exhibits moderate negative correlations with w and q (r = −0.66, −0.68); ρ2 shows positive correlations with Q, w and q, with a stronger correlation with q (r = 0.82).
The correlations between fracture parameters and cuttings parameters are complex. Specifically, fracture parameter ρ1 shows weak correlations with cuttings parameters d, n, λ, d50 (the absolute values of r range from 0.3 to 0.5), consistent with the poor fitting results mentioned earlier. GSI exhibits a strong negative correlation with n (r = −0.75), meaning larger GSI values correspond to more dispersed particle size distributions of cuttings after coal rock fragmentation. However, GSI has moderate correlations with d, λ, and d50 (|r| = 0.55–0.65), indicating its impact on these parameters is less significant compared to the crushability index n. In addition, there is a positive correlation between ρ2 and n (warm tone), indicating that, as the proportion of fracture area ratio increases, the particle size distribution of drill cuttings after coal rock fragmentation becomes more concentrated. Nevertheless, the correlation between ρ2 and d, λ, d50 is moderate (|r| = 0.53–0.63), indicating that ρ2 has a relatively small impact on these parameters.

4. Discussion

4.1. Response of Acoustic Parameters to Fracture Development

From the analysis in Section 3.1, it is evident that the propagation behavior of acoustic waves in coal rock is closely linked to the intensity of fracture development. Figure 18 displays a 3D correlation plot of drilling surface wave velocity v0, GSI, and fracture line density ρ1. The figure demonstrates that v0 increases with higher GSI values, whereas it decreases as ρ1 rises. This trend further validates the intrinsic connection between acoustic parameters and fracture development: more intact coal structures with lower fracture densities facilitate faster acoustic wave propagation. The underlying mechanism lies in fractures acting as discontinuous interfaces within the wave propagation path, inducing reflection, refraction, and scattering [42,43]. These phenomena elongate the effective propagation path, with higher fracture densities exacerbating path tortuosity and propagation distance, thereby significantly reducing wave velocities. Additionally, air-filled voids within fractures further diminish acoustic energy transmission efficiency [44]. Conversely, elevated GSI values signify enhanced structural integrity, resulting in more continuous propagation paths, reduced energy attenuation, and consequently higher wave velocities. Collectively, these findings confirm that acoustic parameters can serve as reliable indirect indicators for evaluating the intensity of coal fracture development.
In addition, microfractures in coal rock from these three mining areas were observed and counted under a microscope (Figure 19), and the porosity of the coal rock was obtained through mercury intrusion experiments. As can be seen from Table 4, the wave velocity of coal rock in three mining areas shows a negative correlation with both the macrofracture area ratio and porosity, meaning that higher wave velocities correspond to smaller macrofracture area ratios and lower porosity. However, it is worth noting that the number of microfractures does not follow this relationship. This is possibly because the influence of microfractures on wave velocity is non-dominant compared with macrofractures. Since microfractures and pores exhibit a more uniform spatial distribution relative to exogenous fractures, the latter are the primary cause of acoustic velocity differences. Overall, changes in wave velocity are jointly controlled by fracture scattering, microfracture development, and porosity. Macrofractures and microfractures are discontinuous interfaces in the coal rock medium. Among them, macrofractures, as large-sized discontinuous interfaces, extend the propagation path of acoustic waves through diffraction and cause energy loss. Microfractures, as microscale interfaces, influence acoustic wave propagation in coal rocks in a manner closely related to factors such as filling status and aperture. Microscopic observations of coal rocks from three mining areas reveal that some microfractures are mineral-filled, and the microfractures in Huolinhe Mine are predominantly tensile fractures with significantly larger apertures than those in Xinyuan and Baode Mines. Specifically, the influence mechanism of microfractures varies with their filling status: air-filled microfractures induce acoustic impedance jumps that intensify wave reflection losses, while mineral-filled microfractures enhance the continuity of coal rock media, mitigating their velocity-reducing effect. Porosity causes energy loss through scattering at pore boundaries or by filling with gas media that enhance acoustic wave energy dissipation. Notably, the coal rock in the Huolinhe mining area has a high macrofracture area ratio, a large number of microfractures, and high porosity, indicating good connectivity between pores and fractures, which further intensifies energy attenuation, resulting in an average wave velocity of only 283 m/s.

4.2. Mechanism Analysis of Cuttings Characteristics for Prediction of Fracture Development

During coal rock drilling, the rotation and axial advancement of the drill bit exert a combined mechanical action on the coal rock ahead (Figure 20). Specifically, kinetic energy transfer during rotation forms normal stress P0 directly ahead of the coal rock, while cyclic air flow generates additional normal stress P1, with both stresses acting on the coal rock ahead. Additionally, shear stress P2 is applied to the borehole wall during drill tooth rolling, further influencing the stress state of the coal rock. In terms of stress distribution, normal stress dominated by axial pressure coexists with tensile stress from circumferential shear action ahead of the borehole [45]. A stress zone forms around the drill bit, consisting of a normal stress region and a tensile stress region, with a transition zone at their interface. The original structure of the coal mass remains in mechanical equilibrium when undisturbed, but drilling induces local stress redistribution. When stress concentration exceeds the compressive or tensile strength of the coal rock, the coal mass fractures [46], inevitably producing cuttings. Due to significant variations in coal rock fracture development, cuttings characteristics exhibit diverse features.
Through macroscopic observation of coal rocks, the development of fractures in coal rocks can be roughly divided into three categories: the coexistence of exogenous fractures and cleats in the Xinyuan Mine coal rocks, the predominance of exogenous fractures in the Baode Mine coal rocks, and the predominance of dense cleats in the Huolinhe Mine coal rocks. Figure 20 shows the distribution characteristics of drill cuttings generated after drilling in coal rocks with three types of fracture development. Type I is the coexistence of exogenous fractures and cleats in coal rock, but the overall fracture density is low, the coal rock structure is relatively complete (high GSI value), and the mechanical properties are uniform. During drilling, drill cuttings are mainly generated under the action of normal stress on the drill bit, and the main form of fragmentation is brittle fracture. Due to the presence of cracks, the stress transmission path is locally obstructed, but the overall strength is still high. The generated drill cuttings are mainly composed of smaller-sized cuttings (d is around 0.52 mm), and the particle size distribution of drill cuttings is relatively concentrated (the value range of n is 0.46–0.61). Type II is coal rock with mainly exogenous fractures, and the overall fracture density is also relatively low, but the coal rock structure is relatively complete (GSI value is lower compared to that of type I). When drilling, it is mainly under the action of normal stress, and the generated drill cuttings show a characteristic of particle size distribution shifting towards the coarse-grained level (d ≈ 0.8 mm), and the concentration of particle size distribution is slightly reduced (n = 0.43–0.53). This may be related to the random distribution characteristics of exogenous fractures, leading to a decrease in the concentration of drill cuttings particle size distribution. Therefore, λ and n slightly decreased, while d50 showed a certain degree of increase. Type III is characterized by dense cleats in coal rock, forming a regular network of endogenous fractures, and loose coal rock structure (with low GSI value). Therefore, during drilling, the coal rock is subjected to the coupling effect of the normal stress of the drill bit and the shear stress around the hole, and the coal rock undergoes shear–tensile fracture along the cleat planes, producing large-sized drill cuttings. And due to the regular arrangement of cleat planes, the crushing path is highly homogenized, and the drilling cuttings are mainly coarse particles with a concentrated particle size distribution (d ≈ 1.53 mm, n = 0.72–0.98).
The drill hole characteristics (Figure 21) exhibit intrinsic correlations with coal rock fracture development. Type I coal rock (high GSI value) exhibits smooth and intact drill hole walls, indicating its homogeneous structural response. Type II coal rock, despite maintaining its structural integrity, exhibits directional cracking along randomly distributed exogenous fractures, manifested as smooth wall surfaces with localized fragmented zones. Type III coal rock (low GSI value) displays significantly roughened and fragmented drill hole walls due to dense-cleat-network-induced structural loosening. This morphological differentiation essentially reflects the macroscopic manifestation of coal rock fracture heterogeneity in mechanical response.

4.3. Analysis of Causes of Variations in Coal Drilling Response

The difference in drilling response of coal is influenced by multiple factors. Figure 22 compares the vitrinite reflectance Ro, density, and firmness coefficient (f) of coal rock from three mining areas. Ro is a key indicator reflecting the degree of coal rock metamorphism, and coal rock density is closely related to its mineral composition and pore structure. The firmness coefficient reflects the compressive strength and overall mechanical properties of coal rocks. Among them, the Rₒ, density, and firmness coefficient of Huolinhe mining area coal rocks are the smallest, indicating a low degree of metamorphism, loose coal rock structure, weak anti-crushing ability, overall fast drilling speed, and easy drilling. The Ro of the coal rock in the Xinyuan mining area is the highest, but its density and f are lower than those in the Baode mining area. According to Table 3, the drilling speed of the Xinyuan mining area is slightly higher than that of the Baode mining area, indicating that the coal rocks in the Xinyuan mining area are relatively easier to drill than those in the Baode mining area. This may result from the high density and f of coal rock in the Baode mining area, which leads to strong homogeneity of coal rocks. The drill bit needs to overcome higher continuous-medium resistance, resulting in a relatively low drilling speed. The coupling effect of the above multi-scale factors indicates that the drilling response of coal is not affected by a single parameter.
It should be noted that the drilling and acoustic testing in this study were conducted under ambient pressure at the surface, whereas deep coal rocks are subjected to geostress and confining pressure, which can alter the closure or opening state of fractures. For instance, an increase in confining pressure promotes the gradual closure of coal rock fractures, reducing the amplitude decrease of acoustic waves. Correspondingly, the mechanical properties of coal rocks also change, thereby influencing the drilling process. Additionally, the difference in coal drilling response is also influenced by geostress direction, water content, and methane adsorption state [47,48,49,50]. When the geostress (principal stress) direction aligns with the borehole axis, higher principal stress levels induce more pronounced internal damage and deformation within the coal matrix, thereby reducing its bearing capacity and increasing drill cuttings production [48]. In terms of moisture content, when the moisture content of coal rock is within the range between 0% and 7.8%, the softening and expansion effects of moisture on particles increase with moisture content and the weakening effect on the physical and mechanical properties of coal intensifies [48], thereby reducing drilling resistance. Meanwhile, the adsorption state of methane may indirectly affect the mechanical properties and fracture propagation of coal by altering pore pressure [49,50].

4.4. Implications for Fracturing Sweet Spot Optimization

Hydraulic fracturing is a core technology for enhancing CBM production, and its effectiveness depends on the efficient interaction between natural fractures and hydraulic fractures [51]. The selection of fracturing sweet spots directly determines fracture propagation efficiency and gas well productivity. This study reveals that the degree of fracture development in coal rock exhibits certain correlations with drilling cuttings characteristics and acoustic parameters, providing valuable guidance for sweet spot optimization.
In vertical well development, the optimization of vertical fracturing intervals can be achieved through synergistic analysis of drilling cuttings and acoustic parameters. When fracture density is high, drilling cuttings tend to have coarser particle sizes, and coarse-grained cuttings exhibit weaker clogging effects on fracture conductivity compared to fine-grained particles [52]. Simultaneously, acoustic wave velocity (v) shows a significant negative correlation with fracture density (|r| > 0.7). Low-velocity zones typically correspond to naturally fractured intervals, where hydraulic fractures tend to propagate along weak planes and interconnect with natural fractures, forming high-conductivity fracture networks. Therefore, preliminary identification of fracturing sweet spots can be achieved through the particle size characteristics of drilling cuttings during mud logging, followed by further optimization using acoustic logging curves (Figure 23a). For horizontal wells, however, the selection of fracturing intervals is constrained by well deviation, making acoustic well logging data acquisition challenging. In such cases, drilling cuttings particle size distribution becomes the critical evaluation criterion. Real-time monitoring of cuttings particle size (d) distribution during mud logging enables rapid identification of coarse-grained enrichment zones, effectively distinguishing sweet spot intervals (Figure 23b).
Finally, this study systematically established a quantitative evaluation criterion for fracture development degree (Table 5) through experimental data synthesis. This evaluation system achieves a quantitative characterization of the fracture development degree through a multi-parameter collaborative identification process involving fracture area proportion, GSI, wave velocity, and the crushing ability index n. It provides discriminative indicators for optimized selection of fracturing sweet spots.

5. Conclusions

(1) Acoustic parameters can indirectly characterize the degree of coal rock fracture development. The increase in fracture line density (ρ1) and areal density (ρ2) significantly reduces acoustic wave velocity, while an increase in GSI enhances wave velocity. This is because the presence of fractures causes reflection, refraction, and scattering of acoustic waves, leading to prolonged actual propagation paths; the higher the fracture density, the more tortuous the acoustic wave path becomes, resulting in a significant reduction in wave velocity. Conversely, higher GSI values indicate a more intact coal rock structure, leading to less acoustic energy loss and higher wave velocity.
(2) Fractures in coal rock have a significant impact on drilling parameters. Fracture areal density ρ2 exhibits a strong positive correlation (r = 0.82) with drill cuttings rate q, indicating that coal rock with high fracture density is more prone to fragmentation. GSI shows a negative correlation (r = −0.68) with drilling rate w, reflecting the restrictive effect of coal rock’s structural stability on drilling resistance; however, fracture parameters have a weaker influence on drill cuttings quantity Q.
(3) Coal rocks with different degrees of fracture development can be divided into three types: the first type is coal rock with coexisting exogenous fractures and cleats but low overall fracture density and intact structure, where drill cuttings during drilling are mainly composed of smaller-sized cuttings with relatively concentrated particle size distribution; the second type is coal rock dominated by exogenous fractures with relatively intact structure, where drill cuttings particle size distribution shifts toward coarser grades with slightly reduced concentration; the third type is coal rock characterized by dense cleats and loose structure, which produce large-sized drill cuttings mainly composed of coarse particles with concentrated particle size distribution during drilling.
(4) Variations in coal drilling response are influenced by multiple factors such as metamorphism degree, density, and mechanical strength. Huolinhe Mine coal rocks have weak metamorphism, loose structure, and low anti-crushing ability, resulting in overall fast drilling speed; Xinyuan Mine coal rocks are easier to drill than Baode Mine’s, possibly due to Baode Mine’s higher density and firmness coefficient (f), stronger homogeneity, and the need for drill bits to overcome higher continuous medium resistance. In future work, the multi-factor coupling mechanism of coal drilling response requires further study.

Author Contributions

Conceptualization, S.L.; Validation, Q.C.; Resources, S.L. and Y.X.; Data curation, H.Z.; Writing—original draft, Z.H.; Writing—review & editing, S.L.; Visualization, A.L.; Supervision, S.L. and H.Z.; Project administration, S.L. and Y.X.; Funding acquisition, S.L. All authors have read and agreed to the published version of the manuscript.

Funding

This work was supported by the National Natural Science Foundation of China (No. 42102220), China National Petroleum Corporation Forward-looking Basic Research Project (No. 2024DDJ23), and Teaching Laboratory Open Fund Project, China University of Geosciences (Wuhan) (No. SKJ2024013). These supports are gratefully acknowledged.

Data Availability Statement

The original contributions presented in this study are included in the article. Further inquiries can be directed to the corresponding author.

Conflicts of Interest

Author Yuhang Xiao was employed by the Research Institute of Petroleum Exploration & Development, PetroChina. The remaining authors declare that the research was conducted in the absence of any commercial or financial relationships that could be construed as a potential conflict of interest.

References

  1. Su, X.; Zhang, L.; Zhang, R. The Abnormal Pressure Regime of the Pennsylvanian No. 8 Coalbed Methane Reservoir in Liulin–Wupu District, Eastern Ordos Basin, China. Int. J. Coal Geol. 2003, 53, 227–239. [Google Scholar] [CrossRef]
  2. Li, S.; Tang, D.; Pan, Z.; Xu, H.; Tao, S.; Liu, Y.; Ren, P. Geological Conditions of Deep Coalbed Methane in the Eastern Margin of the Ordos Basin, China: Implications for Coalbed Methane Development. J. Nat. Gas Sci. Eng. 2018, 53, 394–402. [Google Scholar] [CrossRef]
  3. Liang, S.; Liang, Y.; Elsworth, D.; Yao, Q.; Fu, X.; Kang, J.; Hao, Y.; Wang, M. Permeability Evolution and Production Characteristics of Inclined Coalbed Methane Reservoirs on the Southern Margin of the Junggar Basin, Xinjiang, China. Int. J. Rock Mech. Min. Sci. 2023, 171, 105581. [Google Scholar] [CrossRef]
  4. Yang, X.; Tang, S.; Xi, Z.; Zhang, S.; Zhang, Q.; Zhang, K.; Lin, D.; Wang, J. Dynamic Evolution and Differential Enrichment of Deep Coalbed Methane: A Case Study in Qinshui Basin. Int. J. Coal Geol. 2025, 299, 104696. [Google Scholar] [CrossRef]
  5. Meng, Q.; Li, L.; Li, J.; Tian, W.; Lin, H.; Li, H. Genetic type and gas-generating potential of coalbed methane in the Bayanhua Sag, Erlian Basin. Coal Geol. Explor. 2023, 51, 24–33. [Google Scholar]
  6. Yao, H.; Lv, W.; Wang, K.; Li, L.; Li, W.; Lin, H.; Li, F.; Li, Z. Key geological factors and evaluation methods for huge low-rank coalbed methane reservoirs:Taking Bayanhua depression in Erlian basin as an example. Coal Geol. Explor. 2020, 48, 85–95. [Google Scholar]
  7. Lyu, S.; Wang, S.; Zhang, X.; Li, R.; He, J.; Hu, Q. Pollution characteristics and evaluation of solid-phase materials in CBM drilling. Coal Geol. Explor. 2017, 45, 162–167. [Google Scholar]
  8. Lyu, S.; Wang, S.; Chen, X.; Shah, S.M.; Li, R.; Xiao, Y.; Dong, Q.; Gu, Y. Experimental Study of a Degradable Polymer Drilling Fluid System for Coalbed Methane Well. J. Pet. Sci. Eng. 2019, 178, 678–690. [Google Scholar] [CrossRef]
  9. Lyu, S.; Wang, S.; Li, J.; Chen, X.; Chen, L.; Dong, Q.; Zhang, X.; Huang, P. Massive Hydraulic Fracturing to Control Gas Outbursts in Soft Coal Seams. Rock Mech. Rock Eng. 2022, 55, 1759–1776. [Google Scholar] [CrossRef]
  10. Deisman, N.; Ivars, D.M.; Darcel, C.; Chalaturnyk, R.J. Empirical and Numerical Approaches for Geomechanical Characterization of Coal Seam Reservoirs. Int. J. Coal Geol. 2010, 82, 204–212. [Google Scholar] [CrossRef]
  11. Sui, L.; Yu, J.; Cang, D.; Miao, W.; Wang, H.; Zhang, J.; Yin, S.; Chang, K. The Fractal Description Model of Rock Fracture Networks Characterization. Chaos Solitons Fractals 2019, 129, 71–76. [Google Scholar] [CrossRef]
  12. Hu, Q.; Li, M.; Jia, H.; Liu, C.; Cui, X.; Li, L.; Peng, H.; Zhang, G.; Mao, C. Discussion of the geological adaptability of coal-bed methane horizontal wells of high-rank coal formation in southern Qinshui Basin. J. China Coal Soc. 2019, 44, 1178–1187. [Google Scholar]
  13. Liu, S.; Wang, D.; Yin, G.; Li, M.; Li, X. Experimental Study on the Microstructure Evolution Laws in Coal Seam Affected by Temperature Impact. Rock Mech. Rock Eng. 2020, 53, 1359–1374. [Google Scholar] [CrossRef]
  14. Lyu, S.; Chen, X.; Li, R.; Wang, S.; Liu, J.; Shen, P. Microstructure Analysis on the Fracture Network in High-Rank Coals. Earth Space Sci. 2021, 8, e2021EA001780. [Google Scholar] [CrossRef]
  15. Sun, X.; Zhao, K.; Wang, S.; Song, X.; Liu, L. Influence of Supercritical CO2 Fracturing Mode on the Fracture Morphology and Propagation Characteristics of Coal. Energy Fuels 2024, 38, 4325–4336. [Google Scholar] [CrossRef]
  16. Zhang, P.; Wang, D.; Yu, C.; Zeng, F. Digital coal core construction process and crack characterization based on industrial CT scanning. J. Henan Polytech. Univ. 2019, 38, 10–16. [Google Scholar]
  17. Tian, F.; Li, X.; Zhu, W.; He, R.; Chen, G. Evaluation of 3D characteristics and optimization of fracturing sections for No. 8 coal seam crack in Daning-Ji County block. China Energy Environ. Prot. 2023, 45, 88–95. [Google Scholar]
  18. Wang, L.; Chen, Z.; Ji, Z.; Kong, H.; Shen, H. Experimental Study on Mechanical Properties and Drillability Classification for the X# Coal Seam. Saf. Coal Mines 2013, 44, 18–21. [Google Scholar]
  19. Karasawa, H.; Ohno, T.; Kosugi, M.; Rowley, J.C. Methods to Estimate the Rock Strength and Tooth Wear While Drilling with Roller-Bits—Part 1: Milled-Tooth Bits. J. Energy Resour. Technol.-Trans. Asme 2002, 124, 125–132. [Google Scholar] [CrossRef]
  20. Wang, Q.; Gao, H.; Jiang, B.; Yang, J.; Lv, Z. Relationship Model for the Drilling Parameters from a Digital Drilling Rig versus the Rock Mechanical Parameters and Its Application. Arab. J. Geosci. 2018, 11, 357. [Google Scholar] [CrossRef]
  21. Yue, Z.Q.; Lee, C.F.; Law, K.T.; Tham, L.G. Automatic Monitoring of Rotary-Percussive Drilling for Ground Characterization—Illustrated by a Case Example in Hong Kong. Int. J. Rock Mech. Min. Sci. 2004, 41, 573–612. [Google Scholar] [CrossRef]
  22. Xie, Z.; Chang, X.; Yang, L.; Pi, Y. Classification method of coal and rock drillability based on Mechanical Specific Energy theory. Coal Geol. Explor. 2021, 49, 236–243. [Google Scholar]
  23. Liu, C.; Zhan, Q.; Yang, L.; Zheng, X.; Li, P.; Shahani, N.M. Recognition of Interface and Category of Roadway Roof Strata Based on Drilling Parameters. J. Pet. Sci. Eng. 2021, 204, 108724. [Google Scholar] [CrossRef]
  24. Liu, C.; Song, J.-J.; Kim, J.; Zheng, X.; Shahani, N.M.; Xu, W. Fracture Identification under Unstable Drilling Conditions Based on Proposed Multi-Parameter Voting Method. Rock Mech. Rock Eng. 2023, 56, 3805–3823. [Google Scholar] [CrossRef]
  25. Zhu, J.; Chen, M.; Wang, L.; Sun, H.; Wang, C.; Azhar, N.; Oduro, N.B. Characterization of 10 Nm–10 Μm Coal Dust Particles Generated by Simulated Different Cutting and Drilling Parameters: Mass Concentration Distribution, Number Concentration Distribution, and Fractal Dimension. Int. J. Coal Sci. Technol. 2023, 10, 89. [Google Scholar] [CrossRef]
  26. Geng, J.; Cao, L.; Zhong, C.; Wang, H.; Chen, B. Investigation of Dynamic Response of Drilling Parameters and Deformation Characteristics of Coal around Borehole during Multi-Stage Reaming in Tectonic Coal. Int. J. Rock Mech. Min. Sci. 2023, 170, 105540. [Google Scholar] [CrossRef]
  27. Xiao, S.; Ge, Z.; Lu, Y.; Zhou, Z.; Li, Q.; Wang, L. Investigation on Coal Fragmentation by High-Velocity Water Jet in Drilling: Size Distributions and Fractal Characteristics. Appl. Sci. 2018, 8, 1988. [Google Scholar] [CrossRef]
  28. Zhang, Z.; Lan, X.; Wen, G.; Long, Q.; Yang, X. An Experimental Study on the Particle Size and Shape Distribution of Coal Drill Cuttings by Dynamic Image Analysis. Geofluids 2021, 2021, 5588248. [Google Scholar] [CrossRef]
  29. Wolf, K.-H.A.A.; van Bergen, F.; Ephraim, R.; Pagnier, H. Determination of the Cleat Angle Distribution of the RECOPOL Coal Seams, Using CT-Scans and Image Analysis on Drilling Cuttings and Coal Blocks. Int. J. Coal Geol. 2008, 73, 259–272. [Google Scholar] [CrossRef]
  30. Kumar, S.; Talreja, R.; Murthy, V.M.S.R. Development of a Drill Energy Utilization Index for Aiding Selection of Drill Machines in Surface Mines. Int. J. Min. Sci. Technol. 2017, 27, 393–399. [Google Scholar] [CrossRef]
  31. Mohammadi, M.; Khademi Hamidi, J.; Rostami, J.; Goshtasbi, K. A Closer Look into Chip Shape/Size and Efficiency of Rock Cutting with a Simple Chisel Pick: A Laboratory Scale Investigation. Rock Mech. Rock Eng. 2020, 53, 1375–1392. [Google Scholar] [CrossRef]
  32. Zhou, Y.; Liang, B.; Sun, W.; Liu, X. Distribution laws of particle size of drilling cuttings with drilling depth in deep coal seams. J. Saf. Sci. Technol. 2020, 16, 66–72. [Google Scholar]
  33. Wang, C.; Cheng, Y.; Yi, M.; Lei, Y.; He, X. Powder Mass of Coal after Impact Crushing: A New Fractal-Theory-Based Index to Evaluate Rock Firmness. Rock Mech. Rock Eng. 2020, 53, 4251–4270. [Google Scholar] [CrossRef]
  34. Zhao, L.; Cao, Y.; Lyu, S.; Li, J.; Tian, L. Coal Structure Characteristics in the Northern Qinshui Basin and Their Discrimination Method Based on the Particle Size of Drilling Cuttings. ACS Omega 2022, 7, 22956–22968. [Google Scholar] [CrossRef]
  35. Lv, S.; Wang, S.; Li, R.; Li, G.; Yuan, M.; Wang, J. Prediction of Coal Structure Using Particle Size Characteristics of Coalbed Methane Well Cuttings. Int. J. Min. Sci. Technol. 2019, 29, 209–216. [Google Scholar] [CrossRef]
  36. Haghshenas, B.; Clarkson, C.R.; Aquino, S.D.; Chen, S. Characterization of Multi-Fractured Horizontal Shale Wells Using Drill Cuttings: 2. Permeability/Diffusivity Estimation. J. Nat. Gas Sci. Eng. 2016, 32, 586–596. [Google Scholar] [CrossRef]
  37. Hoek, E.; Brown, E.T. Practical Estimates of Rock Mass Strength. Int. J. Rock Mech. Min. Sci. 1997, 34, 1165–1186. [Google Scholar] [CrossRef]
  38. Guo, H.; Su, X.; Xia, D.; Ni, X.; Li, G. Relationship of the permeability and geological strength index( GSI) of coal reservoir and its significance. J. China Coal Soc. 2010, 35, 1319–1322. [Google Scholar]
  39. Gao, X.; Wang, Y.; Zhang, C. Study and analysis on coal structure features during drilling operation and well wall stability. Coal Sci. Technol. 2016, 44, 95–99. [Google Scholar]
  40. Gonzalez-Tello, P.; Camacho, F.; Vicaria, J.M.; Gonzalez, P.A. A Modified Nukiyama-Tanasawa Distribution Function and a Rosin-Rammler Model for the Particle-Size-Distribution Analysis. Powder Technol. 2008, 186, 278–281. [Google Scholar] [CrossRef]
  41. Alderliesten, M. Mean Particle Diameters. Part VII. The Rosin-Rammler Size Distribution: Physical and Mathematical Properties and Relationships to Moment-Ratio Defined Mean Particle Diameters. Part. Part. Syst. Char. 2013, 30, 244–257. [Google Scholar] [CrossRef]
  42. Jin, J.; Zhao, K.; Huang, F.; Wang, Y.; Fang, L. Experimental study on acoustic time domain propagation characteristics of rock under high water pressure and ground stress. J. China Coal Soc. 2024, 49, 3074–3089. [Google Scholar]
  43. Zhang, M.; Liu, P.; Fan, H.; Li, Z.; Zhao, H.; Jiang, J.; Feng, Z.; Wang, K.; Li, Y.; Wu, H. Response Characteristics of Acoustic Reflection Imaging Logging of Fractures and Formation Interfaces Outside Horizontal Wells in Tight Reservoirs. Chin. J. Geophys.-Chin. Ed. 2024, 67, 2439–2454. [Google Scholar]
  44. Chen, Q.; Liu, X.; Liang, L.; Wang, S.; Yang, C. Numerical simulation of the fractured model acoustic attenuation coefficient. Chin. J. Geophys. 2012, 55, 2044–2052. [Google Scholar]
  45. Li, H.; Wang, W.; Liu, Y.; Ma, J.; Gao, H. An Integrated Drilling, Protection and Sealing Technology for Improving the Gas Drainage Effect in Soft Coal Seams. Energy Rep. 2020, 6, 2030–2043. [Google Scholar] [CrossRef]
  46. Lai, X.; Ren, J.; Cui, F.; Shan, P.; Dai, J.; Xu, H.; Wang, Z. Study on Vertical Cross Loading Fracture of Coal Mass through Hole Based on AE-TF Characteristics. Appl. Acoust. 2020, 166, 107353. [Google Scholar] [CrossRef]
  47. Zhu, L.; Xie, Z.; Li, X.; Zhao, Y.; Wang, T.; Yang, X. Study on the Law of Rock Drillability under High-Temperature and High-Pressure Conditions in the Western Margin of the Ordos Basin. Processes 2024, 12, 1261. [Google Scholar] [CrossRef]
  48. Zhu, G.; Xu, Z.; Liu, H. Experimental study on mechanical behavior and response mechanism of triaxial loading-unloading drilling in impact coal under the effect of water content. Coal Sci. Technol. 2024. [Google Scholar] [CrossRef]
  49. Wang, D.; Pang, X.; Wei, J.; Zhang, H.; Yao, B.; Wei, L.; Guo, Y.; Yuan, M.; Tang, J. Effect of gas properties and pore pressure on the microcrack propagation in coal. Coal Sci. Technol. 2023, 51, 183–192. [Google Scholar]
  50. Zhou, W.; Gao, K.; Xue, S.; Han, Y.; Shu, C.-M.; Huang, P. Experimental Study of the Effects of Gas Adsorption on the Mechanical Properties of Coal. Fuel 2020, 281, 118745. [Google Scholar] [CrossRef]
  51. Lyu, S.; Wang, S.; Chen, X.; Wang, S.; Wang, T.; Shi, X.; Dong, Q.; Li, J. Natural Fractures in Soft Coal Seams and Their Effect on Hydraulic Fracture Propagation: A Field Study. J. Pet. Sci. Eng. 2020, 192, 107255. [Google Scholar] [CrossRef]
  52. Zhao, Z.; Ni, X.; Liu, Z.; Wu, X. Attenuation characteristics of coal fissure induced by gas-water two-phase drive. J. China Coal Soc. 2020, 45, 3853–3863. [Google Scholar]
Figure 1. Source of coal samples.
Energies 18 03404 g001
Figure 2. Schematic diagram of original coal sample and cut coal rock.
Energies 18 03404 g002
Figure 3. Experimental procedures in the study: 1. Fracture statistics, 2. Acoustic wave testing, 3. Drilling test, and 4. Drill cuttings treatment.
Energies 18 03404 g003
Figure 4. Estimated GSI values for different coal structure types.
Energies 18 03404 g004
Figure 5. Waveform diagrams of three structural planes for Sample X-2.
Energies 18 03404 g005
Figure 6. Relationship between fracture line density and acoustic parameters including (a) average wave velocity and (b) drilling surface wave velocity.
Energies 18 03404 g006
Figure 7. Relationship between fracture area ratio and acoustic parameters including (a) average wave velocity and (b) drilling surface wave velocity.
Energies 18 03404 g007
Figure 8. Relationship between GSI and acoustic parameters including (a) average wave velocity and (b) drilling surface wave velocity.
Energies 18 03404 g008
Figure 9. Relationship between fracture line density and drilling parameters.
Energies 18 03404 g009
Figure 10. Relationship between fracture area ratio and drilling parameters.
Energies 18 03404 g010
Figure 11. Relationship between GSI and drilling parameters.
Energies 18 03404 g011
Figure 12. Particle size screening of cuttings from different types of coal samples (B: Baode coal samples, X: Xinyuan coal samples, H: Huolinhe coal samples).
Energies 18 03404 g012
Figure 13. Particle size distribution histogram of cuttings from different coal samples.
Energies 18 03404 g013
Figure 14. Relationship between fracture line density and cuttings parameters including (a) average particle size, (b) crushability index, (c) crushing degree index, and (d) median diameter.
Energies 18 03404 g014
Figure 15. Relationship between fracture area ratio and cuttings parameters including (a) average particle size, (b) crushability index, (c) crushing degree index, and (d) median diameter.
Energies 18 03404 g015
Figure 16. Relationship between GSI and cuttings parameters including (a) average particle size, (b) crushability index, (c) crushing degree index, and (d) median diameter.
Energies 18 03404 g016aEnergies 18 03404 g016b
Figure 17. Correlation heatmap of variables in the tests.
Energies 18 03404 g017
Figure 18. The 3D relationship of v0, GSI, and ρ1.
Energies 18 03404 g018
Figure 19. Microscopic images of microfractures in coal samples from the Xinyuan, Baode, and Huolinhe mining areas: (a) Xinyuan, (b) Baode, (c) Huolinhe.
Energies 18 03404 g019
Figure 20. Force analysis during drilling and mechanism of cuttings generation from coals with different fracture types: Type I (low-density coexisting exogenous fractures and cleats), Type II (exogenous-fracture-dominant), and Type III (dense-cleat-dominant).
Energies 18 03404 g020
Figure 21. Drill hole characterization of coal samples.
Energies 18 03404 g021
Figure 22. Comparison chart of coal rocks’ density, Ro, and f from Baode, Xinyuan, and Huolinhe Mines.
Energies 18 03404 g022
Figure 23. Schematic diagram of fracturing sweet spot optimization in (a) vertical well and (b) horizontal well.
Energies 18 03404 g023
Table 1. Ash yield and organic maceral compositions of coal samples from three mining areas.
Mining AreaInorganic MineralsOrganic Macerals
Aad (%)Vitrinite (%)Inertinite (%)Liptinite (%)
Xinyuan Mine17.8274.3225.680
Baode Mine10.9579.3620.140.50
Huolinhe Mine6.2892.107.640.26
Table 2. Wave velocity data of three groups of characteristic structural planes.
Sample NumberWave Velocity of Plane 1 (m/s)Wave Velocity of Plane 2 (m/s)Wave Velocity of Plane 3 (m/s)
B-291921681984
B-377723921581
X-1258623262718
X-2190020661635
X-418081403891
X-5186424631563
H-1286350414
H-2268300332
Table 3. Drilling Parameters of Coal Rocks.
Serial NumberB-1B-2B-3X-2X-3X-4X-5H-1H-2H-3
Q/(g/cm)9.972.889.235.455.915.7811.6413.275.4412.41
w/(cm/s)0.0130.0130.01250.0190.0260.0290.03130.0220.1250.113
q/(g/s)0.130.040.120.10.150.170.360.290.681.4
Table 4. Comparison of coal rock fracture parameters and acoustic wave velocity across different mining areas.
Mining AreaMacrofracture Area Ratio (%)Number of Microfractures (Counts/9 cm2)Porosity (%)Average Wave Velocity (m/s)
Xinyuan0.314512.11748
Baode0.542194.871485
Huolinhe4.663614.21283
Table 5. Prediction and evaluation indices of fracture development degree.
Fracture Development DegreeFracture Area Ratio (%)GSIWave Velocity (m/s)n
Low<0.36>84>15830.43–0.76
Medium0.36–1.873–86675–16900.46–0.57
High>1.8<73<6750.72–0.98
Disclaimer/Publisher’s Note: The statements, opinions and data contained in all publications are solely those of the individual author(s) and contributor(s) and not of MDPI and/or the editor(s). MDPI and/or the editor(s) disclaim responsibility for any injury to people or property resulting from any ideas, methods, instructions or products referred to in the content.

