Article

Multi-Mode Operation and Coordination Control Strategy Based on Energy Storage and Flexible Multi-State Switch for the New Distribution Network During Grid-Connected Operation

1
Inner Mongolia Power (Group) Co., Ltd., Inner Mongolia Power Research Institute Branch, Hohhot 010020, China
2
Inner Mongolia Enterprise Key Laboratory of Smart Grid Simulation of Electrical Power System, Hohhot 010020, China
3
Department of Electrical Engineering, Baotou Vocational & Technical College, Baotou 014030, China
4
College of Electric Power, Inner Mongolia University of Technology, Hohhot 010080, China
*
Author to whom correspondence should be addressed.
Energies 2025, 18(13), 3389; https://doi.org/10.3390/en18133389
Submission received: 27 May 2025 / Revised: 17 June 2025 / Accepted: 22 June 2025 / Published: 27 June 2025
(This article belongs to the Special Issue Advanced Electric Power Systems, 2nd Edition)

Abstract

For a new distribution network with energy storage and a flexible multi-state switch (FMSS), several problems of multi-mode operation and switching, such as the unbalance of feeder loads and feeder faults, among others, should be considered. This paper forwards a coordination control strategy to address the above challenges faced by the FMSS under grid-connected operations. To tackle the multi-mode operation problem, the system’s operational state is divided into multiple working modes according to the operation states of the system, the positions and number of fault feeders, the working states of the transformers, and the battery’s state of charge. To boost the system’s operational reliability and load balance and extend the power supply time for the fault load, the appropriate control objectives in the coordination control layer and control strategies in the equipment layer for different working modes are established for realizing the above multi-directional control objectives. To resolve the phase asynchrony issue among the fault load and other normal working loads caused by the feeder fault, the off-grid phase-locked control based on the V/f control strategy is applied. To mitigate the bus voltage fluctuation caused by the feeder fault switching, the switching control sequence for the planned off-grid is designed, and the power feed-forward control strategy of the battery is proposed for the unplanned off-grid. The simulation results show that the proposed control strategy can ensure the system’s power balance and yield a high-quality flexible power supply during the grid-connected operational state.

1. Introduction

With the introduction of renewable energy sources into the distribution network, the “closed-loop design and open-loop operation” on the conventional mechanical switches cannot fulfill the control requirements of safety, reliability, and load balance [1,2]. Hence, flexible interconnection among power distribution networks has emerged as a novel technology to enhance the operational reliability and flexibility of power distribution network systems [3,4]. A flexible multi-state switch (FMSS) is a power electronics device installed between two feeders or among multiple feeders in the distribution network to regulate the active power flow among feeders [5].
According to the control technologies of the power electronics and intelligence algorithm, among others, a FMSS not only has the feature on the on-off states of the traditional switches but also can realize objectives like the continuous control of the power, load balance, improving reliability of power supply and so on. Therefore, it is the critical technology and equipment support for the smart grid and new-type power system in the future [6].
The intelligence soft normally open point (SNOP) was introduced in [7]. Based on the SNOP, a FMSS was proposed in [8]. Scholars at home and abroad have performed a series of studies on the structure and control strategies of the FMSS.
In terms of the structure of the FMSS, it can generally be divided into two-port, three-port, and multi-port FMSSs. The two-port FMSS structure, which can realize the power transmission between two AC grids, was studied in [9]. However, the system stopped energy transmission upon the failure of the two-port structure [10]. Therefore, the reliability of the two-port FMSS still needs to be improved. A three-port FMSS structure was introduced to address this challenge [11]. Because of its low power loss, the three-port FMSS exhibits promising application prospects and is broadly used in modern distribution networks [12]. The multi-port FMSS was examined based on two-port and three-port FMSSs [13]. The operational reliability of the multi-port FMSS is superior to that of two-port and three-port FMSSs, but its control is more sophisticated than the two-port and three-port FMSSs [14]. Therefore, the multi-port does not have extensive applications.
In terms of the control strategies of the FMSS, several operational states can be determined according to whether the feeder fails. In [15], a three-port FMSS could be operated on flexible interconnection, load transfer, and autonomous operational states. The former two operational states belong to the grid-connection operation, whereas the latter one belongs to the islanded operation. Based on the three operational states, several control strategies were studied. During the flexible interconnection operational state, the double-loop control strategy of the FMSS, which yields the load balance by the bus voltage distribution strategy among ports, was proposed in [16]. However, 4 PI controls were necessary to work together in this control strategy, which made it more complicated to realize. To simplify control, with the introduction of the active power coefficient, the active power balance on a two-port FMSS was achieved by 2 PI controls [17]. However, it did not consider the location and capacity of the FMSS, which might increase the network expansion costs. In [18], the position and capacity of the FMSS in the distribution network were optimized by the second-order cone programming approach. Although the values of losses and related costs are reduced, it did not consider the bus voltage variation caused by wind power fluctuation. In [19], a synchronverter was introduced to mitigate the voltage fluctuation. However, it was necessary to set the appropriate parameters of the synchronverter to improve the bus voltage variation when a loss of mains occurred. This made the control strategy more complicated. To simplify the control strategy during the load transfer operational state, an online load transfer control strategy of the FMSS was studied under fault conditions to supply power for the faulted load [20]. Although it had good effects, it did not consider the control strategy during the flexible interconnection. In [21], the P/Q, Udc/Q and CVCF control strategies were studied for making the system normal working during the flexible interconnection and load transfer operational state.
All the studies mentioned above analyzed the FMSS for the single operating mode. However, it is necessary to ensure transfer among multiple modes when the system conditions change in practical operations. The two-port FMSS control strategy based on the virtual synchronous machine was proposed for switching among different modes [15]. In [22], the state compensation method was adopted to attain the switching of the control modes on a three-port FMSS by setting the appropriate reference value for the current inner loop of the V/f control strategy. The controller in [15,22] adopted the traditional PI controller, which made the range on the bus voltage large. In [23], the smooth switching among multi-mode by LADRC was applied to considerably lower the deviation ratio of DC voltage. Although the control strategies in [21,22,23] play a vital role in the mode switching of the FMSS, all the above techniques depend on the FMSS energy to maintain the power balance during the feed fault. Therefore, the system’s reliability cannot be assured if all of the feeders fail simultaneously because of a lack of other energy support in the system [24].
To resolve this concern, the energy storage system with the store energy function is introduced into the FMSS [25], namely the E-FMSS. The E-FMSS was superior to FMSS in terms of control flexibility, anti-interference, and scheduling control ability [26]. According to the type of energy storage unit, the E-FMSS has two forms: one is composed of a supercapacitor [27] and battery [28], which are the traditional energy storages; the other is composed of hydrogen-electricity [29] or hydrogen-electricity-heat [30], which are the novel and clean energy storages. In view of the respective characteristics of supercapacitors, batteries, and hydrogen, different control objectives can be set in the coordination control strategy. In [27], three control objectives of the E-FMSS with suppressing negative sequence current, active power oscillation, and reactive power oscillation were proposed for the fast responsiveness of the supercapacitor. In [31], two control objectives of the E-FMSS, with load balancing and extending the power time for the fault load, are set for the high energy density of the battery. In [32], two control objectives with economy and resilience are designed to ensure the cleanliness of hydrogen energy.
All the above control strategies and structures of energy storages affected the E-FMSS to some extent, but they all worked for the operation status and were not refined to working modes. Consequently, the system’s operational efficiency needs to be improved. To solve this problem, one or more control objectives should be set in different working modes according to the system’s varying working conditions. These objectives can enable the system to operate optimally in every working condition. Furthermore, the system’s multi-mode switching has just been examined in the case of the emergency braking mode. However, few papers have investigated the control strategies on the planned off-grid, which informs the off-grid time in advance, in depth, until now. Consequently, this paper takes the new distribution network with energy storage and the FMSS as the study object. It analyzes the working modes, control objectives, control strategies, and feeder off-grid switching strategies of the system. The primary contributions of this paper are summarized as follows:
(1)
A coordinated control strategy based on the E-FMSS is proposed, with the objectives of improving the power supply reliability, realizing the load balance, and extending the power supply time for the fault feeder load.
(2)
Different working modes in the coordinated control strategy are established according to the working states of the transformers, the types and positions of fault feeders, as well as the battery’s state of charge (SOC) during the flexible interconnection and load transfer operational state.
(3)
Switching strategies for the planned and the unplanned feeder off-grids are proposed, respectively, to improve the DC bus voltage shock problem during feeder switching. For the former, a switching control sequence among different converters is developed. For the latter, a power feed-forward control strategy is introduced into the control strategy of the battery.
(4)
An improved drop control strategy of the battery with the off-grid phase-locked function is proposed to address the phase asynchronous problem quickly during the feeder off-grid.
The remainder of this paper is organized as follows. Section 2 introduces the principle and operational state analysis of the new distribution network based on energy storage and the FMSS. Section 3 and Section 4 illustrate the control objectives in the coordination control layer and the control strategy of the equipment layer under the flexible interconnection and the load transfer operational state, respectively. Section 5 describes the control strategies during the off-grid feeder. Section 6 introduces the control strategies of converters on the equipment layer. Section 7 elaborates on the simulation results. Finally, Section 8 summarizes the conclusions.

2. Control Principle and Operational State Analysis of the New Distribution Network

2.1. Topological Structure of the New Distribution Network with E-FMSS

Figure 1 depicts the topology of the new distribution network based on the energy storage and the FMSS. This figure shows that the FMSS is composed of VSC1~VSC3, which are the back-to-back voltage source converters. The DC ports of VSC1~VSC3 are connected in parallel to work as a common DC bus. The AC ports of VSC1~VSC3 are connected to 3 independent 10 kV AC grids, namely Grid 1, Grid 2, and Grid 3, by T1, T2, and T3 transformers. Moreover, three independent AC feeder loads, namely L1, L2, and L3, are connected to the VSC1~VSC3, respectively. The energy storage unit with a battery and a bidirectional DC/DC converter is connected to the DC bus to enhance this system’s operational reliability and control flexibility for the FMSS during complicated operation conditions.
In Figure 1, Cdc is the DC bus capacitor for decreasing the DC bus voltage ripple, and Udc is the DC bus voltage.

2.2. Control Principle of This System

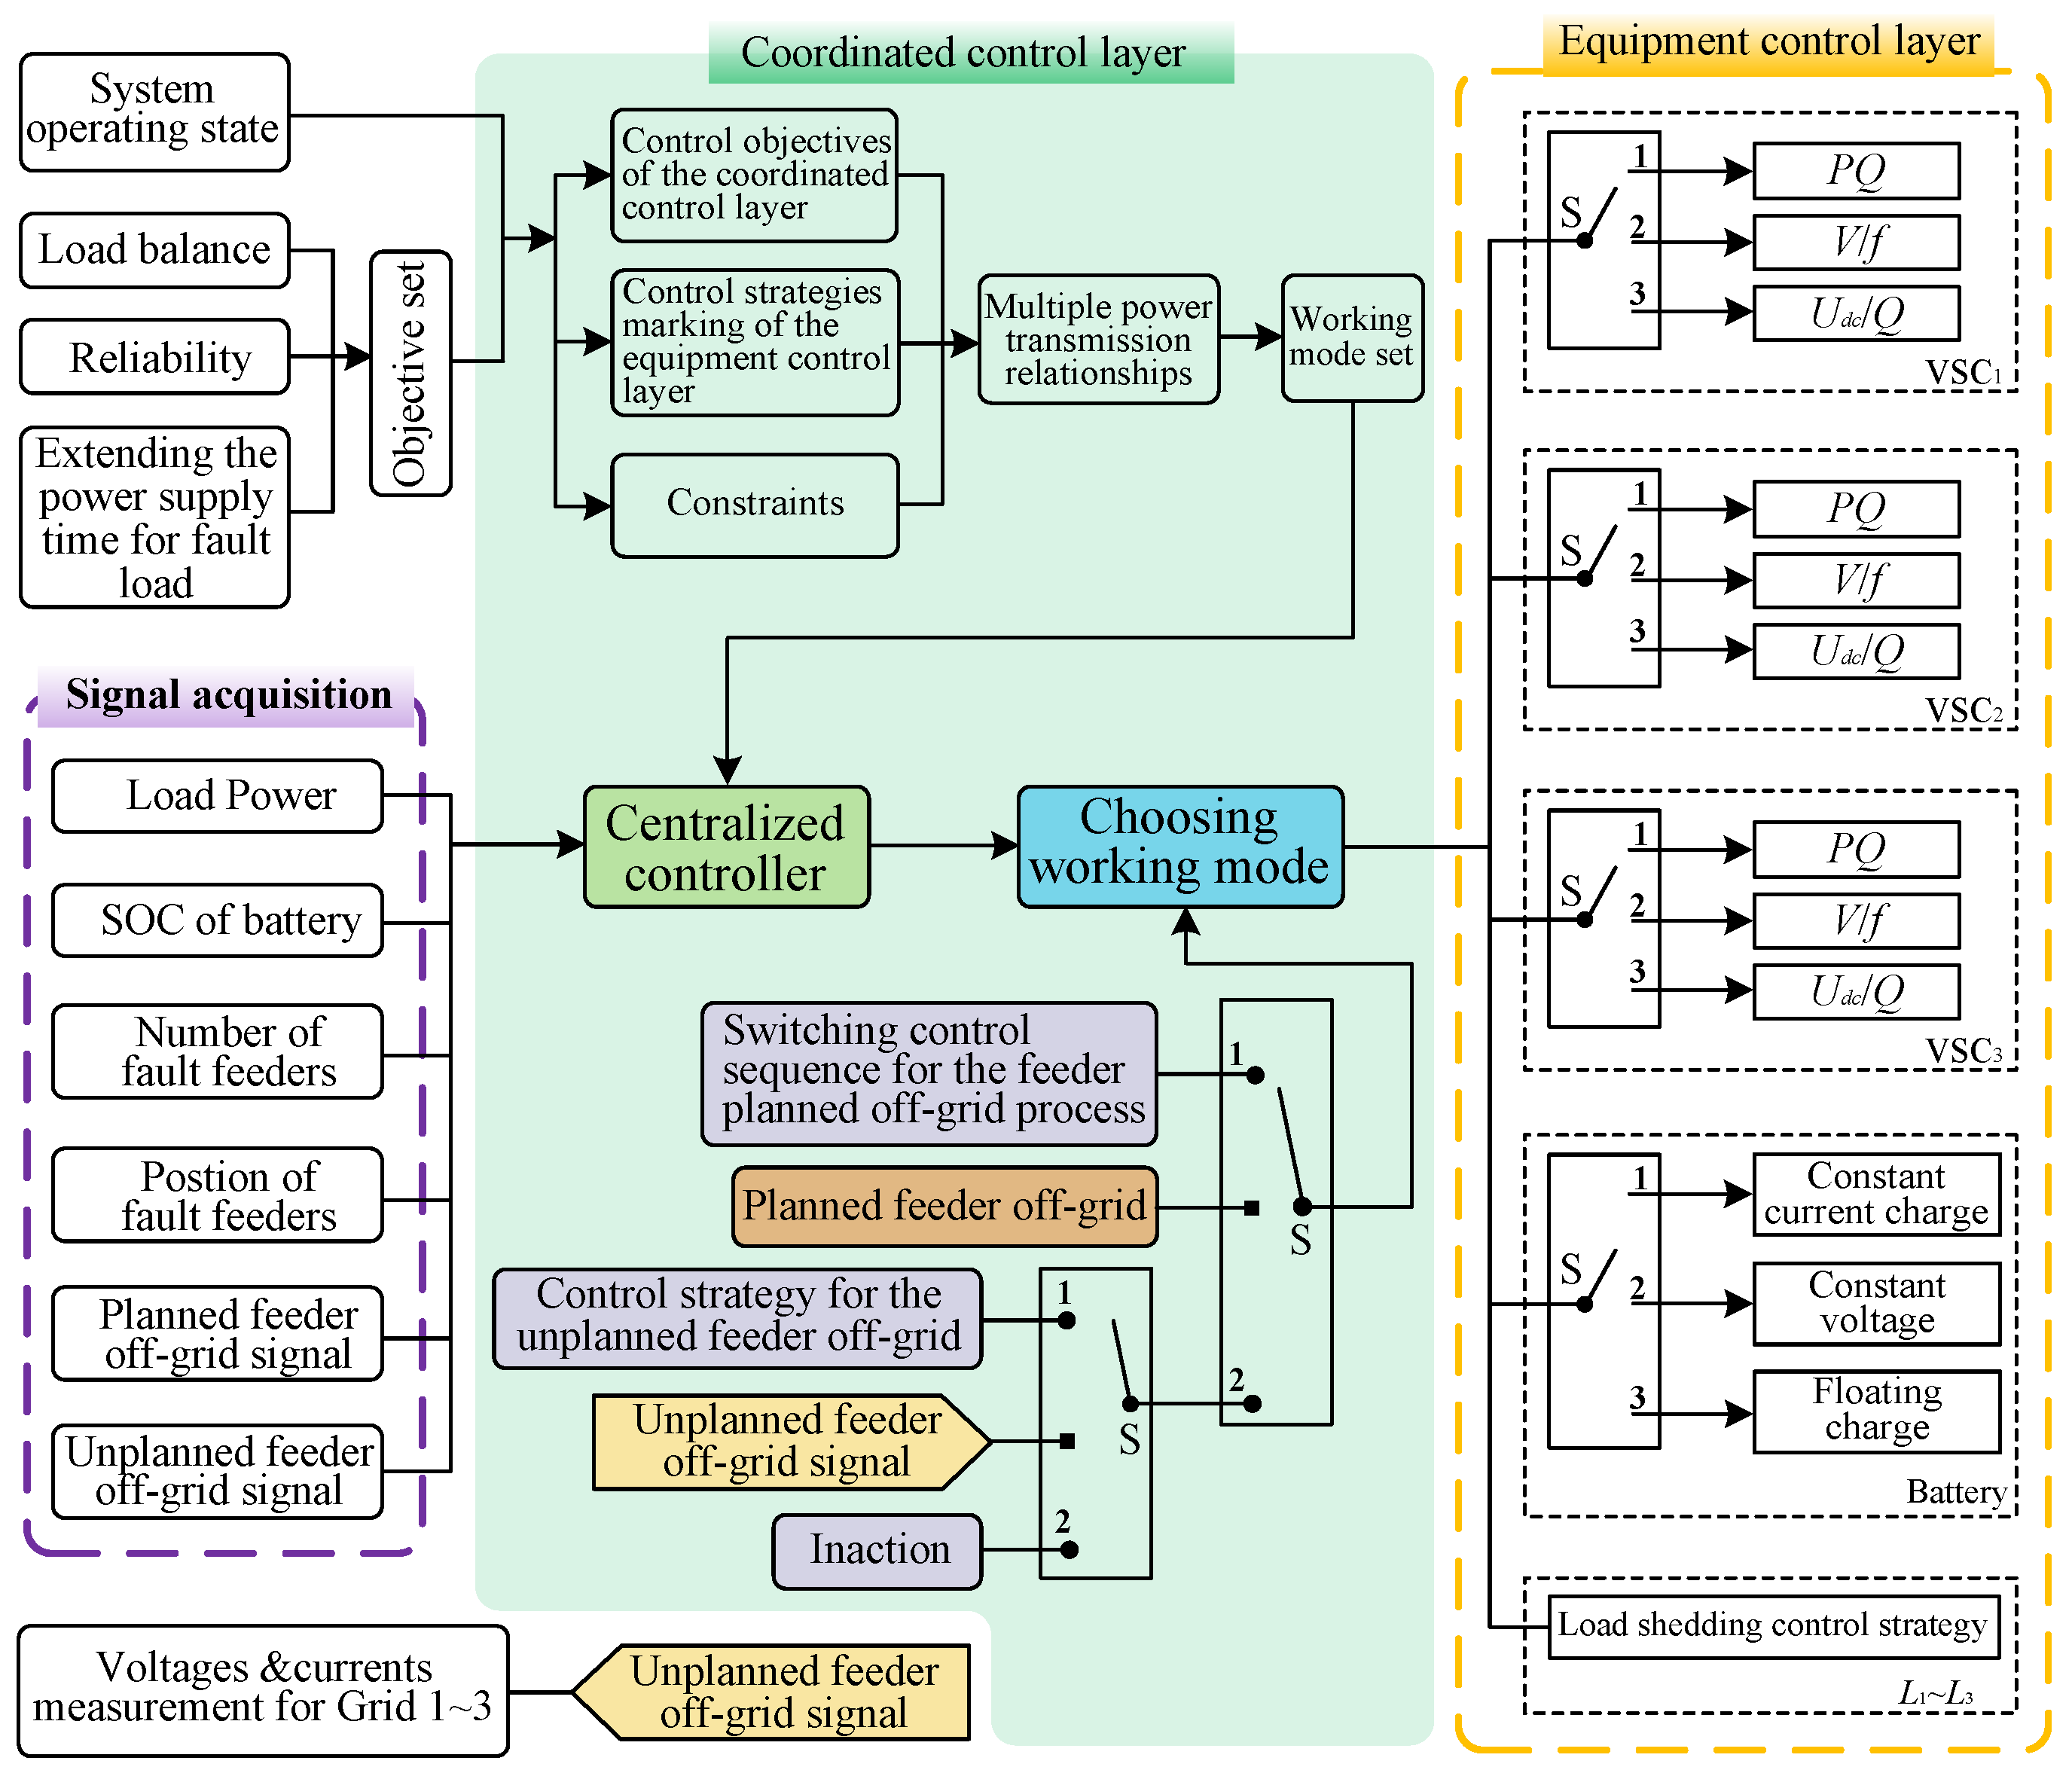
This paper applies a hierarchical control method with a coordinated control layer and an equipment layer to coordinate the energy storage unit and the FMSS. A centralized controller is applied in the coordinated control layer to achieve different control objectives (e.g., load balance, improving the system’s power supply reliability, extending the power supply time for the fault feeder load) and devise the corresponding control strategies to the equipment layer. Several individual local controllers with different control strategies in the equipment layer are presented for the FMSS and battery, respectively. Figure 2 depicts the corresponding control structure.
Figure 2 demonstrates that the centralized controller in the coordinated control layer solves the issues about working mode selection and switching during the grid-connected operation by the load power, the battery’s SOC, the positions and number of fault feeders, as well as operational states of the transformers, etc. The FMSS in the equipment layer selects its control strategy from Udc/Q, PQ, and V/f. If all the feeders connected to the three ports of the FMSS work well, one port usually operates using the Udc/Q control strategy to stabilize the DC bus voltage, which is known as the steady-voltage port. The other ports, which are the unsteady-voltage ports, operate using the PQ control strategy to output the set power from the AC grid to the system. If the feeder is connected to one port of the FMSS fault, the corresponding port works at the V/f control strategy. The battery’s control strategy can switch between constant voltage, constant current charge, and floating charge. The feeder loads (L1, L2, and L3) can realize the load-shedding control strategy.

2.3. Working Modes Analysis During the Grid-Connected Operational State

It can be seen from Figure 1 that the FMSS, transformers, and batteries are the main components of the system. The FMSS can be divided into the flexible interconnection operational state and load transfer operational state according to whether the feeders connected to the ports of the FMSS fail. If all feeders work well, the system operates on a flexible interconnection state, meaning that the FMSS can adjust the output powers of AC grids. If one or two feeders fail, the system operates on the load transfer operational state. The transformer can be divided into two operation statuses: one is the power of the transformer does not reach its maximum active power, and the other is the power of the transformer reaches its maximum power. The battery can be divided into two operation statuses: one is the battery’s SOC reaches its set maximum values, and the other is the battery’s SOC does not reach its set maximum values.
The above operation status of the FMSS, transformers, and battery may all occur in the real operation. And combining them organically can result in the following 19 working modes mentioned in this paper. They reflect all scenarios that may occur during the actual operation. In order to make the study of this paper closer to the real operation, the 19 working modes are discussed as follows.

2.3.1. Working Modes Analysis for the Flexible Interconnection Operational State

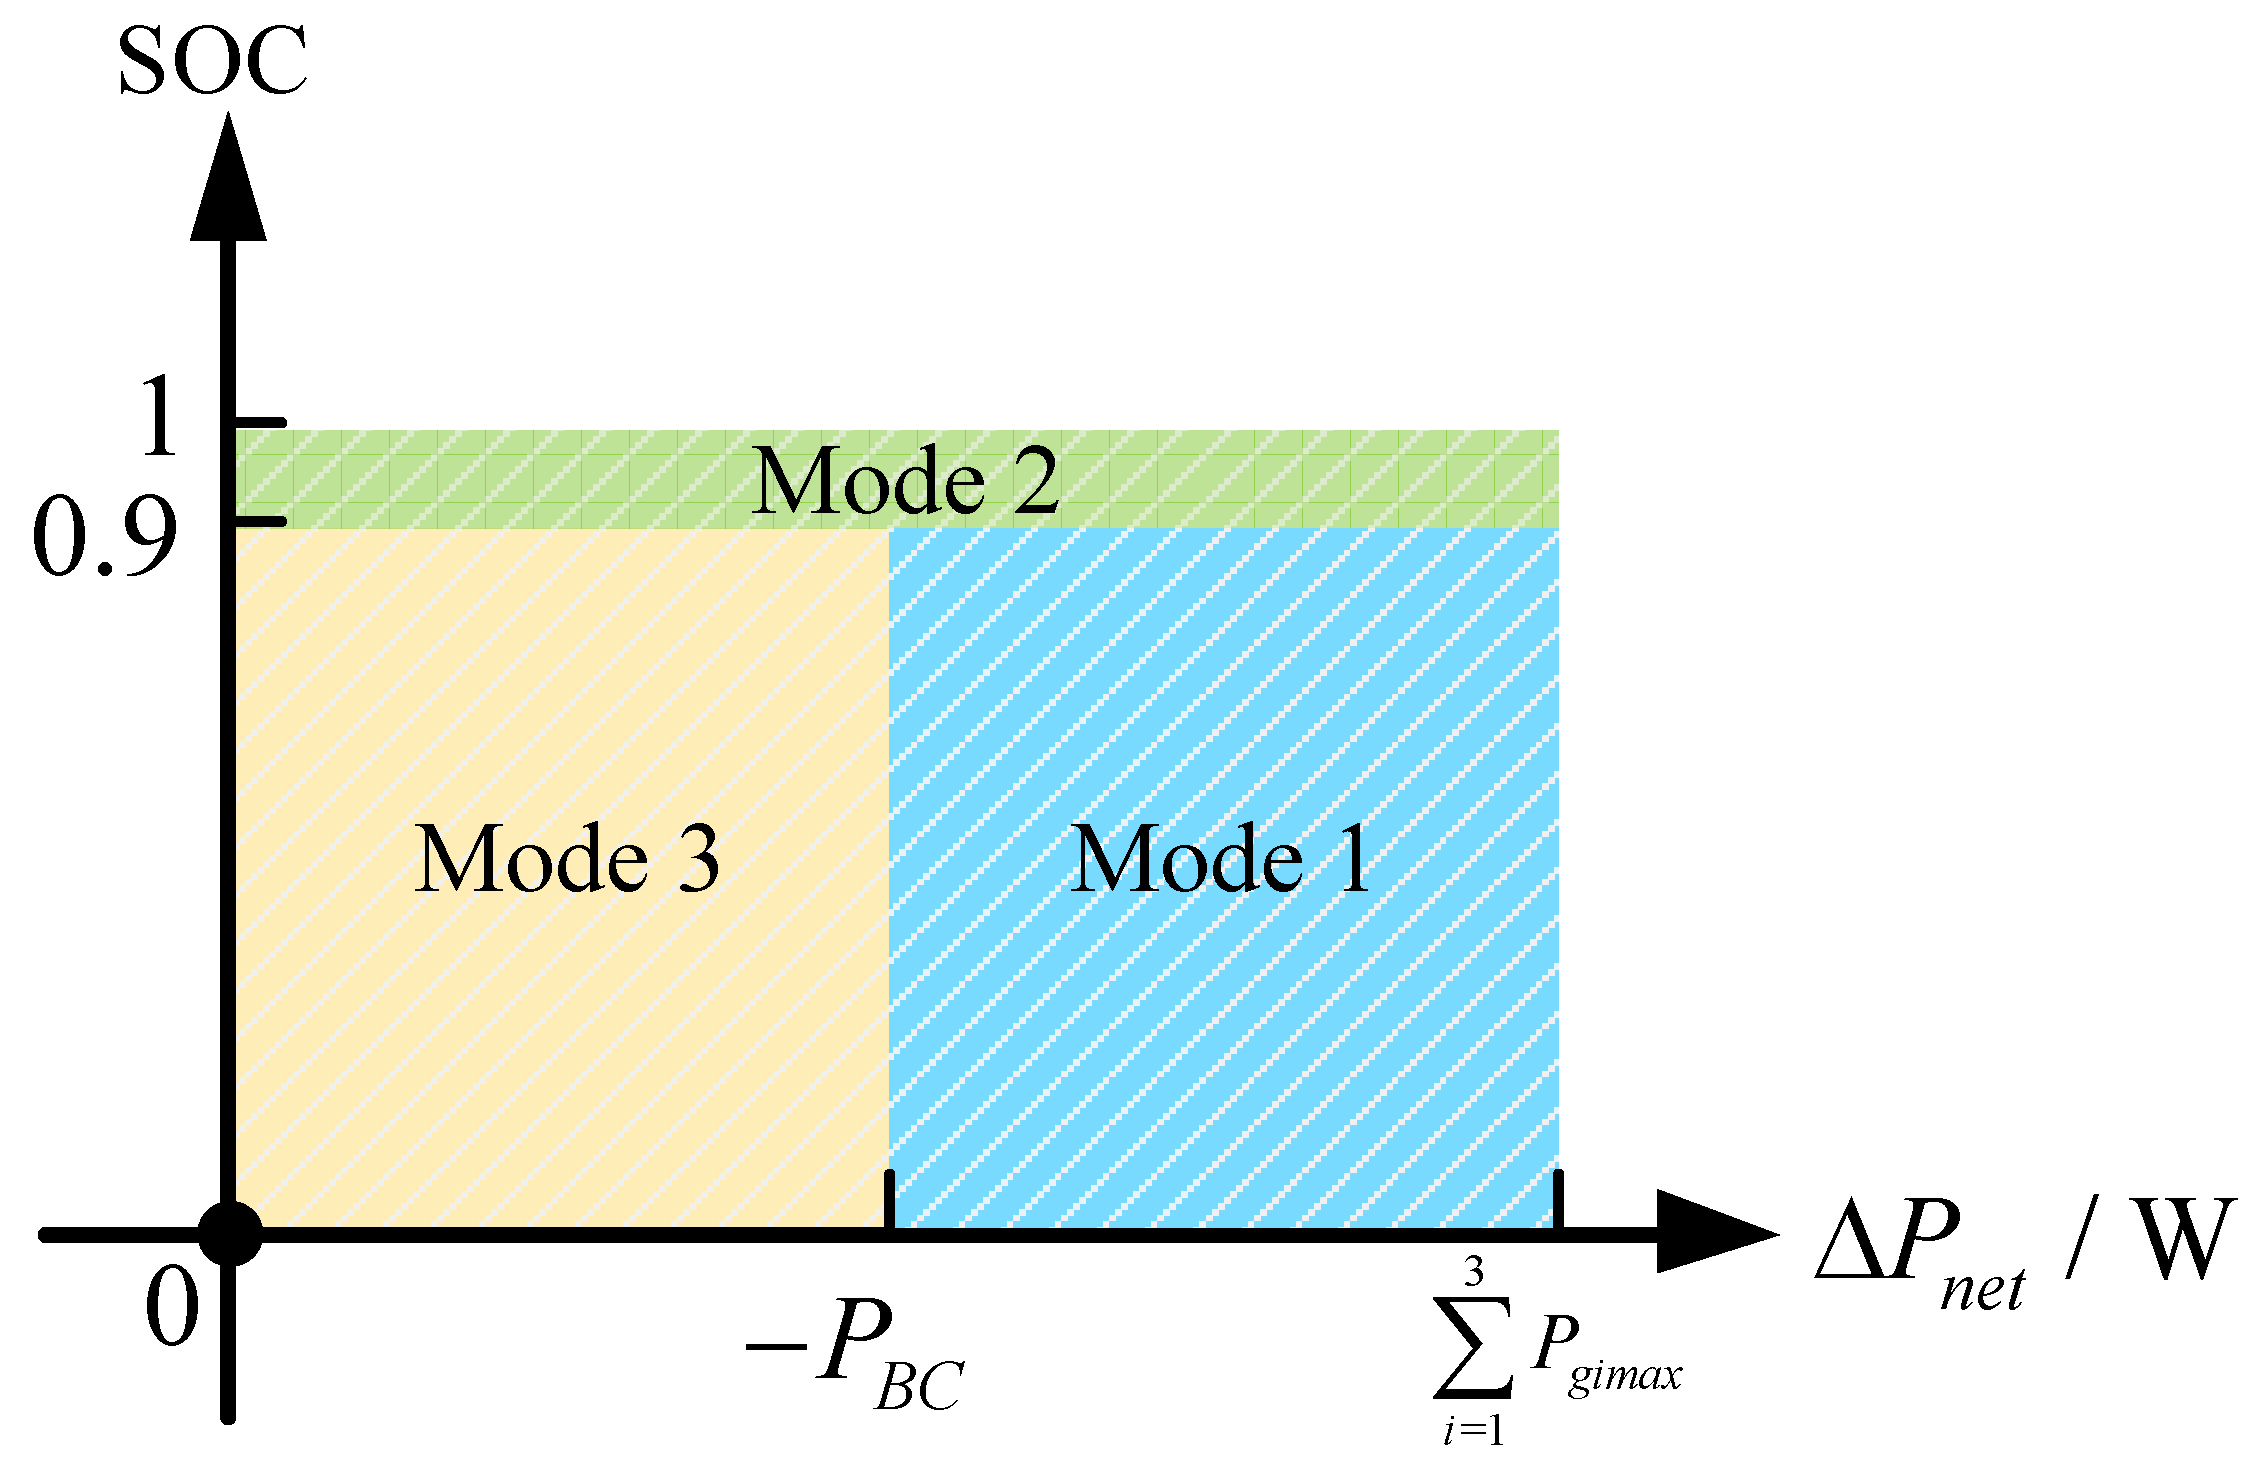
Combining with whether the powers of T1, T2, and T3 reach the maximum values of their respective output active powers, the working modes of the flexible interconnection operational state can be divided into the grid integration-free mode and grid integration-current limiting mode. Based on the above two modes, according to whether the battery’s SOC reaches its maximum value (SOCmax), the working modes for the flexible interconnection operational state can be subdivided into three modes, which are shown in Figure 3 and illustrated in Section 3.

2.3.2. Working Modes Analysis for the Load Transfer Operational State

The working modes for the load transfer operational state are more intricate than those for the flexible interconnection operational state because of the different kinds of positions and the number of fault feeders. According to the positions of the fault feeders, it can be first divided into two faults: one is the feeder connected to the steady-voltage port undergoes failure, and the other is one or two feeders connected to one or two unsteady-voltage ports undergo failure. Then, based on the number of the fault feeders, the former can be subdivided into two types: one is a feeder connected to the steady-voltage port that undergoes failure, and the other one is two feeders that undergo failure with one of them connected to the steady-voltage port and the other connected to the unsteady-voltage port. The latter can also be subdivided into two types: one is the feeder connected to the unsteady-voltage port undergoes failure, and the other is two feeders fail with both connected to the unsteady-voltage ports. Similar to the analysis for the flexible interconnection operation state, according to SOC and the operating states of the transformers, it can be divided into 16 modes, which are shown in Figure 4 and illustrated in Section 4.

2.4. Constraints of the System

2.4.1. Active Power Balance Constraint

During the grid-connected operational state, the system must fulfill the power balance constraint, which can be expressed as Equation (1):
i = 1 3 P g i P L i + P B = 0
where Pgi, Pg2, and Pg3 are the powers of Grid 1, Grid 2, and Grid 3, respectively; PB is the power of the battery; and PLi is the power of Li.

2.4.2. Power and Charge-Discharge Constraints of the Battery

To prolong the battery’s life, it is necessary to restrict the charging and discharging power and the battery’s SOC, which can be expressed as Equation (2):
P B ( t ) P B C . m a x P B ( t ) P B D . m a x S o c m i n S o c ( t ) S o c m a x
where PBC.max and PBD.max are the charging and discharging maximum values of the battery, respectively; SOC(t) is the battery’s SOC at a given time; and SOCmin and SOCmax are the minimum and maximum values of the battery’s SOC, respectively. SOC of the battery is the follows:
S O C = S O C   0 i b a t ( t ) d t C e
where SOC0 is the SOC initial value of the battery, and ibat(t) and Ce represent the output current and capacity of the battery.

2.4.3. Operation Constraints of the Distribution Network

① Constraint of the bus voltage fluctuation range (ΔUdc) can be expressed as Equation (4):
Δ U d c ± 5 %
② Exchange power constraints between each port and the grid connected to the corresponding port can be expressed as Equation (5):
P g k = P L k + P V S C k P g k m a x λ k S T k
where k = 1, 2, 3, PVSCk is the power of VSCk; Pg1max, Pg2max, and Pg3max are the maximum output active powers of Grid 1, Grid 2, and Grid 3, respectively; and λk is the power factor of Tk.
③ Load-shedding constraints can be set as Equation (6):
0 P l o s s k P L k
where k = 1, 2, 3. Plossk is the load-shedding power of PLk.

3. Control Objectives and Strategies During the Flexible Interconnection Operational State

For the working modes shown in Figure 3 under the flexible interconnection operational state, the control objectives based on the load balance and improving the power supply reliability are established in the coordinated control layer according to the working states of transformers and the battery’s states. The control strategies for realizing the corresponding objectives are designed in the equipment layer. The details are explained as follows.

3.1. Grid Integration-Free Mode

Mode 1: If the total power of three loads, expressed as PL, is relatively small, the value and direction of the power fluctuation between the FMSS and AC grids are continuously adjustable. Therefore, the control objectives can be set and implemented as follows:
① To improve the system’s operational reliability, one of the ports in the FMSS is selected as the steady-voltage port, and the battery is used as the backup source. In this section, VSC1 is taken as the steady-voltage port to depict the system’s power transmission relationship (see Figure 3).
② To realize the load balance, Pg2 is the same as Pg3, as shown in Equation (7).
P g 2 = i = 1 3 P L i P B C / 3 , S o c < S o c m a x P g 3 = P g 2
where PBC is the rated charging power of the battery, the battery’s power is positive if the battery releases energy, whereas the battery’s power is negative if the battery absorbs energy.
Control strategies in the equipment layer are described as follows: battery (constant current charge control) + VSC1 (constant voltage control) + VSC2 (PQ control) + VSC3 (PQ control).
Mode 2: When the battery’s SOC reaches SOCmax, the battery’s control strategy turns to the floating charge control, meaning that the system’s reliability has been ensured to the greatest extent. Therefore, the load balance is the only control objective established in the coordination control layer. Based on this objective, Pg2 is the same as Pg3, which is expressed as Equation (8). For the simplification of the analysis, the battery’s floating charge power is set as 0 kW. Figure 3 shows the power transmission for Mode 2.
P g 2 = P L 1 + P L 2 + P L 3 / 3 , S o c S o c m a x P g 3 = P g 2
Control strategies in the equipment layer are expressed as follows: battery (floating charge control) + VSC1 (constant voltage control) + VSC2 (PQ control) + VSC3 (PQ control).

3.2. Grid Integration-Current Limiting Mode

Mode 3: For this mode, it cannot ensure that the battery is charged at the rated power because PL is relatively large. Hence, upgrading the system’s reliability as much as possible is the only objective of the coordination control layer. According to the above objective, T1, T2, and T3 output the maximum active powers, respectively. The battery is charged as the steady-voltage port with the surplus power in the system. The corresponding power transmission diagram is the same as Mode 1 (see Figure 3). The output powers of three AC grids and battery power are shown in Equation (9):
P g 1 = λ 1 S T 1 P g 2 = λ 2 S T 2 P g 3 = λ 3 S T 3 P B C S = i = 1 3 P g i i = 1 3 P L i , S o c S o c   max
where PBCS is the battery’s charging power.
Control strategies in the equipment layer are detailed as follows: battery (constant voltage control) + VSC1 (PQ control) + VSC2 (PQ control) +VSC3 (PQ control).

3.3. Working Modes Set During the Flexible Interconnection Operational State

With the change in the system’s load power and battery’s SOC, the working mode of the system will be converted among Mode 1~3 during the flexible interconnection operational state to achieve different control objectives. To express the working mode during this operational state and the switching relationship among different working modes clearly, this paper takes the system net power difference ΔPnet ( Δ P n e t = i = 1 3 P g i max i = 1 3 P L i ) and the battery’s SOC as the horizontal and vertical coordinates, respectively, to draw the working modes established during the flexible interconnection operational state (see Figure 4).

4. Control Objectives and Control Strategies During the Load Transfer Operational State

For the working modes displayed in Figure 5 under the load transfer operational state, the control objectives based on the load balance, enhancing the power supply reliability, and extending the power supply time for the fault feeder load are established in the control layer according to the positions and number of fault feeders, the operational state of the transformers, and the battery’s SOC. According to the basic requirements of a power system, it is necessary to ensure the safety and reliability of the power system and improve the economy of the system. Therefore, extending the power supply time for the fault feeder load is set as the most important among the three objectives. Based on this, the control strategies for realizing the corresponding objectives are confirmed in the equipment layer. The details are explained as follows.

4.1. The Feeder Connected to the Steady-Voltage Port of FMSS Fails

4.1.1. The Feeder Connected to the Steady-Voltage Port Fails

If the feeder connected to the steady-voltage port fails, it is important to choose another port of the FMSS as the new steady-voltage port to stabilize the DC bus voltage. With the energy inputting from the AC grid that is connected to the fault feeder to the system decreasing to 0, the system’s capacity is reduced. In this section, VSC1 is assumed as the steady-voltage port before the failure of the feeder to illustrate the following working modes.
(1) 
Grid integration-free mode
Mode 4: If PL in this system is relatively small, the power flowing between Grid 2 (Grid 3) and VSC2 (VSC3) can be adjusted continuously. The control objective of the coordination control layer can be expressed as follows:
① To improve the system’s operation reliability, VSC2 is selected as the new steady-voltage port, and the battery is charged at the rated power until its SOC reaches SOCmax.
② To realize the load balance, Pg3 is the same as Pg2, as shown in Table 1.
③ To extend the power supply time for the fault feed load (L1), both VSC2 and VSC3 transfer energy to L1.
The control strategies of the converters in the equipment layer are shown as Mode 4 in Table 1. It is worth noting that the control strategy of VSC1 should be the V-f control strategy to ensure that the working for L1 is normal because the feeder connected to VSC1 undergoes failure.
Mode 5: If the battery’s SOC reaches SOCmax, the system’s reliability has been guaranteed to the greatest extent. Hence, the load balance and extending the power supply time for L1 are incorporated as the objectives of the coordination control layer.
The control strategies of the converters in the equipment layer are shown as Mode 5 in Table 1.
Table 1. Working modes during the feeder connected to the steady-voltage port of FMSS undergoing failure.
Working ModesControl ObjectivesPg1Pg2Pg3PBVSC1VSC2VSC3Battery
Mode 41 + 2 + 30Pg3 i = 1 3 P L i P B C / 2 PBCV/fConstant voltagePQconstant current charging
Mode 52 + 30Pg3 i = 1 3 P L i / 2 PfV/fConstant voltagePQFloating charge
Mode 61 + 30 λ 2 S T 2 λ 3 S T 3 k = 2 3 P g k i = 1 3 P L i V/fPQPQConstant voltage
Mode 730 λ 2 S T 2 λ 3 S T 3 i = 1 3 P L i k = 2 3 P g k V/fPQPQConstant voltage
Mode 81 + 300 i = 1 3 P L i P B C PBCV/fV/fConstant voltageconstant current charging
Mode 9300 i = 1 3 P L i PfV/fV/fConstant voltageFloating charge
Mode 101 + 300 λ 3 S T 3 i = 1 3 P L i P g 3 V/fV/fPQConstant voltage
Mode 11300 λ 3 S T 3 i = 1 3 P L i P g 3 V/fV/fPQConstant voltage
(2) 
Grid integration-current limiting mode
Mode 6: If PL is relatively large but is smaller than the total maximum output powers of T2 and T3, the normal working of loads cannot be assured in the company with the battery charging at the rated power, although T2 and T3 output their respective maximum active powers. The corresponding control objectives of the control layer can be established as follows:
① To improve the system’s operational reliability, T2 and T3 output their respective maximum active powers, which means that their exchange powers with respective AC grids have reached the maximum values. Consequently, the battery is selected as the new steady-voltage port, charging at the system’s surplus power until its SOC reaches SOCmax. The corresponding Pg2, Pg3, and PB are presented in Table 1.
② To extend the power supply time for the fault load, VSC2 and VSC3 supply power to L1.
The control strategies of the converters in the equipment layer are shown as Mode 6 in Table 1. Notably, VSC2 and VSC3 apply PQ control strategies because both T2 and T3 output the maximum power.
Mode 7: If PL is larger than the sum of the maximum output power of T2 and T3, the control objective of the coordination control layer is to extend the power supply time for the fault load. Therefore, the battery discharges its energy as the new steady-voltage port. VSC2, VSC3, and the battery release their energy together to ensure the normal working of L1~L3. The corresponding Pg2, Pg3, and PB are implemented as Mode 7 in Table 1, and the control strategy of the equipment layer is also demonstrated as Mode 7 in Table 1.

4.1.2. Two Feeders Fail, with One of Them Connected to the Steady-Voltage Port

In this case, two fault feeders connected to VSC1 and VSC2, respectively, are used for illustration.
(1)
Grid integration-free mode
Mode 8: If PL is relatively small, the control objectives of the coordination control layer can be expressed as follows:
① To enhance the system’s operational reliability, the battery is charged at a constant current until its SOC reaches the SOCmax.
② To extend the power supply time for the fault feeder loads, VSC3 of the FMSS is selected as the new steady-voltage port to supply energy for L1 and L2. Pg3 is shown as Mode 8 in Table 1.
The control strategies of the converter in the equipment layer are shown as Mode 8 in Table 1.
Mode 9: If the battery is fully charged, the system’s reliability is ensured to the greatest extent. Hence, the control objective of the coordination control layer is to extend the power supply time for the fault feeder loads.
The control strategies of the equipment layer are shown as Mode 9 in Table 1.
(2)
Grid integration-current limiting mode
Mode 10: If PL is relatively large but is smaller than the maximum output power of T3. In this case, it cannot ensure that the loads work well in the company with the battery charges at the rated power, although T3 outputs its maximum active power. The corresponding objectives of the coordination control layer can be established as follows:
① To improve the system’s operational reliability, T3 outputs its maximum active power, which is shown as Mode 10 in Table 1. The battery is selected as the new steady-voltage port that charges at the surplus power.
② To extend the power supply time for the fault loads, VSC3 supplies energy for L1 and L2.
The control strategies of the equipment layer are depicted as Mode 10 in Table 1.
Mode 11: If the total power of three loads is relatively large and is larger than the maximum output power of T3, VSC3 cannot stabilize the DC voltage. In this case, the coordination control layer aims to extend the power supply time for the fault feeder loads (L1 and L2). The battery works as the new steady-voltage port and releases its energy to supply the system’s power shortage.
The control strategies of the converters in the equipment layer and the power of Grid 3 are shown as Mode 11 in Table 1.
In Table 1, the first control objective is to improve the system’s operational reliability; the second is to realize the load balance; and the third is to extend the power supply time for the fault load.

4.2. One or Two Feeders Connected to One or Two Unsteady-Voltage Ports Fail

4.2.1. A Feeder Connected with the Unsteady-Voltage Port Fails

If the feeder connected to the unsteady-voltage port fails, the outputting energy of the AC grid connected to the fault feeder will be decreased to 0. Consequently, the steady-voltage port will be altered according to whether the transformers connected to the normal feeder output their maximum power. To analyze this case clearly, VSC1 is taken as the steady-voltage port, and the feeder connected to VSC3 undergoes failure as an example to illustrate. The details are discussed as follows.
(1)
Grid integration-free mode
Mode 12: If the total power of L1~L3 is relatively small, the steady-voltage port remains unchanged. The control objectives of the coordination control layer can be implemented as follows:
① To boost the system’s operational reliability, the battery charges at the rated power until its SOC reaches SOCmax.
② To realize the load balance, Pg2 is set as Mode 12 in Table 2.
③ To extend the power supply time for the fault load, VSC1 and VSC2 supply energy for L3.
Table 2. Working modes under one or two feeders connected to one or two unsteady-voltage ports undergo failure.
Working ModesControl
Objectives
Pg1Pg2Pg3PBVSC1VSC2VSC3Battery
Mode 121 + 2 + 3Pg2 i = 1 3 P L i P B C / 2 0PBCConstant voltagePQV/fconstant current charging
Mode 132 + 3Pg2 i = 1 3 P L i / 2 0PfConstant voltagePQV/fFloating charge
Mode 141 + 3 λ 1 S T 1 λ 2 S T 2 0 k = 1 2 P g k i = 1 3 P L i PQPQV/fConstant voltage
Mode 153 λ 1 S T 1 λ 2 S T 2 0 i = 1 3 P L i k = 1 2 P g k PQPQV/fConstant voltage
Mode 161 + 3 i = 1 3 P L i P B C 00PBCConstant voltageV/fV/fconstant current charging
Mode 173 i = 1 3 P L i 00PfConstant voltageV/fV/fFloating charge
Mode 181 + 3 λ 1 S T 1 00 P g 1 i = 1 3 P L i PQV/fV/fConstant voltage
Mode 193 λ 1 S T 1 00 i = 1 3 P L i P g 1 PQV/fV/fConstant voltage
The control strategies of the equipment layer are shown as Mode 12 in Table 2.
Mode 13: If the battery’s SOC reaches SOCmax, the system’s reliability is ensured to the maximum extent. The coordination control layer aims to achieve the load balance and extend the power supply time for the fault load. The output power of Grid 3 is set as Mode 13 in Table 2. The corresponding control strategy of the equipment layer is shown as Mode 13 in Table 2.
(2)
Grid integration-current limiting mode
Mode 14: If PL is relatively large but is smaller than the sum of the maximum output powers of T1 and T2, it cannot be ensured that the loads work well and the battery is charged at the rated current, although T1 and T2 output their respective maximum active powers. Hence, the objective of the coordination control layer can be devised as follows:
① To enhance the system’s operational reliability, T1 and T2 output their maximum active powers, respectively. In this case, the powers of Grids 1 and 2 flowing to the FMSS cannot be adjustable. Hence, the battery is set as the DC steady-voltage port and charged at the system’s surplus power.
② To extend the power supply time for L3, VSC1 and VSC2 transfer energy to L3.
The corresponding control strategies of the equipment layer are shown as Mode 14 in Table 2.
Mode 15: In this mode, PL3 is larger than the sum of the maximum output powers of T1 and T2. The objective of the coordination control layer is to extend the power supply time for L3. The battery is altered as the steady-voltage port and discharges to maintain the DC bus voltage stability.
The control strategies of the equipment layer are shown as Mode 15 in Table 2.

4.2.2. Two Feeders Fail, with Both Connected to the Unsteady-Voltage Ports

In this case, take VSC1 as the steady-voltage port and the feeders connected with VSC2 and VSC3 undergoing failure as an example. The details are discussed as follows.
(1)
Grid integration-free mode
Mode 16: If PL is relatively small, VSC1 can supply power for all loads. Hence, the objectives of the coordination control layer are set as follows:
① To improve the system’s operational reliability, the battery charges at the constant current, and VSC1 keeps the steady-voltage port unchanged.
② To extend the power supply time for L1 and L2, VSC1 transfers energy to them.
The control strategies of the equipment layer are shown as Mode 16 in Table 2.
Mode 17: If the battery’s SOC reaches SOCmax, the system’s reliability can be ensured to the greatest extent. Hence, the objective of the coordination control layer is to extend the power supply time for L1 and L2.
The control strategies of the converters in the equipment layer are shown as Mode 17 in Table 2.
(2)
Grid integration-current limiting mode
Mode 18: If PL is relatively large but is smaller than the maximum output power of T1. It cannot ensure that the battery charges at the rated power in the company and that all of the loads are working well. Hence, the control objectives of the coordination control layer are described as follows:
① To enhance the system’s operational reliability, T1 outputs the maximum power and the battery charges at the system’s surplus power. Because the output powers of Grid 1 cannot be adjusted, the battery maintains the DC voltage stability.
② To extend the power supply time for L2 and L3, VSC1 transfer energy to them.
The control strategies of the converters in the equipment layer are shown as Mode 18 in Table 2.
Mode 19: If PL is larger than the maximum output power of T1. Then, the objective of the coordination control layer is to extend the power supply time for the fault feeder loads. Hence, the battery discharges to supply the system’s power shortage.
The control strategies of the converters in the equipment layer are shown as Mode 19 in Table 2.
In Table 2, the control objectives are the same as those in Table 1.

4.3. Working Modes Set During the Load Transfer Operation State

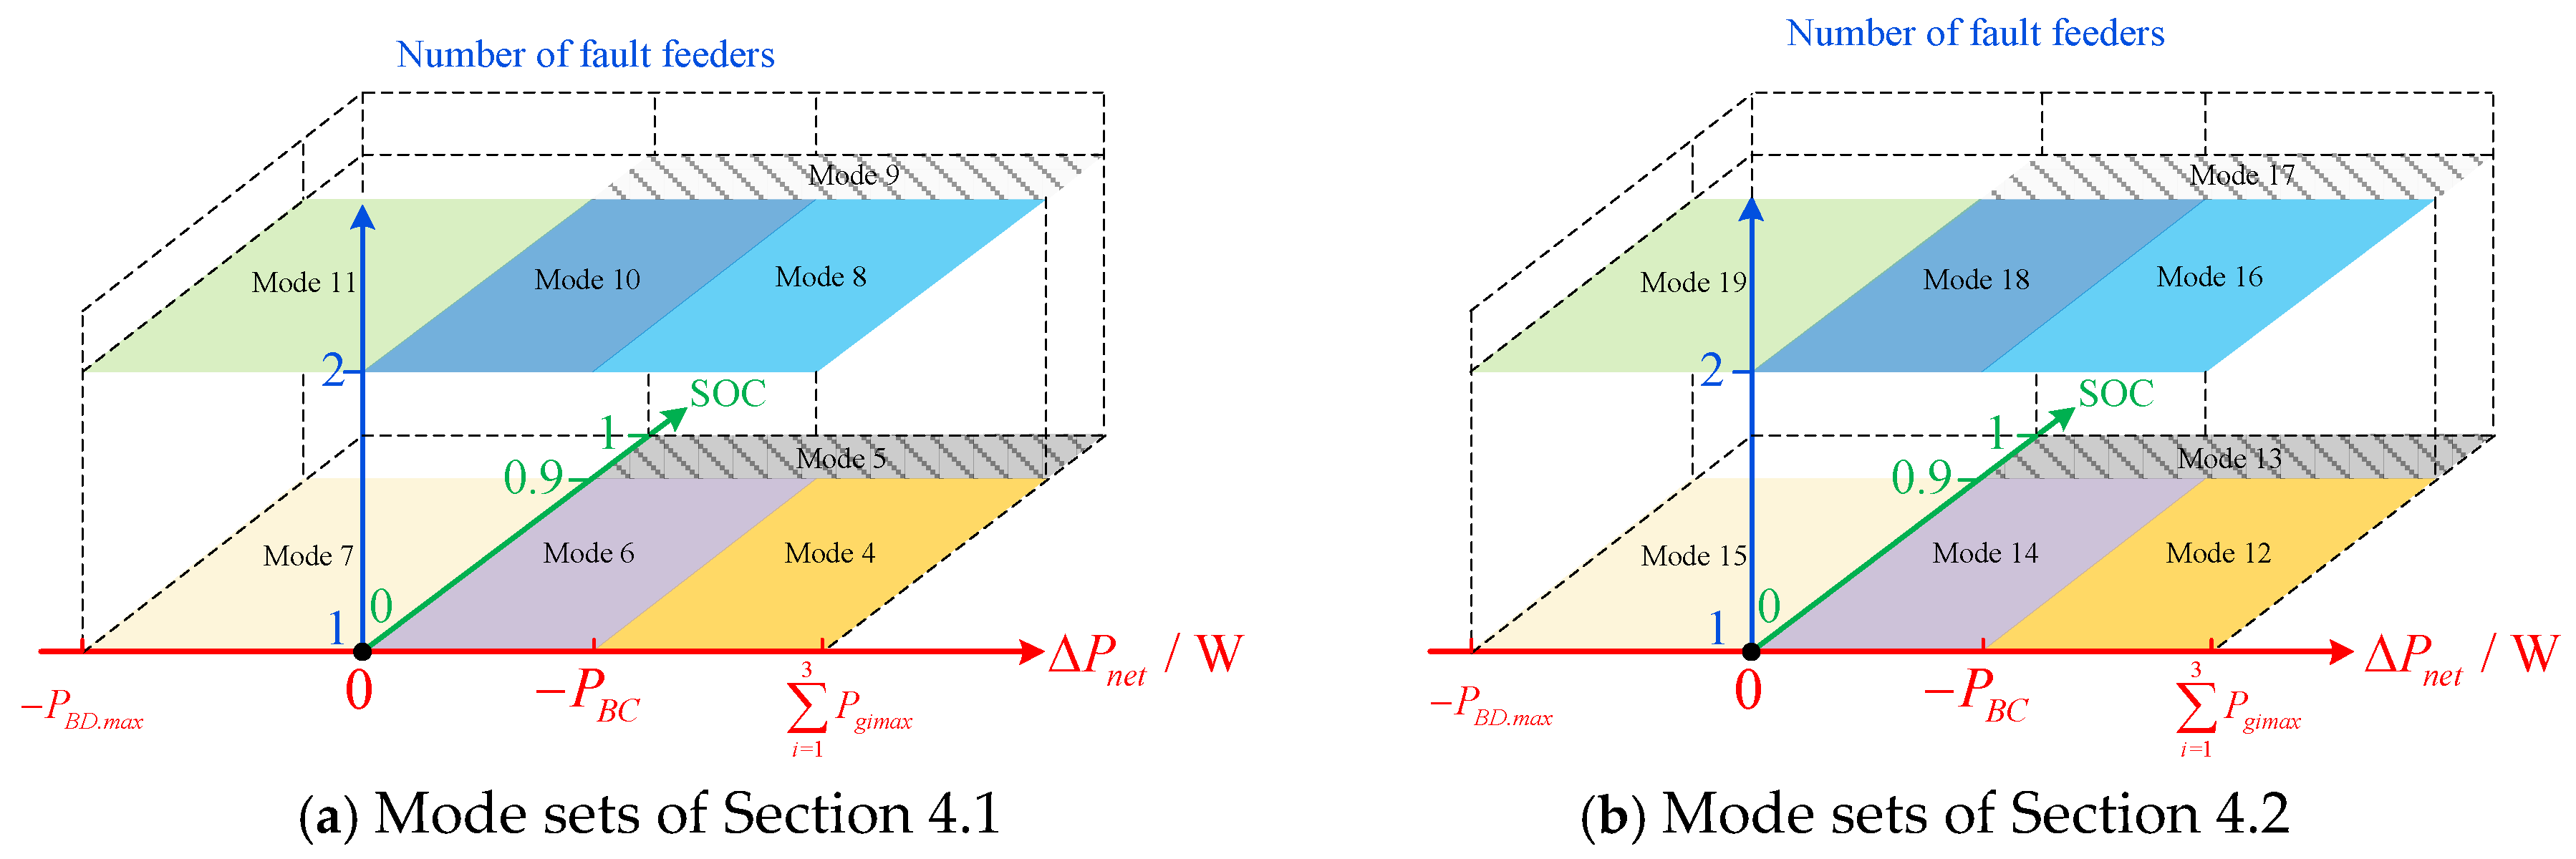
During the load transfer operational state, with the load power, the number of fault feeders, and battery’s SOC changing, the working mode will convert from one mode to another for choosing the appropriate control objectives. This paper takes the ΔPnet as the x-axis, the battery’s SOC as the y-axis, and the number of feeder faults as the z-axis to express the working modes of the load transfer operational state and the switching relationship among different working modes clearly. Based on the above, the working modes in Section 4.1 and Section 4.2 are displayed in Figure 6a,b, respectively.

5. Switching Strategy During Feeder Off-Grid

5.1. Classification of Switching Processes from Grid-Connected Operation to Off-Grid Operation

It can be seen from the above that there are three control strategies for the FMSS. If Udc/Q control and PQ control switch each other at the same port, it means that all of the feeders work well. If Udc/Q control or PQ control switches to V/f control, it means that one or more feeder faults occur, and the fault feeds switch from grid-connected to off-grid. According to the different causes of the feeder off-grid, it can be divided into two types: the planned feeder off-grid and the unplanned feeder off-grid. If the sudden feeder power loss causes the feeder off-grid, it belongs to the unplanned or unpredictable off-grid and is called the unplanned feeder off-grid. If the feeder off-grid is caused by some special reasons in a specific period, such as outage maintenance, it belongs to the planned or predictable off-grid and is called the planned feeder off-grid.
Whether the planned or unplanned feeder is off-grid, it may lead to the DC bus voltage fluctuations caused by the following aspects. One is the control strategies switching and power variations on the battery and other ports of the FMSS because the AC grid power connected to the fault feeder will suddenly decrease to 0. The other is the asynchronous problem on the phase angle between the fault feeder load and other normal feeder loads because the method for obtaining the phase angle of the fault feeder alters from the phase-locked loop during grid connection to the V/f control strategy during the feeder off-grid.
To reduce the variations in the DC bus voltage during the feeder off-grid processing, a planned off-grid switching sequence is designed for the planned feeder off-grid, and a power feed-forward control strategy for the battery is presented for the unplanned feeder off-grid in this paper. Furthermore, to yield rapid phase synchronization between the phase angles of the fault feeder load and the normal feeder loads during feeder off-grid processing, the off-grid phase-locking control strategy is introduced into the traditional V/f control strategy.

5.2. Switching Strategy for the Planned Feeder Off-Grid

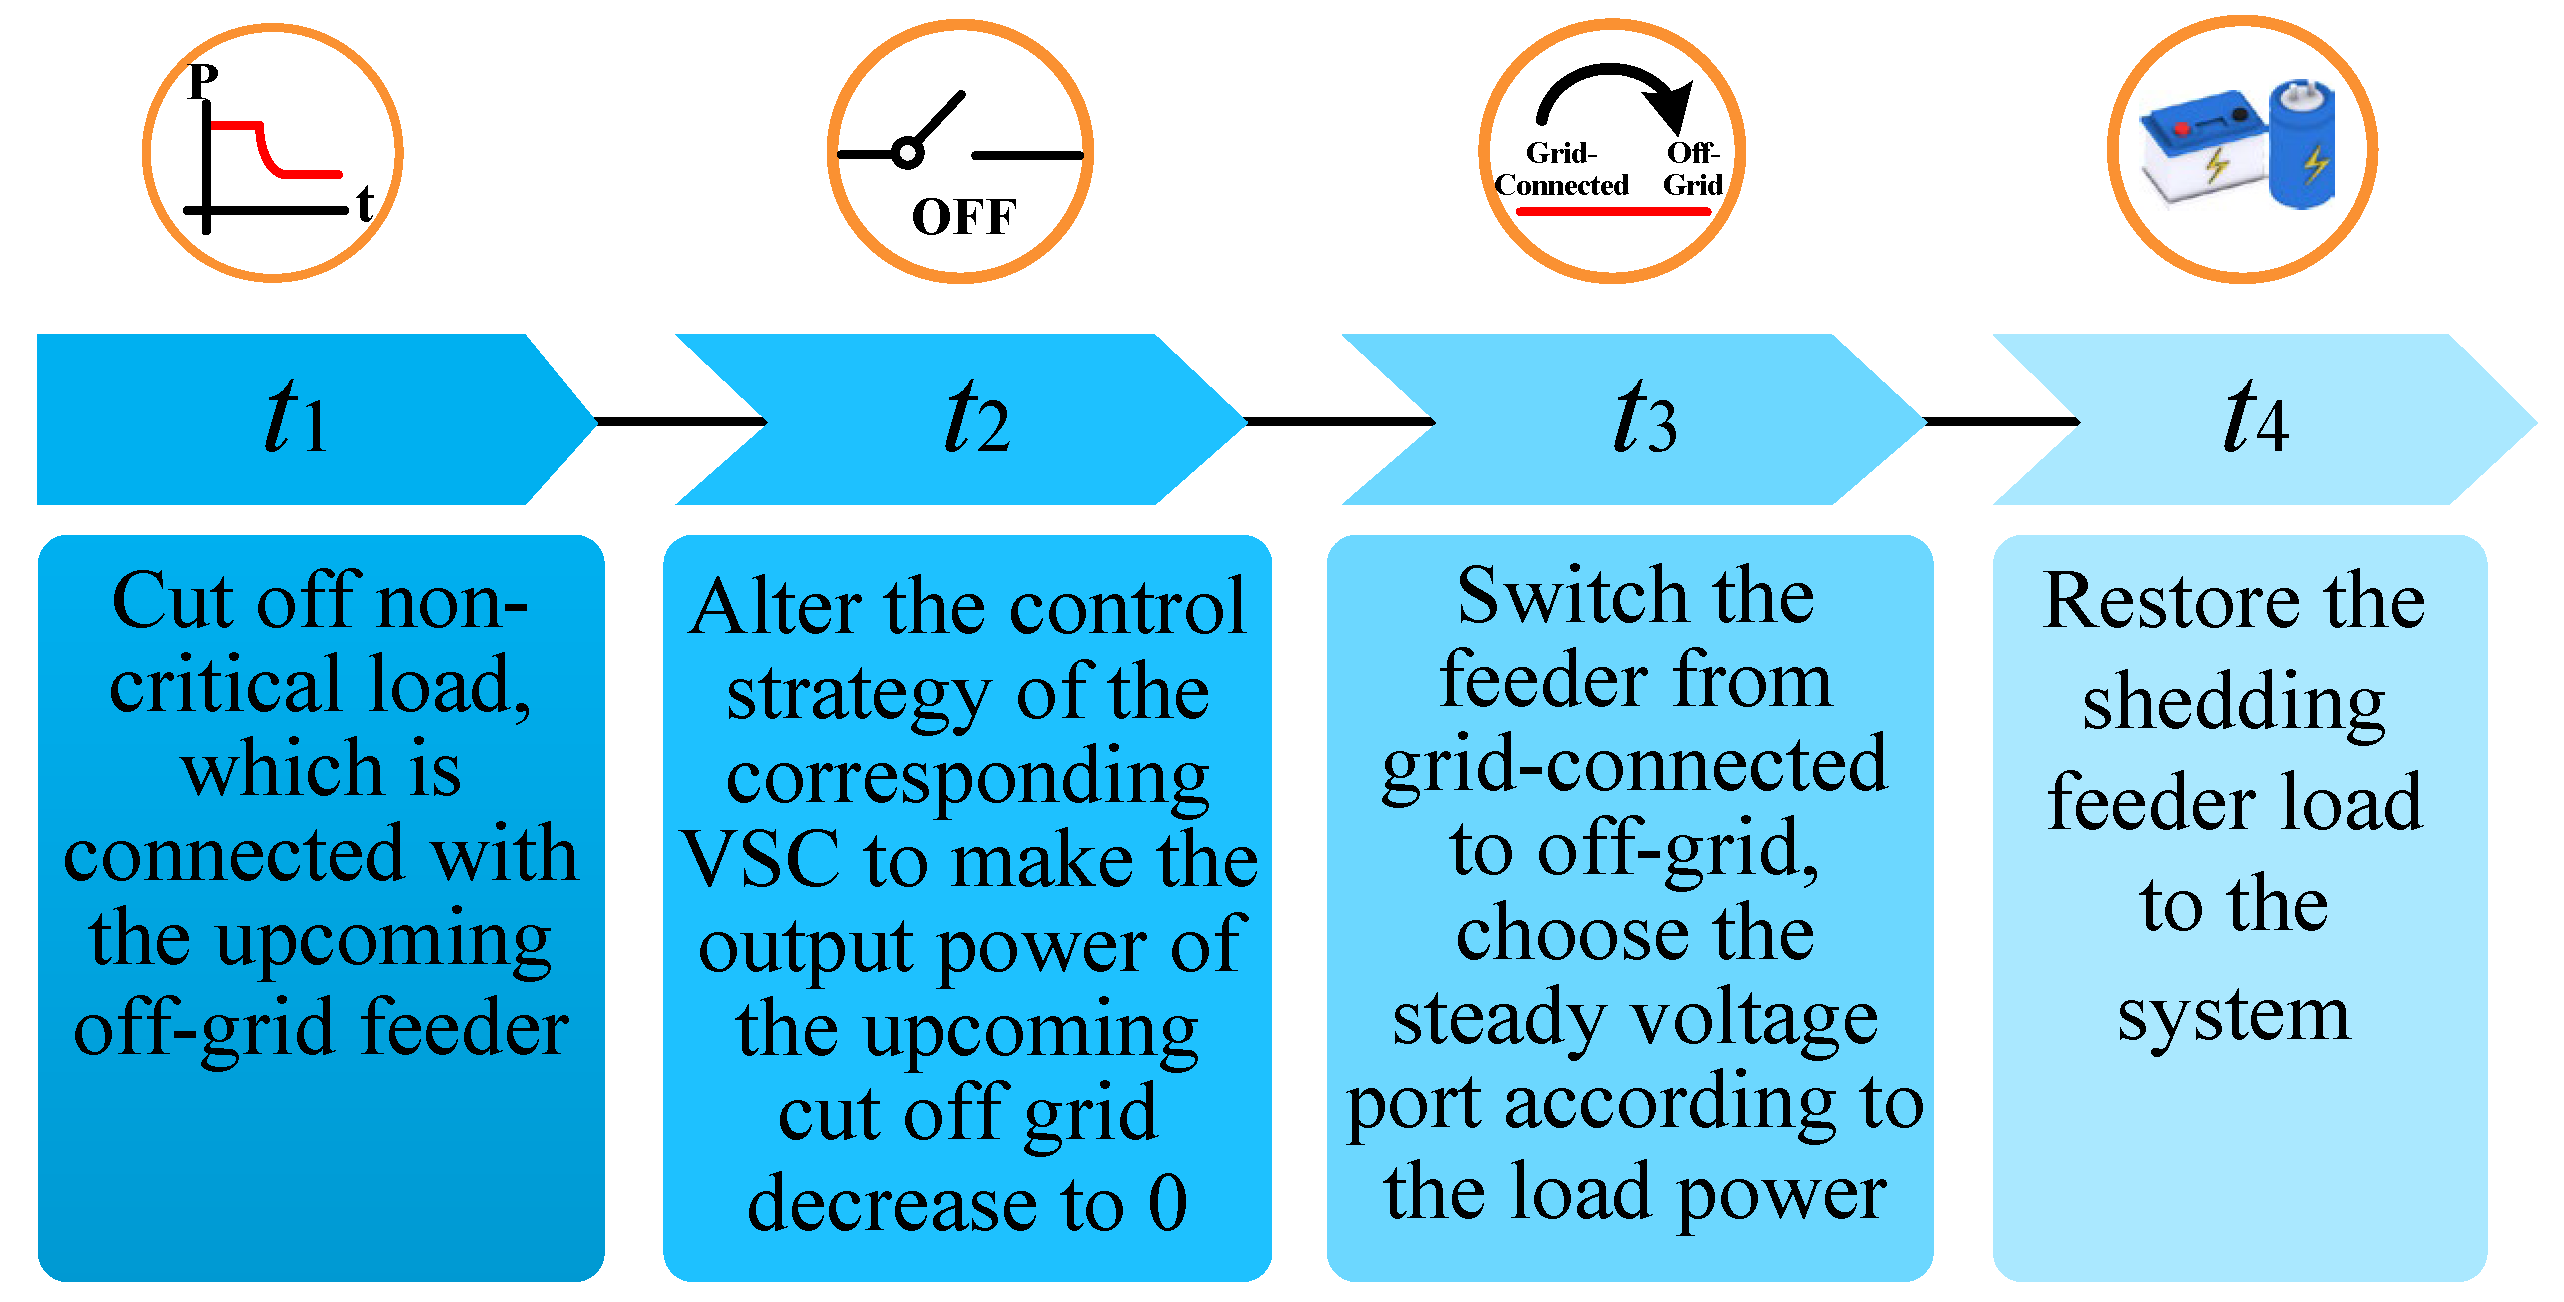
To decrease the bus voltage fluctuation during the planned feeder off-grid process, it is necessary to lower the exchange power between the AC grid, which will occur the feeder off-grid soon, and the system. It can be seen from the above discussions that the output power of an AC grid depends on the power of the load connected to the same port as the AC grid and the power of loads connected to other ports because the FMSS can realize load balance. Therefore, the non-critical load, which will occur feeder off-grid soon, is shed in advance from the AC grid before the occurrence of the planned feeder off-grid. The corresponding VSC’s control strategy is altered to decrease the output power of the corresponding AC grid to 0. Finally, the feeder off-grid operation is performed. The corresponding process is shown in Figure 7.

5.3. Switching Strategy for the Unplanned Off-Grid

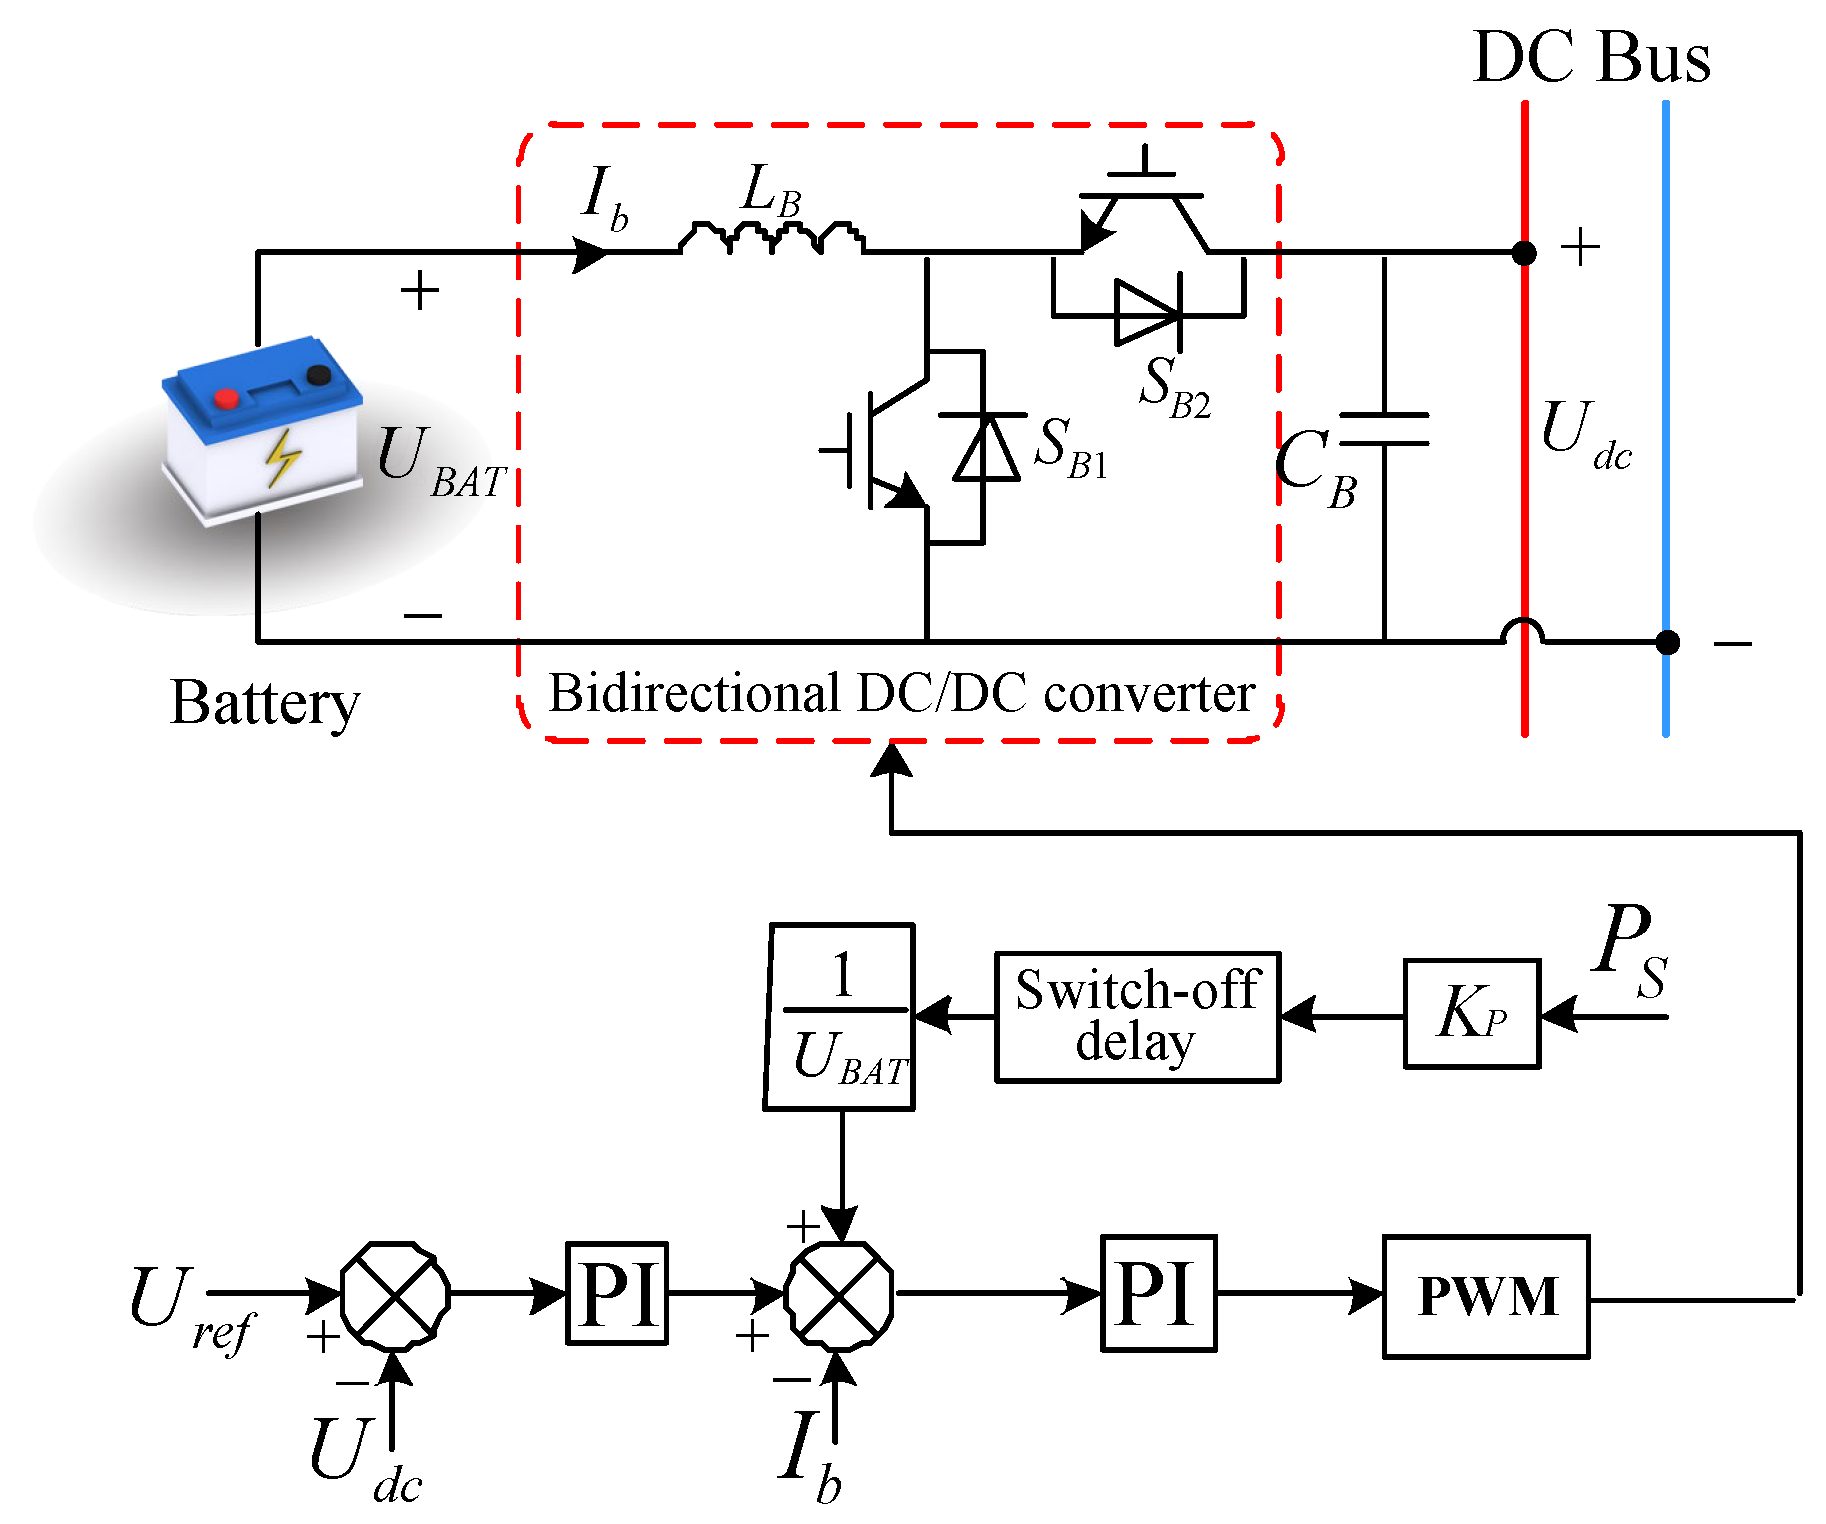
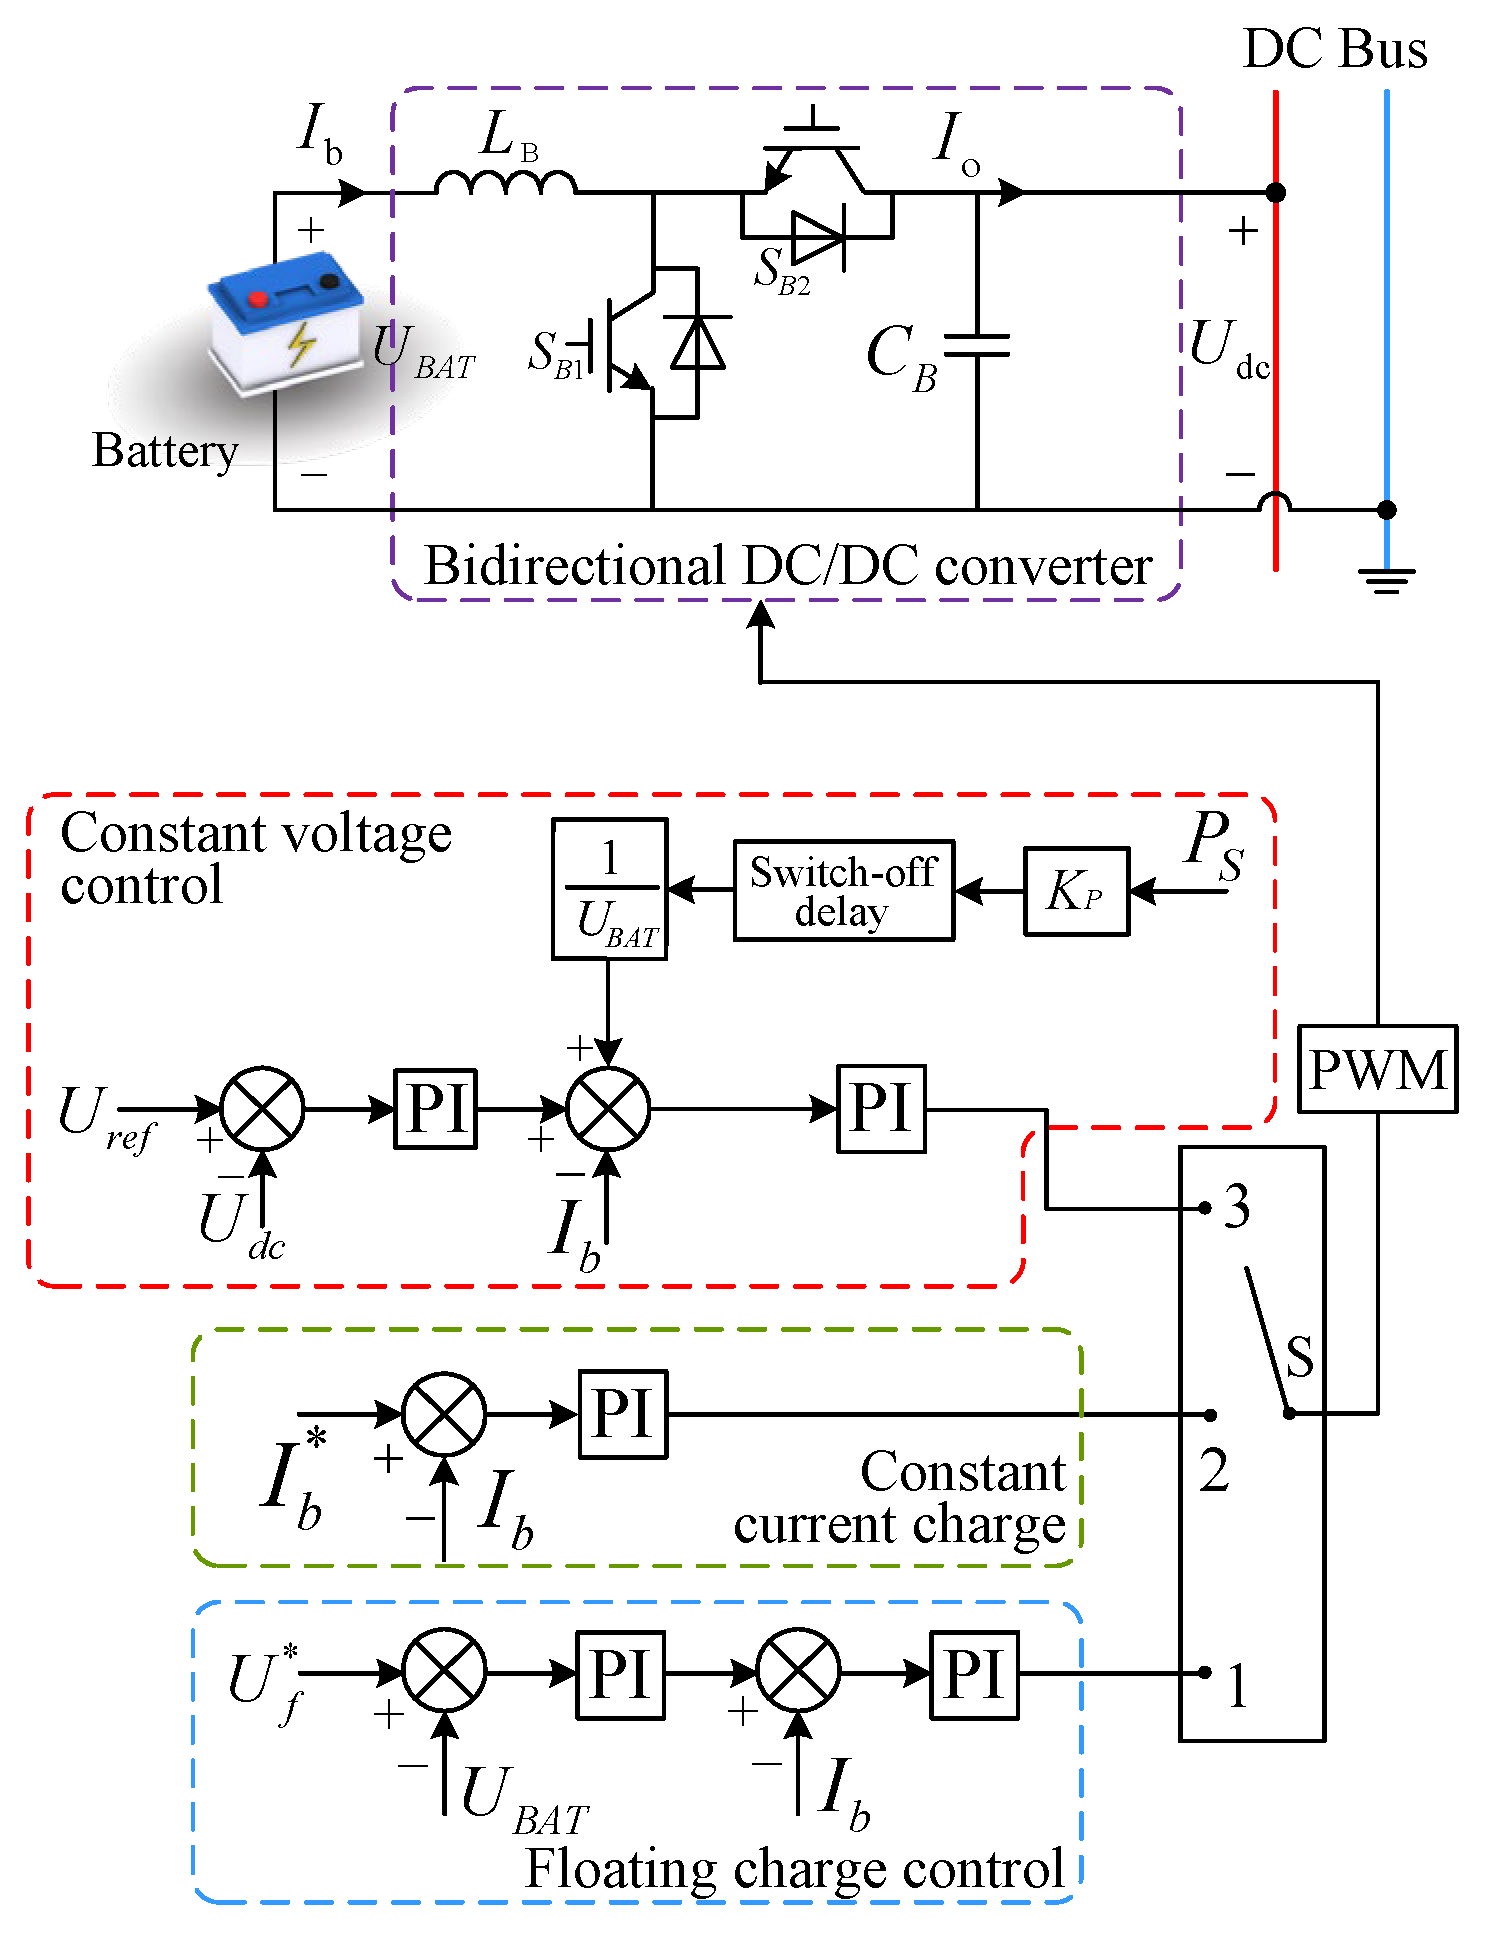
It can be seen from the above discussion that the unplanned off-grid is an emergency. In this case, although the powers of the VSCs for the FMSS and the load power remain unchanged, the DC bus voltage fluctuations may be large because of the change in the operating mode and the control strategy switching for each converter during the unplanned switching process. To decrease the bus voltage fluctuations during the unplanned off-grid process, the power feed-forward control strategy is introduced in the current inner loop based on the traditional control strategy of the battery to increase the battery’s output power quickly and compensate for the unbalanced power in the system. The corresponding process is illustrated in Figure 8.
In Figure 8, Ib is the battery inductor current, LB is the battery’s indicator; SB1 and SB2 are the switches of the bidirectional DC/DC converter; CB is the battery capacitor connected with the DC bus; Udcref is the reference value of the DC bus voltage; Udc is the measurement value of the DC bus voltage; Kp is the power feed-forward ratio of the battery, and PS is the introduced feed-forward power. PS can be expressed as follows:
P s = P g 1 s 1 + P g 1 s 2 + P g 3 s 3
where s1 is the off-grid detection switch. The value of s1 is 0 if the system is a grid-connected operation, whereas the value of s1 is 1 if the system is an off-grid operation. The definition of s2 or s3 is similar to that of s1.
The battery will quickly output the feed-forward power when the unplanned feeder off-grid occurs. With the injection of the feed-forward current at the moment of the off-grid switching, the battery’s output current is increased, which decreases the fluctuations of bus voltage. After the bus voltage is restored to the set value, the delay shutdown control strategy of the battery will function. As a result, the feed-forward current value input to the control system is reduced to 0 to avoid its impact on the constant voltage control of the battery in the future.

5.4. Off-Grid Phase-Locked Control Strategy

If the feeder connected to the AC grid fails, the fault feeder load can still work well because of the characteristics of the flexible interconnection on three AC grids using the FMSS. However, the phase angle of the fault feeder (θm) should be obtained by the V/f control strategy. It differs from the phase angle (θg) of the AC grid, which is the normal feeder’s phase angle. The above results demonstrate that θm must be equal to θg, which means Δθ = θgθm=0. To achieve this objective, the sine function form of Δθ is applied in this paper to eliminate the periodic variation of the phase difference symbol based on the traditional off-grid phase-locking control strategy. It means that sin (Δθ) is a substitute for Δθ as the input signal of the off-grid phase locking to shorten the phase angle synchronization process. It can be obtained from the trigonometric function shown in Equation (11):
sin Δ θ = sin ( θ g θ m ) = sin θ g cos θ m cos θ g sin θ m = s g c m c g s m
The difference between the angular frequency of the power grid and the angular frequency provided by the V/f control strategy can be obtained by Equation (12):
Δ ω s y n = ( k p θ + k i θ s ) ( s g c m c g s m )
where k and k are the proportional and integral coefficients of the off-grid phase-locked control, respectively.
Based on the above discussion, the off-grid phase-locked control strategy is shown in Figure 9.
Figure 9 shows that the initial angular frequency (ωvf), which can be obtained by V/f control, is introduced into the off-grid phase-locked control strategy to accelerate the tracking speed. The detailed calculation process for ωvf is shown in Section 6.1.2. The value of ωm1, which is the sum of Δωsyn and ωvf, is the outputting angle frequency of the off-grid phase-locked control strategy. Based on ωm1, the output angle (θm1) can be calculated.

6. Control Strategies of the Convectors in the Equipment Layer

6.1. Control Strategies of the FMSS

6.1.1. Udc/Q and PQ Control Strategies of FMSS

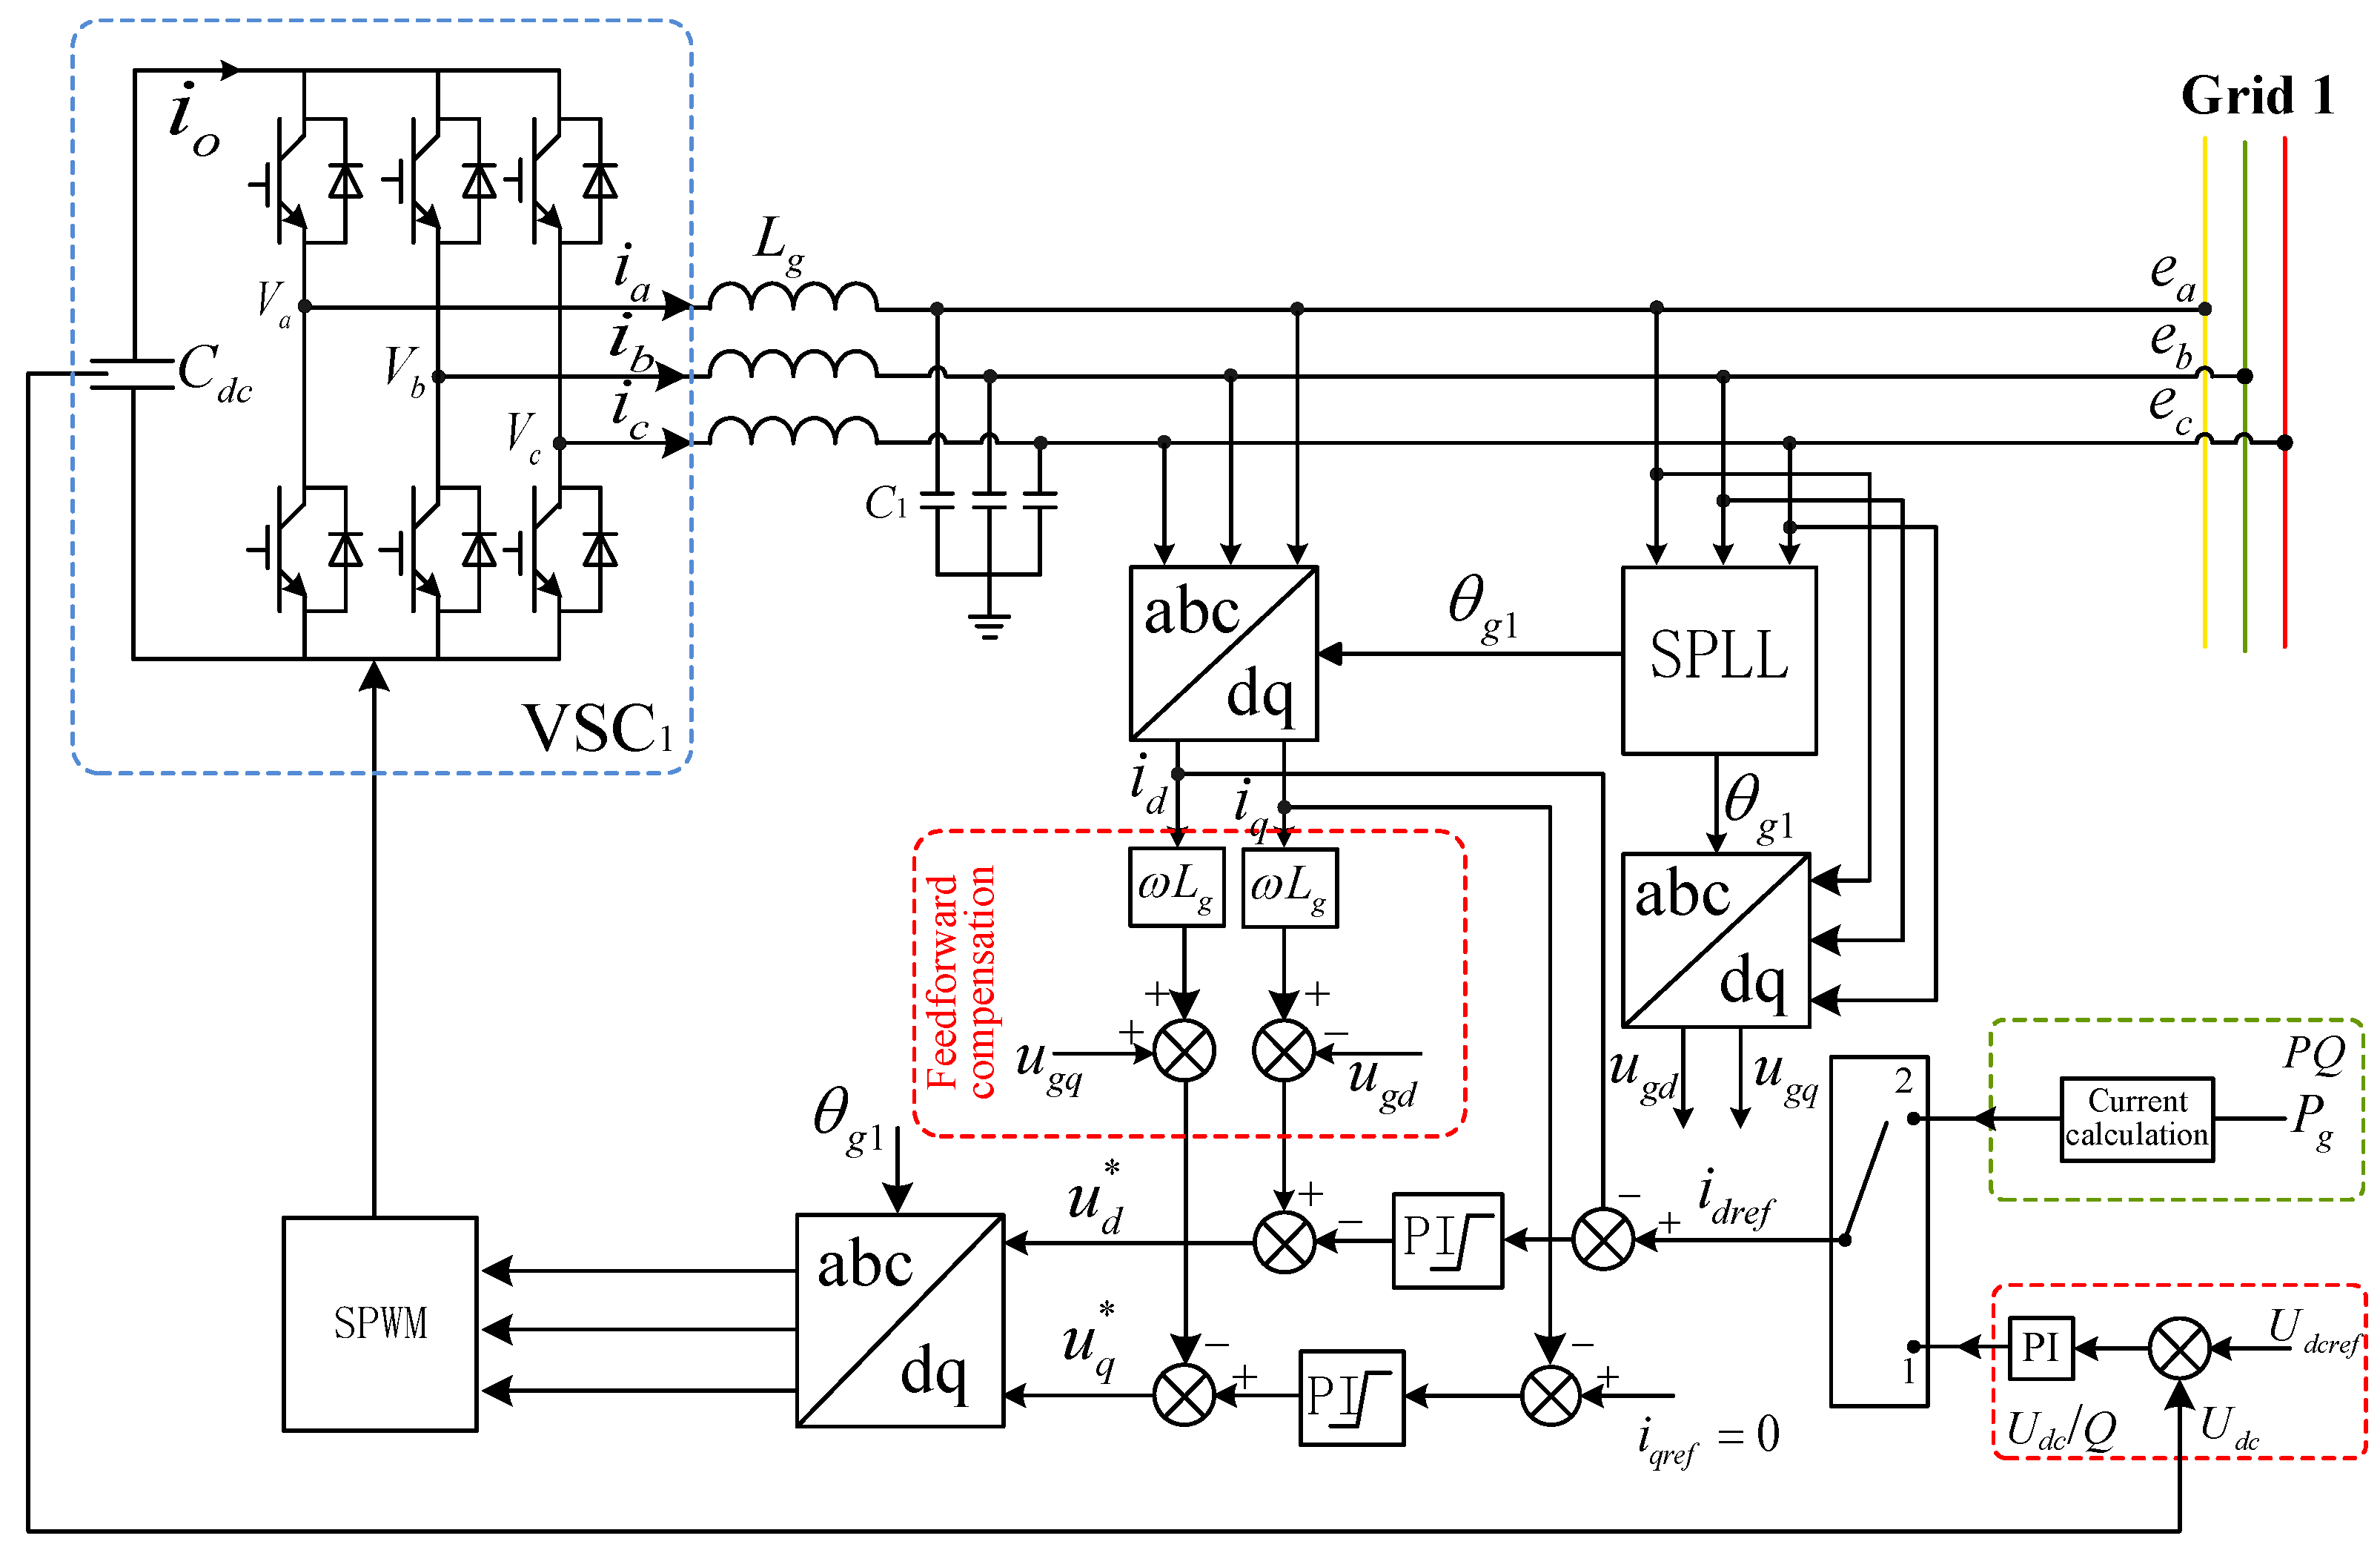
Udc/Q control primarily stabilizes the DC bus voltage using the grid voltage orientation vector control. PQ control outputs the set power by the dual loops and decoupling control to realize the load balance and the maximum power output for the AC grid. The common current inner loop structure is applied to the two control strategies to lower the bus voltage fluctuations caused by the switching between Udc/Q and PQ control strategies. The control strategies of VSC1 in the FMSS are adopted as an example because the Udc/Q and PQ control strategies of VSC1 are similar to those of VSC2 or VSC3. The corresponding Udc/Q and PQ control strategies are shown in Figure 10.
In Figure 10, Idc is the input current of VSC1; va, vb, and vc are the three-phase phase voltages of Grid 1; ia, ib, and ic are the three-phase currents of Grid 1; u d and u q are the voltage reference values on d-axis and q-axis, respectively; idref and iqref are the current reference values on d-axis and q-axis, respectively; ugd and ugq are the output voltages on d-axis and q-axis after the dq transformation; id and iq are the output currents on the d-axis and q-axis after the dq transformation; SPLL is a phase-locked loop; θg1 is the angle of Grid 1 obtained by SPLL; and Lg and C1 are the filter inductor and capacitor of VSC1, respectively.

6.1.2. The Improved V/f Control Strategy with the Off-Grid Phase-Locked Function

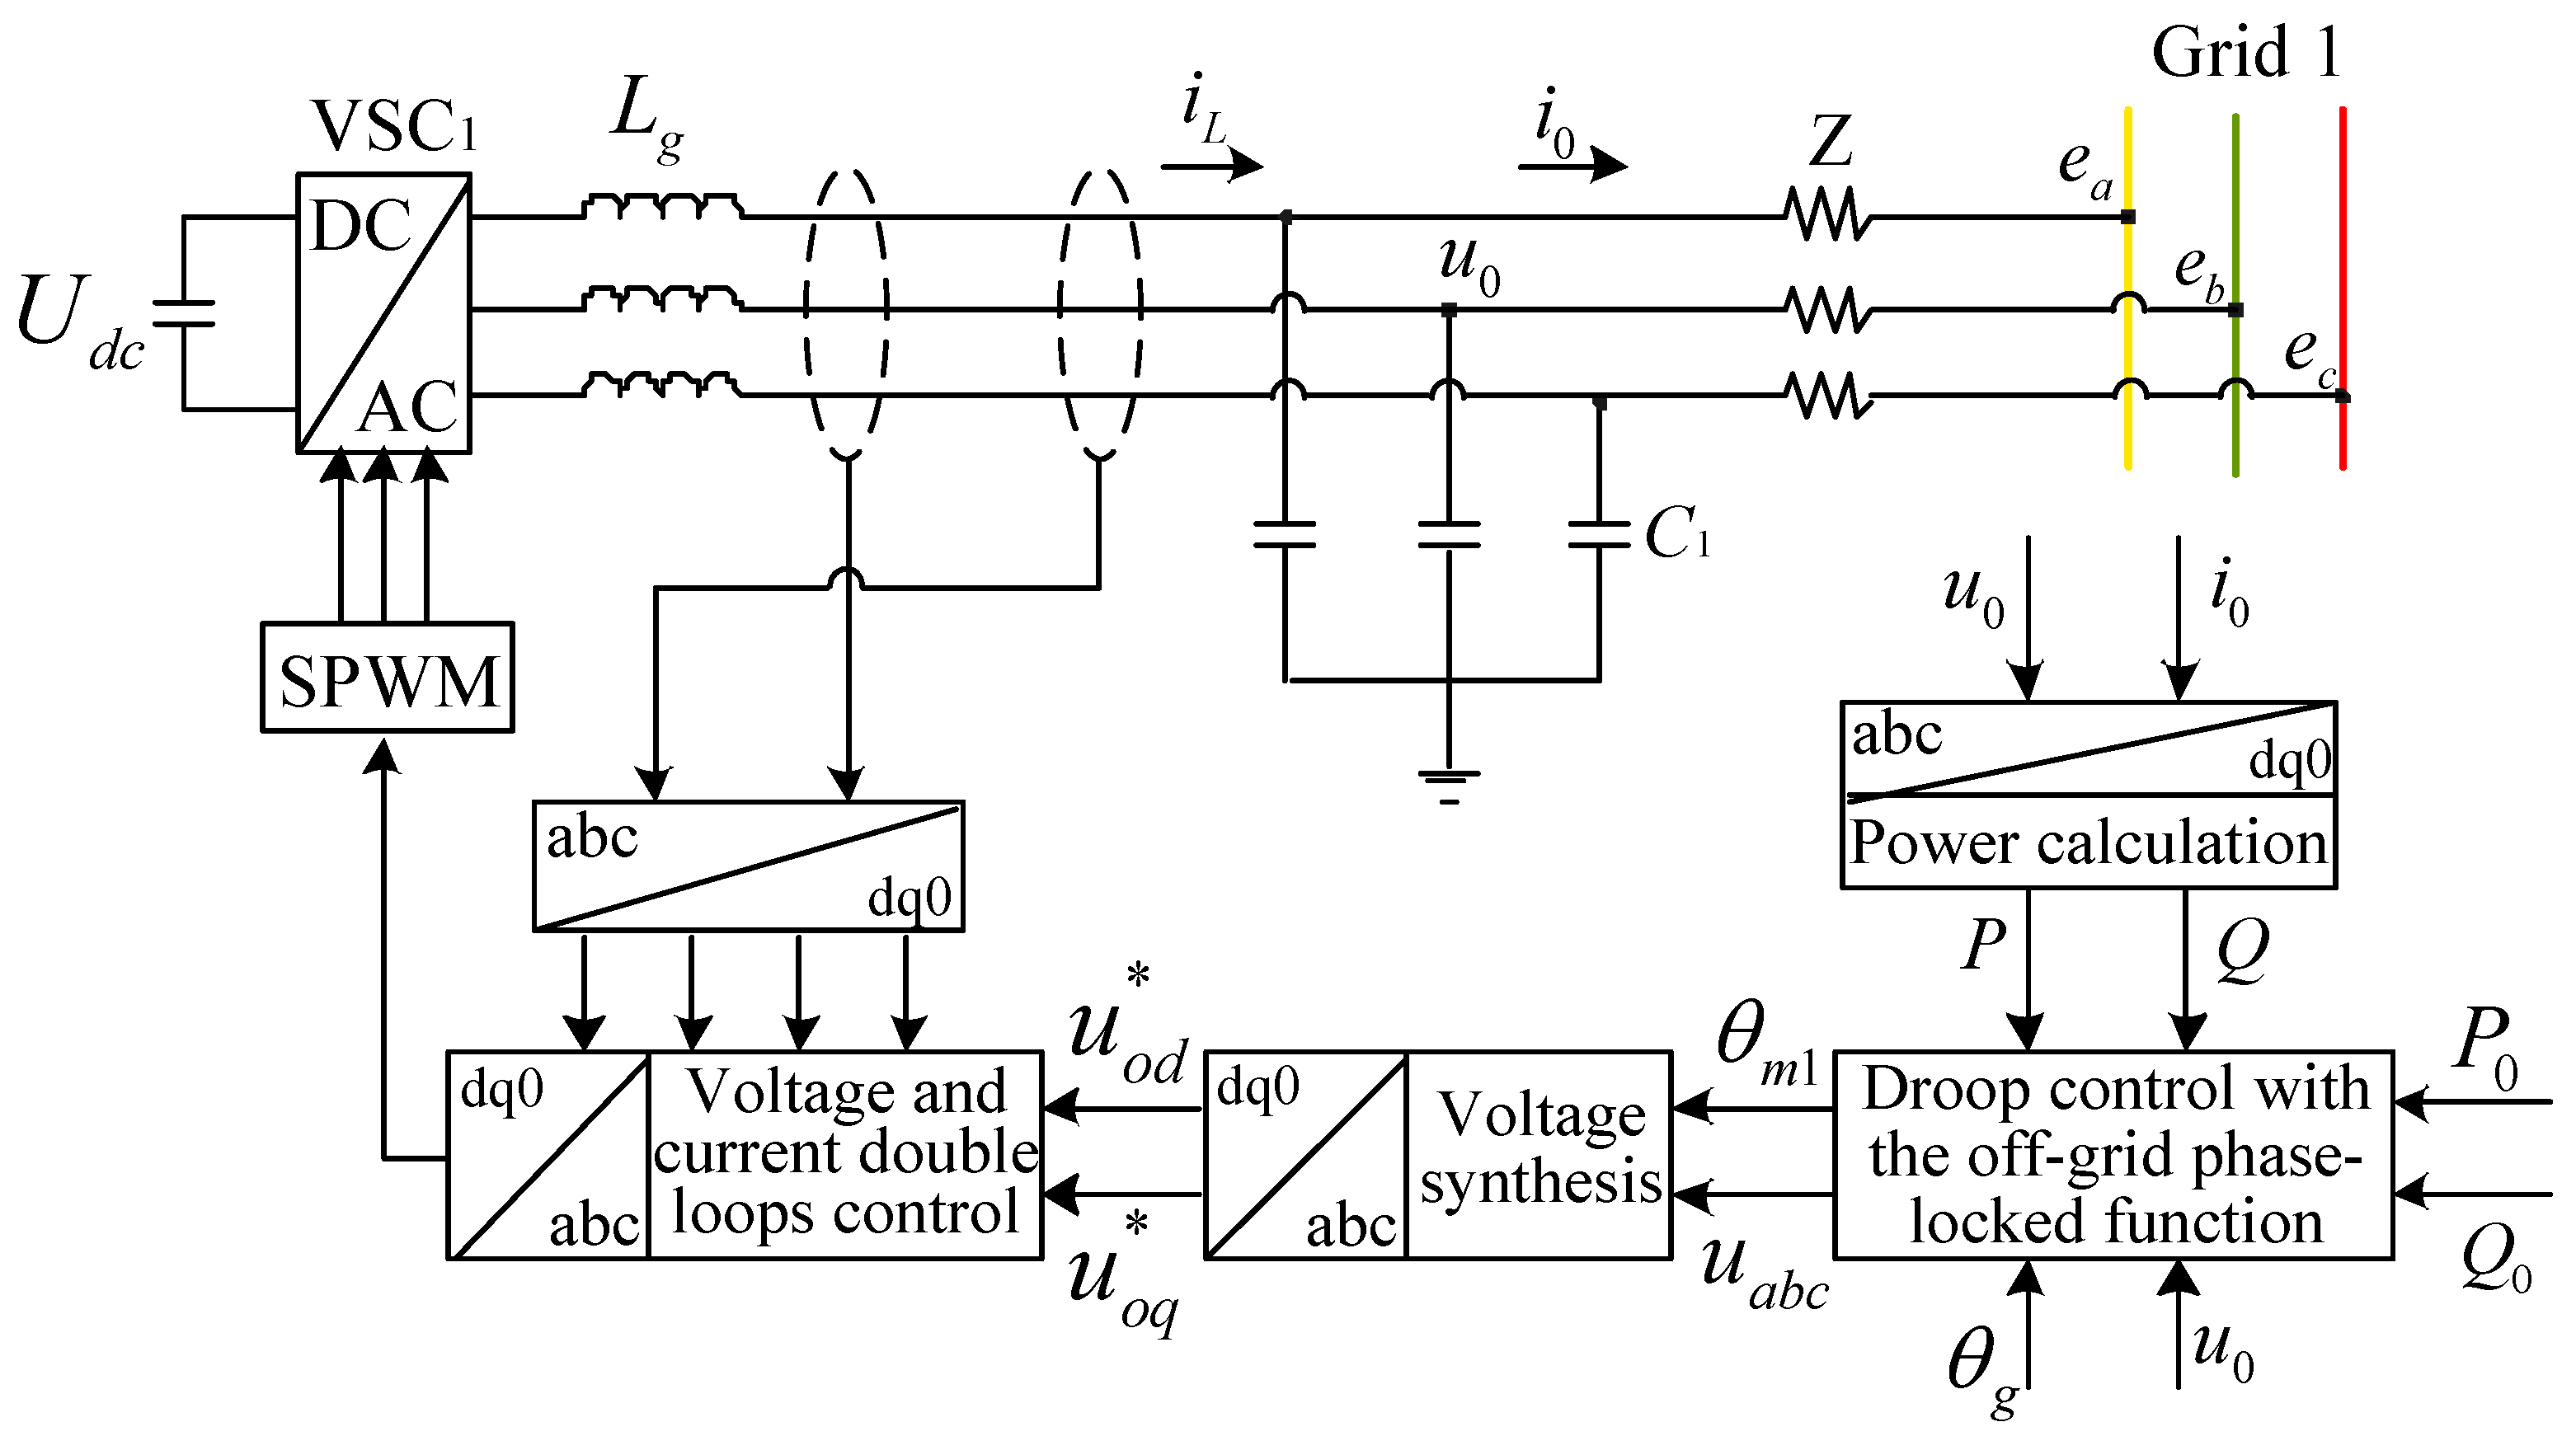
It can be seen from the above discussion that the V/f control strategy can offer a steady voltage and frequency for the fault load by the droop control. The off-grid phase-locked control strategy is introduced into the traditional droop control to quickly realize the phase angle of the fault load tracking to the normal load. The improved V/f control strategy of VSC1 is taken as an example because the V/f control strategy of VSC1 is similar to that of VSC2 or VSC3. The enhanced V/f control strategy is depicted in Figure 11.
In Figure 11, u0 and i0 are the output voltage and current of VSC1, respectively; P0 is the rated output power; Q0 is the reference reactive power; P is the calculated active power; Q is the calculated reactive power; U0 is the rated voltage of the AC grid; θm1 is the reference angle obtained by the improved V/f control strategy of VSC1; uabc is the synthesized voltage control signal; iL is the inductor current; and u o d and u o q are the d-axis and q-axis reference voltage of the V/f control strategy, respectively.
Figure 11 demonstrates that the improved V/f control strategy comprises the power calculation unit, the droop control unit with the off-grid phase-locked function, the voltage synthesis unit, and the voltage and current double loops controller. It is worth mentioning that the droop control unit with the off-grid phase-locked function comprises the droop control part and the off-grid phase-locked function part. For clear illustration, the power calculation unit, the droop control unit with the off-grid phase-locked function, and the voltage synthesis unit are displayed in Figure 12.
(1)
Power calculation unit
In this unit, the active power (P) and the reactive power (Q) are calculated by the output voltage and current of VSC1 according to Equation (13):
Q = u q 0 i d 0 u d 0 i q 0 P = u d 0 i d 0 + u q 0 i q 0
where id0 and iq0 are the d-axis and q-axis currents of i0 after dq transformation, respectively; ud0 and uq0 are the d-axis and q-axis voltages of u0 after dq transformation.
(2)
Droop control unit with the off-grid phase-locked function
This unit is the crucial part of the improved V/f control strategy, which consists of the droop control and the off-grid phase-locked parts. Because the off-grid phase-locked part is introduced in Section 5.4, this section primarily illustrates the droop control strategy, which can deduce the voltage deviation signal (ΔU) and the frequency deviation signal (Δf) by the droop characteristics shown in Equations (14) and (15). Furthermore, the frequency control signal (f1) and the voltage control signal (U1) are obtained by adding the rated frequency (f0) with Δf and the rated voltage (U0) with ΔU, respectively.
Δ f = a 0 ( Q Q 0 ) f 1 = Δ f + f 0
Δ U = b 0 ( P P 0 ) U 1 = Δ U + U 0
where a 0 = f 0 f m a x / Q m a x Q 0 , b 0 = U m i n U 0 / P m a x P 0 ; a0 and b0 are the droop coefficients; fmax is the allowed maximum output frequency of the system; f0 is the rated frequency of the system; Qmax is the allowed maximum output reactive power output of VSC1; Umin is the allowable minimum output voltage amplitude of the system; U0 is the rated voltage; Pmax is the allowed maximum output power in the case of a drop in the system voltage; P0 is the rated active power; and Q0 is the rated reactive power.
The value of ωvf can be calculated based on the value of f1. The output angle frequency for the off-grid phase-locked (ωm1) can be obtained by adding ωvf to Δωsyn. Finally, the output angle for the off-grid phase-locked (θm1) can be calculated by ωm1.
(3)
Voltage synthesis unit
This part can determine the three-phase control signal of VSC1 (uabc) based on θm1 with Equation (16), and the dq axes control signal of VSC1 ( u o d , u o q ) can be obtained using Equation (17).
u a = U 1 sin θ m 1 u b = U 1 sin θ m 1 + 2 3 π u c = U 1 sin θ m 1 2 3 π
u o d = 2 3 u a sin ω m 1 t + u b sin ω m 1 t 2 3 π + u c sin ω m 1 t + 2 3 π u o q = 2 3 u a cos ω m 1 t + u b cos ω m 1 t 2 3 π + u c cos ω m 1 t + 2 3 π
(4)
Voltage and current double loops controller
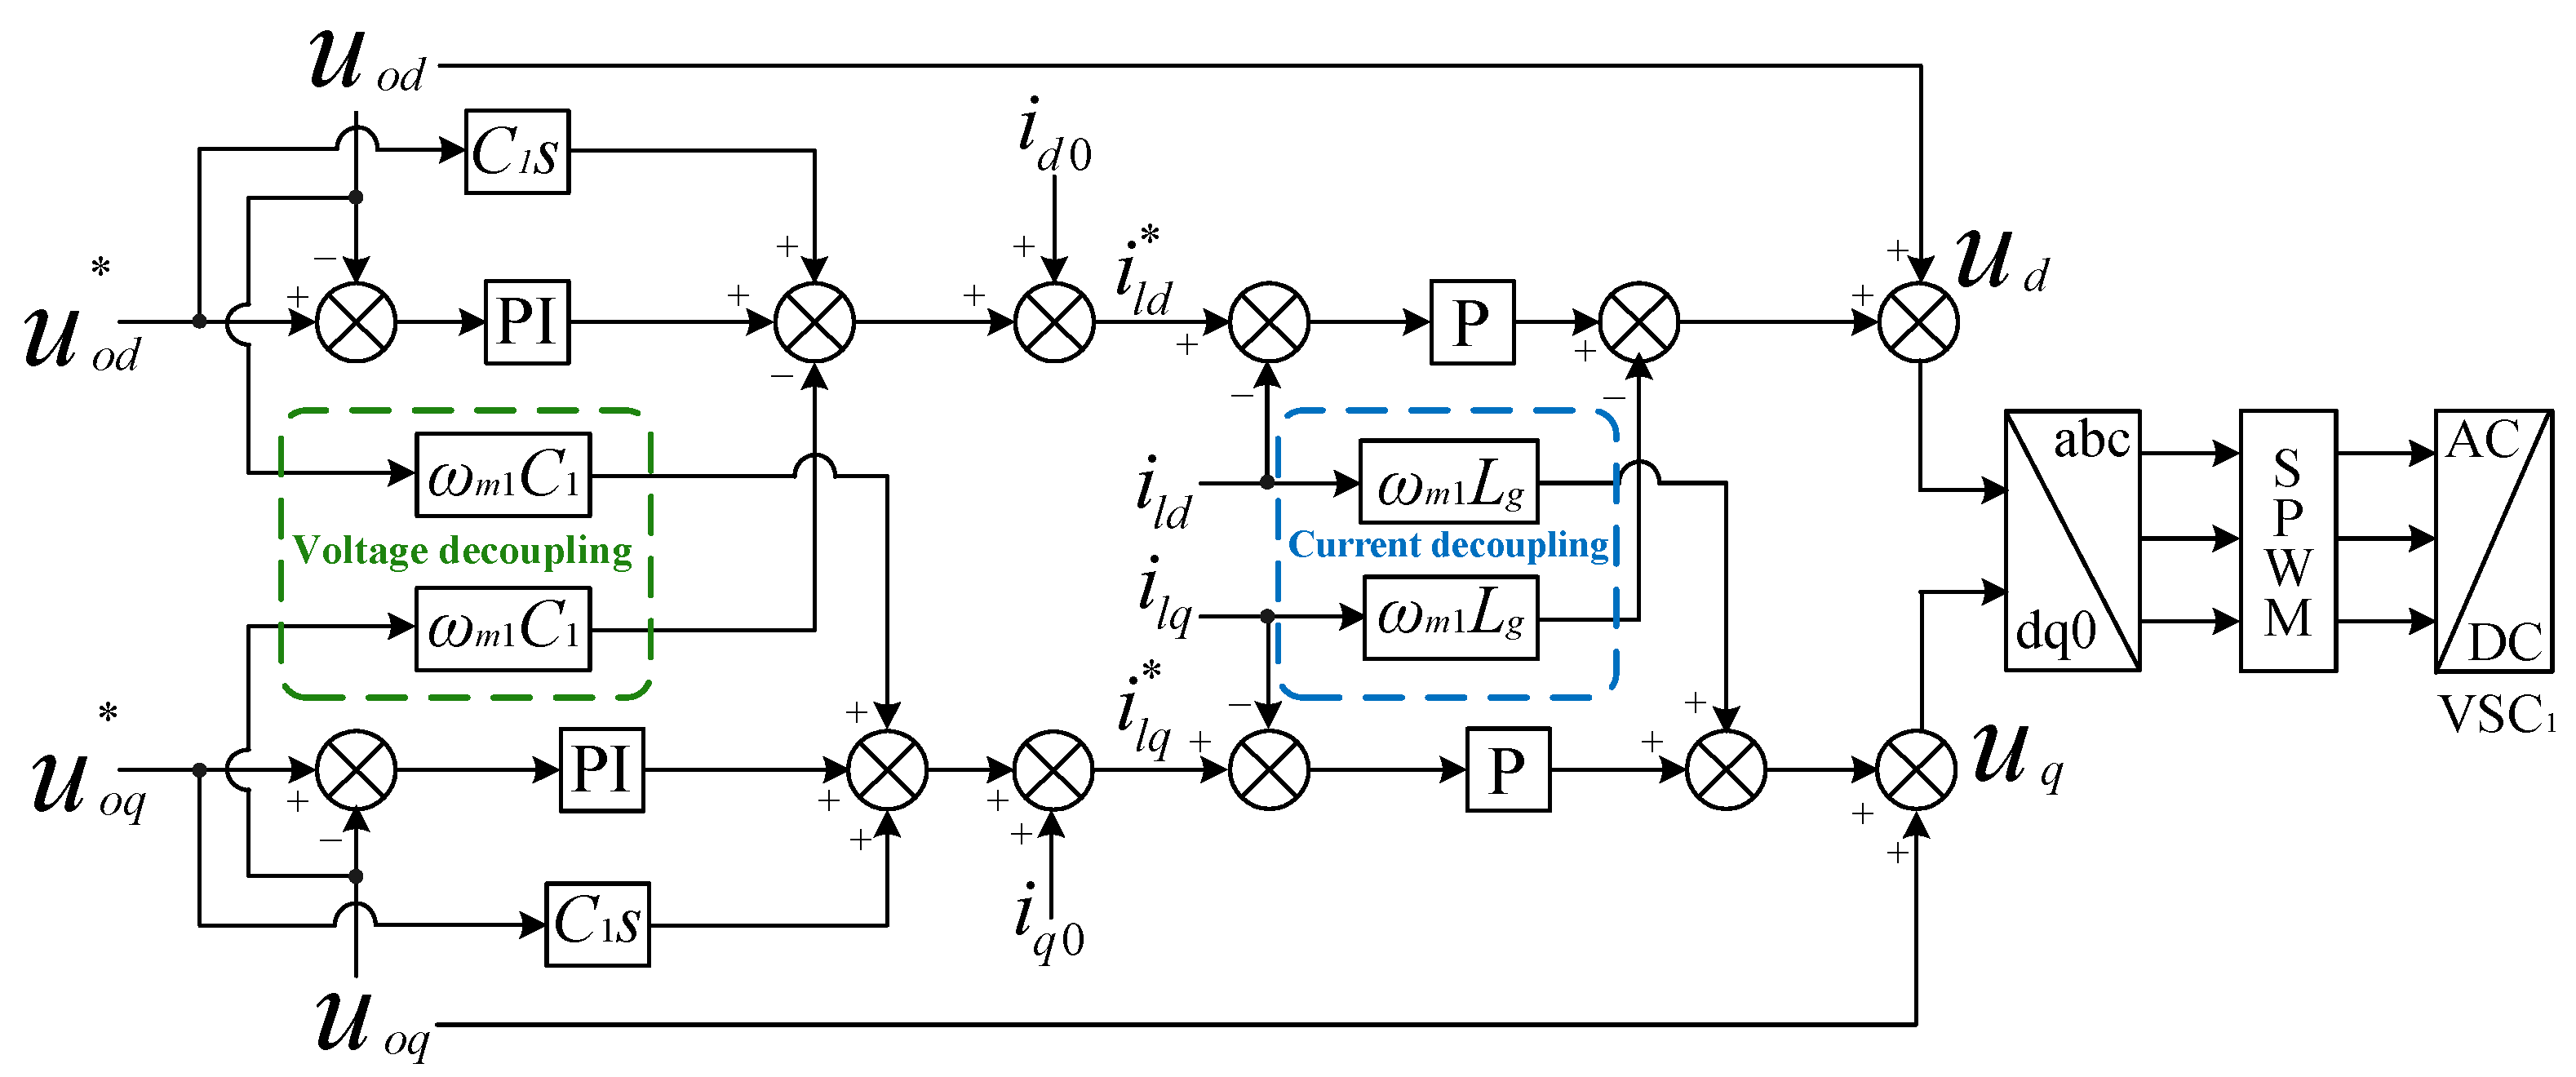
The voltage and current decoupling parts are introduced into the voltage and current double-loop controllers, which are shown in Figure 13.
In Figure 13, uod and uoq are the d-axis and q-axis values of the output voltage, respectively; iod and ioq are the d-axis and q-axis values of the output current, respectively; i l d and i l q are the d-axis and q-axis reference inductor currents, respectively; and ud and uq are the d-axis and q-axis values of the control voltage for SPWM.

6.2. Control Strategy of the Energy Storage Converter

The energy storage system can select one of the control strategies from constant voltage, constant current charging, and floating charging controls to operate. The constant voltage control uses the voltage and current double loops control, whereas the constant current charging and floating charging adopt the single current loop control. It can be seen from Section 5.3 that the power feed-forward control strategy is implemented into the current inner loop to release energy quickly from the energy storage system at the moment of the unplanned feeder off-grid operation. The overall control strategy of the energy storage converter is shown in Figure 14.
In Figure 14, the numbers of 1, 2 and 3 indicate the floating charge control, the constant current charge and the constant voltage control for the battery.

7. Simulation Analysis

7.1. Simulation Parameters

To verify the effectiveness of the proposed coordination control strategy, a new distribution network with energy storage and the FMSS is built according to the topological structure in Figure 1. The DC bus voltage is 750 V. Capacities of T1, T2, and T3 are 125 kV·A, and the power factors of the three transformers are all 0.8. The ratio of transformers is 10 kV/0.4 kV. The battery capacity is 350A·h, and the terminal voltage is 360 V. SOCmax is 0.9. The simulation results of the corresponding off-grid phase-locked, flexible interconnection, and load transfer operation states are detailed below.

7.2. Simulation Result for the Off-Grid Phase-Locked Control Strategy

Figure 15 shows the phase simulation result when the feeder operates from grid integration to off-grid. It illustrates that the system works at grid integration operation before 0.03 s and θm is 0. At 0.03 s, the feeder switches to the off-grid operation, and θm tracks θg quickly. θm and θg are the same after two time periods to realize the off-grid phase-locked function.

7.3. Simulation Results on the Flexible Interconnection Operation State

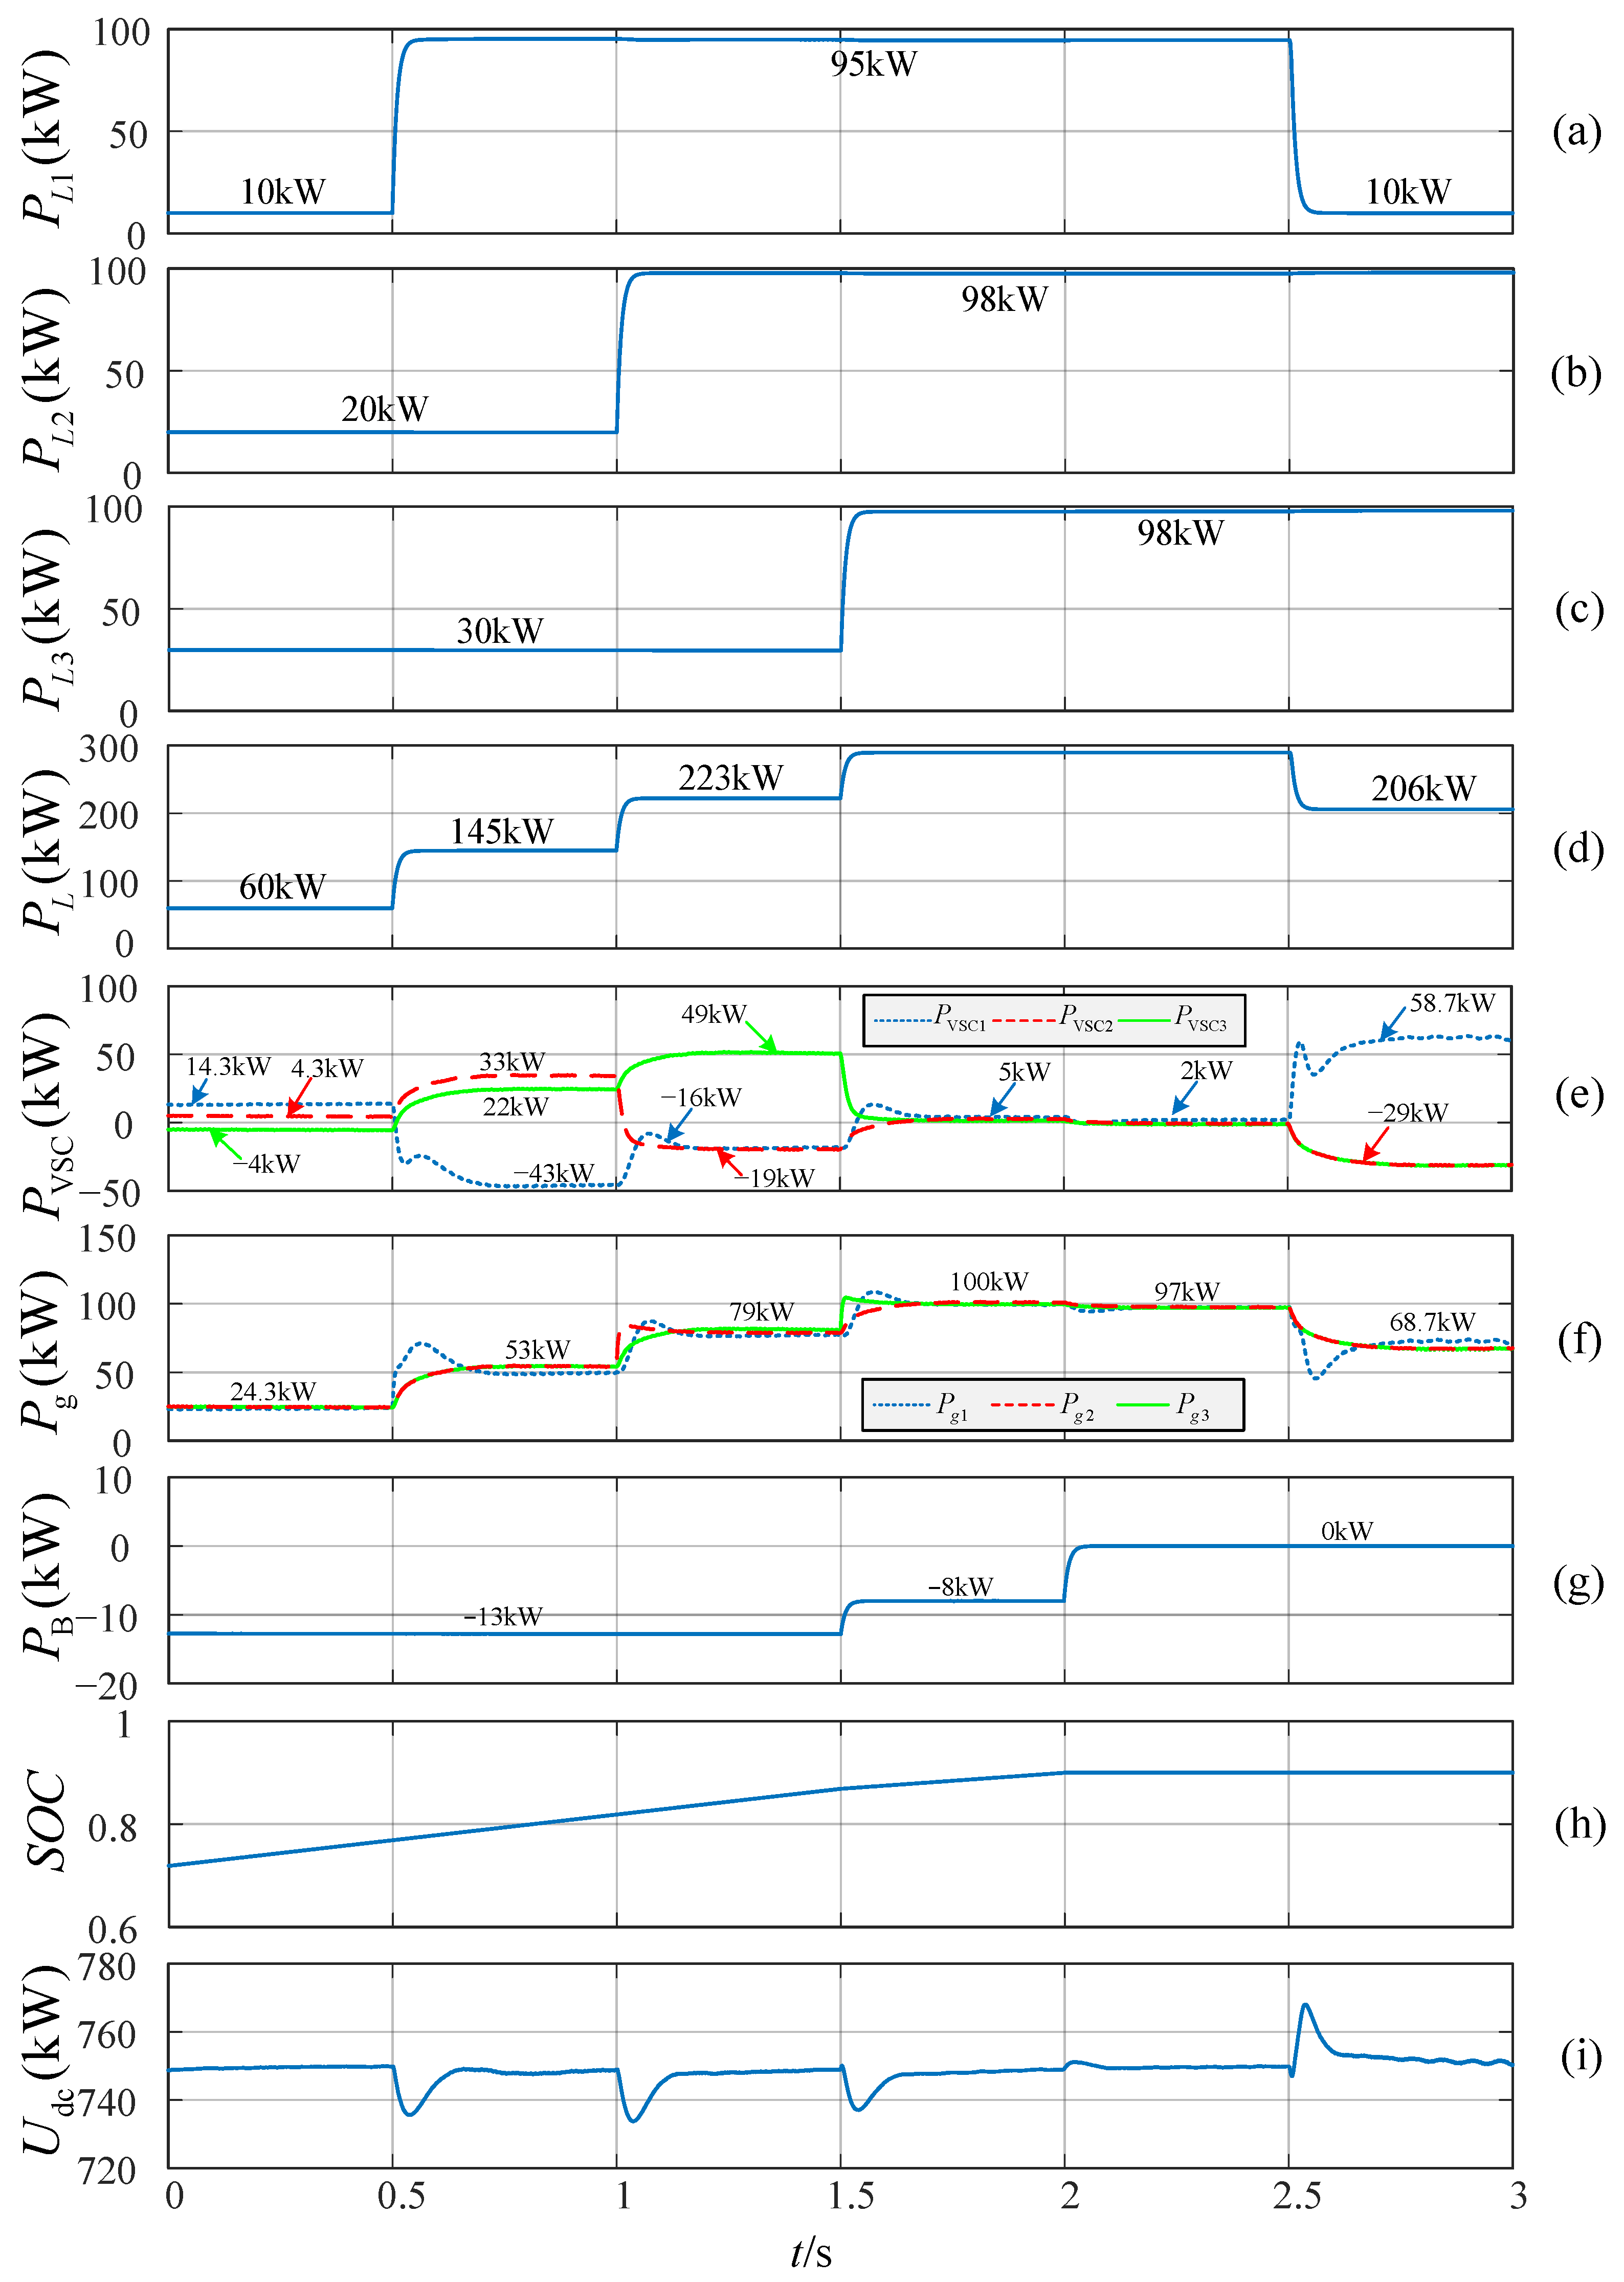
In this scenario, the initial SOC of the battery is 72%, and the powers of L1, L2, and L3 are 10 kW, 20 kW, and 30 kW, respectively. The simulation results on the flexible interconnection state during the variation in the powers of L1, L2, and L3 are shown in Figure 16. The curves in the figure from top to bottom are PL1, PL2, L3 PL3, PL, the power of every port for the FMSS (PVSC), the power of every grid in the system (Pg), PB, the battery’s SOC, and Udc.
The system’s total capacity is 300 kW on the flexible interconnection operation state. Figure 16d shows that PL is always less than the system’s total capacity, although PL1 and PL2 increase successively before 1.5 s (see Figure 16a,b). Therefore, the system operates at Mode 1 during this period, and the battery is charged at constant power to improve the system’s reliability. At 1.5 s, Figure 16c demonstrates that PL3 increases abruptly, which makes PL approach to the system capacity. As a result, the system operates at the grid integration-current limiting mode. During this period, the system operates at Mode 3. All of the three AC grids output their respective maximum powers, as shown in Figure 16f. Figure 16g shows that the battery is charged with the surplus power (8 kW) in the system to improve the power supply reliability of the system as much as possible. At 0.9 s, Figure 16h shows that the SOC reaches SOCmax with the battery charging. Consequently, the battery alters as the floating charge control strategy. With the decreased battery power, three grids exit from the grid integration-current limiting mode. The system turns to work in mode 2.
In summary, it can be seen from the whole simulation results that the output powers of three grids in Figure 16f are always the same at the steady state, which illustrates that the objective on the load balance is realized. Figure 16h shows that the battery is charging until 0.9s, which illustrates that the objective about improving the power supply reliability is realized. Moreover, the sum of PL1 in Figure 16a and PVSC1 in Figure 16e is Pg1 in Figure 16f, which shows that the power balance of VSC1. The similar analysis can be got on VSC2 and VSC3. As a result, the bus voltage in Figure 16i is always around 750 V, which also indicates effectiveness of the control strategies in the equipment layer.

7.4. Simulation Result Analysis on the Load Transfer Operation State

7.4.1. AC Feeder Fault Connected to the Steady-Voltage Port of the FMSS

Figure 17 shows the simulation results if the feeder fails at VSC1, which is the steady port. In the initial state, the system capacity decreases to 200 kW because the feeder connected with Grid 1 undergoes failure.
Figure 17d shows that PL is far less than the system capacity, although PL1 and PL2 are changed before 1.5 s. Therefore, the system works at Mode 4 during this period. SOC in this period is increasing (see Figure 17h), which enhances the system’s reliability. Figure 17f shows that Pg2 is the same as Pg3 in this period, realizing the load balance. At 1.5 s, Figure 17h displays that the reliability is improved to the greatest extent when the battery’s SOC reaches SOCmax. Therefore, the system currently operates from Mode 4 to Mode 5. Pg2 and Pg3 in Figure 17f decrease with the same power for maintaining the load balance. At 2 s, PL3 increases sharply and makes PL exceed the system’s capacity. Consequently, the work mode turns to Mode 7. Therefore, Grid 2 or Grid 3 outputs the maximum power. Meanwhile, the battery discharges to make up the system power deficit. At 2.5 s, the system returns to work at Mode 4 with the shedding of L3. At 4 s, the unplanned off-grid operation occurs at the feeder connected to Grid 2. Figure 17g shows that PB releases its power immediately to avoid the bus voltage fluctuating in a large range, which illustrates the effectiveness of the power feed-forward control of the battery. At 4.5 s, the system operates at Mode 8 with the decreasing PL1, making the battery charge at constant power.
In summary, it can be seen from the simulation results of Figure 17a,b that the fault loads (L1 and L2) work well, which illustrates that the objective of extending the power supply time for the fault load is realized. Moreover, the system’s reliability is improved continuously with the increasing SOC in Figure 17h. Figure 17f illustrates that Pg2 is the same as Pg3 at the steady state before the unplanned feeder off-grid occurs, which means the load balance is realized. Based on the data of Figure 17a–c,e,f, the conclusion about the power balance of VSC1 (VSC2, VSC3) can be proved by the same analysis process in Section 7.3.

7.4.2. AC Feeders Fault at the Unsteady-Voltage Port of FMSS

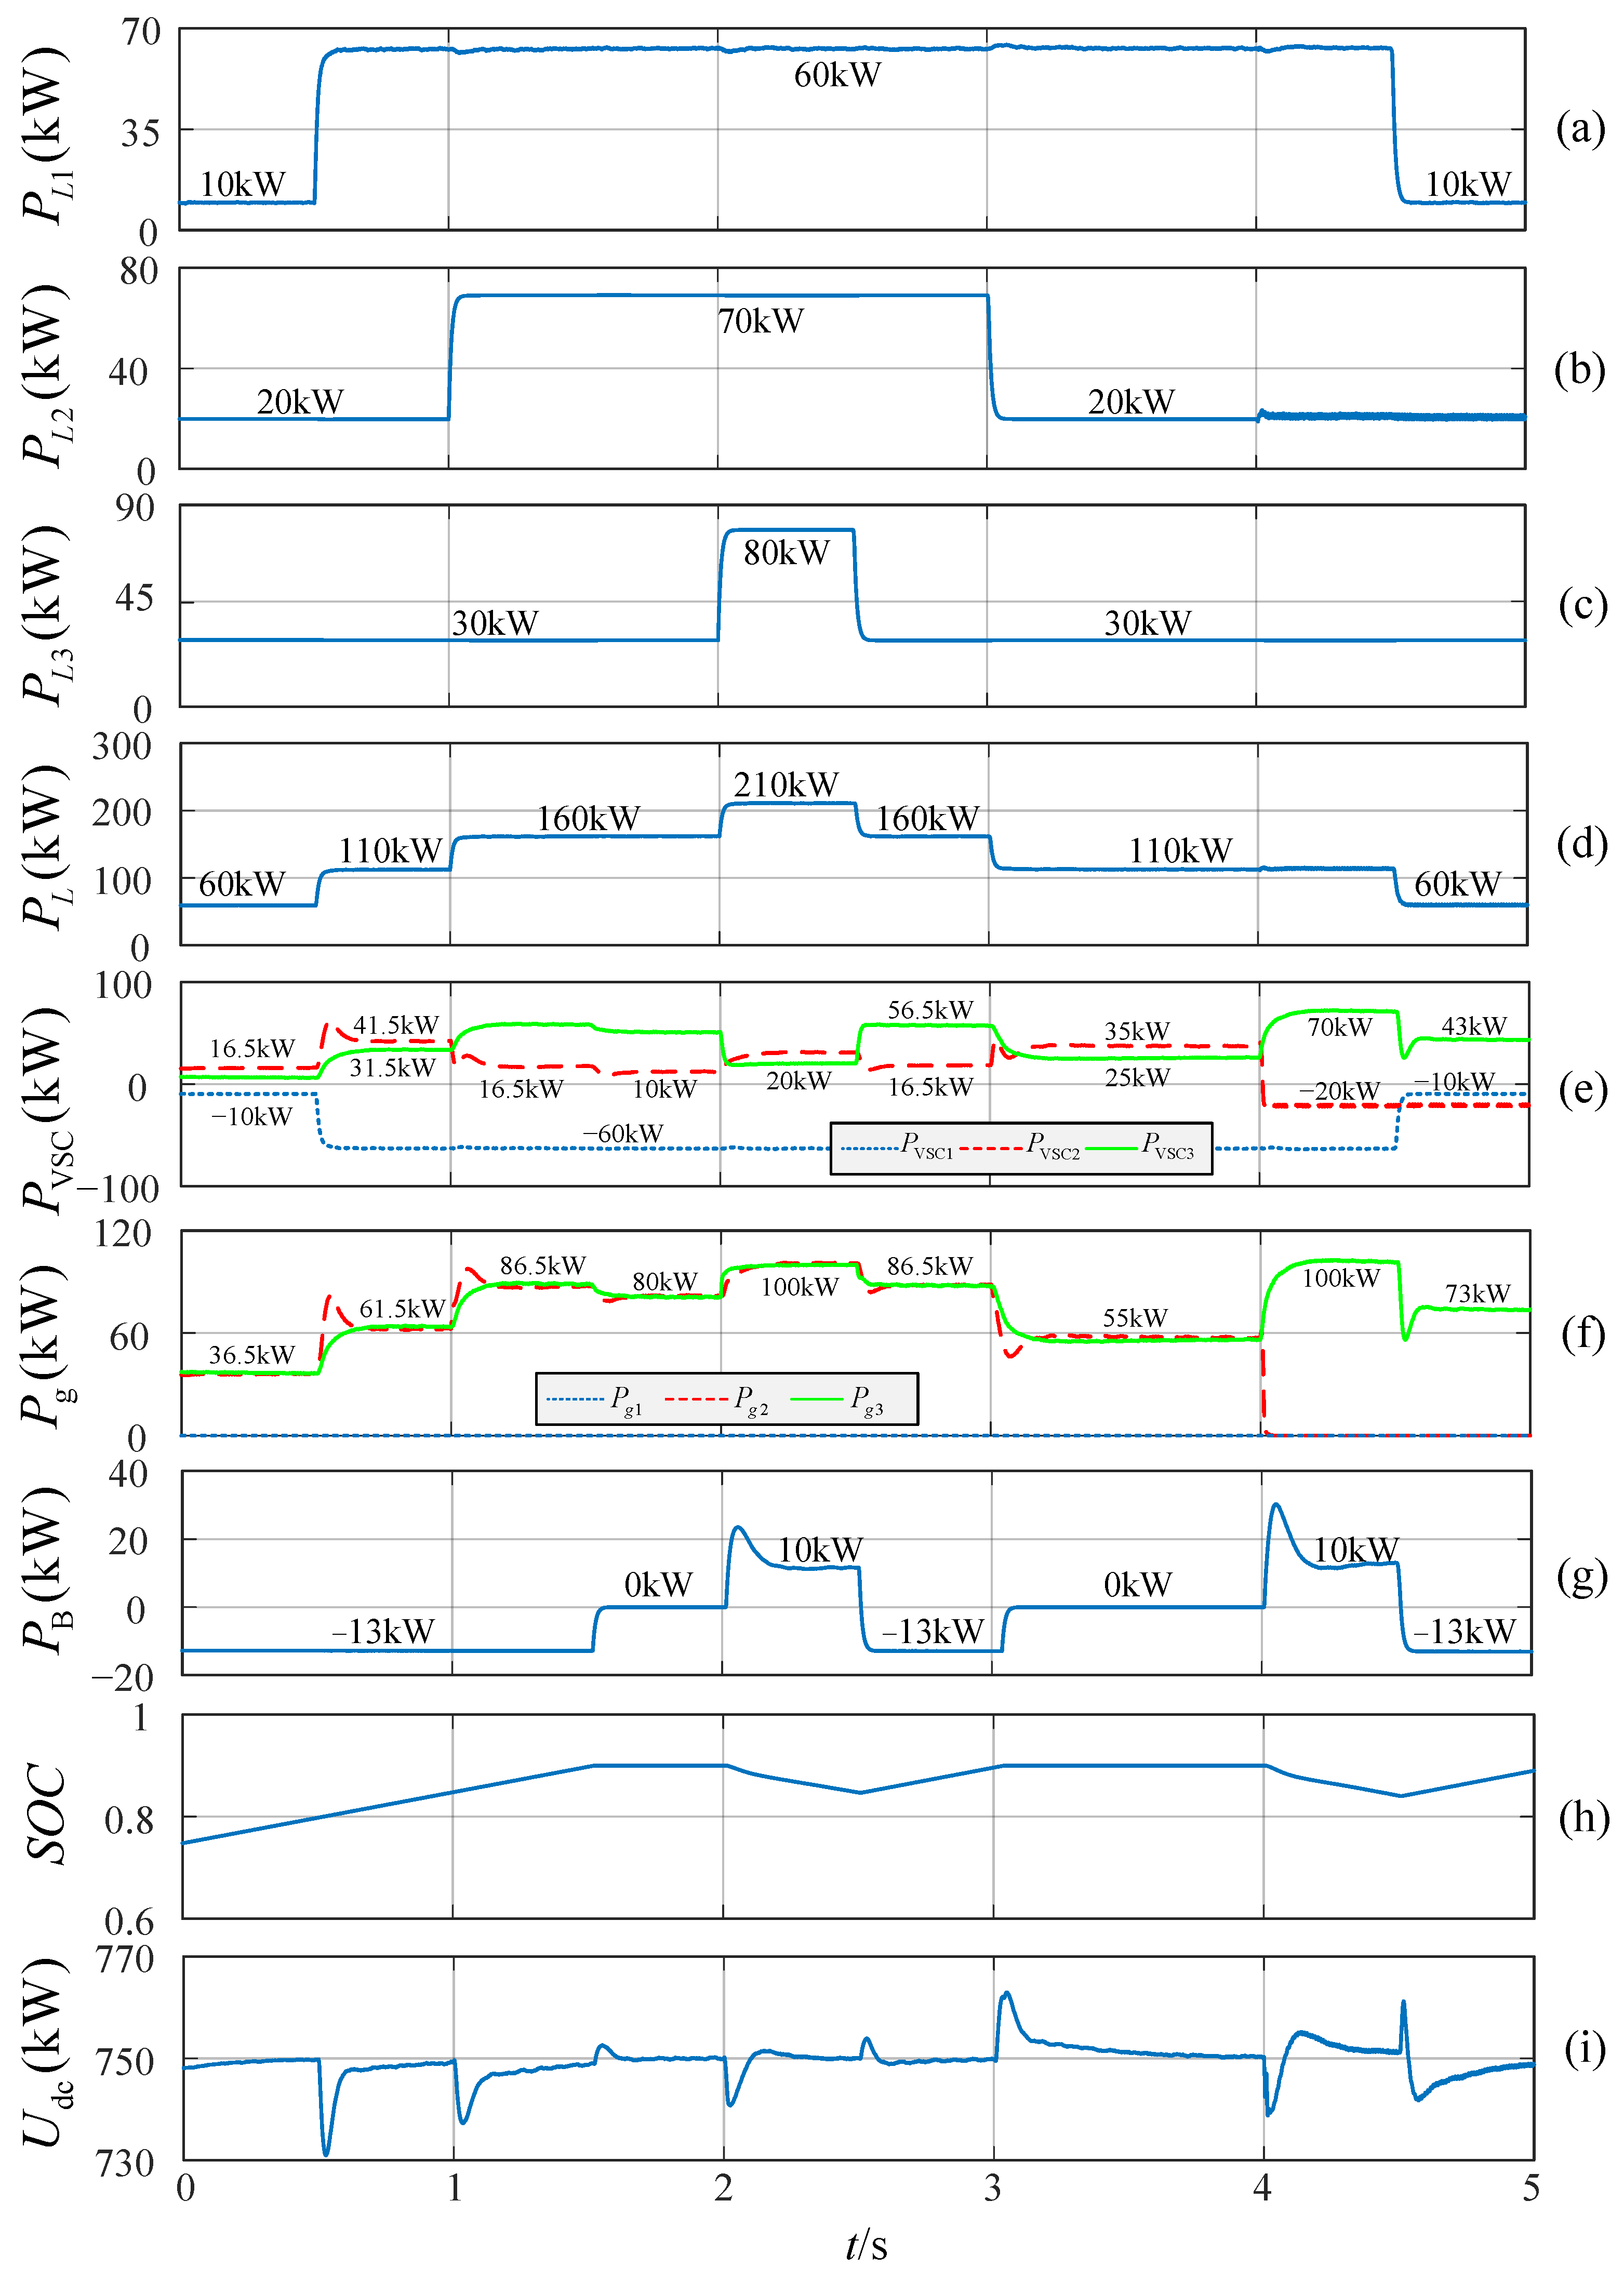
Figure 18 shows the simulation results if the feeder at VSC3 fails, which is not the steady port of the FMSS. In the initial state, VSC1 stabilizes the DC bus voltage, and the system capacity decreases to 200 kW because the feeder connected to Grid 3 undergoes failure.
Although PL1 shown in Figure 18a increases by 85 kW at 0.5 s, PL shown in Figure 18d is still smaller than the system’s capacity, which makes the system operate on Mode 12 until 1 s. At 1 s, PL2 increases abruptly, making PL approach the system’s capacity. Therefore, both Pg1 and Pg2 output the maximum power (see Figure 18f), and the working mode of the system turns to Mode 14. The battery is charged with the surplus power (−5 kW) in the system. At 1.5 s, the battery’s SOC in Figure 18h reaches SOCmax, which makes Pg1 and Pg2 decrease by the same power, and the system operates on Mode 13. At 2 s, PL3 increases abruptly, and PL is larger than the system’s capacity. Hence, the battery discharges to maintain the DC bus stability. The operation of the system turns to Mode 15. At 2.5 s, Figure 18b shows that L2 sheds part of the loads, which results in the system returning to operate at Mode 13. At 3 s, the instruction about Grid 2 going off-grid at 4 s is received. To reduce the bus voltage fluctuation at the feeder off-grid moment, the non-critical load of L2 (50 kW) is first shed. With the load power in the system descending, Pg1 and Pg2 decrease by the same power for keeping the load balance. The system operates on Mode 14 during this period. At 3.5 s, Pg2 is decreased to 0 by the PQ control strategy. Then, the battery is altered as the steady port to stabilize the DC bus voltage. At 4 s, the feeder connected to Grid 2 becomes the planned feeder off-grid, which makes the system capacity decrease to 100 kW. However, it does not cause the large bus voltage fluctuation because Pg2 has been reduced to 0. And the system operates on Mode 19. At 4.5 s, the system turns to Mode 16 with the decreasing on P1.
In summary, it can be seen from Figure 18h that the system’s reliability is improved continuously with the increasing SOC. Figure 18f illustrates that Pg1 is the same as Pg2 at the steady state before the switching strategy for the planned feeder off-grid working. It shows that the load balance is realized. Figure 18b,c display that the fault loads (L2 and L3) can work normally. Consequently, the objective of extending power supply time for the fault load is achieved. Based on the data of Figure 18a–c,e,f, the conclusion about the power balance of VSC1 (VSC2, VSC3) can be proved by the same analysis process in Section 7.3.

8. Conclusions

This study analyzed the system’s multi-mode operation, the objectives of the coordination control layer, the control strategies of the equipment layer for the complicated working conditions of the new distribution network, and the switching strategies during the feeder fault. The conclusions are summarized as follows:
(1)
For the complicated energy management problem of the new distribution network, the different control objectives and strategies are designed in the coordination and equipment control layers, respectively. They can not only assure power balance in the system but also realize a high-quality flexible power supply.
(2)
The switching control sequence for the converters can realize smooth switching during the planned feeder off-grid. The power feed-forward of the battery can make up for the energy loss quickly during the unplanned feeder off-grid. The related simulation result shows that the above two control strategies can reduce the bus voltage fluctuation, whether the feeder is planned or unplanned and off-grid.
(3)
The off-grid phase-locking control strategy can realize the normal grid phase tracking within two time periods, which ensures the fault load phase is synchronous with other loads during feeder faults.
(4)
According to simulation results, under the flexible interconnection mode, the proposed control strategy not only enhances the power supply reliability of the system but also realizes load balance. Under load transfer mode, the proposed control strategy extends the power supply time for the fault loads, improves the power supply reliability of the system as much as possible, and realizes load balance.
As mentioned in Section I, the new distribution network with an E-FMSS represents a significant development trend and research field in the future. Therefore, the research focus on the E-FMSS needs to be further explored and improved. Besides that, the hardware conditions (e.g., battery degradation, converter delays) in the system are not considered in the analysis process of this paper, which may affect the system’s operation effect. For example, battery degradation may result in problems such as system reliability deteriorating, voltage drop, economic rise, etc. Converter delays may cause the deterioration of stability, harmonic suppression, dynamic response, etc. Based on the above discussion, the following works and directions will be carried out in the future.
(1)
Establishing a real E-FMSS or an experimental platform and comparing the simulation results with the experimental or real running results to validate the effectiveness of the proposed coordination control Strategy in this paper.
(2)
Exploring the working modes and coordination control strategy when all feeders connected to the FMSS fail.
(3)
Conducting the research on the virtual inertial control strategy for the E-FMSS to further improve the fluctuation during the unplanned off-grid switching.
(4)
Improving the proposed control strategy by considering battery degradation, converter delays, etc.

Author Contributions

Y.M.: writing-original draft. J.T.: writing—review and editing. Y.X.: visualization. H.H.: investigation. G.L.: project administration. T.Q.: visualization. X.F.: investigation. R.L.: writing—review and editing. All authors have read and agreed to the published version of the manuscript.

Funding

This work was funded by the 2024 Science and Technology Project of Inner Mongolia Power (Group) Co., Ltd. (2024-4-54), the Natural Science Foundation of Inner Mongolia Autonomous Region (2024MS05027, 2022MS05026, 2025MS05112), the ‘Science and Technology Breakthrough’ project of Inner Mongolia Autonomous Region (2024KJTW0017), the Basic Scientific Research Business Fee Items of Universities in Inner Mongolia Autonomous Region (JY 20250036. JY 20230049), and the science and technology research project of colleges and universities in the Inner Mongolia Autonomous Region (NJZY23022, NJZY21099, NJZY21090).

Data Availability Statement

The original contributions presented in this study are included in the article. Further inquiries can be directed to the corresponding author.

Conflicts of Interest

The authors declare that this study received funding from Inner Mongolia Power (Group) Co., Ltd. Authors Yuechao Ma, Jun Tao, Yu Xu, Hongbin Hu, Tao Qin, and Xuchen Fu were employed by the company Inner Mongolia Power (Group) Co., Ltd. The remaining authors declare that the research was conducted in the absence of any commercial or financial relationships that could be construed as a potential conflict of interest. The funder was not involved in the study design, collection, analysis, interpretation of data, the writing of this article or the decision to submit it for publication.

References

  1. Djapic, P.; Strbac, G. Value of load transfer capacity in distribution network design. In Proceedings of the IET International Conference on Resilience of Transmission and Distribution Networks (RTDN 2017), Birmingbam, UK, 5–6 December 2017. [Google Scholar]
  2. Bloemink, J.M.; Green, T.C. Increasing Distributed Generation Penetration Using Soft Normally-Open Points. In Proceedings of the IEEE PES General Meeting, Providence, RI, USA, 25–29 July 2010. [Google Scholar]
  3. Oikonomou, K.; Parvania, M.; Khatami, R. Deliverable energy flexibility scheduling for active distribution neworks. IEEE Trans. Smart Grid 2020, 11, 655–664. [Google Scholar] [CrossRef]
  4. Jia, G.; Chen, M.; Zhao, B.; Lu, Y.; Yang, Y. Application of Flexible Muti-State Switch in Intelligent Distribution Network. Trans. China Electrotech. Soc. 2019, 34, 760–1798. [Google Scholar]
  5. Jiang, X.; Zhou, Y.; Ming, W.; Yang, P.; Wu, J. An overview of Soft Open Points in Electricity Distribution Networks. IEEE Trans. Smart Grid 2022, 13, 1899–1910. [Google Scholar] [CrossRef]
  6. Wang, Z.; Lin, X.; Tong, N.; Li, Z.; Sun, S.; Liu, C. Optimal planning of a 100% renewable energy island supply system based on the integration of a concentrating solar power plant and desalination units. Int. J. Electr. Power Energy Syst. 2020, 117, 105707. [Google Scholar] [CrossRef]
  7. Chen, Y.; Sun, J.; Zha, X.; Yang, Y.; Xu, F. A Novel Node Flexibility Evaluation Method of Active Distribution Network for SNOP Integration. IEEE J. Emerg. Sel. Top. Circuits Syst. 2021, 11, 188–198. [Google Scholar] [CrossRef]
  8. Cheng, Y.; Zhang, G.; Yu, C.; Peng, B.; Wu, X.; Xu, F. Application of Short-time Fourier Transform in Feeder Fault Detection of Flexible Multi-state Switch. J. Phys. Conf. Ser. 2021, 1754, 012106. [Google Scholar] [CrossRef]
  9. Chen, Z.; Yang, H.; Li, M.; Zhao, R.; Wang, C.; Xu, F. Topology Selection Analysis of Flexible Multi-state Switch for Distribution Network Multi-feeder Interconnection. J. Power Supply 2022, 20, 102–112. [Google Scholar]
  10. Li, Z.; Chen, W.; He, G.; Zhao, H. A Novel Modulation Method for Flexible Multi-State Switches with Shared Modules. Electr. Power Eng. Technol. 2023, 42, 35–42. [Google Scholar]
  11. Hou, Y.; Xu, Y.; Wang, Z.; Chen, X.; Cui, H. Research on Application of Three-Port SNOP Based on Dual Closed-Loop control in Distribution Network. In Proceedings of the 2017 IEEE International Conference on Smart Technologies and Management for Computing, Communication, Controls, Energy and Materials, Chennai, India, 2–4 August 2017. [Google Scholar]
  12. Wang, M.; Wei, R.; Liu, H.; Su, C.; Zhang, G.; Su, Q. Control Strategies and Prospects for Flexible Multi-State Switch in Intelligent Distribution Network. In Proceedings of the 2023 8th International Conference on Power and Renewable Energy (ICPRE), Shanghai, China, 22–25 September 2023. [Google Scholar]
  13. Ji, H.; Wang, C.; Li, P.; Zhao, J.; Song, G.; Ding, F.; Wu, J. An Enhanced SOCP-based Method for Feeder Load Balancing Using the Multi-terminal Soft Open Point in Active Distribution Networks. Appl. Energy 2017, 208, 986–995. [Google Scholar] [CrossRef]
  14. Sun, F.; Ma, J.; Yu, M.; Wei, W. Optimized Two-Time Scale Robust Dispatching Method for the Multi-terminal Soft Open Point in Unbalanced Active Distribution Networks. IEEE Trans. Sustain. Energy 2021, 12, 587–597. [Google Scholar] [CrossRef]
  15. Yuan, W.; Tu, C.; Zheng, L.; Fan, X.; Qi, G.; Xin, W. Flexible Interconnection Strategy Between DC Microgrid and AC Distribution Grid Based on Energy Storage Flexible Multi-State Switch. Electr. Power Autom. Equip. 2021, 41, 254–260. [Google Scholar]
  16. Huo, Q.; Su, M.; Wu, L.; Zhen, W.T.; Peng, W. Compound Control Strategy for Flexible Multi-state Switch. Autom. Electr. Power Syst. 2018, 42, 166–170. [Google Scholar]
  17. Xu, C.; Yuan, X.; Xu, Y.; Tan, Z.; Lin, C.; Chen, M. Research on Feeder Power Balancing Technology Based on SNOP Droop Control. In Proceedings of the 2019 IEEE 10th International Symposium on Power Electronics for Distributed Generation Systems (PEDG), Xi’an, China, 3–6 June 2019. [Google Scholar]
  18. Ehsanbakhsh, M.; Sepasian, M.S. Optimal Allocation of Soft Open Points in Active Distribution Networks Considering Wind Generation Uncertainty. In Proceedings of the 2023 27th International Electrical Power Distribution Networks Conference (EPDC), Mashhad, Iran, 2–4 May 2023. [Google Scholar]
  19. Wu, R.; Ran, L.; Weiss, G.; Yu, J. Control of a Synchronverter-based Soft Open Point in A Distribution Network. In Proceedings of the 14th IET International Conference on AC and DC Power Transmission (ACDC 2018), Chengdu, China, 21–22 February 2018. [Google Scholar]
  20. Tong, N.; Sun, K.; Li, K.J.; Zhu, X.; Lin, X.; Li, Z.; Lee, W.J. Online Load Transfer Criterion Using Soft Normally-open Points for Distribution Networks with Renewable Energies Integration. In Proceedings of the 2020 IEEE Industry Applications Society Annual Meeting, Detroit, MI, USA, 10–16 October 2020. [Google Scholar]
  21. Peng, B.; Zhang, G. Coordination Control Strategy for Three-port SNOP Based on FCS-MPC. In Proceedings of the 14th IET International Conference on AC and DC Power Transmission (ACDC 2018), Chengdu, China, 21–23 February 2018. [Google Scholar]
  22. Lin, J.; Kong, X.; Zheng, J.; Zhou, F.; Wang, C.; Zhang, L. A Smooth Operating-state-switching Method Used in Multi-terminal Flexible Interconnected Device. In Proceedings of the 2021 IEEE Sustainable Power and Energy Conference (ISPEC), Nanjing, China, 23–25 December 2021. [Google Scholar]
  23. Liu, Y.; Sun, M.; Hu, C.; Li, Z.; Ban, M. Smooth Switching Strategy for flexible multi-state switches based on linear active disturbance rejcetion control. Power Syst. Technol. 2024, 48, 1663–1671. [Google Scholar]
  24. Cao, W.; Wu, J.; Jenkins, N.; Wang, C.; Green, T. Operating Principle of Soft Open Points for Electrical Distribution Network Operation. Appl. Energy 2016, 164, 245–257. [Google Scholar] [CrossRef]
  25. Sarantakos, I.; Peker, M.; Zografou-Barredo, N.M.; Deakin, M.; Patsios, C.; Sayfutdinov, T.; Taylor, P.C.; Greenwood, D. A Robust Mixed-integer Convex Model for Optimal Scheduling of Integrated Energy Storage-Soft Open Point Devices. IEEE Trans. Smart Grid 2022, 13, 4072–4087. [Google Scholar] [CrossRef]
  26. Yao, C.; Zhou, C.; Yu, J.; Xu, K.; Li, P.; Song, G. A Sequential Optimization Method for Soft Open Point Integrated with Energy Storage in Active Distribution Networks. Energy Procedia 2018, 145, 528–533. [Google Scholar] [CrossRef]
  27. He, D.; Zhang, W.; Zou, Y.; Cai, X.; Lan, Z. Multi-objective Control Strategy for Flexible Multi-state Switch Based on Supercapacitor Energy Storage Under Grid Voltage Imbalance. High Volt. Eng. 2024, 50, 5482–5494. [Google Scholar]
  28. Attanasio, F.; Wasterlain, S.; Pidancier, T.; Marchesoni, M.; Favre-Perrod, P.; Carpita, M. Low Voltage Soft Open Point with Energy Storage: System Simulation and Prototype Preliminary Test Results. In Proceedings of the 2018 International Symposium on Power Electronics, Electrical Drives, Automation and Motion (SPEEDAM), Amalfi, Italy, 20–22 June 2018. [Google Scholar]
  29. Ge, P.; Tang, D.; Yuan, Y.; Guerrero, J.M.; Zio, E. A hierarchical multi-objective co-optimization framework for sizing and energy management of coupled hydrogen-electricity energy storage systems at ports. Appl. Energy 2025, 384, 125451. [Google Scholar] [CrossRef]
  30. Liu, J.; Cao, X.; Xu, Z.; Guan, X.; Dong, X.; Wang, C. Resilient Operation of Multi-energy Industrial Park Based on Integrated Hydrogen-electricity-heat Microgrids. Int. J. Hydrogen Energy 2021, 46, 28855–28869. [Google Scholar] [CrossRef]
  31. Duan, Q.; Sha, G.; Sheng, W. Multi-mode operation and its control strategy of flexible interconnected system for distribution network. Electr. Power Autom. Equip. 2020, 40, 9–24. [Google Scholar]
  32. Tang, D.; Tang, H.; Yuan, C.; Dong, M.; Diaz-Londono, C.; Agundis-Tinajero, G.D.; Guerrero, J.M.; Zio, E. Economic and resilience-oriented operation of coupled hydrogen-electricity energy systems at ports. Appl. Energy 2025, 390, 125825. [Google Scholar] [CrossRef]
Figure 1. Structure diagram of the new distribution network with E-FMSS.
Energies 18 03389 g001
Figure 2. Hierarchical control structure.
Energies 18 03389 g002
Figure 3. Working modes during the flexible interconnection operational state.
Energies 18 03389 g003
Figure 4. Working modes set during the flexible interconnection operational state.
Energies 18 03389 g004
Figure 5. Working modes during the load transfer operational state.
Energies 18 03389 g005
Figure 6. Working modes set during the load transfer operation state.
Energies 18 03389 g006
Figure 7. Switching control sequence diagram for the feeder planned off-grid process.
Energies 18 03389 g007
Figure 8. Power feed-forward control of the battery for the feeder unplanned off-grid.
Energies 18 03389 g008
Figure 9. Off-grid phase-locked control strategy.
Energies 18 03389 g009
Figure 10. Udc/Q and PQ control strategies of VSC1 in FMSS.
Energies 18 03389 g010
Figure 11. Improved V/f control strategy.
Energies 18 03389 g011
Figure 12. Control block diagram of the power calculation, droop control, off-grid phase-locked and voltage synthesis units.
Energies 18 03389 g012
Figure 13. Voltage and current double loops control strategy.
Energies 18 03389 g013
Figure 14. Control strategies of the energy storage converter.
Energies 18 03389 g014
Figure 15. Simulation result of the off-grid phase locking.
Energies 18 03389 g015
Figure 16. Simulation results in the flexible interconnection operation state. (a) output power waveform of L1; (b) output power waveform of L2; (c) output power waveform of L3; (d) output power waveform of the total loads; (e) output power waveforms of VSC1, VSC2 and VSC3; (f) output power waveforms of Grid 1, Grid 2 and Grid 3; (g) output power waveform of the battery; (h) SOC of the battery; (i) bus voltage waveform.
Energies 18 03389 g016
Figure 17. Simulation results of AC feeder fault connected with the steady-voltage port of the FMSS. (a) output power waveform of L1; (b) output power waveform of L2; (c) output power waveform of L3; (d) output power waveform of the total loads; (e) output power waveforms of VSC1, VSC2 and VSC3; (f) output power waveforms of Grid 1, Grid 2 and Grid 3; (g) output power waveform of the battery; (h) SOC of the battery; (i) bus voltage waveform.
Energies 18 03389 g017
Figure 18. Simulation results of the feeders’ faults at the unsteady-voltage port of FMSS. (a) output power waveform of L1; (b) output power waveform of L2; (c) output power waveform of L3; (d) output power waveform of the total loads; (e) output power waveforms of VSC1, VSC2 and VSC3; (f) output power waveforms of Grid 1, Grid 2 and Grid 3; (g) output power waveform of the battery; (h) SOC of the battery; (i) bus voltage waveform.
Energies 18 03389 g018
Disclaimer/Publisher’s Note: The statements, opinions and data contained in all publications are solely those of the individual author(s) and contributor(s) and not of MDPI and/or the editor(s). MDPI and/or the editor(s) disclaim responsibility for any injury to people or property resulting from any ideas, methods, instructions or products referred to in the content.