Article

Dynamic Analysis of the Interconnection of a Set of FPSO Units to an Onshore System via HVDC

by
Johnny Orozco Nivelo
1,*,
Carlos A. Villegas Guerrero
1,
Lúcio José da Motta
1,
Marcos R. de Paula Júnior
1,
José M.d. Carvalho Filho
1,
Alex Reis
2,
José Carlos Oliveira
3,
José Mauro T. Marinho
4,
Vinicius Z. Silva
4 and
Carlos A. C. Cavaliere
4
1
Department of Electrical Systems and Energy, Federal University of Itajubá, Itajubá 37500-903, Brazil
2
Faculty of Science, Technology in Engineering, University of Brasilia, Brasília 72444-240, Brazil
3
Faculty of Electrical Engineering, Federal University of Uberlândia, Uberlândia 38400-902, Brazil
4
Petrobras Research Center (CENPES), Rio de Janeiro 21941-915, Brazil
*
Author to whom correspondence should be addressed.
Energies 2025, 18(14), 3637; https://doi.org/10.3390/en18143637
Submission received: 5 June 2025 / Revised: 2 July 2025 / Accepted: 7 July 2025 / Published: 9 July 2025
(This article belongs to the Special Issue Advanced Electric Power Systems, 2nd Edition)

Abstract

In an effort to restrict further increases in climate change, governments and companies are exploring ways to reduce greenhouse gas (GHG) emissions. In this context, the oil industry, which contributes to indirect GHG emissions, is seeking ways to develop solutions to this issue. One such approach focuses on the connection of offshore oil production platforms to the onshore power grid via high-voltage direct current (HVDC), enabling a total or partial reduction in the number of local generators, which are generally powered by gas turbines. Therefore, this work aims to determine the technical feasibility, based on transient and dynamic stability analyses, of electrifying a system composed of six floating production storage and offloading (FPSO) units connected to a hub, which is powered by the onshore grid through submarine cables using HVDC technology. The analysis includes significant contingencies that could lead the system to undesirable operating conditions, allowing for the identification of appropriate remedial control actions. The analysis, based on real data and parameters, was carried out using PSCAD software. The results show that the modeled system is technically viable and could be adopted by oil companies. In addition to aligning with global warming mitigation goals, the proposal includes a complex system modeling approach, with the aim of enabling further study.

1. Introduction

In recent decades, concerns about restricting the rise in the planet’s average temperature have grown, especially since the United Nations Conference on the Human Environment in Stockholm, Sweden, in 1972, when, for the first time in UN (United Nations) history, environmental concerns took center stage alongside politics and economics [1]. Since then, numerous meetings have been held and agreements have been made among various countries, including the first World Climate Conference (WCC) in 1979; the first Conference of the Parties (COP 1) in 1995; the Kyoto Protocol during COP 3 in 1997; and the 2015 Paris Agreement at COP 23 [2].
However, despite the efforts made by several countries adhering to the treaties, the planet continues to suffer from climate change, and this is likely to further worsen. According to the United Nations [3], forecasts suggest that global demand for coal, oil, and gas will reach its peak this decade, considering that CO2 emissions from fossil fuels reached a record high in 2022. Consequently, agreements related to environmental issues have become more stringent, and, at the most recent conferences—COP 28 and COP 29 (held in 2023 and 2024, respectively)—a number of challenging targets were laid out, while others were reformulated, such as limiting the planet’s temperature increase to 1.5 °C by 2100, compared with the 2 °C agreed in Paris [4,5].
Although the gas emissions that contribute to the greenhouse effect are generally associated with the use of fossil fuels by industry and the automotive sector, the process of oil extraction and refining itself also contributes to what is known as indirect emissions. A study published in 2018 reported that the total indirect greenhouse gas (GHG) emissions from oil and gas operations amounted to more than 5 million tons of carbon dioxide equivalent (CO2-eq), representing 15% of the total GHG emissions from the energy sector [6]. Given this scenario, the oil industry has been seeking solutions to address the issue and respond to the established targets. One example is provided by the Norwegian oil and energy department, which mandates the electrification of future offshore installations through the onshore grid (power from shore), as with the Utsira complex [7]. In this way, the Brazilian government and a number of companies have also committed to contributing to reducing GHG emissions. In 2023, Brazil updated its targets, seeking to reduce its emissions by 48% by 2025 and 53% by 2030 compared with 2005 levels. Furthermore, the commitment to achieving net-zero emissions by 2050 has been reaffirmed [8]. Inspired by the experiences of other countries, the Brazilian oil industry has been evaluating the potential electrification of its platforms [9].
In addition to the environmental benefits generated by electrifying FPSO units via HVDC from onshore power, there are other advantages, such as operational flexibility, which comes with the integration of power control devices that improve the operational aspects of the electrical grid. Some studies suggest the use of renewable energy sources installed near the platforms, with wind and solar energy being the primary alternatives [7,10,11,12]. However, other studies show that the integration of renewable energy into power systems has caused changes in the systems’ dynamic behaviors. This is the case in the study reported in [13], where the frequency dynamic response of a system with a high share of renewable generation differs from that of a system operating with conventional generation. Therefore, if an integrated protection system is considered, its design, selection, and operation will be affected during a disturbance or contingency, as it seeks to maintain system stability.
In this context, this work analyzes the technical feasibility based on transient and dynamic stability analysis of the electrification of a multi-platform system composed of six platforms located at different distances connected to a central energy hub at 66 kV, which in turn is connected by submarine cables to the onshore electrical system through a bipolar VSC-HVDC system connecting two stations (rectifier/inverter) at 150 kV DC. The analysis is conducted under adverse scenarios such as short circuits, generator unit losses, large motor startups, and sudden FPSO islanding due to disconnection, ensuring that open-loop control actions can mitigate the contingency and lead the system to stable operation.
The results were then compared with the regulatory standards, particularly the general requirements for electrical installations on offshore platforms, as outlined in the IEC 61892-1 standard [14]. Based on these results, this study proposes a configuration and parametric structure for electrifying not just a single platform, but an entire FPSO complex that can operate safely and efficiently within the constraints imposed by pre-salt oil and gas extraction. Therefore, this work can contribute significantly to reducing GHG emissions, as future platforms will be able to operate without or with a reduced number of generators, importing electricity from the onshore grid. In Brazil, approximately 85% of the grid is powered by renewable energy, primarily from hydroelectric sources [15]. Additionally, this study enhances knowledge in this area more broadly by adding to discussions on the various analyzed scenarios, and provides a comprehensive modeling approach using PSCAD software, covering the whole system from onshore facilities to the most distant platform.
To this end, this article is structured as follows: Section 2 presents the specifications of the proposed electrical network. Section 3 outlines the results of the power flow analysis, to serve as a reference. Section 4 presents the results for each analyzed case in the dynamic and transient studies, comparing them to regulatory guidelines. Finally, Section 5 concludes this study.

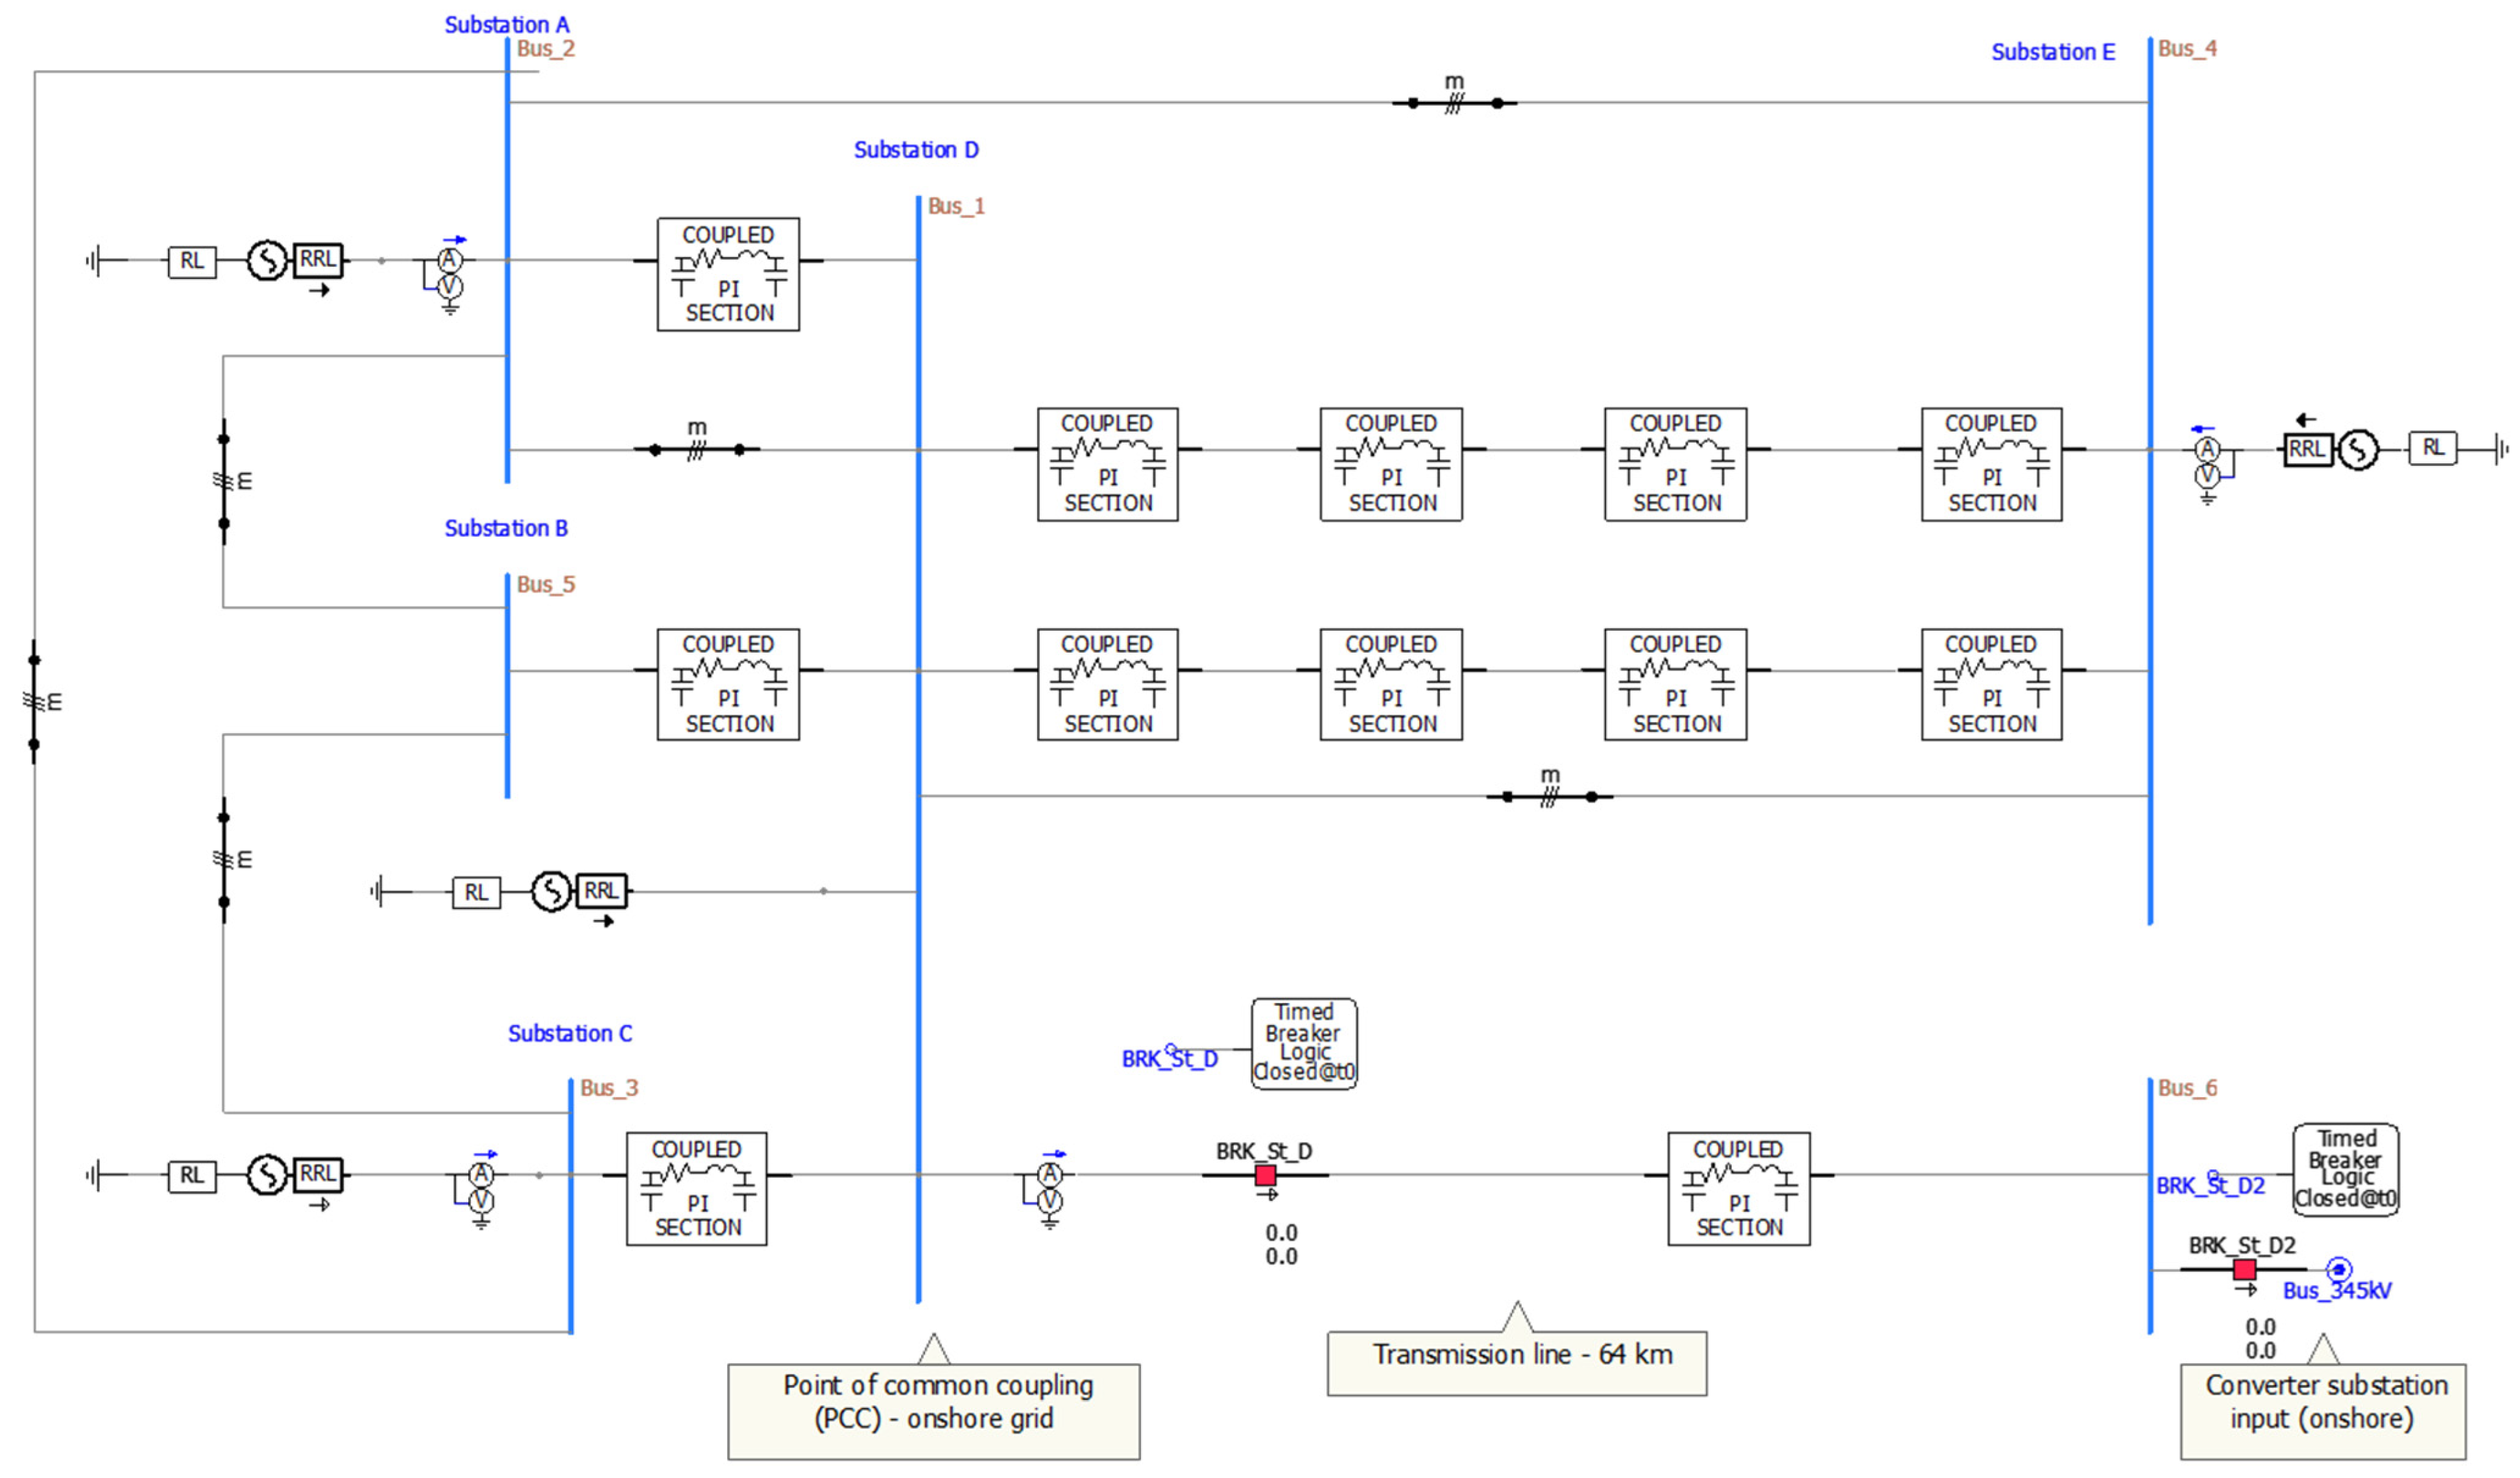
2. Case Study Description

The proposed system begins at a substation located on the mainland with an installed capacity of 1200 MVA and operating at voltage levels of 345 kV, 138 kV, and 13.8 kV, where the 345 kV bus is the point of common coupling (PCC) with Brazil’s integrated power system (National Integrated System, SIN). From this substation, a 64 km extra-high-voltage transmission line (345 kV) supplies energy to the coast, where it connects to the converter substation by means of two transformers with three windings of 345, 82.5, and 13.8 kV, 200 MVA each. The secondaries of these transformers are connected to rectifier stations, which interconnect with the necessary equipment for the conversion to a direct voltage of ±150 kV DC, while the tertiary ones are responsible for supplying the auxiliary service loads of these stations. The HVDC transmission is designed to provide 300 MW at 150 kV DC, totaling approximately 236 km of DC submarine cables. These cables are received at an energy hub platform, which will supply energy to the distribution system through two three-winding transformers of 82.5, 66, and 13.8 kV, 200 MVA each. The primary windings, at 82.5 kV, are connected to the inverter units. The modeled distribution system represents a 66 kV AC shunting yard from which six feeders are derived to serve the production units (FPSO). These feeders are in radial arrangements, using three-pole submarine cables, with different extensions for the distribution circuits in order to evaluate possible distances between the production units and the hub. Multiples of 10 km sections (10, 20, 30, 40, 50, and 60 km) are used, allocating 50 MW to each FPSO, as shown in Figure 1.
The present case study was developed using PSCAD (Power Systems Computer Aided Design) software, version 5.0.1. This tool, which is based on the EMTDC (electromagnetic transients including DC) simulation program for electromagnetic transient analysis, allowed us to evaluate several system operation scenarios under both steady-state and contingency conditions, as well as an assessment of the layout’s technical feasibility.

2.1. Integration with the SIN

The representation of the SIN in the region of interest on the mainland was carried out using PSCAD software, based on information extracted from [16]. This representation, shown in Figure 2, considers an equivalent electrical network capable of sustaining the voltage at 345 kV in the PCC. For the Thevenin equivalent models of the system, voltage sources behind the impedances were used, considering the maximum short-circuit condition of the system. In addition, its modules and angles were adjusted to reproduce the real loading condition of the SIN (power flow), thus representing the power contributions to the offshore system. In turn, the transmission lines of this system were modeled using the nominal PI model, specifically the Coupled PI Section model of PSCAD, with the positive and zero sequence parameters provided for a 10 km section. This representation of the transmission lines was applied to all lines of the SIN, including the one that connects to the converter substation.

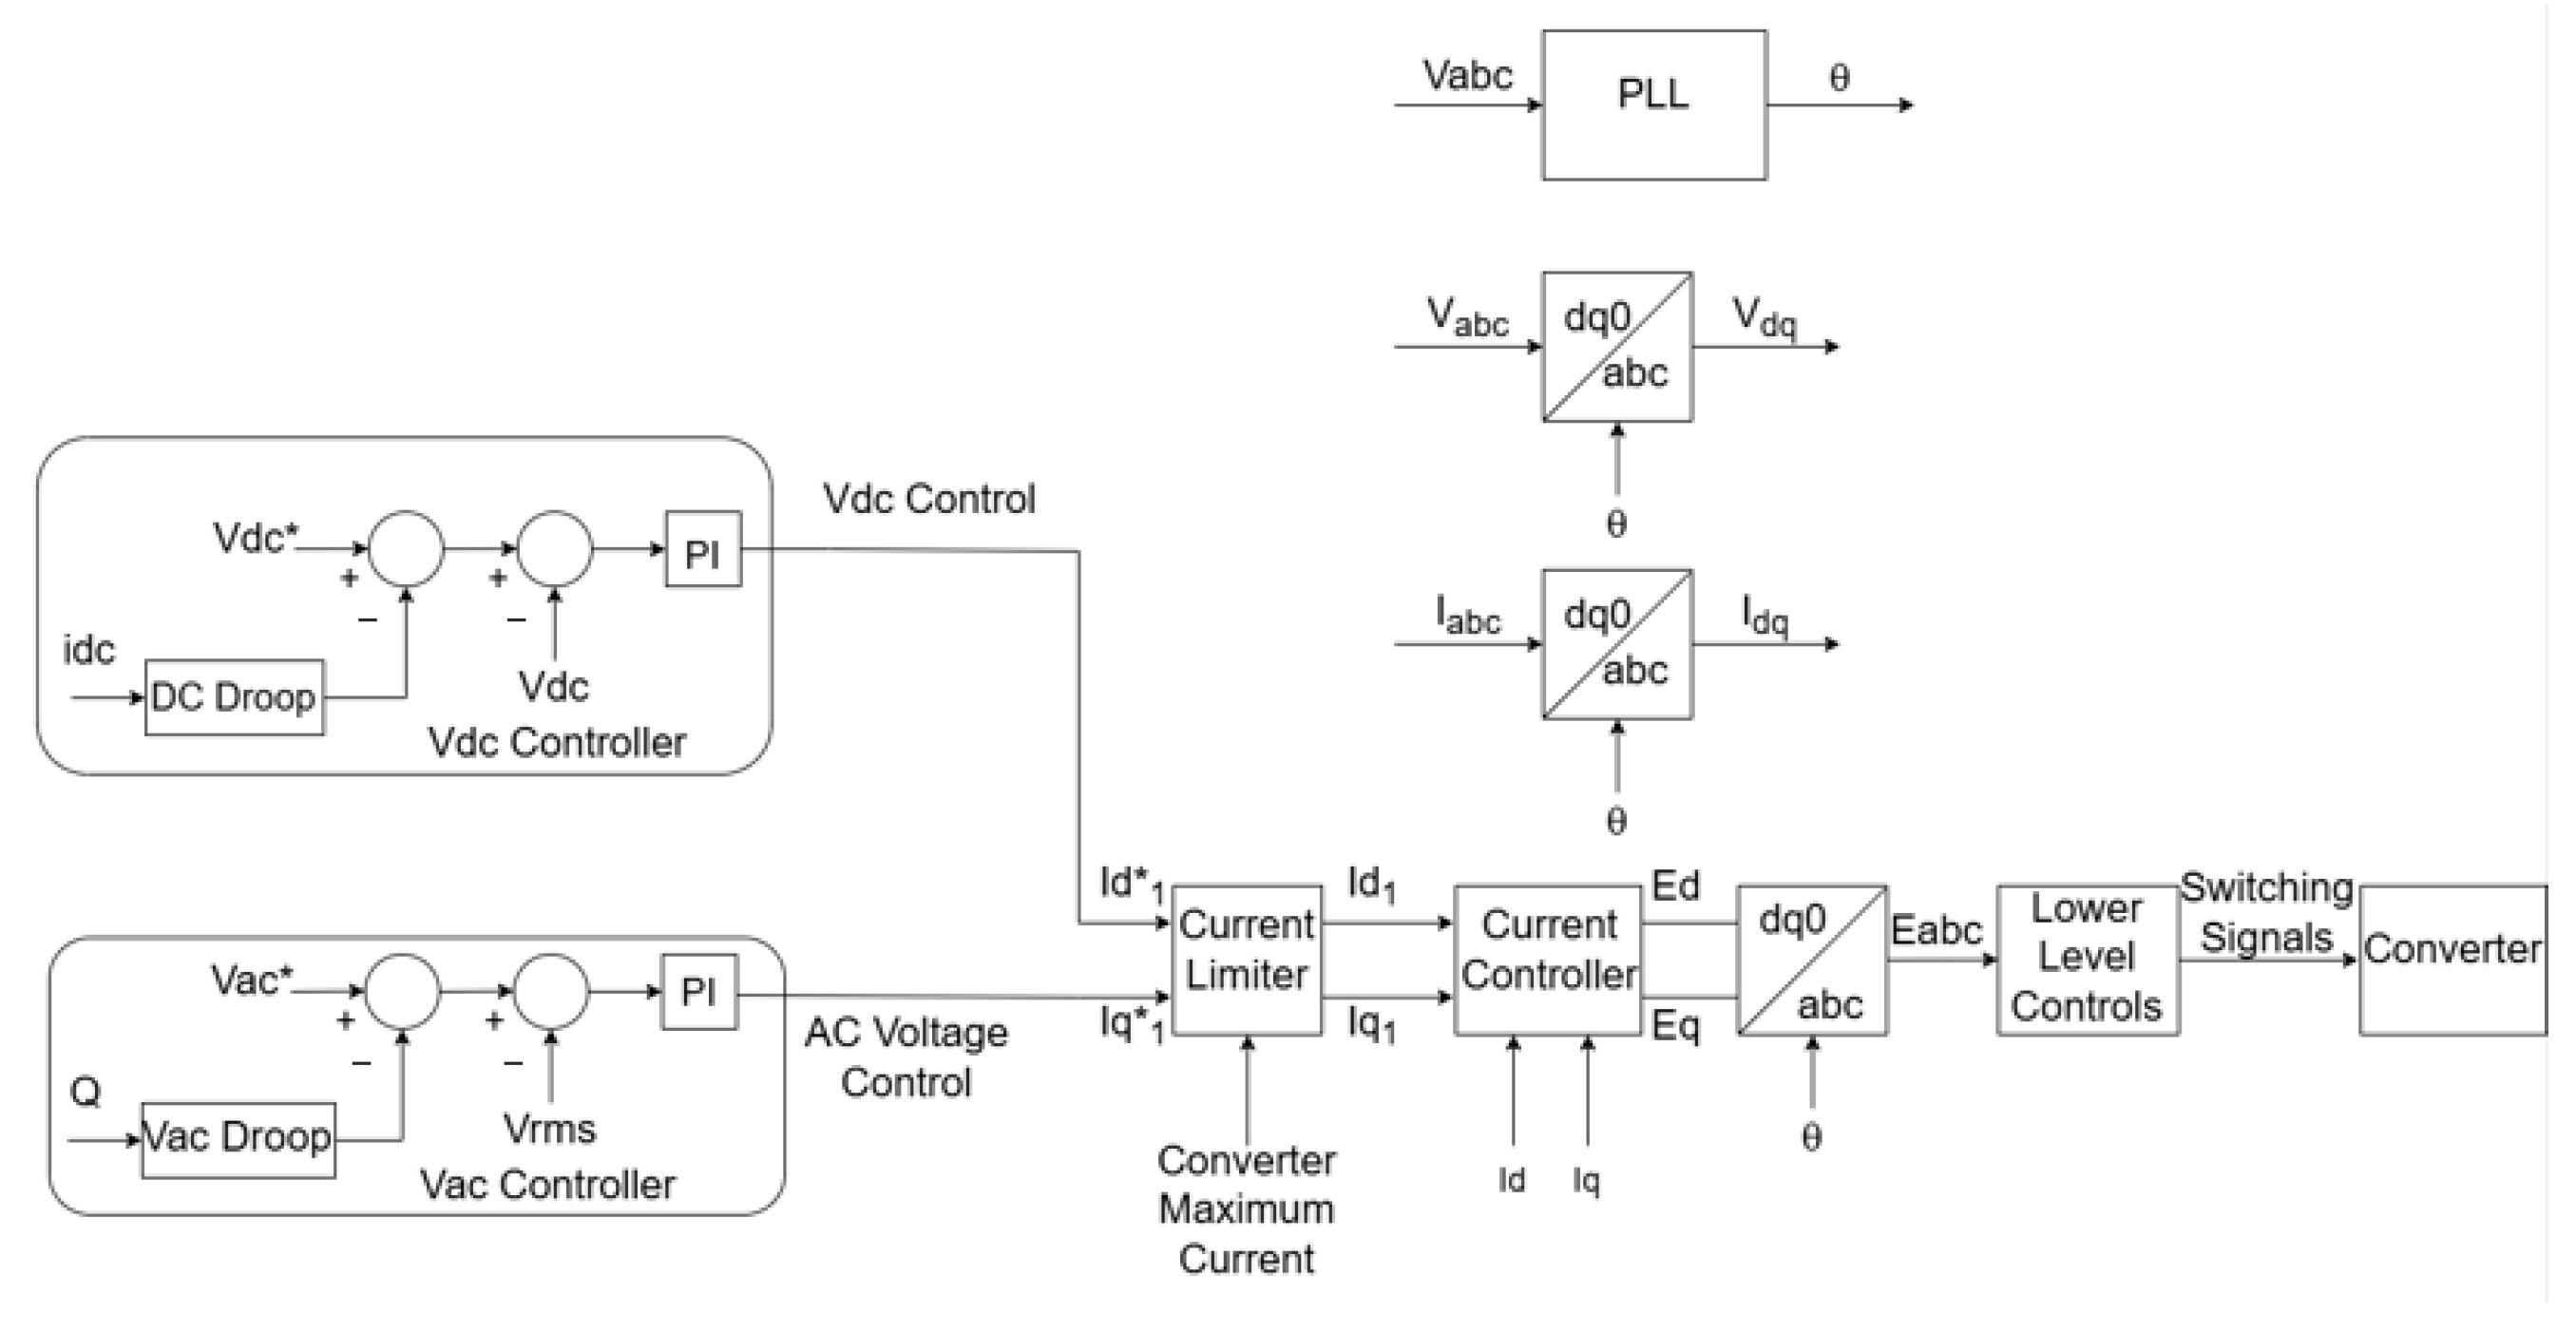
2.2. HVDC–VSC Link ± 150 kV

As can be observed in Figure 3, the HVDC system modeled in PSCAD consists of two conversion stations: one for transforming AC to DC, located on the coast (the rectifier substation), and another for returning DC to AC, located on the offshore platform (the inverter substation). Two single-core submarine cables with a cross-section of 1200 mm2 connected the two stations. In the rectifier substation, we find two three-winding transformers responsible for transforming and interconnecting the SIN to the HVDC system at voltage levels ranging from 345 to 82.5 kV, with the tertiary winding only being used for auxiliary services at 13.8 kV. Similarly, in the inverter substation, there are also two three-winding transformers responsible for connecting the HVDC system to the hub at voltage levels ranging from 82.5 to 66 kV, with their tertiary winding used for auxiliary services. Modeling of the three-winding transformers in the respective converter substations was performed in PSCAD using the three-phase three-winding transformer model, where the nominal power data, the winding connection, and the impedance parameters ZPS (from primary to secondary), ZPT (from primary to tertiary), and ZST (from secondary to tertiary) are used.
The topological and parametric configuration of the transmission complex makes use of an interconnection through a VSC-HVDC system. The main characteristic of the transmission network is its bipolar arrangement, i.e., there are two independently controlled asymmetric monopoles, with a nominal capacity of 200 MVA for each converter, employing an operational philosophy that includes the possibility of metallic return. The choice to use an MMC-VSC-HVDC voltage source converter was made because of its attractive characteristics in terms of reducing the number of components required while enhancing functionality, as well as contributing to the composition of the DC solution for the interconnection, resulting in a considerable reduction in computational effort. For the PSCAD modeling, the MMC (modular multi-level converter) library [17] was used, in accordance with the CIGRE Brochure B4.57 [18], based on submodule circuits in aggregated Thévenin/Norton equivalents of converter arms. Figure 4 presents this modeling strategy, in which the equivalent three-phase voltage of the MMC individual arms ( E a b c ) is obtained by (1), (2), and (3).
E a b c t = i = 1 N E s m i t = R v e q · I v , a b c t + E a b c , e q t t ,
R v e q t = i = 0 N R s m e q i t
E a b c , e q t t = i = 0 N E s m e q i t t
The relationship between the voltages at the inverter output terminals and the primary side of the transformer is obtained by (4):
E a E b E c = R a r m · i a i b i c + L a r m · d d t i a i b i c + V a V b V c
where V a , V b , and V c are phase voltages a , b , and c at the terminals on the transformer’s primary side; E a , E b , and E c are the voltages generated at the inverter output terminals; i a , i b , and i c are the currents flowing between the inverter and the power grid; and R a r m and L a r m represent the total resistance and inductance of the output filter, respectively. Applying the Park transformation to (4), Equations (5) and (6) are obtained, which represent the voltage balance at the inverter output terminals in the dq0 reference frame:
V d = E d R f I d L f d I d d t + ω L f I q
V q = E q R f I q L f d I q d t + ω L f I d
where V d and V q are the direct-axis and quadrature-axis voltages at the transformer’s primary side, respectively; E d and E q are the direct-axis and quadrature-axis voltages generated by the inverter; I d and I q are the direct-axis and quadrature-axis currents circulating within the system; and ω represents the angular frequency of the power grid. Based on these considerations, the components V d and V q are defined as (7) and (8), respectively. Consequently, the instantaneous active ( p ) and reactive ( q ) powers are expressed by (9) and (10), respectively.
V d = V
V q = 0
p = 3 2 V I d
q = 3 2 V I q
The phase-shift modulation (PS-PWM) strategy was used based on the definition of the trigger pulses and with a range of possibilities in the switching strategy, which may vary depending on the submodule topology and switching loss requirements of the converter, among other aspects. Regarding the control strategy in the rectifier station, the regulation of the DC link voltage module (Vdc Control) and the voltage regulation module at a specified grid bus (VCA Control) were selected, based on the Grid-Following control mode, shown in Figure 5. A Phase Locked Loop (PLL) technique is employed to synchronize the converter-generated voltages with the AC grid, obtaining the phase angle at the PCC, thus enabling precise control of the current injected into the grid.
For the inverter station, a Grid-Forming Mode (GFM) control strategy was used. Figure 6 illustrates the control strategies designed to regulate the AC frequency and voltage at the offshore production unit. In this operational mode, the inverters function as voltage sources, establishing the system frequency and voltage downstream of the HVDC interconnection by balancing the active and reactive powers delivered to the offshore grid. A commonly adopted control technique for achieving this objective is droop control [19,20], which facilitates synchronization and load sharing among multiple generation units. These control functionalities in both the rectifier and inverter stations were selected based on the operational requirements defined by the project developed here.
The electrical parameters of the submarine DC cable were estimated to a level of accuracy that was sufficient for study and simulation purposes, using the analytical model based on the frequency domain developed by Chien and Bucknall [21]. Through the development of this model in MathCad® Prime 10 software, the resistance, inductance, and capacitance parameters of the DC cables were determined. Based on the obtained results, a good correlation between the quantities was found when compared with other methodologies associated with the PSCAD model (Wedepohl and Wilcox [22], Saad, Gaba, and Giroux [23]) and EMTP-RV® (Pollaczeck [24]). For the studies carried out here, the PI model, as established in PSCAD, was considered a suitable option with which to compose both the negative and positive pole cables and the metallic return of the bipolar HVDC system.

2.3. Distribution System
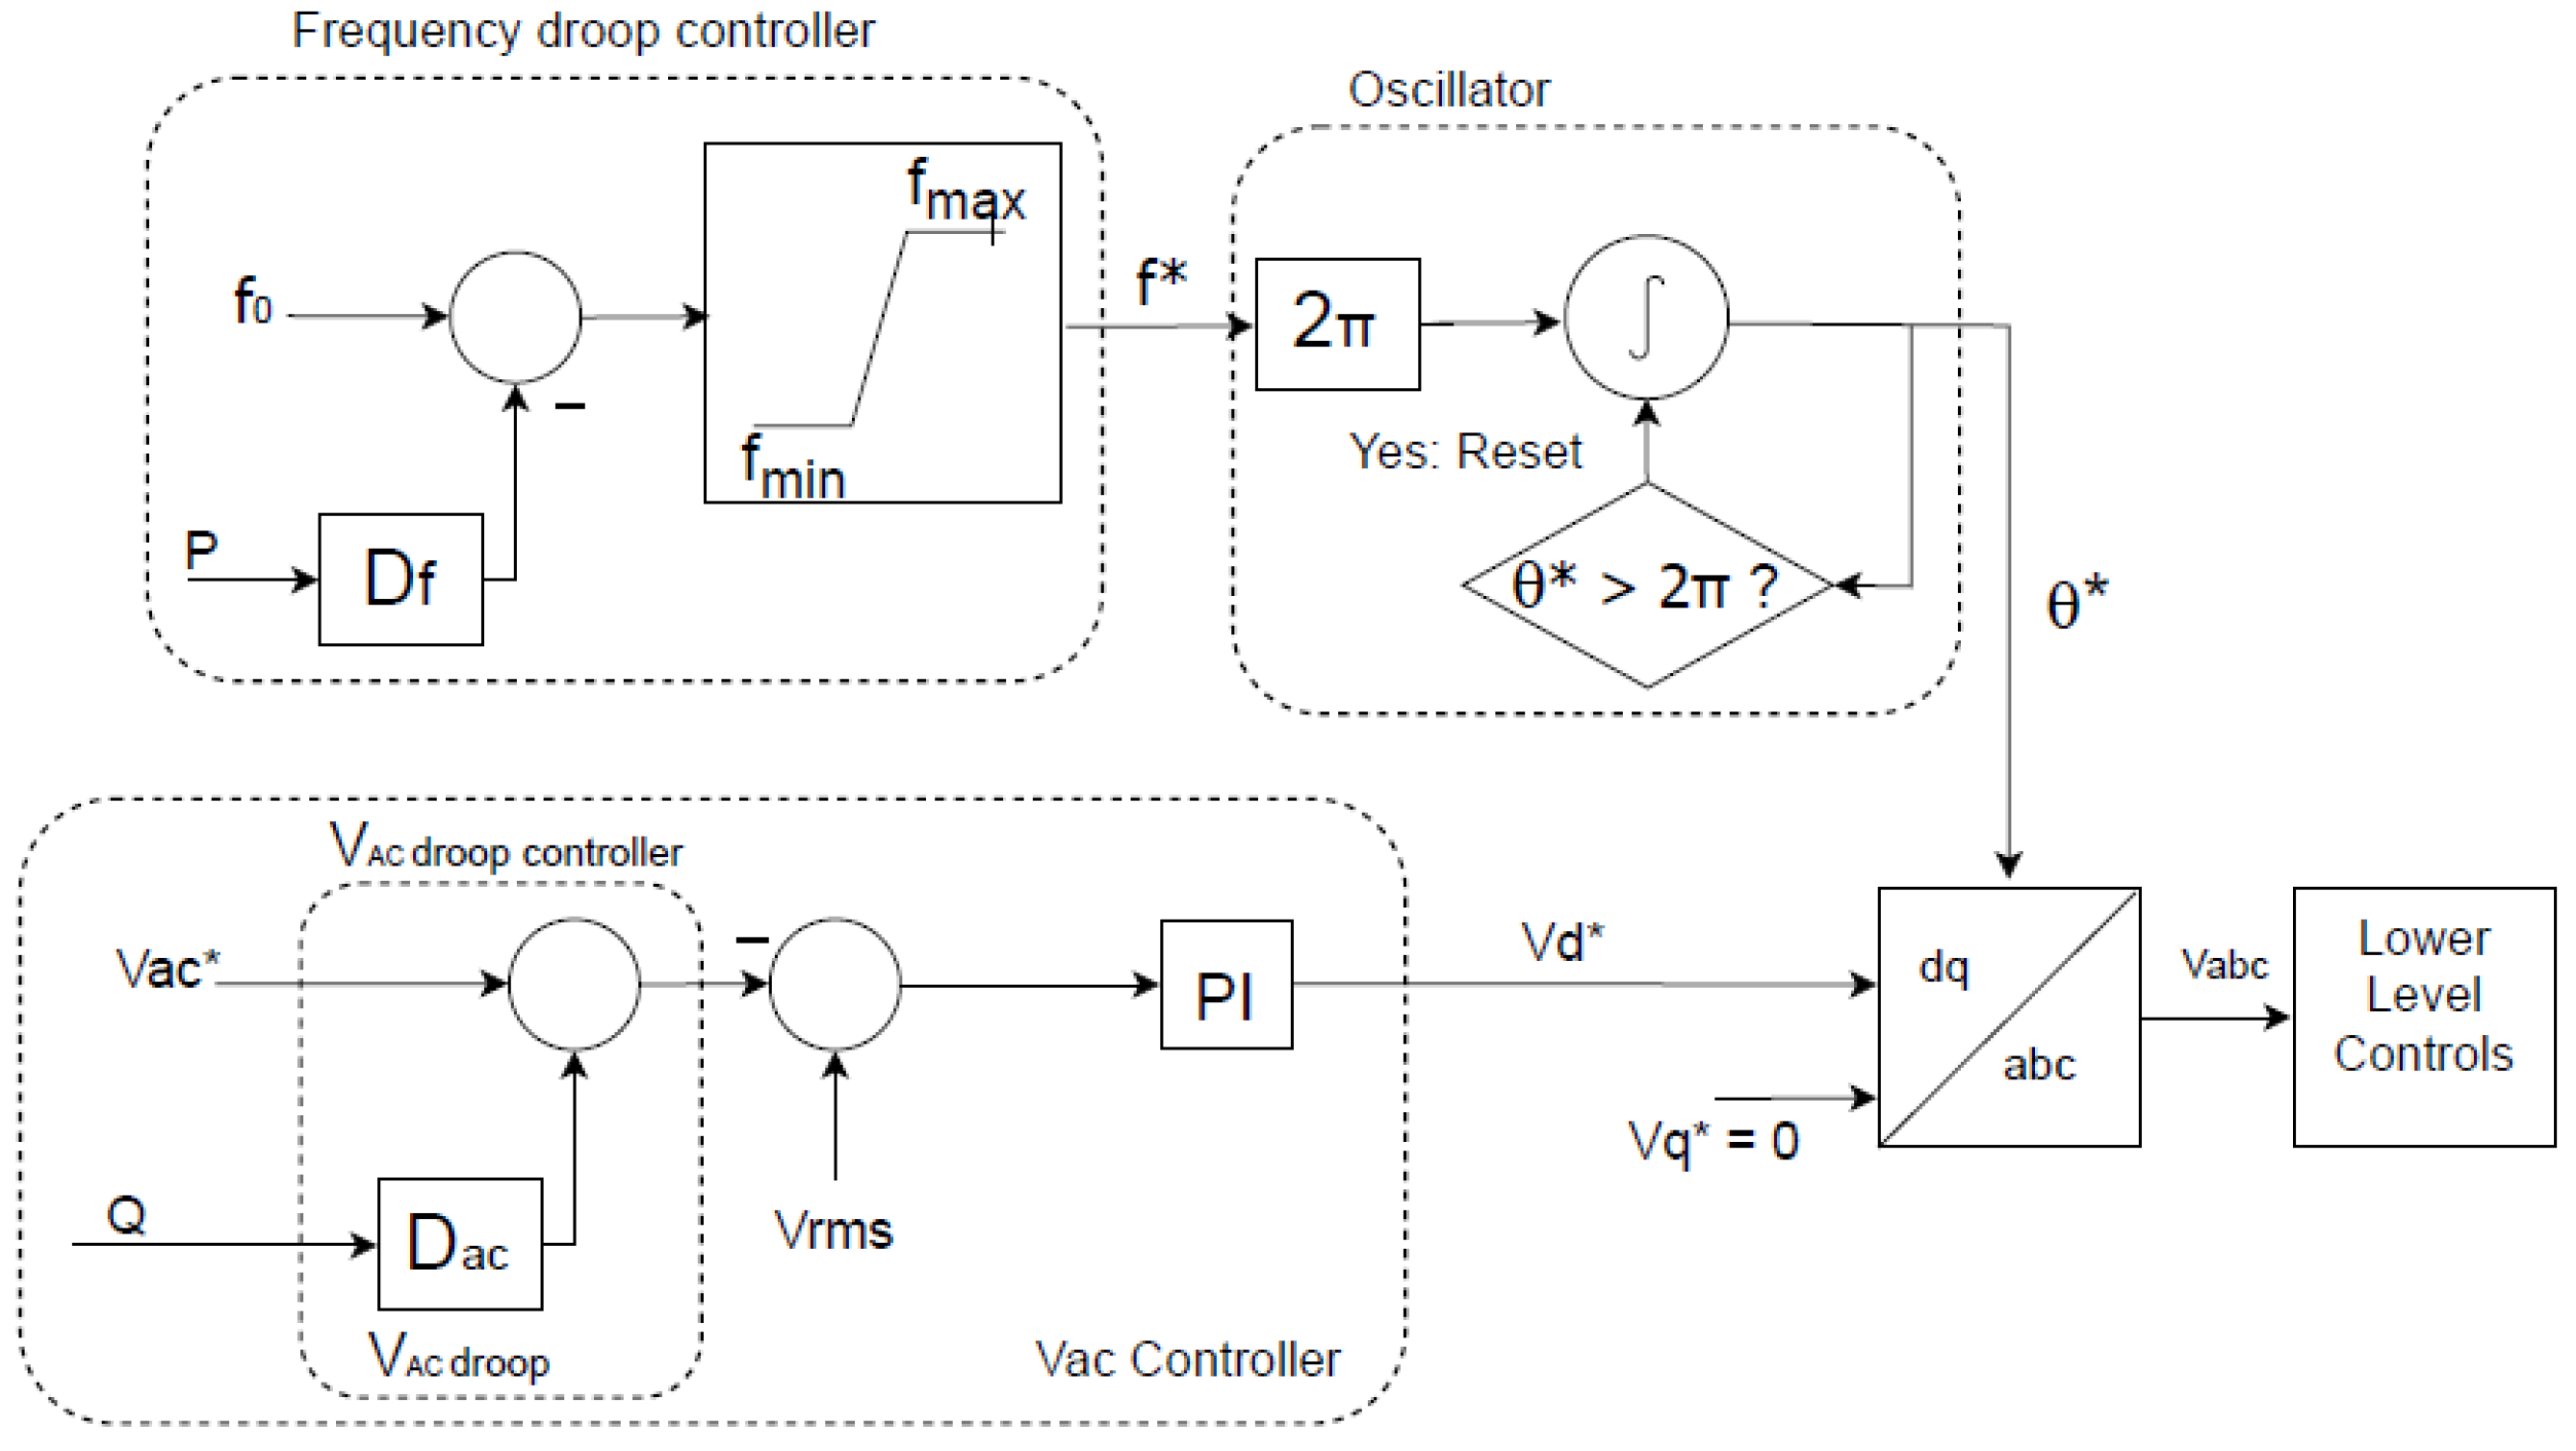
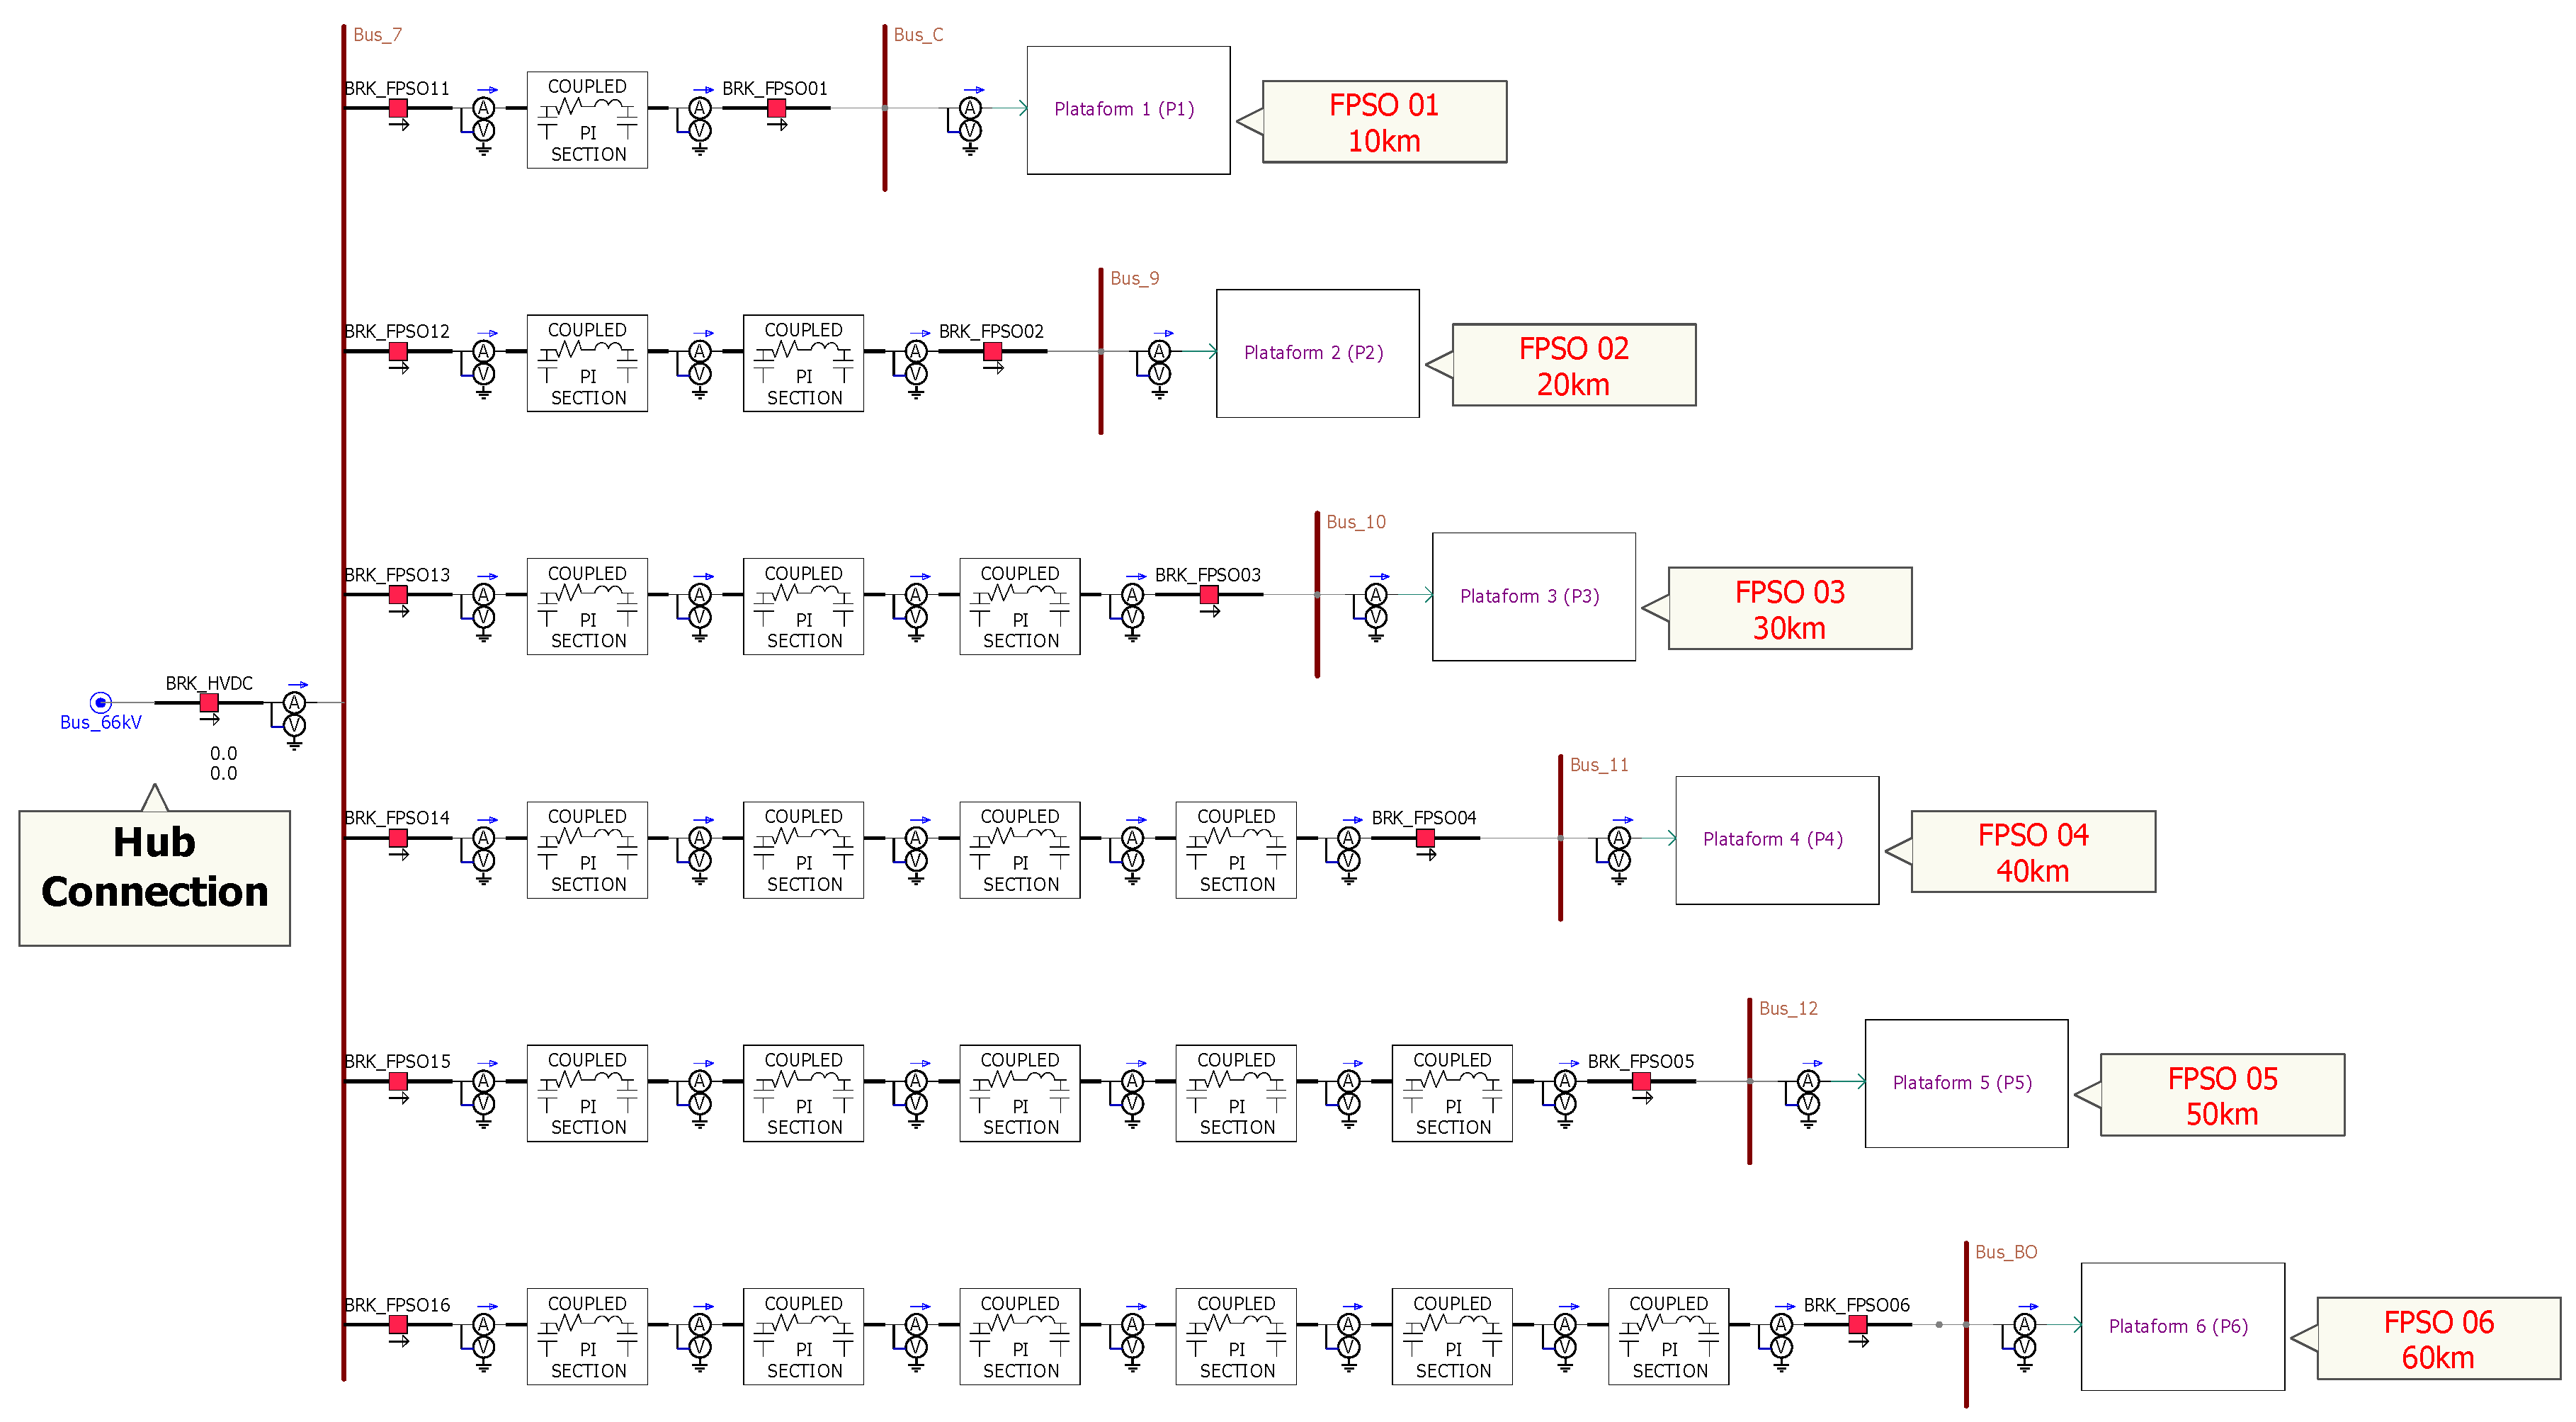
The three-phase circuit at 66 kV, with submarine cables for the distribution network between the hub and the platforms, was represented by PI sections, since these are short distances, and the studies were conducted in the frequency domain. However, to monitor the voltages and currents in the middle of the circuit, a cascade arrangement was chosen with one PI for every 10 km, as shown in Figure 7. For the PI model, the resistance, inductance, and capacitance were obtained directly from the cable manufacturer’s catalogs [25].

2.4. FPSO Units

The FPSO-type offshore platform unit used in Brazil usually has its own generation system, with four turbogenerators connected in parallel. These are the only sources of energy to supply the entire demand of the FPSO unit. Under normal conditions, this generation system operates with three generators while the fourth is on standby. In the present work, the new integration topology with the HVDC seeks to minimize local generation, proposing a generation system with two turbogenerators of 31.25 MVA, 13.8 kV, and 60 Hz adjusted to provide 16 MW each. To supply the platform’s total demand (82 MW), 50 MW is imported from the SIN by the HVDC system through a 66/13.8 kV, 70 MVA transformer, which is connected to the submarine circuit coming from the hub.
The synchronous generator (SG) model follows the methodology described by the authors of [26], which was validated in the real-time digital simulator (RTDS) and replicated in PSCAD. Figure 8a presents a complete representation of the SG model and its respective controls in PSCAD. The model contemplates the inertia of the turbine assembly represented by the multi-mass block (MM), with the electrical torque (Te) and speed (w) signals continuously exchanged between the MM and SG systems. The w signal is processed by the speed control loop embedded inside the “governor” block, which, in turn, provides the mechanical torque signal (Tm) to the MM system. Similarly, the SG sends terminal voltage (Vt) and field current (If) signals to the automatic voltage regulator (AVR) control loops allocated within the “excitation” block, and as a result of this control, such loops return the excitation voltage (Ef) signal to the SG. Basically, the AVR has the function of providing the DC current required for the SG field winding in order to keep the terminal voltage close to the rated value, and control and protection functions are also assigned. In general terms, the FPSO unit AVR consists of five main elements: the exciter, the main voltage control, the load compensator, the power stabilizer, and the limiters—the over-excitation (OEL), under-excitation (UEL), and under-frequency (UF) limiters. These limiters correspond to auxiliary loops that make up the input of the AVR main loop, consisting of a proportional–integral–derivative (PID) control, which accords with the IEEE AC5A standard model [27]. It should be noted that, in the model proposed in [26], evaluating the isolated operation of the FPSO system, the reference voltage (Vref) desired at the machine terminals is considered to be the only quantity to be controlled in the AVR main loop. However, for the present case of integrated operation of the FPSO system with the SIN, it was necessary to establish coordination in the reactive power control between the SG excitation system and the inverter station of the HVDC system. Thus, the original loop AVR was adapted to consider the desired power factor reference at the machine terminals as the main variable to be controlled by the excitation system.
Each FPSO has a total demand of approximately 82 MW, while its distribution system is mainly composed of large three-phase induction motors representing gas compressors and water injection pumps with nominal capacities of 11 MW and 5.7 MW, respectively, which are distributed along two busbar sections (A and B) at 13.8 kV, as can be observed in Figure 9. The Wound Rotor Induction Machine model was used in PSCAD, with the “external connection to rotor” option enabled to access the rotor circuit, thus allowing its resistance to vary dynamically as a function of the square of the speed, as shown in Figure 8b. This model represents an adaptation of the model proposed by the authors of [28]. The smaller loads, supplied at low voltage and used in administrative operations, and the smaller motors, the dynamics of which are not crucial, were modeled as constant PQ loads.

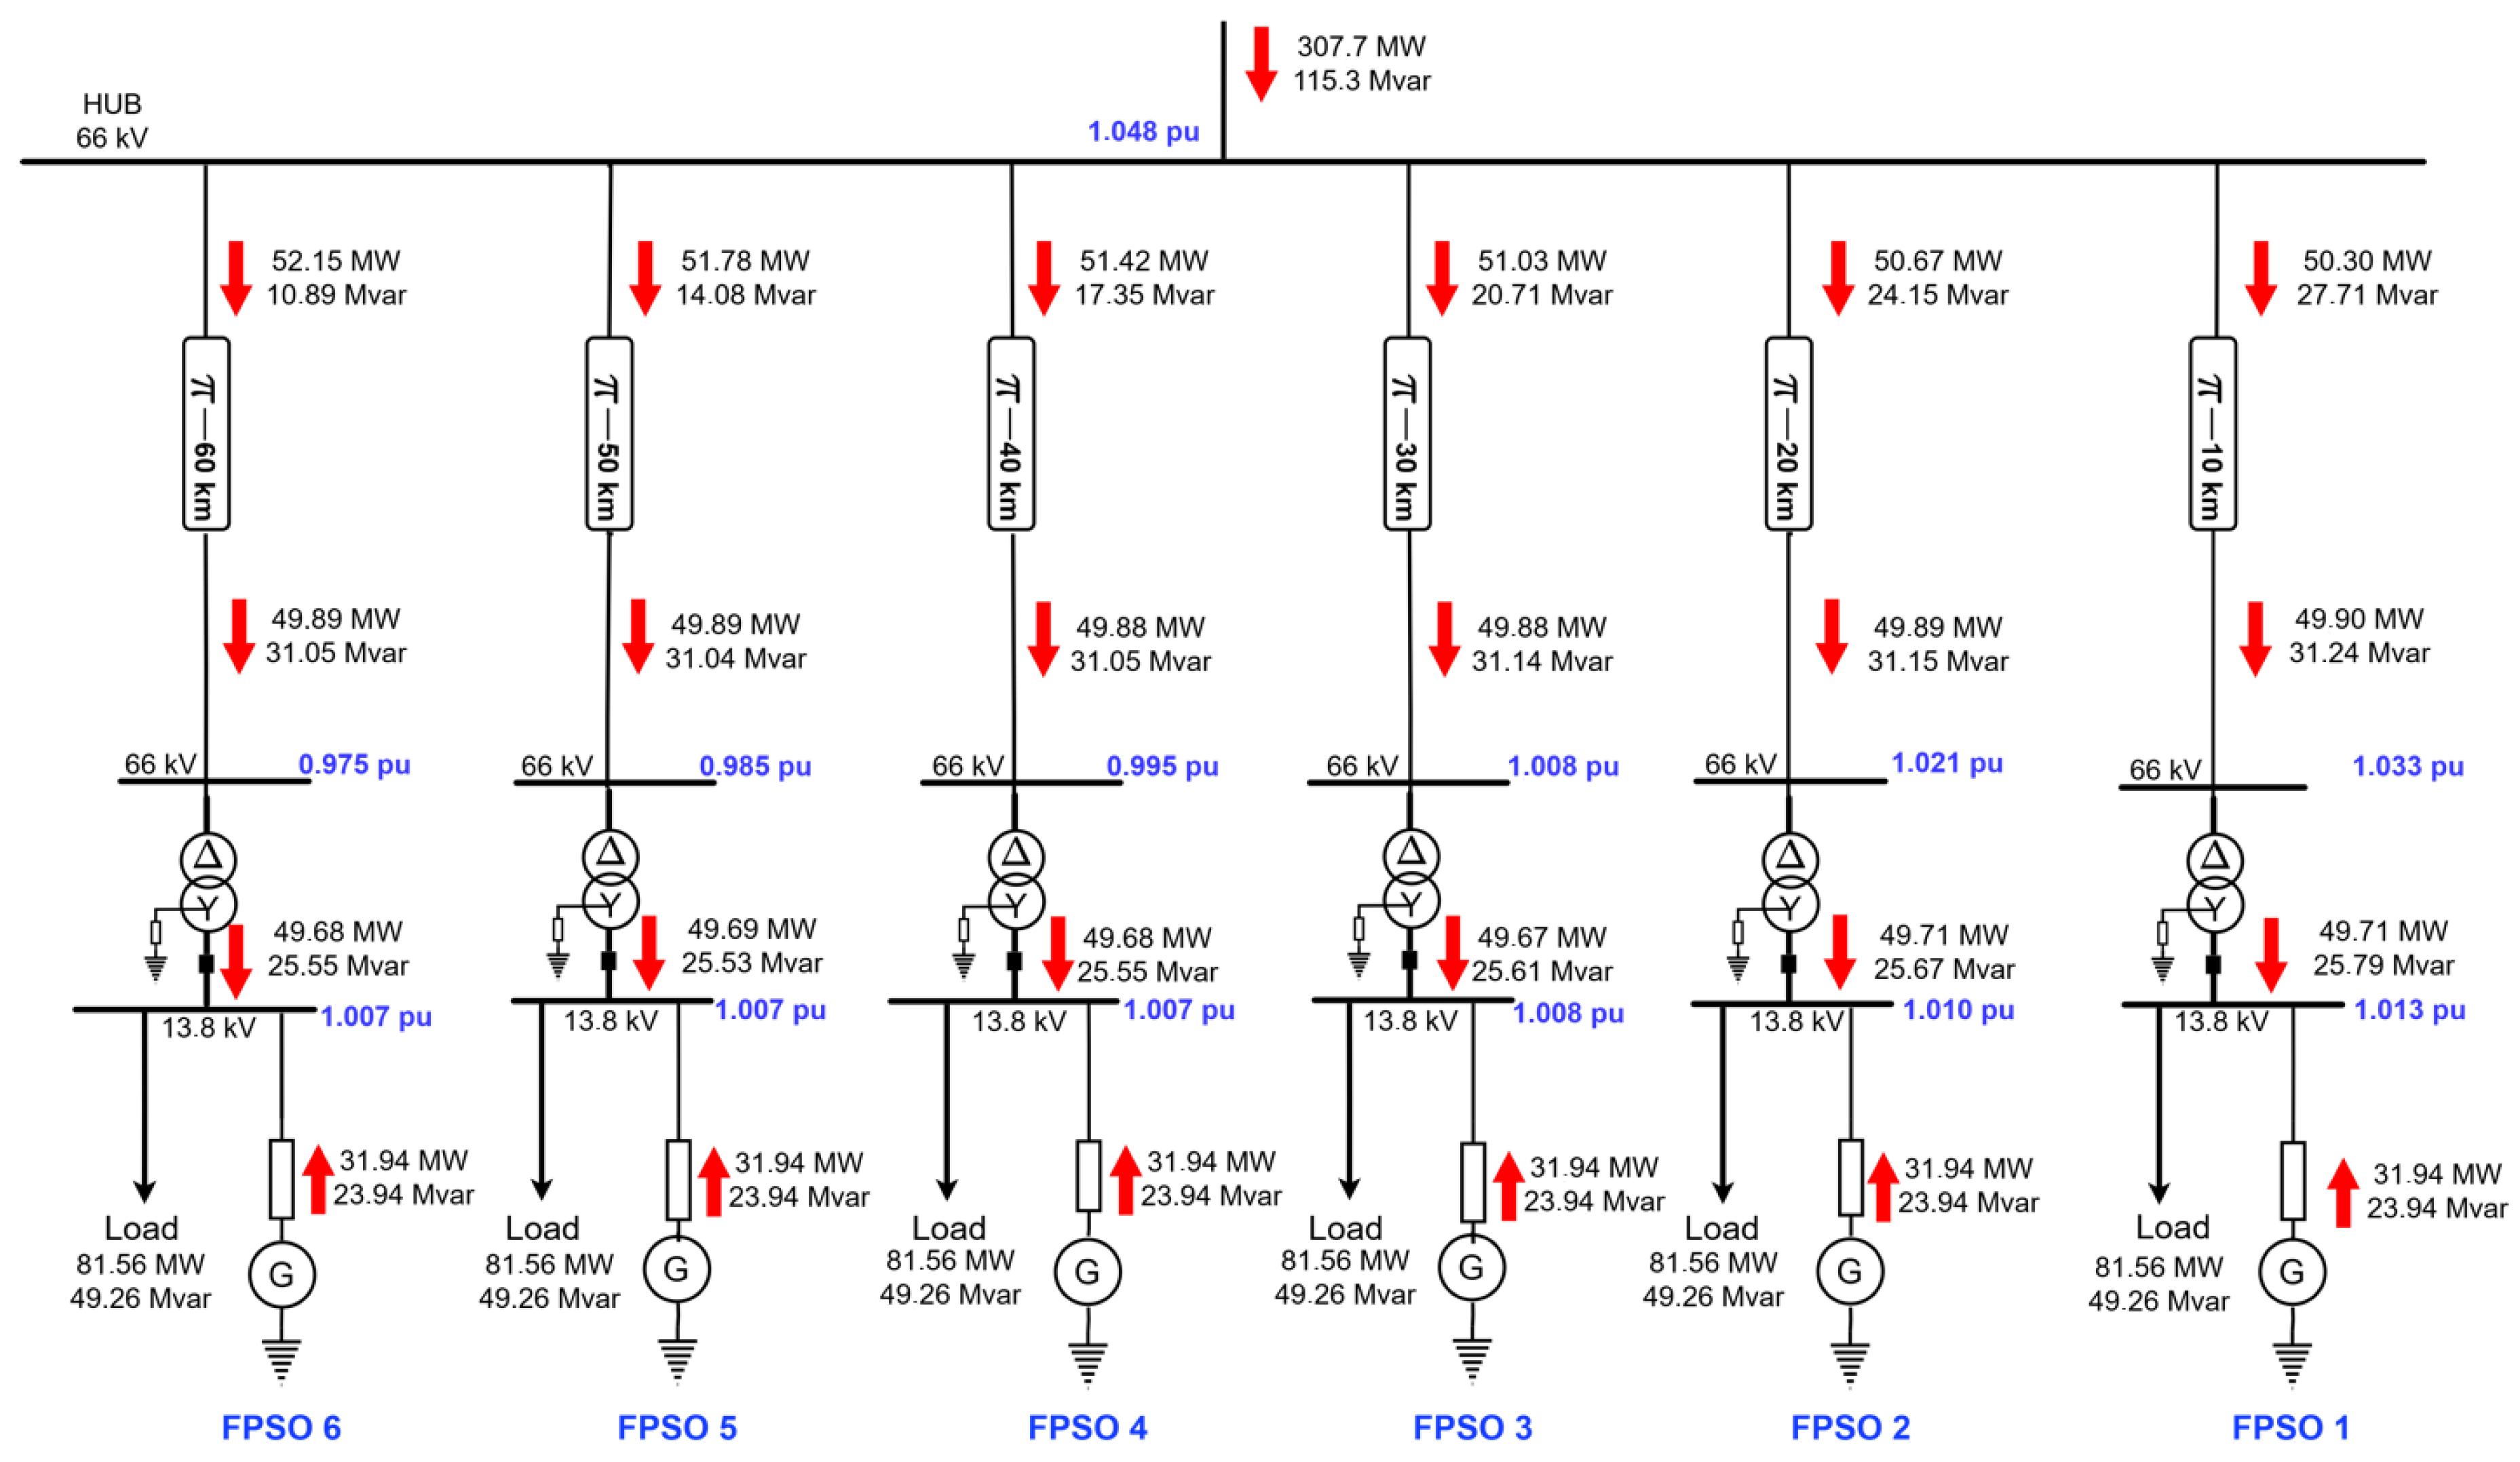
3. Steady Power Flow: Benchmark

This section indicates some characteristics of the proposed electrical system, as well as the results of the load flow analysis under the established conditions. These results allow a better evaluation of the operating system through contingency scenarios, which can then be compared with the normative values of IEC 61892-1 [14], which are highlighted in Table 1.
Figure 10 shows the power flow in the system, noting an active power flow of 340.7 MW demanded from the SIN to the supply system of the 6 FPSO units and recognizing that part of this demand is distributed among the loads of each FPSO, the auxiliary services of the rectifier and inverter stations, and losses in the transmission and distribution systems. The DC link voltage remains constant and regulated for both poles of the rectifier. The RMS voltage at the input bus, at 345 kV, is constantly maintained at 0.999 pu by the rectifier control, which adjusts the exchange of reactive power with the SIN to achieve this target. Accordingly, a reactive power flow from the AC network to the rectifier station of 31.99 Mvar (16.00 + 15.99) is established. Regarding the voltage at the inverter unit input (DC link), there is a drop along the line, reaching 0.988 pu. Meanwhile, the RMS voltage at the 66 kV (AC) busbar is set by the inverter unit at 1.048 pu because of the reactive power flow adjustment from the converter to the distribution network, totaling 115.3 Mvar, to supply the load and regulate the voltage level of the FPSO unit.
Figure 11 shows the power flow in the 66 kV distribution network, and we can see that of the 307.7 MW delivered by the inverter unit at the 66 kV bus, 298.4 MW is used to supply the FPSO loads, while 9.56 MW is associated with distribution network losses. On the other side, the reactive power of 115.3 Mvar injected by the inverter unit at the 66 kV bus establishes a reactive power flow in the network that ensures voltages of around 1.0 pu. In the case of the power supplied to the FPSO units, both from the SIN interconnection and the generation system, all synchronous generation units supplied reactive power in compliance with a power factor of 0.8, with the total demand per FPSO being 81.56 MW and 49.26 Mvar.

4. Simulation Results and Discussion

To verify whether the proposed arrangement and parametric structure for the electrification of a platform, as well as for the entire archipelago complex supplied by an HVDC module connected to the onshore system, can operate satisfactorily from an electrical perspective, ensuring safe and optimal performance, a number of scenarios were evaluated. These scenarios considered the wide range of options for studies involving dynamic and transient phenomena, addressing situations that are feasible in real field conditions. As such, these test events were investigated by grouping the selected cases into four groups on the basis of their sharing common physical characteristics.

4.1. Events Associated with the 345 kV Substation

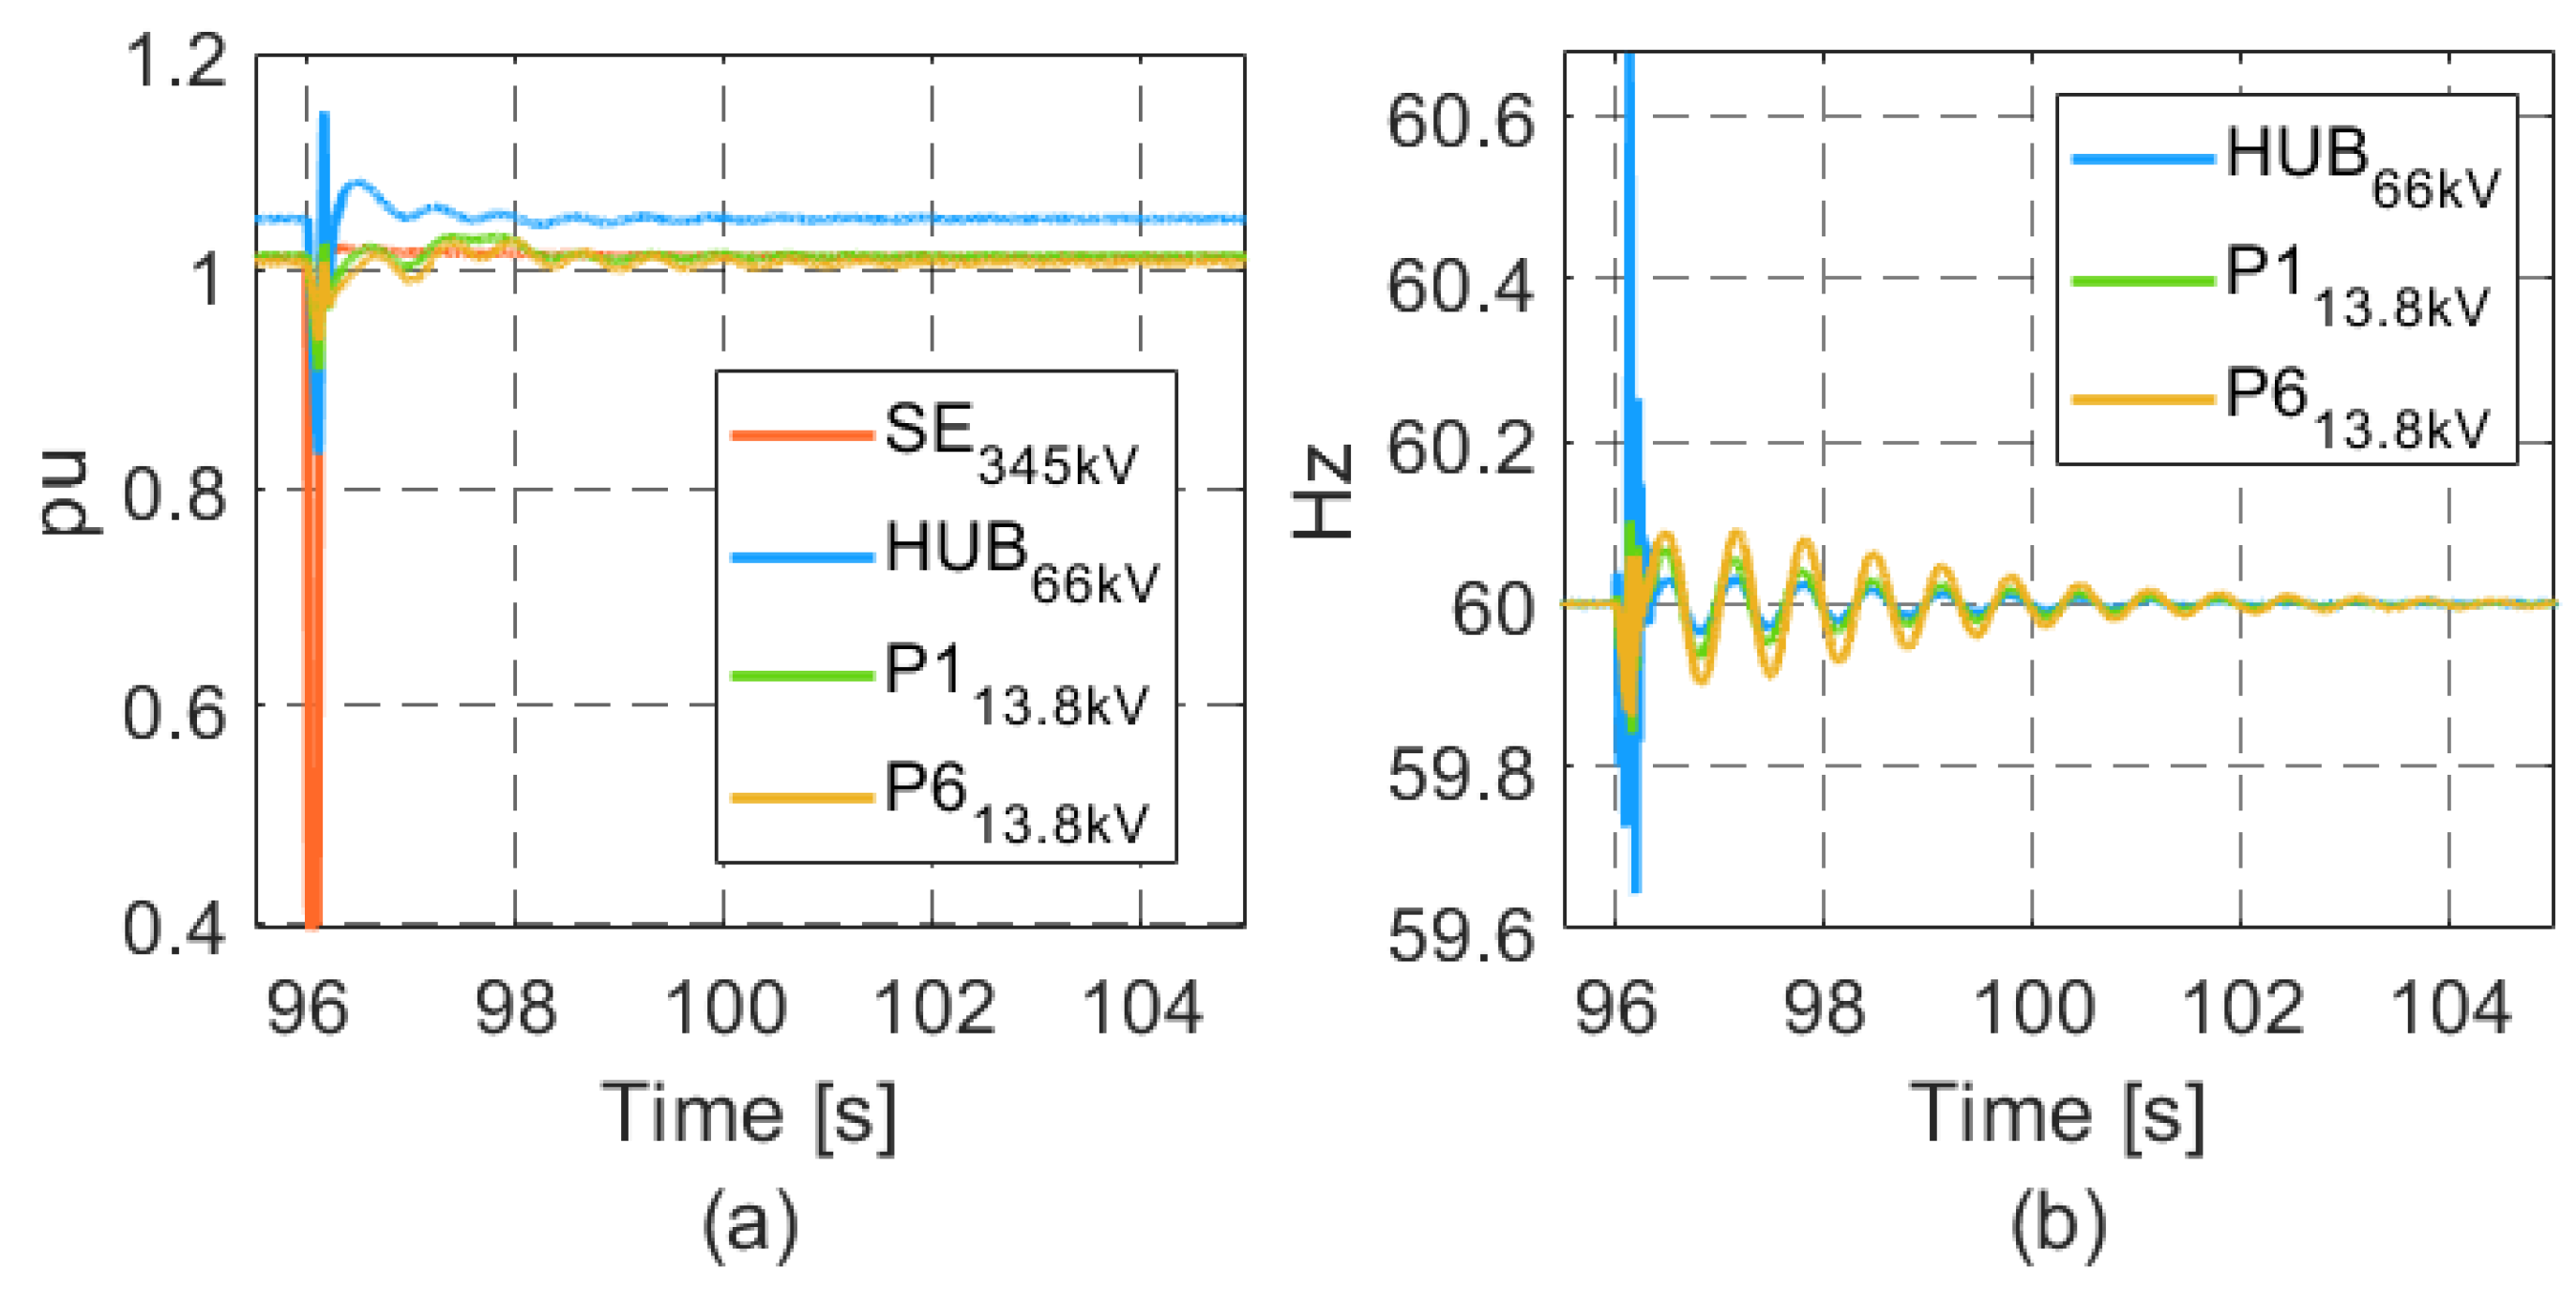
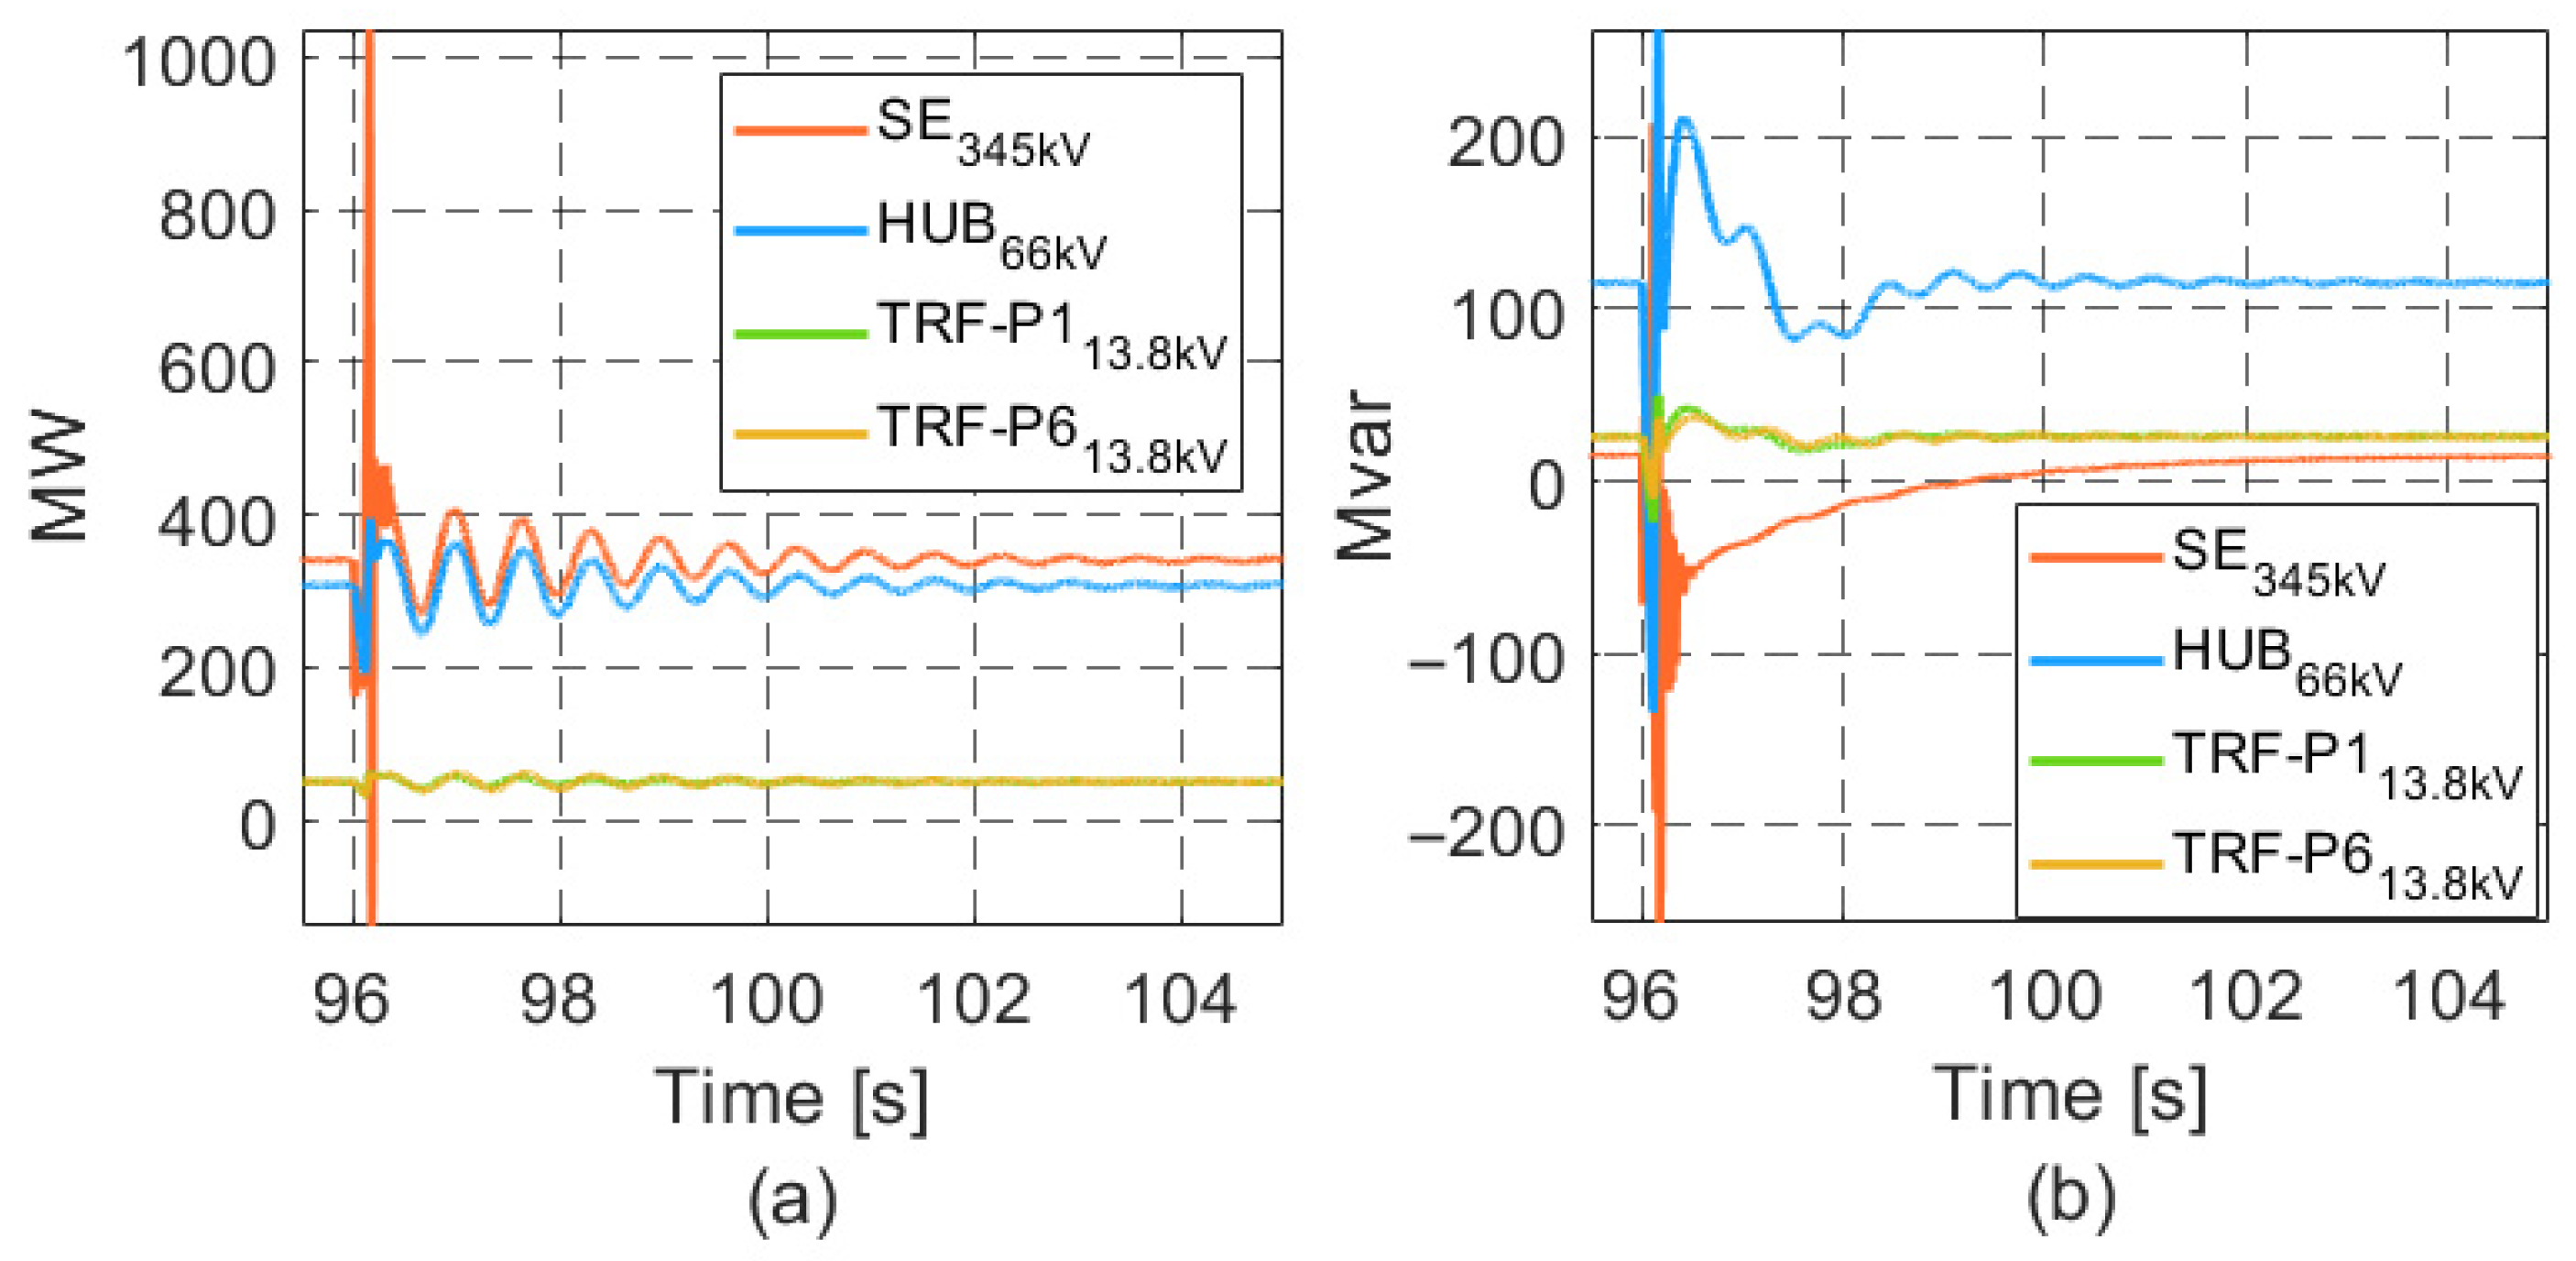
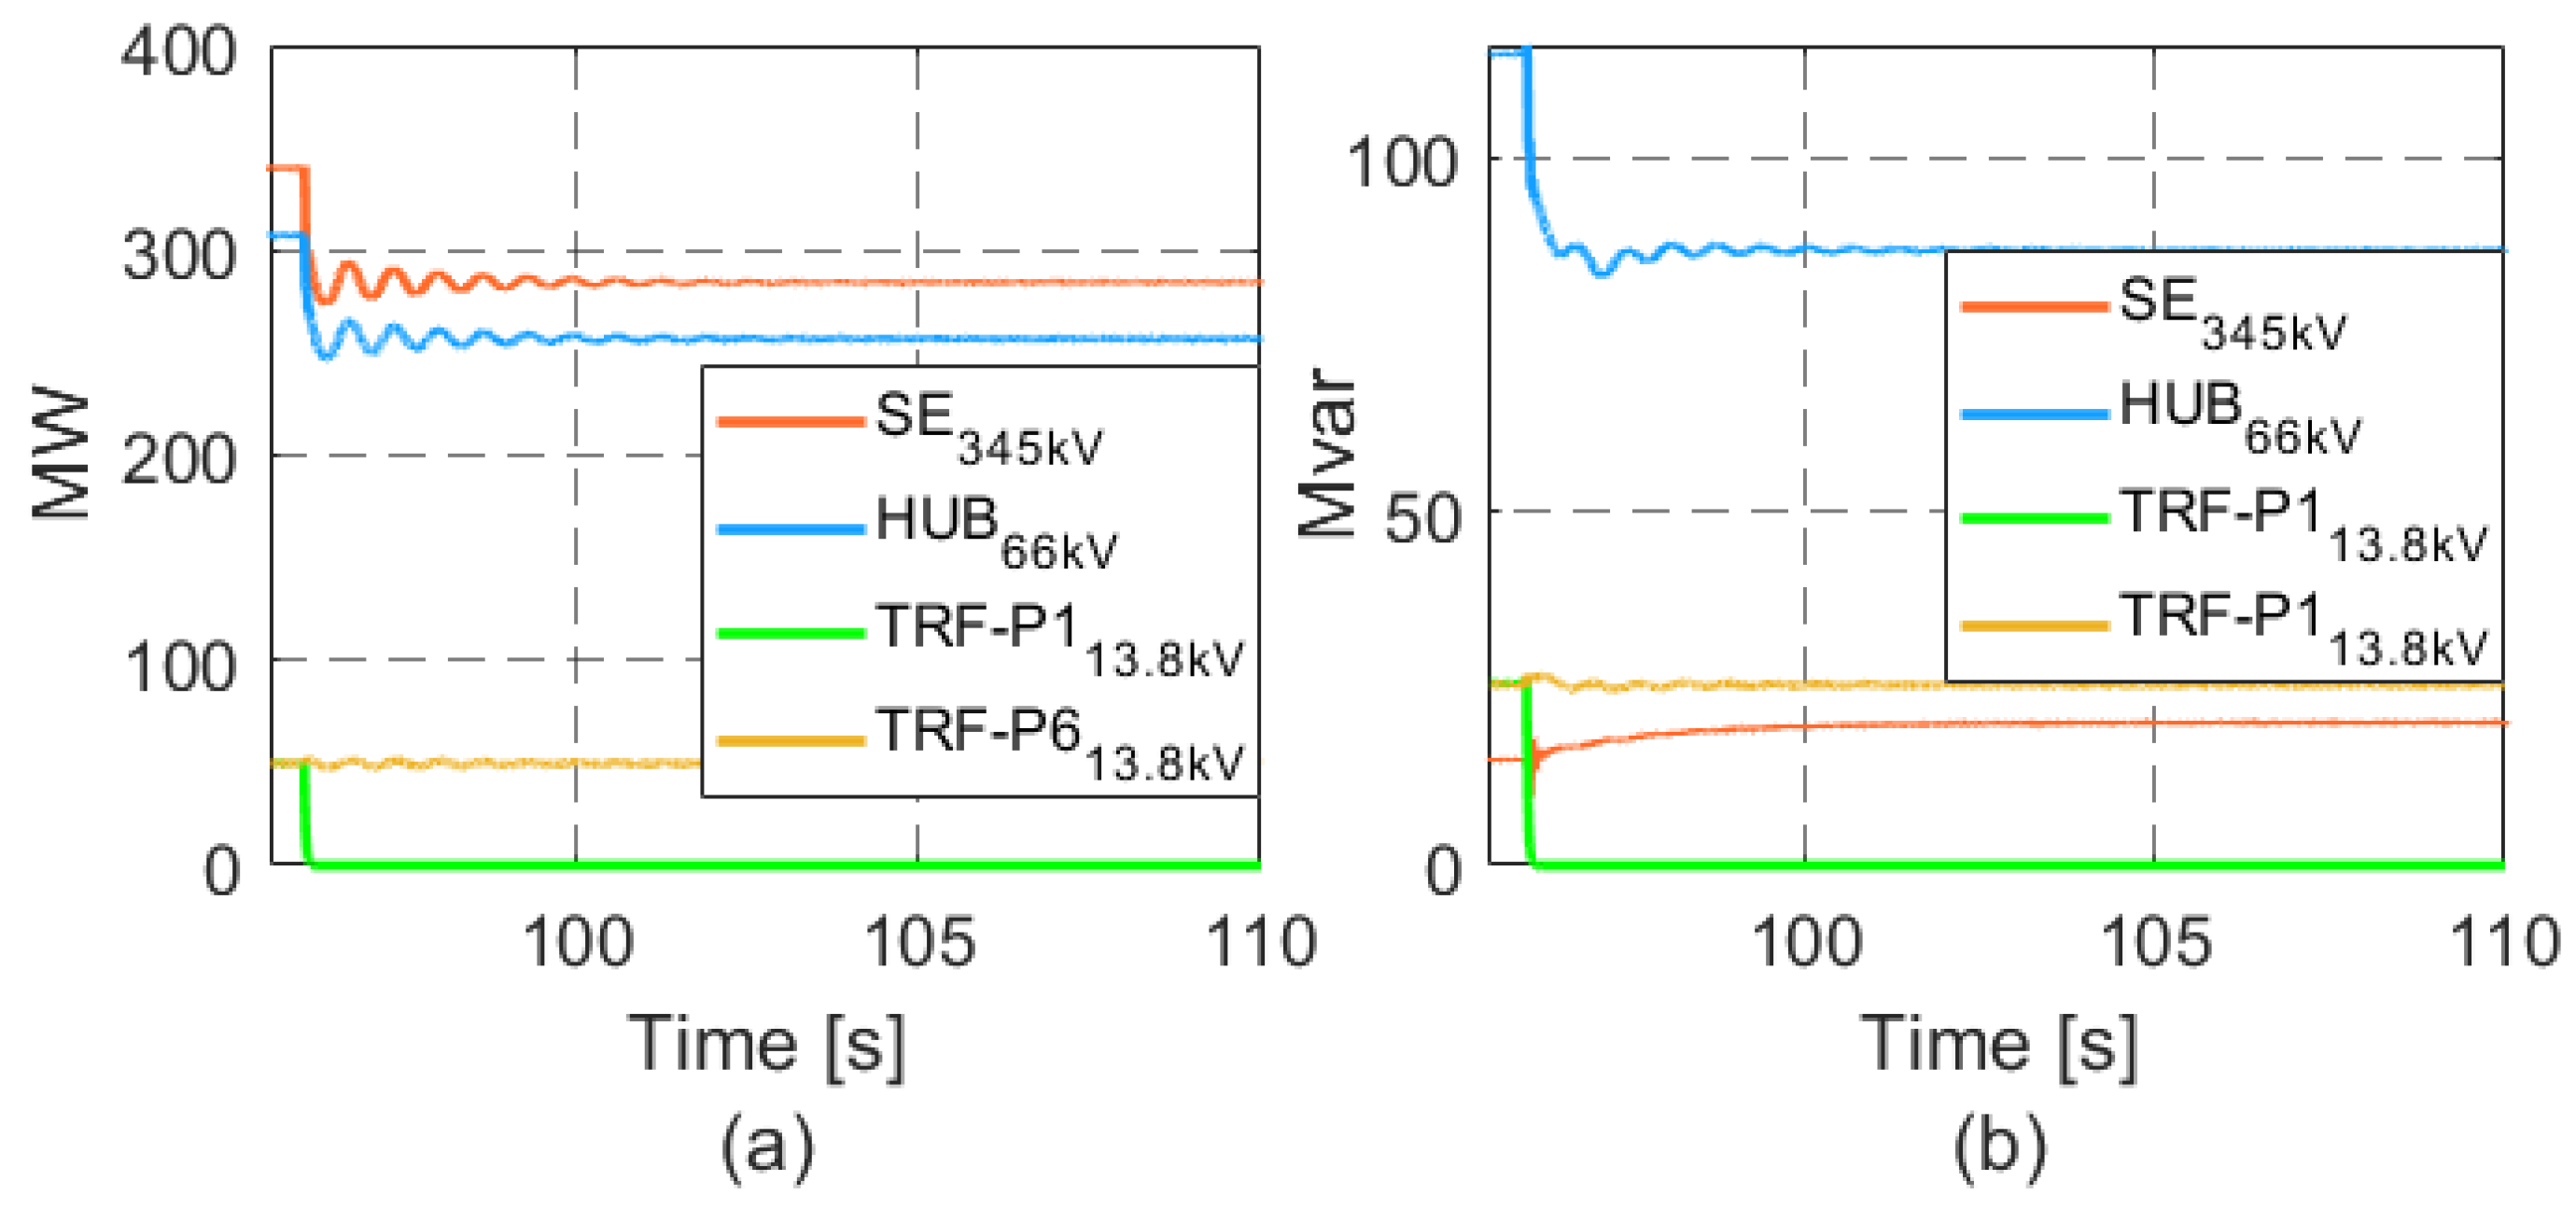
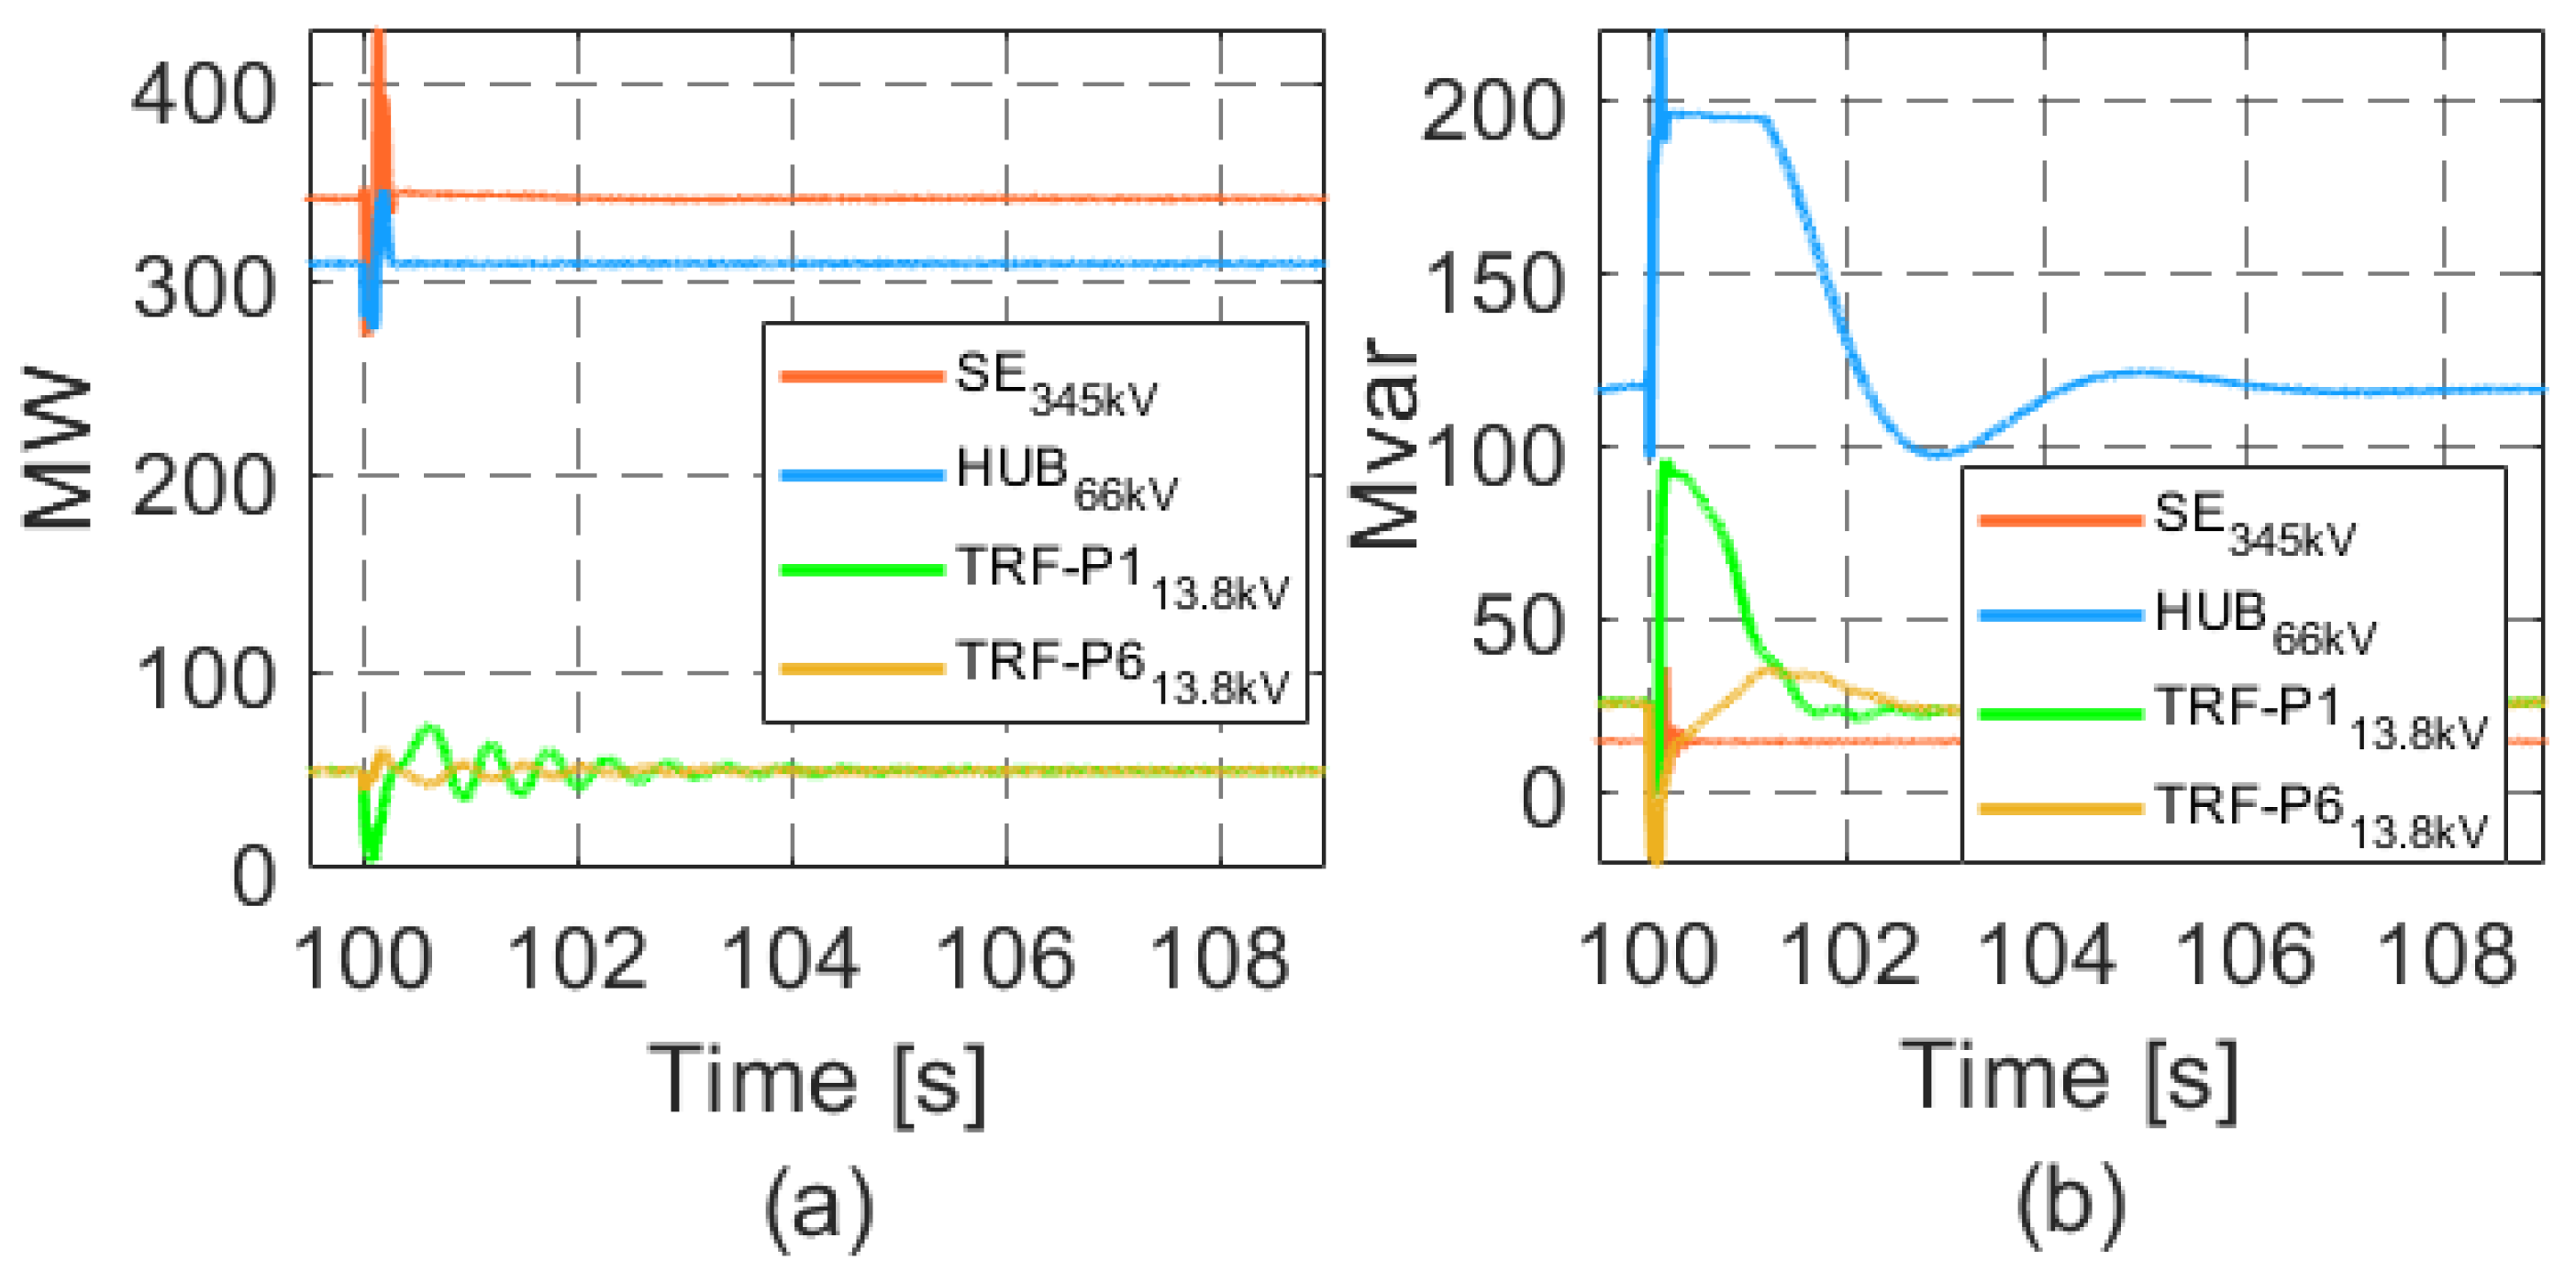
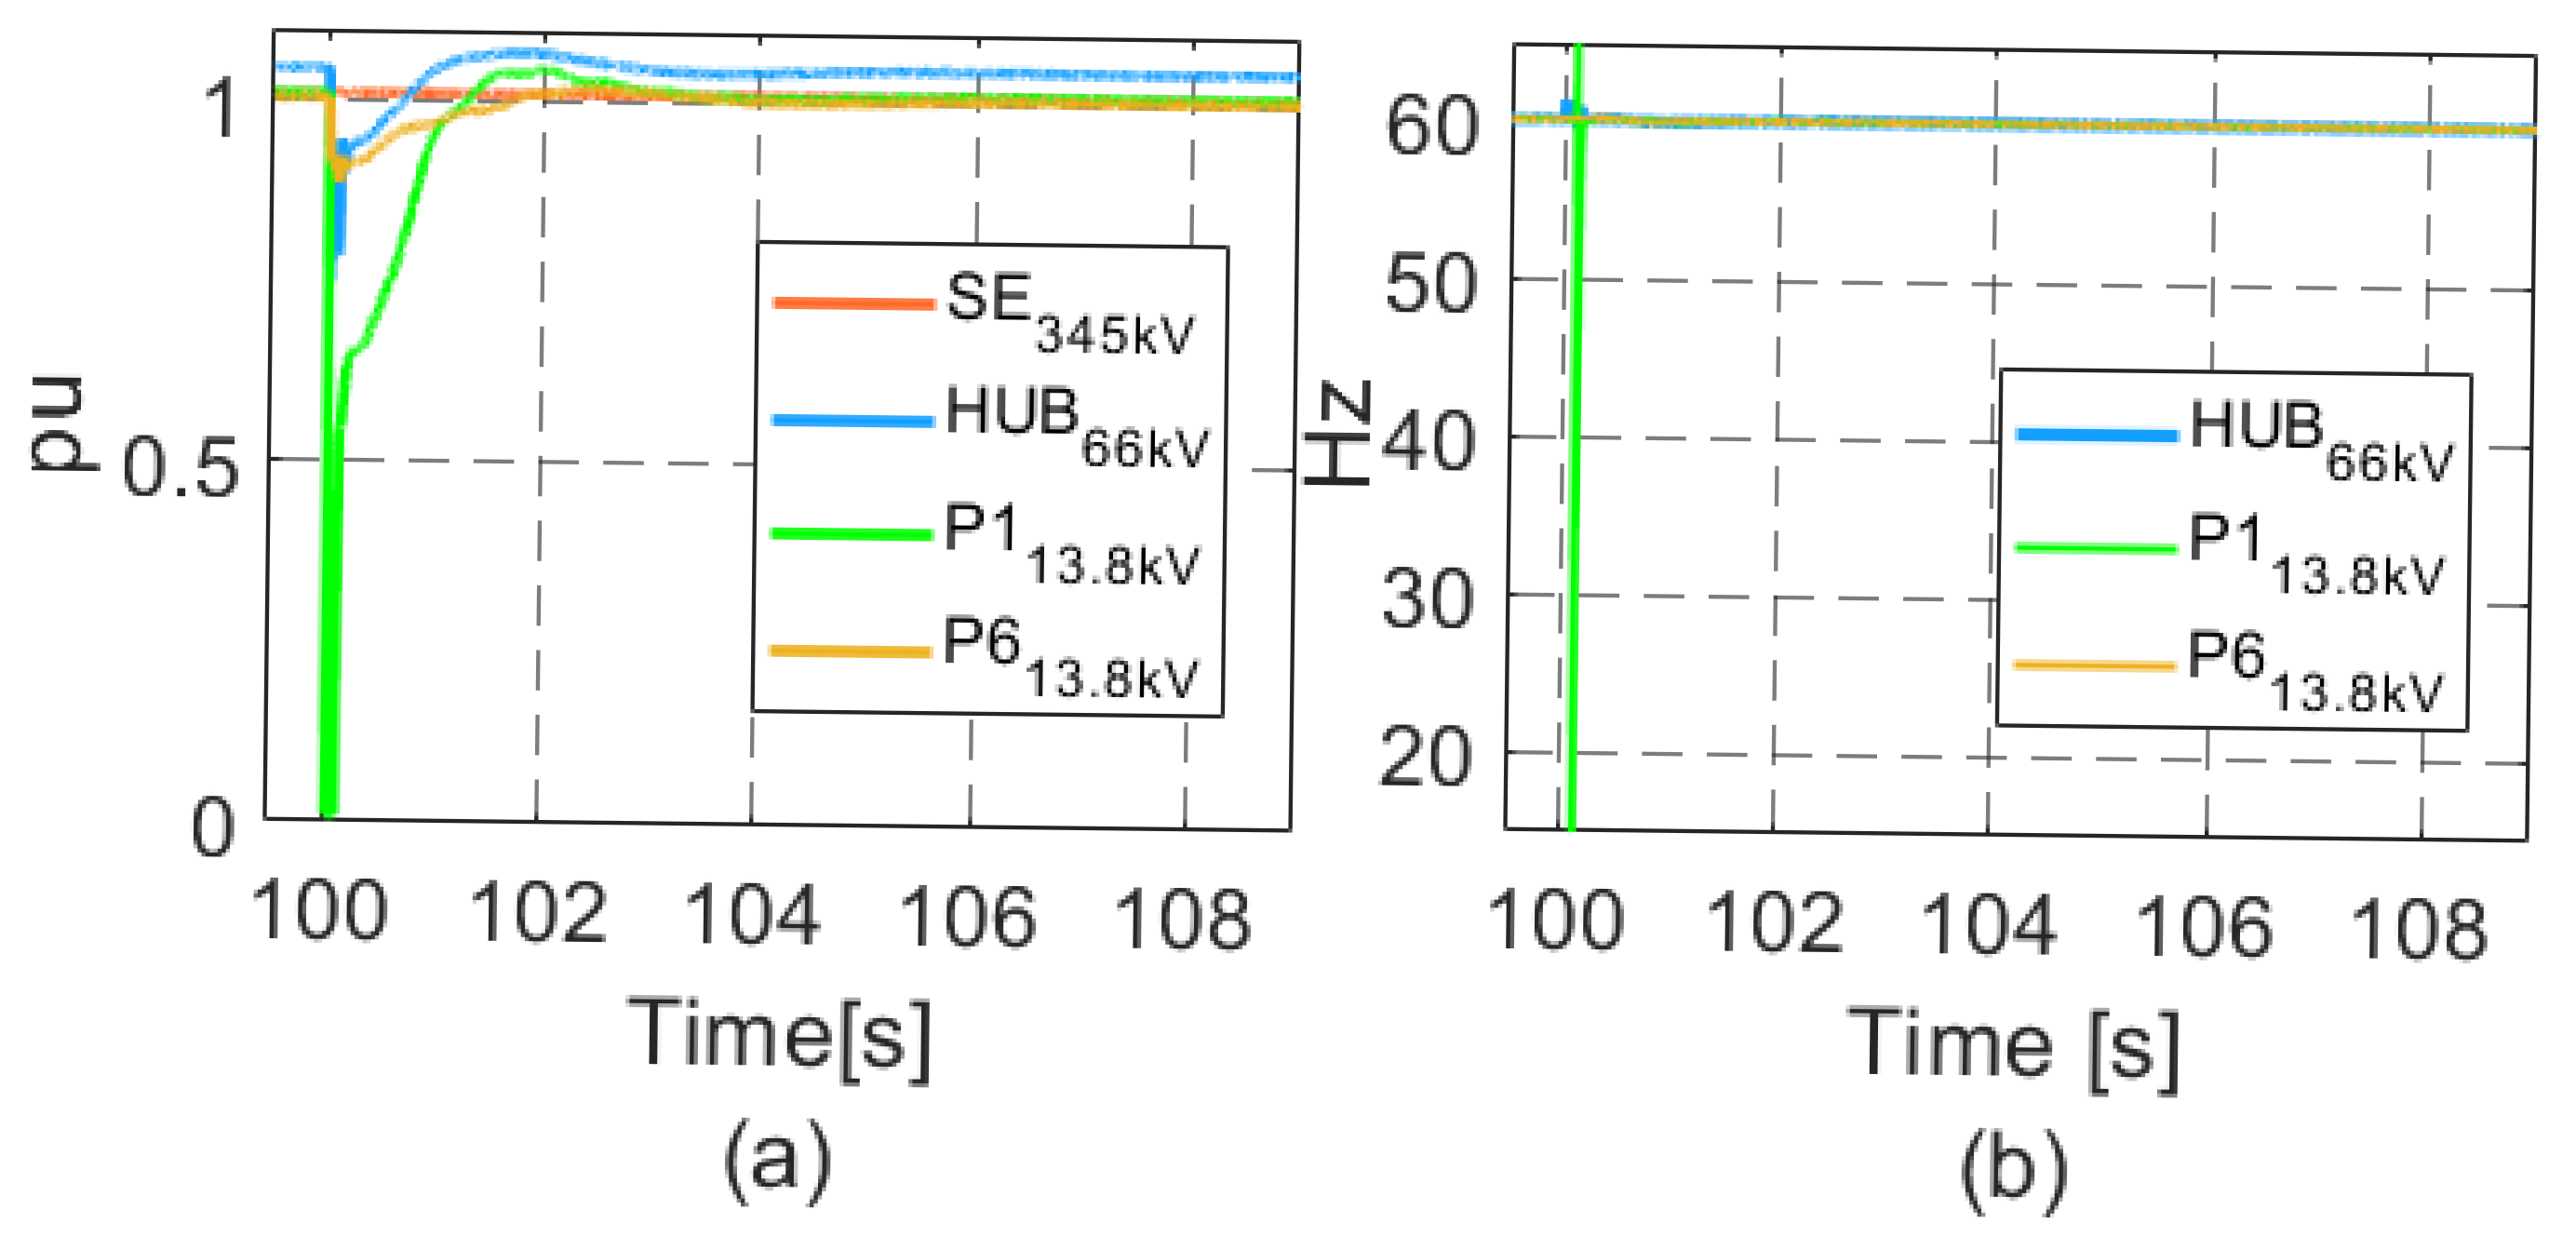
4.1.1. Interruption of Power Supply from the SIN

In this case, the system’s behavior was evaluated in response to a severe event, such as the loss of the power supply from the SIN. This event was simulated by opening the 345 kV transmission line connecting the rectifier substation to the SIN substation. It is clear that in this scenario, a complete system collapse would be expected due to the deficit in meeting a 300 MW load demand (50 MW per FPSO). However, a sequence of operational actions was evaluated following the occurrence of the test event, aiming to mitigate instability and consequently maintain platform operation (production).
As highlighted in Section 3, under normal operating conditions, the offshore system demands approximately 307.7 MW and 115.3 Mvar from the inverter station. However, when the connection to the SIN is lost, the HVDC link is automatically disconnected after 100 ms, thus ceasing power supply and triggering instability in the distribution network with a decrease to 44 Hz. On the FPSO units, the generators are unable to compensate for the voltage and frequency drops due to the imbalance between generation and load, reaching 0.8 pu and 44 Hz, respectively, at the 13.8 kV buses.
To mitigate the resulting instability, the system’s behavior was assessed with load shedding of 300 MW (50 MW per FPSO), 200 ms after the SIN disconnection—scenario 1 (S1). Figure 12a presents the voltage profiles at both the hub and platform P1. It can be observed from the solid blue curve that, prior to the event, the hub voltage stabilized at 1.048 pu, which was regulated by the control system of the inverter units. However, following the DC line disconnection, and due to the new operational conditions imposed on the electrical complex, there is a voltage increase to 1.35 pu. This occurs because of the absence of HVDC inverter control mechanisms (now offline) and the reactive power surplus caused by the capacitive effect of the 66 kV submarine cables connecting the hub to the FPSO units. This situation also causes voltage levels on the 13.8 kV FPSO buses to exceed regulatory limits (6%), reaching 1.38 pu, as shown in Figure 12a (solid green curve). As for the frequency, due to load shedding, it remains within acceptable limits, stabilizing at 59.87 Hz both at the hub bus and the FPSO 13.8 kV buses, as shown in Figure 12b (solid green and yellow curves for platforms P1 and P6, respectively). Although the active power flow from the hub to the FPSO units (hub-interconnection transformer (TRF)) is interrupted, as confirmed in Figure 13a (solid green and yellow curves), there is still reactive power importation by the FPSO units, resulting from the capacitive effect of the 66 kV cables. This ranges from 6 Mvar at platform P1 (closest to the hub) to 40 Mvar at platform P6, as illustrated in Figure 13b (solid green and yellow curves, respectively). This condition causes the generators to adjust their reactive power output, stabilizing at new levels consistent with the excess reactive power from the 66 kV cables, ranging from 12 Mvar at platform P1 to –5.4 Mvar at platform P6, that is, consuming reactive power, as shown in Figure 14b (solid green and yellow curves, respectively).
After verifying that the capacitive effect of unloaded 66 kV cables impairs the islanded operation of the system, it was decided to disconnect the 66 kV distribution network 100 ms after load shedding, leading to an isolated operating condition for each FPSO—scenario 2 (S2). Under these circumstances, Figure 12a shows that the hub voltage dropped to zero (dashed blue curve), as expected, while the 13.8 kV bus voltage at platform P1 rose to 1.18 pu (dashed green curve). Although this voltage level is still high, it can be mitigated through generator voltage control. In this case, the AVR control loop needs to switch its control strategy from “power factor mode” to “reference voltage mode” (Vref). Regarding frequency, Figure 12b indicates stabilization at 60 Hz on the FPSO units, demonstrating that the disconnection of the 66 kV distribution network was beneficial for maintaining proper platform operation (dashed green and yellow curves). In this way, the generators (GS1) remained in synchrony, producing active and reactive powers under conditions such as those before the event (16 MW and 12 Mvar), as shown in Figure 14a,b (dashed green and yellow curves). Meanwhile, reactive power flows at the secondary sides of the 66/13.8 kV transformers, which connect the FPSO units to the hub, dropped to zero due to the disconnection of the distribution cables, as indicated in Figure 13a,b (dashed green and yellow curves).
By isolating the platforms, the only mechanism for voltage control at the 13.8 kV buses is the reactive power adjustment of the synchronous generators, initially set with a fixed power factor of 0.8 pu. Consequently, a change in the AVR control loop strategy was implemented, switching from power factor mode to reference voltage mode (Vref) with a preset point of 1 pu—scenario 3 (S3). Consequently, the voltage level, previously at 1.18 pu at the 13.8 kV buses, dropped and stabilized at 1 pu, as illustrated in Figure 12a (dashed purple curve). This voltage adjustment was a result of the AVR action, reducing the reactive power supplied by the generators from 12 to 10 Mvar, as shown by the dashed purple curve in Figure 14b.

4.1.2. Short Circuit in the 345 kV Network

This case focuses on the behavior of the electrical complex in the event of a possible three-phase short circuit near the 345 kV substation, which manifests as a voltage sag. This event lasted 100 ms, with no transmission line disconnection, resulting in a residual voltage of 0.4 pu at the 345 kV substation bus during the disturbance, as shown in Figure 15a (orange curve). A momentary voltage drop can also be observed at the 66 kV (hub) bus (blue curve), which returns to its initial value (1.048 pu) immediately after the disturbance is cleared. Similarly, as shown in Figure 15b, the electrical network frequency at the hub (blue curve) remains steady at 60 Hz after the event, which is justified by the operational control imposed by the inverter station, adjusting the active power flow to balance energy generation and consumption. Regarding the voltage and frequency behavior in the 13.8 kV bus of the production units, slight oscillations occur around the nominal value; however, the stable operation of the FPSO units is maintained during the short circuit in the SIN, as indicated by the green and yellow curves in Figure 15a,b.
The active and reactive power flows from the onshore network (SIN) to the offshore interconnection are shown in Figure 16a,b, represented by the orange curves. Prior to the occurrence of the disturbance, the flows were approximately 340 MW and 15 Mvar, respectively. At the onset of the voltage sag, a temporary reduction of 200 MW in the active power flow from the SIN was observed. Regarding reactive power, an inversion in the direction of flow on the 345 kV transmission line occurred during the event. This is due to the action of the control system of the rectifier station, which provides reactive power compensation to support voltage regulation. Once the fault is cleared and oscillation damping is achieved, both the active and reactive power flows are restored to their pre-disturbance levels. Similar behavior can be observed in the active power flow from the inverter station to the hub (blue curve), with a momentary reduction from 307 to 191 MW at the instant of the fault. This flow is subsequently restored to its previous level after typical oscillations associated with the system’s dynamic response. As for reactive power, variations are related to the voltage control performed by the inverter station. The active and reactive power flows in the interconnection between the FPSO units and the hub (green and yellow curves) do not indicate any critical or compromising conditions for the stable operation of the system.
Confirming the stability of voltage and frequency at the 13.8 kV bus in the FPSO units, Figure 17a,b show the active and reactive power outputs from one of the generators on FPSO units 1 and 6, indicating oscillations with peak deviations of approximately 4 MW and 8 Mvar, respectively, relative to the pre-fault values. Nevertheless, the generation units remain in stable operation and synchronized with the distribution network after the disturbance.

4.2. Events Associated with the HVDC Transmission System

Short Circuit in the Positive Pole of the DC Submarine Cable

This case shows the system behavior when a 100 ms pole-to-ground short circuit occurs in the DC cable. This situation requires the removal of the faulty pole, which results in a single-pole DC transmission condition. In this operating condition, the remaining pole can support an overload capacity of 20% compared with its originally established value (150 MW).
In summary, the sequence of events imposed in this case consists of the occurrence of the fault, followed by the actuation of the HVDC protection system disconnecting the short-circuited cable after 100 ms, and the increase in the dispatch of the remaining pole to 180 MW, 300 ms after the occurrence of the fault—scenario 1 (S1). As shown by the orange curves in Figure 18a,b, before the fault occurs, the active and reactive power flows at the 345 kV substation are 340 MW and 15 Mvar, respectively. However, after this event and due to the new dispatch of the remaining pole, the active power is reduced to 200 MW and the reactive power is increased to 28 Mvar because of the reduction in the 64 km line loading at 345 kV and the action of control to regulate the voltage at the substation on the PCC. Regarding the 66 kV bus, the blue curves in Figure 18a,b show the active and reactive powers coming from the hub, varying from 307 to 183 MW and from 117 to 13 Mvar, respectively. Before and after the event, the voltage is around 1.048 pu, evidencing the damping of transient oscillations, as shown in Figure 19a. This condition results from the voltage control action of the inverter station, which adjusts the reactive power flow to achieve this objective. The frequency in the 66 kV system, as shown by the solid blue curve in Figure 19b, stabilizes at 59.11 Hz following the disconnection of one of the poles.
Figure 19a (solid green and yellow curves) shows the voltages at the 13.8 kV buses of FPSO units 1 and 6, which show an increase of 1.05 pu and 1.07 pu, respectively, following the sequence of events (fault occurrence and clearance, and increased dispatch from the remaining pole). Thus, the closest platform maintains voltage levels within the regulatory limits, while the most distant FPSO exceeds the 6% limit. It becomes evident that, following the disconnection of the DC cable, there is a reduction in the import of active and reactive powers per FPSO in the interconnection between the platforms and the hub, even with the increased transmission capacity of the remaining DC cable. This behavior can be observed in Figure 18a,b (green and yellow curves), where the active power is reduced from 50 to 30 MW and the reactive power from 25 to 16 Mvar. Consequently, in Figure 20a,b (solid green and yellow curves), the generators start to supply this power loss in the transmission, as the power increases from 16 to 24.5 MW for each generation unit. The reactive power, based on the constant power factor control mode (0.8 pu) imposed on the AVR, shows a proportional increase from 12 to 18 Mvar. In turn, this increase in the active power injected by the synchronous generators of the FPSO units has an effect on the frequency, which stabilizes at 59.11 Hz, remaining within the maximum acceptable deviation, as shown in Figure 19b (solid green and yellow curves). This behavior was expected due to the control mode (droop) configured in the turbines.
The results are consistent with the loss of 120 MW of transmission capacity in the HVDC system, indicating a stable operational situation for the electrical system. However, we can observe that, with the lower power supply from the SIN, overvoltages are generated in the 13.8 kV buses, and a slight drop in frequency occurred due to the increase in generator power. Thus, in order to improve system behavior in view of the results obtained, a new scenario was evaluated that includes the switching of under-load taps of the 66/13.8 kV transformers allocated to the FPSO units and load shedding of 20 MW per platform, equivalent to the expected supply of the SIN of 120 MW. These actions occurred 300 ms after the disconnection of the short-circuited DC cable—scenario 2 (S2).
Based on this new operating condition, the green and yellow dashed curves in Figure 19a show the voltage performance of the 13.8 kV buses. After the event, the voltages of FPSO units 1 and 6 are reestablished to the levels preceding the event (1.00 pu). The frequencies on the 13.8 kV buses of the FPSO units, as well as the frequency at the hub, indicated in Figure 19b (blue, green, and yellow dashed curves), confirm the stabilization at 60 Hz after such control actions. In this sense, the generators on the platforms operate under similar conditions before and after the event, with powers of 16 MW and 12 Mvar, as shown in Figure 20a,b (green and yellow dashed curves).

4.3. Events Associated with the 66 kV Distribution Network

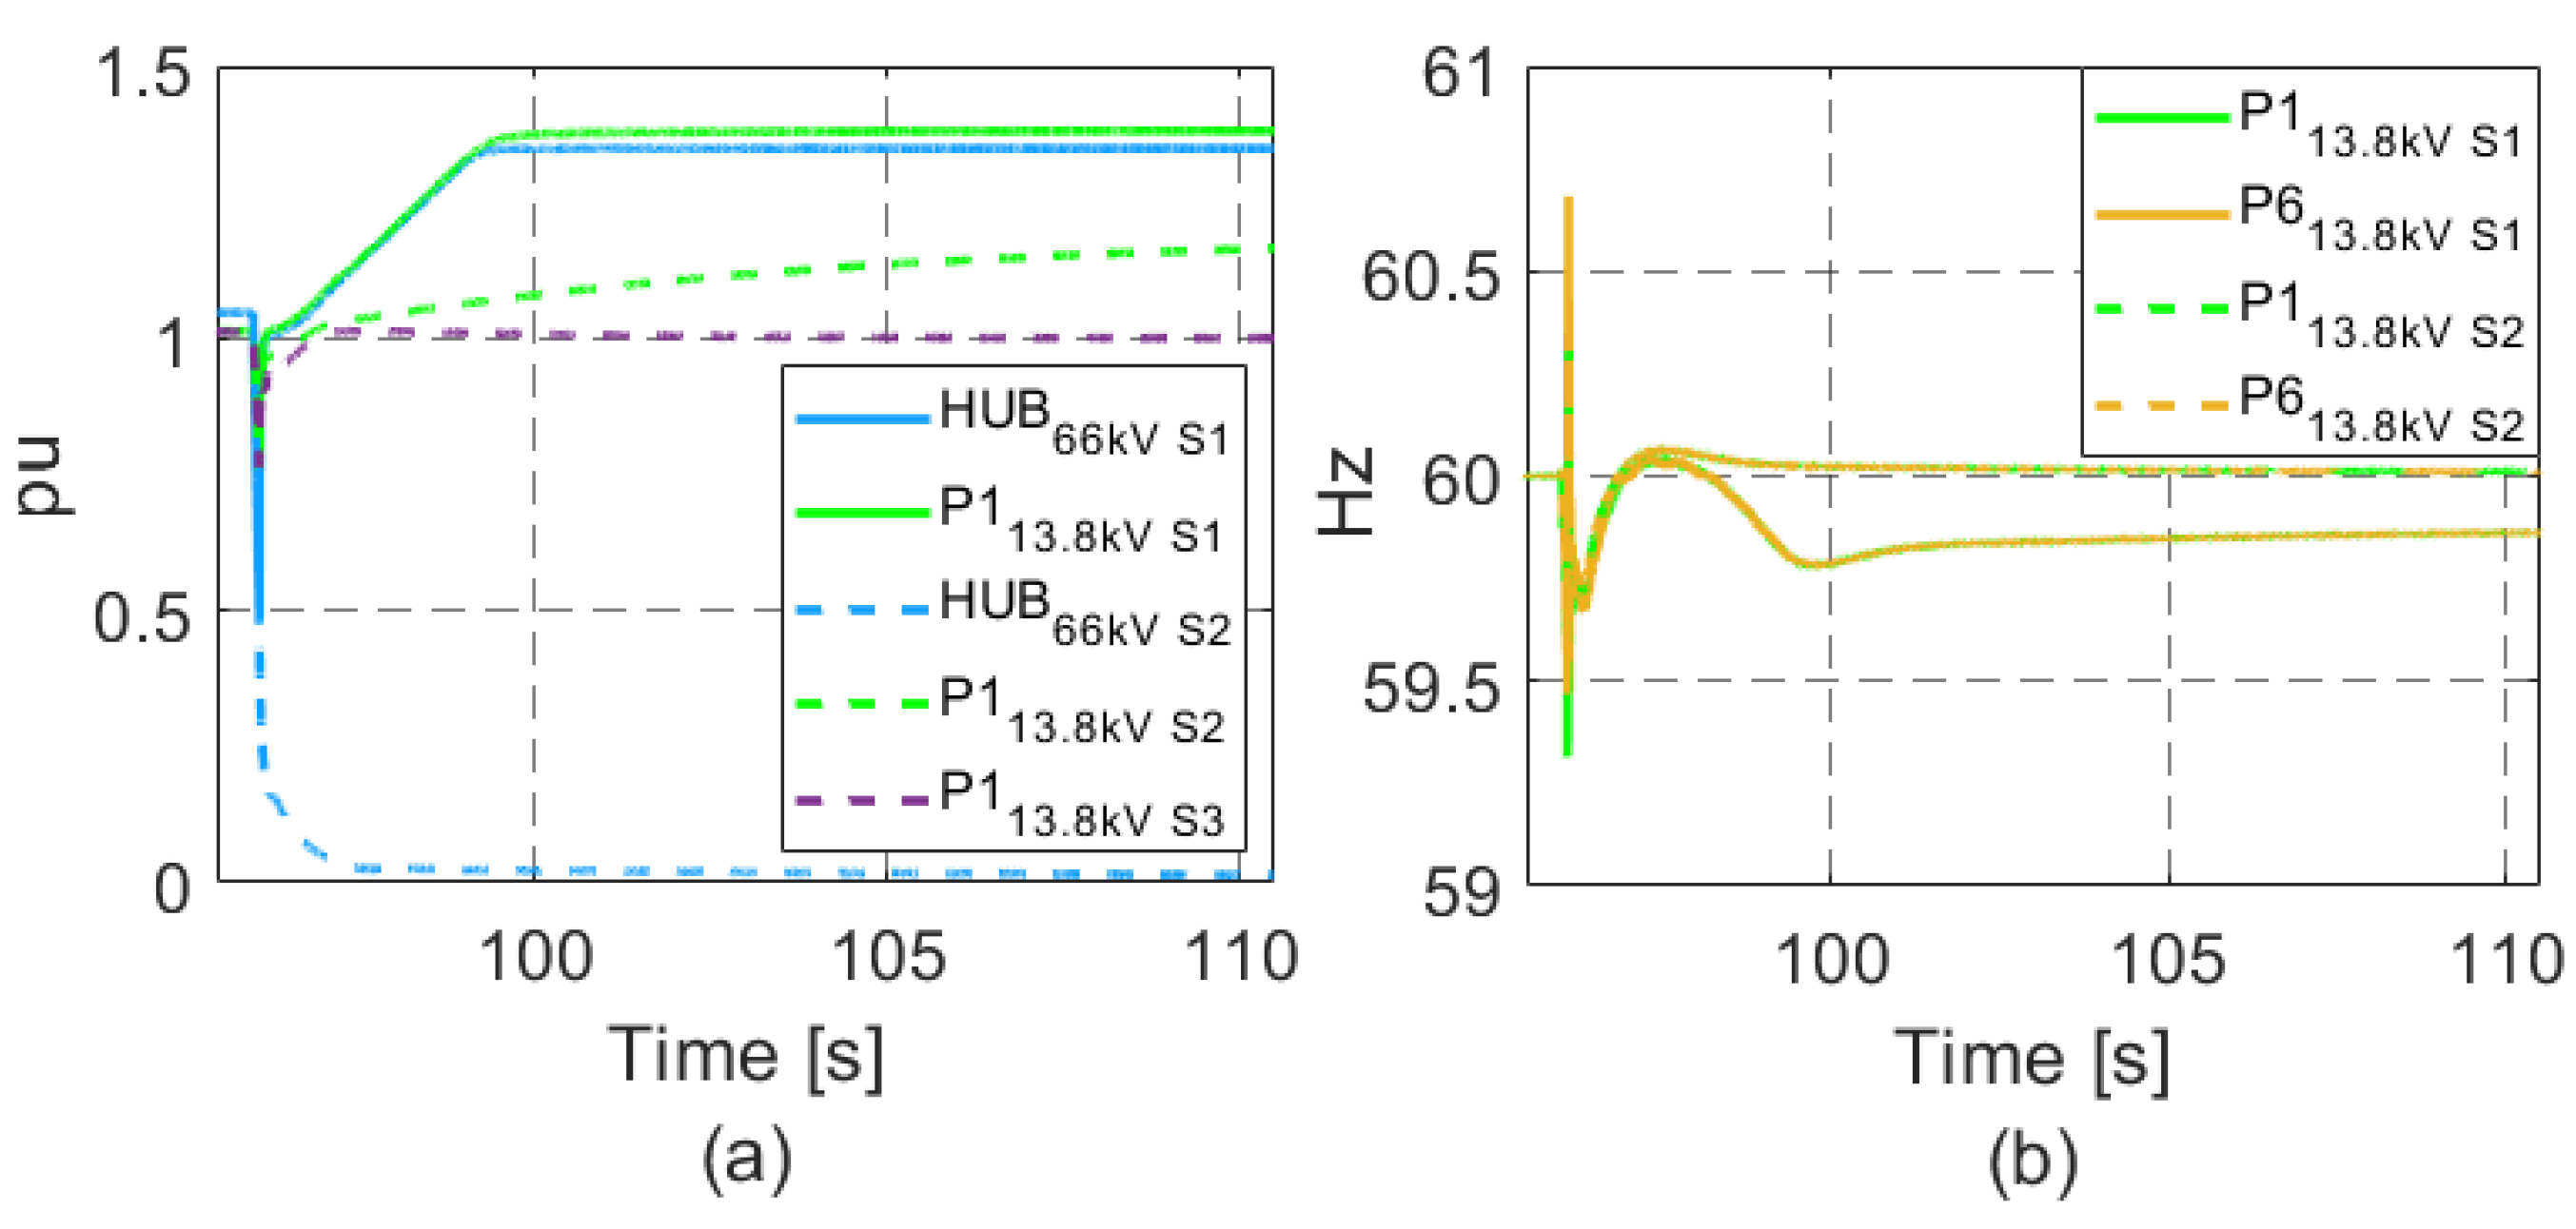
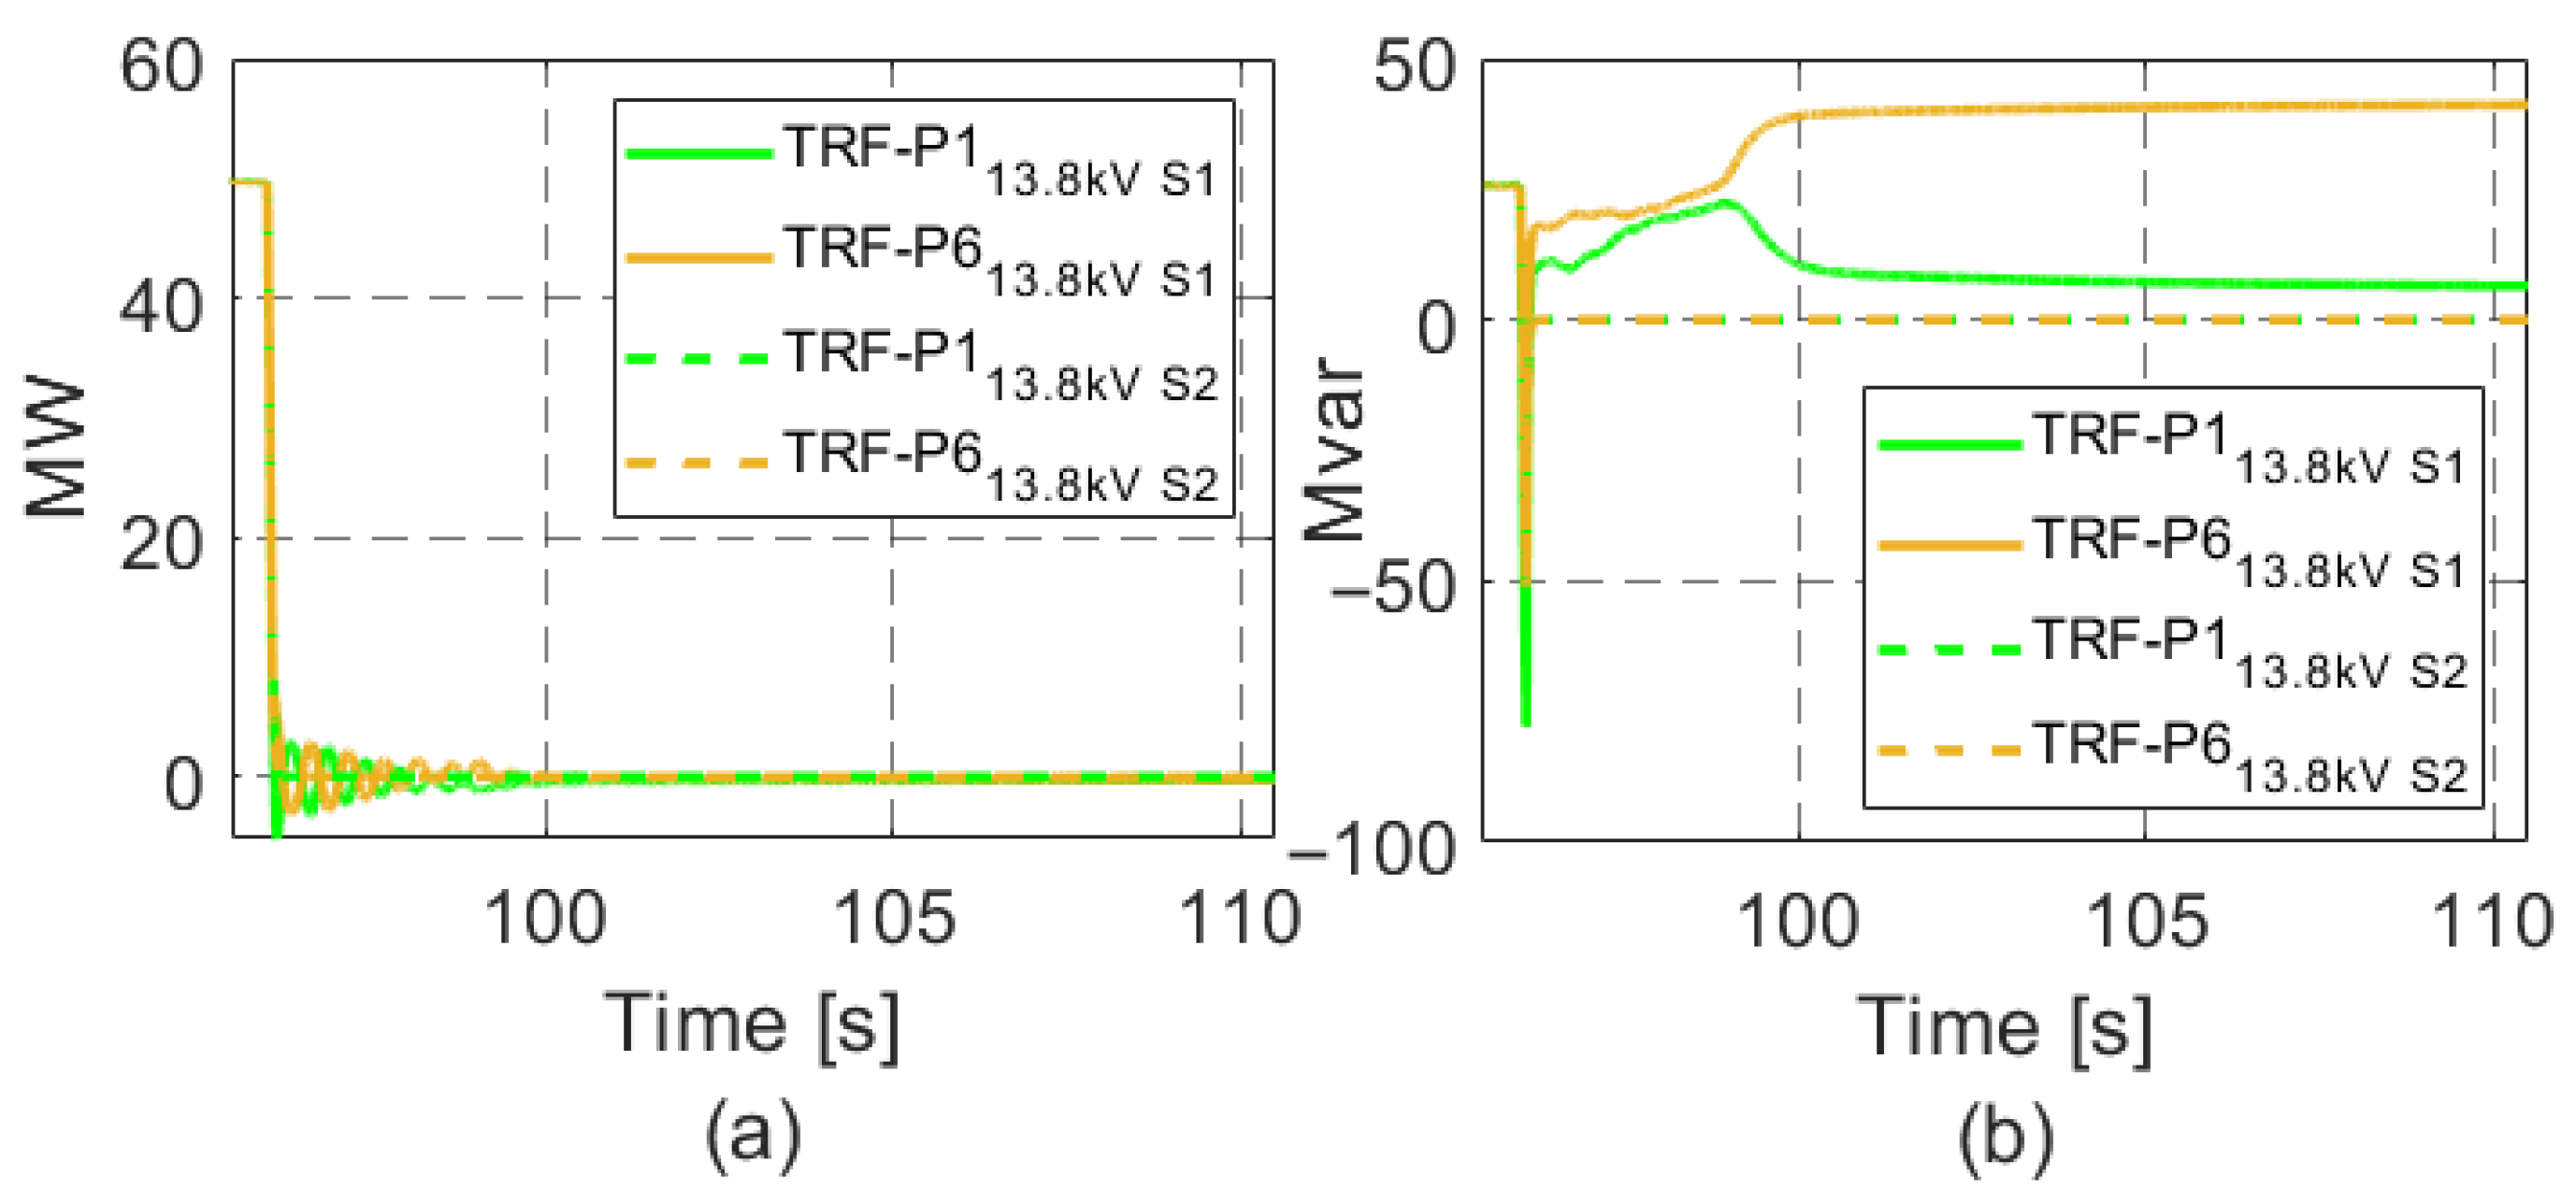
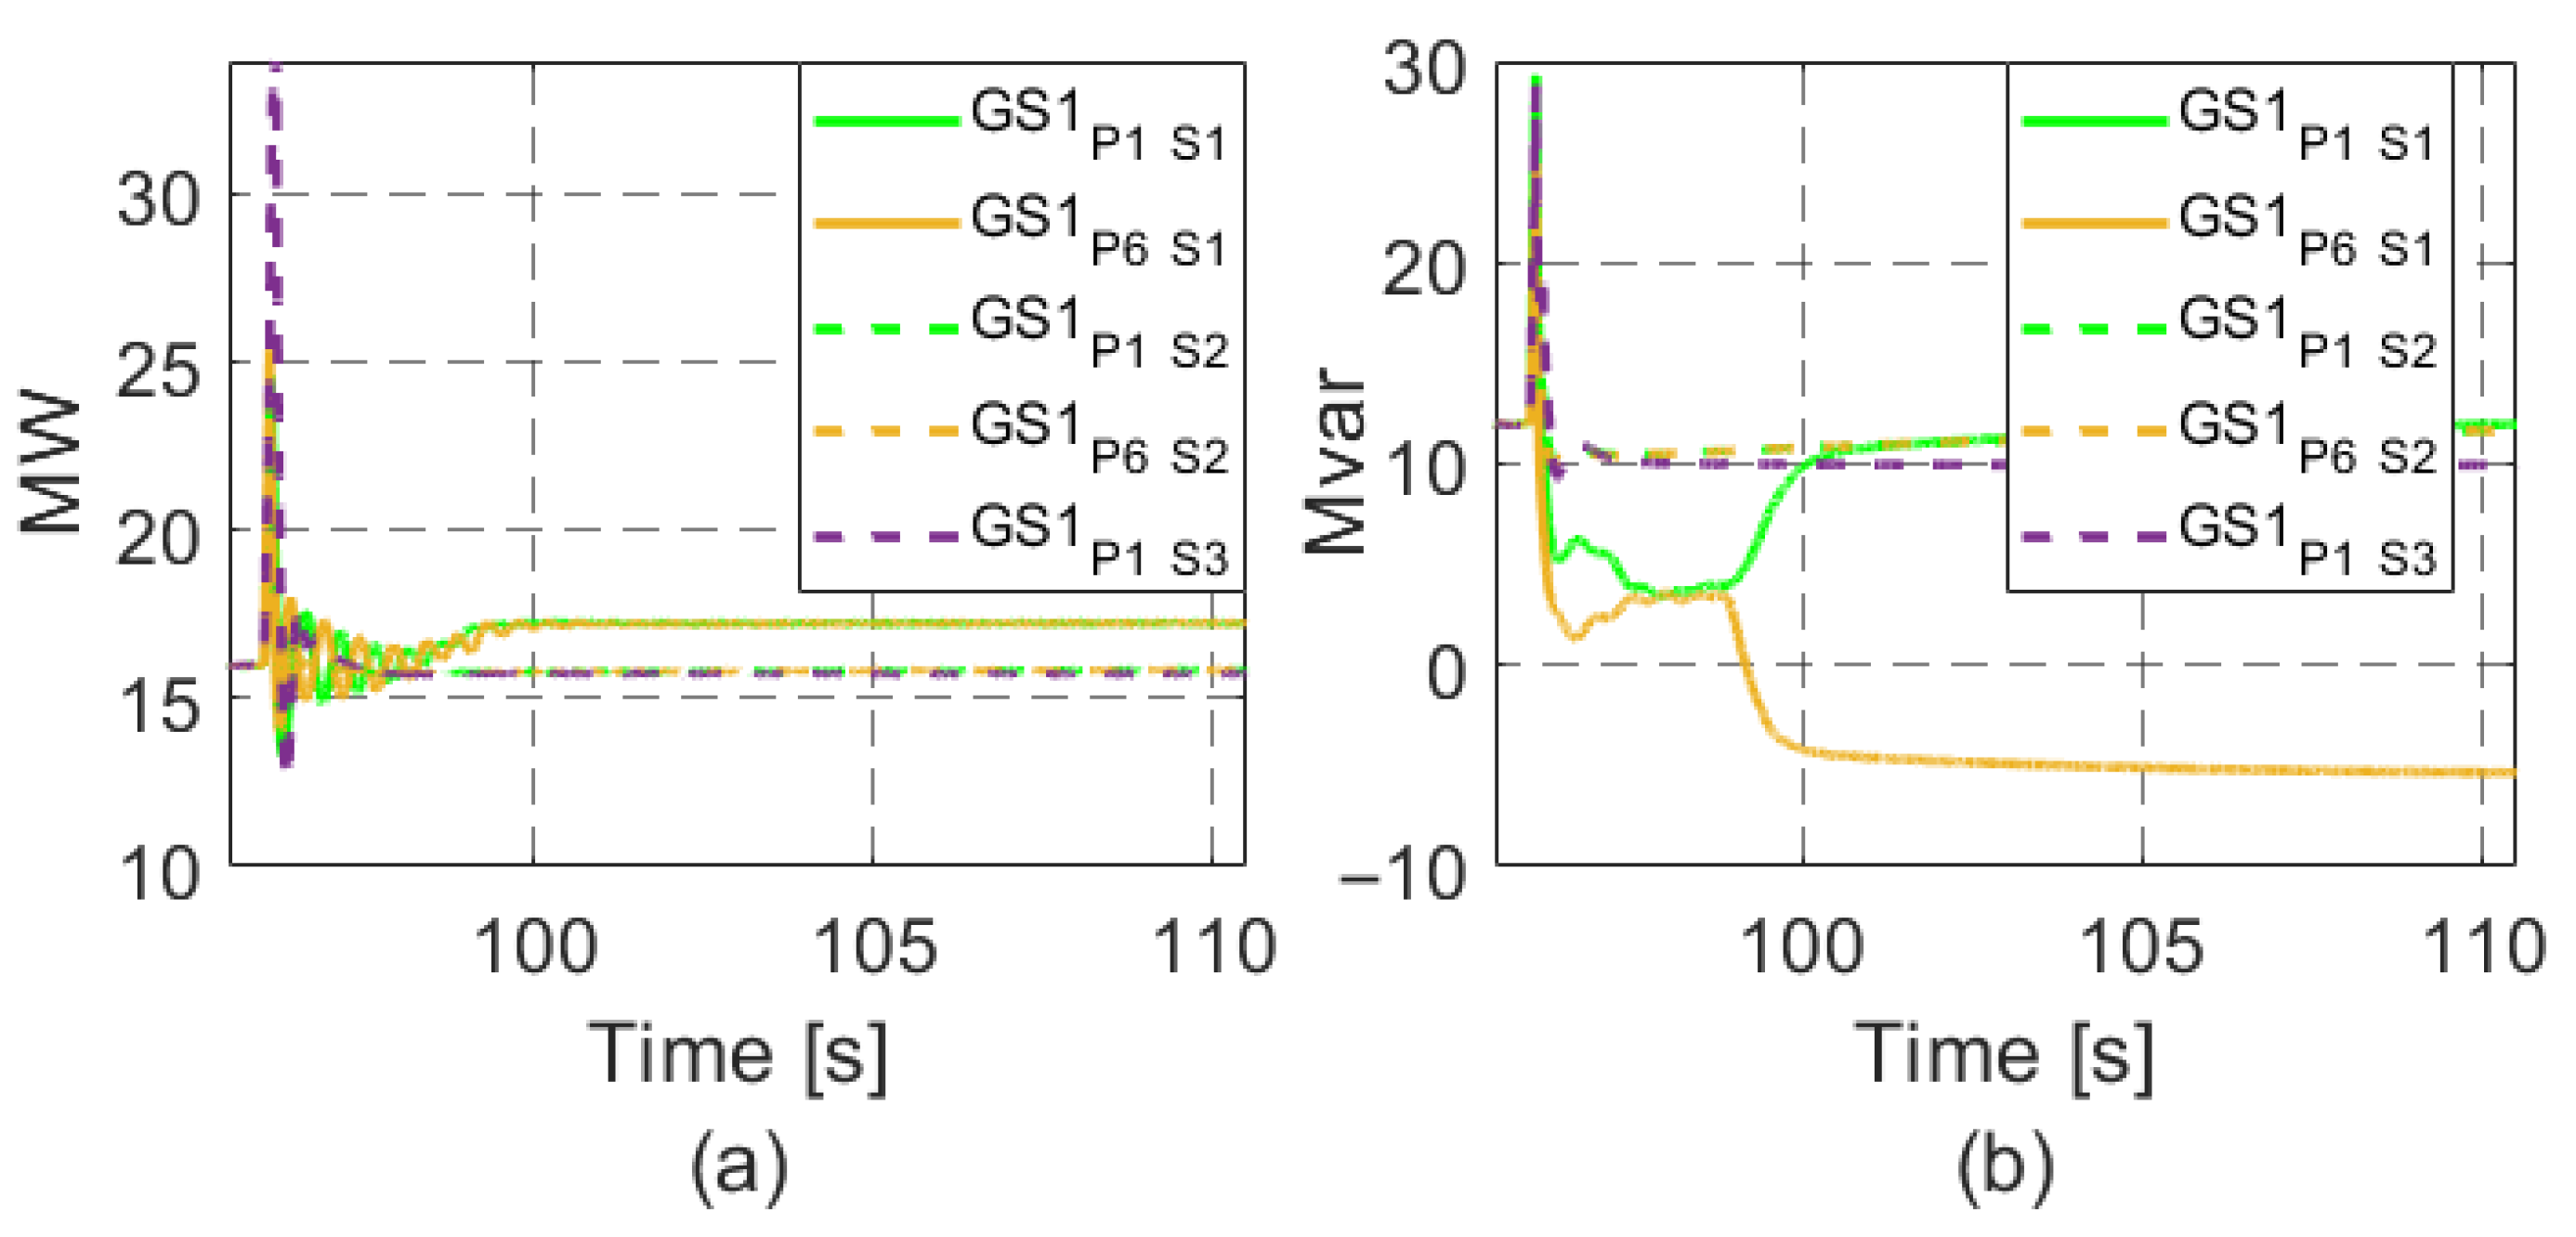
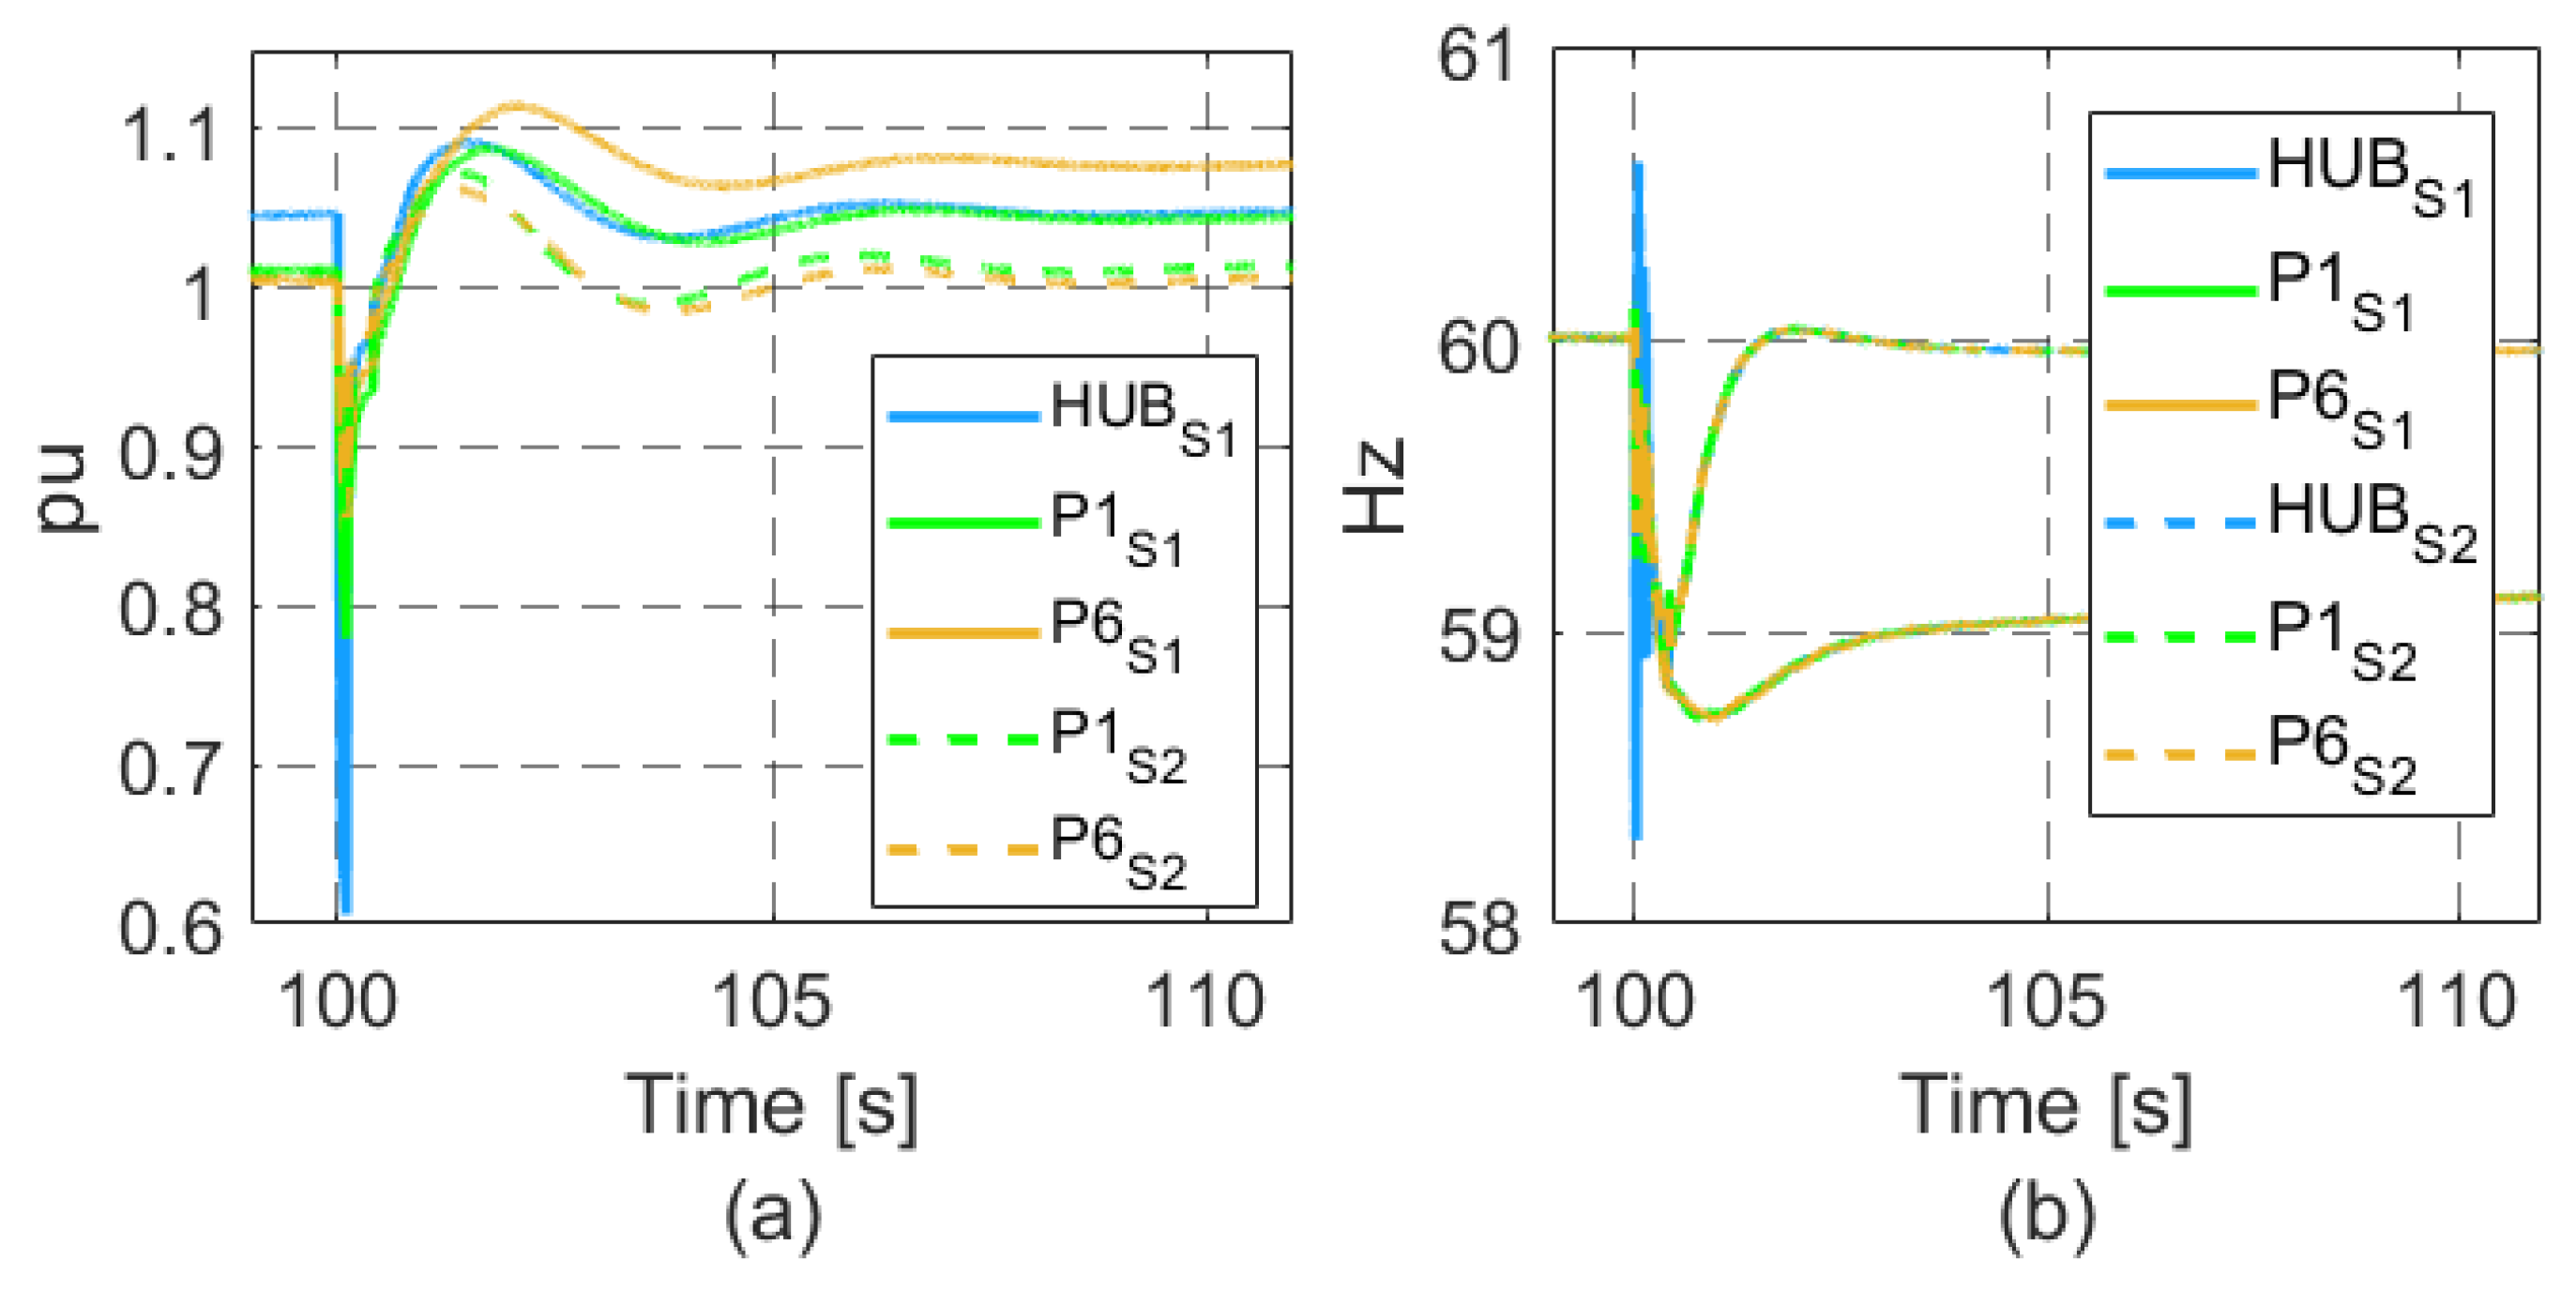
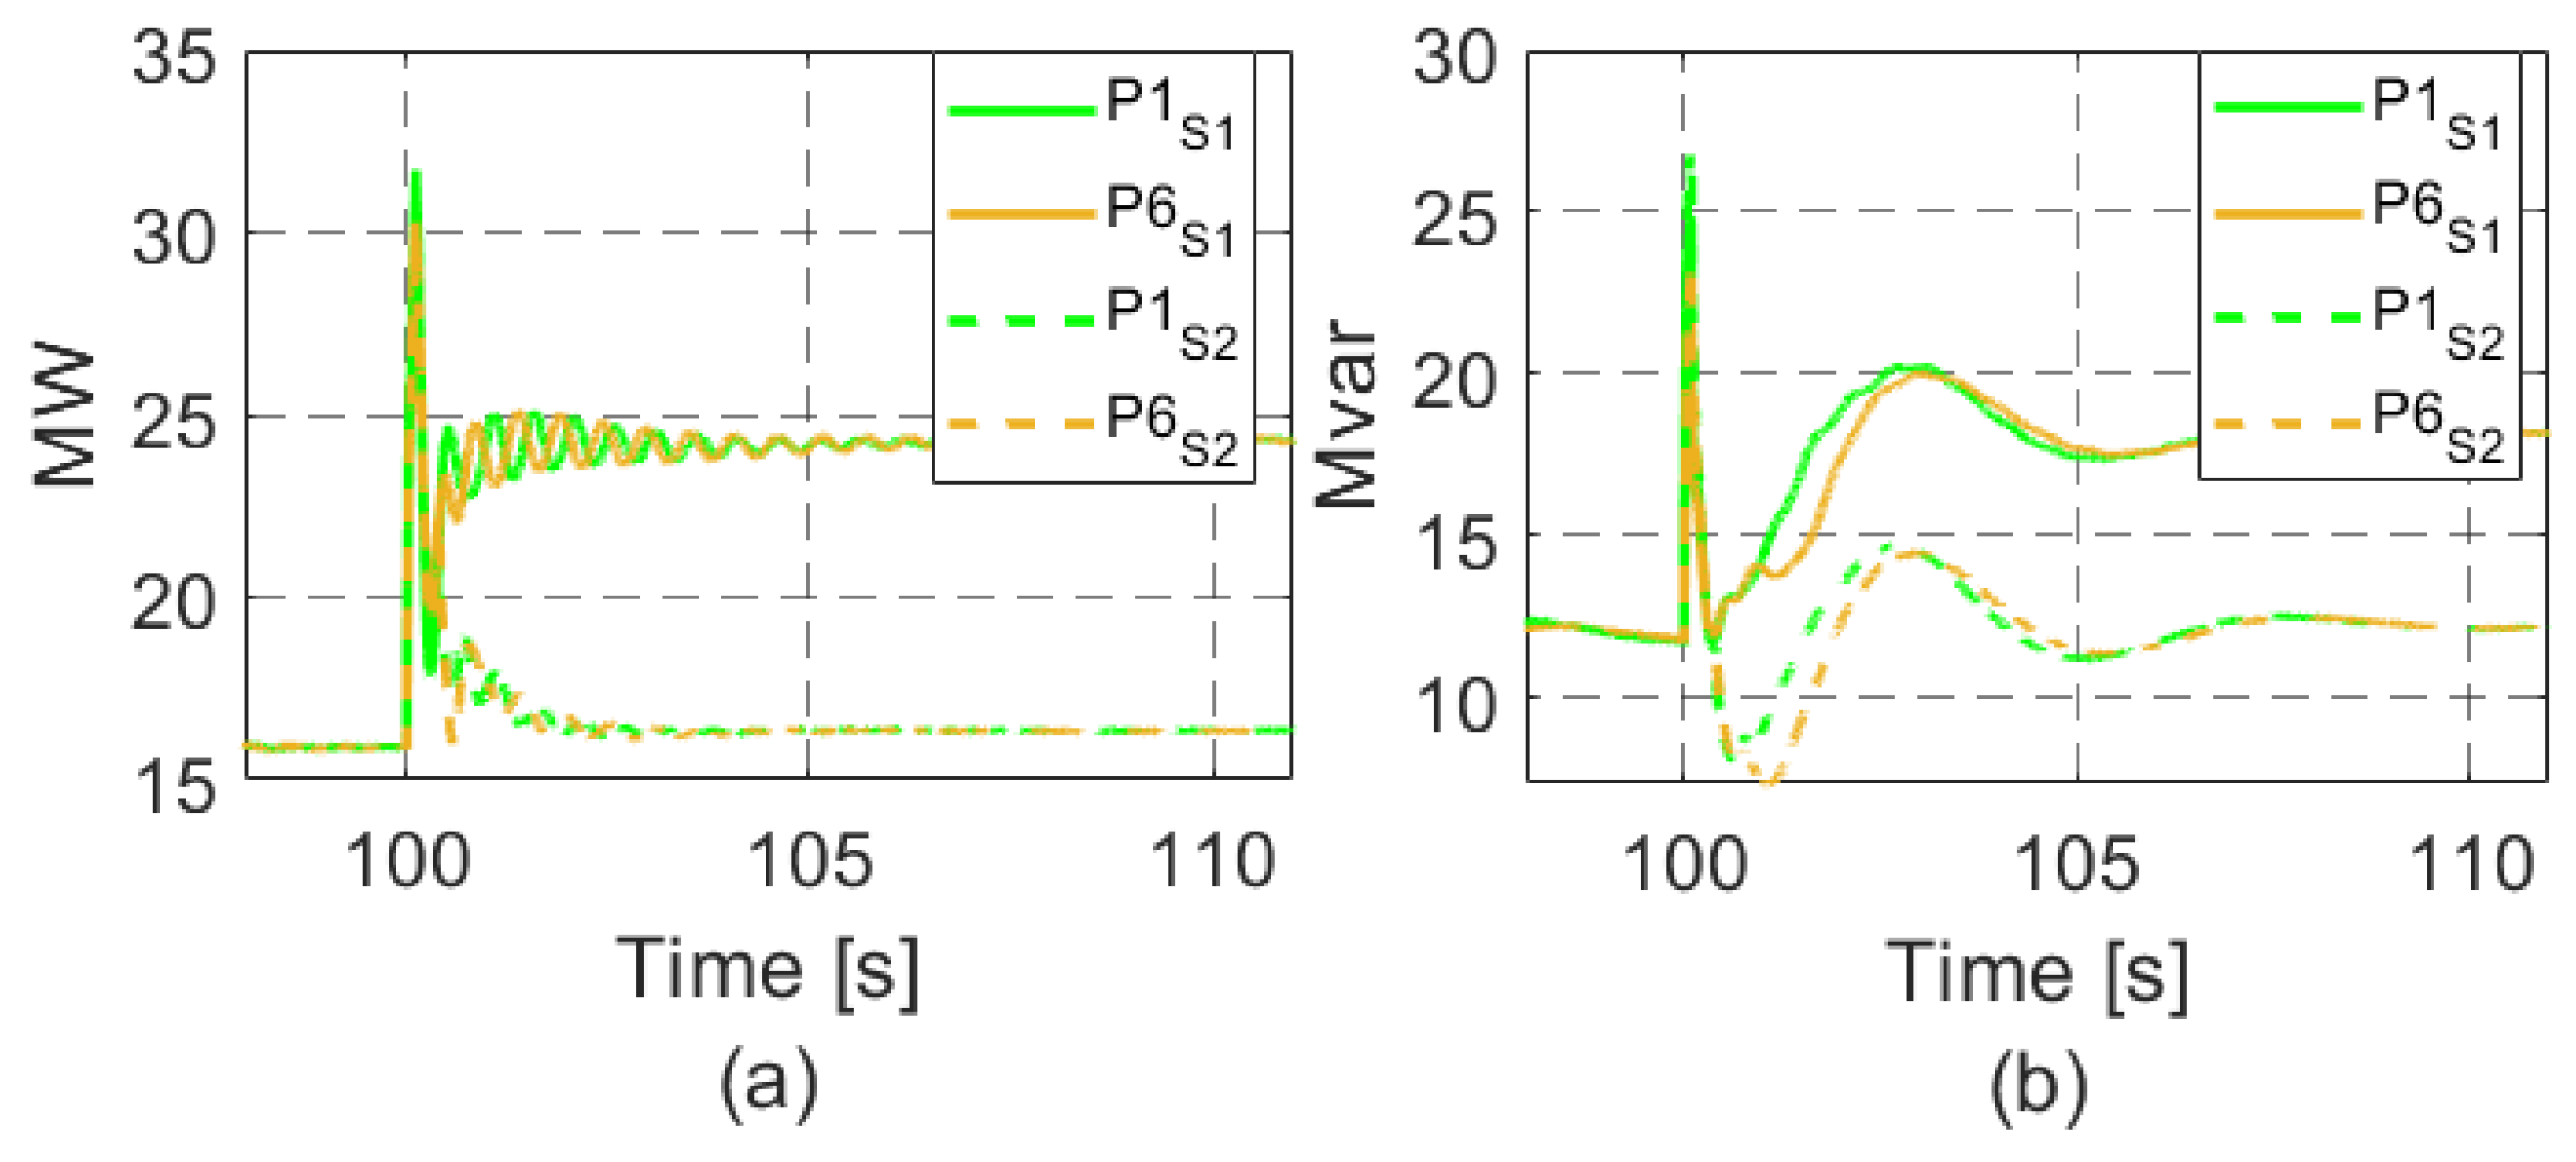
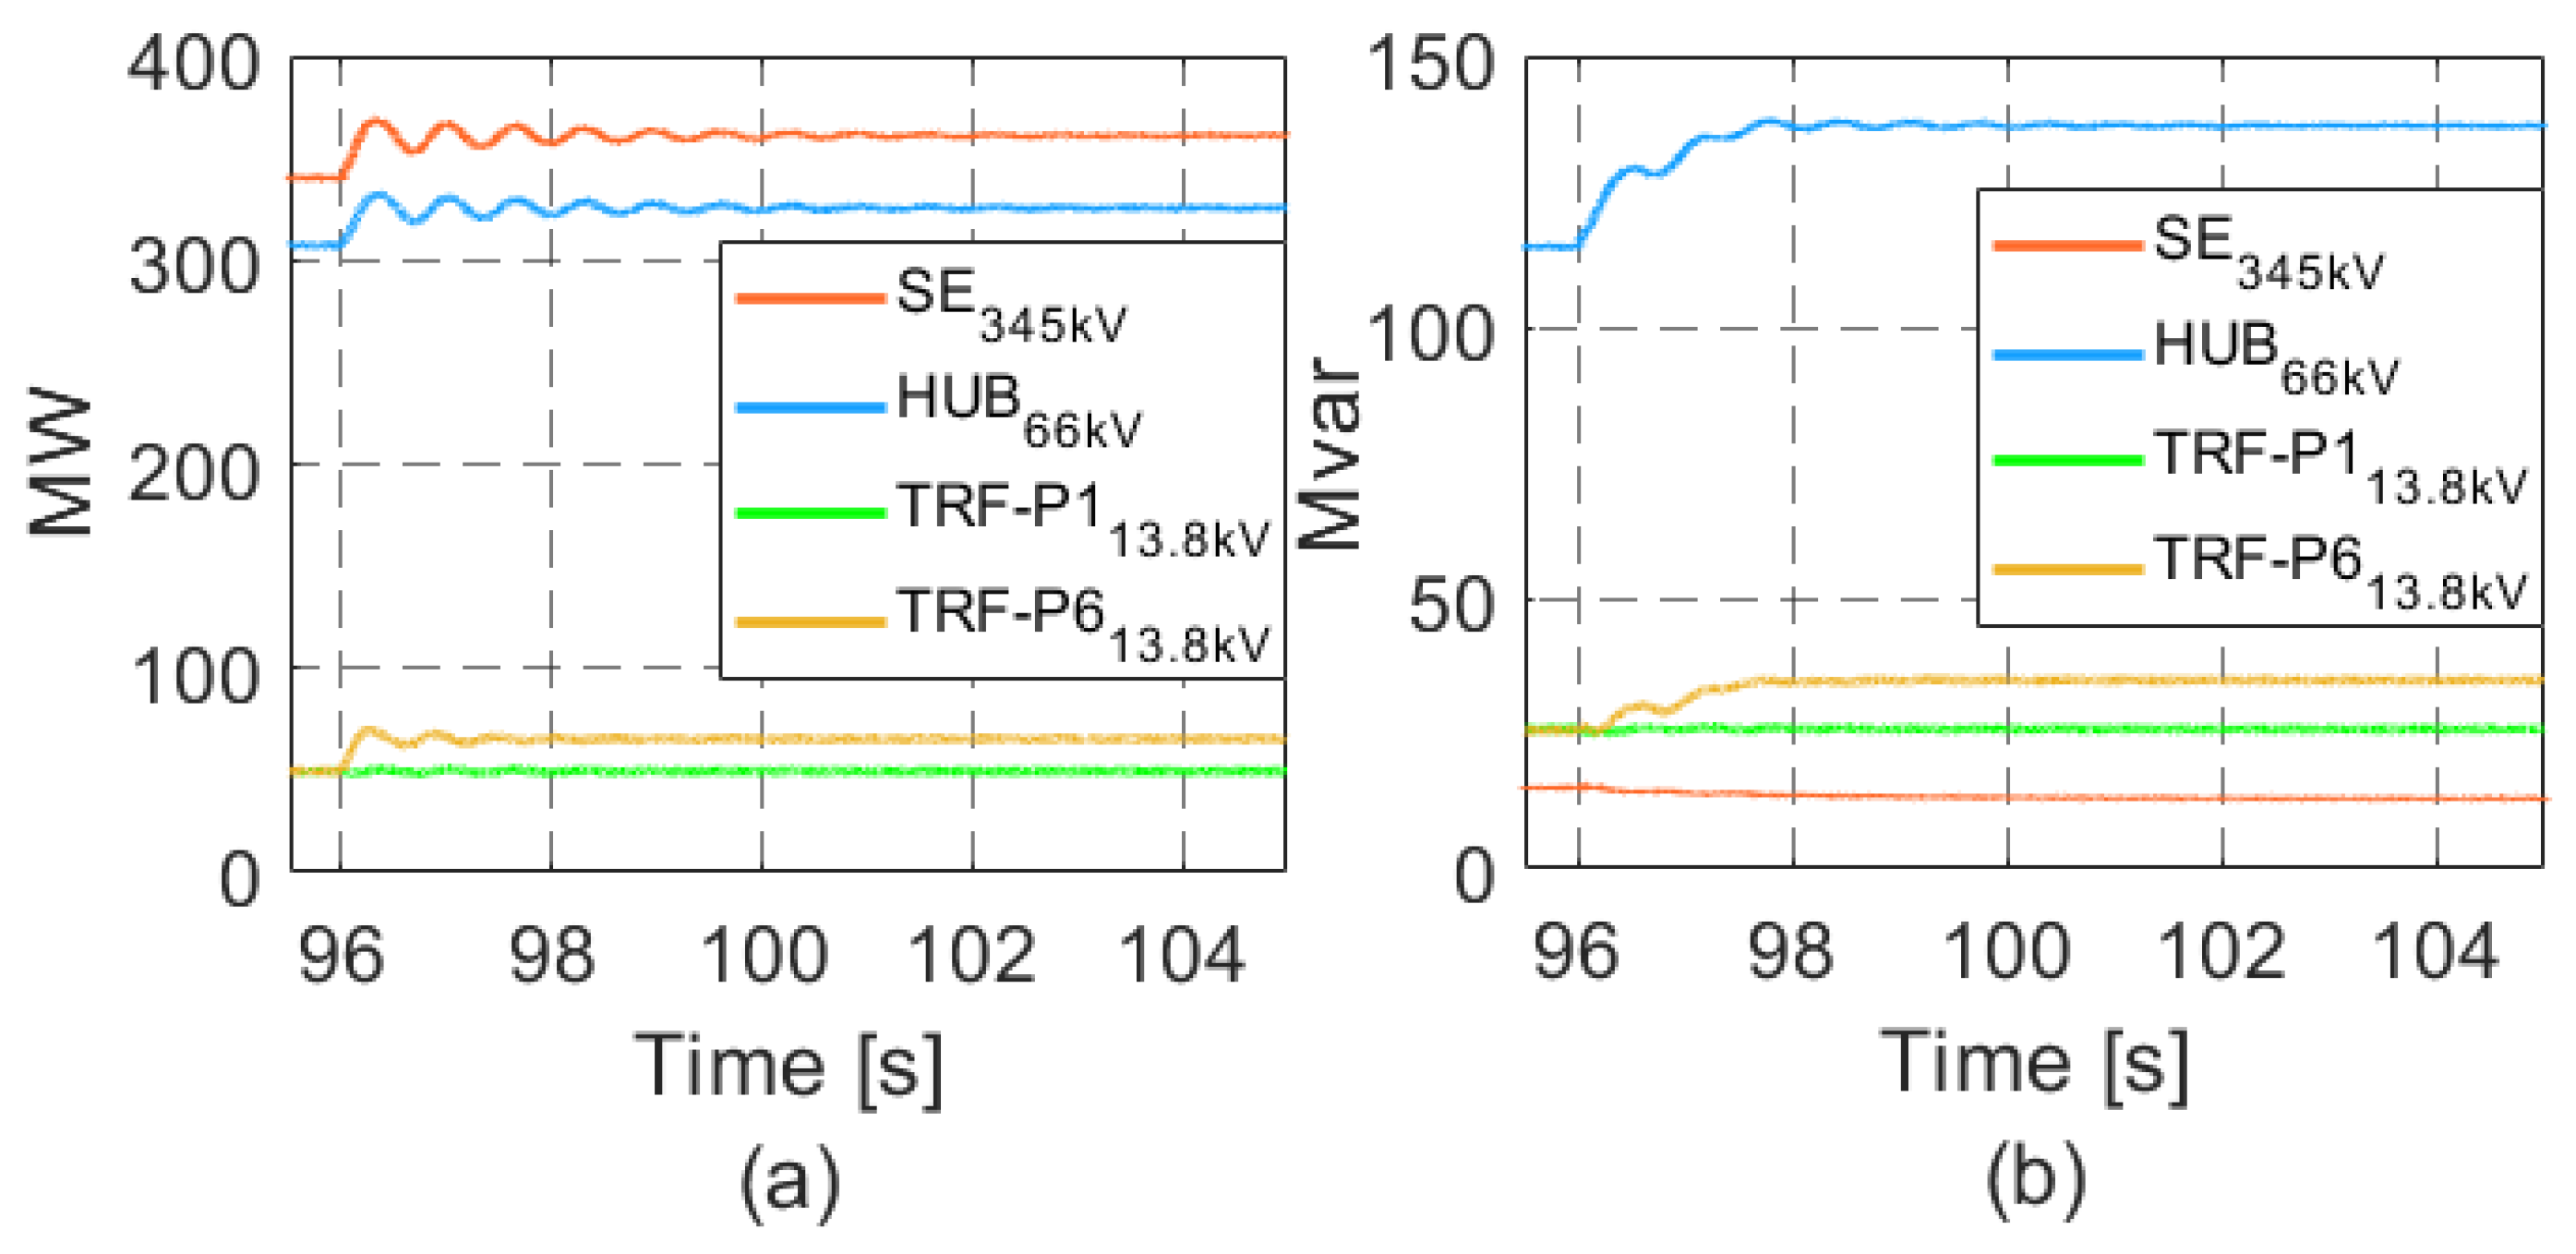
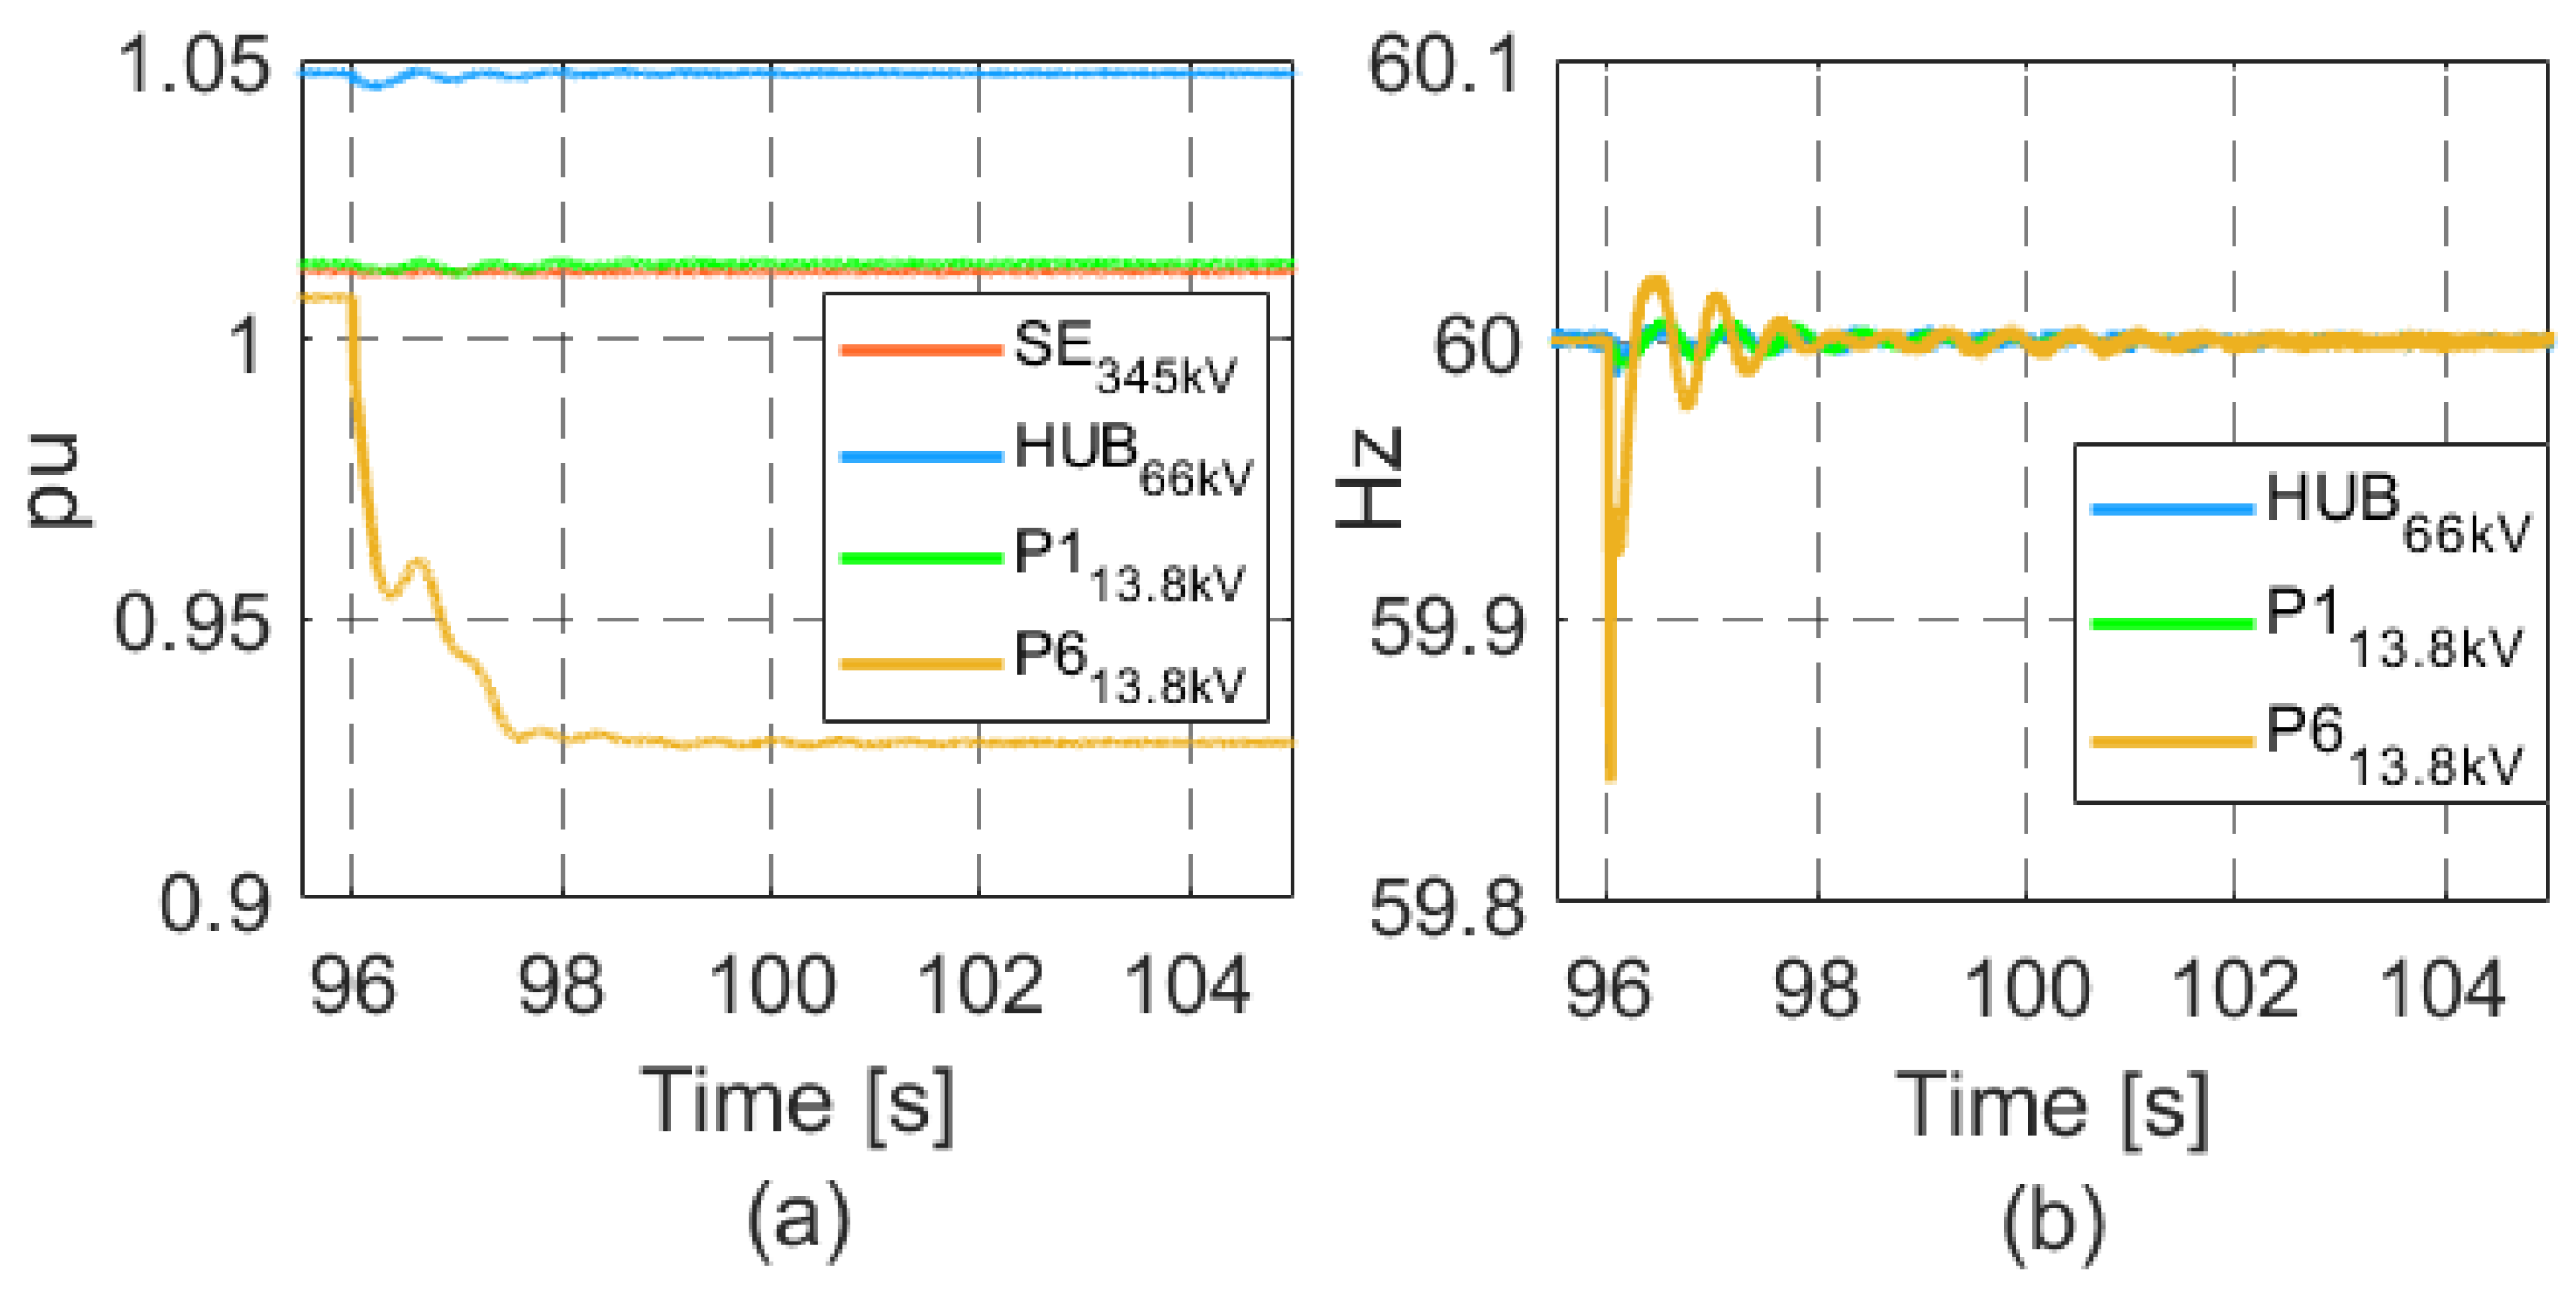
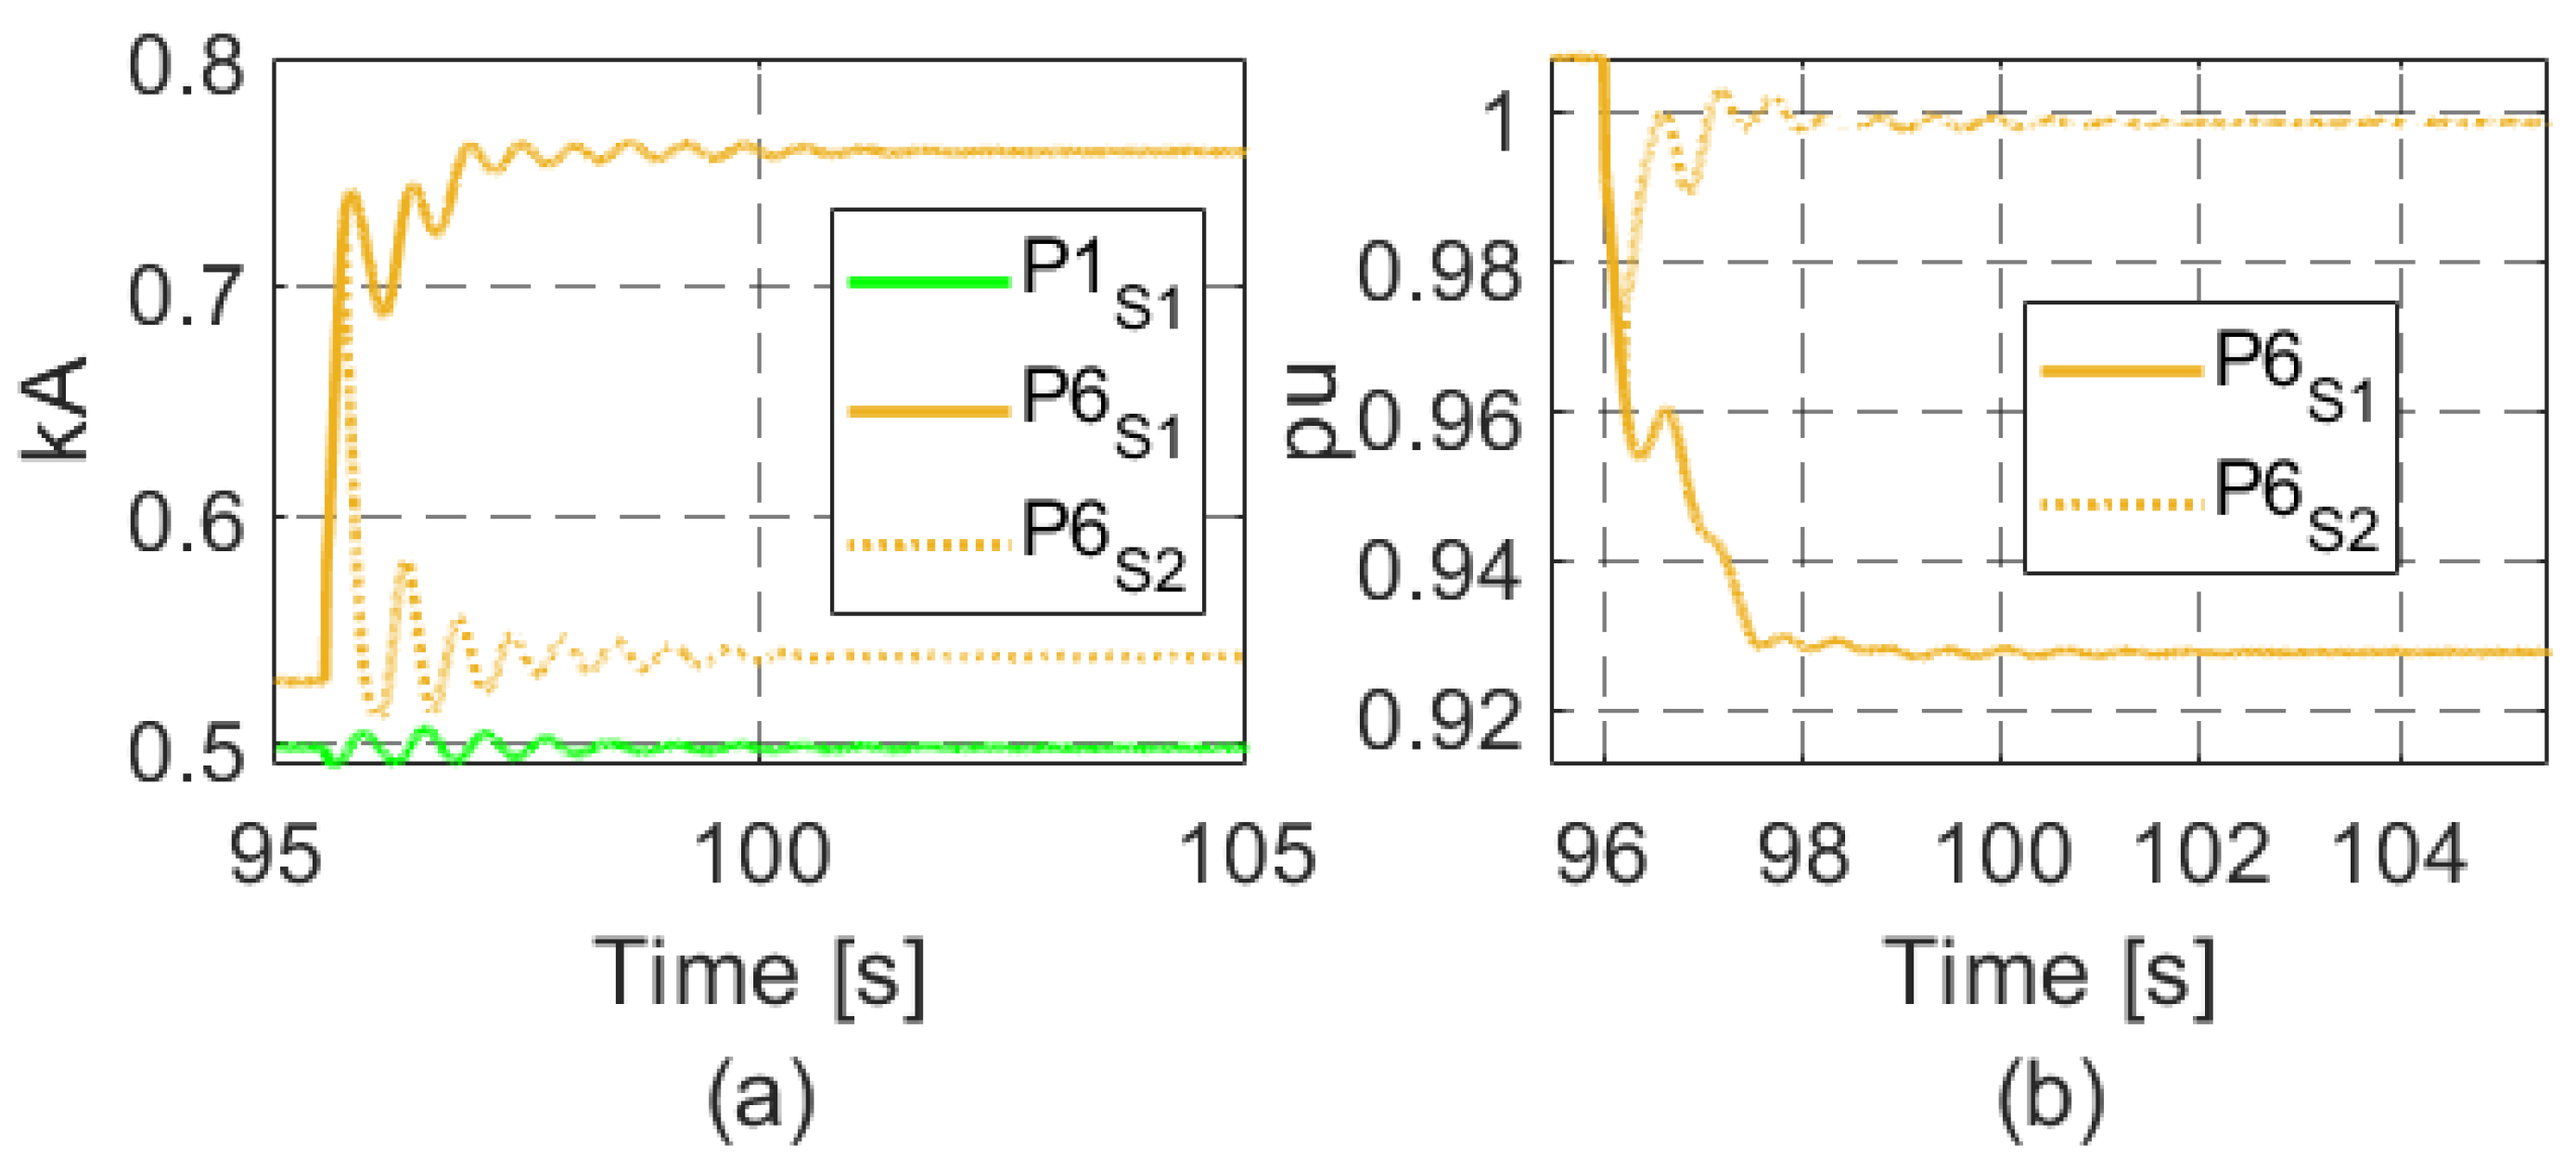
Power Supply Interruption for an FPSO Located 10 Km Away

The purpose of this simulation is to represent the sudden disconnection of an FPSO, that is, a loss of load for the system. For this, the 66 kV cable of the platform closest to the hub (P1) was disconnected at both ends, representing a deficit of 50 MW in the power demand from the SIN. This event was triggered at 96 s into the simulation.
As shown in Figure 21a, the voltage at the PCC (orange curve) remains constant, a fact attributed to the action of the voltage control provided by the rectifier station. The blue curve, which represents the voltage at the 66 kV bus, shows a slight oscillation at the FPSO unit exit. However, the voltage behavior on the disconnected platform, indicated by the green curve, illustrates a collapse, with the voltage level dropping to approximately 0.2 pu. Consequently, the frequency on the affected platform reaches a minimum of 57 Hz, but due to the acceleration of the generator, after 100 s, it reaches a maximum of 65 Hz, as illustrated in Figure 21b (green curve), indicating its instability. Meanwhile, the other platforms were observed to maintain stable frequency and voltage levels after the disconnection of FPSO 1, as observed in the case of the FPSO unit furthest from the hub (P6), represented by the yellow curves. At the hub, the frequency (blue curve) remained at 60 Hz, due to the operational control imposed by the inverter station for active power, aiming at a balance between generation and load.
Regarding the behavior of the active and reactive powers demanded at the 345 kV substation connection bus, there was a reduction from 340 to 285 MW in the active power and an increase from 15 to 20 Mvar in the reactive power, as evidenced by the orange curves in Figure 22a and b, respectively. This reduction of 55 MW in active power corresponds to the demand of the disconnected FPSO (50 MW) and the reduction in losses in the system. In the case of reactive power, the increase is due to the reduction in loading of the 64 km line by 345 kV. For the voltage level of 66 kV (hub), as indicated in Figure 22a,b (blue curves), there is a reduction in the active power and, in this case, in the reactive power as well, which is consistent with the amount of rejected demand (50 MW and 24 Mvar). Regarding the interconnection of the FPSO units with the hub-interconnection transformer (TRF), the disconnection of FPSO 1 is verified through the drop in power to zero (green curves). However, for the most distant FPSO (FPSO 6 at 60 km), only slight oscillations in the active and reactive power flows (yellow curves) were observed, but these are dampened by the action of the inverter station control, thus ensuring the operational continuity of the production units.
Still regarding the power flow, as evidenced in Figure 23a,b, for FPSO 1 we find an increase in the active and reactive powers in GS1 initially, as shown by the green curves, but this does not allow stable operation of the system after the platform is disconnected. The reduction in the voltage level implies a reduction in the generator’s power supply capacity, causing an abrupt drop in the injected power at around 102 s. The generators on the other platforms, as in the case of FPSO 6, show small oscillations in the active and reactive power outputs at their terminals after the event. However, they are damped, implying stable operation for these production units, as shown through the behavior of the yellow curves.

4.4. Events Associated with FPSO Units

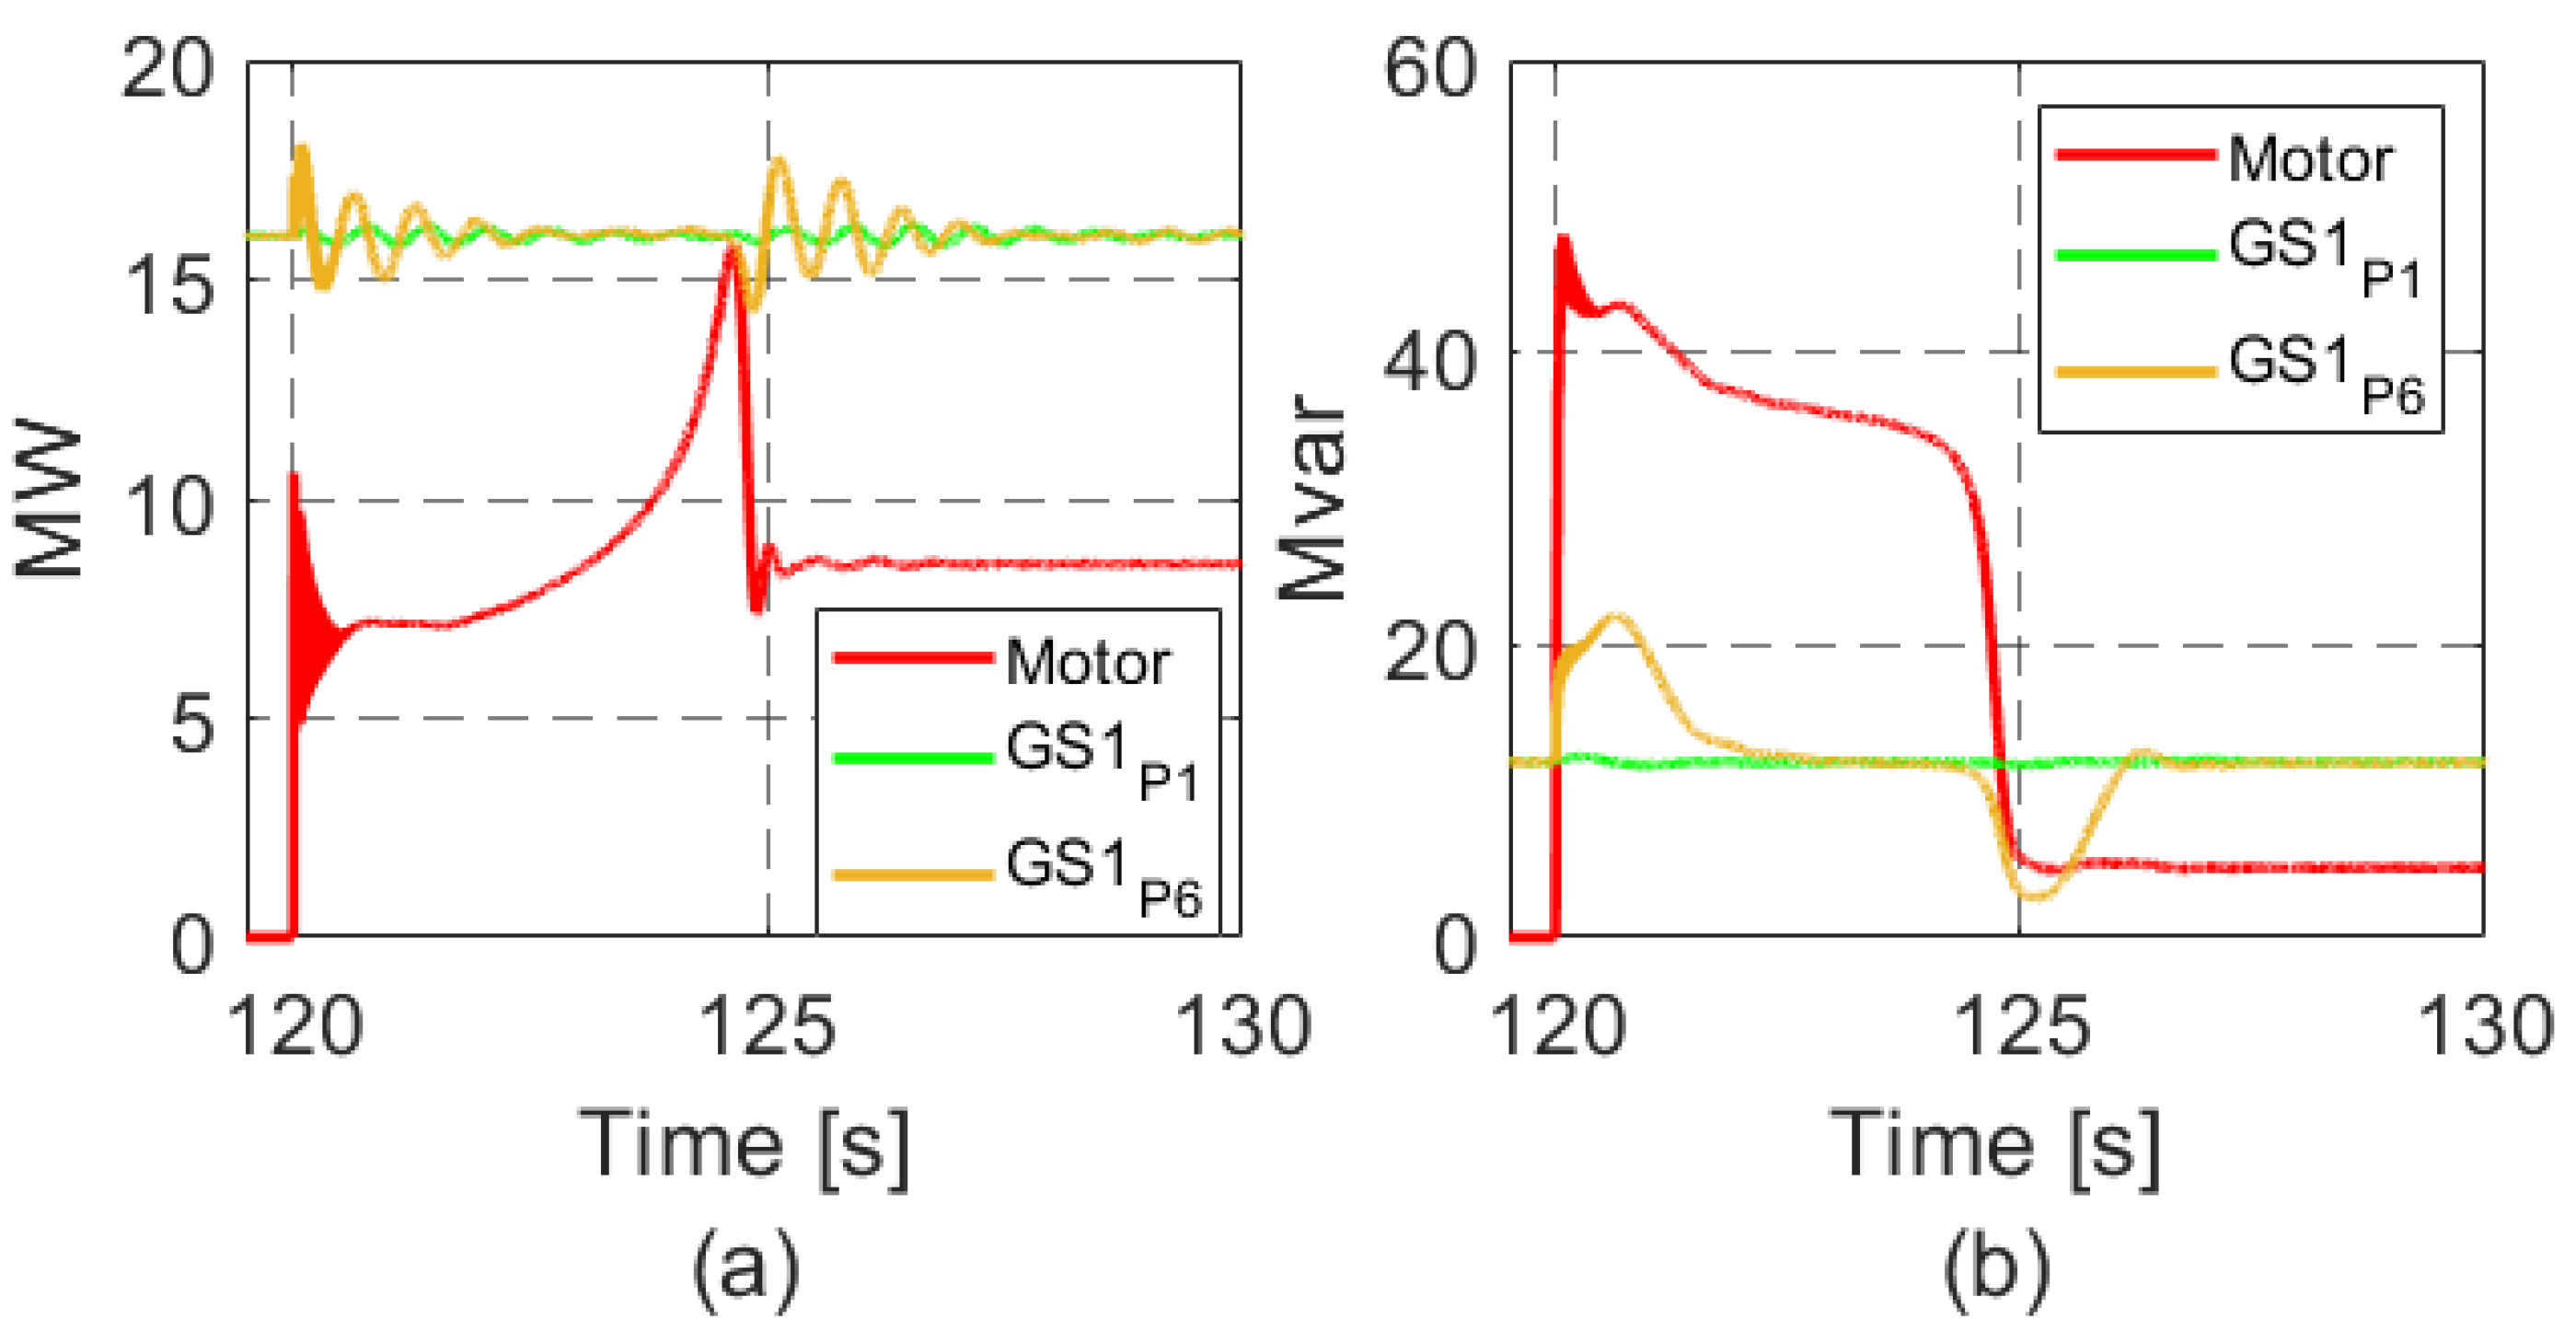
4.4.1. Startup of a Large Capacity Motor on the FPSO Unit Located at a Distance of 60 km

A common occurrence that raises concerns regarding the safe operation of an FPSO is the startup of large induction motors. As such, analyzing this scenario is essential, particularly in installations with long electrical distances, as they are more susceptible to voltage drops, as is the case with the production unit located 60 km from the hub.
In this scenario, the direct online startup of an 11 MW motor connected to the 13.8 kV bus is simulated, beginning at 120 s into the simulation and lasting approximately 5 s. Figure 24a shows that this event does not impact the voltage at the 345 kV substation bus (orange curve), which remains around 1.012 pu. At the 66 kV hub bus, shown in blue, a slight oscillation can be observed at the beginning of the startup, but this quickly returns to the pre-event value of 1.048 pu. This stability is maintained due to the action of the inverter control, which promptly adjusts the reactive power flow to maintain this variable around its reference value. At the 13.8 kV buses of the production units, it can be observed that the voltage in FPSO 6 (yellow curve) presents a voltage dip to 0.86 pu, a value within acceptable limits [19], and returns to normal levels (1.007 pu). For FPSO 1 (green curve), the amplitude of the voltage oscillation is minimal, thus maintaining stable operation.
Regarding the system frequency, it can be observed from Figure 24b that for the 66 kV bus, indicated by a blue curve, there is a slight oscillation at the time of startup, but it remains at 60 Hz due to the operational control imposed by the inverter station for the active power, aiming at the balance between generation and load. On the platforms, the frequencies (green and yellow curves) behave normally, with a greater oscillation (around 0.2%) on the platform where the event occurs (FPSO 6, yellow curve), but stabilize at the nominal value.
As shown in Figure 25a,b, before the event, the active and reactive powers (orange curves) at the onshore substation were around 329.6 MW and 16 Mvar, respectively. With the motor startup, the active power flow from the SIN to the offshore interconnection increased from 329.6 to 340 MW to meet the new load demand of FPSO 6. At the 66 kV bus, indicated by a blue curve, the power flow increased from 297.8 to 307.2 MW. For FPSO 6, the active power flow (yellow curve) rose from 41.2 to 49.6 MW, confirming that this increase in demand is supplied by the 66 kV distribution network.
Regarding the reactive power in the SIN, shown by the orange curve in Figure 25b, it suffers a decrease of approximately 0.7 Mvar due to an increase in the loading of the 64 km line at 345 kV. At the 66 kV bus (blue curve), we see an increase from 106.6 to 114.5 Mvar. It is worth noting that during the motor startup process, the reactive power delivered by the inverter reaches maximum values of the order of 156.7 Mvar, which is evidence that the response of the inverter station predominates over the platform generators in supplying the reactive power required by the motor at its startup. For the interconnection of FPSO 6 to the hub (yellow curve), an increase in flow from 21.9 to 25.6 Mvar can be observed, with a maximum value of around 52.4 Mvar during startup. At FPSO 1, represented by the green curve, a small oscillation in the reactive power can be observed, but without any compromise to operation.
The active and reactive power outputs at the terminals of one of the generators (GS1) of FPSO units 1 and 6 are shown in Figure 26a,b. For FPSO 6, indicated by the yellow curve, oscillations in active and reactive power flows can be observed at the beginning and end of startup, without impacting the established values of 16 MW and 12 Mvar, respectively. The generator of FPSO 1 (green curve) shows slight oscillation in the active and reactive powers at its terminals during the event, which, once damped, reveals stable operation for this production unit.
Figure 26a,b also illustrate the behavior of the active and reactive powers of the motor put into operation (red curves), although it has a nominal power of 11 MW, it demands around 8.5 MW and 4.8 Mvar, consuming an approximate current of 406 A in steady-state conditions, while reaching a peak of 2.5 kA at startup.

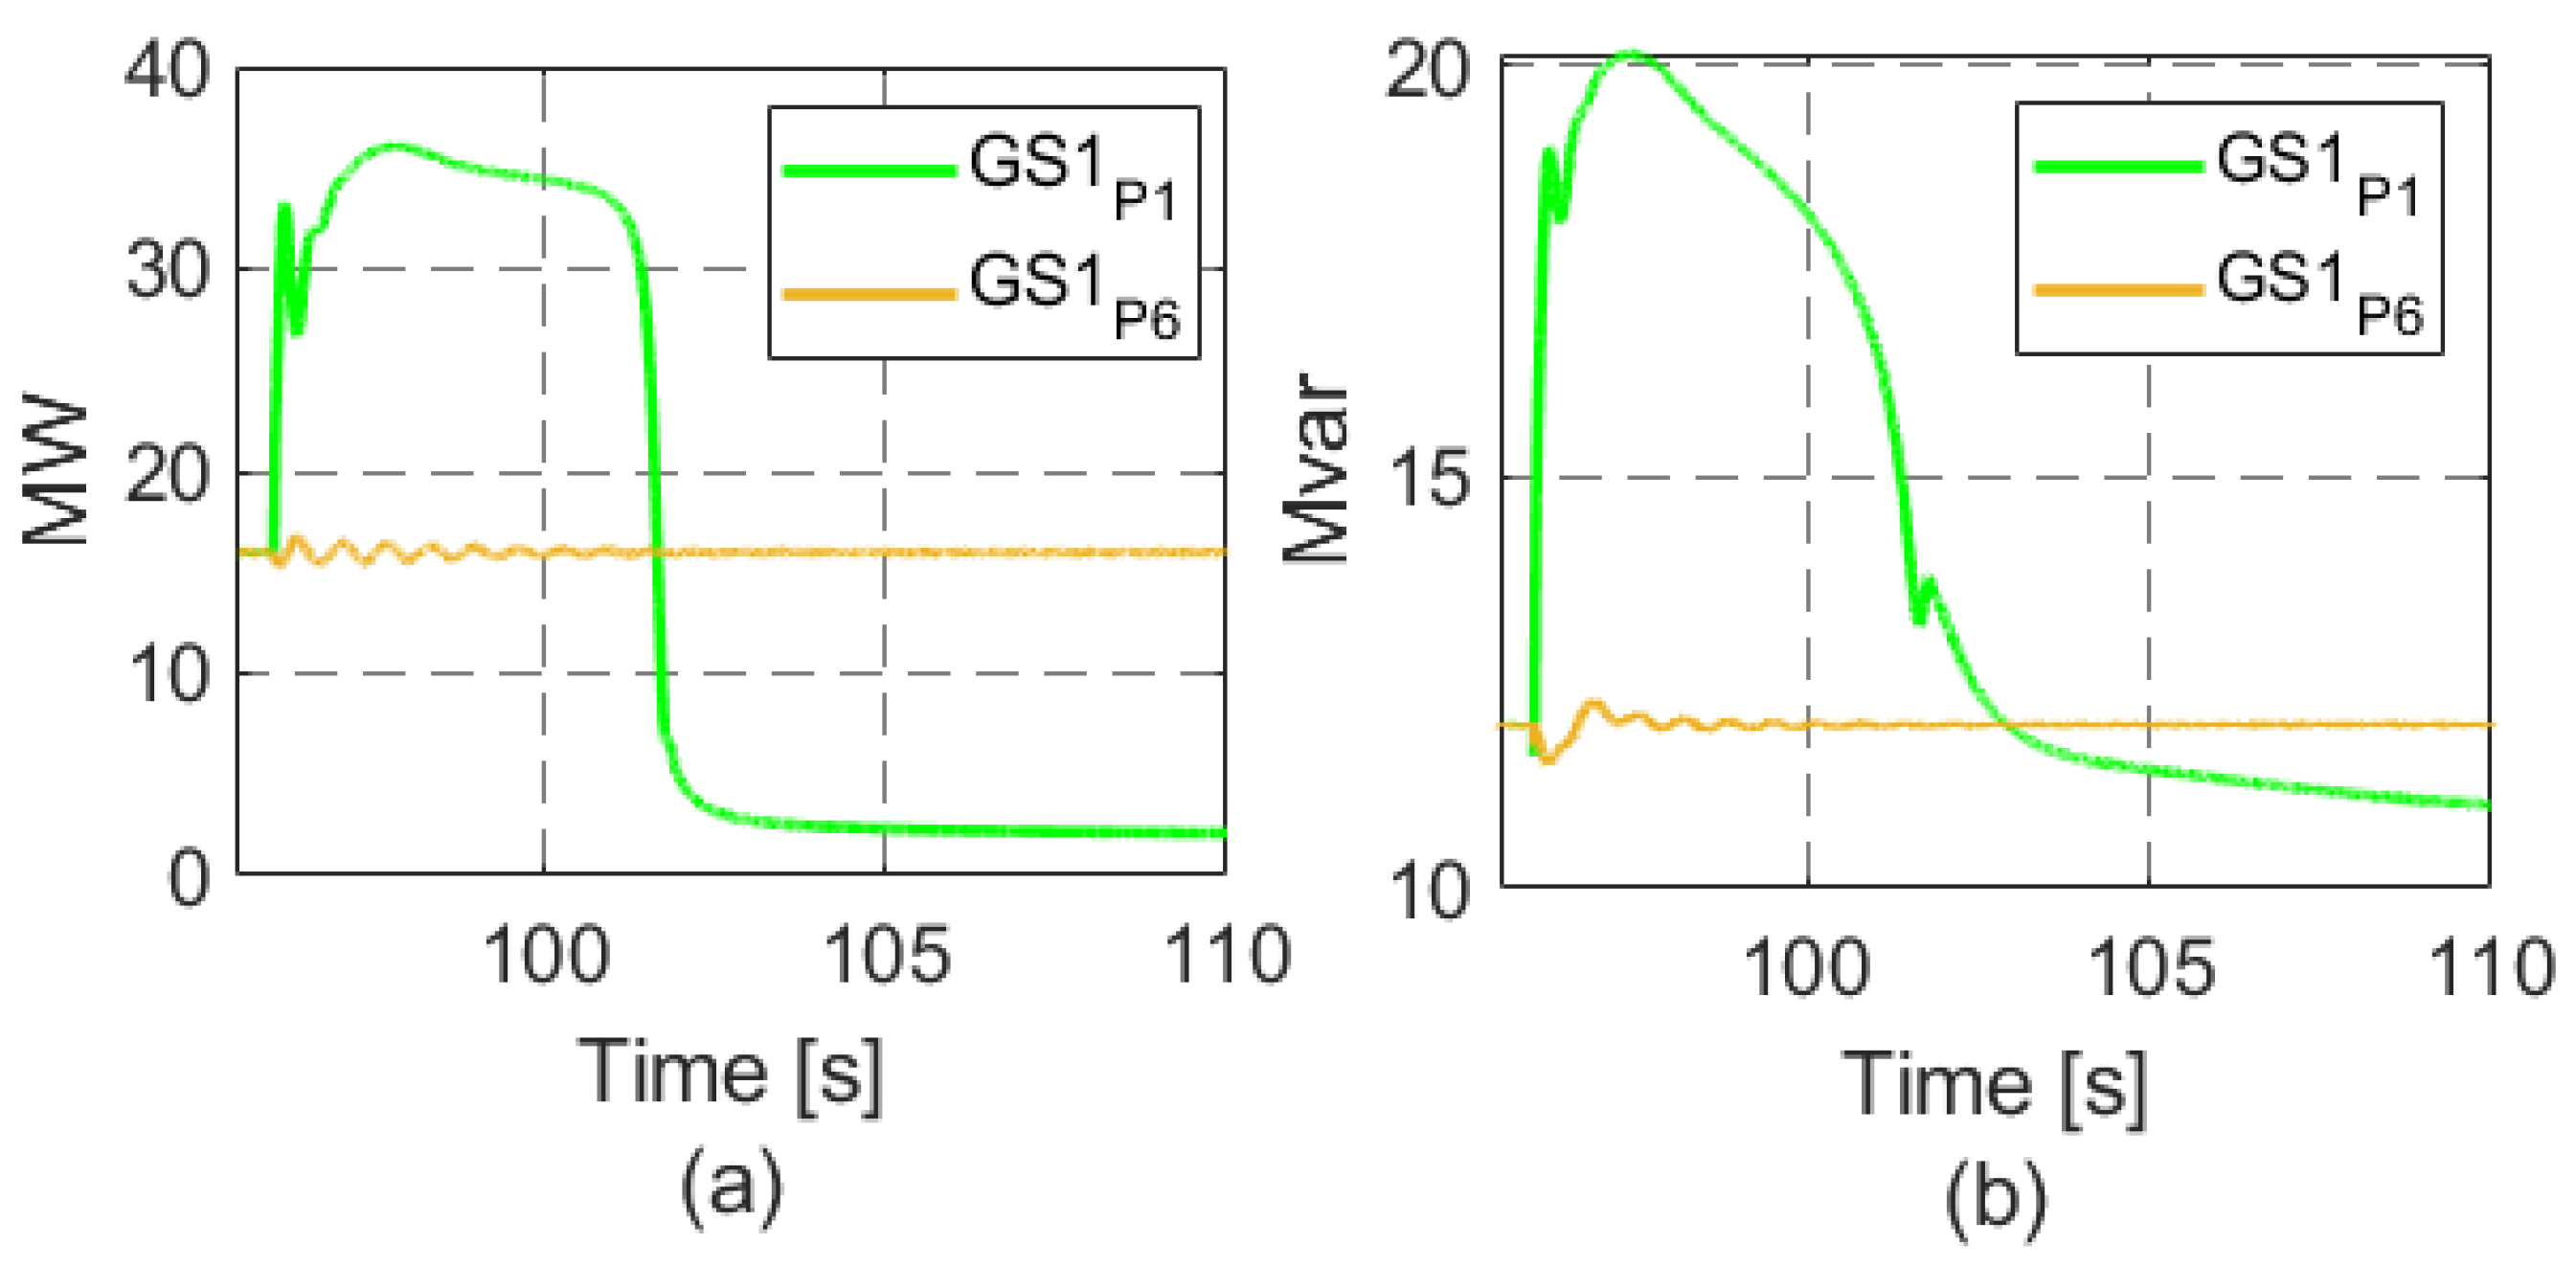
4.4.2. Loss of a Synchronous Generation Unit Located 60 Km Away

The loss of local generation on an FPSO is a feasible event. Therefore, such a case was simulated to evaluate the performance of the electrical system following the loss of one of the generators (GS1) on the most remote platform (60 km from the hub), given its association with the most significant impacts of the event. Figure 27a,b show the active and reactive power flows from the SIN to the offshore interconnection (orange curves), as well as the power delivered by the inverter to the hub (blue curves). As expected, the loss of a generating unit on FPSO 6 leads to an increase in active power importation from 340 to 360 MW. Regarding reactive power, the control action of the rectifier station reduces the flow from 15 to 13 Mvar to support voltage regulation at the PCC. The active power delivered by the inverter, initially at 307 MW, increases to approximately 325 MW to cover the generation deficit. The reactive power, originally at 114 Mvar, increases to 137 Mvar. The voltage at the 66 kV hub bus, as shown in Figure 28a (blue curve), exhibits an oscillatory behavior that is damped due to the inverter control system acting to restore the variable to its pre-event level of 1.048 pu. The frequency at the hub, as indicated in Figure 28b (blue curve), also oscillates as a result of the generator’s disconnection, but it stabilizes at 60 Hz due to the action of the inverter control system.
After the event, the voltage on the 13.8 kV bus of FPSO 6 reduces to 0.93 pu as a result of the decrease in reactive power of the generation system, as illustrated in Figure 28a (yellow curve). The frequency, shown in Figure 28b (yellow curve), reflects the momentary imbalance between generation and consumption, manifested in the form of oscillations that are subsequently damped by adjusting the active power flow imposed by the inverter station. In turn, and to a much lower extent, the voltage and frequency for FPSO 1, shown in Figure 28a,b (green curves), also experience damped oscillations due to the event. However, even with the reduced value, the post-event voltage on FPSO 6 remained within the 10% limit for steady-state tolerance, as shown in Table 1.
The active and reactive power flows of the generators, as shown in Figure 29a,b, in FPSO 1 are represented by the green curves, indicating small damped oscillations up to the stabilization point. For FPSO 6, the generator powers (GS1) (red curves) show zero values due to disconnection. However, the generator that remains in operation (GS2) continues to operate at 16 MW and 12 Mvar (yellow curves) after the disturbance. As for the active and reactive power flows in the interconnection of the FPSO units to the hub-interconnection transformer (TRF), the yellow curves in Figure 27a,b indicate an increase from 50 to 65 MW and from 25 to 35 Mvar in the power import of FPSO 6, respectively, in order to cover the generation deficit that occurred. In importing power from the FPSO unit, the values remain the same after the event, as shown by the green curves.
Here, we address an important aspect observed in relation to the loads imposed on the distribution network cables. For the proposed topology, the ampacity limit of the cable is 725 A, while the current in steady state is around 530 A. In this case, the increase in power imported from the hub to FPSO 6 implied an increase in current to 760 A, as can be observed in Figure 30a (solid yellow curve). This fact determines that there is a need for measures aimed at making the load currents compatible with the nominal capacity of the cable. Thus, a load shedding strategy was adopted on FPSO 6, 200 ms after the loss of the generating unit, with the amount rejected being equivalent to the 16 MW supply of GS1. Figure 30a (dashed yellow curve) shows the behavior of the current in the cable connecting the hub to FPSO 6 based on this new operational condition, which shows the current having been reestablished to 537 A. In turn, the strategy adopted, in addition to seeking to alleviate the overloading of the interconnection with the hub, also mitigated the undervoltage issue observed at the 13.8 kV bus of the platform in question. After load shedding, the voltage at FPSO 6 was restored to 1.00 pu, as shown in Figure 30b (dashed yellow curve).
Given the results, it is worth noting that the loss of two generating units (GS1 and GS2) together in an FPSO would result in a critical scenario; however, this scenario is unlikely to occur. In this situation, the voltage on the 13.8 kV bus would experience a dip greater than 0.93 pu (in the case of the loss of one generating unit). Furthermore, the current in the distribution network cable would exceed the maximum permissible value of 725 A.

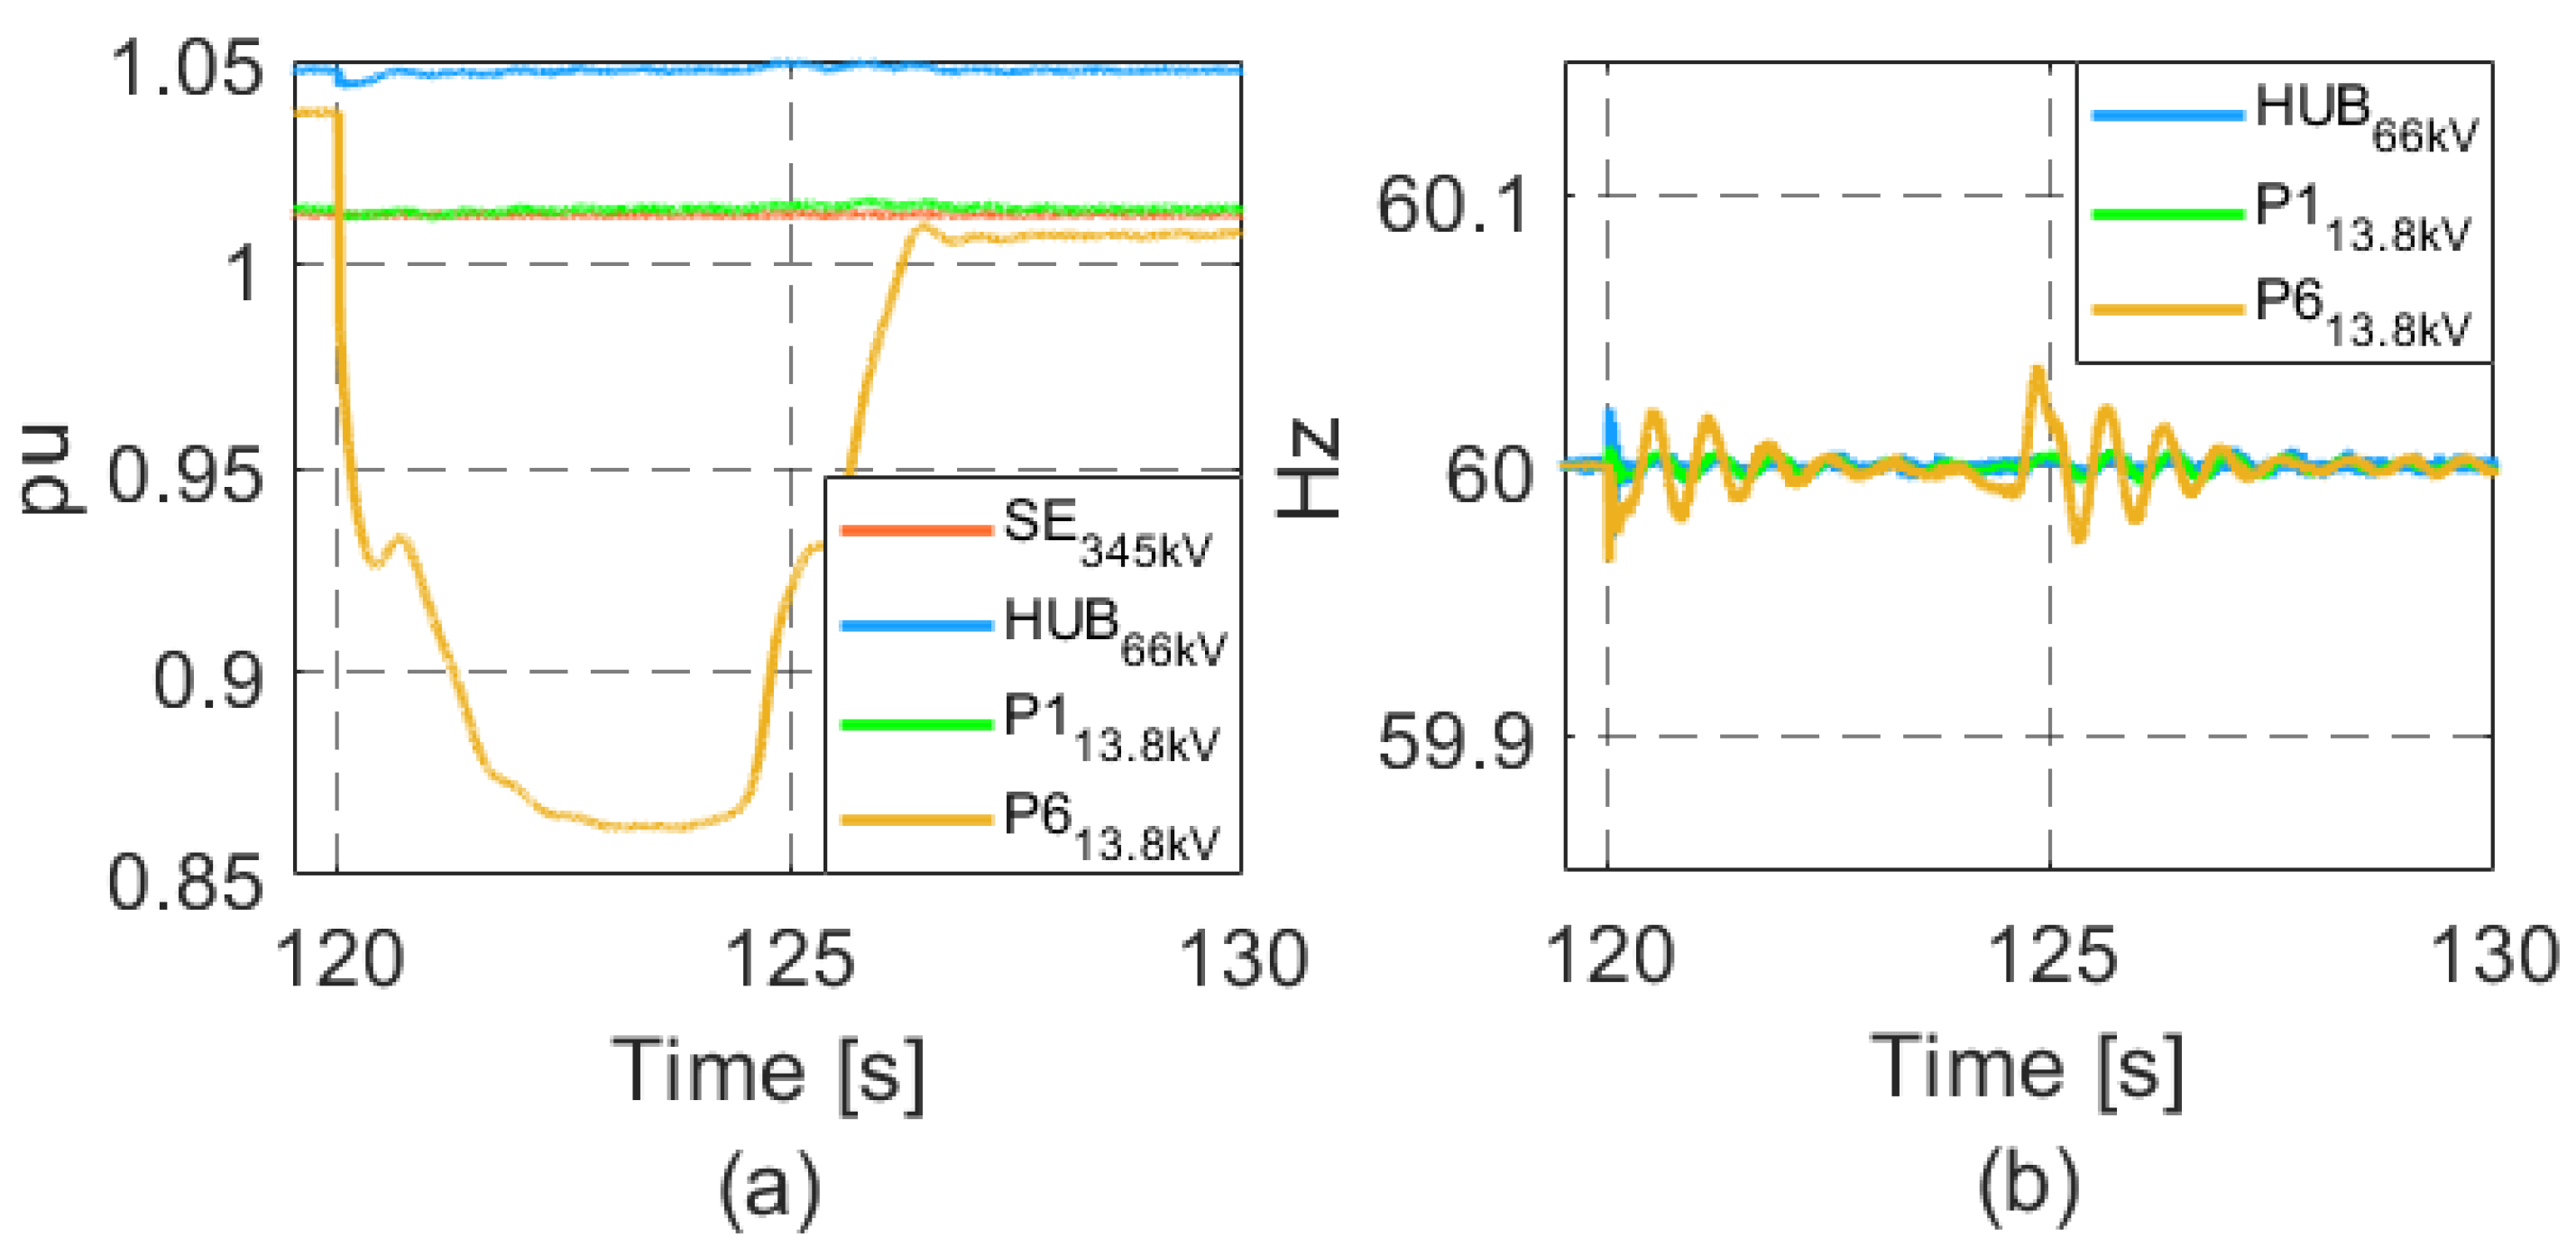
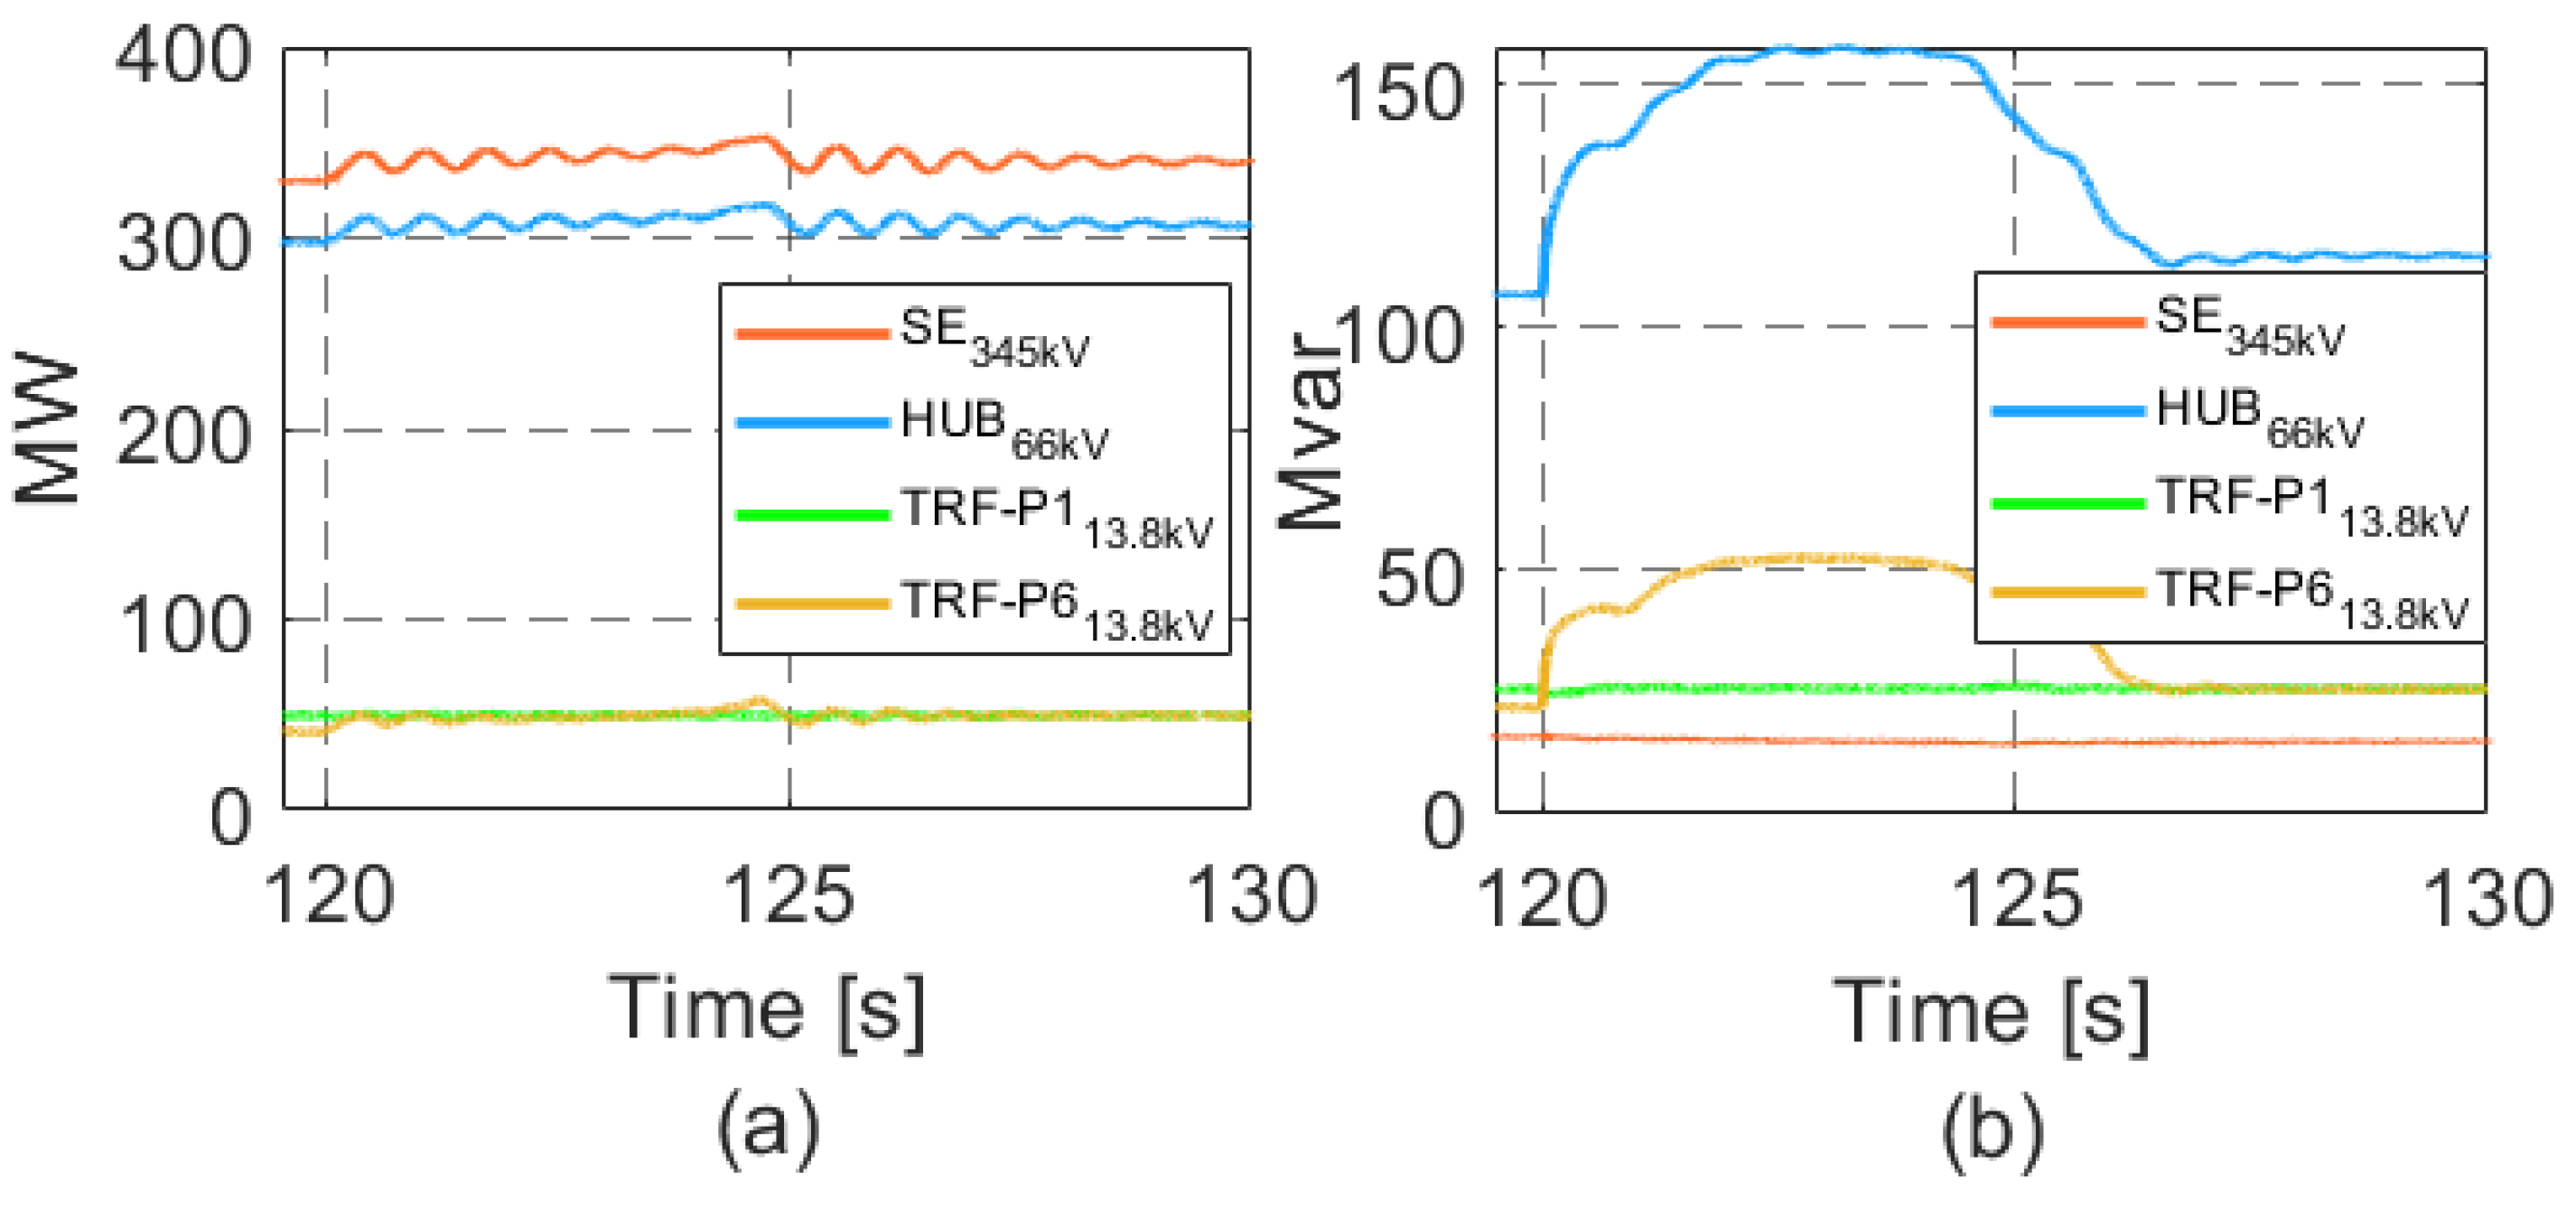
4.4.3. Three-Phase Short Circuit on the 13.8 kV Bus of the FPSO Unit Located 10 km Away

This final case involves the occurrence of a three-phase short circuit at the 13.8 kV bus of the FPSO unit located 10 km from the hub. This scenario was chosen due to the fact that it would have a significant impact on maintaining process stability and, consequently, the stability of the entire installation. In this case, the fault lasts 100 ms and is cleared without causing disconnection of the FPSO unit from the distribution network. The active and reactive power flows from the SIN to the offshore interconnection are shown in Figure 31a,b (orange curves). It can be observed that during the short circuit, the rectifier station exhibits an oscillation in the importation of active power, which is damped shortly after the fault’s clearance. Regarding reactive power, the control action of the rectifier station also causes variations in this quantity in order to support voltage regulation at the PCC. As a result, the voltage at the 345 kV substation tends to remain at 1.012 pu, as illustrated in Figure 32a (orange curve).
The behavior of the active and reactive power outputs, which go from the inverter station to the hub, is shown in Figure 31a,b (blue curves). Once the event occurs, the active power is reduced from 307 to 277 MW, restoring itself immediately after the fault has been cleared. Regarding the reactive power, an increase from 117 to 200 Mvar was observed, which is operationally limited by the inverter unit. After the disturbance, the power stabilizes again at 117 Mvar, thus maintaining the voltage on the 66 kV bus of the hub at 1.048 pu, after having reached the value of 0.80 pu during the fault, as shown in Figure 32a (blue curve). As for the frequency at the hub, as indicated in Figure 32b (blue curve), it is impacted due to the momentary imbalance between the power supplied and consumed, promoting a damped oscillatory process.
Regarding the behavior of the internal network in the production units, Figure 32a (green and yellow curves) shows the behavior of the voltages in the 13.8 kV buses of FPSO units 1 and 6. As expected, FPSO 1 experiences a voltage dip, which results in a zero value during the short circuit. FPSO 6 is also impacted, however, more mildly, reaching levels of around 0.9 pu during the event, but returning to its initial operational condition. The frequencies in the 13.8 kV buses of the FPSO units are indicated in Figure 32b (green and yellow curves), showing oscillations that then stabilize due to the actuation of the control systems of the inverter located in the hub. In the interconnection between the FPSO units and the hub-interconnection transformer (TRF), the active and reactive powers present variations that are damped with the restoration of the operating conditions, as shown in Figure 31a,b (green and yellow curves). As for the active and reactive powers for one of the generators (GS1), Figure 33a,b show that, due to the voltage dip caused by the fault, there is a reduction in the active power injection capacity in the 13.8 kV bus. As a consequence of the momentary imbalance between the mechanical power on the generator shaft and the electrical power supplied, its frequency undergoes changes, which are damped when the fault is eliminated. In terms of the reactive powers of the generators, in order to maintain the power factor at the generator output at a constant value, changes are also observed, which return to pre-fault values.

5. Conclusions

This study presents a technical feasibility analysis of a proposed system for connecting an offshore oil platform complex to the onshore power grid, analyzing various critical dynamic scenarios from an operational perspective. To this end, the entire electrical system was modeled in PSCAD software, from the FPSO unit loads through the distribution system, HVDC transmission, and HVAC transmission up to the substation where it connects to PAC.
Given the various scenarios evaluated, the loss of connection with the onshore system is critical, requiring additional actions to ensure that the platforms remain in an operational state with voltage and frequency values within regulatory limits. For this, it was necessary to disconnect the DC link, shed loads, disconnect the 66 kV cables, and, finally, disconnect the automatic transition of the control mode in the AVR, prioritizing the reference voltage.
In response to a three-phase short circuit lasting 100 ms on the 345 kV network, the system performed satisfactorily, with coordinated actions from both the rectifier and inverter stations contributing to power flow support and maintaining other variables within normal operating conditions. In contrast, for a 100 ms fault in the DC transmission cable, resulting in a loss of transmission capacity, an increase in voltage levels was observed on the FPSO units, along with a reduction in frequency. Therefore, to reverse this scenario, on-load tap switching of the transformer at the FPSO unit input (66/13.8 kV) was adopted, in addition to the rejection of 20 MW of load per platform, which resulted in conditions similar to those before the fault. In the case of a short circuit at the 13.8 kV bus of the FPSO unit closest to the hub, a variation in power flow and a voltage dip across the platforms was observed, with the most critical impact occurring at the fault location. However, after fault clearance (100 ms) and the response of the inverter station control, the entire system settled back into steady-state operating conditions.
When simulating an interruption of the power supply to the FPSO unit located 10 km from the hub, no major concerns arose regarding the rest of the system, as the inverter station contributed to maintaining the balance between generation and load. However, it is possible to keep the disconnected platform operating in island mode by adopting measures such as load shedding and, potentially, switching the control mode at the AVR input to prioritize voltage reference instead of power factor.
The most likely scenario to occur on a platform is the startup of a large motor. However, as evaluated in this study, no additional actions were required, even when simulating the direct online startup of an 11 MW motor coupled to its mechanical load. In the scenario involving the loss of a generating unit, which also has a high probability of occurring, the loss of a generator on the most remote FPSO (60 km away) was simulated. This was found to result in increased demand on the onshore system, given that the remaining generator on the affected platform continues operating at fixed active and reactive power outputs. Although the voltage at FPSO 6 experienced a reduction, the voltage and frequency levels upstream of the rectifier substation and downstream of the inverter substation were maintained due to the control actions of these devices, which aim to regulate voltage and maintain the generation–load balance, respectively. However, in this scenario, the current levels in the cables connecting the FPSO units to the 66 kV hub become critical, as they may exceed the thermal ampacity limit of the cable. In this study, the issue was resolved by shedding 16 MW of the load on the affected FPSO unit.
Based on the analysis, it is concluded that the proposed electrical system is technically viable and feasible to implement, representing an option for oil companies that can benefit from a more reliable and stable system. Additionally, it aligns with global temperature containment goals by reducing the number of generators used for local electricity production on the FPSO unit, thereby contributing to the reduction in GHG emissions. Furthermore, this study provides a systemic and complex model with real parameters, enabling reliable responses to the events evaluated here, as well as serving as a foundation for future work.

Author Contributions

Conceptualization, J.O.N., L.J.d.M. and C.A.V.G.; methodology, validation, formal analysis, and investigation, J.O.N., L.J.d.M. and C.A.V.G.; resources, J.O.N., L.J.d.M. and C.A.V.G.; data curation, J.O.N., L.J.d.M., A.R. and M.R.d.P.J.; writing—original draft preparation, J.O.N., L.J.d.M. and C.A.V.G.; writing—review and editing, J.O.N., L.J.d.M. and C.A.V.G.; visualization, supervision, project administration, and funding acquisition, J.M.d.C.F., C.A.V.G., J.C.O., J.M.T.M., V.Z.S. and C.A.C.C. All authors have read and agreed to the published version of the manuscript.

Funding

This research was funded by Petrobras, a Brazilian oil and gas company, through Project N° 0050.0121196.22.9.

Data Availability Statement

Requests to access the datasheet should be directed to johnnyorozco12@gmail.com, luciomotta@unifei.edu.br, and carlosvillegasguerrero@unifei.edu.br.

Acknowledgments

The authors would like to thank Petrobras, a Brazilian oil and gas company, for supporting this research project.

Conflicts of Interest

The authors declare no conflicts of interest. The funders had no role in the design of the study; in the collection, analyses, or interpretation of data; in the writing of the manu-script; or in the decision to publish the results.

References

  1. DownToEarth. Available online: https://www.downtoearth.org.in/environment/stockholm-1972-united-nations-conference-on-the-human-environment-world-environment-day-2022-83215 (accessed on 9 November 2024).
  2. United Nations—Climate Change. Available online: https://unfccc.int/process/the-convention/history-of-the-convention#Climate-Change-in-context (accessed on 9 November 2024).
  3. United Nations—Climate Action. Available online: https://www.un.org/en/climatechange/reports (accessed on 9 November 2024).
  4. UNFCCC. Conference of the Parties Serving as the Meeting of the Parties to the Paris Agreement (CMA). In UN Climate Change Conference—United Arab Emirates Nov/Dec 2023. Available online: https://unfccc.int/documents/636608 (accessed on 9 November 2024).
  5. United Nations—COP 29. Available online: https://unfccc.int/event/cop-29#decisions_reports (accessed on 25 March 2025).
  6. International Energy Agency—IEA, World Energy Outlook. 2018. Available online: https://www.iea.org/reports/world-energy-outlook-2018/oil-and-gas-innovation (accessed on 10 September 2024).
  7. Ballari, A.; Østensen, J.S. Electrification of the Utsira Formation: Electric System Requirements for a Power Distribution Platform. Master’s Thesis, University of Agder, Kristiansand, Norway, 2013. Available online: http://hdl.handle.net/11250/136731 (accessed on 5 January 2023).
  8. Planalto—Latest News. Available online: https://www.gov.br/planalto/en/latest-news/2023/11/brazil-at-cop28-climate-leadership-and-expectations-for-a-sustainable-future (accessed on 12 November 2024).
  9. Diário Oficial da União—DOU 2022. Available online: https://www.jusbrasil.com.br/diarios/1189331435/dou-secao-3-23-06-2022-pg-84 (accessed on 20 December 2023).
  10. Oliveira, M.F. Metodologia para Aplicação de Fontes Renováveis de Energia. Master’s Thesis, Escola Politécnica da Universidade de São Paulo, São Paulo, Brazil, 2013. Available online: https://teses.usp.br/teses/ (accessed on 14 November 2022).
  11. Antunes, M.A.; Brandão, D.I.; Biajo, V.H.M.; Oliveira, F.S.; Silva, S.M. Floating, Production, Storage, and Offloading Unit: A Contingency Operating Mode Using Variable Frequency Drives. IEEE Access 2024, 12, 68149–68159. [Google Scholar]
  12. Amin, A.; Rygg, A.; Molinas, M. Active Power Flow Direction Effect on Stability in Multi-terminal VSC-HVDC Transmission System in Integrating Wind Farm. In Proceedings of the IEEE 17th Workshop on Control and Modeling for Power Electronics, Trondheim, Norway, 27–30 June 2016; pp. 1–8. [Google Scholar]
  13. Toro-Mendoza, M.A.; Segundo-Ramírez, J.; Esparza-Gurrola, A.; Visairo-Cruz, N.; Guitiérrez, C.A.N.; Pérez-negrón, C. Toward Adaptive Load Shedding Remedial Action Schemes in Modern Electrical Power Systems. IEEE Access 2023, 11, 111011–111033. [Google Scholar] [CrossRef]
  14. ABNT NBR: IEC 61892-1; Unidades Marítimas Fixas e Móveis—Instalações Elétricas—Parte 1: Requisitos e Condições Gerais. ABNT: Rio de Janeiro, Brazil, 2016.
  15. EPE—Empresa de Pesquisa Energética, Matriz Energética e Elétrica. Available online: https://www.epe.gov.br/pt/abcdenergia/matriz-energetica-e-eletrica (accessed on 20 September 2024).
  16. EPE—Empresa de Pesquisa Energética, Nota Informativa: Base de Dados de Curto-circuito. 2022. Available online: https://www.epe.gov.br/pt/leiloes-de-energia/leiloes-de-transmissao/bases-de-dados (accessed on 10 October 2024).
  17. PSCAD—Knowledge Based. Available online: https://www.pscad.com/knowledge-base/article/222 (accessed on 10 October 2023).
  18. CIGRE—Working Group B4.57. Guide for the Development of Models for HVDC Converters in a HVDC Grid; CIGRE: Paris, France, 2014. [Google Scholar]
  19. Ordono, A.; Sanchez-Ruiz, A.; Zubiaga, M.; Asensio, F.J.; Cortajarena, J.A. Current limiting strategies for grid forming inverters under low voltage ride through. Renew. Sustain. Energy Rev. 2024, 202, 114657. [Google Scholar] [CrossRef]
  20. Girona-Badia, J.; Prieto-Araujo, E.; Gomis-Bellmunt, O. Pairing grid-forming VSC filter topologies with voltage control structures. Int. J. Electr. Power Energy Syst. 2024, 155B, 109670. [Google Scholar] [CrossRef]
  21. Chien, C.H.; Bucknall, R.W.G. Analysis of Harmonics in Subsea Power Transmission Cables Used in VSC-HVDC Transmission Systems Operating Under Steady-State Conditions. IEEE Trans. Power Deliv. 2007, 22, 2489–2497. [Google Scholar]
  22. Wedepohl, L.M.; Wilcox, D.J. Transient Analysis of Underground Power Transmission System—System Model and Wave Propagation Characteristics. Proc. IEEE. 1973, 120, 253–260. [Google Scholar]
  23. Saad, O.; Gaba, G.; Giroux, M.A. Closed-form Approximation for Ground Return Impedance of Underground Cables. IEEE Trans. Power Deliv. 1996, 11, 1536–1545. [Google Scholar]
  24. Pollaczeck, J.F. On the Field Produced by an Infinitely Long Wire Carrying Alternating Current. Elektr. Nachrichtentechnik 1926, 3, 339–360. [Google Scholar]
  25. Prysmian Group. General Datasheet—66 kV Wet Design, EPR Insulation, Copper Conductor: Submarine Cable; Prysmian: Milan, Italy, 2021. [Google Scholar]
  26. Coello, J.A.C.; Nivelo, J.J.O.; Guerrero, C.A.; Passos, F.O.; Silveira, P.M.; Filho, J.M.C. Dynamic Control Validation of the Power Generation System of an Offshore Platform through Real-time Digital Simulation. In Proceedings of the 14th IEEE International Conference on Industry Applications (INDUSCON), São Paulo, Brazil, 15–18 August 2021; pp. 932–939. [Google Scholar] [CrossRef]
  27. IEEE Std 421.5-2016; IEEE Recommended Practice for Excitation System Models for Power System Stability Studies. (Revision of IEEE Std 421.5-2005). IEEE: Piscataway, NJ, USA, 2016; pp. 1–207. [CrossRef]
  28. Nivelo, J.J.O.; Coello, J.A.C.; Pereira, G.G.C.; Passos, F.O.; Filho, J.M.C.; Guerrero, C.A.V.; Silveira, P.M.; Silva, V.Z. Evaluating Voltage Drop Snapshot and Time Motor Starting Study Methodologies—An Offshore Platform Case Study. Electr. Power Syst. Res. 2021, 196, 107187. [Google Scholar] [CrossRef]
Figure 1. Single-line representation for the electrical power supply of offshore platforms.
Energies 18 03637 g001
Figure 2. SIN equivalent electrical network modeled in PSCAD.
Energies 18 03637 g002
Figure 3. Model of VSC-HVDC in PSCAD.
Energies 18 03637 g003
Figure 4. MMC-VSC-HVDC converter model. Adapted from [18].
Energies 18 03637 g004
Figure 5. Control loops for the rectifier station operating in Grid-Following Mode. Adapted from [18]. * Reference values for the control system.
Energies 18 03637 g005
Figure 6. Control loops for an inverter station operating in Grid-Following Mode. Adapted from [18]. * Reference values for the control system.
Energies 18 03637 g006
Figure 7. The 66 kV connection of the platforms to the hub modeled in PSCAD.
Energies 18 03637 g007
Figure 8. Synchronous machines represented in PSCAD: (a) generator and (b) motor.
Energies 18 03637 g008
Figure 9. FPSO electrical system topology.
Energies 18 03637 g009
Figure 10. Power flow for the FPSO supply complex.
Energies 18 03637 g010
Figure 11. Power flow in the distribution system.
Energies 18 03637 g011
Figure 12. (a) Voltage at the hub and at the 13.8 kV bus of FPSO 1; (b) frequency at the 13.8 kV buses of FPSO units 1 and 6.
Energies 18 03637 g012
Figure 13. (a) Active power flow at the connection between FPSO units 1 and 6 with the hub; (b) reactive power flow at the connection between FPSO units 1 and 6 with the hub.
Energies 18 03637 g013
Figure 14. (a) Active power at GS1 of FPSO units 1 and 6; (b) reactive power at GS1 of FPSO units 1 and 6.
Energies 18 03637 g014
Figure 15. (a) Voltage at the 345 kV substation, at the hub, and at the 13.8 kV buses of the FPSO units; (b) frequency at the hub and at the 13.8 kV buses of FPSO units 1 and 6.
Energies 18 03637 g015
Figure 16. Power flow at the output of the 345 kV substation, at the connection between the inverter station and the hub, and at the interconnection of FPSO units 1 and 6 with the hub: (a) active power flow; (b) reactive power flow.
Energies 18 03637 g016
Figure 17. (a) Active power at GS1 of FPSO units 1 and 6; (b) reactive power at GS1 of FPSO units 1 and 6.
Energies 18 03637 g017
Figure 18. Power flow at the output of the 345 kV substation, at the connection between the inverter station and the hub, and at the interconnection of FPSO units 1 and 6 with the hub: (a) active power flow; (b) reactive power flow.
Energies 18 03637 g018
Figure 19. (a) Voltage at the hub and at the 13.8 kV buses of FPSO units 1 and 6; (b) frequency at the hub and at the 13.8 kV buses of FPSO units 1 and 6.
Energies 18 03637 g019
Figure 20. (a) Active power at GS1 of FPSO units 1 and 6; (b) reactive power at GS1 of FPSO units 1 and 6.
Energies 18 03637 g020
Figure 21. (a) Voltage at the 345 kV substation, at the hub, and at the 13.8 kV buses of FPSO units 1 and 6; (b) frequency at the hub and at the 13.8 kV buses of FPSO units 1 and 6.
Energies 18 03637 g021
Figure 22. Power flow at the output of the 345 kV substation, at the connection between the inverter station and the hub, and at the interconnection of FPSO units 1 and 6 with the hub: (a) active power flow; (b) reactive power flow.
Energies 18 03637 g022
Figure 23. (a) Active power at GS1 of FPSO units 1 and 6; (b) reactive power at GS1 of FPSO units 1 and 6.
Energies 18 03637 g023
Figure 24. (a) Voltage at the 345 kV substation, at the hub, and at the 13.8 kV buses of FPSO units 1 and 6; (b) frequency at the hub and at the 13.8 kV buses of FPSO units 1 and 6.
Energies 18 03637 g024
Figure 25. Power flow at the output of the 345 kV substation, at the connection between the inverter station and the hub, and at the interconnection of FPSO units 1 and 6 with the hub: (a) active power flow; (b) reactive power flow.
Energies 18 03637 g025
Figure 26. (a) Active power of the motor put into operation at GS1 of FPSO units 1 and 6; (b) reactive power of the motor put into operation at GS1 of FPSO units 1 and 6.
Energies 18 03637 g026
Figure 27. Power flow at the output of the 345 kV substation, at the connection between the inverter station and the hub, and at the interconnection of FPSO units 1 and 6 with the hub: (a) active power flow; (b) reactive power flow.
Energies 18 03637 g027
Figure 28. (a) Voltage at the 345 kV substation, at the hub, and at the 13.8 kV buses of FPSO units 1 and 6; (b) frequency at the hub and at the 13.8 kV buses of FPSO units 1 and 6.
Energies 18 03637 g028
Figure 29. (a) Active power at GS1 of FPSO 1; GS1 and GS2 of FPSO 6; (b) reactive power at GS1 of FPSO 1; and GS1 and GS2 of FPSO 6.
Energies 18 03637 g029
Figure 30. (a) Current of the cables connected to FPSO units 1 and 6 with the hub; (b) voltage at the 13.8 kV bus of FPSO 6.
Energies 18 03637 g030
Figure 31. Power flow at the output of the 345 kV substation, at the connection between the inverter station and the hub, and at the interconnection of FPSO units 1 and 6 with the hub: (a) active power flow; (b) reactive power flow.
Energies 18 03637 g031
Figure 32. (a) Voltage at the 345 kV substation, at the hub, and at the 13.8 kV buses of FPSO units 1 and 6; (b) frequency at the hub and at the 13.8 kV buses of FPSO units 1 and 6.
Energies 18 03637 g032
Figure 33. (a) Active power at GS1 of FPSO units 1 and 6; (b) reactive power at GS1 of FPSO units 1 and 6.
Energies 18 03637 g033
Table 1. Voltage and frequency characteristics (adapted from [14]).
OperationVoltage DeviationFrequency Deviation
Maximum continuous deviation+6%/−10%±5%
Maximum cyclical deviation±2%±0.5%
Maximum transient deviation±20%±10%
Maximum transient recovery time1.5 s5 s
Disclaimer/Publisher’s Note: The statements, opinions and data contained in all publications are solely those of the individual author(s) and contributor(s) and not of MDPI and/or the editor(s). MDPI and/or the editor(s) disclaim responsibility for any injury to people or property resulting from any ideas, methods, instructions or products referred to in the content.

