Abstract
In this investigation, a comprehensive validation framework for an integrated electrochemical-thermal model that addresses critical thermal management challenges in lithium-ion batteries (LIBs) is presented. The two-dimensional numerical model combines the Newman–Tiedemann–Gu–Kim (NTGK) electrochemical-thermal battery framework with the enthalpy-porosity approach for phase change material (PCM) battery thermal management systems (BTMSs). Rigorous validation against benchmarks demonstrates the model’s exceptional predictive capability across a wide range of operating conditions. Simulated temperature distribution and voltage capacity profiles at multiple discharge rates show excellent agreement with the experimental data, accurately capturing the underlying electrochemical-thermal mechanisms. Incorporating Capric acid (with a phase transition range of 302–305 K) as the PCM, the thermal management model demonstrates significantly improved accuracy over existing models in the literature. Notable error reductions include a 78.3% decrease in the Mean Squared Error (0.477 vs. 2.202), a 53.4% reduction in the Root Mean Squared Error (0.619 vs. 1.483), and a 55.5% drop in the Mean Absolute Percentage Error. Statistical analysis further confirms the model’s robustness, with a high coefficient of determination (R2 = 0.968858) and well-distributed residuals. Liquid fraction evolution analysis highlights the PCM’s ability to absorb thermal energy effectively during high-discharge operations, enhancing thermal regulation. This validated model provides a reliable foundation for the design of next-generation BTMS, aiming to improve the safety, performance, and lifespan of LIBs in advanced energy storage applications where thermal stability is critical.
1. Introduction
Lithium-ion batteries have emerged as the dominant energy storage technology across a wide range of applications [1], from electric vehicles (EVs) and renewable energy storage systems to portable consumer electronics [2]. Their advantages include high energy density, high power density, high cell voltage, low self-discharge, and lack of memory effect, which make them particularly well-suited for high-energy and high-power applications [3]. As the global push for electrification and renewable energy integration intensifies, the demand for more efficient, safer, and longer-lasting Li-ion batteries continues to grow [4].
However, the performance, safety, and longevity of Li-ion batteries are critically dependent on effective thermal management [5]. These batteries operate optimally within a narrow temperature range, typically between 288–308 K [6]. Temperatures beyond this range can lead to accelerated degradation, reduced capacity, and in extreme cases, thermal runaway (TR)—a phenomenon where uncontrolled temperature rise can result in dangerous fire or explosion [7]. The challenge of thermal management becomes even more pronounced as energy density requirements increase, particularly in high-power applications such as EVs, where rapid charging and discharging generate significant heat [8].
Among thermal management system (TMS) strategies, PCMs are a prominent passive thermal management strategy, offering energy-efficient cooling by absorbing and releasing heat during phase transitions without external power [9].
Recent studies highlight the rising importance of PCMs in managing Li-ion battery heat generation, especially amid growing demand for safe, efficient energy storage in EVs and renewable grids. A comprehensive review by Ahmadian-Elmi and Zhao [10] identifies PCMs as a key passive alternative to active cooling, offering stable battery temperatures without external power. Their role has grown central in managing Li-ion battery issues such as overheating and TR.
Despite their benefits, PCMs suffer from low thermal conductivity, limiting heat transfer under high-demand conditions [11]. Additionally, PCM finite heat capacity means that once the material fully transitions to its liquid state, its ability to absorb additional heat diminishes, potentially leaving batteries vulnerable during prolonged or extreme operation [12]. To address these limitations, researchers such as Idi et al. [13] have developed composites with additives such as metal foams and nanoparticles to enhance thermal conductivity. Their findings show improved heat transfer, lower battery temperatures, and better thermal uniformity, reducing hotspot risks.
Preventing TR is another key focus. Srivastava et al. [14] showed that PCM layers can absorb excess heat early, delaying or stopping runaway events. Their study highlights how PCM design parameters affect safety. These advances stress the need for accurate, validated models, as reliable simulations are essential for scaling up PCM-based systems and ensuring real-world effectiveness. Recent studies stress the need for robust model validation in battery thermal management. Sarmadian et al. [15] and Zhao et al. [16] demonstrated the value of combining experimental data with advanced parameter estimation for accurate electrochemical-thermal modeling. Wang et al. [17] provided rare internal temperature data for model validation, while Zhu et al. [18] reinforced the importance of multi-physics, experimentally grounded approaches. Collectively, these studies highlight a clear shift toward experimentally validated modeling strategies that balance fidelity, efficiency, and practical deployment.
Three significant contributions have shaped the current understanding of battery thermal modeling with PCMs. Kim et al. [19] developed a foundational electrochemical-thermal model for LIBs, Javani et al. [20] pioneered the integration of PCMs for battery thermal management, and Verma et al. [21] explored comparative PCM configurations.
Kim et al. [19] established a comprehensive two-dimensional model for LIBs that accounts for the potential and current density distributions on the electrodes as functions of discharge time and environmental temperature. Their approach incorporated temperature-dependent parameters using Arrhenius relationships and validated results against experimental measurements across multiple discharge rates and environmental conditions. This model provides an excellent foundation for understanding the electrochemical heat generation processes in LIBs, though it did not investigate PCM-based thermal management.
Javani et al. [20] extended battery thermal modeling by incorporating PCMs around prismatic lithium-ion cells. They implemented the enthalpy-porosity technique to model phase change and analyzed the effects of various PCM thicknesses on temperature reduction. Their results demonstrated that PCMs could effectively reduce maximum temperatures and temperature excursions in battery cells, particularly during transient conditions. However, their study was limited to paraffin-based PCMs and did not explore enhanced thermal conductivity options.
Verma et al. [21] conducted a comparative study on battery thermal management using various PCM configurations. They investigated different PCM thicknesses and ambient conditions, comparing the results with traditionally used paraffins. While their work provided valuable insights into PCM selection and implementation, their model accuracy showed notable deviations from benchmark data, particularly during high discharge rates and extreme ambient conditions.
Despite these advancements, there remains a significant gap in the literature regarding comprehensive model validation across different operating conditions and PCM configurations. The accuracy of thermal predictions is paramount for designing effective battery thermal management systems, yet existing models often suffer from simplifications that limit their predictive capability. Additionally, the integration of different modeling approaches (electrochemical, thermal, and phase change) presents numerical challenges that must be carefully addressed to ensure reliable results.
While individual models for battery electrochemical-thermal behavior and PCM heat absorption have been developed, their integration presents significant challenges due to the complex coupling between heat generation in the battery and phase change dynamics in the PCM. Previous attempts to combine these models often lack comprehensive validation against experimental or benchmark data, raising questions about their reliability for practical design applications. Verma et al. [21] presented a comparative study of PCM implementation, but their model showed substantial deviations from benchmark results, particularly during high discharge rates and extreme ambient conditions, indicating a critical need for improved model accuracy.
The accuracy of heat generation simulation, particularly during high discharge rates, is critical for correctly predicting temperature distributions and phase change behavior. Similarly, the thermal properties of PCMs during phase transition and their interface with the battery surface present modeling complexities that require careful validation.
Quantitative assessments of model improvements over previous approaches are often lacking in the literature. Without rigorous statistical comparison of error metrics, it is difficult to evaluate the relative performance of different modeling strategies and identify the most promising directions for model refinement. This gap hinders the systematic advancement of battery thermal management modeling and limits confidence in simulation-based design decisions.
The primary objective of the present study is to develop and validate a comprehensive numerical model for PCM-based battery thermal management that addresses these challenges. The present work aims to integrate an electrochemical-thermal battery model based on the approach of Kim et al. [19] with a PCM thermal management system following the methodology of Javani et al. [20] to create a unified modeling framework to ensure reliability across a range of operating conditions. The current study quantitatively assesses the model’s performance against previous approaches, particularly the recent work of Verma et al. [21], using comprehensive statistical error metrics, including Mean Squared Error, Root Mean Squared Error, Coefficient of Determination, Mean Absolute Error, and Mean Absolute Percentage Error.
This research focuses exclusively on model development and validation against established benchmarks, providing a reliable foundation for subsequent studies on PCM enhancement strategies. Comprehensive validation fills a critical gap in the literature, enabling more confident design decisions for PCM-based battery thermal management systems in EVs and other high-power applications. While previous studies have proposed coupled electrochemical-thermal and PCM models, few have subjected these models to rigorous validation using multiple experimental benchmarks. This study addresses that gap by presenting a robust, quantitatively validated framework that improves agreement with benchmark data compared to the existing literature (e.g., Verma et al. [21]). The statistical error analysis conducted here not only demonstrates the model’s predictive reliability but also provides a foundation for future enhancements such as nanoparticle-augmented PCMs, which we explore in our follow-up work.
By focusing on validation, the present study lays a solid foundation for future enhancements, ensuring safer and more efficient battery systems for emerging thermal energy storage needs.
This work builds upon the previous foundational studies as discussed above to develop an integrated approach to battery thermal management modeling. By combining established methodologies and addressing their limitations, the present work aims to contribute to the advancement of the modeling and simulation of the PCM-based thermal management systems for LIBs in demanding applications such as EVs and advanced thermal energy storage.
2. Modeling Process and Methodology
This section presents the comprehensive numerical modeling approach employed to simulate the thermal behavior of LIBs with PCM-based thermal management. The methodology integrates two established frameworks: the electrochemical-thermal battery model of Kim et al. [19] and the PCM thermal management system of Javani et al. [20]. This study describes the battery cell model with its governing equations for potential and current distribution, temperature-dependent parameters, and heat generation mechanisms. This is followed by the PCM model implementation using the enthalpy-porosity technique, which accurately captures the phase change dynamics during battery operation. The coupling of these models and their numerical implementation details are then presented, establishing a unified framework for predicting battery thermal behavior with PCM cooling.
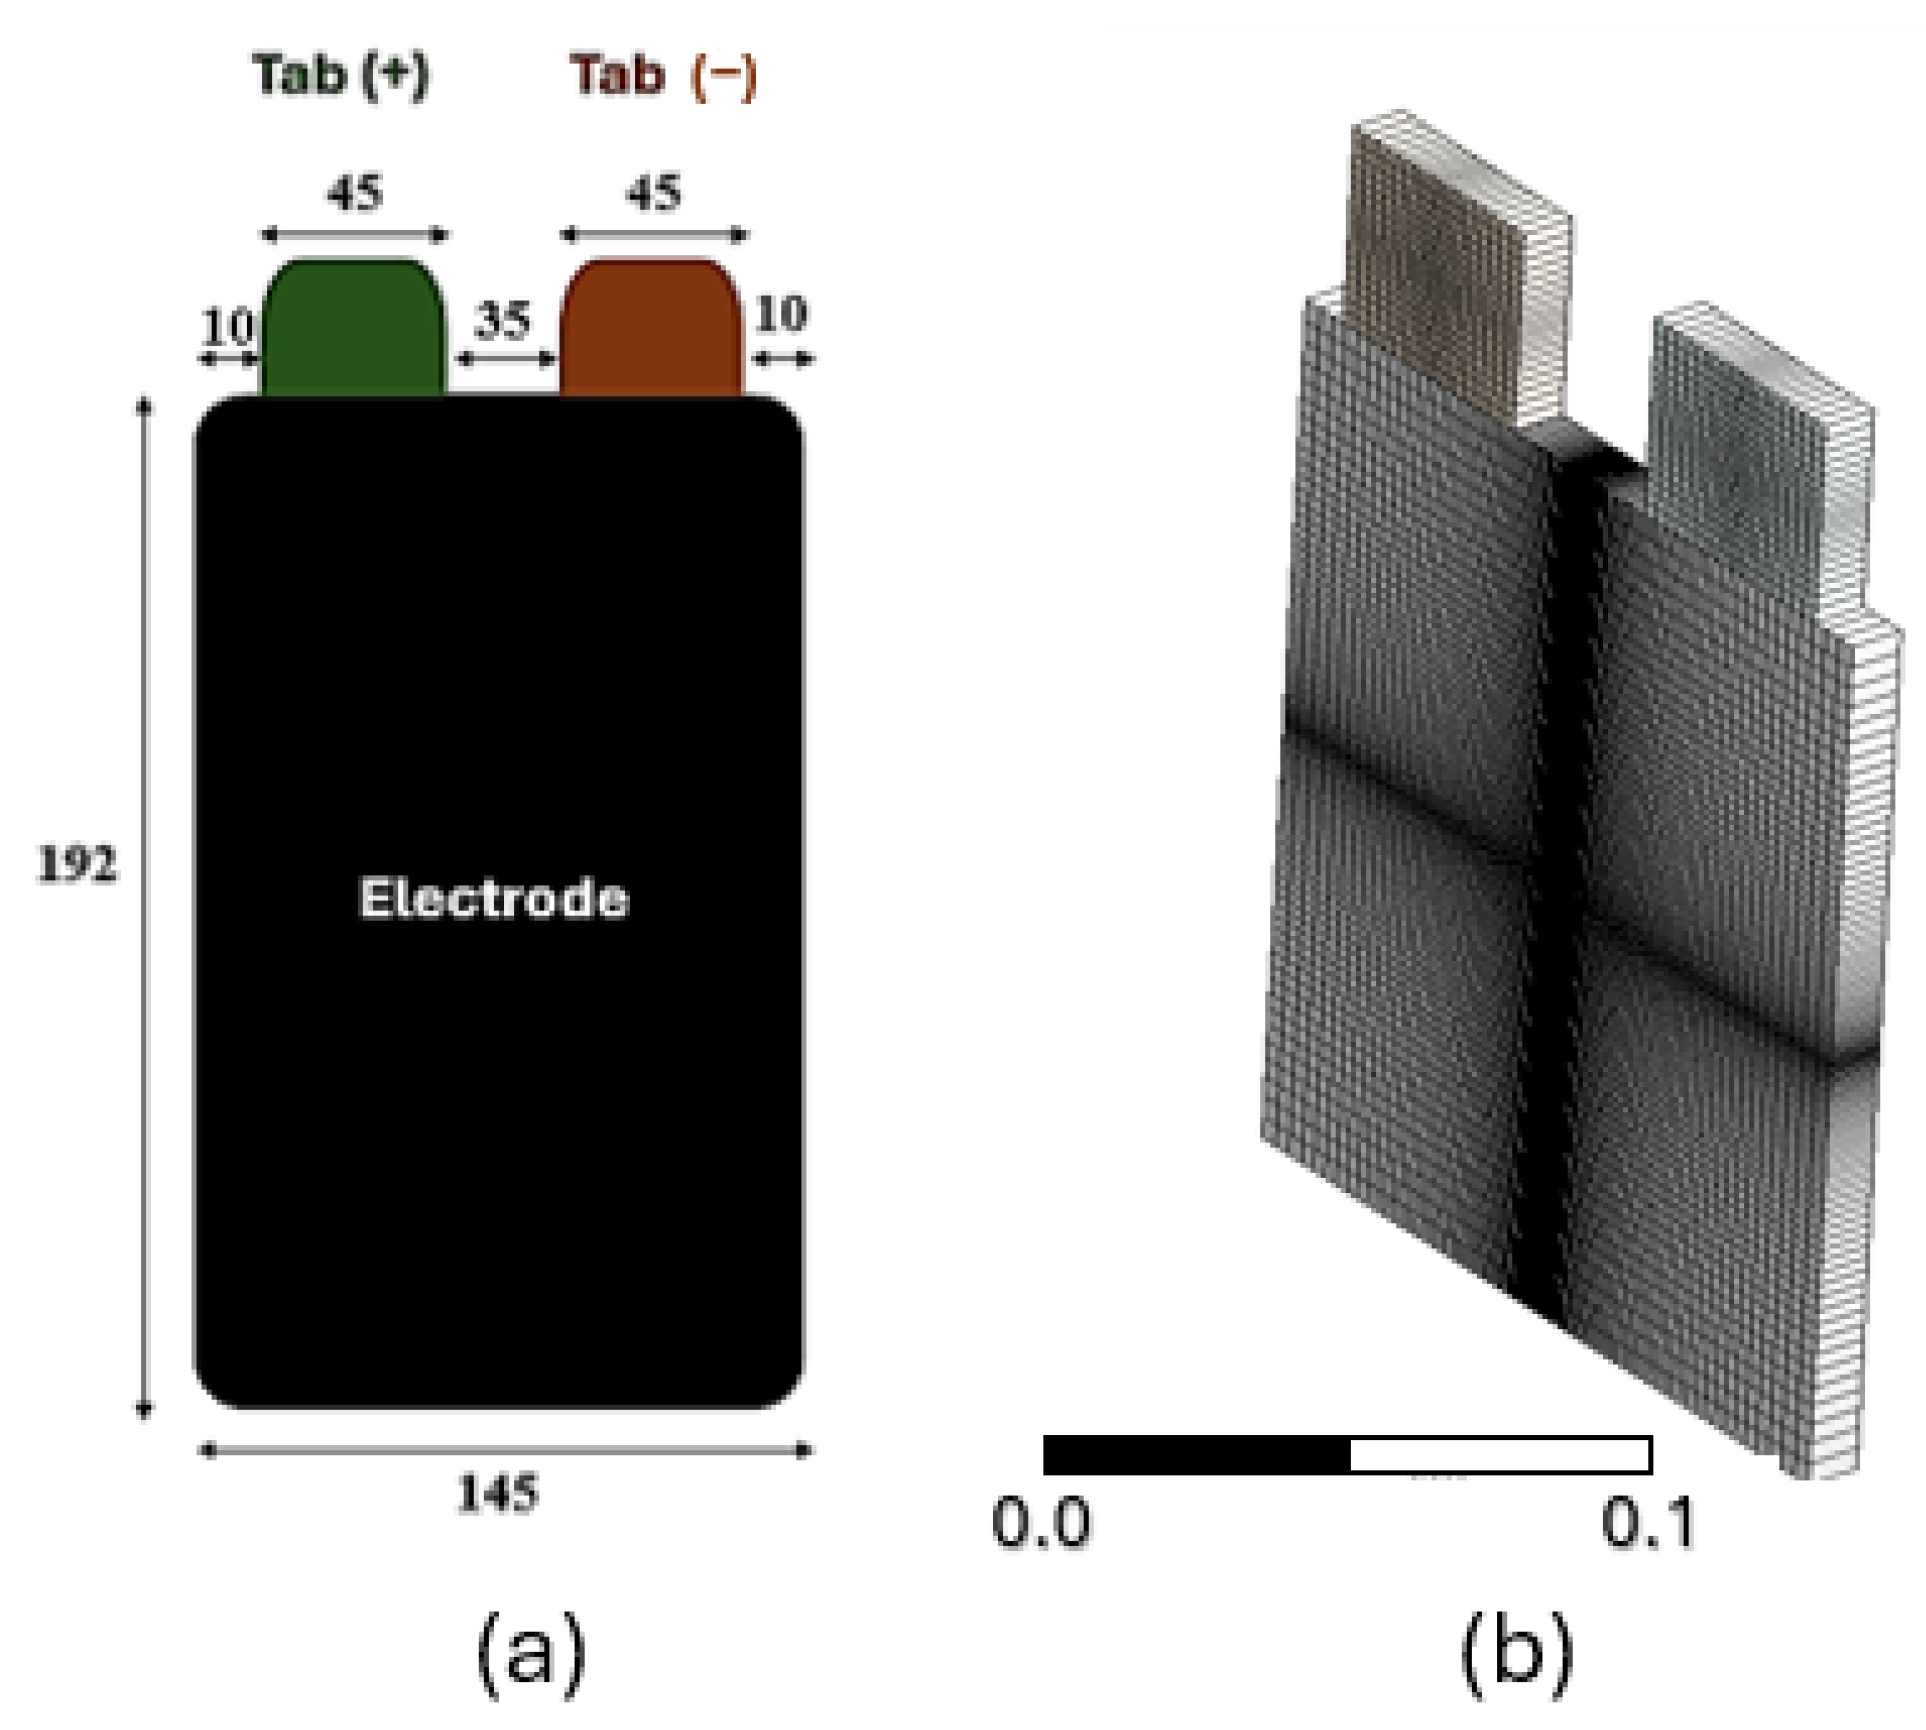
Figure 1 illustrates the schematic diagram of the lithium-ion battery cell used in this study, showing the prismatic cell dimensions and the positions of the positive and negative tabs.

Figure 1.
Schematic diagram of the battery cell (a) with dimensions in mm, showing the electrode and tab locations. (b) 3D view (all measurements in millimeters).
2.1. NTGK Battery Cell Model and Integrated Heat Transfer Modeling
The lithium-ion battery cell modeling approach in this study implements the Newman–Tiedemann–Gu–Kim (NTGK) model, a semi-empirical electrochemical framework developed by Kim et al. [19]. This NTGK model effectively captures the potential and current density distributions on the electrodes while accounting for the temperature dependencies of key parameters. Originally proposed by Kwon et al. [22] and subsequently refined by Kim et al. [19], this model has been widely adopted for lithium-ion battery thermal simulations due to its balance of computational efficiency and predictive accuracy. The battery considered in this study is based on the 14.6 Ah commercial Li-ion pouch cell developed by LG Chem, as described by Kim et al. [19], which features a LiMn2O4 cathode, graphite anode, and a plasticized electrolyte, configured as a pouch cell with parallel plate electrodes. This specific chemistry offers relatively higher thermal stability compared to other common cathode materials such as NMC or LCO. While the current model does not explicitly simulate decomposition or gas-generation processes related to thermal runaway, incorporating this material-specific configuration provides a realistic foundation for modeling temperature evolution and internal heat generation during dynamic cycling. The material properties used in this study are adopted directly from the validated model developed by Kim et al. [19], which is based on a 14.6 Ah Li-ion pouch cell. The specific material properties employed in this study correspond to a commercial 18,650 cell with well-characterized components. The positive electrode consists of a LiCoO2 active material layer with a thickness of 20 μm, density of 2700 kg/m3, specific heat capacity of 900 J/(kg·K), thermal conductivity of 238 W/(m·K), and electronic conductivity of 3.83 × 10⁷ S/m. The negative electrode contains a graphite active material layer of 150 μm thickness, with corresponding properties involving a density of 1500 kg/m3, specific heat of 700 J/(kg·K), thermal conductivity of 5 W/(m·K), and electronic conductivity of 13.9 S/m. The separator, specifically a polyethylene (PE) microporous membrane, has a thickness of 12 μm, density of 1200 kg/m3, specific heat of 700 J/(kg·K), and thermal conductivity of 1 W/(m·K). The current collectors consist of aluminum foil (145 μm) for the positive electrode and copper foil (10 μm) for the negative electrode, with densities of 2500 and 8960 kg/m3, specific heat capacities of 700 and 385 J/(kg·K), and thermal conductivities of 5 and 398 W/(m·K), respectively. These properties yield effective cell-level parameters with a density of 2092 kg/m3, specific heat capacity of 678 J/(kg·K), thermal conductivity of 18.2 W/(m·K), and electrical conductivities of 1.19 × 10⁶ S/m in the radial direction and 9.83 × 10⁵ S/m in the axial direction.
In the NTGK model formulation, the volumetric current transfer rate relates to the potential field through algebraic equations rather than solving the full set of coupled partial differential equations used in more complex models. This approach significantly reduces computational costs while maintaining sufficient accuracy for thermal management studies.
2.1.1. Governing Equations for Potential and Current Distribution
The continuity of current on the electrodes leads to the following equations [19]:
where and are the linear current density vectors in the positive and negative electrodes (A/m2) respectively, J is the current density transferred through the separator (A/m2), and and denote the domains of the positive and negative electrodes (m3).
By applying Ohm’s law, the linear current density vectors are expressed as follows [23]:
where and are the resistances of the positive and negative electrodes (Ω·m), and and are the potentials (V). Substituting these expressions into the continuity equations yields the Poisson equations
The current density J is determined by the potential difference between the electrodes (A/m3) according to the polarization expression
where Y and U are fitting parameters that depend on the depth of discharge (DOD) according to [24]
where through are constants determined through calibration at a reference temperature of 298 K.
2.1.2. Temperature Dependence of Parameters
To accurately model the battery behavior at different environmental temperatures, the parameters Y and U are modified according to the Arrhenius equation and Nernst equation principles [25]
where and are the values at the reference temperature of 298 K, and are the absolute temperatures of the environment and reference condition (298.15 K), and and are constants determined to be 1800 and 9.5 × 10⁻⁴, respectively, based on experimental calibration.
The depth of discharge (DOD) varies with position on the electrode and time during discharge, and it is calculated as [26]
where t is time (s), and is the theoretical capacity per unit area of the electrodes (C/m2 or A·s/m2).
2.1.3. Thermal Model of the Battery
The thermal behavior of the battery cell is governed by the transient heat conduction equation [27]
where is the density (kg/m3), is the specific heat capacity (J/(kg·K)), T is the temperature (K), and are the effective thermal conductivities in the x and y directions (W/(m·K)), q is the volumetric heat generation rate (W/m3), and is the heat dissipation rate through convection (W/m3).
The heat generation rate incorporates several mechanisms [28], as given by
where a is the specific area of the battery (m2/m3), is the open-circuit potential (V), E is the cell voltage (V), and are the specific areas of the positive and negative electrodes, respectively (m2/m3), and ip and in are the magnitudes of the current density vectors (A/m2).
2.1.4. Battery Material Properties and Boundary Conditions
The battery cell modeled in this study comprises distinct components, each with specific material properties essential for accurately simulating thermal behavior during operation. For the numerical model, the battery cell was represented with distinct thermal properties assigned to each component zone. The positive current collector (P+, 20 μm thick) features high thermal conductivity (238 W/m·K) and density (2700 kg/m3) consistent with aluminum materials. The negative current collector (N−, 10 μm thick) exhibits even higher thermal conductivity (398 W/m·K) characteristic of copper. The active material layers—positive electrode (P−, 150 μm thick) and negative electrode (N+, 145 μm thick)—have moderate thermal conductivity values of 5 W/m·K, with the separator (S, 12 μm thick) demonstrating the lowest thermal conductivity (1 W/m·K), as expected for polymeric materials. The combined effective properties of the complete battery cell (322 μm total thickness) yield moderate values for density (2092 kg/m3), specific heat capacity (678 J/kg·K), and thermal conductivity (18.2 W/m·K), with distinctive electrical conductivity values for the positive (1.19 × 10⁶ S/m) and negative (9.83 × 10⁵ S/m) regions. These material-specific properties were essential for accurate thermal simulations and were incorporated into the numerical model to capture temperature-dependent behavior during various discharge conditions [29]. These properties were implemented in the model to ensure accurate representation of the heterogeneous battery structure. These material parameters, sourced from previous empirical studies by Kim et al. [19], ensure a realistic representation of heat generation, conduction, and dissipation within the heterogeneous battery structure.
Boundary conditions implemented in the numerical model closely follow the specifications outlined by the Newman–Tiedemann–Gu–Kim (NTGK) [30]. All external surfaces of the battery cell, excluding the electrode tabs, were set as convective heat transfer boundaries with natural convection conditions to the ambient environment. The convective heat transfer coefficient was set at 5 W/m2·K, reflecting typical free convection conditions. The ambient temperature for the simulations was consistently maintained at 298 K to align with standard benchmarking scenarios.
The electrode tabs serve as electrical boundary conditions where specific current densities are applied, corresponding to various discharge rates investigated in the simulations (1C, 3C, and 5C). These boundary conditions enable accurate reproduction of thermal and electrical responses observed experimentally in reference data.
Internally, interface boundaries between distinct battery components (electrodes, separator, and current collectors) are treated as coupled walls to facilitate realistic heat transfer across adjacent zones, ensuring continuity in thermal and electrical potentials. No-slip and electrically insulating conditions were employed on lateral walls not directly engaged in current transfer, representing the actual battery construction’s insulating housing materials.
The computational domain was discretized using a structured mesh with refined elements near the electrode-separator interfaces and tabs to resolve steep gradients in potential and temperature. Convergence was ensured by setting residual tolerances to 10−6 for energy and 10−4 for potential equations.
This setup ensures that the battery model accurately replicates the experimental conditions of Kim et al. [19], providing a reliable baseline for integrating the PCM layer and validating the coupled thermal management system. The boundary conditions and material properties are consistent with the NTGK framework’s semi-empirical approach, balancing computational efficiency with predictive fidelity for thermal management applications.
2.2. Phase Change Material Modeling
The thermal management system incorporates a PCM layer surrounding the battery cell. In this study, Capric acid was selected as the PCM due to its suitable phase transition temperature range (302–305 K), which aligns well with the optimal operating temperature range of LIBs.
While Capric acid demonstrates favorable thermal properties for battery thermal management applications, practical implementation requires consideration of additional factors. From an economic perspective, Capric acid is relatively cost-effective compared to other organic PCMs [31]. In terms of resource abundance, Capric acid can be derived from both natural sources (coconut oil and palm kernel oil) and synthetic means, ensuring reliable supply chains [32]. Environmental considerations are also crucial; Capric acid is biodegradable and non-toxic, making it an environmentally friendly option compared to paraffin-based or salt hydrate PCMs. Furthermore, its chemical stability over repeated thermal cycles (>1000 cycles without significant degradation) and compatibility with common battery packaging materials make it a practical choice for commercial applications [33]. These factors, combined with its appropriate melting temperature, justify the continued use of Capric acid as a benchmark PCM for battery thermal management studies.
2.2.1. Governing Equations for PCM
Following Javani et al.’s methodology [20], the enthalpy-porosity technique was implemented to model the phase change process. The energy equation governing heat transfer in the PCM is given by
where H is the total enthalpy (J/kg), k is the thermal conductivity(W/m·K), and is a source term (W/m3) (set to zero for the PCM region).
The total enthalpy H consists of sensible heat and latent heat components
where is the reference enthalpy at reference temperature (J/kg), is the specific heat capacity (J/kg·K), L is the latent heat of fusion (J/kg), and f is the liquid fraction defined as
where and are the solidus and liquidus temperatures of the PCM (K).
2.2.2. PCM Properties and Implementation
The Capric acid selected as the PCM for this thermal management system exhibits thermophysical properties well-suited for battery temperature regulation. With a moderate heat capacity of 475.59 J/kg·K and significant latent heat of 152.7 kJ/kg·K, it provides effective thermal energy storage during phase transition. The material’s density of 878 kg/m3 allows for compact implementation, while its thermal conductivity of 0.153 W/m·K, though relatively low as typical for PCMs, is sufficient for the application when properly configured.
Following Verma et al. [21], the thermophysical properties of Capric acid were implemented as constant values rather than temperature-dependent functions. This simplification is consistent with the validation study and is appropriate for the moderate temperature ranges encountered in our simulations (302–305 K during phase change). The enthalpy-porosity method handles the phase transition by using different property values for solid and liquid phases, with linear interpolation in the mushy zone based on the liquid fraction.
While the relatively low thermal conductivity of pure Capric acid presents a challenge for rapid heat dissipation, our simulation results demonstrate that the high latent heat of fusion effectively compensates for this limitation by providing substantial thermal buffering capacity. The PCM layer acts as a thermal capacitor, absorbing heat during peak discharge rates and releasing it gradually during rest periods. For applications requiring enhanced heat transfer rates, future implementations could incorporate thermal conductivity enhancers such as expanded graphite, metal foams, or carbon nanotubes.
Most importantly, Capric acid offers an appropriate phase transition range with solidus temperature at 302 K and liquidus temperature at 305 K, aligning well with the optimal operating temperature range for LIBs and enabling the material to effectively absorb excess heat during high-discharge operations while maintaining battery temperature within safe limits. These properties are implemented as temperature-dependent functions to accurately capture the behavior during phase transition [21].
The PCM layer is applied around the battery cell with 3 mm thickness to evaluate the impact on thermal management performance.
In practical implementations, leakage of the PCM during melting is mitigated using containment strategies such as encapsulation, structural enclosures, or porous support matrices (e.g., metal foams or expanded graphite). In this study, leakage is not explicitly modeled, consistent with the benchmark configuration adopted from Javani et al. [20], which assumes perfect containment.
This configuration leverages the orthotropic thermal properties of the battery, where the in-plane thermal conductivity is significantly higher than the through-plane one.
2.2.3. Coupled Thermal Model and Boundary Conditions
In the present numerical study, a lithium-ion battery cell coupled with a PCM thermal management system is modeled to assess the thermal performance during operational conditions. The battery cell generates heat internally due to electrochemical reactions, which are considered the sole heat generation source in the computational domain. The heat generation rate is uniformly set to 6870 W/m3, representing a typical condition corresponding to a 2C discharge rate.
As discussed earlier, the PCM utilized in this investigation is Capric acid, selected due to its favorable thermophysical properties, including high latent heat and appropriate melting temperature range suitable for thermal management applications. A uniform PCM layer of 3 mm thickness is applied around the battery cell. This thickness was chosen based on literature indicating effective thermal moderation and improved uniformity of temperature distribution within the battery cell.
The initial boundary condition for the coupled battery-PCM system is set to an ambient temperature of 294.15 K. The boundary surfaces of the battery cell and the positive and negative terminals connected to the cell are subjected to free convection boundary conditions, with a convective heat transfer coefficient of 7 W/m2·K applied to represent natural convection cooling.
The interfaces between the battery cell and PCM, as well as between the battery cell and the terminals, are treated as coupled boundaries, allowing seamless heat transfer across these interfaces and ensuring continuity in temperature profiles.
These boundary conditions closely follow methodologies established by previous studies on PCM-based thermal management systems for LIBs, demonstrating their effectiveness in reducing peak temperatures and promoting uniform thermal profiles under transient conditions. The selected boundary conditions and material properties ensure that the numerical model accurately captures the heat transfer phenomena, including conduction within the battery and PCM, latent heat absorption during the PCM phase transition, and convection-based heat removal to the ambient environment. This comprehensive and coupled approach enables accurate prediction and evaluation of the PCM’s effectiveness in managing thermal loads and maintaining safe operating temperatures in lithium-ion battery applications.
3. Results and Discussion
The validation and analysis of the integrated battery thermal management model demonstrate its capability to accurately predict thermal behavior across various operating conditions. This section presents a comprehensive assessment of the model’s performance in three key areas: (1) validation of the battery electrochemical-thermal model against experimental data of Kim et al. [19], (2) validation of the PCM thermal management system against the results obtained by Javani et al. [20], and (3) comparative analysis with recent work of Verma et al. [21] using statistical error metrics.
3.1. Battery Model Validation
The accuracy of the electrochemical-thermal battery model was assessed by comparing simulation results with experimental data from Kim et al. [19] for a 14.6 Ah lithium-ion battery. The validation process focused on comparing three key parameters: (i) minimum temperature, (ii) maximum temperature, and (iii) voltage-capacity discharge curves at different charge/discharge rates (1C, 3C, and 5C).
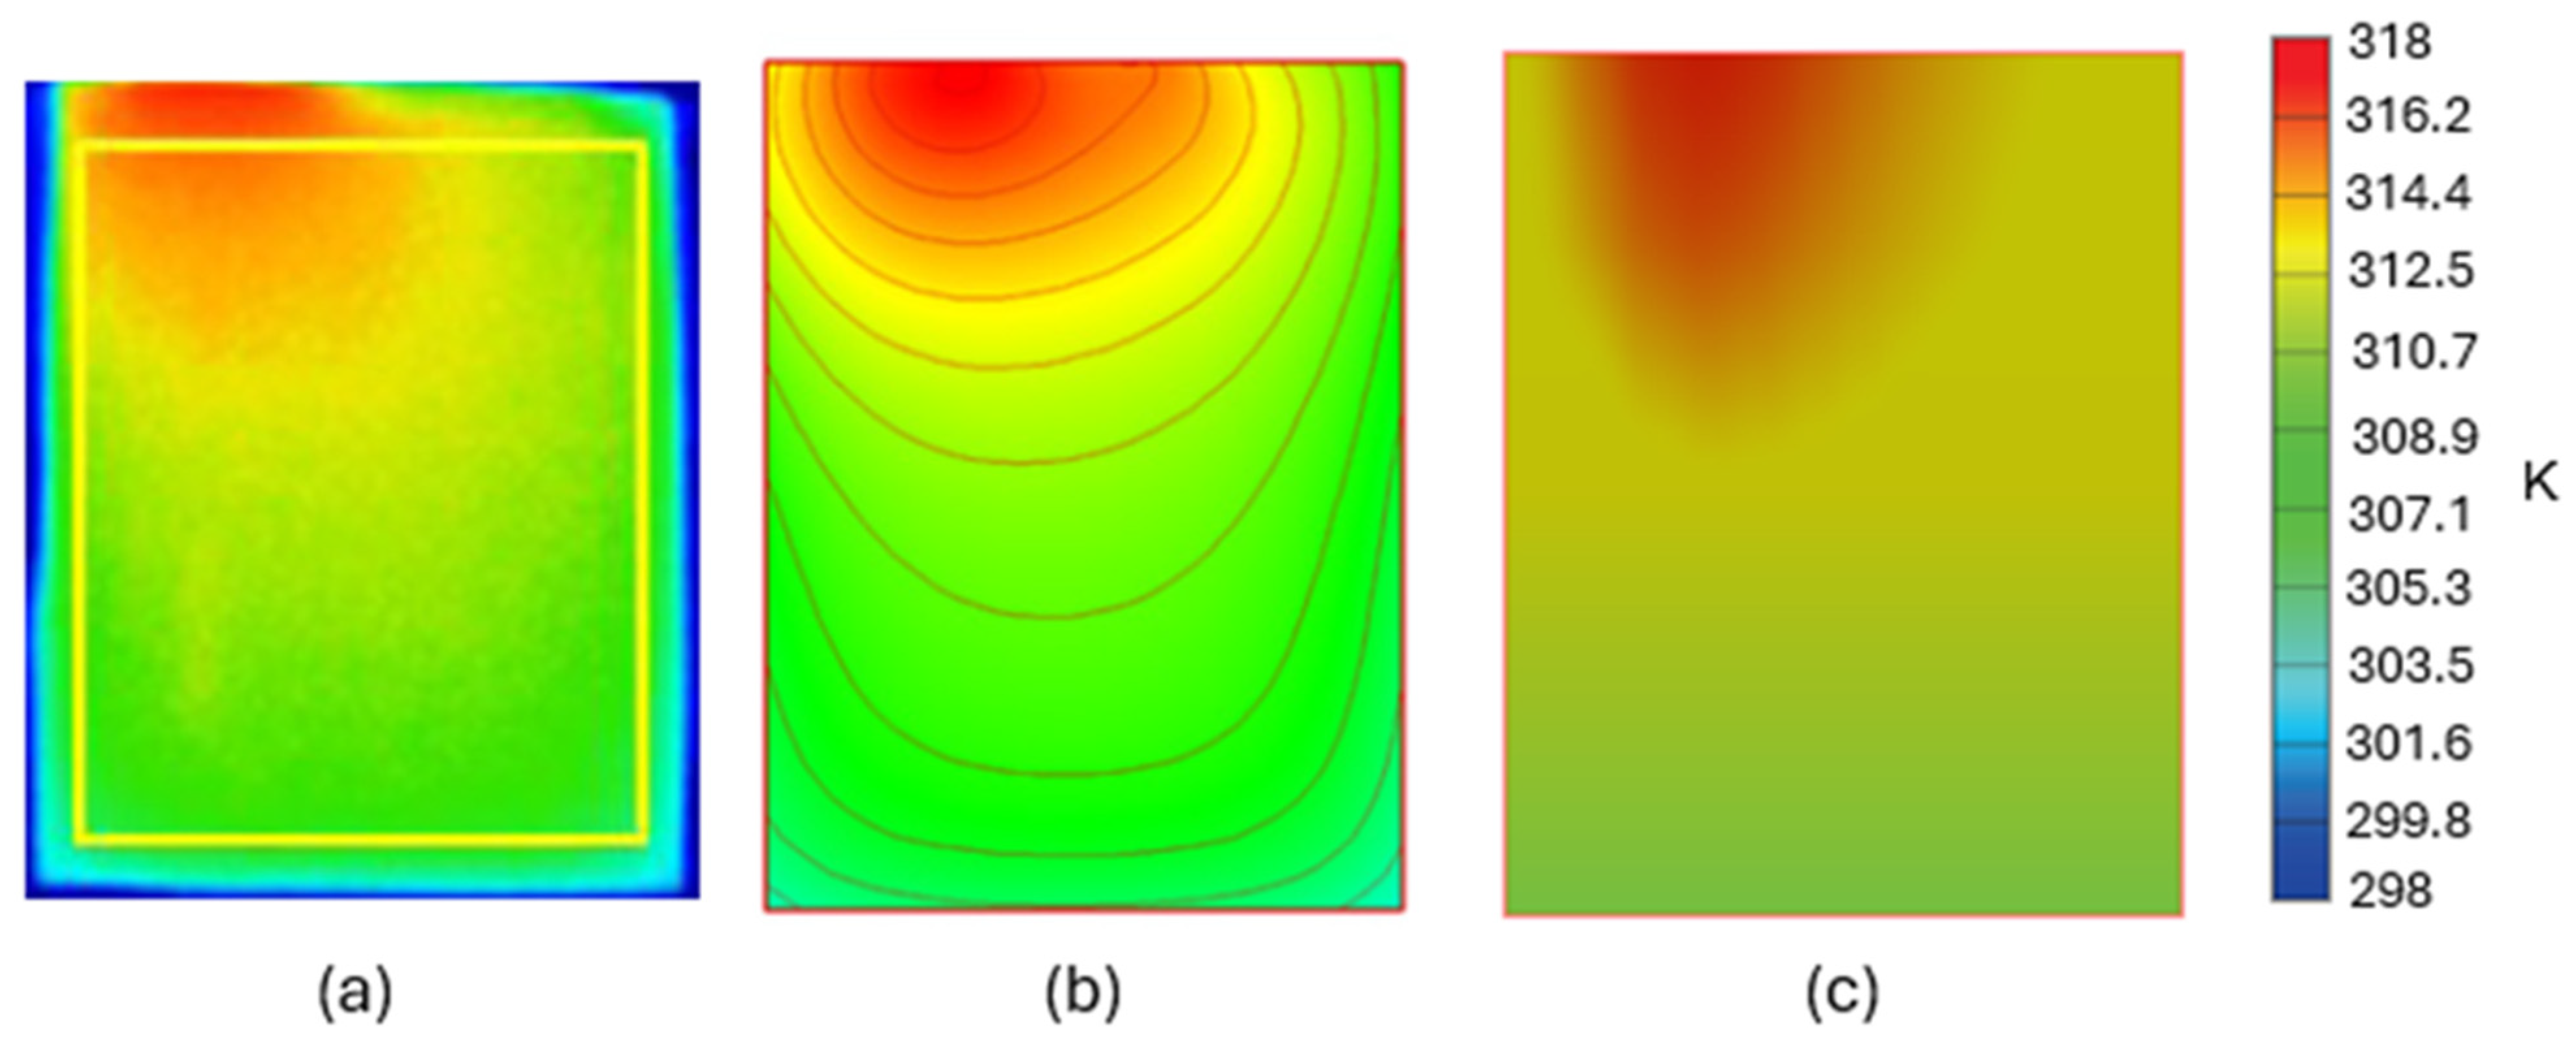
The temperature distribution contours for the lithium-ion battery at a 5C discharge rate after 11 min of operation are presented in Figure 2, which shows the experimental IR thermal image (a), the numerical prediction from Kim et al. [34] model (b), and the results from the present study (c). The temperature scale ranges from 298 K to 318 K, as indicated by the color bar. The experimental thermal image displays localized temperature variations, with higher temperatures concentrated in the central region of the battery cell. The model prediction from Kim et al. [34] (b) captures the general temperature distribution pattern with more uniform isotherms. The results from the present study demonstrate excellent agreement with both the experimental data and Kim et al. [35], accurately reproducing the temperature gradients and spatial distribution patterns. The slightly cooler areas near the terminals are correctly captured, as is the temperature rise in the central region. This spatial temperature distribution comparison serves as a critical validation step, confirming that the present model correctly reproduces not only the maximum and minimum temperatures but also their spatial distribution across the battery cell at high discharge rates.

Figure 2.
Temperature distribution based on (a) the experimental IR image, (b) the LIB at discharge times of 11 min during discharge at a rate of 5C and an environmental temperature of 298 K from Kim et al. [19], and (c) the present study.
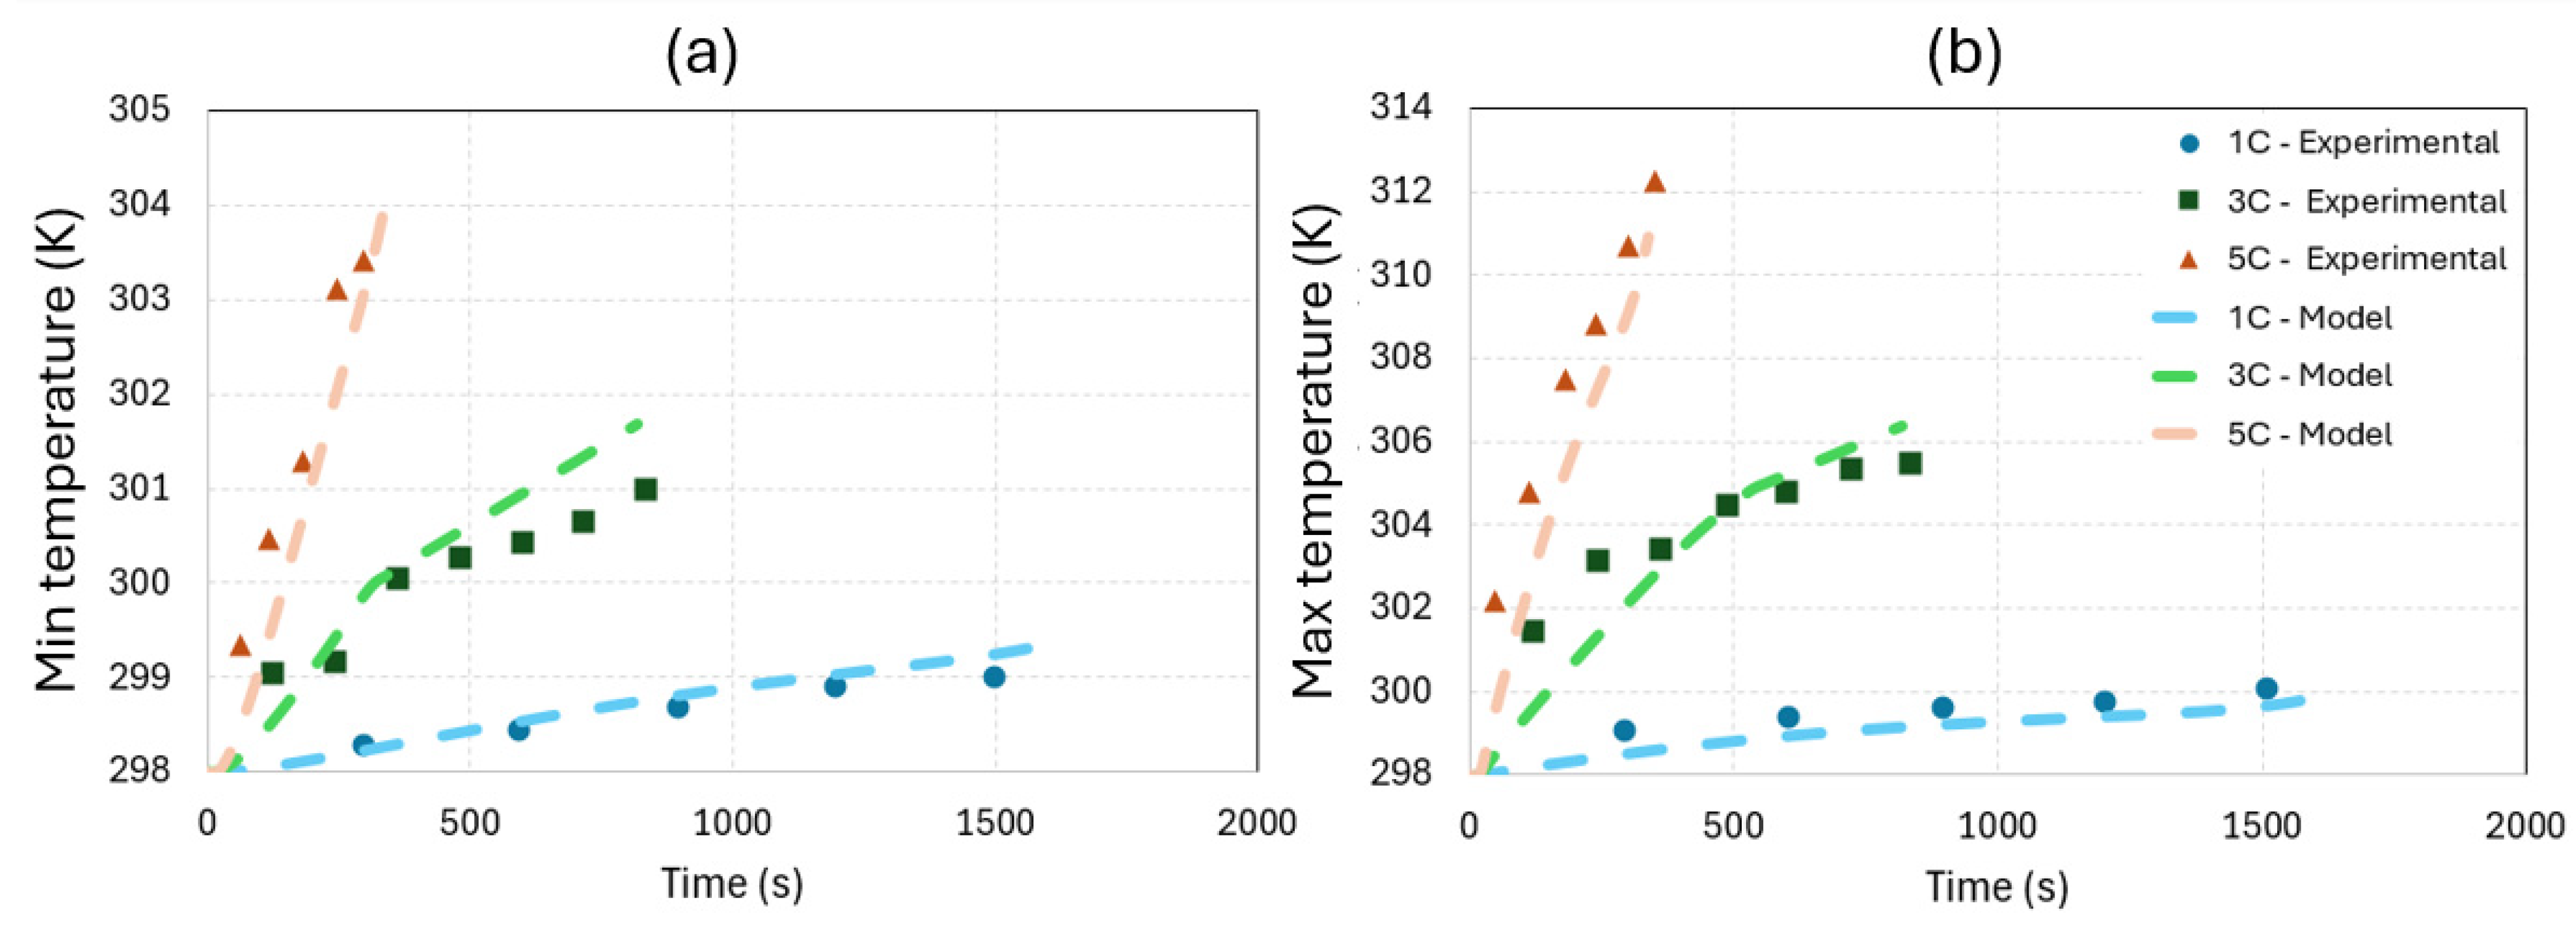
The battery temperature distribution was assessed by comparing the minimum and maximum temperatures obtained from the present numerical model with those reported in Kim et al. [19]. Figure 3a,b illustrate the evolution of the minimum and maximum battery temperatures over time for different discharge rates (1C, 3C, and 5C). The experimental results from Kim et al. [19] provide a reference for evaluating the accuracy of the proposed model. The simulated temperatures closely follow the experimental trends, demonstrating a strong correlation across all charge/discharge rates. The discrepancy between the model and experimental temperatures remains minimal, indicating the effectiveness of the adopted thermal model in capturing the heat generation and dissipation dynamics within the battery system.
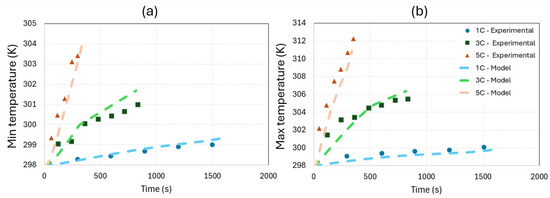
Figure 3.
(a) Maximum temperature and (b) minimum temperature obtained from experiment [19] and present model for the LIB during discharge at discharge rates of 1, 3, and 5C and an environmental temperature of 298 K.
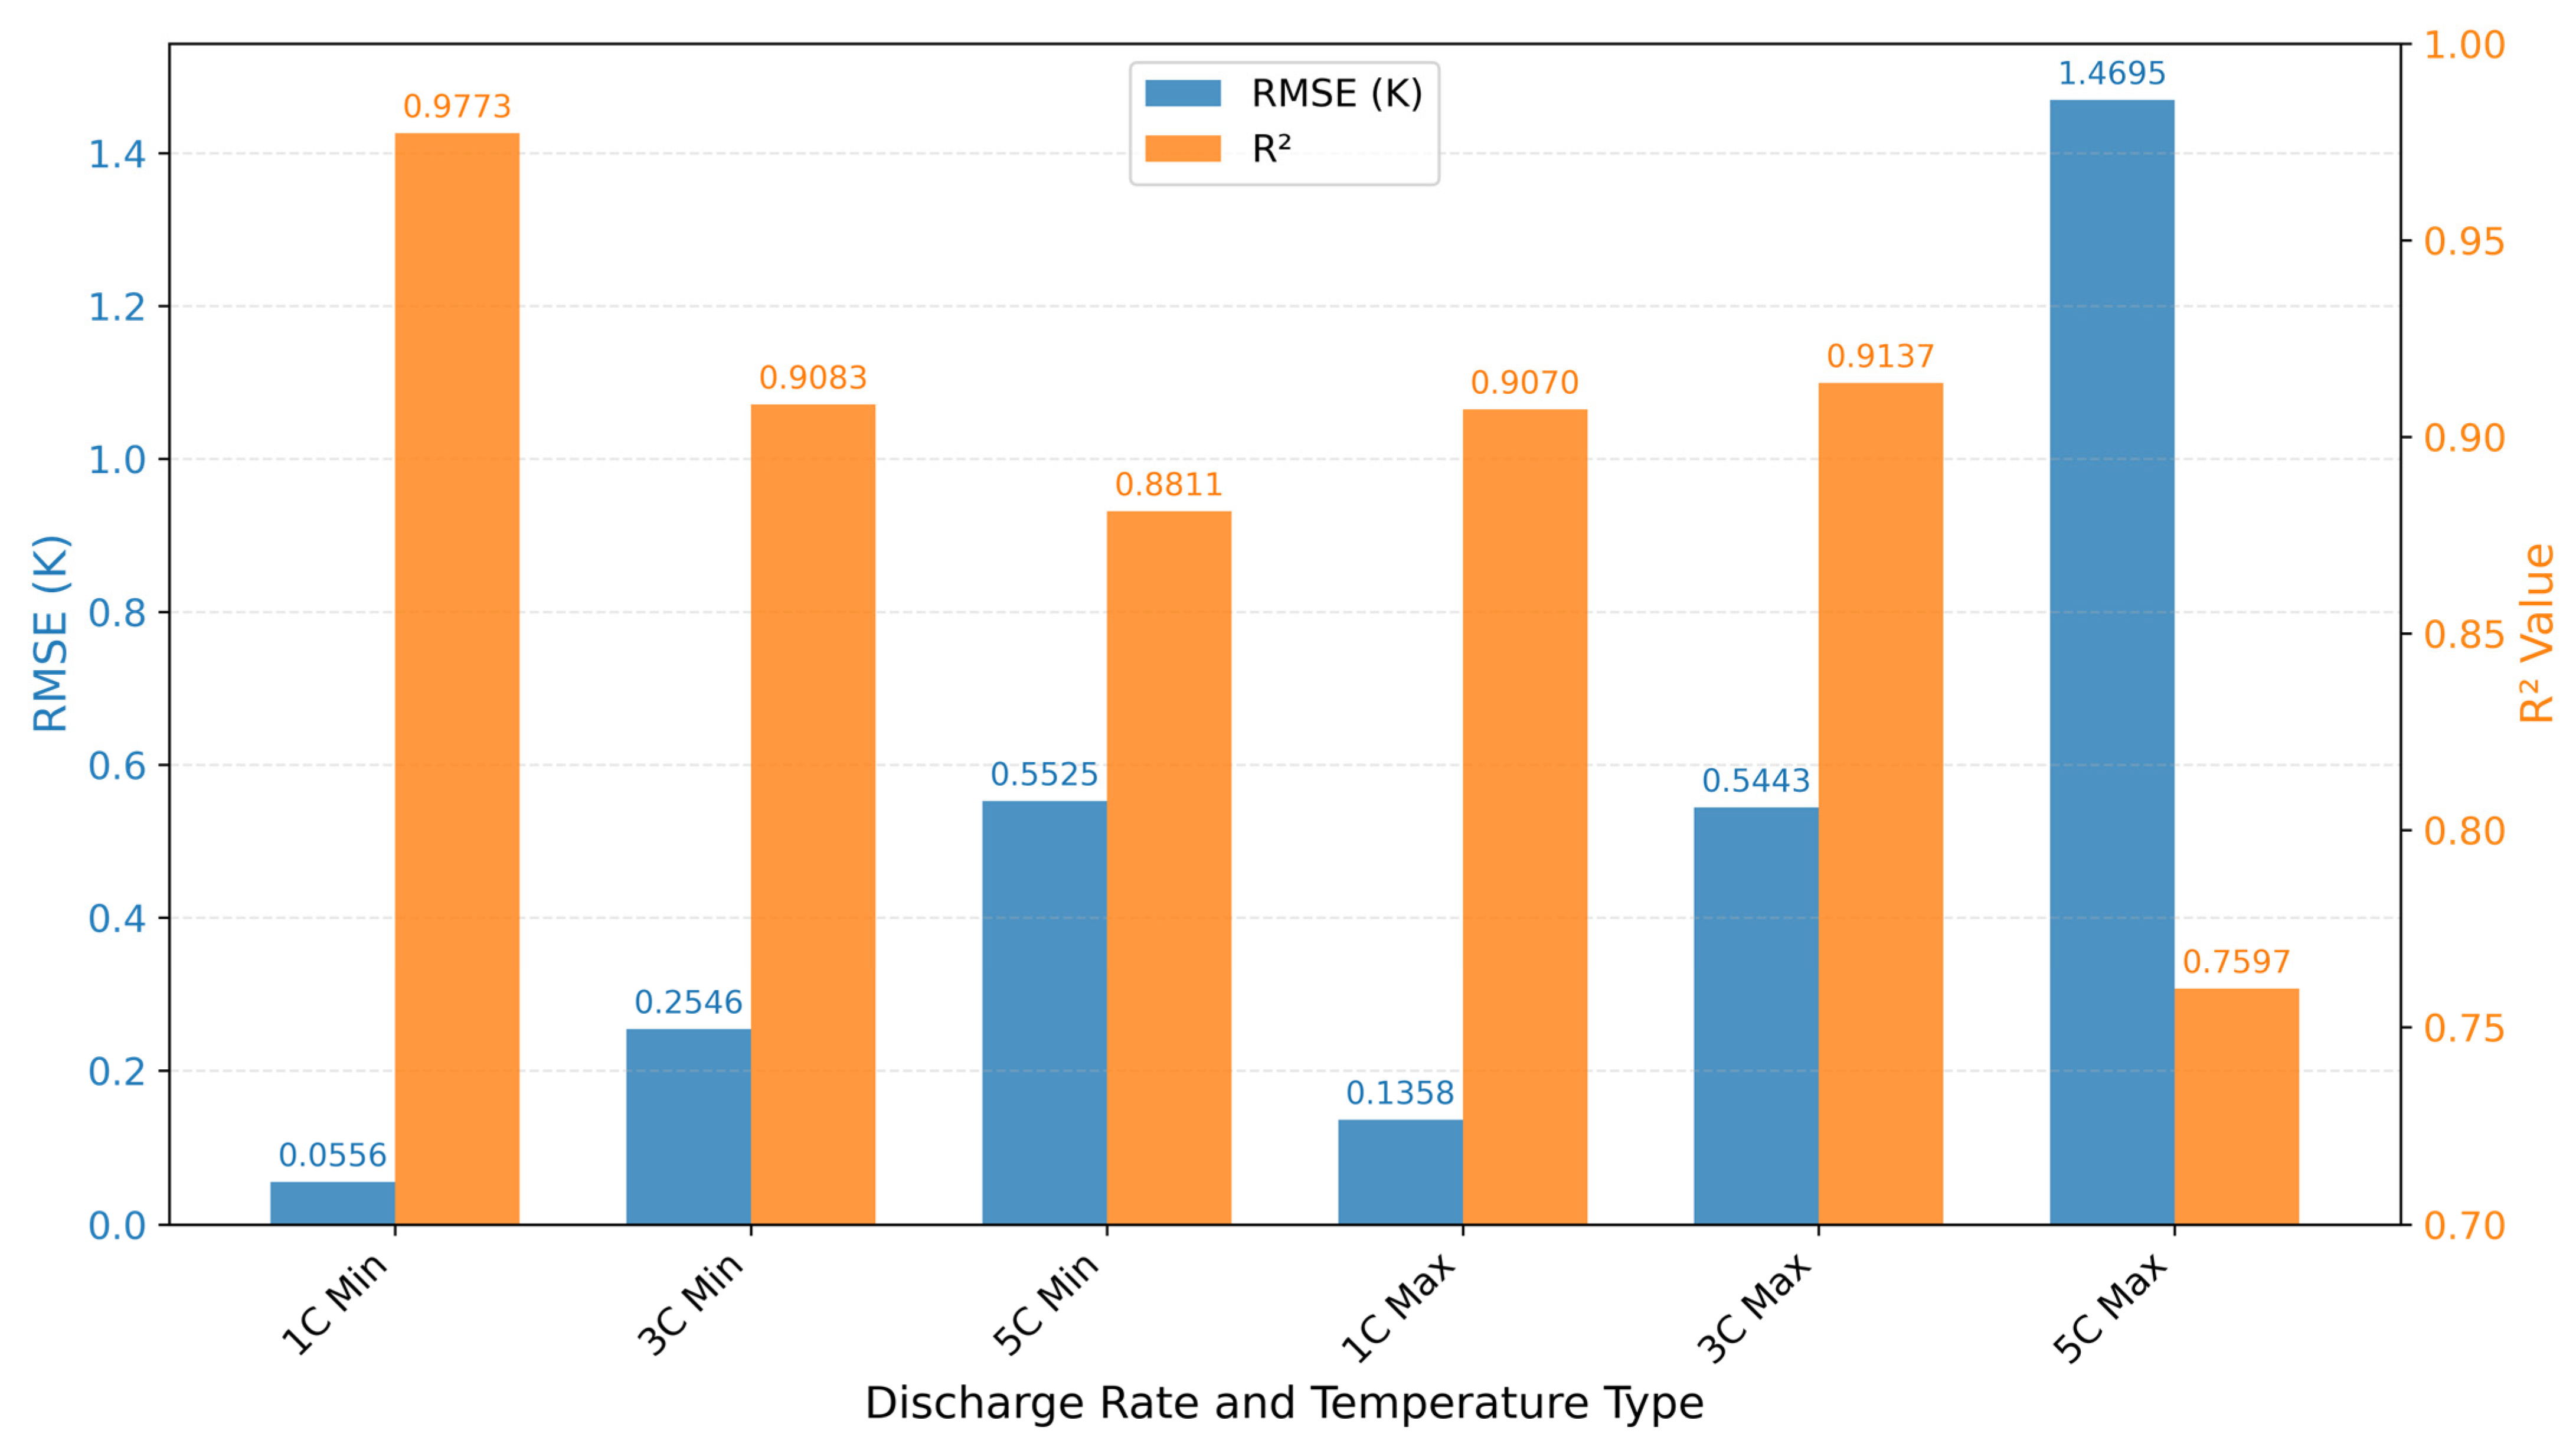
To quantitatively assess the agreement between the present numerical model and experimental data [19] presented in Figure 3, comprehensive statistical error metrics were calculated for both minimum and maximum temperatures across all discharge rates. For minimum temperatures, the model demonstrated excellent accuracy with RMSE values of 0.0556 K, 0.2546 K, and 0.5525 K for 1C, 3C, and 5C discharge rates, respectively. The corresponding R2 values of 0.9773, 0.9083, and 0.8811 confirm a strong correlation between the predicted and experimental data. For maximum temperatures, similar trends were observed, with RMSE values of 0.1358 K, 0.5443 K, and 1.4695 K for 1C, 3C, and 5C rates. The R2 values of 0.9070, 0.9137, and 0.7597 indicate that the model successfully captures the temperature evolution patterns even at higher discharge rates. The mean absolute percentage errors remained below 0.34% across all cases, demonstrating the model’s robust performance in capturing both the magnitude and temporal evolution of battery temperature distributions under varied operating conditions. These quantitative metrics confirm that the present numerical model accurately represents the thermal behavior of the battery system.
Figure 4 depicts statistical error metrics quantifying the agreement between the present numerical model predictions and experimental data [19] for battery temperature distributions shown in Figure 3 (see Appendix A for definitions). Lower values of MSE, RMSE, MAE, and MAPE indicate better model performance, while higher R2 values (closer to 1.0) represent stronger correlation between predicted and experimental data.
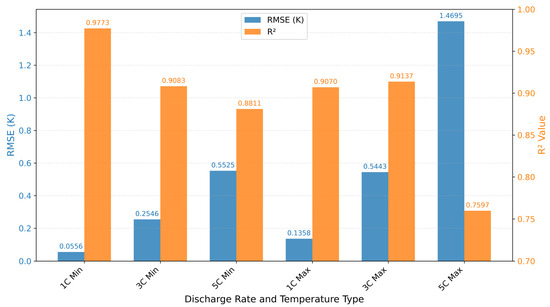
Figure 4.
Comparison of RMSE and R2 values at different discharge rates.
At higher discharge rates, such as 5C, the battery experiences increased heat generation due to the higher current flow, leading to a significant rise in maximum temperature. The numerical model successfully captures this behavior, showing a notable agreement with the experimental data. The results suggest that the proposed thermal management approach is capable of accurately predicting the temperature variations within the lithium-ion battery, reinforcing its reliability for further investigations into phase change material-enhanced thermal management strategies.
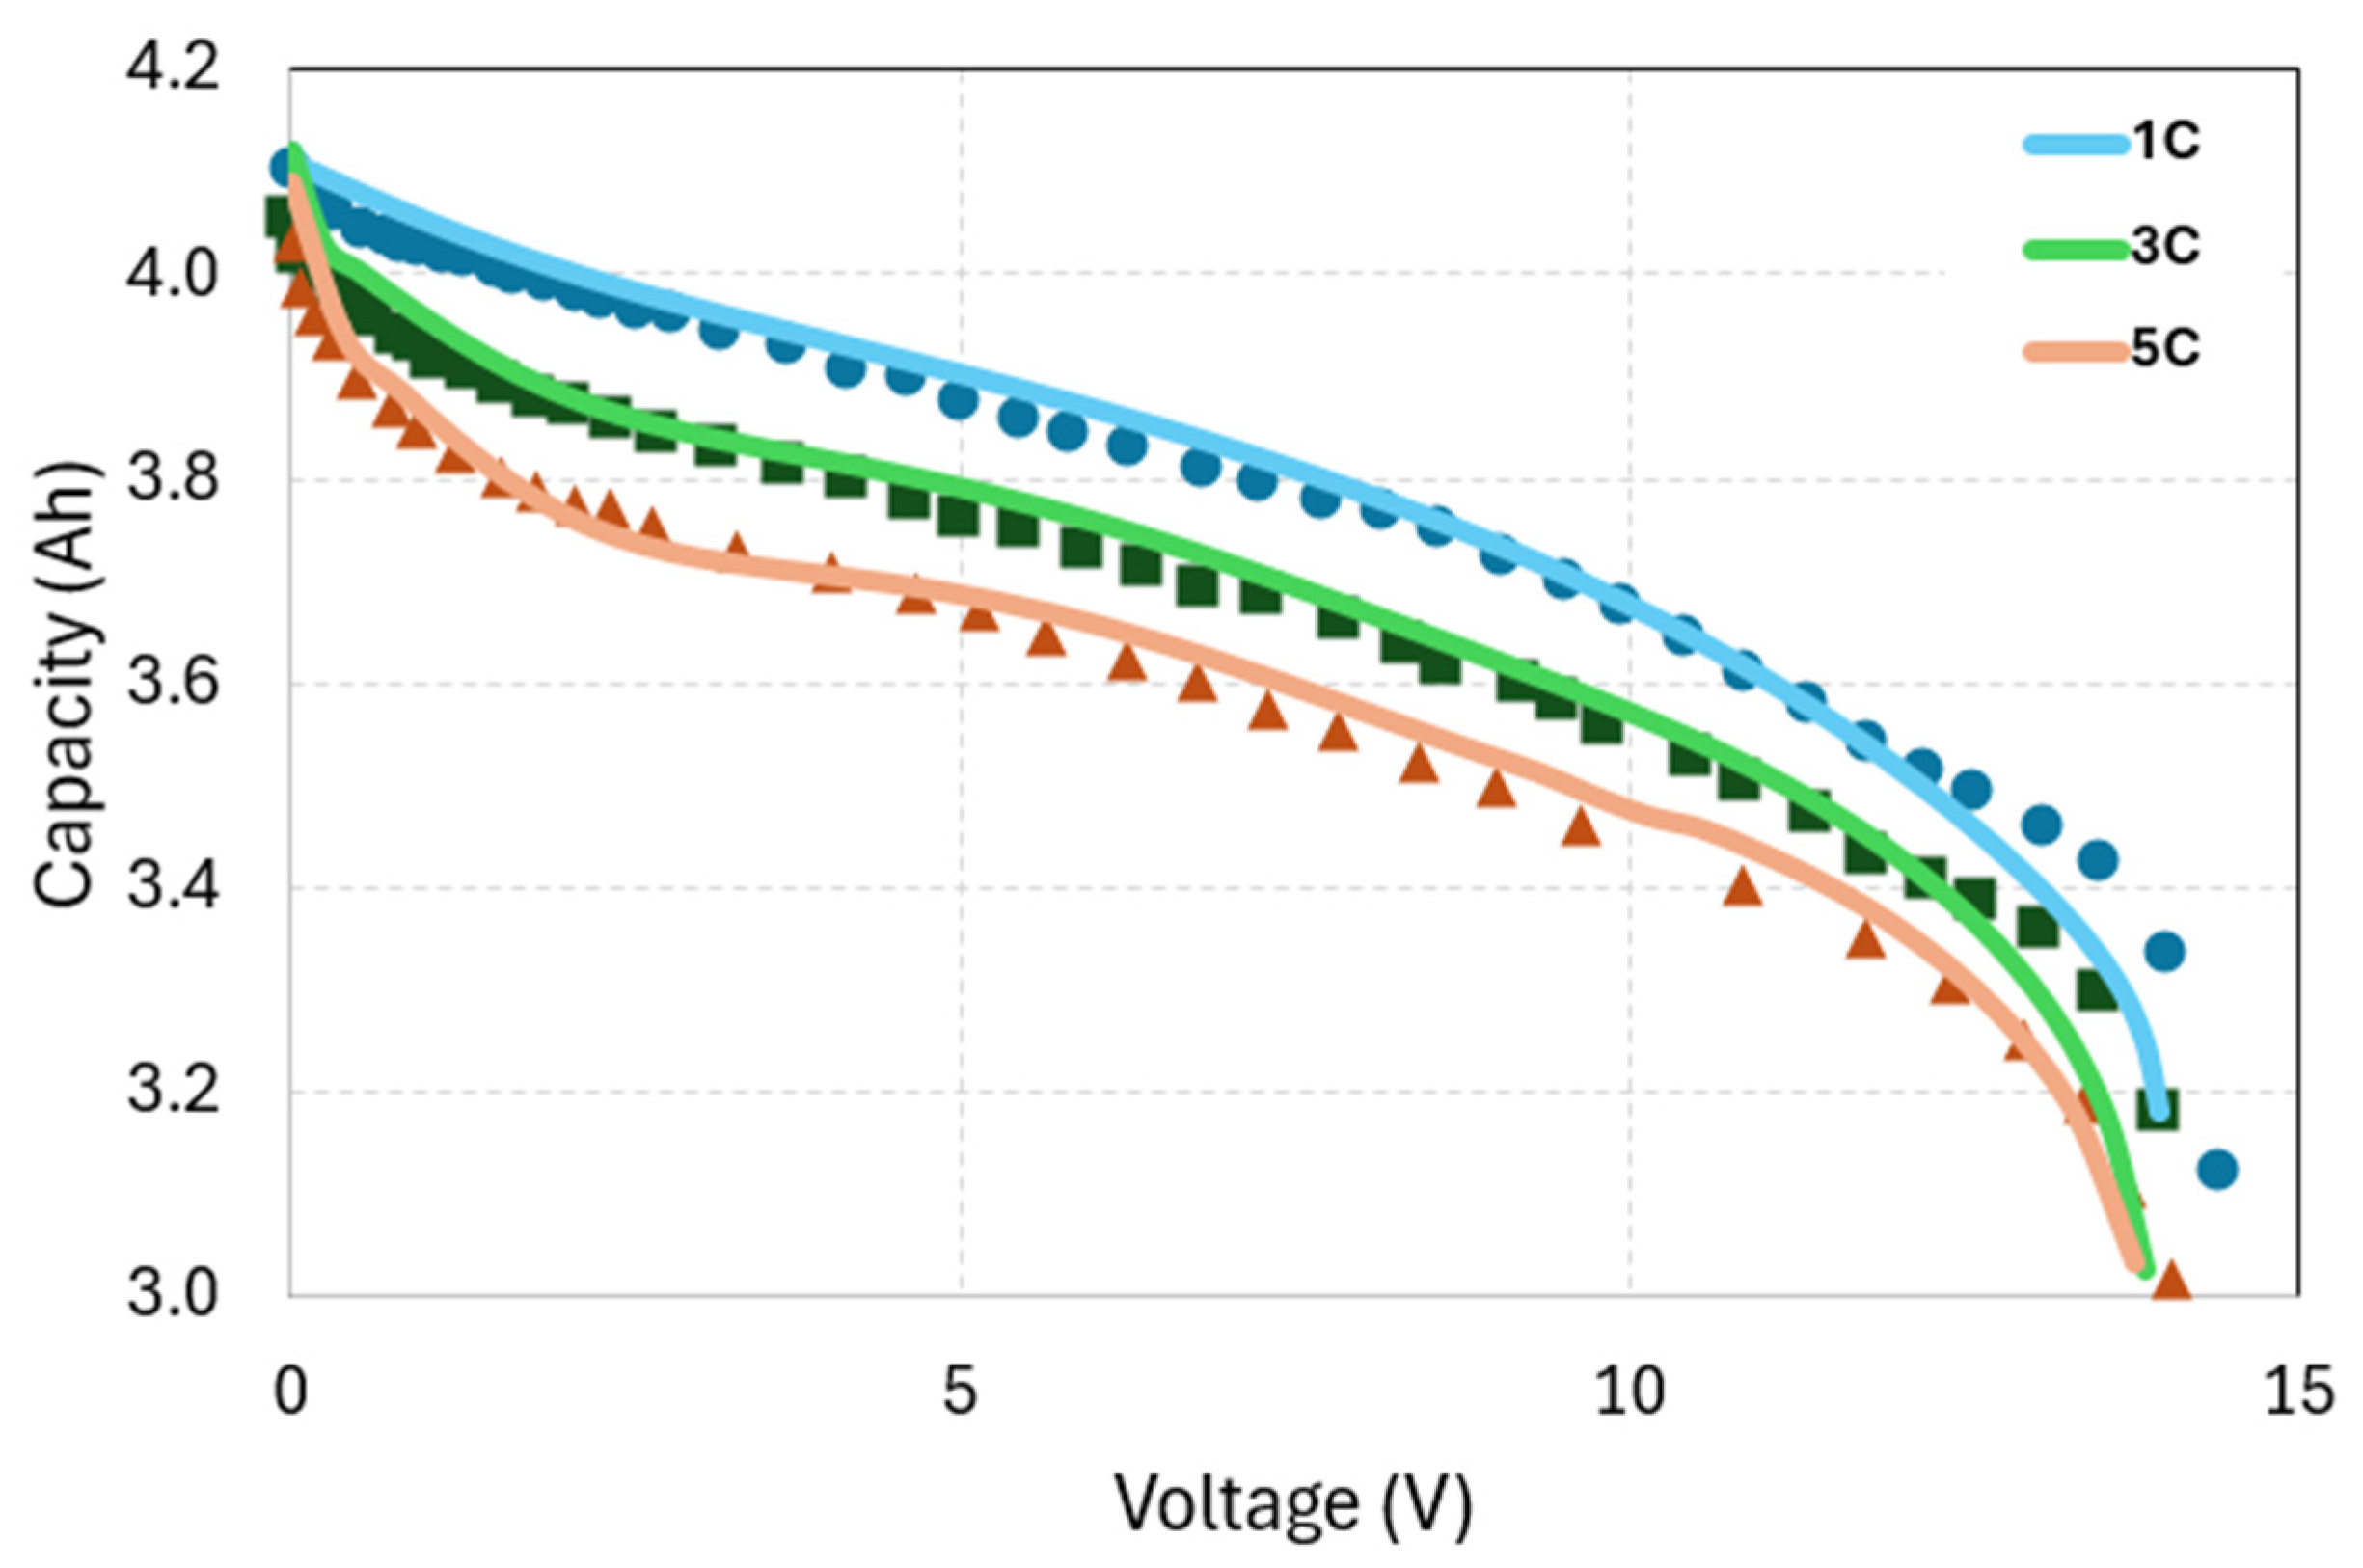
Figure 5 presents a comparison between the modeled voltage-capacity discharge curves and the experimental results from Kim et al. [35], demonstrating a strong agreement across different discharge rates. The predicted voltage profiles at 1C, 3C, and 5C closely follow the experimental data, confirming the model’s ability to capture the electrochemical behavior of the battery accurately. This agreement confirms the accuracy of both the electrochemical and thermal aspects of the model, as battery voltage is influenced by both factors. The model successfully reproduces the characteristic voltage drop as the discharge rate increases, a phenomenon attributed to increased polarization and ohmic resistance at higher currents. Furthermore, the model effectively replicates the expected voltage drop as the discharge rate increases, a trend that aligns well with experimental observations. This consistency highlights the model’s reliability in predicting the voltage response of LIBs under varying discharge conditions.

Figure 5.
Comparison of the experimental (scatters) and model (lines) discharge curves at discharge rates ranging from 1C to 5C.
This validation establishes confidence in the electrochemical-thermal foundation of the integrated model and its ability to accurately predict heat generation under various operating conditions.
3.2. PCM Thermal Management Model Validation
After validating the battery model, the performance of the integrated PCM thermal management system has been assessed by comparing simulation results with the benchmark data from Javani et al. [20], which investigated heat transfer and thermal management of lithium-ion cells using PCMs. Additionally, the results were assessed against the numerical results of Verma et al. [21] to further establish the reliability of the model.
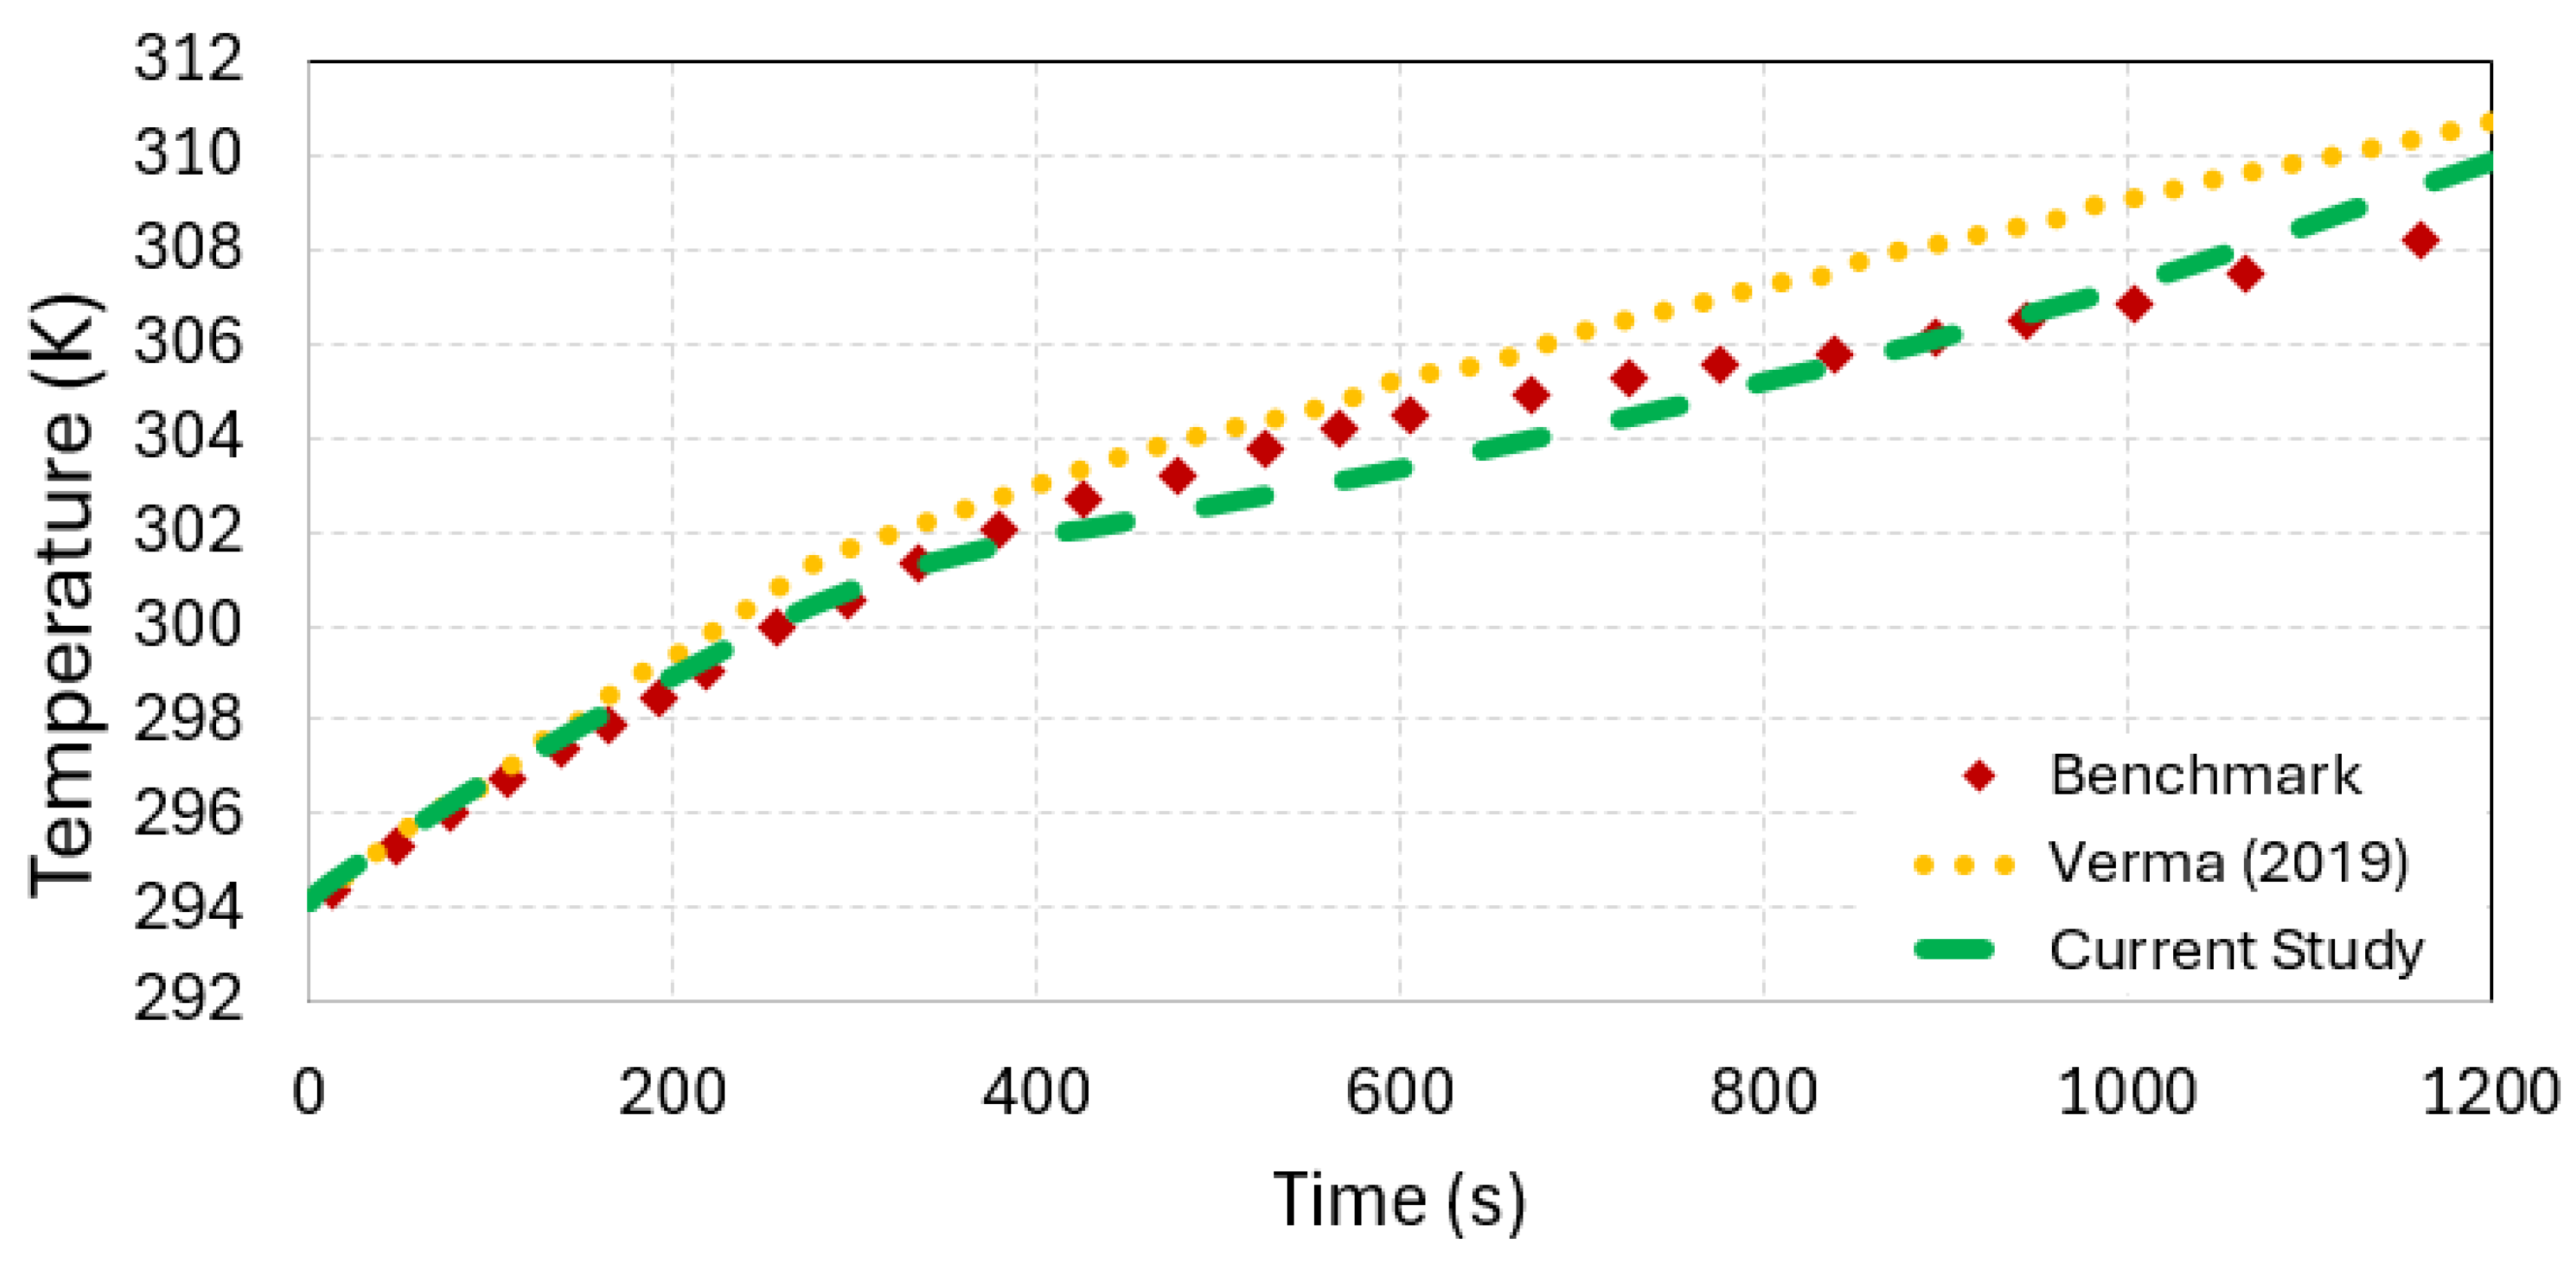
Figure 6 illustrates the comparison between the predicted temperature profiles obtained from the current study and those reported in Javani et al. [20] and Verma et al. [21]. The current study predictions and Verma [21] predictions are plotted against the benchmark’s true values (Javani et al. [20]). The temperature evolution over time demonstrates that the proposed model closely follows the benchmark data, with a minimal deviation throughout the simulation period. Notably, the current study exhibits a stronger agreement with the benchmark data than the results from Verma et al. [21], indicating improved predictive accuracy.
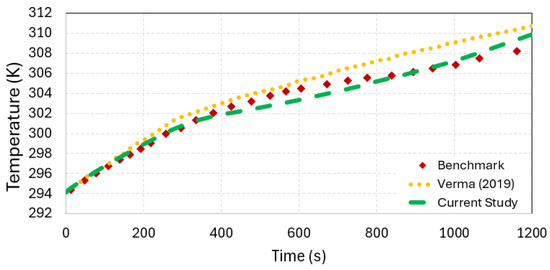
Figure 6.
Comparison of temperature over simulation time between current study, Verma et al. [21], and Javani (benchmark).
3.3. Phase Change Dynamics and Thermal Performance
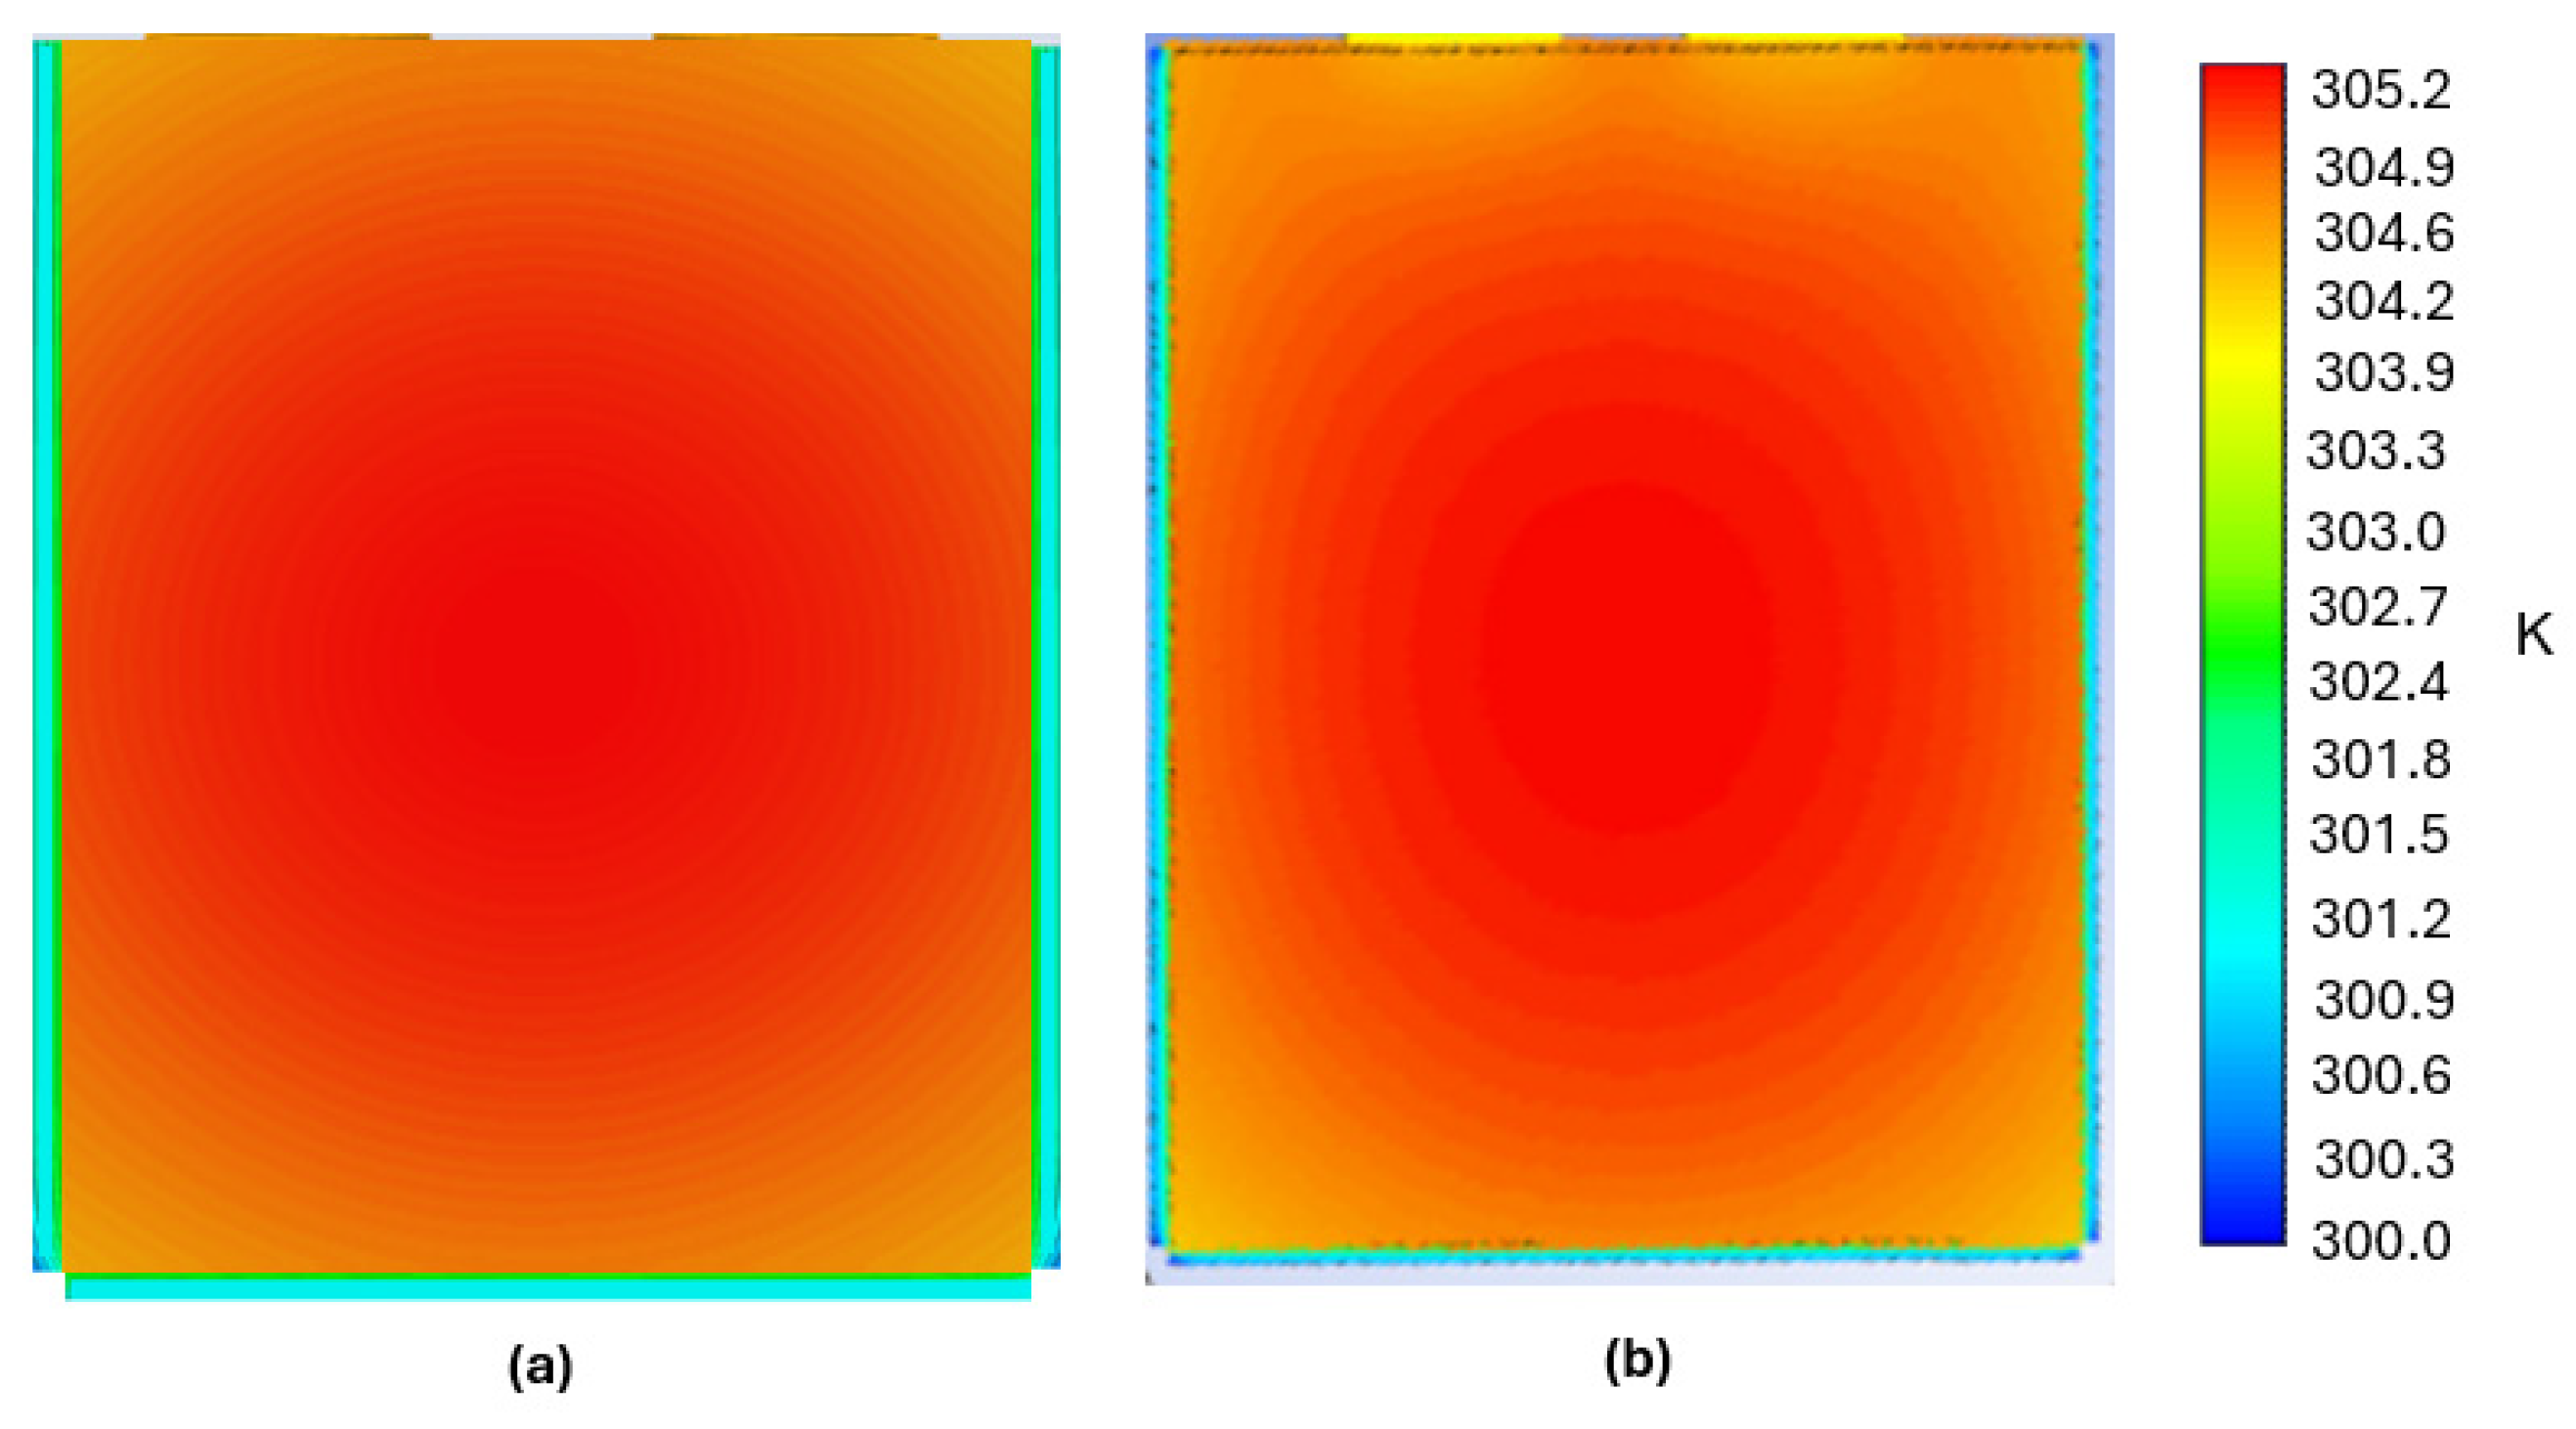
The temperature distribution within the battery-PCM system provides critical insights into the effectiveness of the thermal management approach. Figure 7 shows the temperature contours for the battery with a 3 mm Capric acid PCM layer during a 2C discharge rate (with a heat generation rate of 63,970 W/m3 used as a source term) at an ambient temperature of 294 K after 1200 s of operation. The temperature distribution shows a gradient from the central region of the battery toward the PCM boundary, with a maximum temperature of approximately 305 K. This result aligns well with the findings reported by Verma et al. [21] in their comparable configuration, confirming the model’s ability to accurately predict spatial temperature patterns under practical operating conditions. The visible thermal gradient within the PCM layer illustrates the progressive heat absorption process, with regions closer to the battery experiencing higher temperatures as they approach or undergo phase transition. This visualization demonstrates how the PCM effectively contains the temperature rise within the battery by absorbing and storing thermal energy through latent heat, preventing the battery from exceeding its optimal operating temperature range.
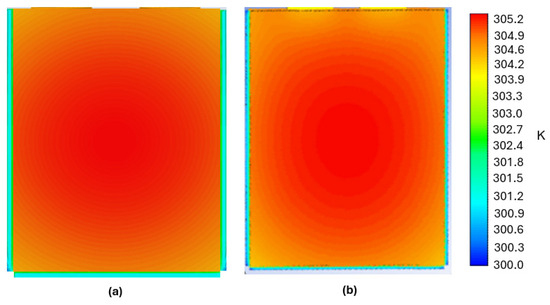
Figure 7.
Battery with 3 mm thickness of PCM layer at 294 K, 63,970 W/m3, (a) current study, (b) Verma et al. [21].
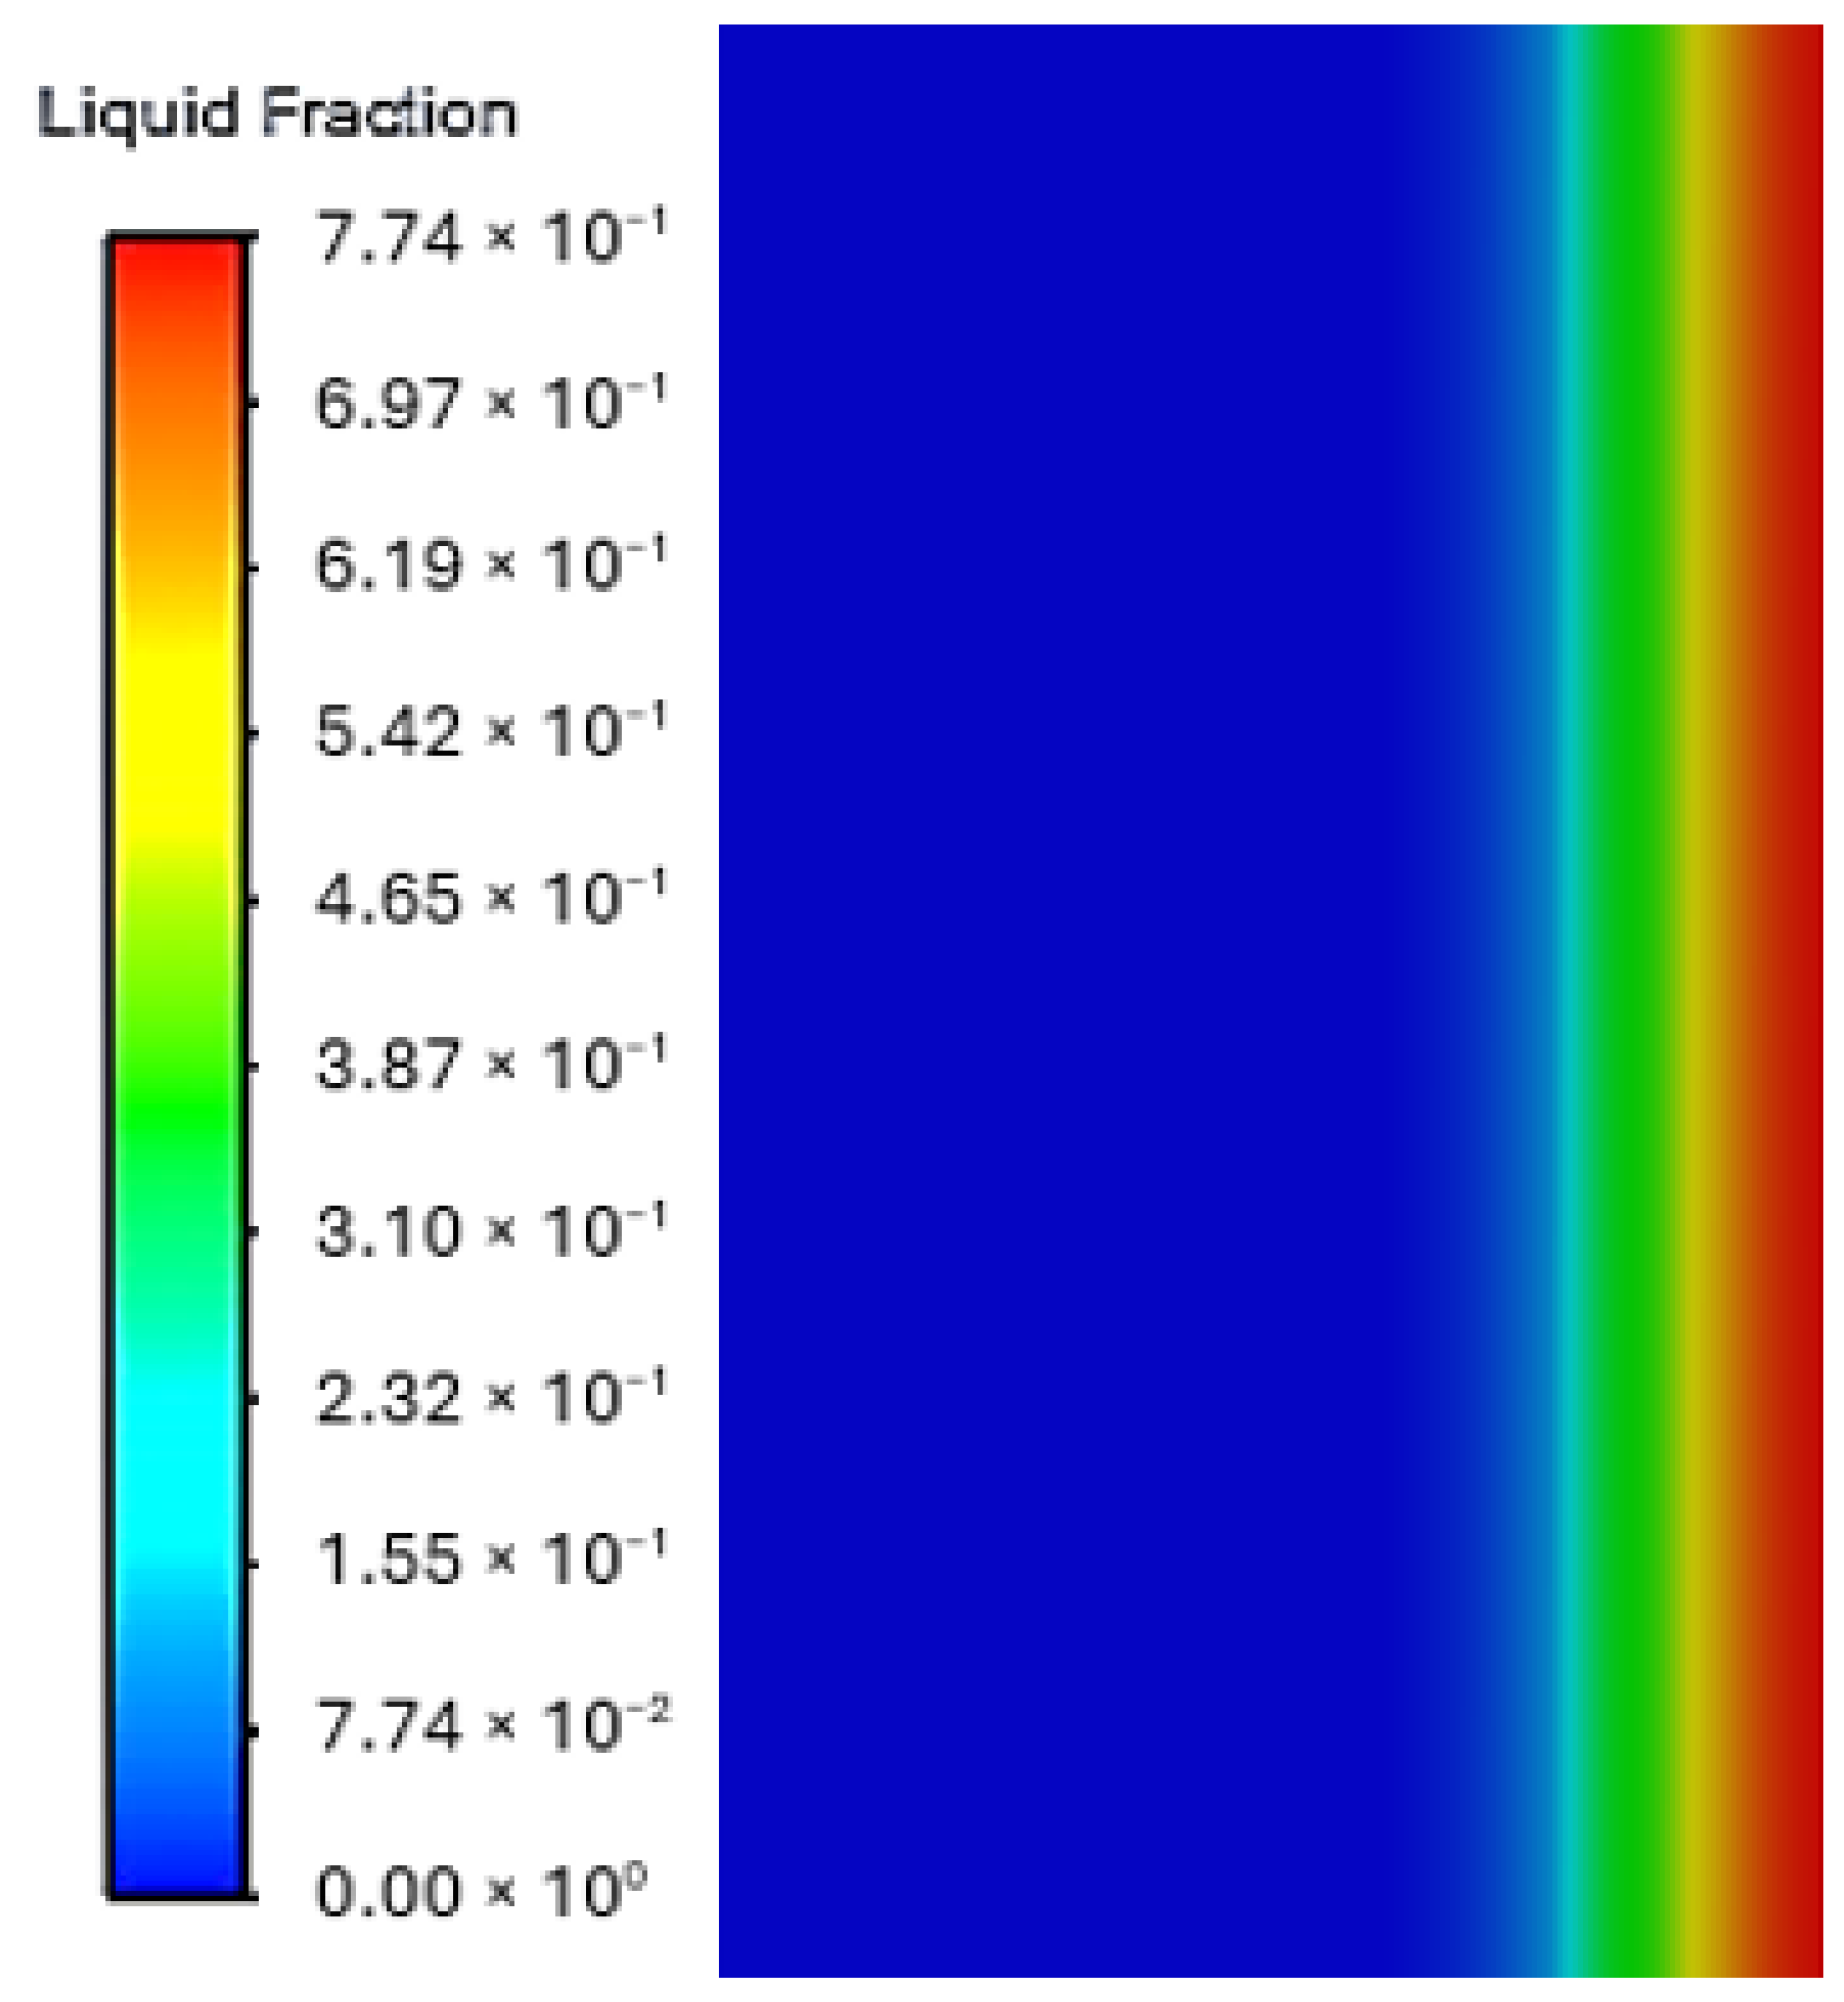
Beyond validation against previous studies, our model provides valuable insights into the phase change dynamics and thermal performance of the battery-PCM system. The analysis of liquid fraction evolution during discharge reveals the progressive melting pattern of the PCM and its effectiveness in absorbing heat during thermal transients. PCM begins melting near the battery surface within the first 5 min of discharge, with the phase change gradually propagating outward as discharge continues. This behavior highlights the importance of selecting a PCM with an appropriate phase change temperature and latent heat capacity to match the specific operating conditions of the battery.
Figure 8 illustrates the liquid fraction distribution in the PCM after 1200 s of discharge at a 2C rate. The color scale ranges from 0.00 (completely solid, blue) to 0.774 (partially melted, red), revealing the progressive phase transition from the battery-PCM interface outward.
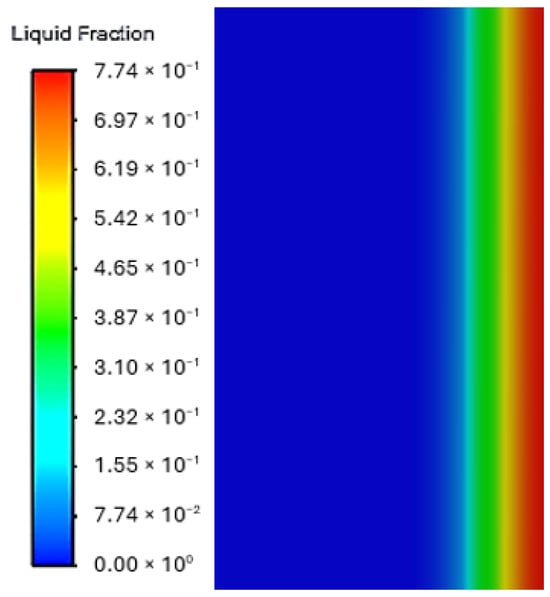
Figure 8.
Liquid fraction distribution within the 3 mm Capric acid PCM layer after 1200 s of battery discharge at 2C rate (63,970 W/m3) and ambient temperature of 294 K.
The contour exhibits a distinct gradient with higher liquid fraction values concentrated near the battery surface (right side), where temperatures are highest. This visualization clearly demonstrates the thermal energy absorption mechanism of the PCM, as regions with liquid fractions between 0.0 and 1.0 represent the “mushy zone” where phase change is actively occurring, and latent heat is being absorbed. The relatively narrow transition band between fully solid and partially melted regions indicates the effectiveness of Capric acid’s sharp phase transition behavior compared to paraffin-based PCMs.
The incomplete melting (maximum liquid fraction of 0.774) after 1200 s suggests that the PCM still retains additional thermal storage capacity, which is advantageous for longer duration discharge scenarios. This behavior confirms that the 3 mm PCM layer provides an appropriate balance between thermal protection and material efficiency for the tested discharge conditions.
3.4. Comparative Analysis with Previous Studies
To further assess the accuracy of the proposed PCM thermal management model, a quantitative error analysis was conducted by comparing the predictions between the current study, Verma et al. [21], and the benchmark data from Javani et al. [20]. The analysis aimed to evaluate the deviation of predicted values from the true values by computing key statistical error metrics: MSE, RMSE, R2, MAE, and MAPE. These metrics provide a comprehensive assessment of the model’s predictive performance, allowing for a rigorous comparison of the two studies.
3.5. Data Preparation and Interpolation
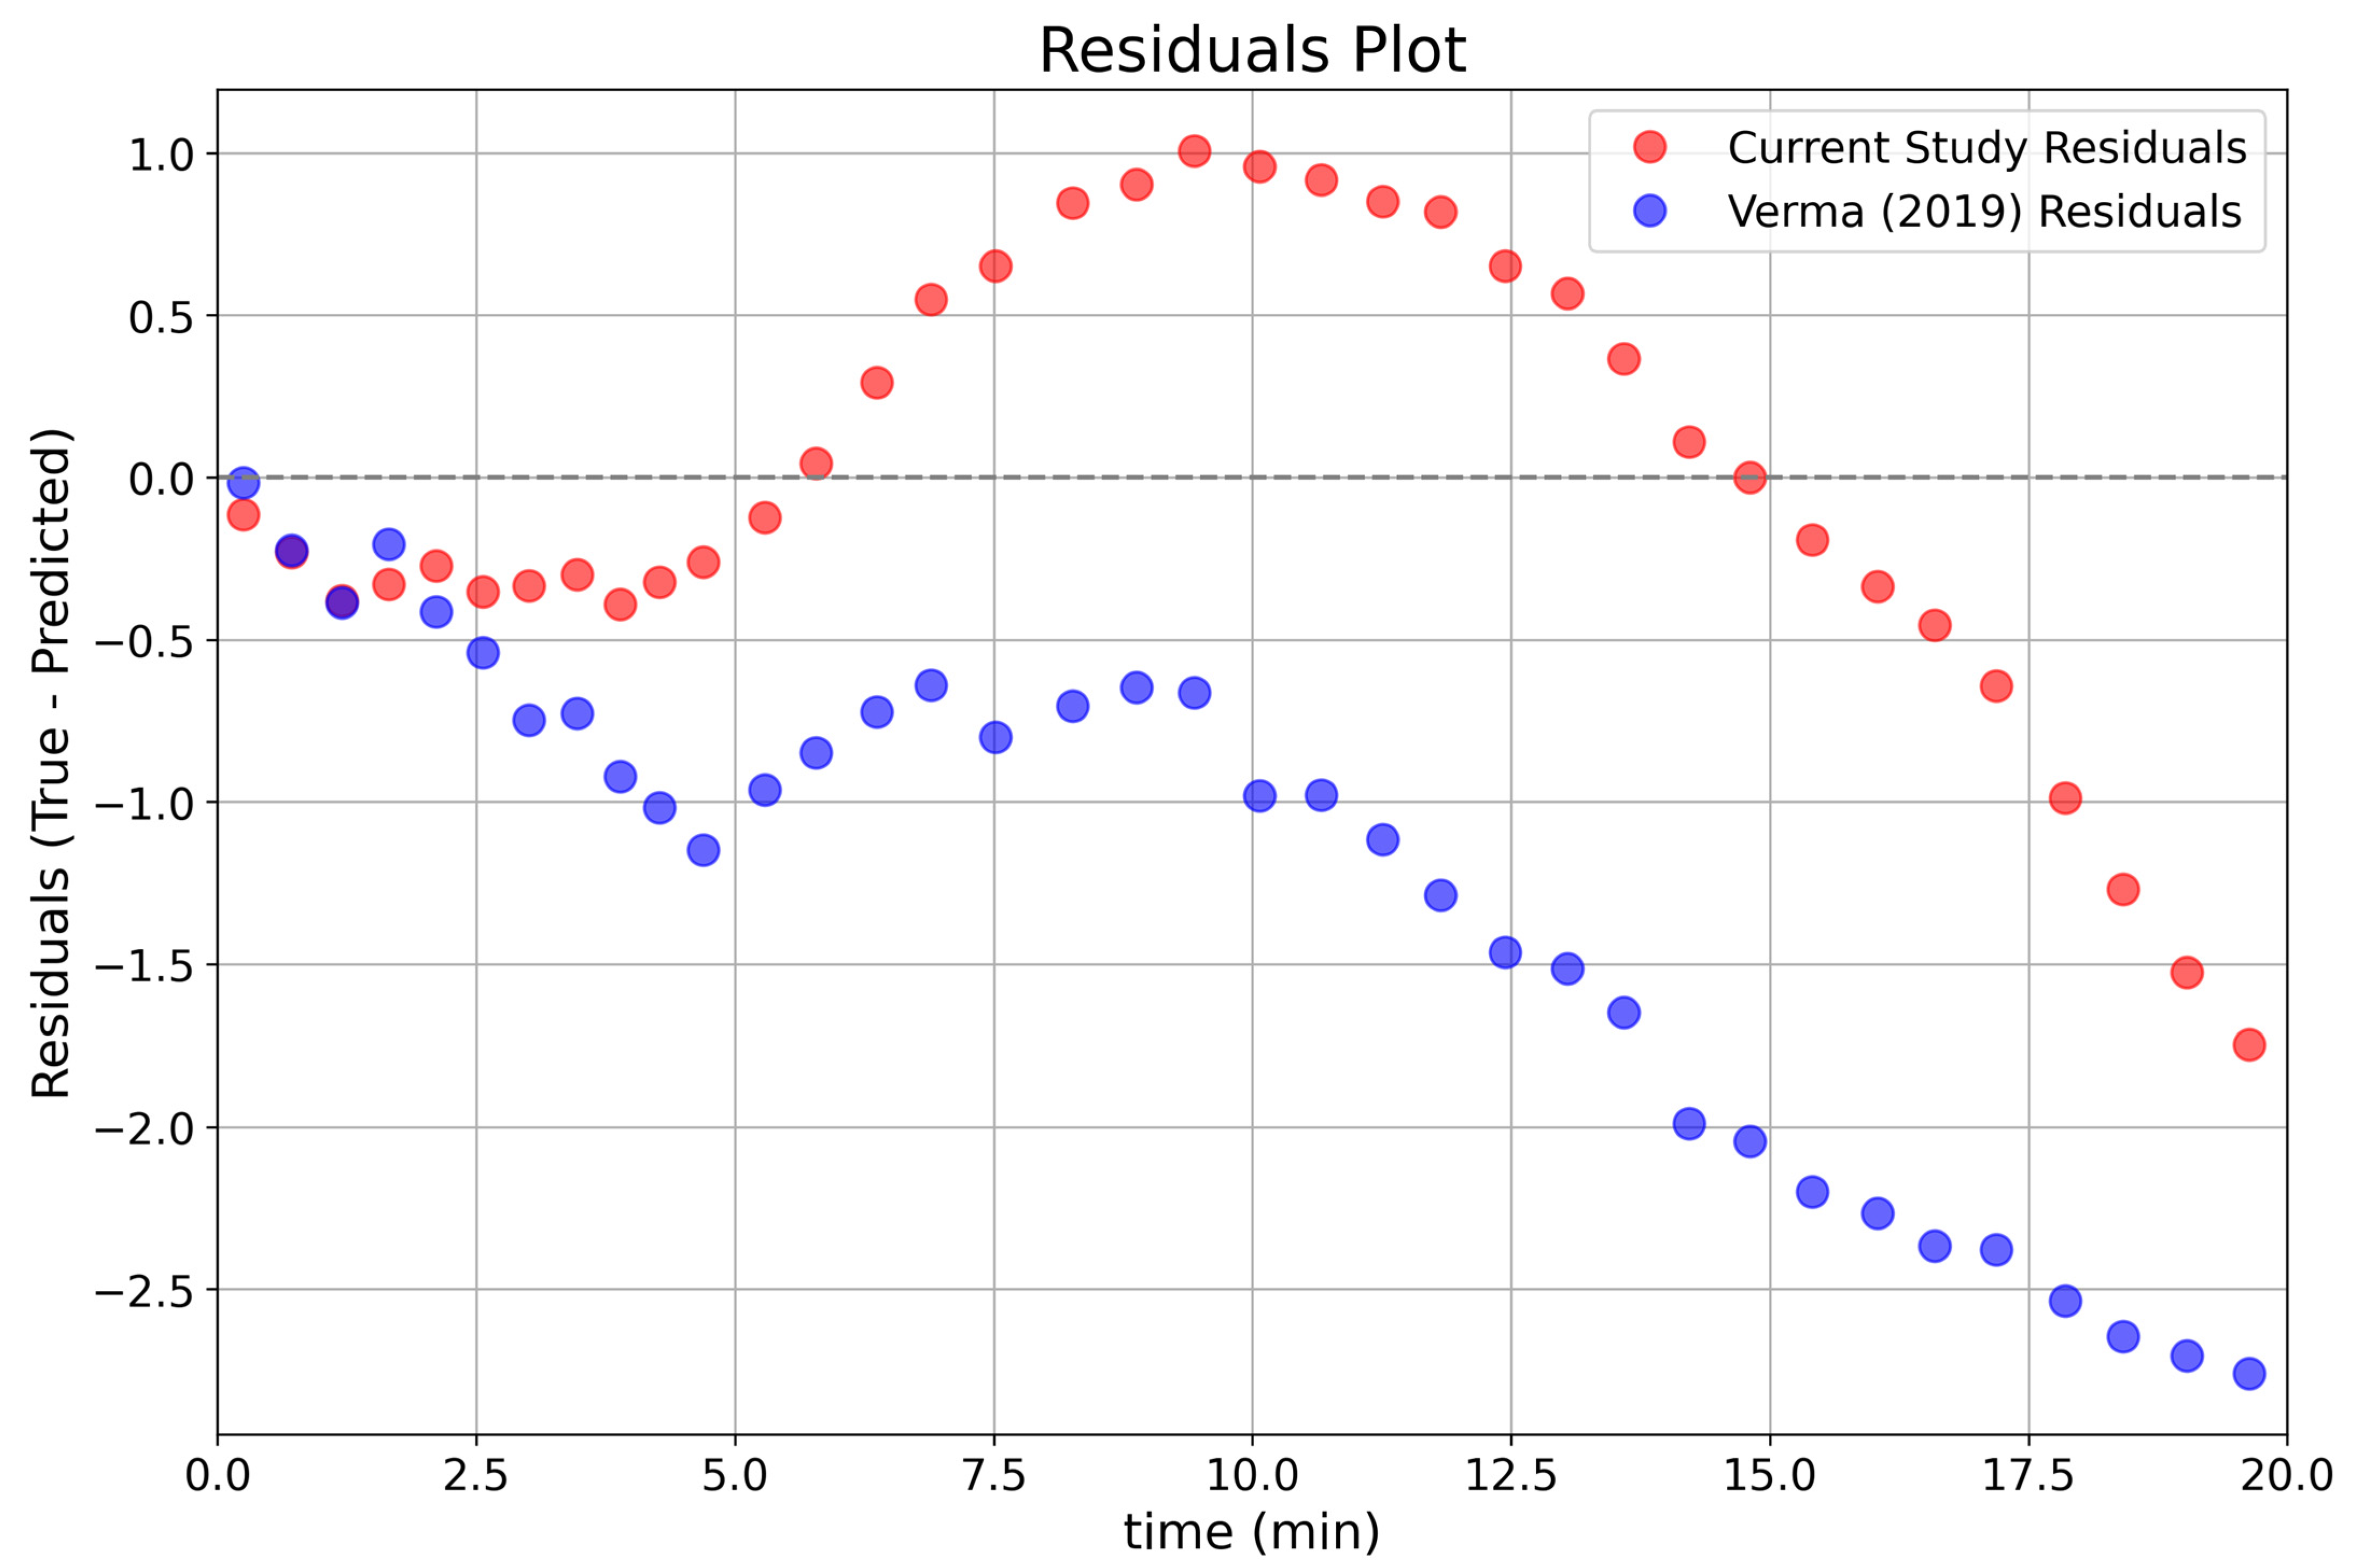
To facilitate a direct comparison between the current study and previous work by Verma et al. [21], a systematic analysis of temperature profiles was conducted using the benchmark data from Javani et al. [20] as a reference point. The temperature–time relationships presented in Figure 5 were examined to calculate the deviations of each model from the benchmark values. This comparative approach allowed for the quantification of prediction accuracy and the identification of potential systematic biases in both modelling approaches. The residual analysis that follows provides a clear visualization of how each model performs across the simulation timeframe and reveals patterns in prediction errors that inform the statistical error metrics presented later in this section.
Figure 9 presents the error residuals, which exhibit the differences between the true values from the benchmark study of Javani et al. [20] and the predicted values from both the current study and Verma et al. [21].
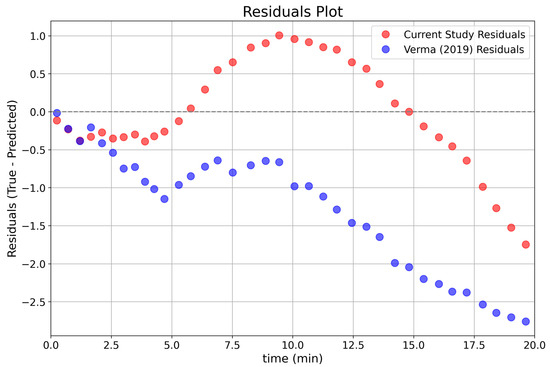
Figure 9.
Residual errors comparison between current study and Verma et al. [21] with respect to the benchmark [20].
The distribution of residuals indicates that the current study demonstrates a more balanced pattern, with residuals fluctuating symmetrically around the zero line. This suggests that the model does not exhibit significant bias toward overestimation or underestimation. In contrast, residuals from Verma et al. [21] display a systematic downward deviation, indicating a persistent underprediction of temperature values relative to the benchmark. This trend highlights the superior predictive consistency of the current study, as its residuals remain more closely distributed around zero, reducing overall prediction errors.
3.6. Error Metrics Comparison
To quantify the differences in model accuracy, Figure 10 and Table 1 provide a comparative visualization of the calculated error metrics (see Appendix A for definitions of these metrics). The MSE and RMSE values confirm that the present model produces significantly lower error magnitudes than those of Verma et al. [21], demonstrating its improved predictive capability. Additionally, the R2 value of 0.9688 for the current model indicates a higher proportion of variance explained, reinforcing the model’s ability to capture the underlying temperature trends. The MAE and MAPE values further highlight that the present model maintains lower absolute and percentage-based errors, confirming its robustness in minimizing discrepancies from the benchmark data.
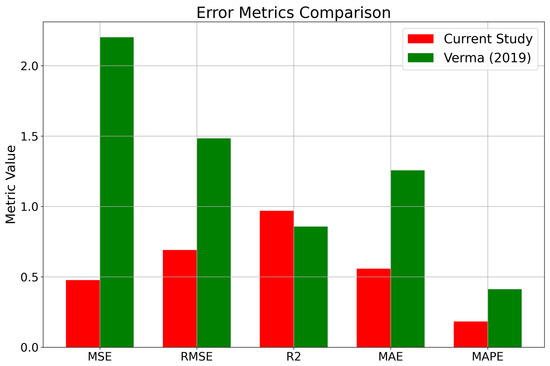
Figure 10.
Error metric values for the current model and Verma et al. [21] with respect to the benchmark data.

Table 1.
Error comparison between current model and Verma et al. [21].
The values of error metrics in Figure 10 are listed in Table 1. The superior agreement of the present model with the benchmark study of Javani et al. [20] suggests that it effectively captures the latent heat absorption characteristics of PCM during the battery’s high discharge rates, reducing temperature excursions. The results highlight the model’s enhanced predictive capability in simulating thermal management strategies for LIBs compared to previously published studies.
By accurately replicating the experimental trends observed in Javani et al. [20] and outperforming the predictions of Verma et al. [21], the present study reinforces the effectiveness of the adopted numerical framework. These findings establish a solid foundation for further exploration of enhanced PCMs and hybrid cooling strategies in advanced battery thermal management systems.
4. Conclusions
This study introduces a meticulously validated numerical model for the thermal behavior of lithium-ion batteries (LIBs) integrated with phase change material (PCM) thermal management systems. The model’s validation approach, which covers both the electrochemical-thermal battery behavior and PCM-based cooling systems, provides a solid foundation for future advancements in battery thermal management systems (BTMSs).
The battery model, built upon the NTGK electrochemical-thermal framework, showed strong alignment with experimental data across a range of discharge rates (1C, 3C, and 5C) and environmental conditions. Temperature distributions, including both spatial and temporal variations, closely matched experimental measurements, with minimal discrepancies. The voltage-capacity discharge curves across different C-rates also accurately reflected the electrochemical response of the battery, demonstrating the model’s capacity to predict both thermal and electrical performance under realistic operating scenarios.
The PCM-integrated BTMS successfully simulated the phase change dynamics and heat absorption characteristics of the Capric acid PCM. The model effectively predicted the spatial temperature distribution within the battery-PCM system and the phase transition progression of the PCM during discharge. By analyzing the evolution of the liquid fraction, the study provided important insights into the thermal energy absorption mechanism, confirming that a 3 mm PCM layer offers an optimal balance between thermal protection and material efficiency under the tested discharge conditions.
Comparative analysis with prior studies highlighted the superior predictive capability of this model. Statistical error analysis showed significant improvements over the work of Verma et al. [21], with reductions of 78.3% in Mean Squared Error (0.477 vs. 2.202), 53.4% in Root Mean Squared Error (0.619 vs. 1.483), and 55.5% in Mean Absolute Percentage Error (0.001 vs. 0.004). The model achieved a high coefficient of determination (R2) of 0.968858, indicating an excellent fit to benchmark data from Javani et al. [20]. Furthermore, residual analysis revealed a more balanced error distribution, without systematic bias, confirming the robustness of the model across varying thermal conditions.
These improvements stem from three key factors: (1) more accurate implementation of the NTGK electrochemical-thermal model, especially in capturing temperature-dependent parameters; (2) precise characterization of the enthalpy-porosity phase change behavior in the PCM region; and (3) careful consideration of the coupled heat transfer between the battery and the PCM. The balanced residual distribution further suggests that this model avoids the systematic errors that may have affected earlier versions.
The validated model serves as a reliable platform for exploring advanced thermal management strategies for LIBs in high-power applications.
While Capric acid PCM was used for validation in this study, its relatively low melting point (~302 K) may limit its effectiveness in real-world applications with elevated ambient temperatures (e.g., during summer or under direct solar exposure). Under such conditions, the PCM may experience heat storage saturation, reducing its thermal buffering ability. As such, future research should investigate the use of higher melting point PCMs, PCM mixtures, or temperature-adaptive composites to broaden the model’s applicability to a wider range of operating environments.
Building on this foundation, future work could focus on optimizing PCM properties, integrating thermal conductivity enhancers like metal foams or nanoparticles [35], and developing hybrid cooling systems that combine PCM with active cooling methods. Additionally, the model could be adapted for larger battery packs and various cell geometries to tackle thermal management challenges in real-world electric vehicle (EV) applications.
By offering a high-fidelity tool for predicting battery thermal behavior with PCM cooling, this study contributes significantly to the development of safer, more efficient energy storage systems. The enhanced BTMS enabled by this research will play a crucial role in advancing the electrification of transportation and the integration of renewable energy sources, areas where the performance, safety, and longevity of LIBs are of paramount importance. As battery technologies evolve toward higher energy densities and faster charging rates, precise thermal management modeling becomes increasingly vital, making this work a timely and valuable contribution to the field.
Author Contributions
Conceptualization, M.N.; methodology, M.N. and H.H.; software, M.N.; validation, M.N.; formal analysis, M.N.; investigation, M.N. and H.H.; resources, M.N.; data curation, M.N.; writing—original draft preparation, M.N.; writing—review and editing, M.N. and H.H.; visualization, M.N.; supervision, H.H.; project administration, H.H. All authors have read and agreed to the published version of the manuscript.
Funding
This research received no external funding.
Data Availability Statement
The raw data supporting the conclusions of this article will be made available by the authors on request.
Conflicts of Interest
The authors declare no conflicts of interest.
Abbreviations
| BTMS | Battery thermal management system |
| DOD | Depth of discharge |
| LIB | Lithium-ion battery |
| MAE | Mean Absolute Error |
| MAPE | Mean Absolute Percentage Error |
| MSE | Mean Squared Error |
| NTGK | Newman–Tiedemann–Gu–Kim |
| PCM | Phase change material |
| RMSE | Root Mean Squared Error |
| TMS | Thermal management system |
| EV | Electric vehicle |
| TR | Thermal runaway |
| Nomenclature | |
| ρ | Density (kg/m3) |
| Cp | Specific heat capacity (J/kg·K) |
| k | Thermal conductivity (W/m·K) |
| σ | Electrical conductivity (S/m) |
| H | Total enthalpy (J) |
| L | Latent heat of fusion (kJ/kg) |
| f | Liquid fraction |
| T | Temperature (K) |
| t | Time (s) |
| q | Volumetric heat generation rate (W/m3) |
| J | Current density (A/m2) |
| δ | Thickness (μm) |
| E | Cell voltage (V) |
| U | Open-circuit potential (V) |
| Y, U | Polarization parameters |
| h | Convective heat transfer coefficient (W/m2·K) |
| DOD | Depth of discharge (dimensionless) |
| a | Specific area of battery (m2) |
| ip, in | Magnitude of current density vectors (A/m2) |
Appendix A. Statistical Error Analysis for Model Evaluation
To systematically quantify the predictive accuracy of the present model and enable objective comparison with previous studies, a comprehensive statistical error analysis framework was implemented. This framework employs multiple complementary error metrics to evaluate different aspects of model performance against benchmark data. For the error analysis, let yi represent the observed (benchmark) values, denote the predicted values from the model, and n be the total number of data points. The following statistical error metrics were calculated:
Mean Squared Error (MSE):
The Mean Squared Error measures the average squared difference between predicted and observed values:
MSE penalizes large errors due to its squared nature, making it particularly sensitive to outliers. A smaller MSE indicates better model performance.
Root Mean Squared Error (RMSE):
The Root Mean Squared Error provides the square root of MSE, returning the error measure to the same units as the original data
RMSE maintains the emphasis on larger errors while being more interpretable than MSE in the context of the original data scale.
Coefficient of Determination (R2):
The Coefficient of Determination measures the proportion of variance in the observed data that is explained by the model
where is the mean of the observed values. R2 ranges from 0 to 1, with higher values indicating better model fit. An R2 of 1 represents a perfect fit.
Mean Absolute Error (MAE):
The Mean Absolute Error calculates the average absolute difference between predicted and observed values
Unlike MSE, MAE weights all errors linearly, providing a more robust measure less affected by outliers.
Mean Absolute Percentage Error (MAPE):
The Mean Absolute Percentage Error expresses accuracy as a percentage of the error relative to the observed values
MAPE provides a scale-independent error measure that allows for meaningful comparison across different datasets or studies.
To ensure a fair comparison between the present model and previous studies (particularly Verma et al. [21]), data interpolation was performed to align the time points between different datasets. This preprocessing step enables direct point-to-point comparison of predicted values against benchmark data. The consistent application of these error metrics across model evaluations provides a rigorous and objective framework for assessing improvements in predictive accuracy.
References
- Khan, F.N.U.; Rasul, M.G.; Sayem, A.S.M.; Mandal, N.K. Design and optimization of lithium-ion battery as an efficient energy storage device for electric vehicles: A comprehensive review. J. Energy Storage 2023, 71, 108033. [Google Scholar] [CrossRef]
- Nasiri, M.; Hadim, H. Battery Thermal Management Systems: Analyzing Today’s Landscape and Tomorrow’s Technology. In Proceedings of the 9th Thermal and Fluids Engineering Conference (TFEC), Corvallis, OR, USA, 21–24 April 2024; ASTFE Digital Library, Begell House Inc.: Danbury, CT, USA, 2024. Available online: https://dl.astfe.org/conferences/tfec2024,2d6c7309626b1193,111d34ff7129638b.html (accessed on 16 September 2024).
- Xu, J.; Cai, X.; Cai, S.; Shao, Y.; Hu, C.; Lu, S.; Ding, S. High-Energy Lithium-Ion Batteries: Recent Progress and a Promising Future in Applications. Energy Environ. Mater. 2023, 6, e12450. [Google Scholar] [CrossRef]
- Sahoo, S.; Timmann, P. Energy storage technologies for modern power systems: A detailed analysis of functionalities, potentials, and impacts. IEEE Access 2023, 11, 49689–49729. [Google Scholar] [CrossRef]
- Li, Z.; Zhang, Y.; Zhang, S.; Tang, B. Phase change materials for lithium-ion battery thermal management systems: A review. J. Energy Storage 2024, 80, 110259. [Google Scholar] [CrossRef]
- Zhang, X.; Li, Z.; Luo, L.; Fan, Y.; Du, Z. A review on thermal management of lithium-ion batteries for electric vehicles. Energy 2022, 238, 121652. [Google Scholar] [CrossRef]
- Nasiri, M.; Hadim, H. Advances in battery thermal management: Current landscape and future directions. Renew. Sustain. Energy Rev. 2024, 200, 114611. [Google Scholar] [CrossRef]
- Chen, Y.; Kang, Y.; Zhao, Y.; Wang, L.; Liu, J.; Li, Y.; Liang, Z.; He, X.; Li, X.; Tavajohi, N.; et al. A review of lithium-ion battery safety concerns: The issues, strategies, and testing standards. J. Energy Chem. 2021, 59, 83–99. [Google Scholar] [CrossRef]
- Patel, J.R.; Rathod, M.K. Recent developments in the passive and hybrid thermal management techniques of lithium-ion batteries. J. Power Sources 2020, 480, 228820. [Google Scholar] [CrossRef]
- Ahmadian-Elmi, M.; Zhao, P. Review of thermal management strategies for cylindrical lithium-ion battery packs. Batteries 2024, 10, 50. [Google Scholar] [CrossRef]
- Lamrani, B.; Johannes, K.; Kuznik, F. Phase change materials integrated into building walls: An updated review. Renew. Sustain. Energy Rev. 2021, 140, 110751. [Google Scholar] [CrossRef]
- Jilte, R.; Afzal, A.; Panchal, S. A novel battery thermal management system using nano-enhanced phase change materials. Energy 2021, 219, 119564. [Google Scholar] [CrossRef]
- El Idi, M.M.; Karkri, M.; Tankari, M.A. A passive thermal management system of Li-ion batteries using PCM composites: Experimental and numerical investigations. Int. J. Heat Mass Transf. 2021, 169, 120894. [Google Scholar] [CrossRef]
- Srivastava, G.; Nandan, R.; Das, M.K. Thermal runaway management of Li ion battery using PCM: A parametric study. Energy Convers. Manag. X 2022, 16, 100306. [Google Scholar] [CrossRef]
- Sarmadian, A.; Widanage, W.D.; Shollock, B.; Restuccia, F. Experimentally-verified thermal-electrochemical simulations of a cylindrical battery using physics-based, simplified and generalized lumped models. J. Energy Storage 2023, 70, 107910. [Google Scholar] [CrossRef]
- Zhao, Y.; Wei, M.; Dan, D.; Dong, J.; Wright, E. Enhancing battery electrochemical-thermal model accuracy through a hybrid parameter estimation framework. Energy Storage Mater. 2024, 72, 103720. [Google Scholar] [CrossRef]
- Wang, Q.-K.; Shen, J.-N.; Ma, Z.-F.; He, Y.-J. Decoupling parameter estimation strategy based electrochemical-thermal coupled modeling method for large format lithium-ion batteries with internal temperature experimental validation. Chem. Eng. J. 2021, 424, 130308. [Google Scholar] [CrossRef]
- Zhu, X.; Xie, Y.; Chen, H.; Luan, W. Numerical analysis of the cyclic mechanical damage of Li-ion battery electrode and experimental validation. Int. J. Fatigue 2021, 142, 105915. [Google Scholar] [CrossRef]
- Kim, U.S.; Yi, J.; Shin, C.B.; Han, T.; Park, S. Modeling the dependence of the discharge behavior of a lithium-ion battery on the environmental temperature. J. Electrochem. Soc. 2011, 158, A611. [Google Scholar]
- Javani, N.; Dincer, I.; Naterer, G.F.; Yilbas, B.S. Heat transfer and thermal management with PCMs in a Li-ion battery cell for electric vehicles. Int. J. Heat Mass Transf. 2014, 72, 690–703. [Google Scholar] [CrossRef]
- Verma, A.; Shashidhara, S.; Rakshit, D. A comparative study on battery thermal management using phase change material (PCM). Therm. Sci. Eng. Prog. 2019, 11, 74–83. [Google Scholar] [CrossRef]
- Kwon, K.H.; Shin, C.B.; Kang, T.H.; Kim, C.-S. A two-dimensional modeling of a lithium-polymer battery. J. Power Sources 2006, 163, 151–157. [Google Scholar] [CrossRef]
- Bergveld, H.J.; Kruijt, W.S.; Notten, P.H.L. Battery Management Systems. In Battery Management Systems; Springer: Dordrecht, The Netherlands, 2002; pp. 9–30. [Google Scholar] [CrossRef]
- Pals, C.R.; Newman, J. Thermal modeling of the lithium/polymer battery: I. Discharge behavior of a single cell. J. Electrochem. Soc. 1995, 142, 3274. [Google Scholar] [CrossRef]
- Bard, A.J.; Faulkner, L.R.; White, H.S. Electrochemical Methods: Fundamentals and Applications; John Wiley & Sons: Hoboken, NJ, USA, 2022; Available online: https://books.google.com/books?hl=en&lr=&id=4ShuEAAAQBAJ&oi=fnd&pg=PR21&dq=A.+J.+Bard+and+L.+R.+Falkner,+Electrochemical+Methods:+Fundamentals+and+Applications,+2nd+ed.,+John+Wiley+and+Sons,+Inc.,+New+York+(2001).&ots=SJErFYRwsI&sig=S6nTJA9aahmn2H0n2CaOLa5pWmU (accessed on 21 March 2025).
- Song, L.; Evans, J.W. Electrochemical-thermal model of lithium polymer batteries. J. Electrochem. Soc. 2000, 147, 2086. [Google Scholar] [CrossRef]
- Gu, W.B.; Wang, C.Y. Thermal-electrochemical modeling of battery systems. J. Electrochem. Soc. 2000, 147, 2910. [Google Scholar] [CrossRef]
- Srinivasan, V.; Wang, C.Y. Analysis of electrochemical and thermal behavior of Li-ion cells. J. Electrochem. Soc. 2002, 150, A98. [Google Scholar] [CrossRef]
- Kim, U.S.; Shin, C.B.; Kim, C.-S. Effect of electrode configuration on the thermal behavior of a lithium-polymer battery. J. Power Sources 2008, 180, 909–916. [Google Scholar] [CrossRef]
- ANSYS Drive Canonsburg. ANSYS Fluent Advanced Add-On Modules; ANSYS: Canonsburg, PA, USA, 2015; Volume 15317, pp. 724–746. [Google Scholar]
- Benhorma, A.; Bensenouci, A.; Teggar, M.; Ismail, K.A.; Arıcı, M.; Mezaache, E.; Laouer, A.; Lino, F.A. Prospects and challenges of bio-based phase change materials: An up to date review. J. Energy Storage 2024, 90, 111713. [Google Scholar] [CrossRef]
- Wu, W.Y.; Yeap, I.S.; Wang, S.; Tomczak, N.; Lin, M.; Kai, D.; Ye, E.; Thitsartarn, W.; Tan, J.B.; Yin, X.; et al. Advancements in sustainable phase change materials: Valorizing waste for eco-friendly applications. Mater. Today Chem. 2024, 39, 102163. [Google Scholar] [CrossRef]
- Guo, M.; Fei, H.; Li, Y.; He, Q.; Du, W.; Zhou, J. Thermal Performances and Stability of Capric Acid–Stearic Acid–Paraffin Wax Adsorbed into Expanded Graphite in Vacuum Conditions. J. Phys. Chem. C 2024, 128, 6222–6232. [Google Scholar] [CrossRef]
- Kim, U.S.; Yi, J.; Shin, C.B.; Han, T.; Park, S. Modelling the thermal behavior of a lithium-ion battery during charge. J. Power Sources 2011, 196, 5115–5121. [Google Scholar] [CrossRef]
- Jiang, L.; Zhao, L.; Zhang, R.; Zhang, W.; Ma, X.; Niu, Z.; Chen, G.; Li, M. Research of the thermal storage properties of thermally conductive carbon fiber-reinforced paraffin/olefin block copolymer composite phase change materials with thermotropic flexibility. J. Energy Storage 2024, 76, 109761. [Google Scholar] [CrossRef]

Disclaimer/Publisher’s Note: The statements, opinions and data contained in all publications are solely those of the individual author(s) and contributor(s) and not of MDPI and/or the editor(s). MDPI and/or the editor(s) disclaim responsibility for any injury to people or property resulting from any ideas, methods, instructions or products referred to in the content. |
© 2025 by the authors. Licensee MDPI, Basel, Switzerland. This article is an open access article distributed under the terms and conditions of the Creative Commons Attribution (CC BY) license (https://creativecommons.org/licenses/by/4.0/).