Article

Impact Mechanism Analysis of DFIG with Inertia Control on the Ultra-Low Frequency Oscillation of the Power System

1
Electric Power Dispatching and Control Center of Guangdong Power Grid, Co, Ltd., Guangzhou 510600, China
2
School of Electrical and Electronic Engineering, Huazhong University of Science and Technology, Luoyu Road 1037, Wuhan 430074, China
3
State Key Laboratory of Advanced Electromagnetic Technology, Wuhan 430074, China
*
Author to whom correspondence should be addressed.
Energies 2025, 18(13), 3365; https://doi.org/10.3390/en18133365
Submission received: 24 April 2025 / Revised: 16 June 2025 / Accepted: 24 June 2025 / Published: 26 June 2025

Abstract

Amid the global transition toward sustainable energy, regional power grids with high wind power penetration are increasingly emerging. The implementation of frequency control is critically essential for enhancing the frequency support capability of grid-connected devices. However, existing studies indicate this may induce ULFOs (ultra-low frequency oscillations). Current research on ULFOs have been predominantly concentrated on hydro-dominated power systems, with limited exploration into systems where thermal power serves as synchronous sources—let alone elucidation of the underlying mechanisms. This study focuses on regional power grids where wind and thermal power generation coexist. Eigenvalue analysis reveals that frequency regulation control of doubly-fed induction generators (DFIGs) can trigger ULFOs. Leveraging common-mode oscillation theory, an extended system frequency response (ESFR) model incorporating DFIG frequency control is formulated and rigorously validated across a range of operational scenarios. Moreover, frequency-domain analysis uncovers the mechanism by which inertia control affects ULFO behavior, and time-domain simulations are conducted to validate the influence of DFIG control parameters on ULFOs.

1. Introduction

The escalating penetration of variable renewable resources induces progressively frequent frequency oscillations in regional power networks, constituting a critical stability concern. In 2015, a frequency oscillation event in the Tibet power grid resulted in a load shedding of 94 MW [1]. In 2016, a 0.05 Hz frequency oscillation occurred in the Yunnan power grid in a performance test of asynchronous operation [2]. Lasting for 10 min, the oscillation gradually subsided after the main power plant governor exited. Analogous phenomena also have also been observed in Turkey and Colombia [3,4], commonly referred to as ultra-low frequency oscillations (ULFOs) in the industry.
Early studies primarily focused on ULFOs induced by hydroelectric generators. References [5,6,7] employ the eigenvalue analysis and damping torque methods to investigate ULFOs in systems with high hydropower penetration. These studies identify the water hammer effect as the fundamental cause of these oscillations. They also highlight several characteristics of ULFOs, including low oscillation frequency, long duration, and synchronized system frequency. Reference [8] establishes a transfer function for the phase relationship between two machines using the Heffron–Philips model and further clarifies the underlying mechanisms.
In recent years, a growing body of literature has examined the influence of wind power on ULFOs within hydropower-dominated systems [9,10,11,12]. Reference [10] highlights that the doubly-fed induction generators (DFIGs), when operating under specific load conditions, can introduce negative damping to the system. As demonstrated in [11,12], the deployment of frequency-regulated DFIGs in hydropower-predominant grids can enhance the damping of ULFO. Furthermore, the strategic optimization of turbine control parameters has been shown to significantly improve the overall stability of the hydropower system. Eigenvalue analysis reveals that integrating wind power with frequency regulation into hydropower systems improves the stability of the primary frequency regulation process and sheds lights on the mechanisms through which frequency control modulates ULFO behavior [13].
Nevertheless, extant research concerning the effect of wind turbines on ULFOs is mainly conducted in systems dominated by hydroelectric turbines. In regions such as Northwest China—where hydropower resources are scarce—power systems are primarily composed of wind and thermal generation. As wind energy constitutes a primary power source, frequency regulation capabilities have been widely deployed across wind farms [14,15]. Under these operating conditions, the existence of ULFO phenomena remains indeterminate, and the mechanisms underpinning their potential emergence are yet to be systematically examined.
The main contributions of this paper are delineated as follows: First, a two-machine system model integrating a doubly-fed induction generator (DFIG) and a steam turbine unit is established, with its state-space model derived. Eigenvalue analysis confirms ULFO modes induced by inertia control of the DFIG. Subsequently, the frequency-domain expression for the equivalent inertia of DFIG with inertia control is obtained. Leveraging the extended system frequency response model (ESFR) and frequency-domain analysis, the underlying mechanisms through which DFIG inertia control influences ULFO are systematically investigated. Furthermore, the effects of diverse control strategies and operating conditions on ULFOs are comprehensively assessed.
The rest parts of this paper are organized as follows: Section 2 provides a concise overview of the system under investigation. Section 3 presents the analytical methodology of ULFOs caused by DFIG inertia control. Building upon this foundation, Section 4 reveals the mechanism of the ULFO caused by DFIG inertia control. Section 5 explores the key influencing factors of ULFO. Finally, Section 6 offers the concluding remarks.

2. System Description and Modeling

2.1. System Description

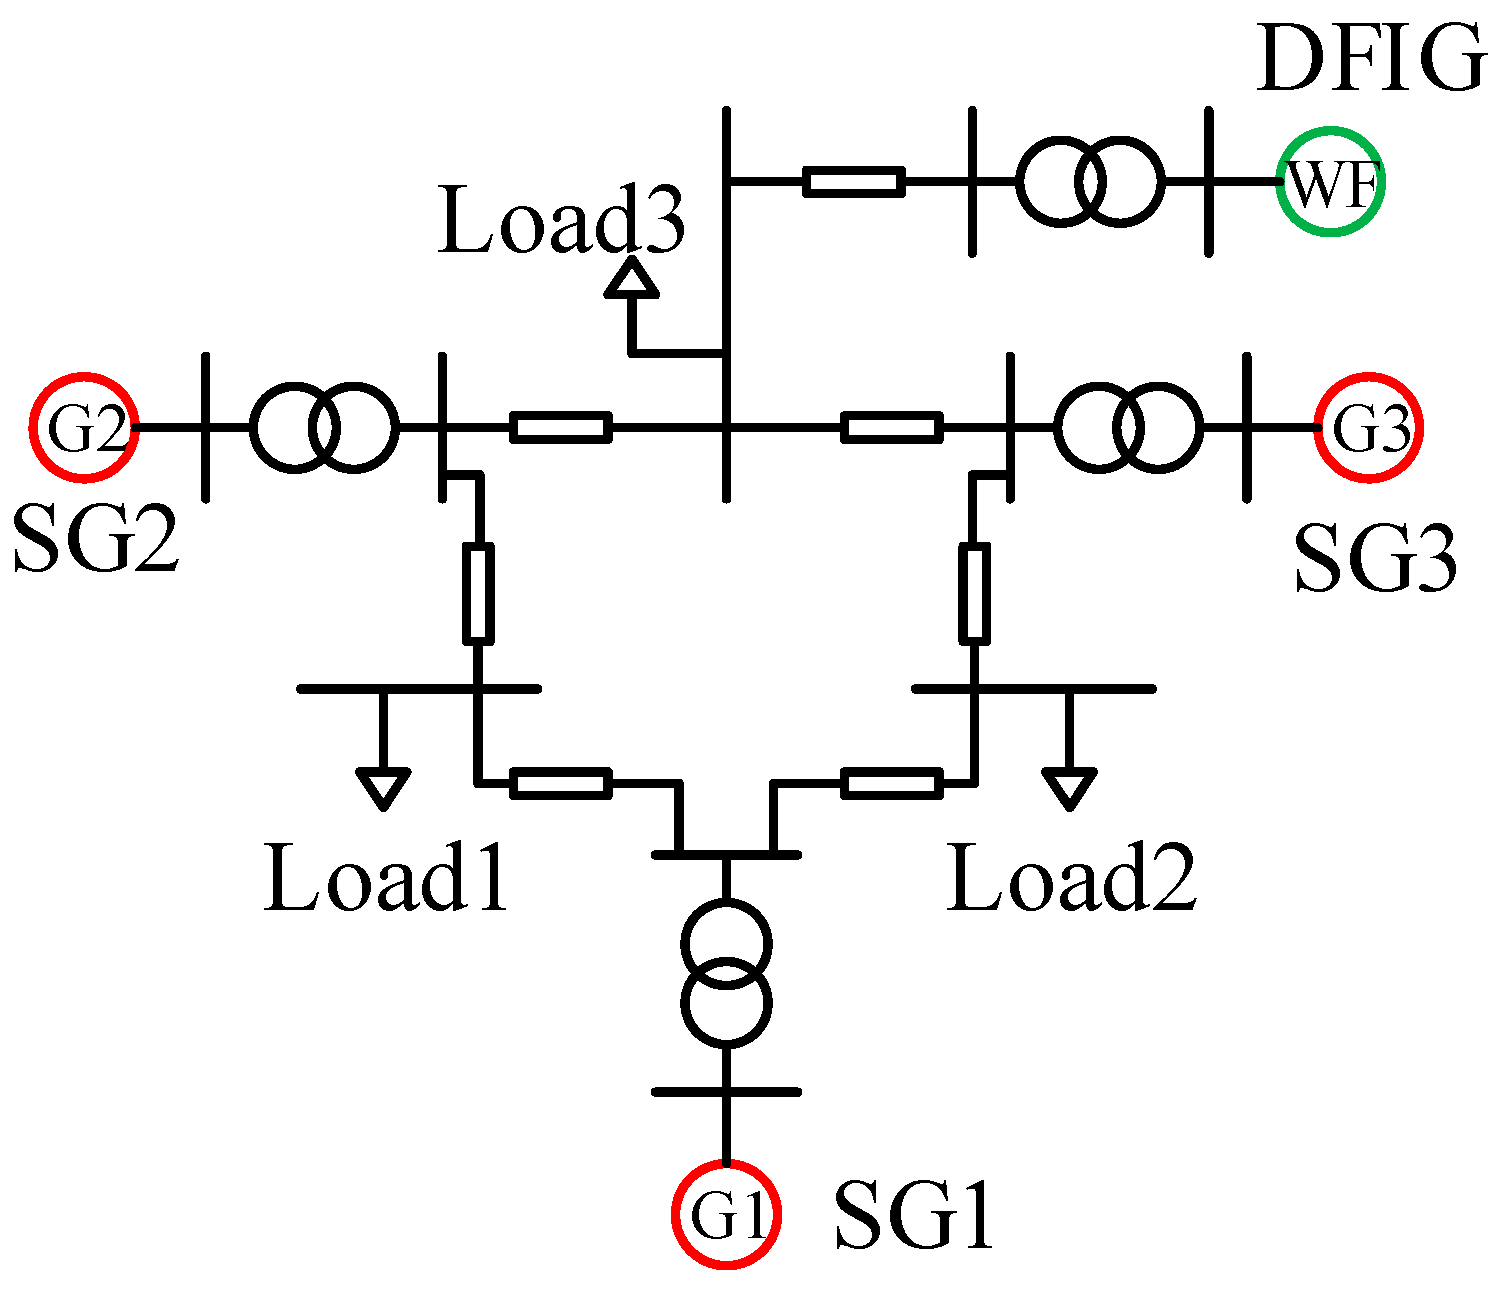
As shown in Figure 1, to evaluate whether the frequency control of DFIGs causes ULFOs, a two-machine system consisting of a DFIG with frequency regulation control and SG is constructed.

2.2. Modeling of Steam Turbine SG

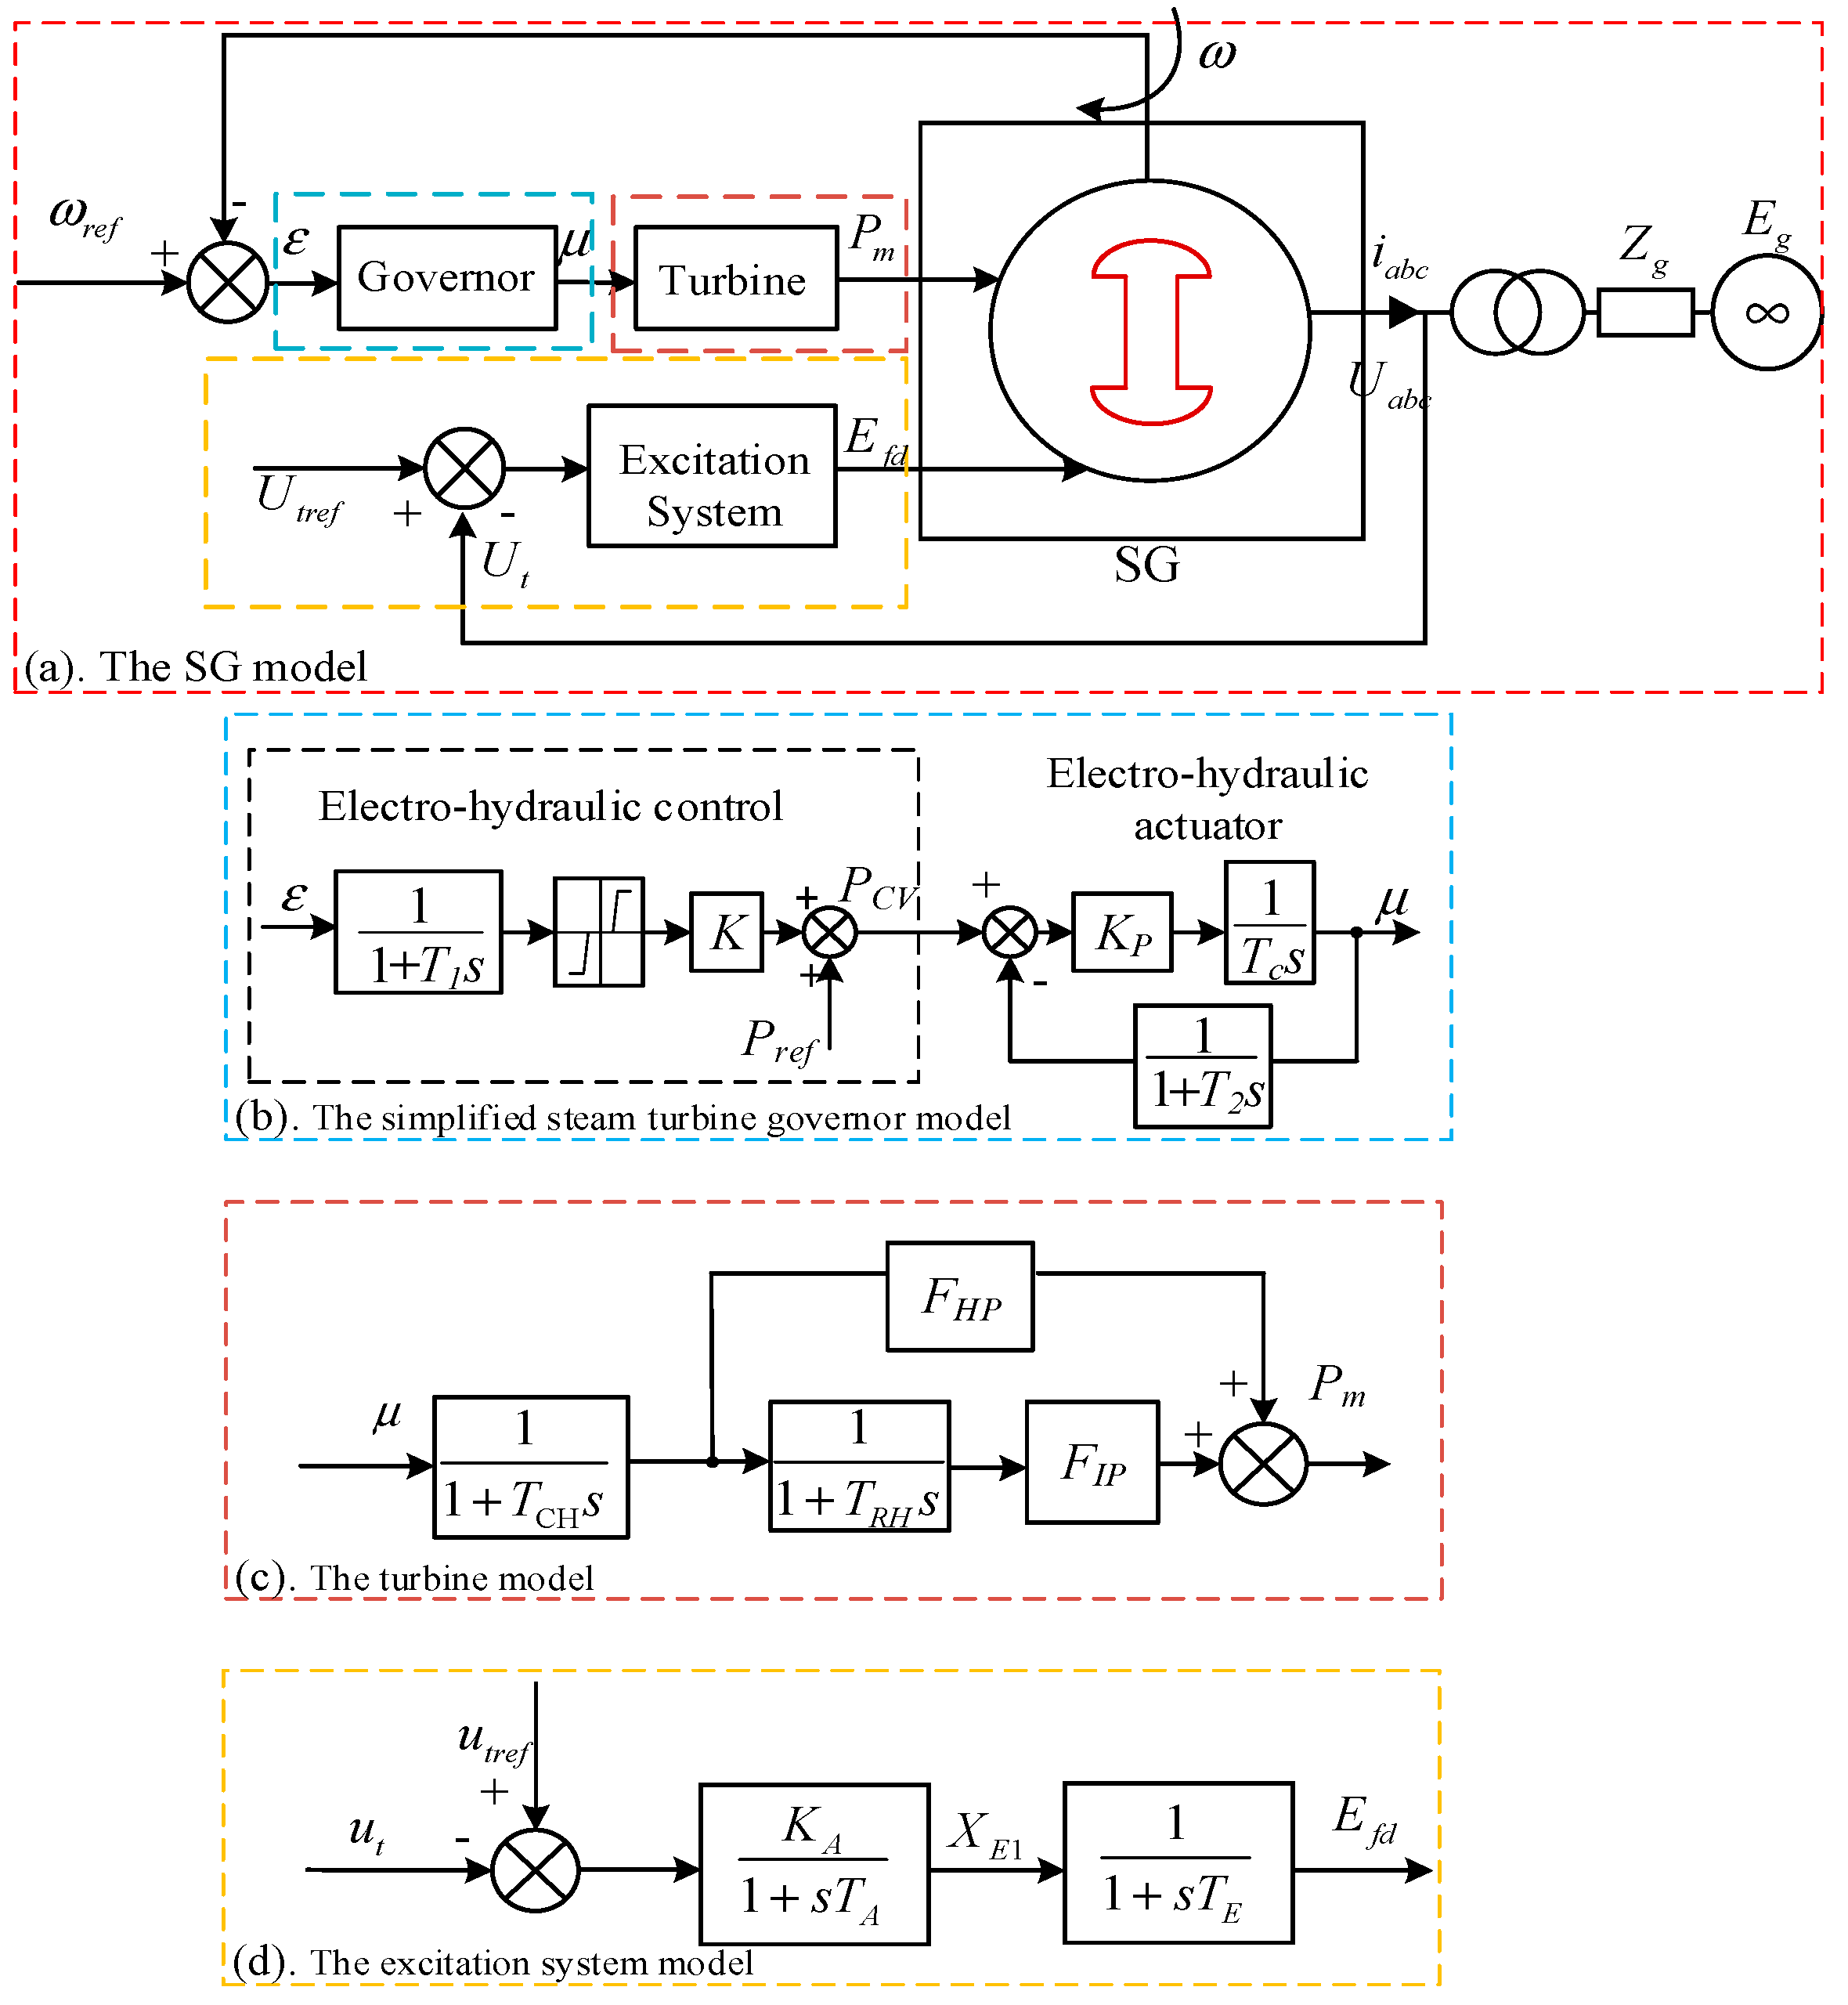
The SG model illustrated in Figure 2 consists of three main components: the rotor, the turbine as well as governor model, and the excitation system.
T d 0 d E q d t = E f d E q X d X d i d 2 H d ω d t = T m T e D ω 1 d θ E d t = 100 π ω 1
Ignoring the flux dynamics of the damping windings, the mathematical model of the synchronous machine can be represented by a third-order model [18].
The simplified model of the steam turbine governor is illustrated in Figure 2b. K and KP represent the gain and integral time constant of the governor. The turbine model describes the relation between the mechanical power Pm and the valve opening μ. The model of the turbine is illustrated in Figure 2c, where TCH represents the integral time constant of the high-pressure cylinder and TRH refers to the integral time constant of the intermediate reheat pipe. FHP and FIP represent the power distribution ratios of the high-pressure and intermediate-pressure cylinders relative to the total power output.
The excitation system model is shown in Figure 2d, where Utref represents the reference value of the generator terminal voltage. Ut is the measured terminal voltage, and XE1 is an intermediate variable in the control loop. Efd represents the excitation voltage, which equals to the internal voltage in no-load and steady-state condition. KA, TA, and TE denote the proportional gain, integral time constant, and excitation time constant, respectively. Efd can be obtained as
E f d = K V ( V r e f V t T V s + 1 )

2.3. Modeling of DFIG in the Electromechanical Time Scale

This section first defines the electrical potential within the electromechanical timescale of the DFIG. Based on this, the linearized model of DFIG in electromechanical timescale is subsequently established.

2.3.1. The Internal Voltage of the DFIG

The direction of current flowing outward from the stator and inward into the rotor is defined as positive, respectively. Accordingly, the stator voltage equation is given as
V s = R s I s + d Ψ s d t + j ω 1 Ψ s
V s + R s I s + j ω 1 L s I s + d L s I s d t = d L m I r d t + j ω 1 L m I r
Since the electromechanical timescale concerned in this paper is much slower than the dynamics of stator flux and rotor current control, the differential terms of (3) and (4) are neglected. It is further assumed that rotor current can instantaneously track its reference values. Consequently, Equation (4) is simplified as
V s + R s I s + j ω 1 L s I s = j ω 1 L m I r
Similar to SGs, the right-hand side of the above equation can be defined as the internal voltage of the DFIG:
E d = ω 1 L m i r d = x m i r d E q = ω 1 L m i r q = x m i r q
where xs = ω1Ls is defined as the internal reactance. xm = ω1Lm denotes the excitation reactance.
In addition to the stator, the DFIG also transfers power to the grid through the rotor and converter. Considering that the slip is generally small, the effect of the slip will be neglected below.

2.3.2. Linearization of DFIG Model

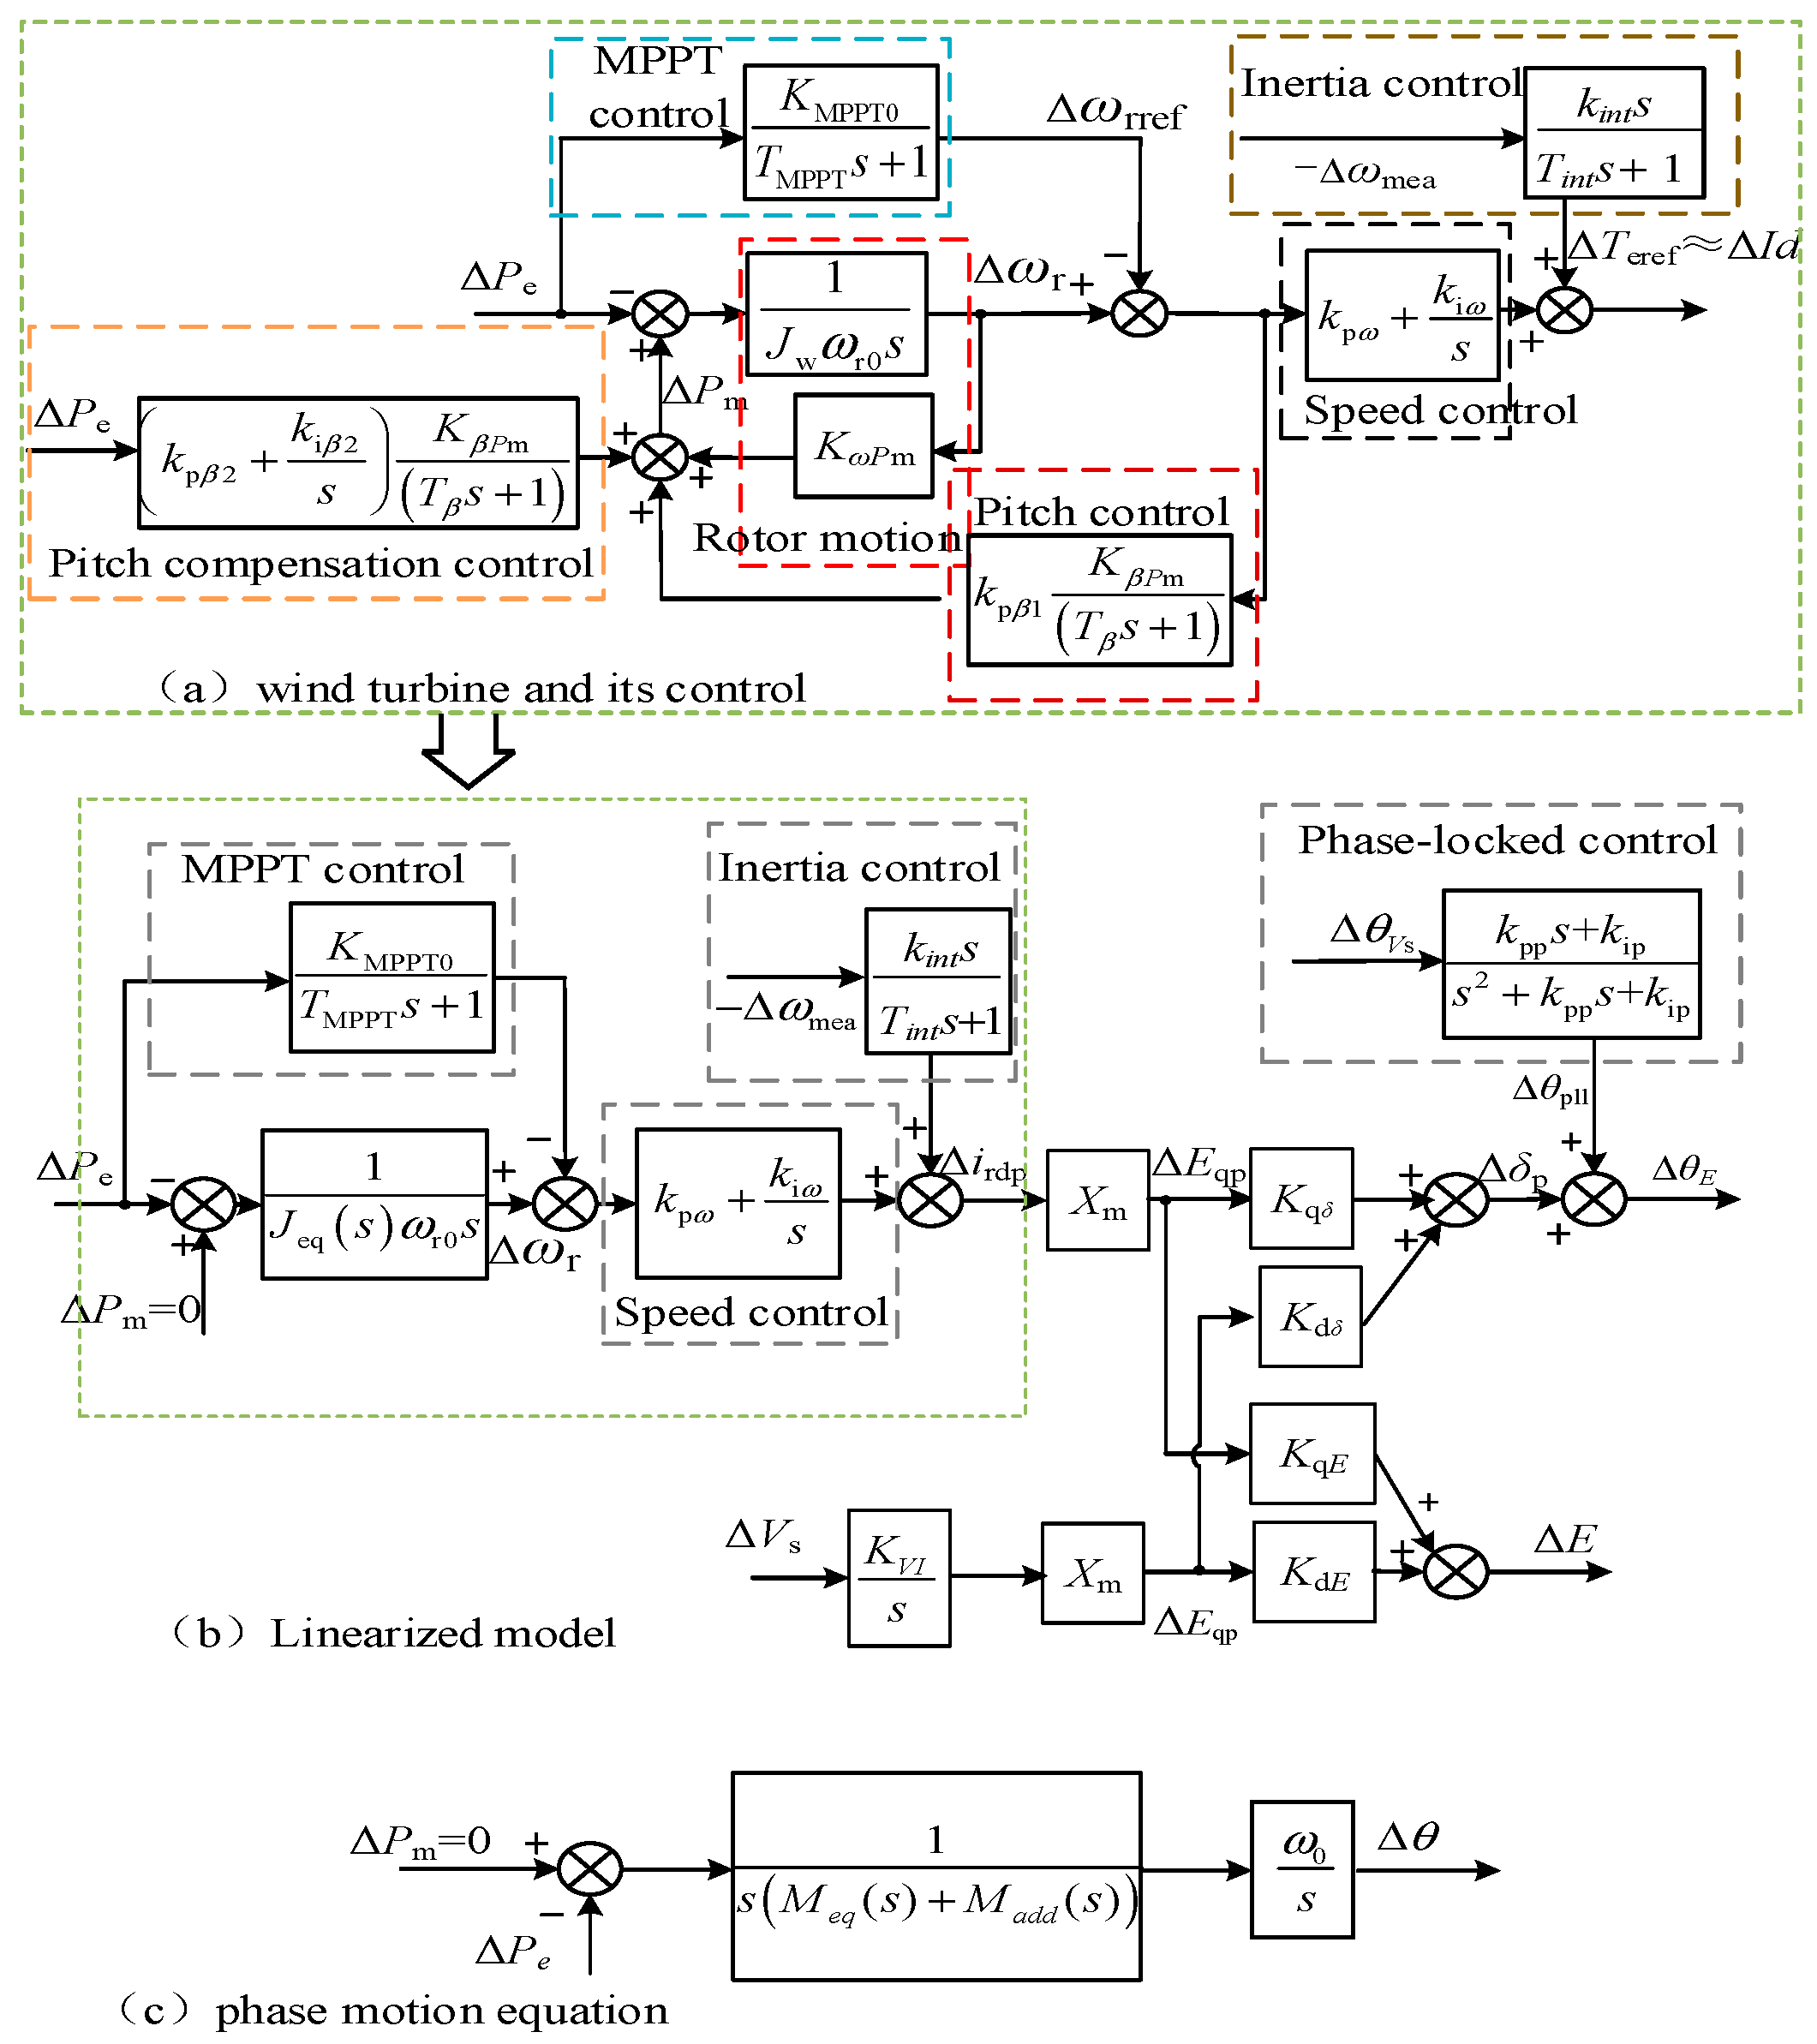
The control diagram of DFIG with inertia control is shown in Figure 3. In this section, the linearized model is derived, as depicted in Figure 4a,c. Assuming a constant wind speed in Figure 3, the effects of inertia control, speed control, pitch angle control, and pitch angle compensation control are presented in Figure 4a. By linearizing the MPPT control, the mechanical torque variation is expressed as
Δ T m = K P T m k p p i t c h 2 s + k i p i t c h 2 s Δ ω r + ω r 0 k p ω s + k i ω s Δ ω r e r + K P T m k p p i t c h 1 s + k i p i t c h 1 s Δ ω r e r + K ω T m Δ ω r = K P T m G ω P 2 s Δ ω r T e r e f 0 + G ω T e s ω r 0 Δ ω r e r + K P T m G ω P 1 Δ ω r e r + K ω T m Δ ω r
The coefficients and specific expressions for the transfer functions can be found in Appendix A. The electromagnetic torque Te can be expressed in terms of the electromagnetic power and rotor speed:
Δ T e = 1 ω r 0 Δ P e P e ω 2 r 0 Δ ω r
For MPPT control, the relationship between output of MPPT and active power is approximated by
ω r r e f M P P T = a P e 2 + b P e + c
Linearizing (10) yields
K P ω r = 2 a P e 0 + b , P e < P M P P T 0 , P e P M P P T
where PMPPT is the electromagnetic power corresponding to the output rotational speed when the MPPT control reaches its maximum. Accordingly, the reference of rotor speed after linearization is given as
Δ ω r r e f = K P ω r T P ω s + 1 Δ P e
In addition, inertia control in linearized form can be written as
Δ T e r e f = k int s T int s + 1 Δ ω m e a
To simplify the block diagram in Figure 4a, the MPPT control, speed control, pitch angle control, and pitch angle compensation control are merged. The relationship between Δωr and ΔPe can be expressed as
G 1 s Δ P e = G 2 s Δ ω r
G 1 s = 1 K β P m k p β 2 s + k i β 2 s T β s + 1 + K MPPT 0 T MPPT s + 1 k p β 1 K β P m T β s + 1
G 2 s = J w ω r 0 s K ω P m + k p β 1 K β P m T β s + 1
where G1(s) and G2(s) are the transfer function between Δωr and ΔPe. Therefore, (13) can be reorganized into the form of a motion equation:
Δ P m Δ P e = J e q s ω r 0 s Δ ω r
where ΔPm = 0, and the expression for Jeq(s) is
J e q s = G 2 s G 1 s ω r 0 s
Jeq(s) represents the equivalent rotor moment of inertia after considering the coupling relationship between the mechanical power of the DFIG, rotor speed, and pitch angle. Therefore, the effect of speed control, pitch angle control, and pitch angle compensation control on internal voltage is shown in the dashed block in Figure 4b. The corresponding coefficients in Figure 4b are then derived.
Since above controls are conducted in dq-frame of phase-locked loop (PLL), the amplitude and phase of internal voltage can be obtained as
Δ E = Δ E d p 2 + E q p 2 = E d 0 E 0 Δ E d p + E q 0 E 0 Δ E q p Δ δ p = Δ arctan E q p E d p = E q p 0 E 0 2 Δ E d p + E d p 0 E 0 2 Δ E q p
where Δδp represents the power angle in the phase-locked coordinate system. When combined with the phase Δθpll of the phase-locked coordinate system, it gives ΔθE. The PLL tracks the terminal voltage phase, θVs, and provides phase reference for other control loops. The relation between the phases is given by
Δ θ E = Δ δ p + k p p l l s + k i p l l s 2 + k p p l l s + k i p l l Δ θ V s
The relations among the parameters in Figure 4b are given by
K q δ = E d 0 E 0 2 ,   K d δ = E q 0 E 0 2 ,   K q E = E q 0 E 0 ,   K d E = E d 0 E 0
As evidenced by the 2 × 2 model of the DFIG, condensation into a phase motion equation becomes imperative for subsequent frequency-domain analysis.

2.4. Phase Motion Equation

To obtain the phase motion equation, it is necessary to express this in terms of the electromagnetic power Pe. Neglecting the stator resistance, the linearized expression for the electromagnetic power output of the DFIG is defined as follows:
Δ P s e = E 0 V s 0 X s cos δ 0 Δ θ E Δ θ V s + V s 0 X s sin δ 0 Δ E + E 0 X s sin δ 0 Δ V s
where δ0 = θE0θVs0.
Under small disturbance conditions, the fluctuations in terminal voltage are small, and the bandwidth of the terminal voltage control for DFIG is much larger than that of the electromechanical time scale. Therefore, in the analysis of ULFOs, the terminal voltage of DFIG remains constant, with the terminal voltage deviation ΔVs taken as 0. Under this condition, ΔθVs can be expressed in terms of ΔPse and ΔθE.
The electromagnetic power Pse of the stator can be determined by the slip rate slip and the electromagnetic power Pe of the wind turbine, while the slip rate can be expressed in terms of the rotor speed of the wind turbine. Therefore, in per unit, ΔPse can be expressed as
Δ P s e = 1 ω r 0 Δ P e P e 0 ω r 0 2 Δ ω r
By combining Figure 4b and substituting into the relevant equations, the increment of the complete expression of the internal voltage phase ΔθE of the DFIG:
G 4 s Δ P e = Δ θ E + G 4 s Δ ω m e a
G 3 s = s 2 + k pp s + k ip s 2 X m K q δ 1 J eq s ω r 0 s + K MPPT 0 T M P P T 0 s + 1 k p ω + k i ω s + k pp s + k ip s 2 K P θ ω r 0 P e 0 K P θ ω r 0 3 J eq s s + X m K q E K E θ 1 J eq s ω r 0 s + K MPPT 0 T M P P T 0 s + 1 k p ω + k i ω s
G 4 s = k int s T int s + 1 X m K q θ s 2 + k pp s + k ip s 2 + X m K q E K E θ k pp s + k ip s 2
where G3(s) characterizes the complex coupling relationship among rotor speed, pitch angle, mechanical power, and electromagnetic power under the original control of DFIG, while G4(s) represents the influence of inertia control on the internal voltage phase.
Since the derivative of the internal voltage phase, when normalized, corresponds to the internal voltage frequency and given that the frequencies across the entire power grid are approximately equal in the context of ULFOs, both the internal voltage frequency and the measured frequency ωmea can be approximated as a uniform frequency. Thus, referring to the form of the rotor speed motion equation, the expression can be rearranged as follows:
Δ P m Δ P e = ω b G 3 s s 2 + G 4 s G 3 s s s Δ ω
where ΔPm = 0 and ωb represents the nominal frequency of the power grid.
The first term within the brackets on the right side of this equation originates from the DFIG, while the second term is introduced by inertia control and exhibits a coupling with the control. The equivalent inertia of DFIG Meq(s), and the additional inertia introduced by the inertia control Madd(s), can be defined as follows:
M e q s = ω b G 3 s s 2
M a d d s = G 4 s G 3 s s

3. Analysis Method of the ULFO Caused by Inertia Control of DFIG

3.1. The Simplified ESFR for the Analysis of the System with DFIG

The ESFR is widely applied for analyzing ULFOs, primarily due to the absence of relative rotor swings in ULFO [21,22,23]. In Figure 5, load variations ΔPei are modeled as disturbances, enabling the multi-machine system to be equivalently represented as a single machine with load. Within this framework, KDi represents the regulation frequency of the damping or load of each machine, which is typically negligible. Accordingly, the system’s open-loop transfer function H(s) is derived as shown in Figure 6:
H s = G S G s M S G + K S M e q s + M a d d s s
where GSG(s) is derived from its control block diagram. The denominator of the equation represents the total inertia sΣM(s). Ks represents the ratio of the installed capacity of DFIG to that of the SG, and its relation with the penetration rate of the wind turbine is as follows:
K s = η RE / 1 η RE
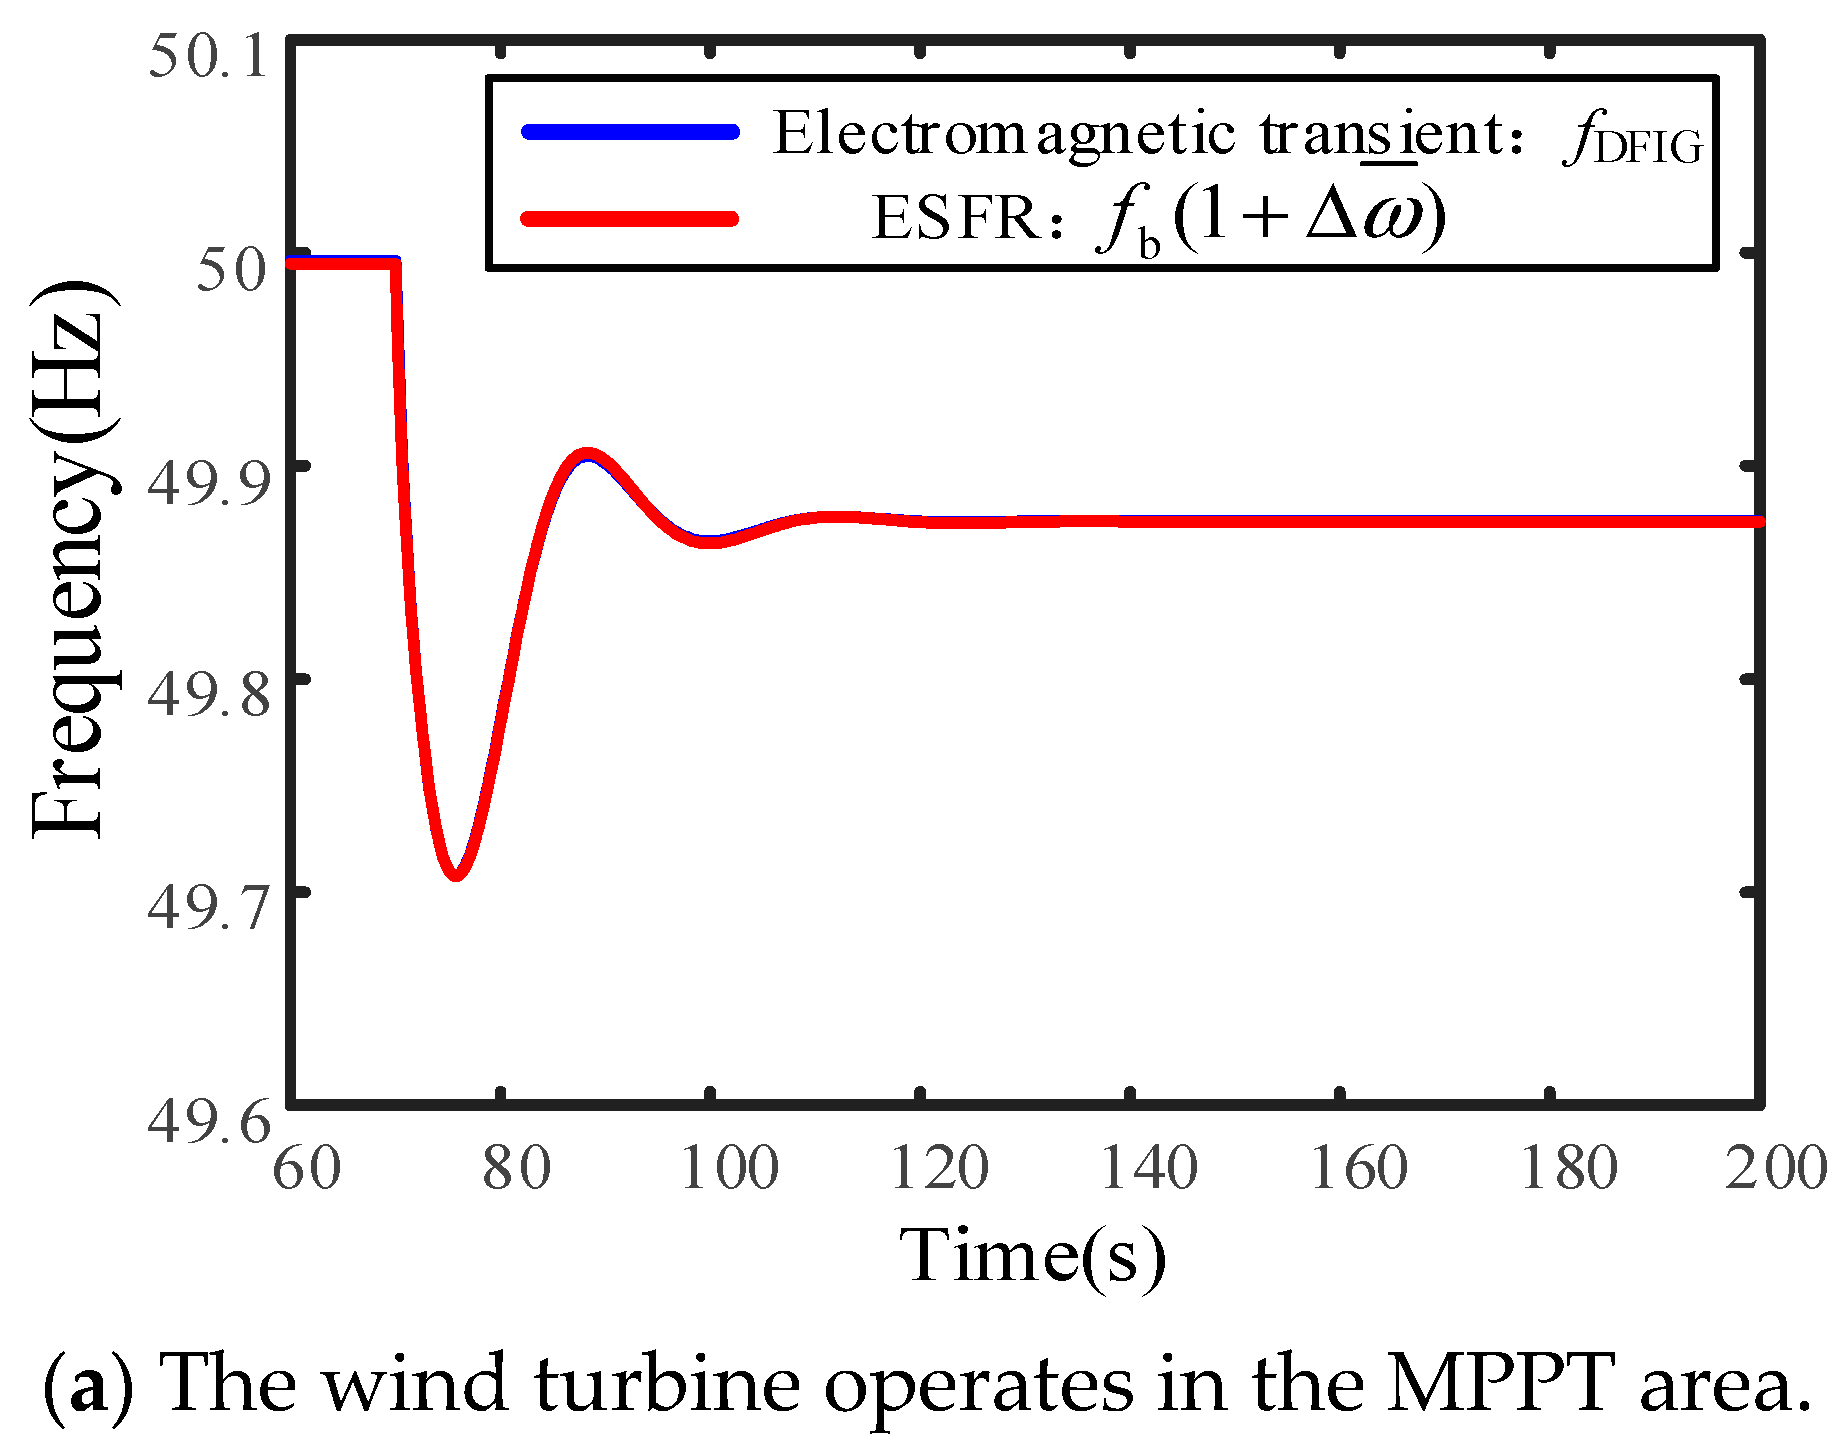
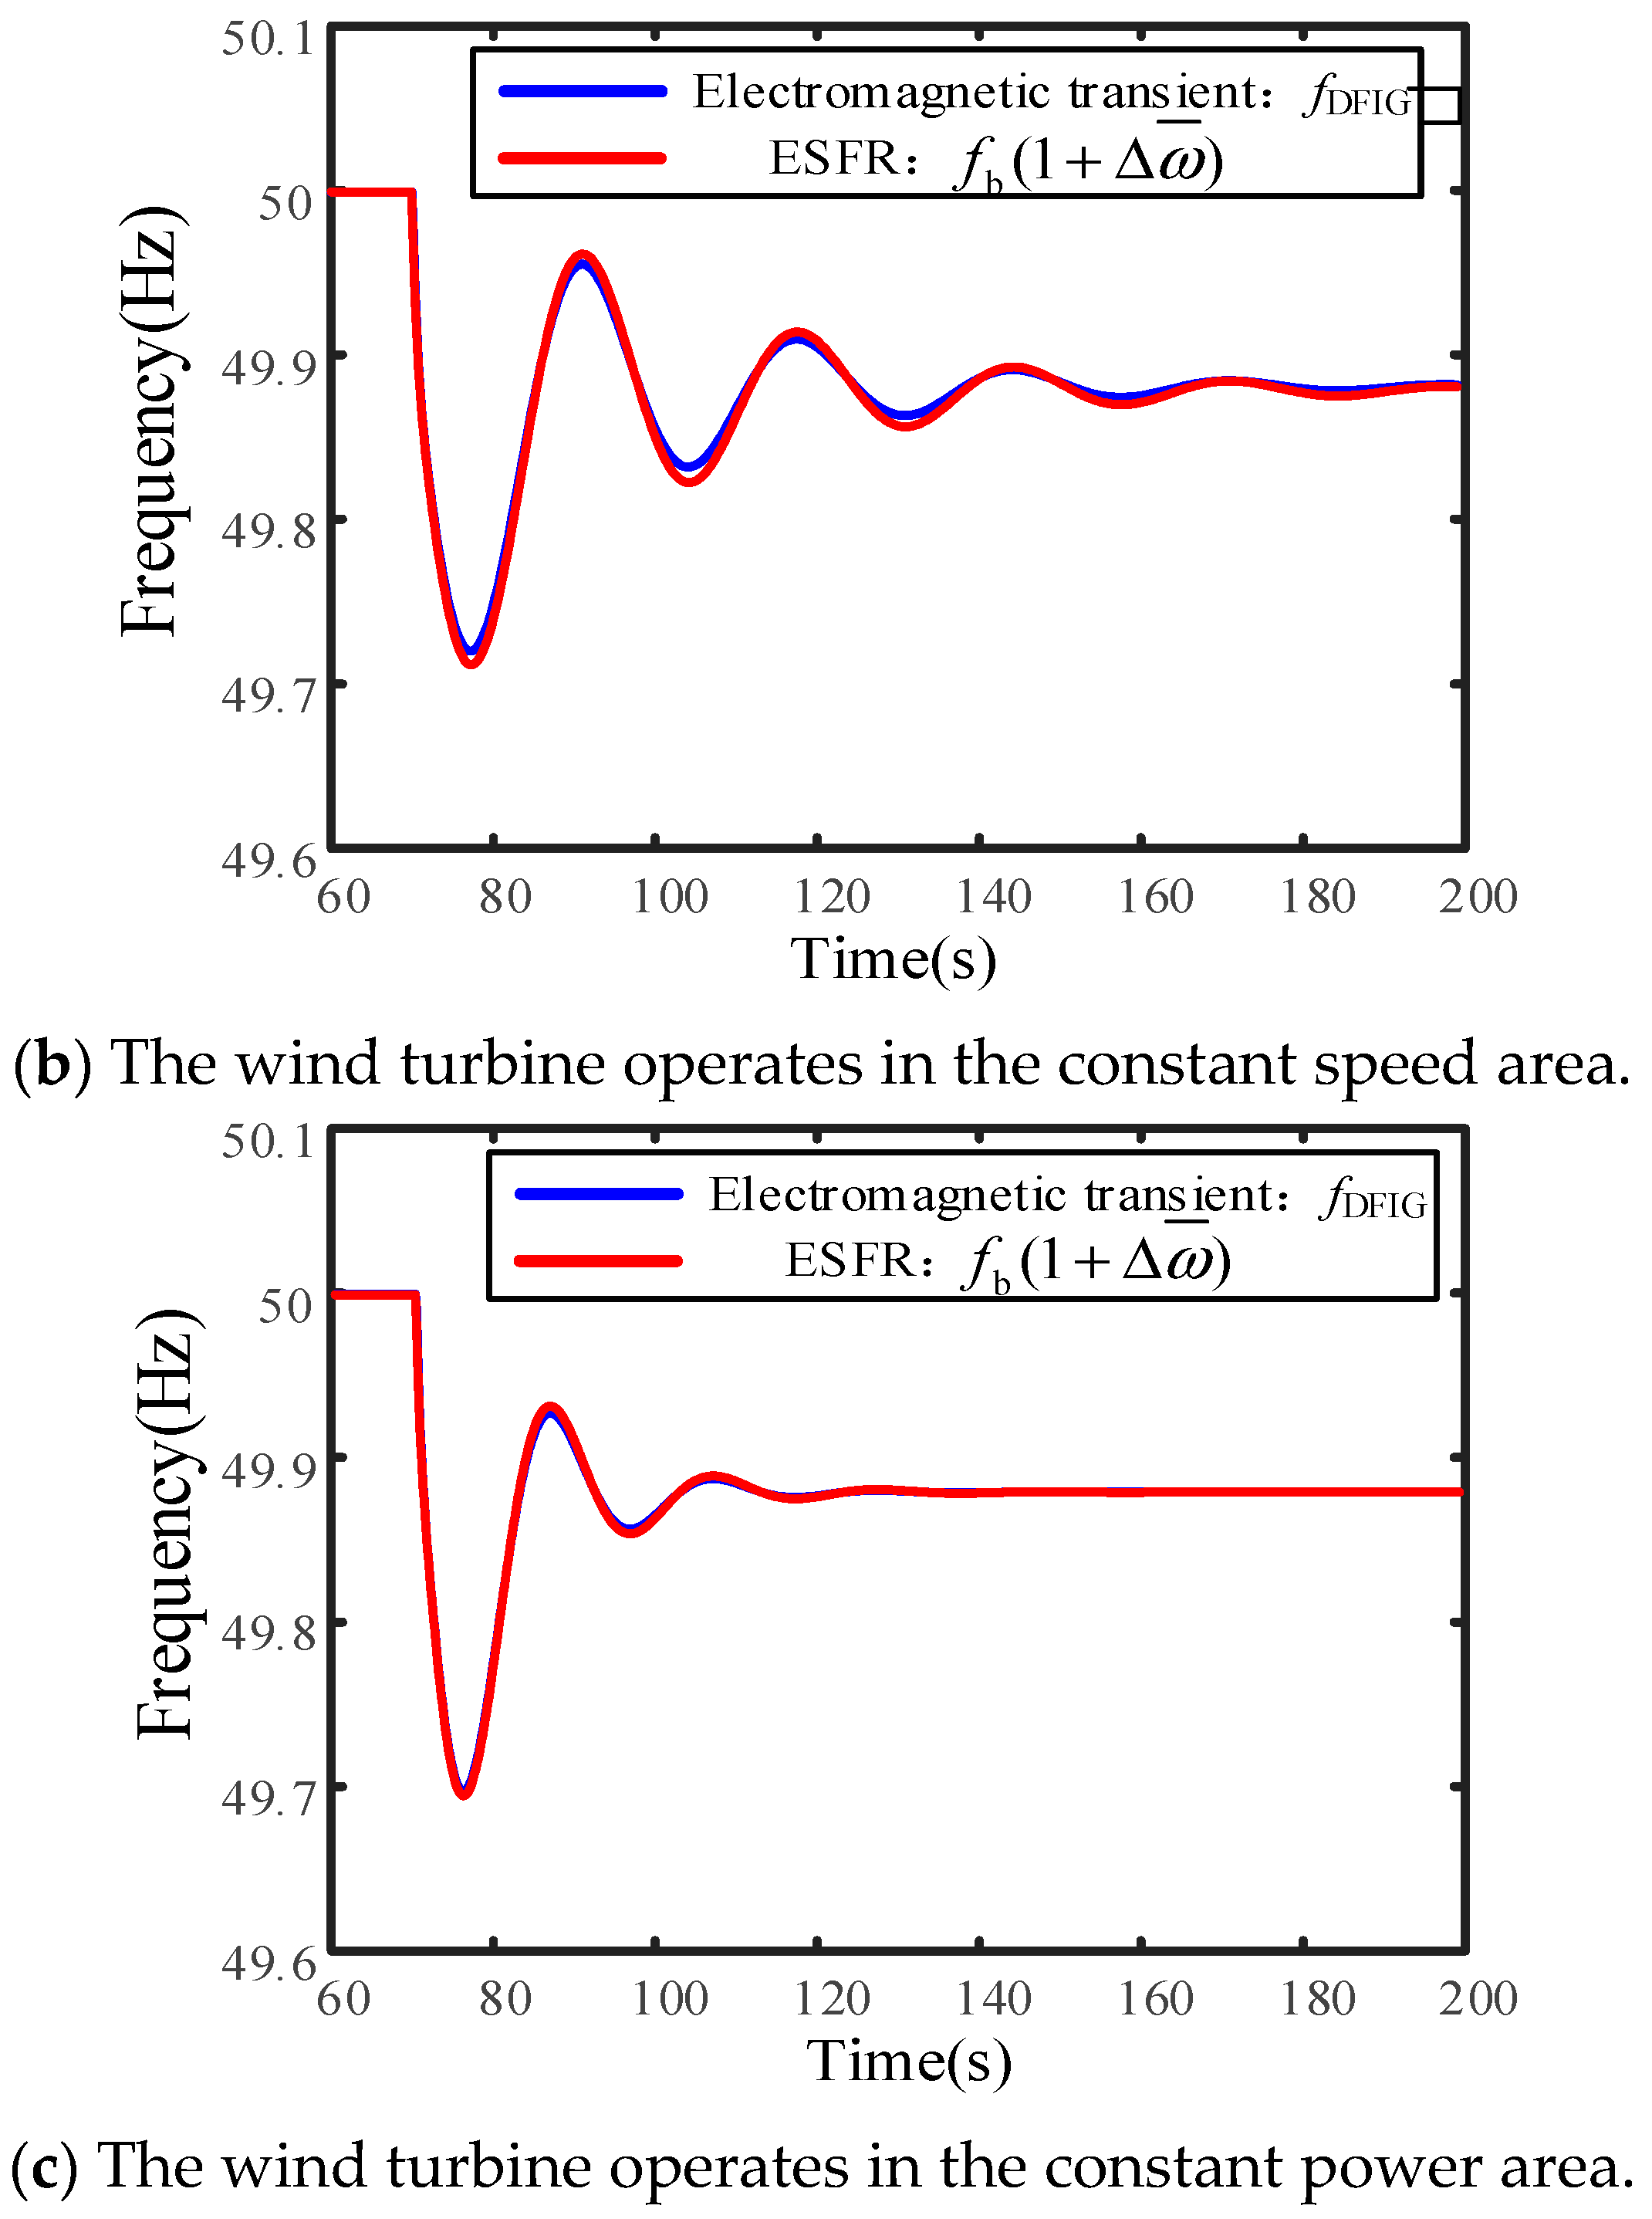
In this two-machine system, the wind penetration rate is selected as ηRE = 50%, resulting in Ks = 1. Assuming DFIG operates in the MPPT area, the constant speed area, and the constant power area, the frequency response obtained from electromagnetic transient (EMT) simulations and ESFR is presented in Figure 7. The frequency response obtained from ESFR aligns well with that of EMT simulations, indicating the accuracy of the derived equivalent inertia and the feasibility of ESFR. Further simulation analyses confirm the applicability of small-signal analysis for this model (Appendix A).
Upon deriving the open-loop transfer function H(s), frequency domain analysis can be employed to evaluate the system’s stability. In the presence of ULFO modes, the oscillation frequency represents the lowest frequency among all modal oscillations. Consequently, the zero-crossing point frequency ωc of H(s) closely approximates the ULFO frequency, and the phase margin (PM) is proportional to the damping ratio of the oscillation.

3.2. The ULFO Caused by DFIG with Inertia Control

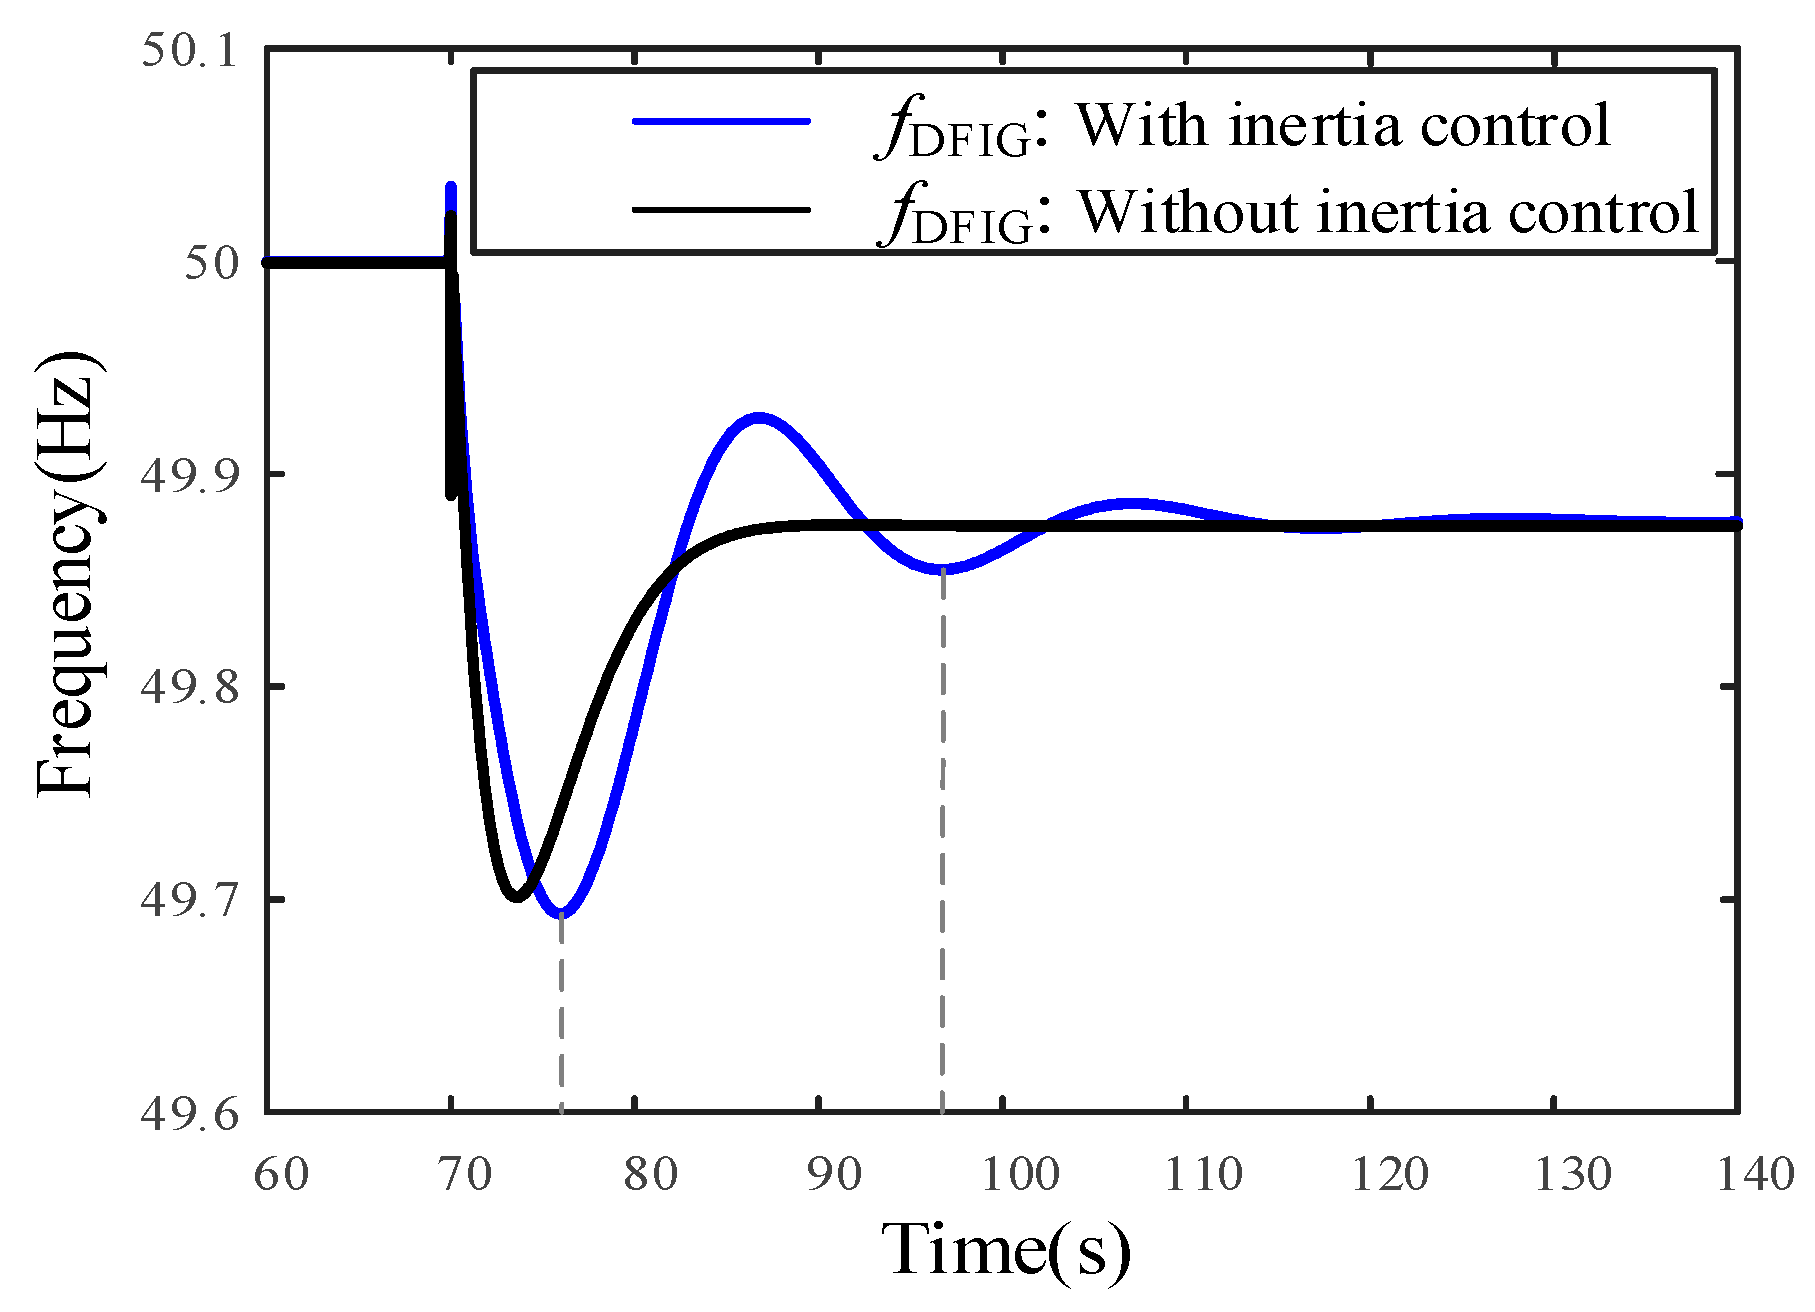
As presented in Table 1 and Table 2, to investigate the influence of inertia control, the oscillation modal eigenvalues, oscillation frequencies, and damping ratios of the system are calculated before and after the introduction of inertia control. Table 1 presents two oscillation modes without inertia control. These oscillation modes exhibit significant damping, indicating that the ULFO is not a dominant issue. In contrast, Table 2 reveals that inertia control in the DFIG gives rise to an additional ULFO mode with reduced damping. Time-domain simulation in Figure 8 also indicates that the damping of ULFO is significantly weakened with inertia control of the DFIG. These results collectively indicate that the inertia control in DFIGs is a contributing factor to the emergence of ULFOs.
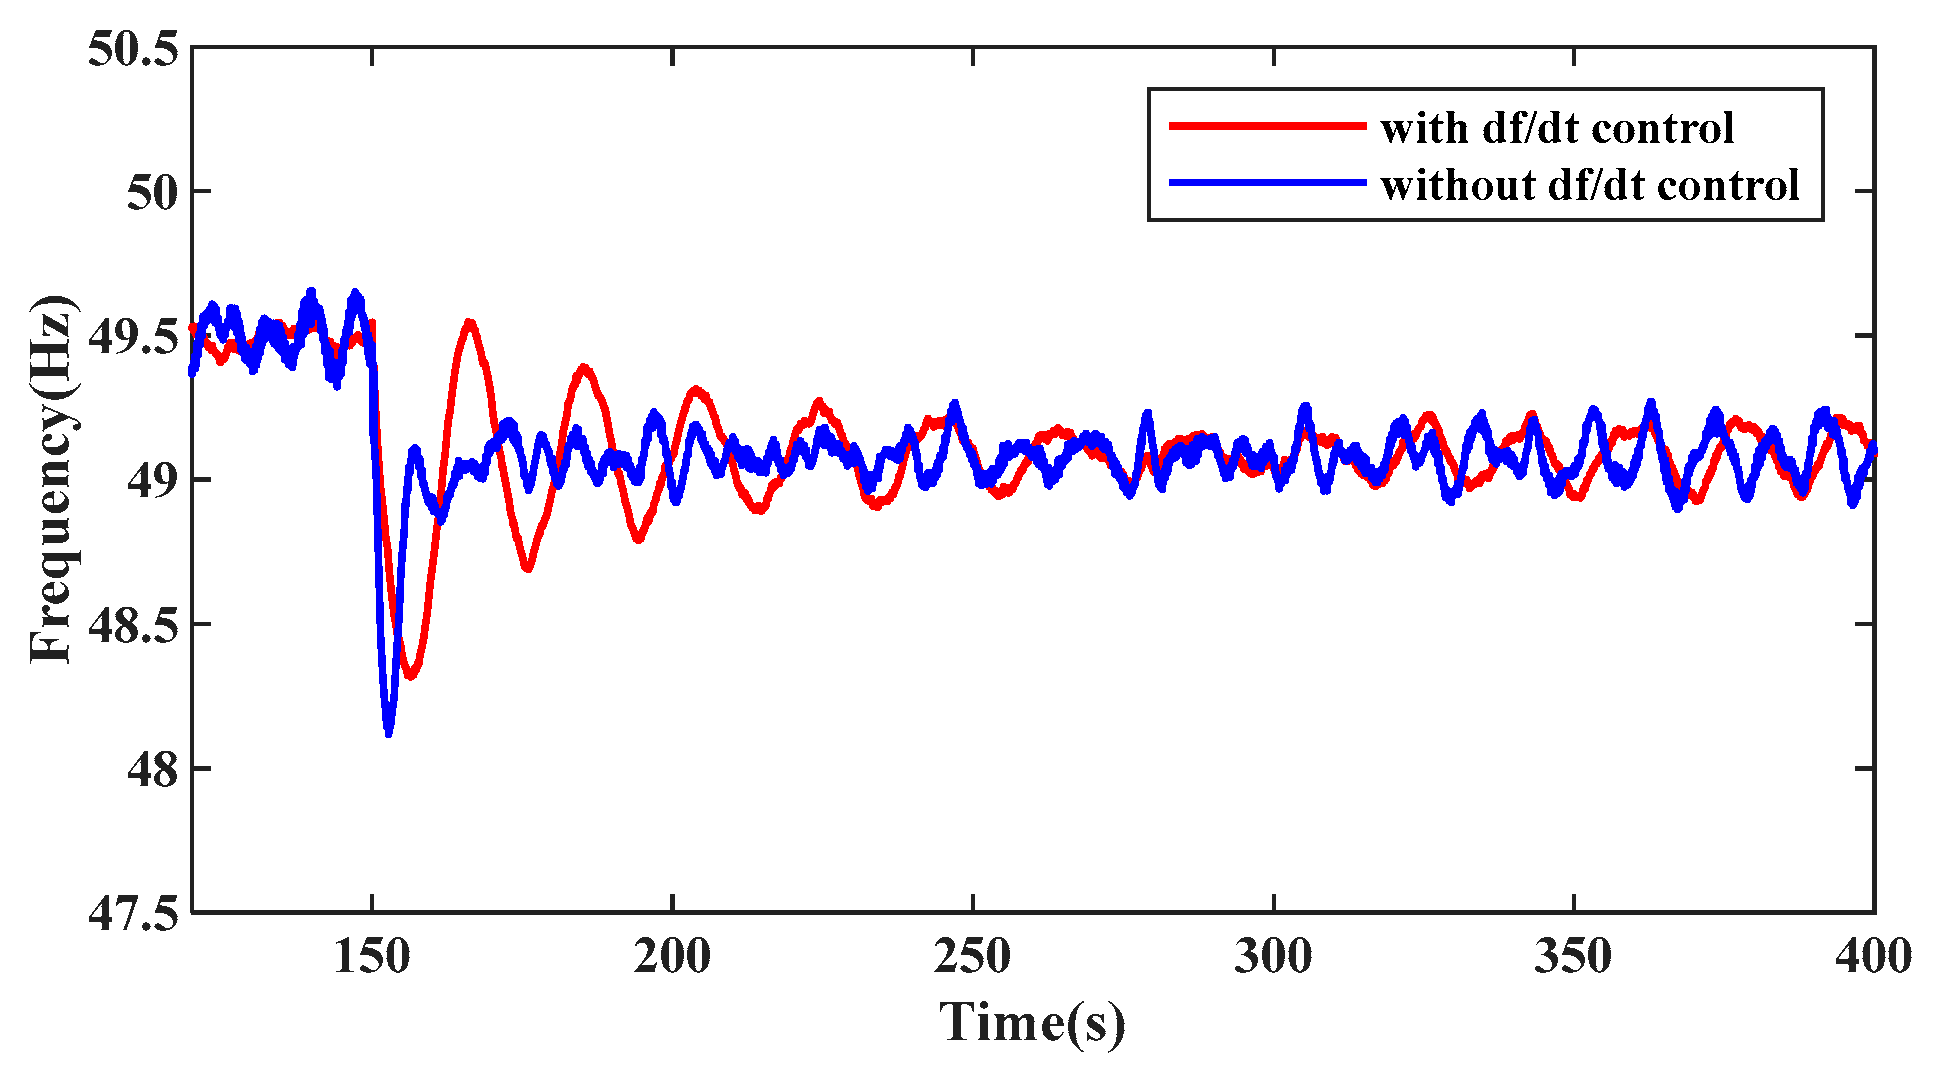
To align with real-world scenarios, we validate the frequency stability under wind speed and load fluctuations. Under the IEEE three-machine, nine-bus standard test system, the validation superimposes stochastic disturbances on steady-state wind speeds, followed by introducing a load step disturbance. As observed in Figure 9, the wind speed and load variations trigger ULFO, which is induced by inertia control. Both approaches jointly validate that inertia control implementation induces ULFOs.

4. Mechanism Analysis of the ULFO Caused by Inertia Control of the DFIG

4.1. Relation Between the Additional Inertia and the Stability of the System

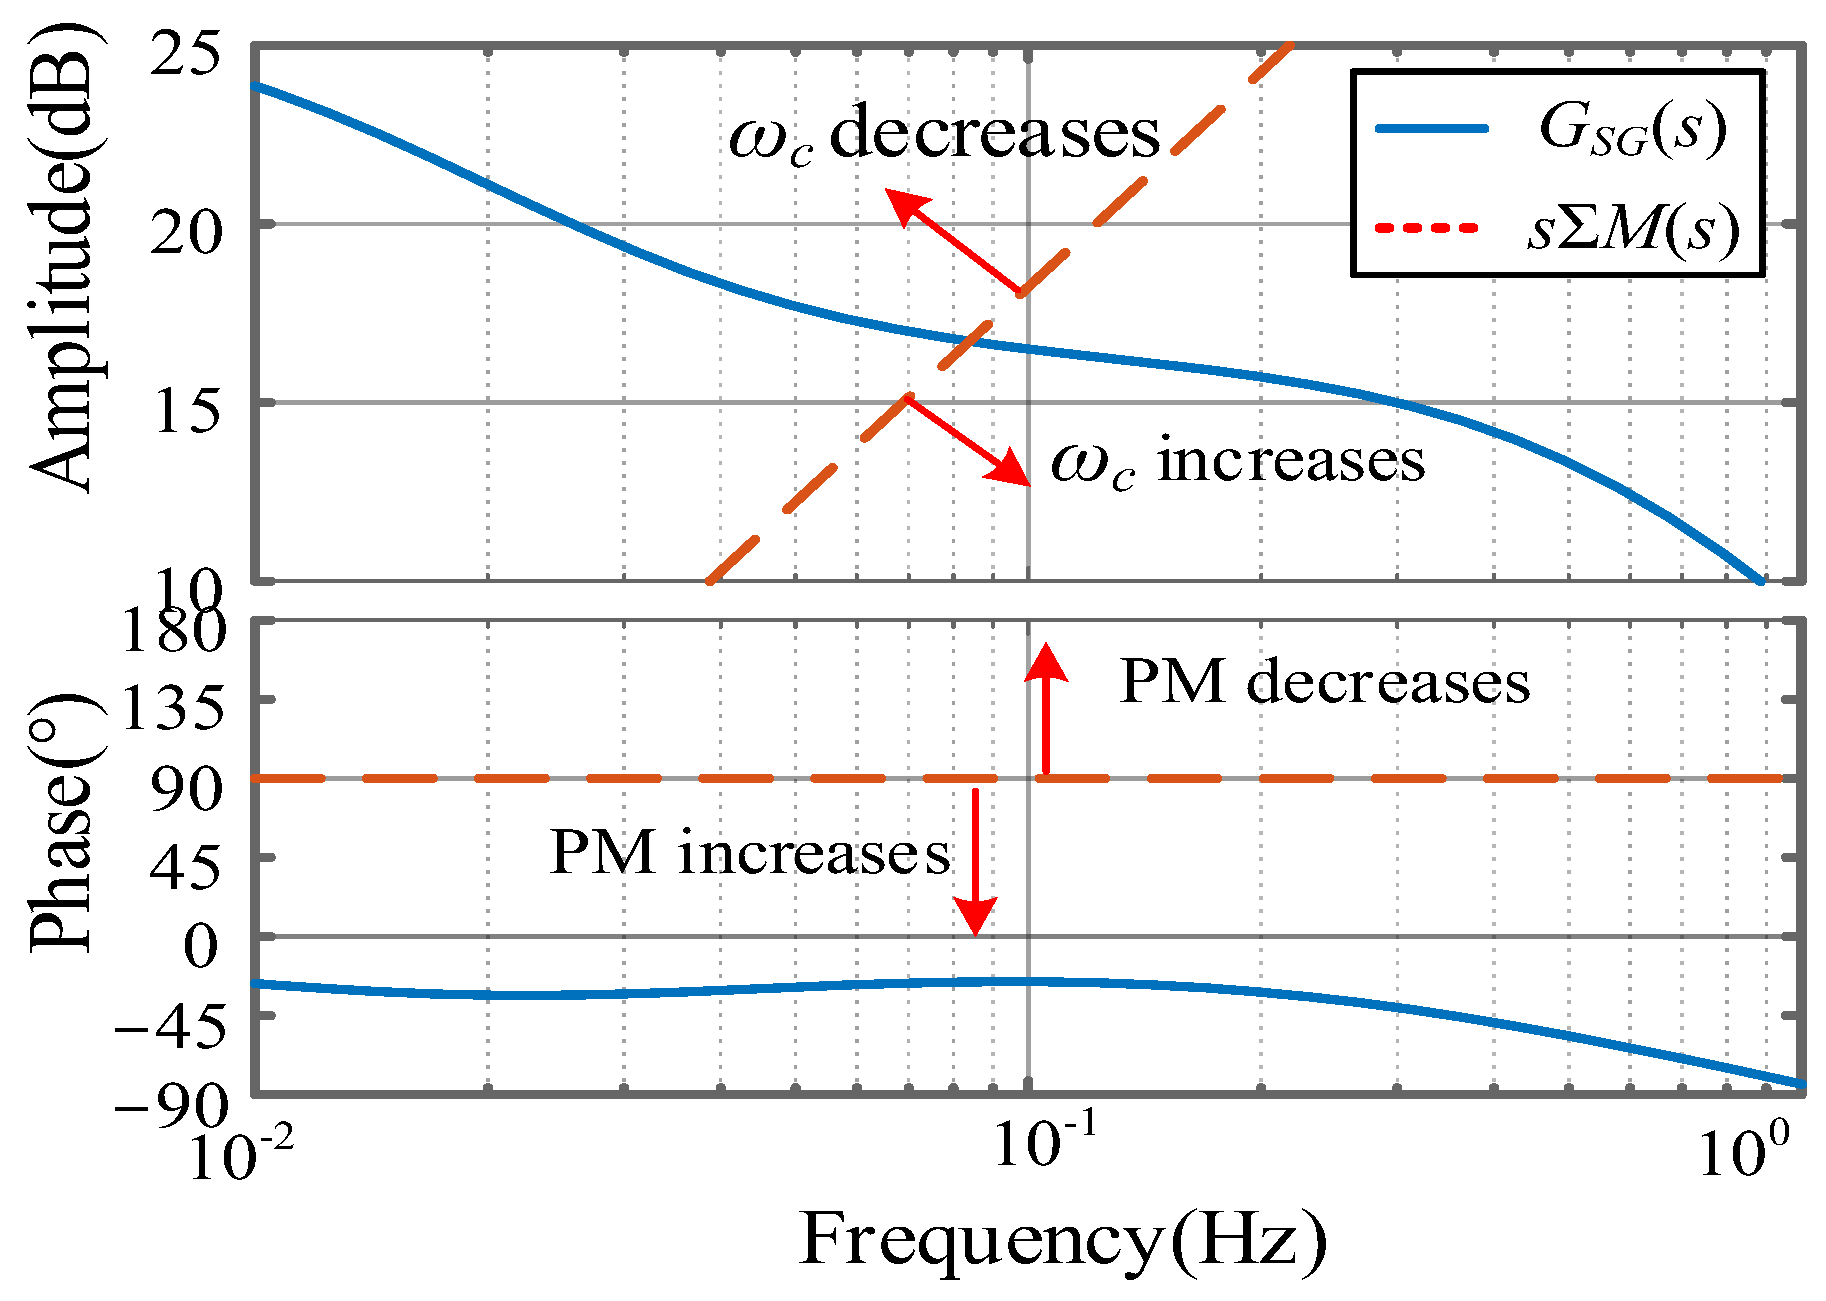
The transfer function H(s) reveals that both crossover frequency ωc and phase margin PM are co-determined by the magnitude/phase responses of governor transfer function GSG(s) and total inertia ΣM(s). The magnitude response of H(s) equals the difference between GSG(s) and ΣM(s), while its phase response equals the difference between their phase angles. PM is defined as the difference between the open-loop phase angle and −180° when the open-loop gain equals 1 (0 dB). For zero-crossing frequency, we have (31):
H ( j ω c ) = 1 G S G ( j ω c ) = j ω c M ( j ω c )
P M = G S G ( j ω c ) - j ω c Σ M ( j ω c ) + 18 0
Therefore, ωc is the crossing-frequency of GSG(s) equaling sΣM(s). In (32), it can be seen that PM will decrease with the phase of sΣM(s) increase. Madd(s) provided by inertia control of the DFIG affects the amplitude and phase characteristics of the total inertia ΣM(s), thereby influencing the overall stability. The Bode diagram for GSG(s) is presented in Figure 10, which shows that the amplitude characteristic of GSG(s) decreases as the frequency increases. Consequently, when Madd(s) causes the amplitude of ΣM(s) to decrease in the ultra-low frequency band, ωc will increase, leading to a higher frequency of ULFOs and vice versa. Furthermore, if Madd(s) causes the phase of ΣM(s) to decrease in the ultra-low frequency band, the PM will increase, thereby enhancing the damping of ULFOs and vice versa.

4.2. Mechanism of ULFO Caused by Inertia Control

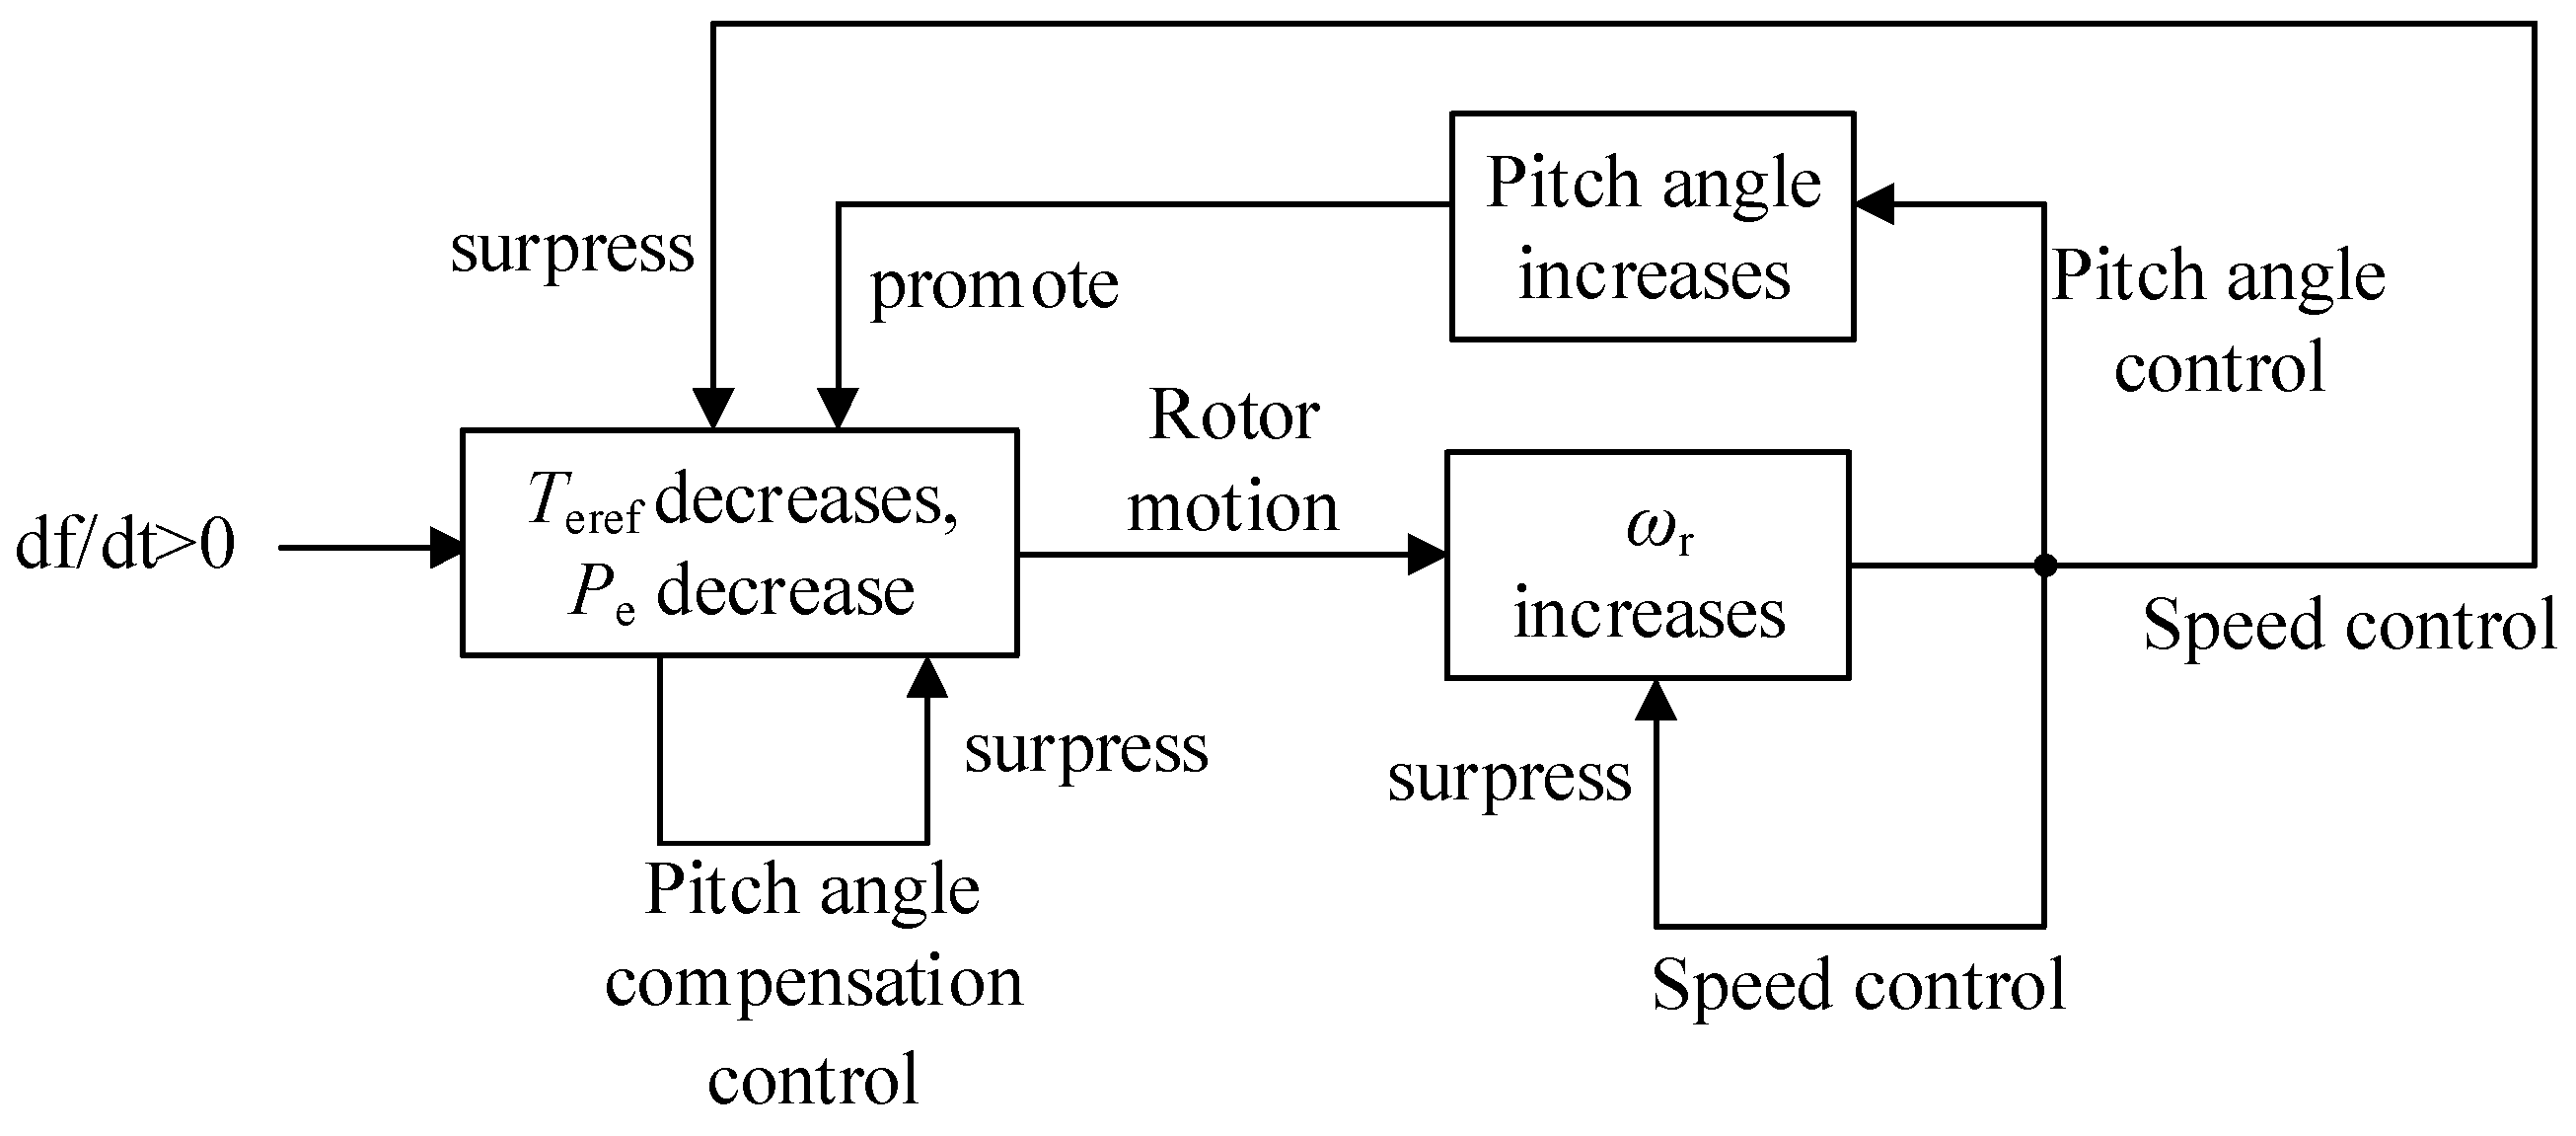
The fundamental function of inertia control is to establish a connection between the rate of change in frequency and rotor speed. As shown in Figure 11, when df/dt > 0, electromagnetic torque reference and power decrease. Pitch compensation control counteracts this trend, while rotor speed declines according to rotor motion equations. This speed reduction cascade-triggers (1) speed control suppresses speed drop and reduced electromagnetic torque/power and (2) pitch control increases blade angle, aggravating power decline.
In the following part of this section, we will demonstrate that the coupling between rotor speed variation caused by inertia control and multiple control loops is the root cause of ULFOs. In the frequency band concerned in this paper, the dynamics of the PLL can be neglected, and Madd(s) can be simplified as
M a d d s = k int s T int s + 1 X m K q θ + X m K q E K E θ X m K q δ + X m K q E K E θ J e q s ω r 0 k p ω + k i ω s P e 0 K P θ ω r 0 3 J e q s s K P θ ω r 0
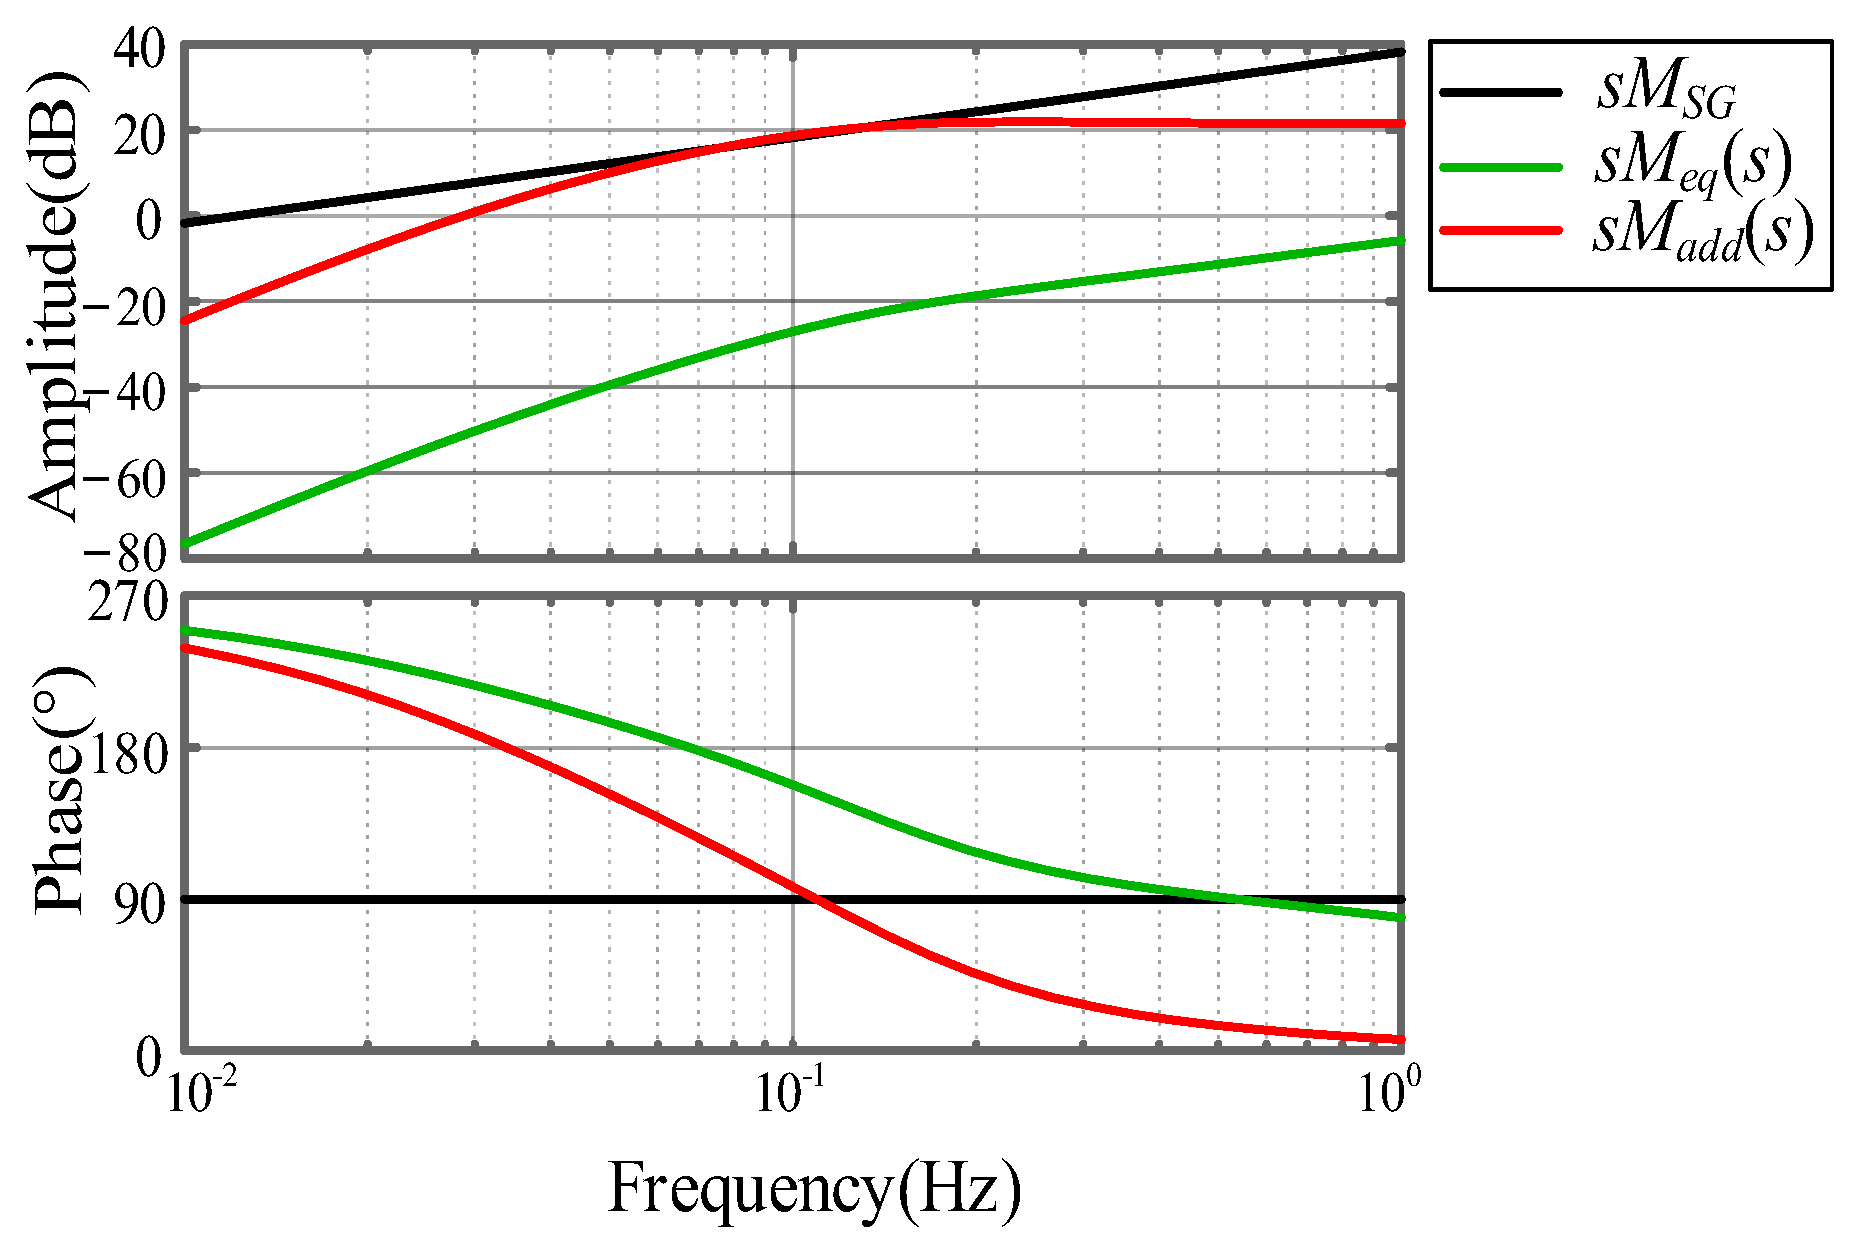
According to (33), Madd(s) is jointly determined by inertia control and rotor speed control. As Jeq(s) is influenced by the pitch angle control, pitch angle compensation control, and the MPPT control, these mechanisms also serve as contributing factors to Madd(s). The Bode diagrams for sMSG, sMeq(s), and sMadd(s) are depicted in Figure 12.
The figure first reveals that the equivalent inertia of the DFIG without the inertia control, Meq(s), is more than 40 dB (100 times), lower than that of the SG, MSG. Hence, the equivalent inertia of the DFIG in the absence of inertia control is negligible, implying its limited influence on ULFO dynamics. In contrast, the amplitude of Madd(s) for DFIG with inertia control is comparable to MSG, indicating that its influence on ULFO is not negligible. Furthermore, Madd(s) exhibits a significant phase lead compared to MSG, thereby increasing the overall phase of the total inertia ΣM(s). This inertia control of DFIG reduces the PM of the H(s), consequently diminishing the damping of ULFO.
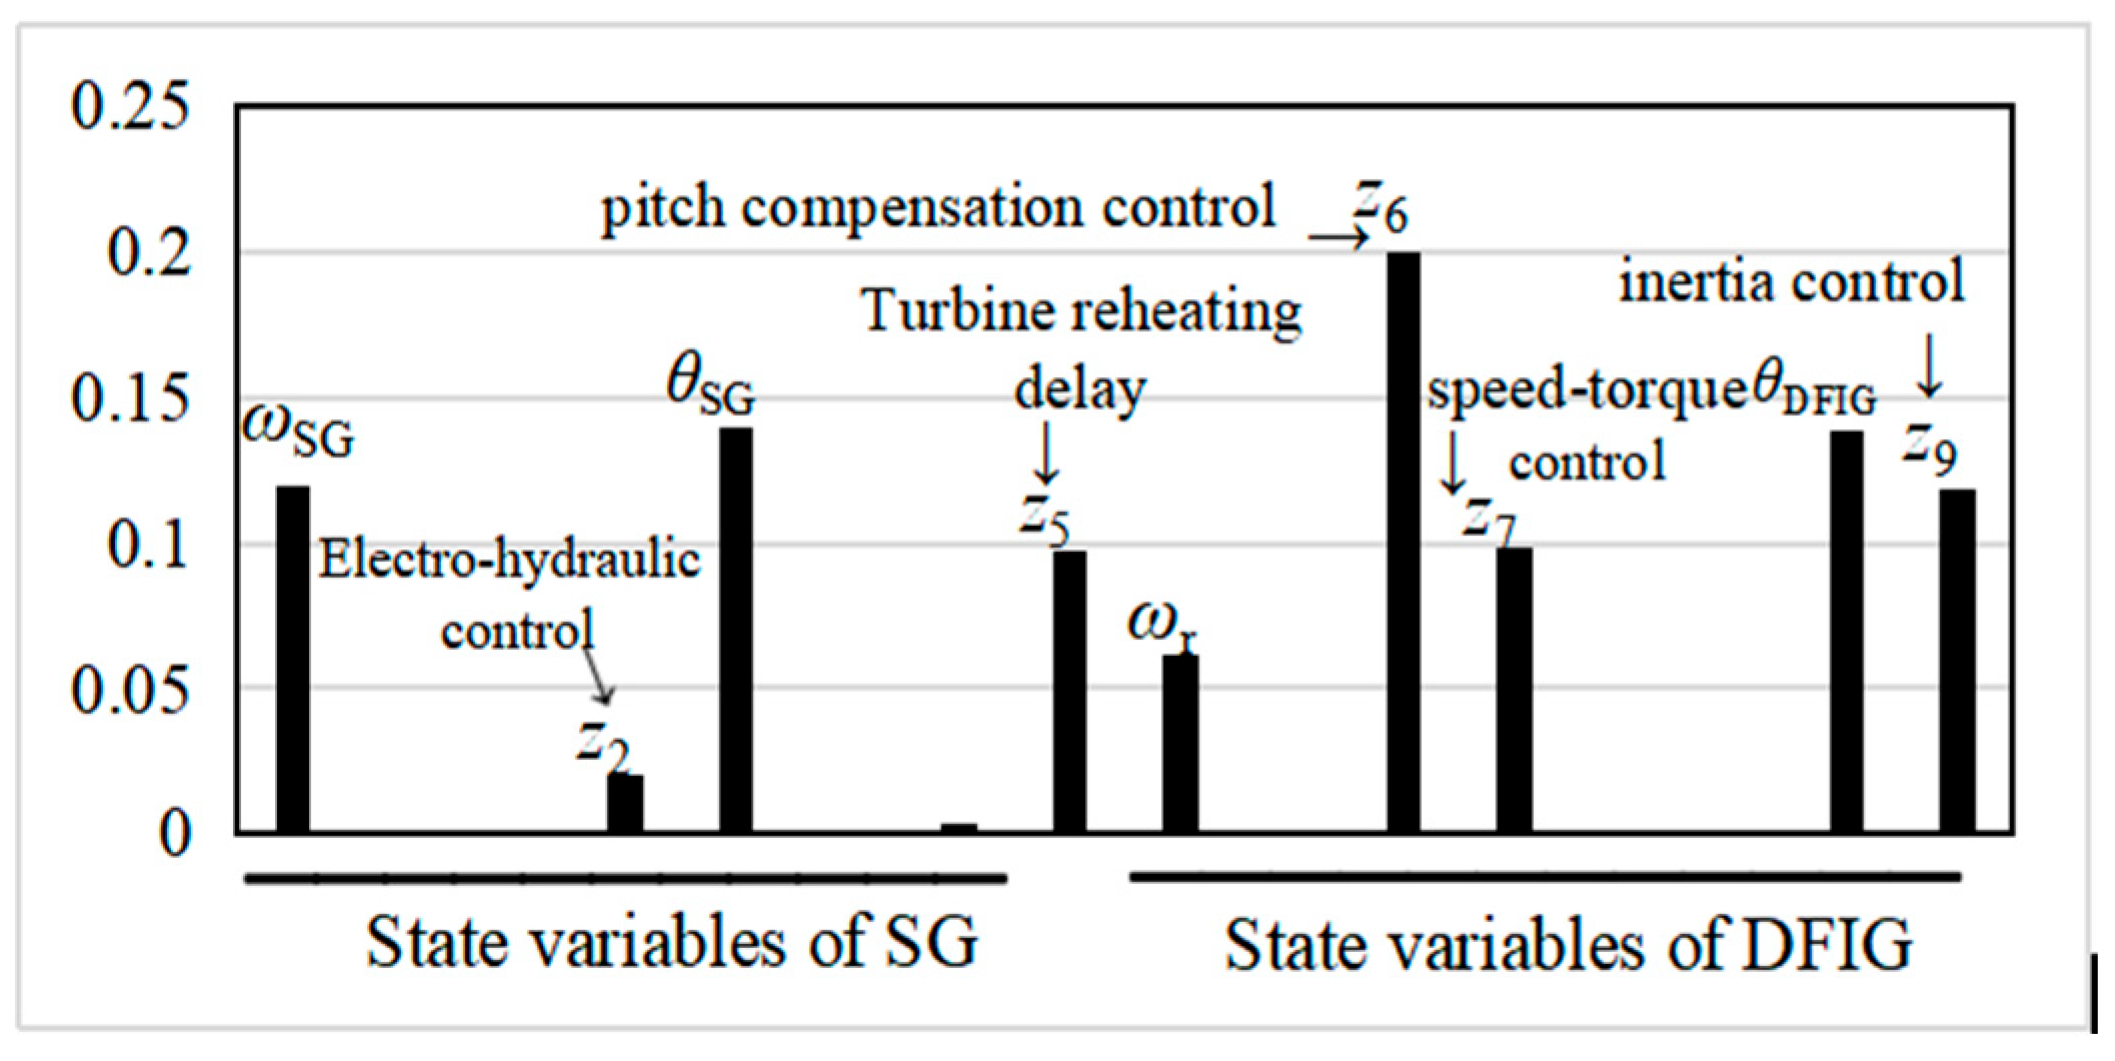
To identify the control mechanisms that exert the greatest influence on the ULFO modes, participation factor analysis is conducted. The results shown in Figure 13 indicate that the rotor speed, pitch angle control, and pitch compensation control exhibit substantial participation in ULFO. Therefore, their impacts will be the primary focus of analysis in the next section.

5. Factors Influencing the ULFO

5.1. Impact of Speed Control

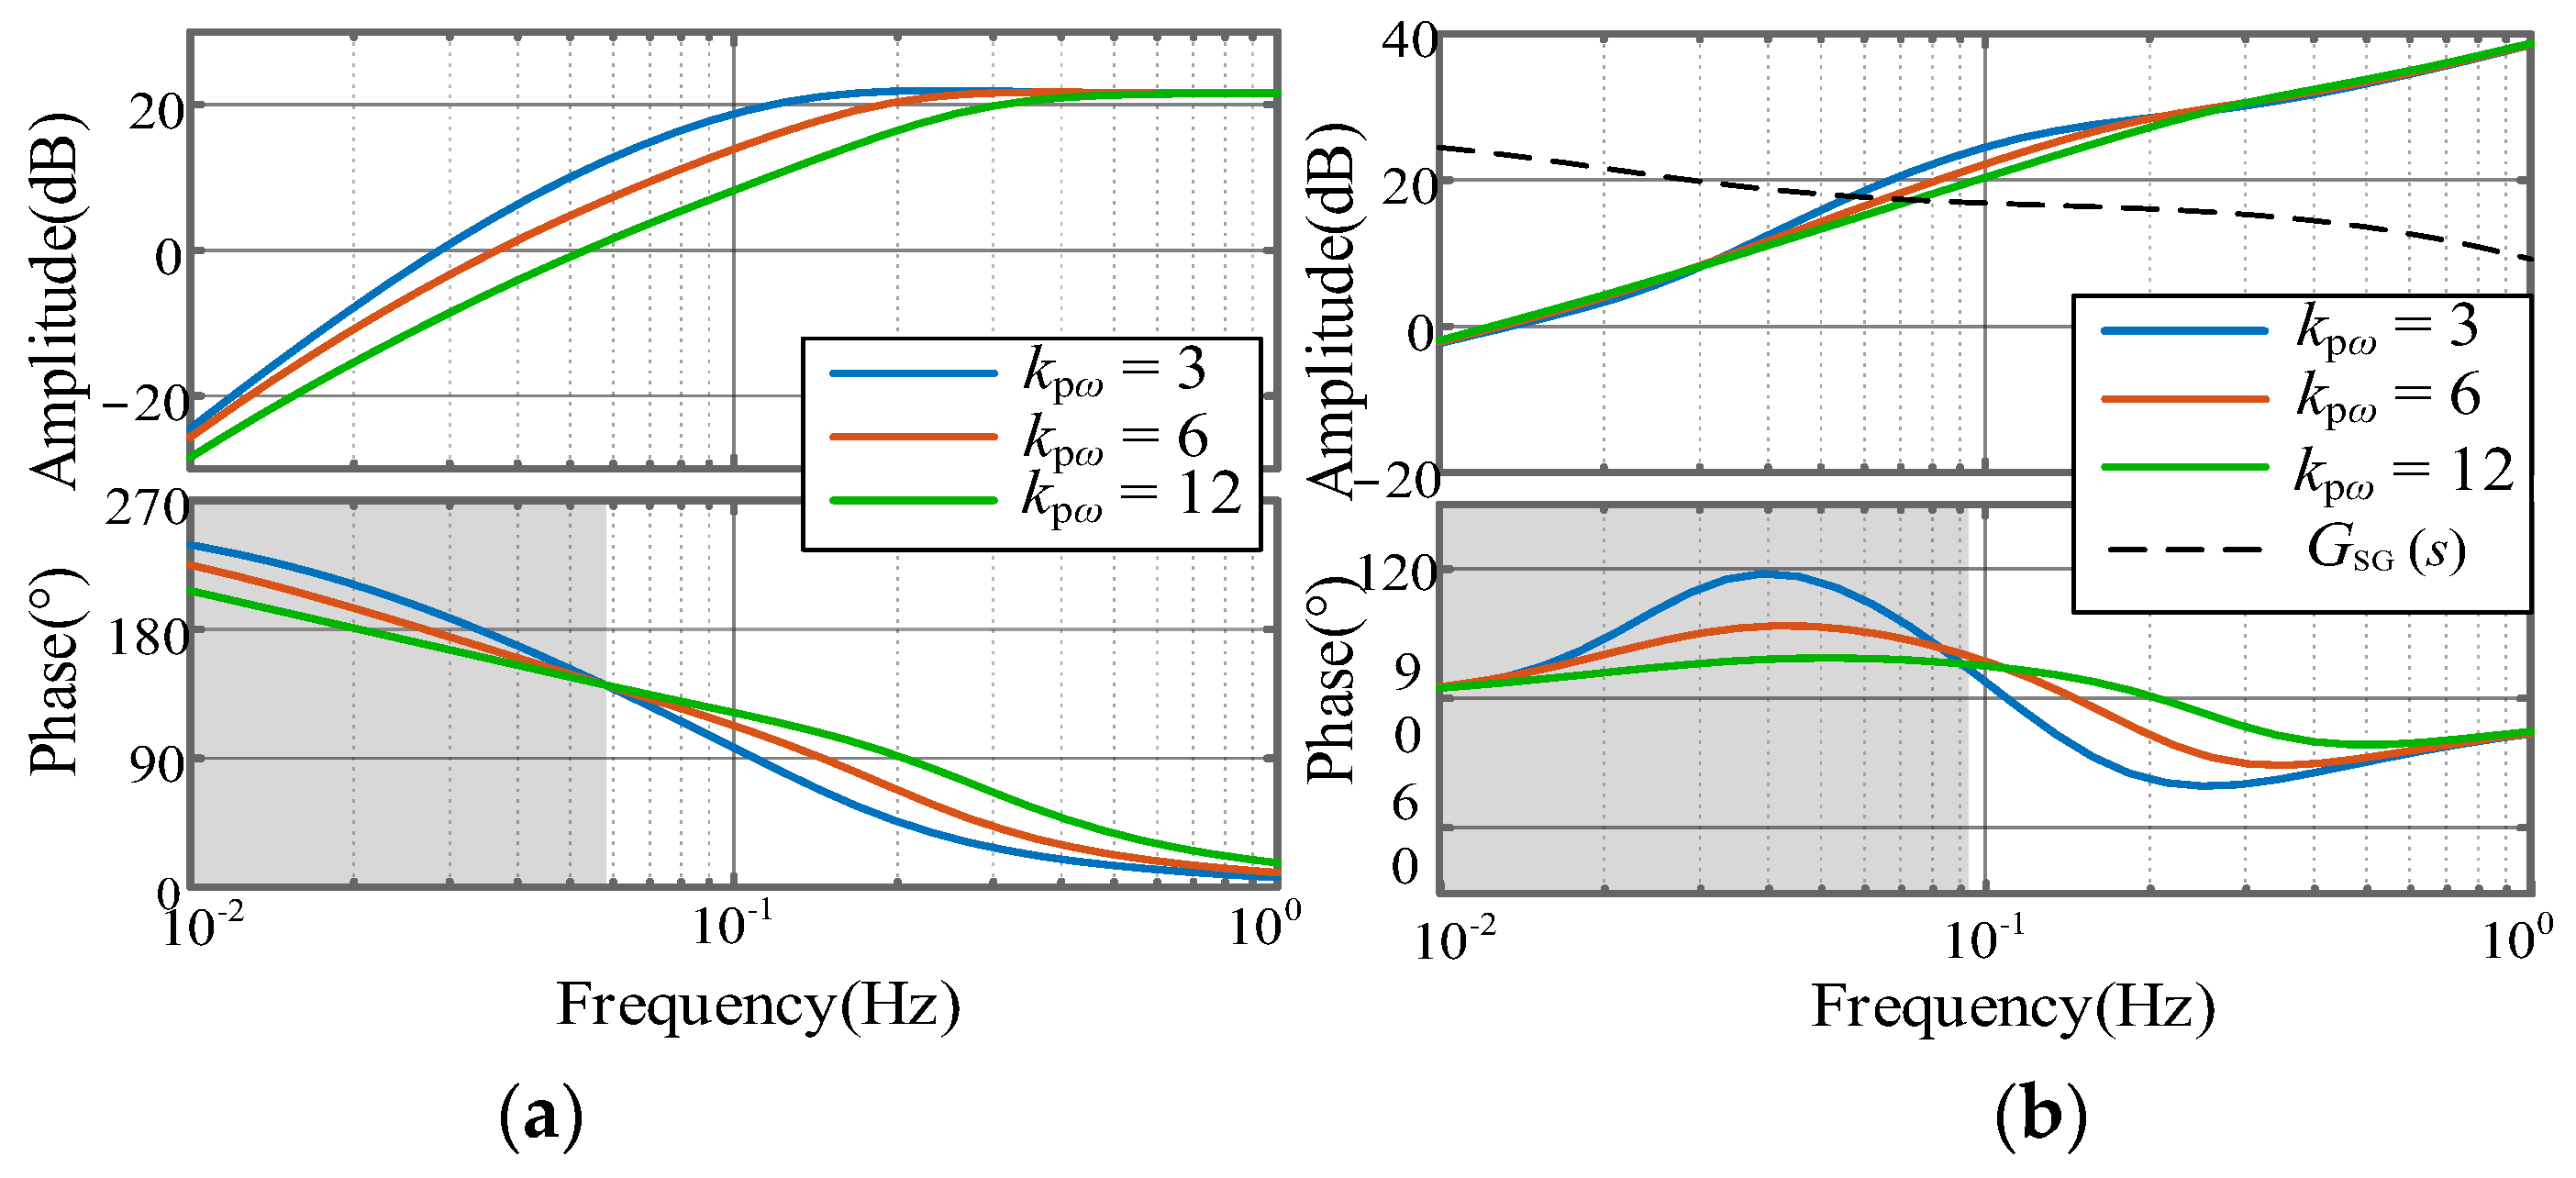
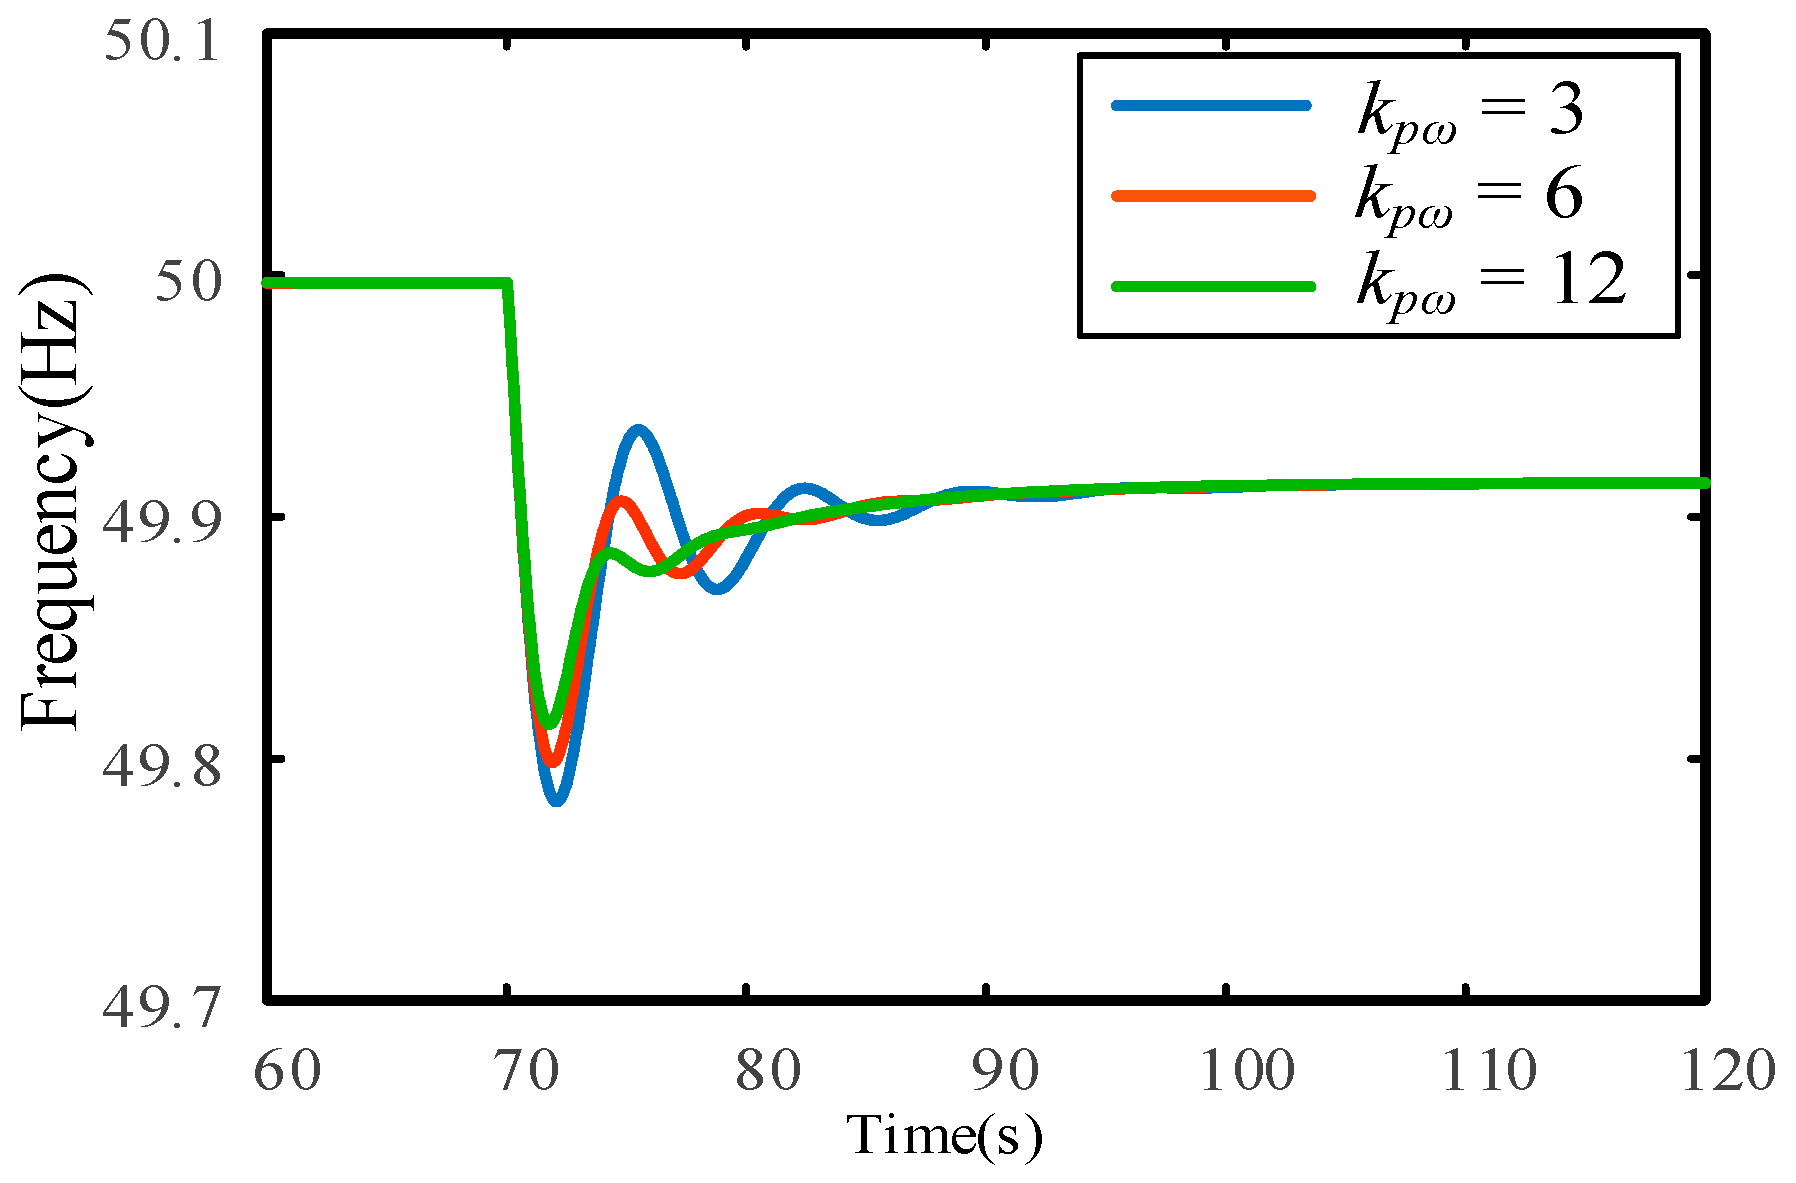
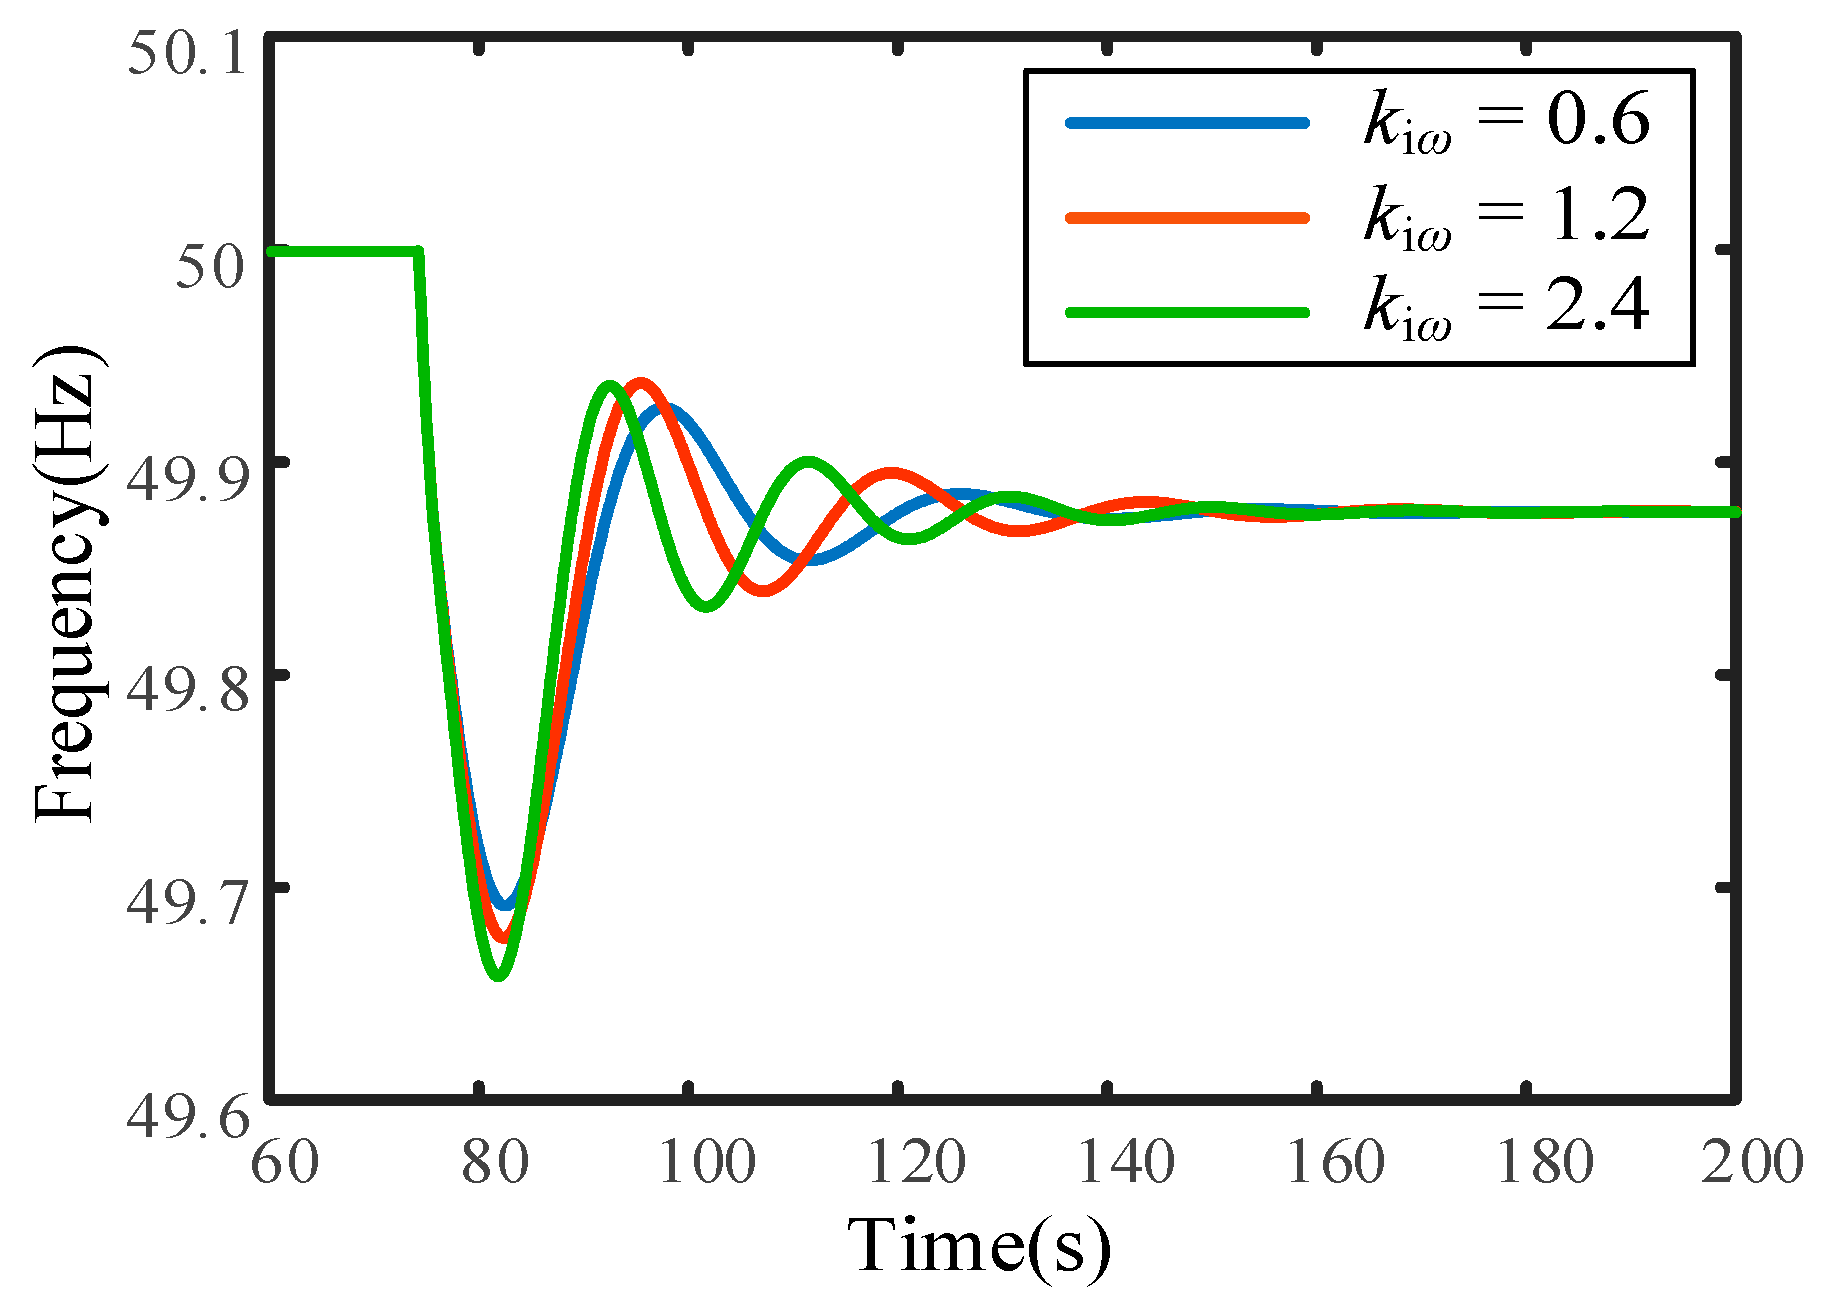
Linearization is conducted for the steady-state operation of the wind turbine. With the pitch angle and pitch angle compensation controls disabled, the proportional control parameter k of the rotor speed control is set to 0.5, 1, and 2 times its default value. The Bode diagrams of sMadd(s), sΣM(s), and GSG(s) are presented in Figure 14. As shown in Figure 14a, an increase in k leads to a reduction in the magnitude of Madd(s) and induces a phase lag in the shaded area. A similar trend is observed for sΣM(s) in Figure 14b. Consequently, when ωc falls within the gray area in Figure 14a,b, an increase in the k parameter can mitigate ULFO. This conclusion is further corroborated by the time-domain simulation results presented in Figure 15.
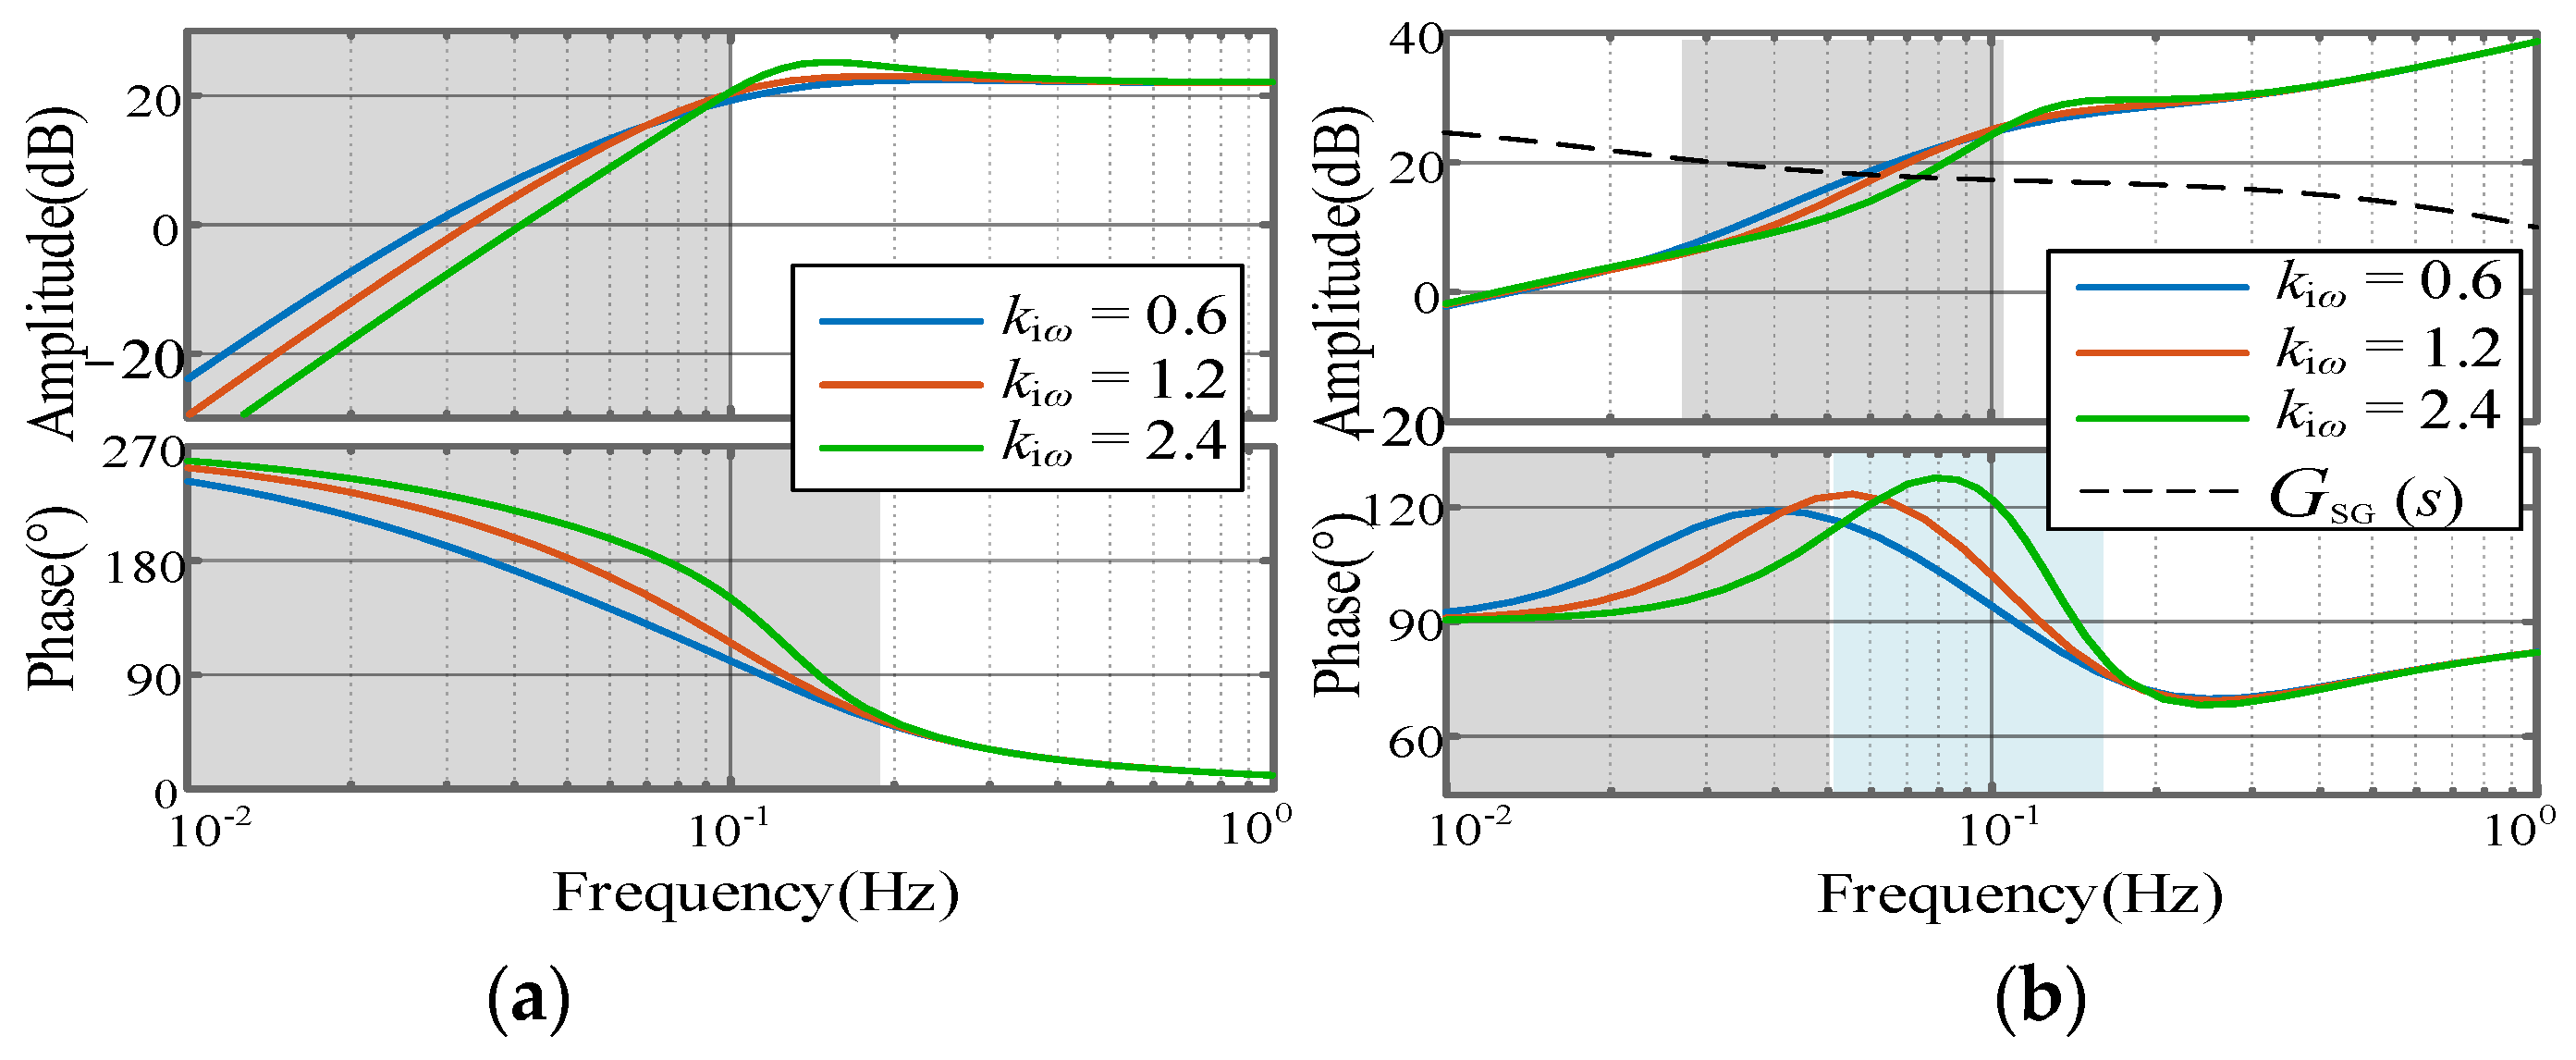
Analogically, by applying the same linearization approach and setting k to 0.5, 1, and 2 times its default value, the Bode diagrams for sMadd(s), sΣM(s), and GSG(s) are presented in Figure 16. As illustrated in Figure 16a, increases in k result in an increase in the phase and a decrease in magnitude of Madd(s) in the shaded area. The phase and magnitude of sΣM(s) exhibit similar characteristics in the blue area. Therefore, when ωc falls within the blue band in Figure 16a,b, an increase in the k parameter can decrease the damping of ULFO. Furthermore, Figure 17 shows a reduction in the frequency of ULFO alongside enhanced system damping, thereby validating the analytical findings.
From a physical perspective, when the rotor speed declines, a larger k enhances the ability to track the reference speed ωref, thereby preventing further speed reduction. This response is counter to the inherent dynamics of inertia control. Accordingly, a higher speed-torque ratio control parameter can mitigate ULFO induced by inertia control.

5.2. Impact of Pitch Angle Control

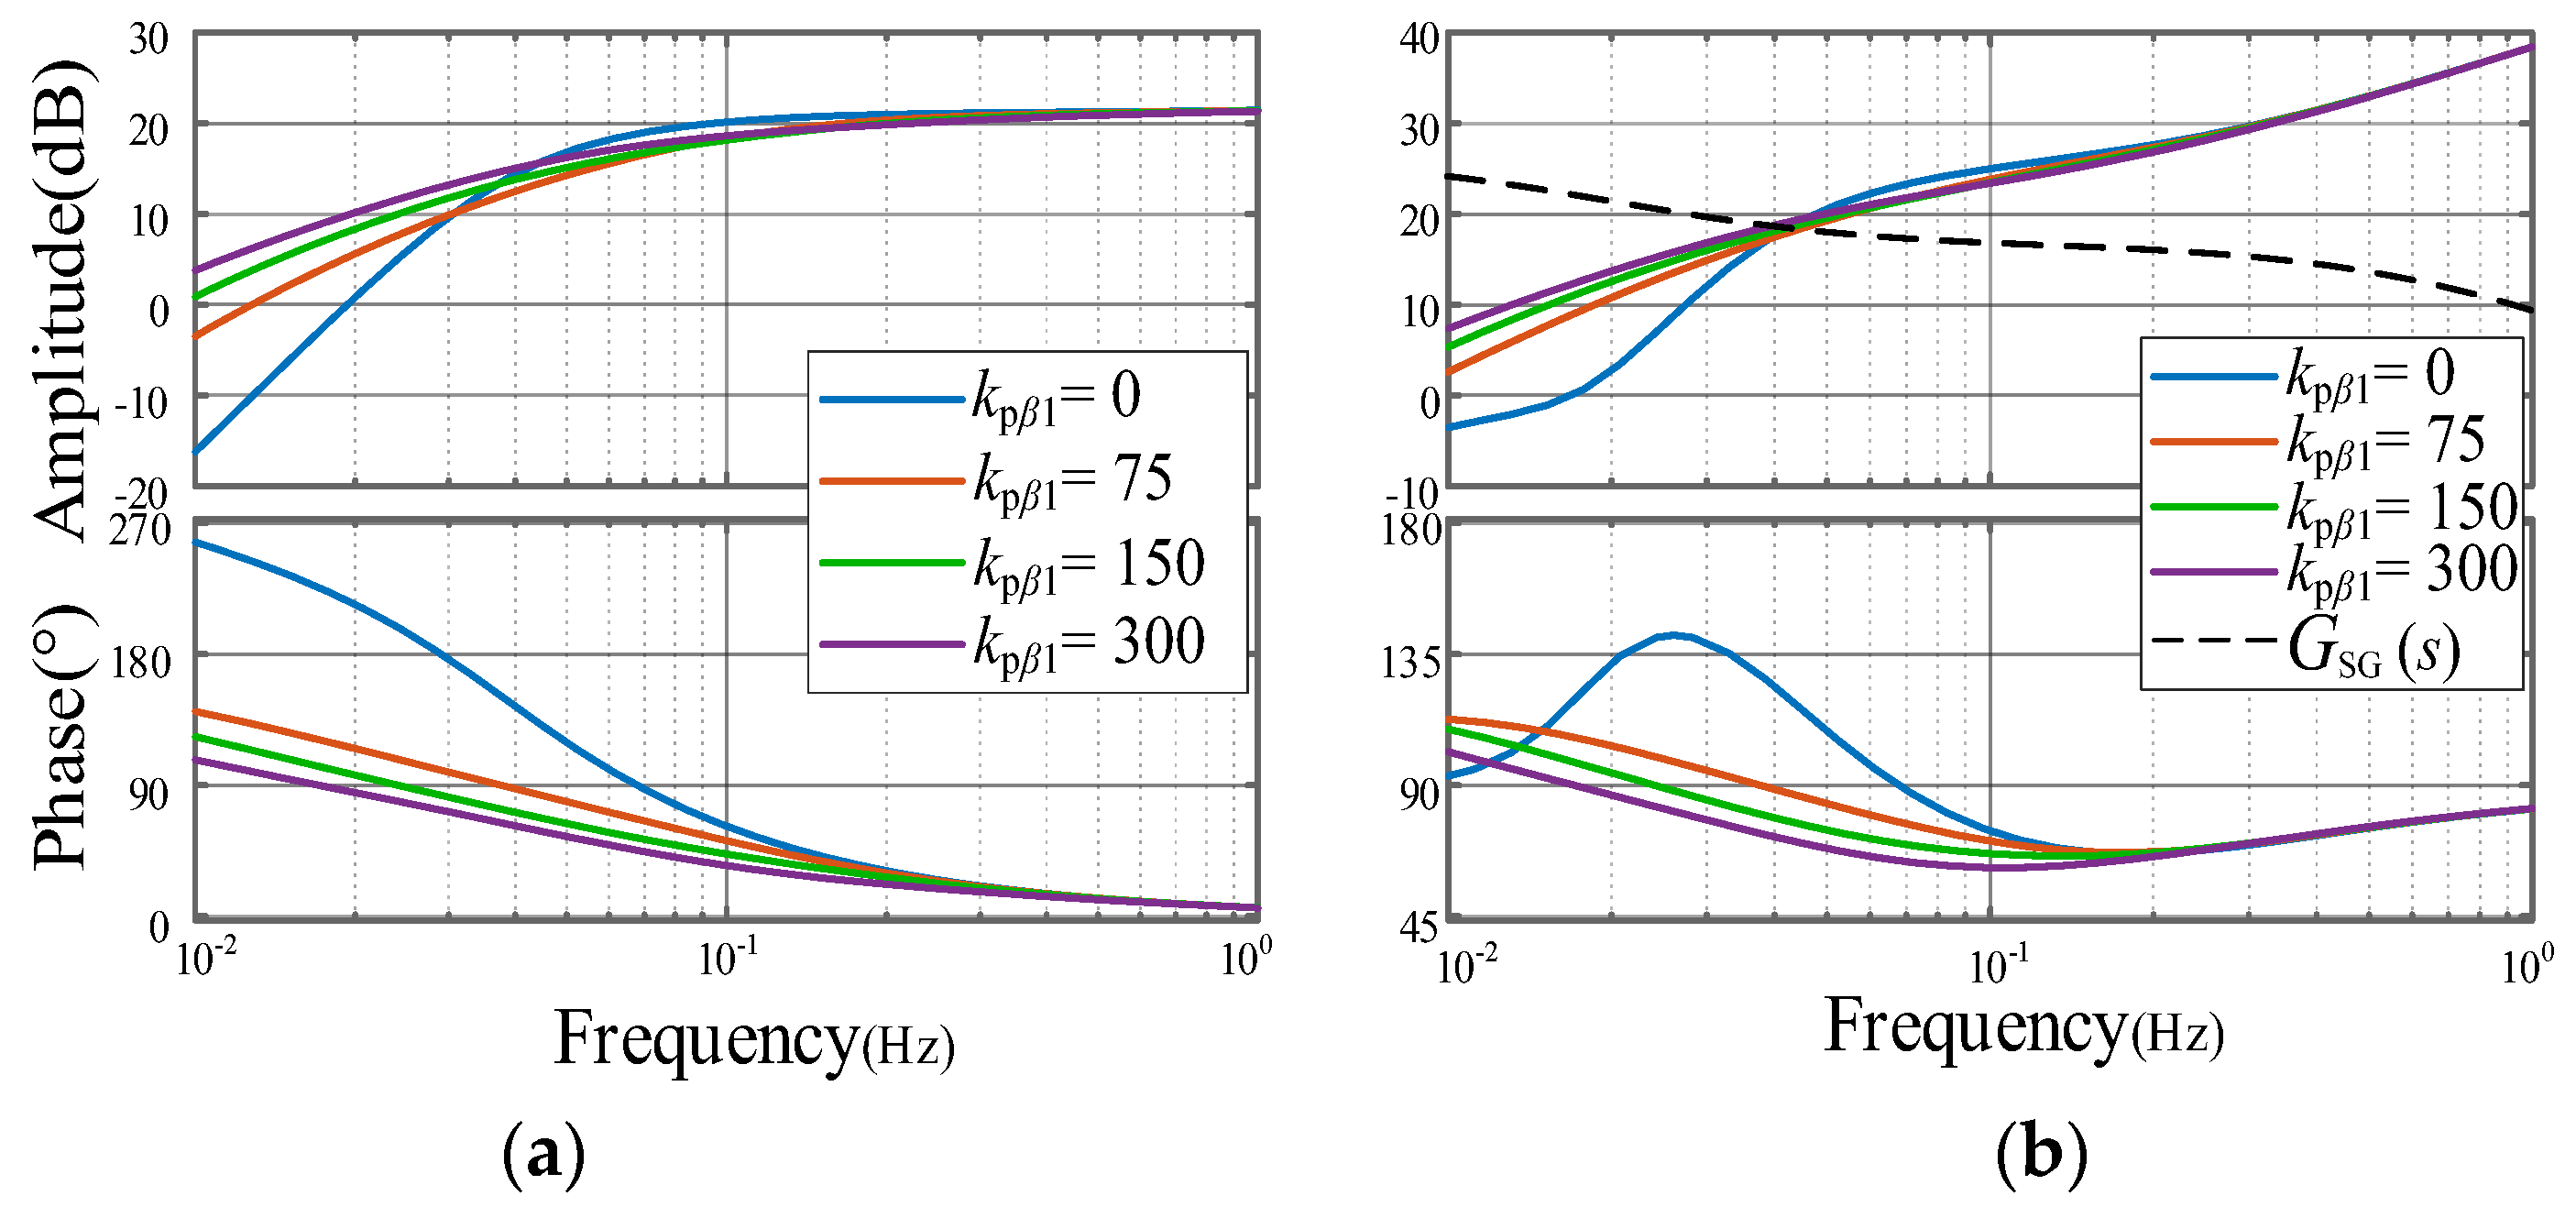
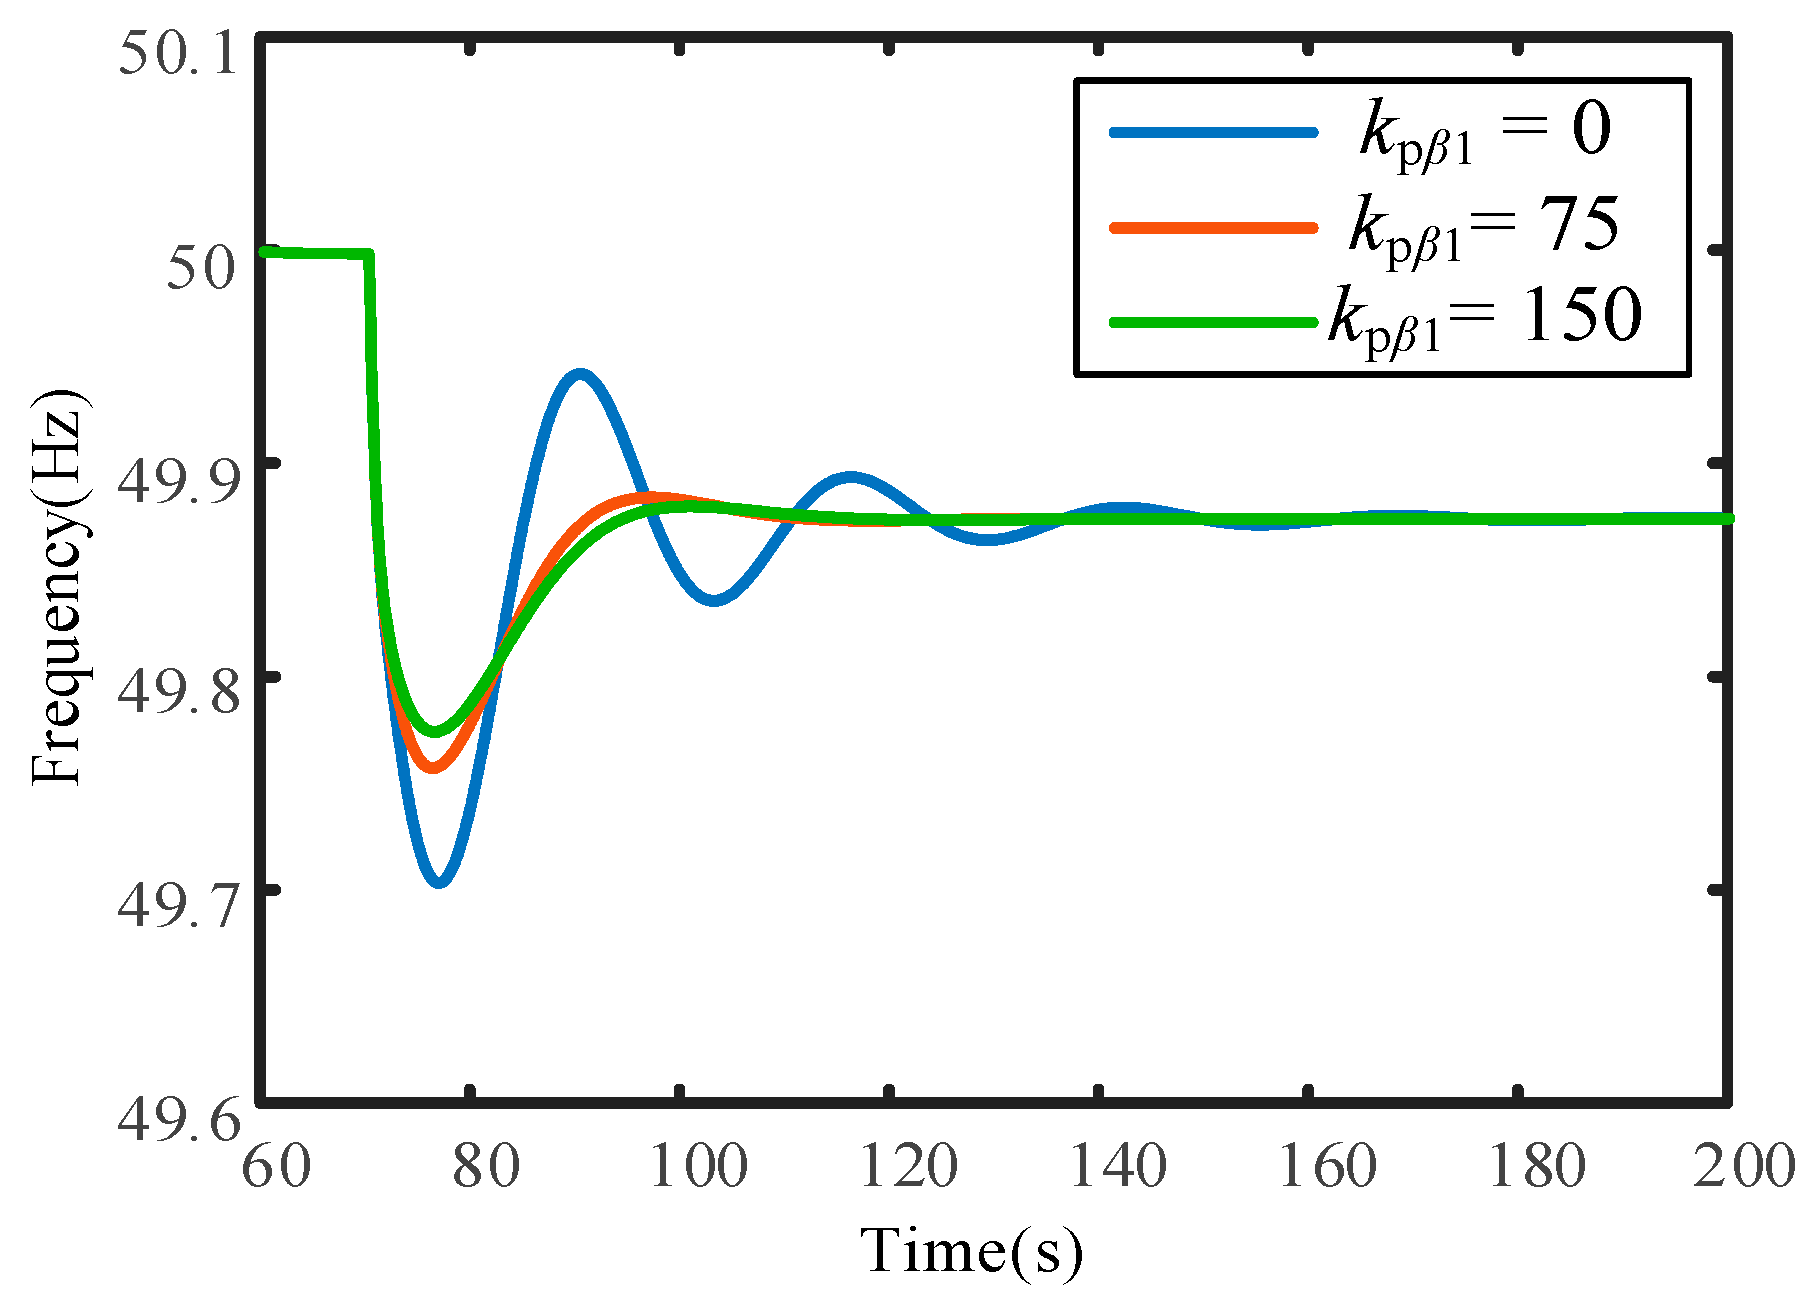
Linearization is conducted for the steady-state operation of the wind turbine. With pitch angle compensation control disabled, the control parameter k1 for pitch angle control is set to 0, 0.5, 1, 2, and 4 times its default value, where a value of 0 denotes complete disconnection of the pitch angle control. The Bode diagrams of sMadd(s), sΣM(s), and GSG(s) are presented in Figure 18. As illustrated in Figure 18a, when pitch angle control is introduced, an increase in k1 decreases the phase and increases the magnitude of sMadd(s) in the gray band. Similar characteristics are observed for sΣM(s) in Figure 18b. Therefore, the introduction of pitch angle control can increase the damping of ULFOs. These observations are further substantiated by the time-domain simulation depicted in Figure 19.
The underlying physical mechanism is given as follows: when the rotor speed decreases, the pitch angle control can reduce the pitch angle to increase the mechanical power captured by the wind turbine, thereby increasing the rotor speed. This response counteracts the inertia control-induced dynamics, making pitch angle control an effective strategy for mitigating ULFOs.

5.3. Impact of Pitch Angle Compensation

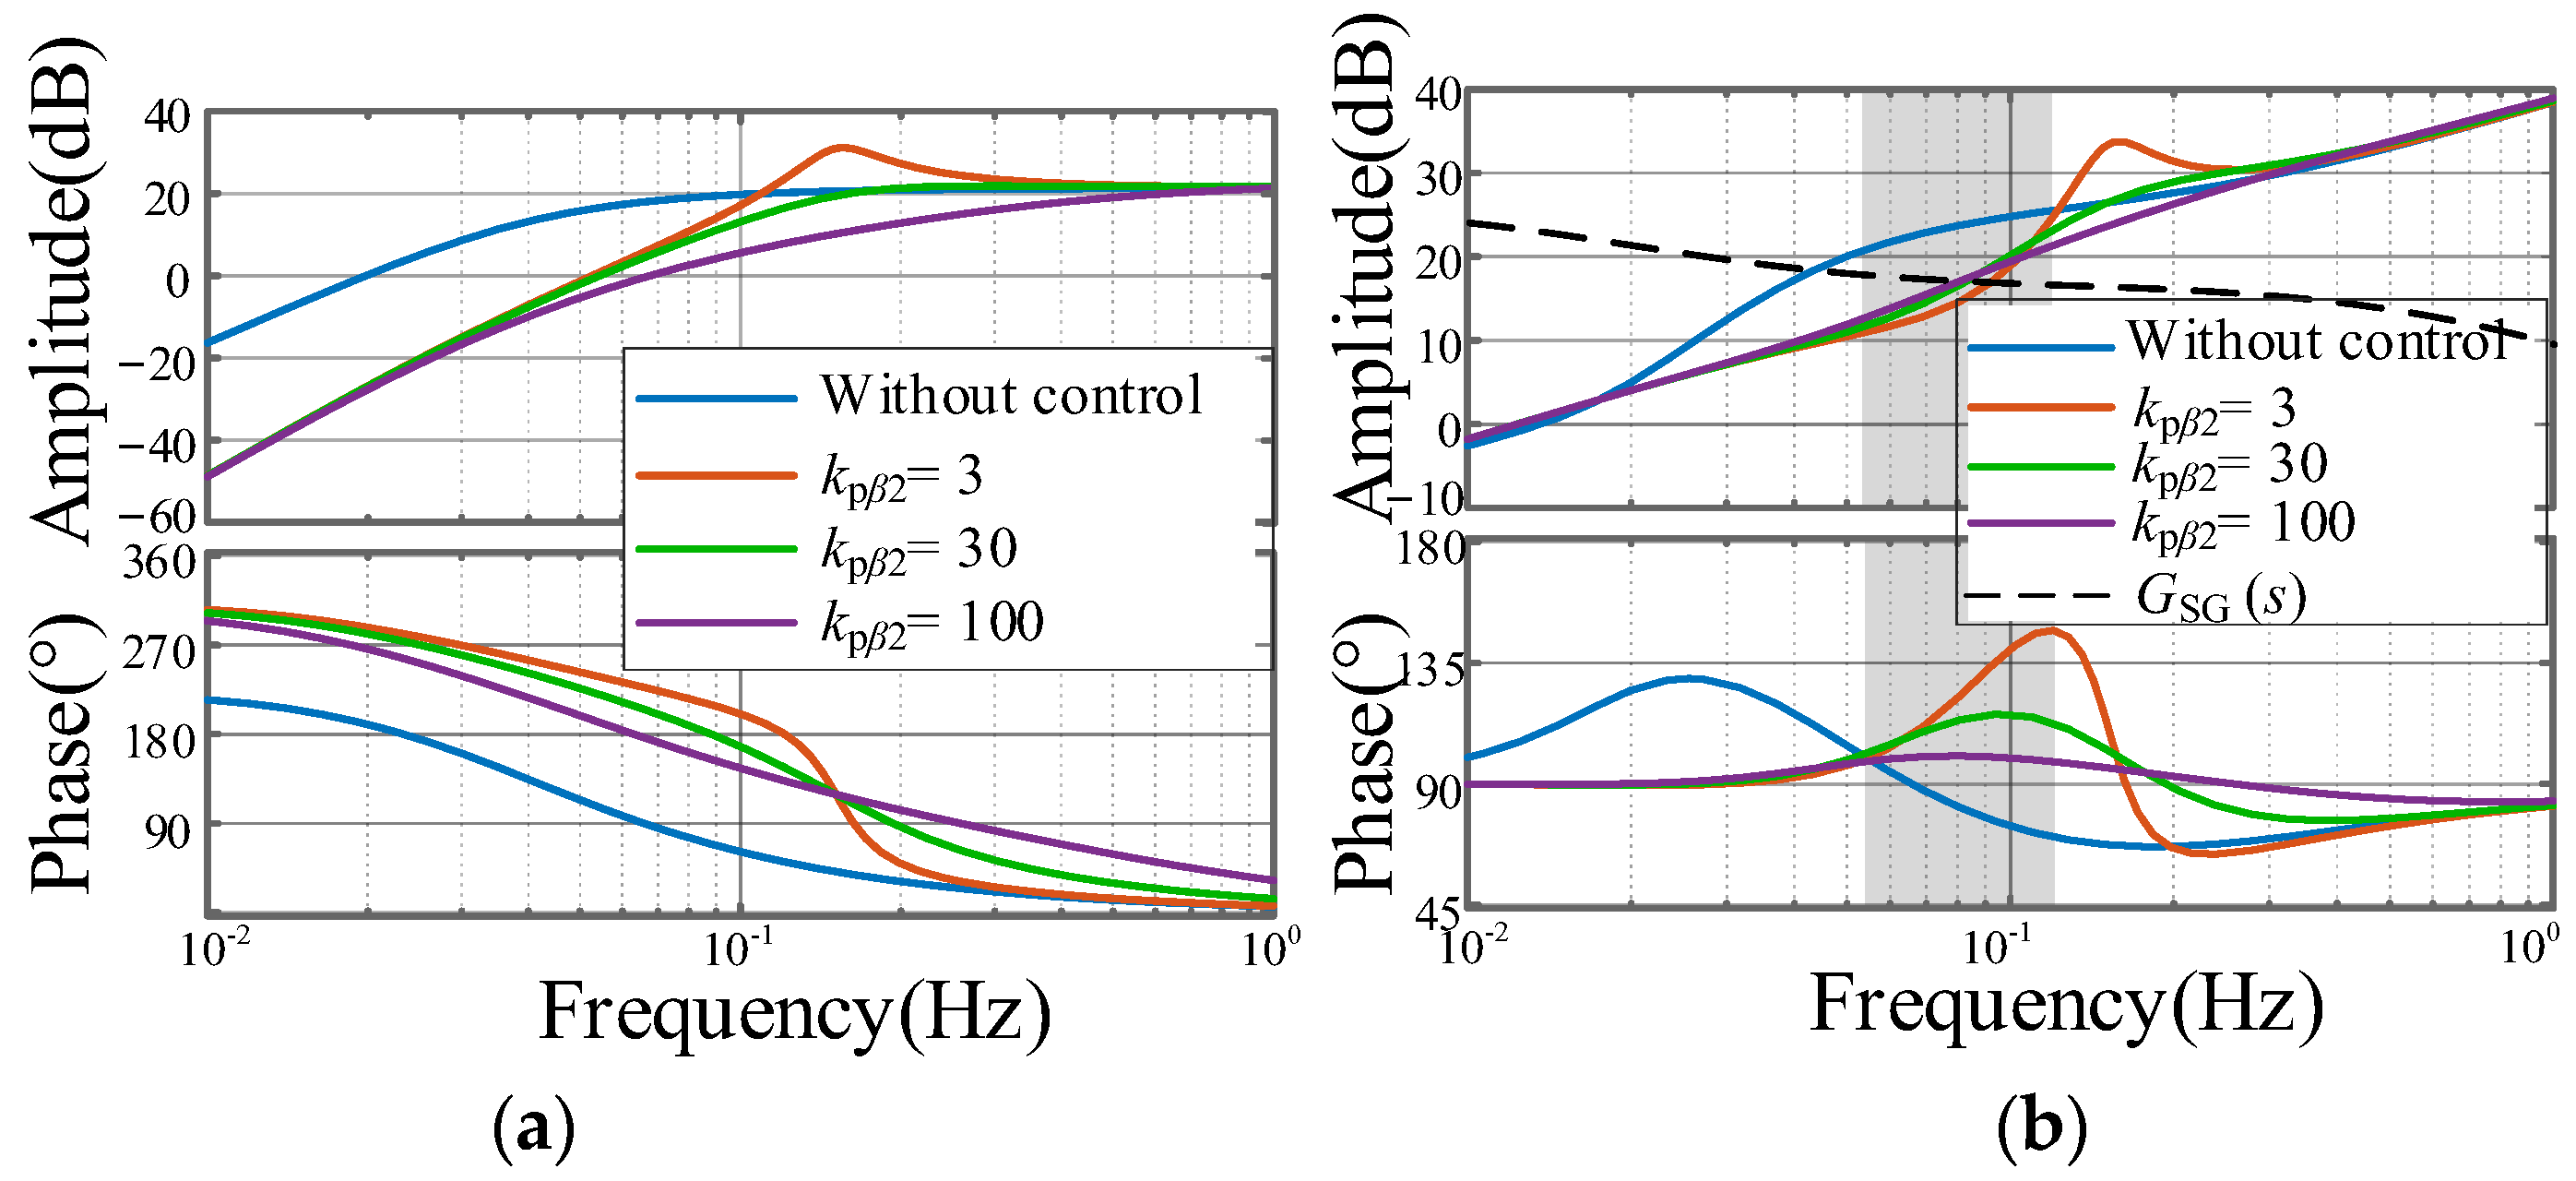
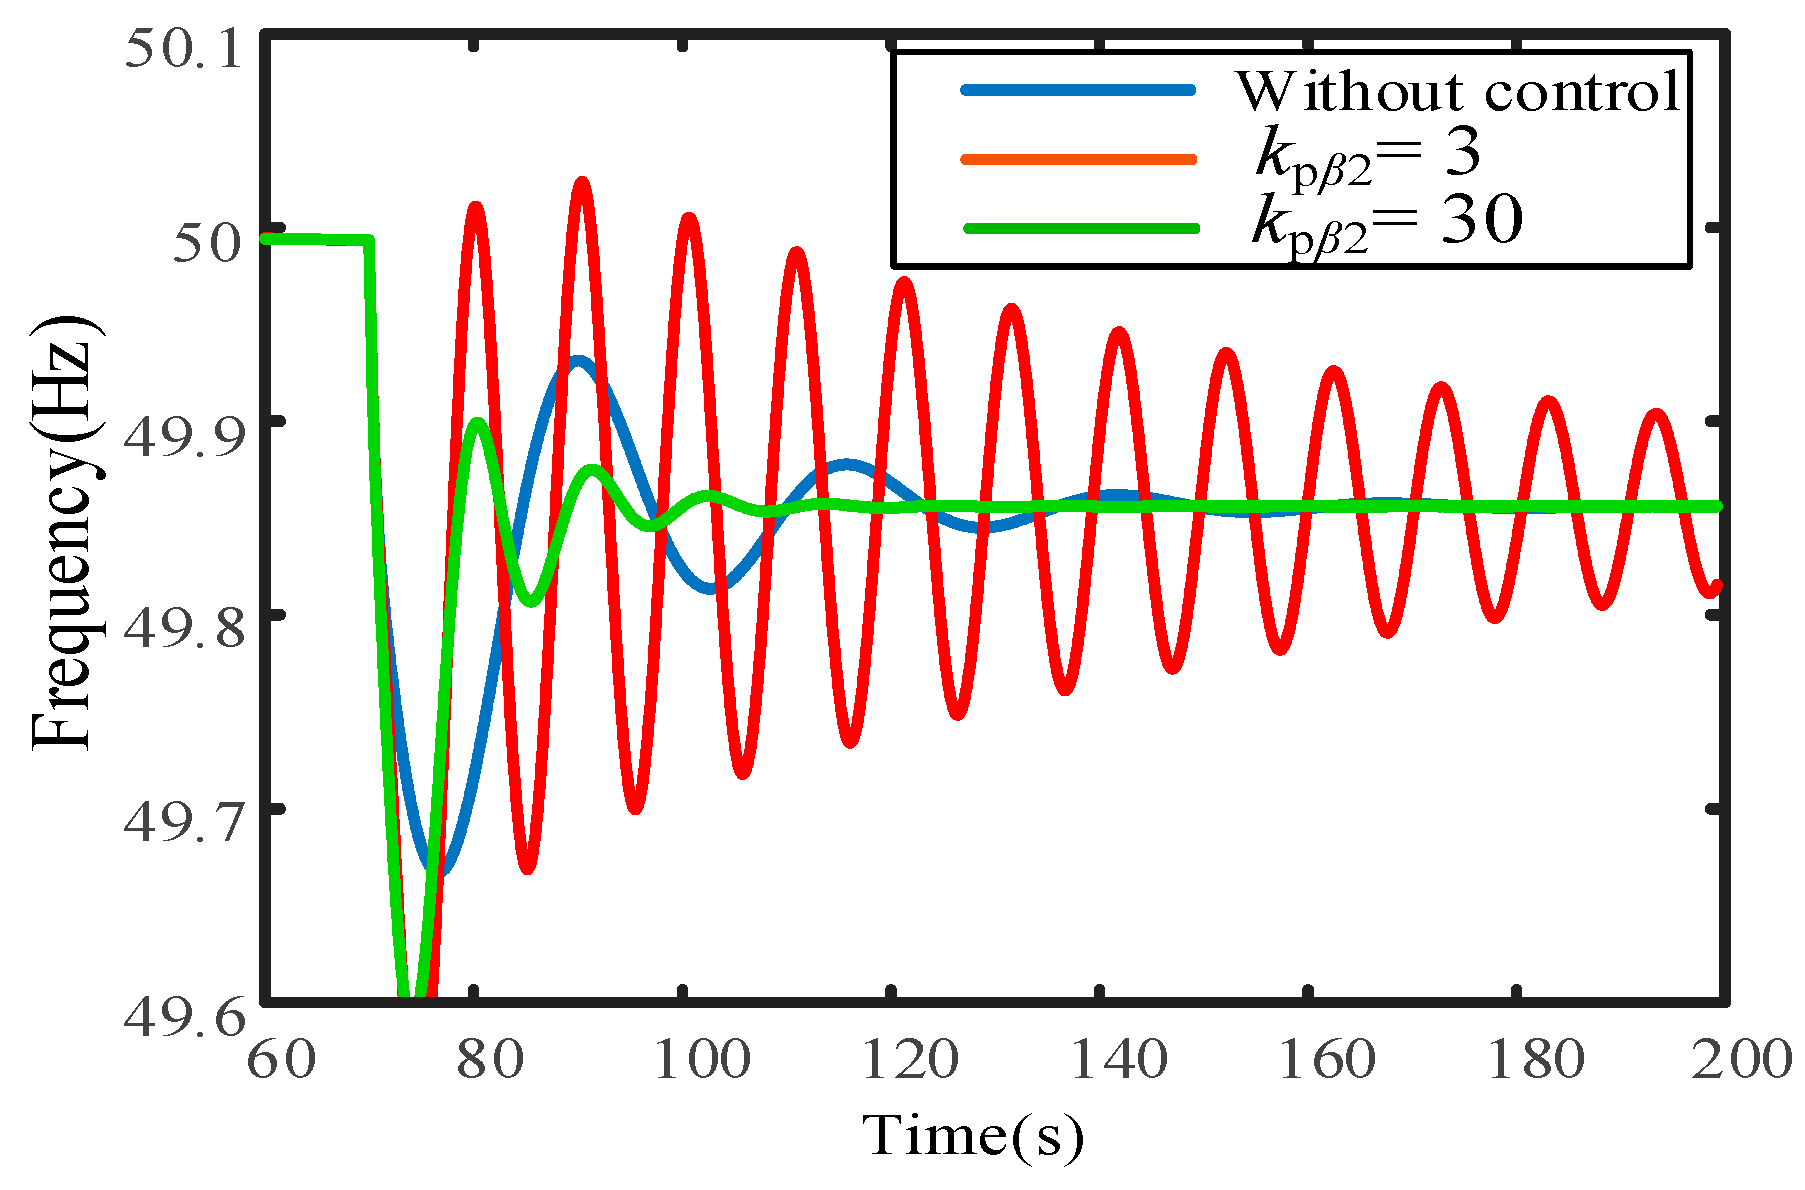
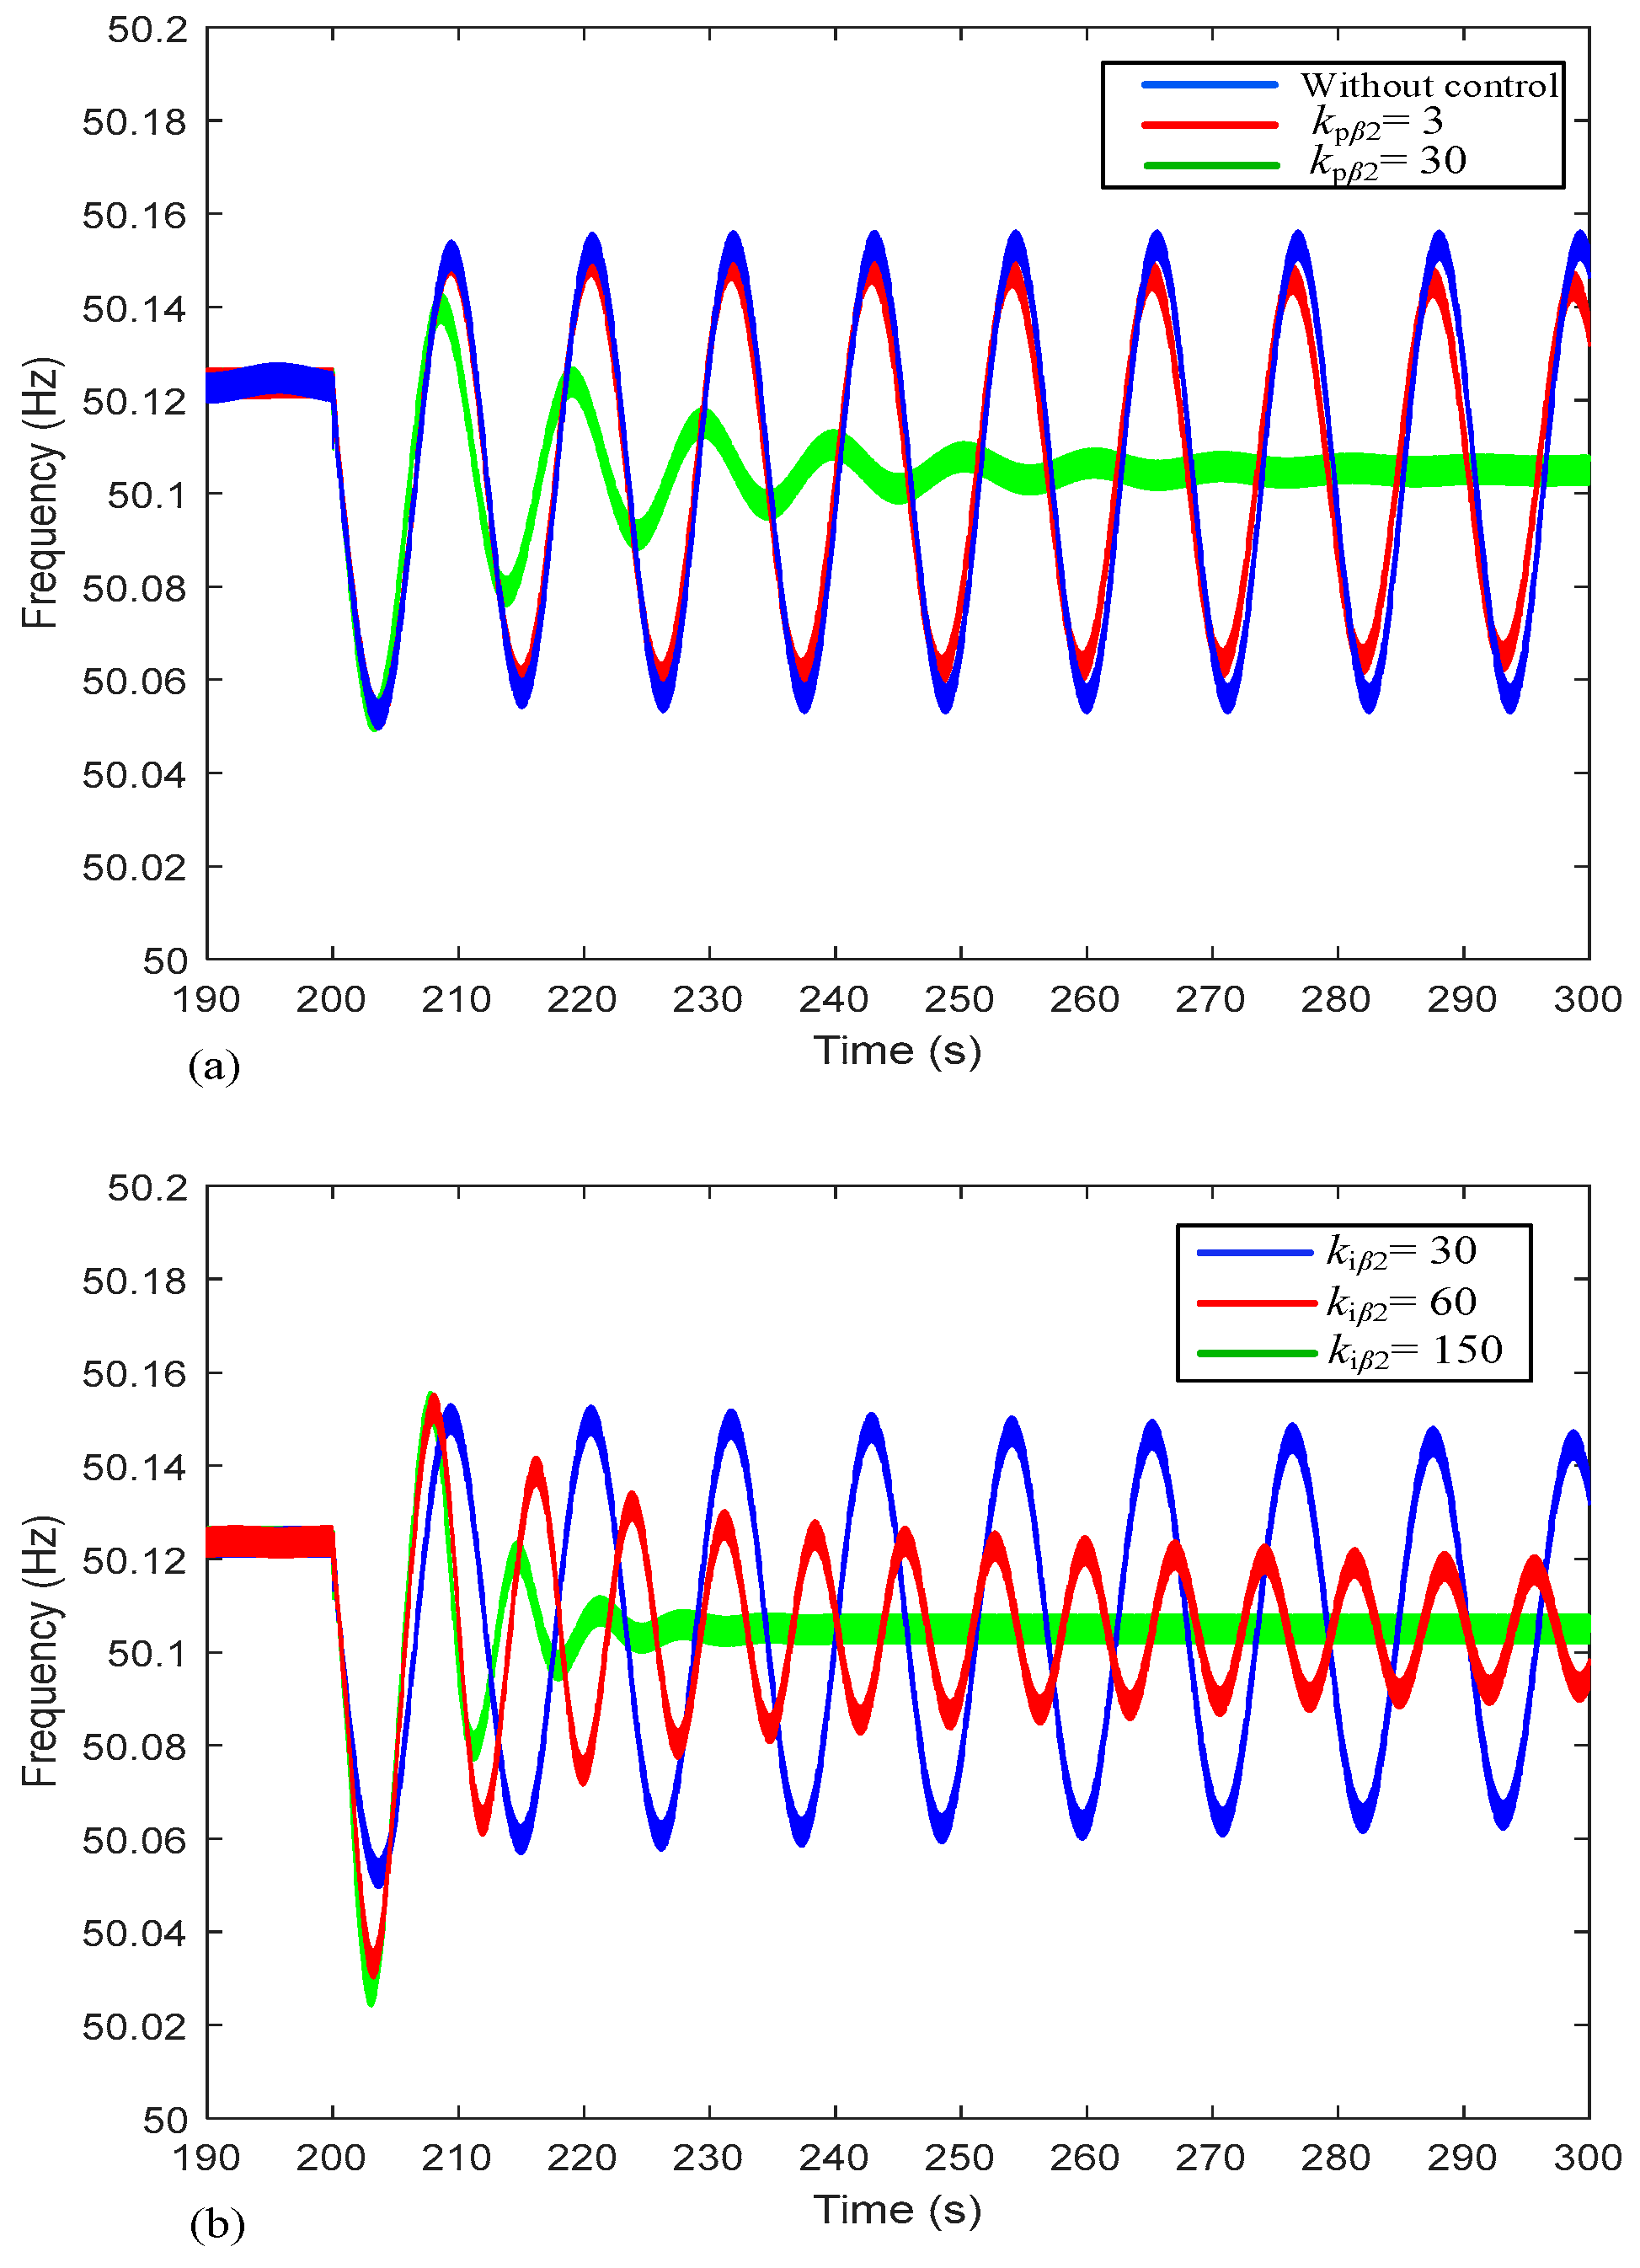
Linearization is conducted for the steady-state operation of the wind turbine. With pitch angle control disabled, the control parameter k2 of pitch angle compensation control is set to 0, 0.1, 1, and 10/3 times its default value, where 0 indicates the disconnection of pitch angle compensation control. The Bode diagrams for sMadd(s), sΣM(s), and GSG(s) are presented in Figure 20. As illustrated in Figure 20a, the introduction of pitch angle compensation control reduces the magnitude and increases the phase of sMadd(s). As k2 increases, the magnitude and phase of sMadd(s) decrease, and the peak in magnitude within a specific frequency band becomes smoother. As shown in Figure 20b, pitch angle compensation control reduces the magnitude and increases the phase of sΣM(s) in the gray band. The introduction of pitch angle control tends to increase ωc and decrease the PM. However, as k2 increases, the phase decreases, and the PM increases sΣM(s). These observations are further substantiated by the time-domain simulations depicted in Figure 21.
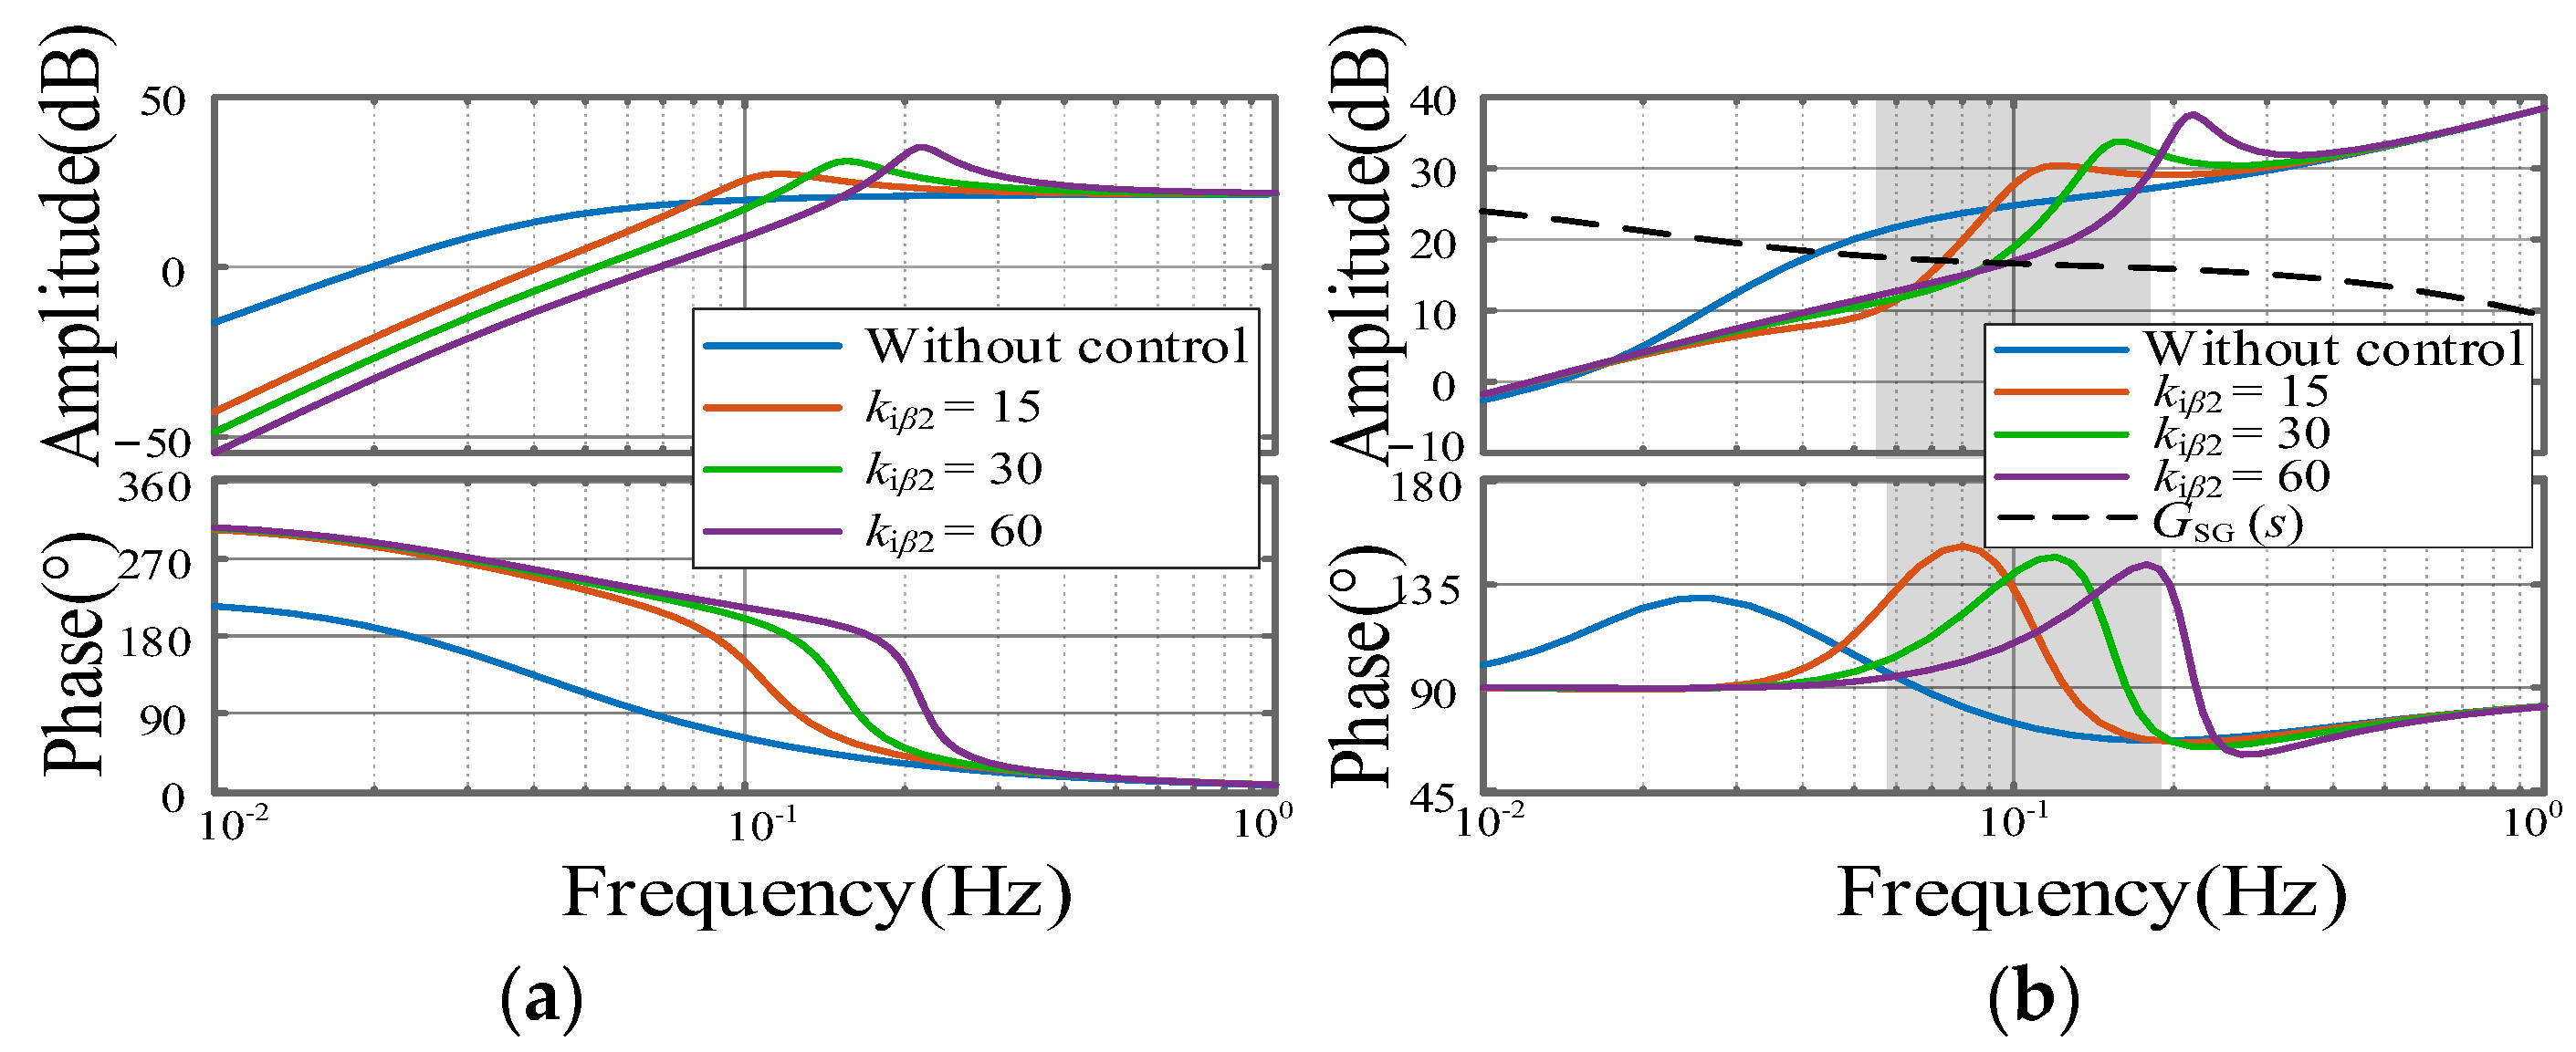
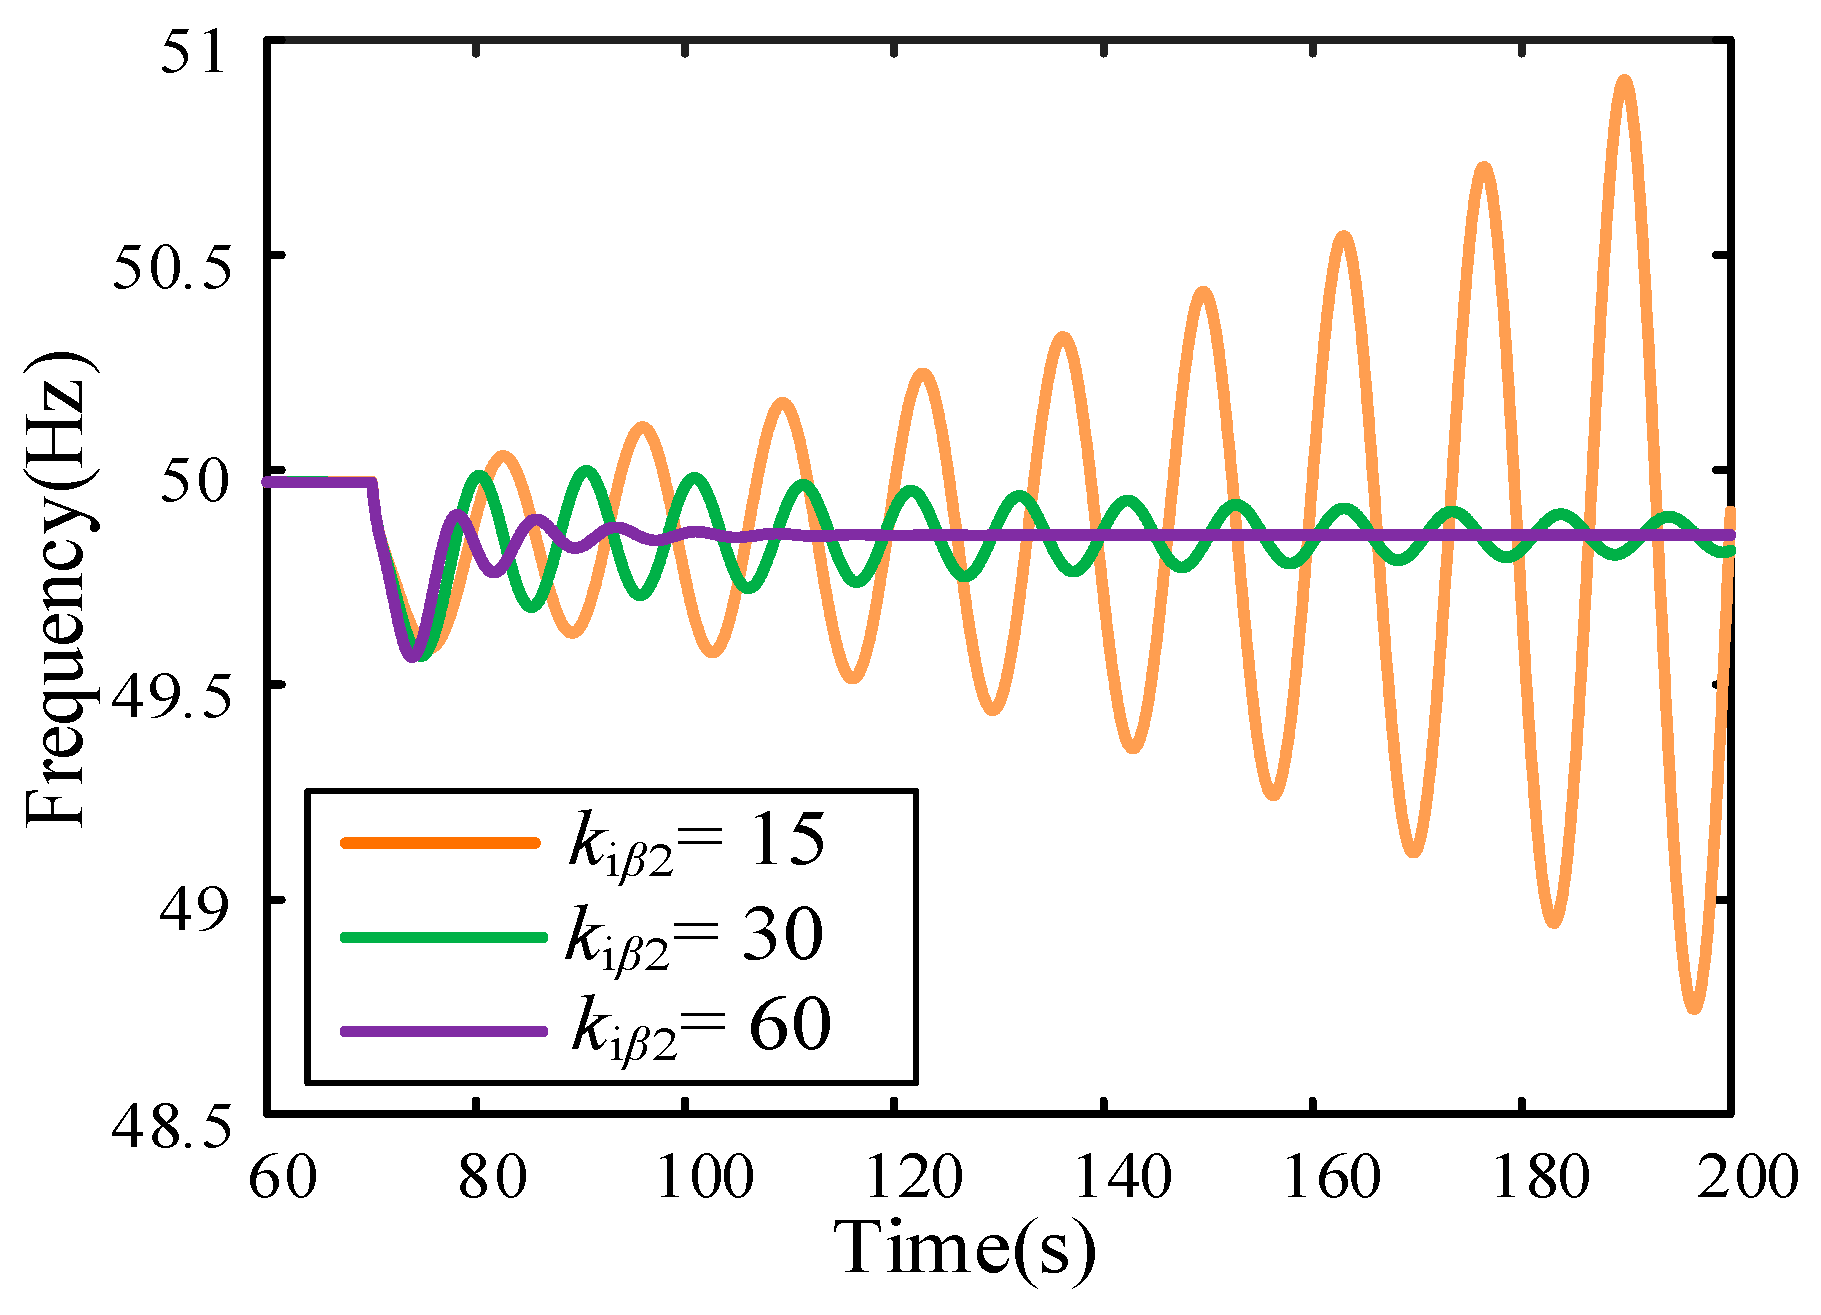
Adopting the same operating conditions and setting the integral control parameter k2 to 0, 0.5, 1, and 2 times its default value, the Bode diagrams for sMadd(s), sΣM(s), and GSG(s) are illustrated in Figure 22. As shown in Figure 22a, as k2 increases, the magnitude of sMadd(s) decreases within the ultra-low frequency band, while the peak amplitude increases and shifts to the right. In the shaded area of Figure 22b, the amplitude of sΣM(s) decreases with increasing k2, resulting in ωc increases. However, the phase of sΣM(s) increases, resulting in a decrease in PM. As illustrated in Figure 23, with the increase of the parameter k2, the frequency of the ULFO increases, and the damping of ULFO decreases, which is consistent with the results of the frequency domain analysis.
This phenomenon can be elucidated through the underlying physical process: when inertia control increases the electromagnetic power output of DFIG while the rotor speed concurrently declines, the pitch angle compensation control responds by increasing the pitch angle. This reduces the mechanical power captured by DFIG, further decreasing the rotor speed. Therefore, pitch angle compensation control can mitigate the ULFOs.

5.4. Impact of the MPPT Control

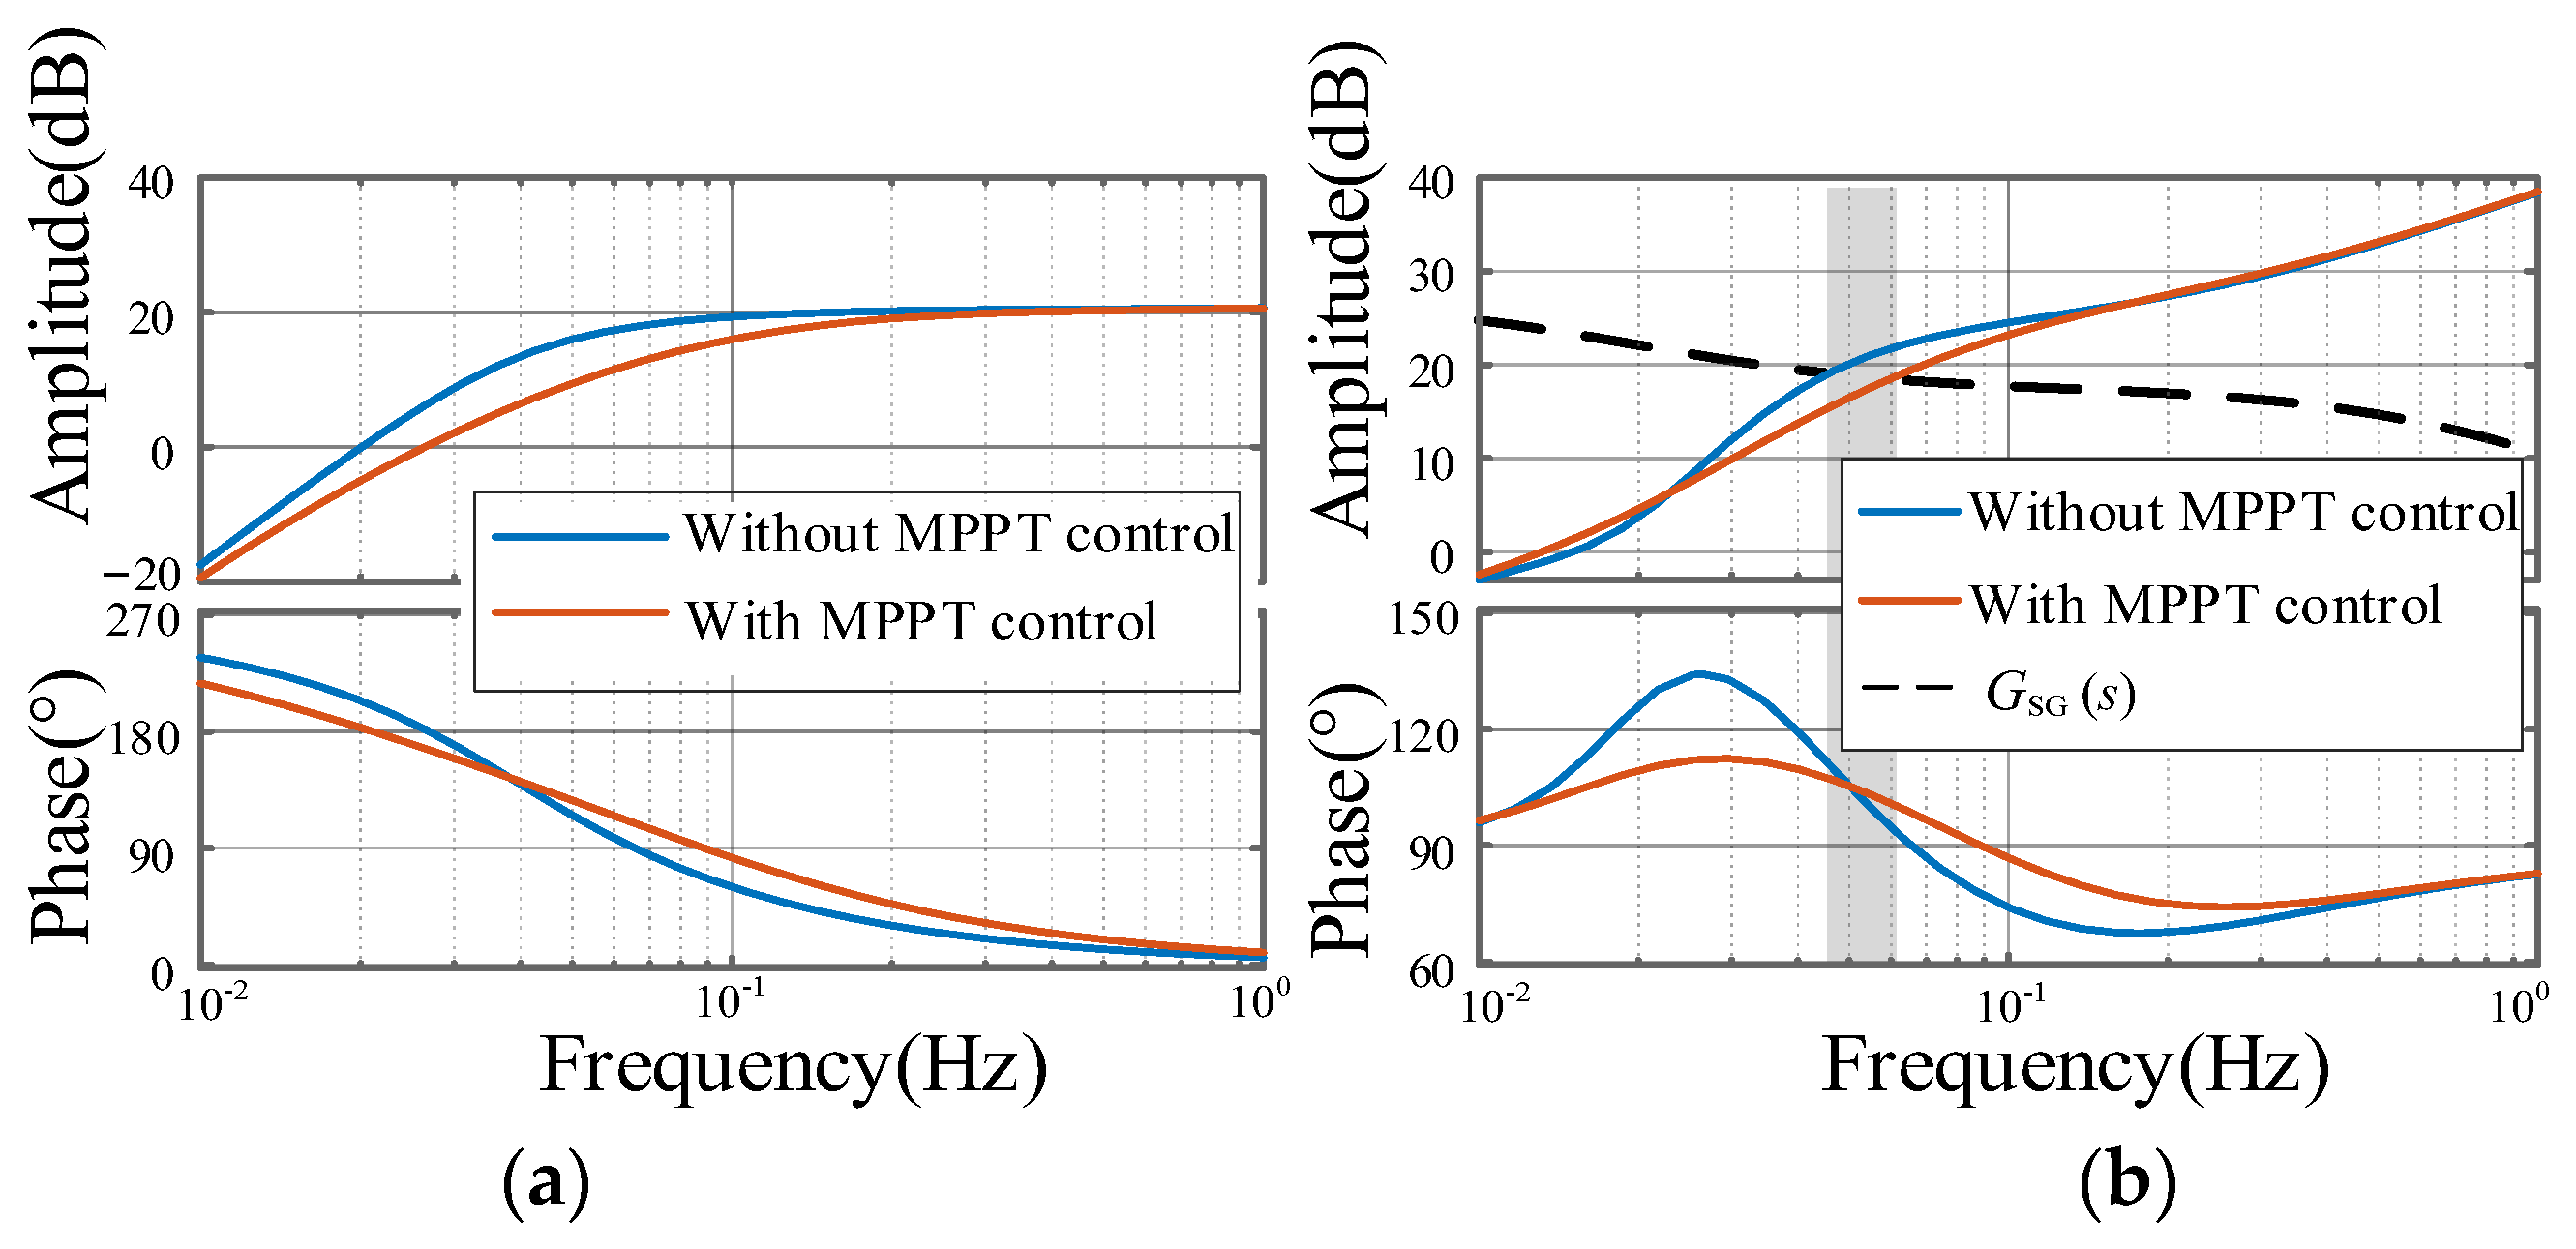
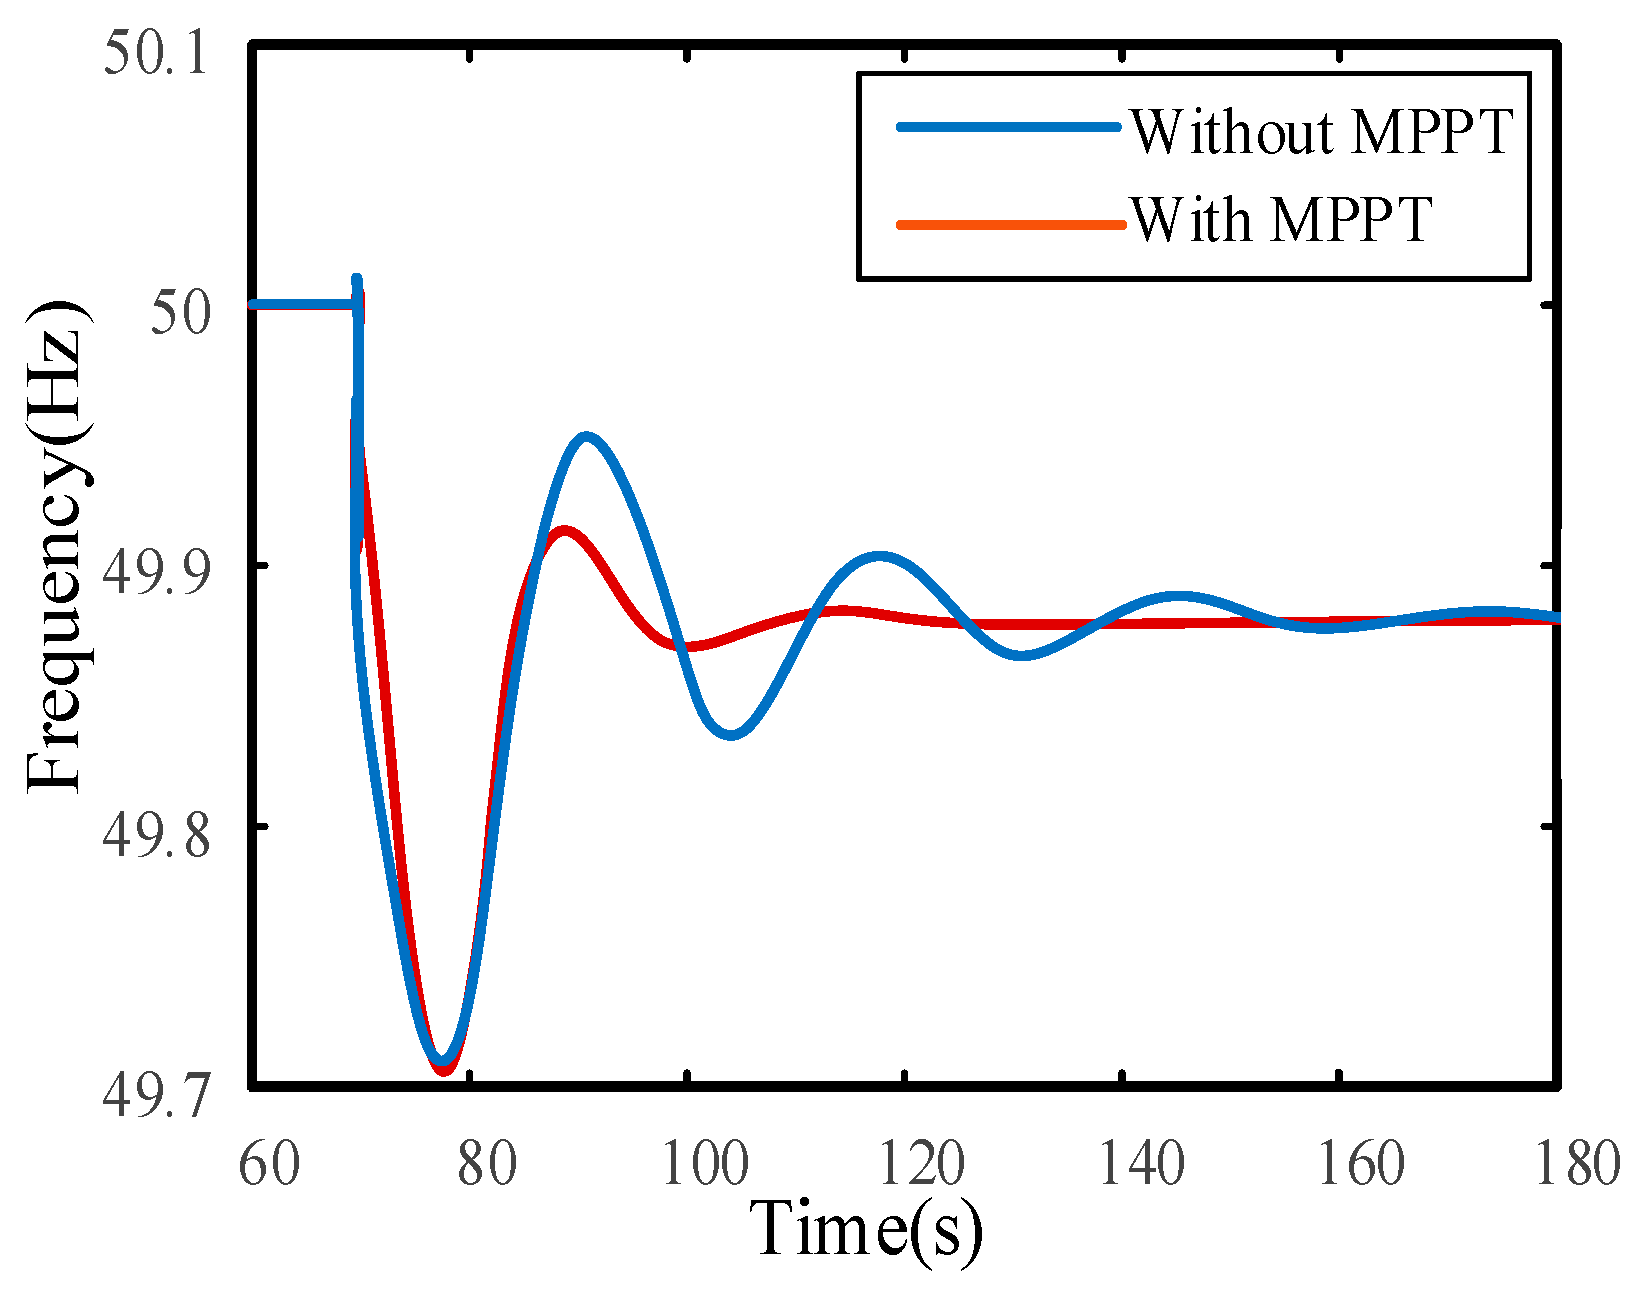
When DFIG operates in MPPT area, the Bode diagrams for sMadd(s), sΣM(s), and GSG(s) with and without the MPPT control are presented in Figure 24. As shown in Figure 24a, the introduction of the MPPT control reduces the magnitude of sMadd(s). Furthermore, the phase decreases in the lower frequency band while increasing in the higher frequency band. In Figure 24b, sΣM(s) exhibits similar characteristics. Additionally, the increase of ωc and PM results in the damping of ULFO increases. Time-domain simulation results in Figure 25 validate the analysis.
As the physical process explains, when inertia control increases the electromagnetic power output of the wind turbine while causing a decrease in rotor speed, the MPPT control acts to raise the reference speed, thereby mitigating the decline in rotor speed. This response is contrary to the physical process associated with inertia control. Consequently, the MPPT control can mitigate the ULFOs.

5.5. Key Influencing Parameters Validation

Given the significant impact of pitch compensation control confirmed in preceding sections, validation is conducted under the IEEE three-machine, nine-bus standard test system with MATLAB/Simulink R2021a. The structure of the test system is shown in Figure 26.
When the parameters of pitch angle compensation control changes, simulation results are shown in Figure 27. The system is more stable with larger k2 and k2. This demonstrates that key characteristics identified earlier remain valid across alternative scenarios, confirming the robustness of the experimental findings.
In summary, the influence of increasing parameters of the system on ULFOs is consolidated in Table 3. In the table, the ↑ symbol indicates that an increase in the parameter tends to increase the oscillation frequency and oscillation damping ratio; vice versa. The — symbol signifies that the impact of the parameter change on system stability is non-monotonic.
Among the aforementioned influencing factors, pitch angle compensation control emerges as particularly pivotal. As demonstrated in Figure 20, Figure 21, Figure 22 and Figure 23, its control parameters exert a significant influence on damping characteristics and may even induce frequency instability phenomena under specific operating conditions. When ULFOs occur in a power system dominated by wind and thermal power, it is recommended to increase the parameters k2 and k2 of the pitch angle compensation control. This approach enhances system damping and thereby significantly improves overall stability.

6. Conclusions

In high-penetration wind power systems, the research on how inertia control of DFIGs influences ULFOs still requires further exploration. Current ULFO research predominantly focuses on hydro-dominated power systems. The main contribution of this paper is as follows:
  • ULFOs induced by inertia control of DFIG are confirmed using eigenvalue analysis. The result indicates that inertia control in DFIGs is a contributing factor to the emergence of ULFOs.
  • An ESFR model is proposed and validated to further investigate the mechanism of ULFOs. To evaluate which control has a greater influence on the ULFO modes, the participation factor analysis is conducted.
  • Based on this, the factors influencing the ULFO are analyzed. It is found that pitch angle compensation control exerts the predominant impact on such oscillations. With the increase of the parameters k2 and k2, the ULFO can be effectively mitigated.
Future research can prioritize mechanistic analysis of ULFOs in large-scale hybrid systems with diverse renewable sources. Concurrently, developing advanced control schemes to enhance system damping for oscillation mitigation is imperative.

Author Contributions

Conceptualization, formal analysis, writing–original draft, W.F.; Data curation, methodology, resources, supervision, Y.Y.; Software, writing—review and editing, validation—funding acquisition, project administration, D.Z.; Investigation, B.Z.; Validation, B.B.; Conceptualization, visualization, writing—review and editing, Y.Z. All authors have read and agreed to the published version of the manuscript.

Funding

This work was supported by the China Southern Power Grid Company Science and Technology Project under the grant 036000KC23090005 (GDKJXM20231027).

Data Availability Statement

The original contributions presented in the study are included in the article; further inquiries can be directed to the corresponding author.

Conflicts of Interest

Authors Wei Fan and Yang Yi were employed by Electric Power Dispatching and Control Center of Guangdong Power Grid. The remaining authors declare that the research was conducted in the absence of any commercial or financial relationships that could be construed as a potential conflict of interest. The company had no role in the design of the study; in the collection, analyses, or interpretation of data; in the writing of the manuscript, or in the decision to publish the results.

Appendix A

Appendix A.1. Parameters of the Studied System

Table A1. Parameters of the studied system.
SymbolMeaning
KPTmThe partial derivative of Tm with respect to β
KωTmThe partial derivative of Tm with respect to ωr
GωP1(s)Transfer function of pitch angle control 1
GωP2(s)Transfer function of pitch angle control 2
GωTe(s)Transfer function of speed control
KωPmThe partial derivative of Pm with respect to ωr
KβPmThe partial derivative of Pm with respect to β
KMPPT0The partial derivative of ωrefMPPT with respect to Pe
G1(s)Transfer function between Δωr and ΔPe 1
G2(s)Transfer function between Δωr and ΔPe 2
G3(s)Transfer function of Meq(s)
G4(s)Transfer function of Madd(s)

Appendix A.2. Coefficients and Transfer Functions in the Linearized Model

Coefficients KPTm, KωTm, KωPm, KβPm, and KMPPT0 are given as
K P T m = T m β | β = β 0 , ω r = ω r 0
K ω T m = T m ω r | β = β 0 , ω r = ω r 0
K ω P m = P m ω r β = β 0 , ω r = ω r 0 , v w = v w 0
K β P m = P m β β = β 0 , ω r = ω r 0 , v w = v w 0
K MPPT 0 = 2 a P e 0 + b , MPPT   area 0 , constant   speed   area ,   constant   power   area
Transfer functions GωP1(s), GωP2(s), and GωTe(s) are given as
G ω P 1 ( s ) = k p p i t c h 1 s + k i p i t c h 1 s
G ω P 2 s = k p p i t c h 2 s + k i p i t c h 2 s
G ω T e s = k p ω s + k i ω s

Appendix A.3. The Validation of the Small-Signal Model
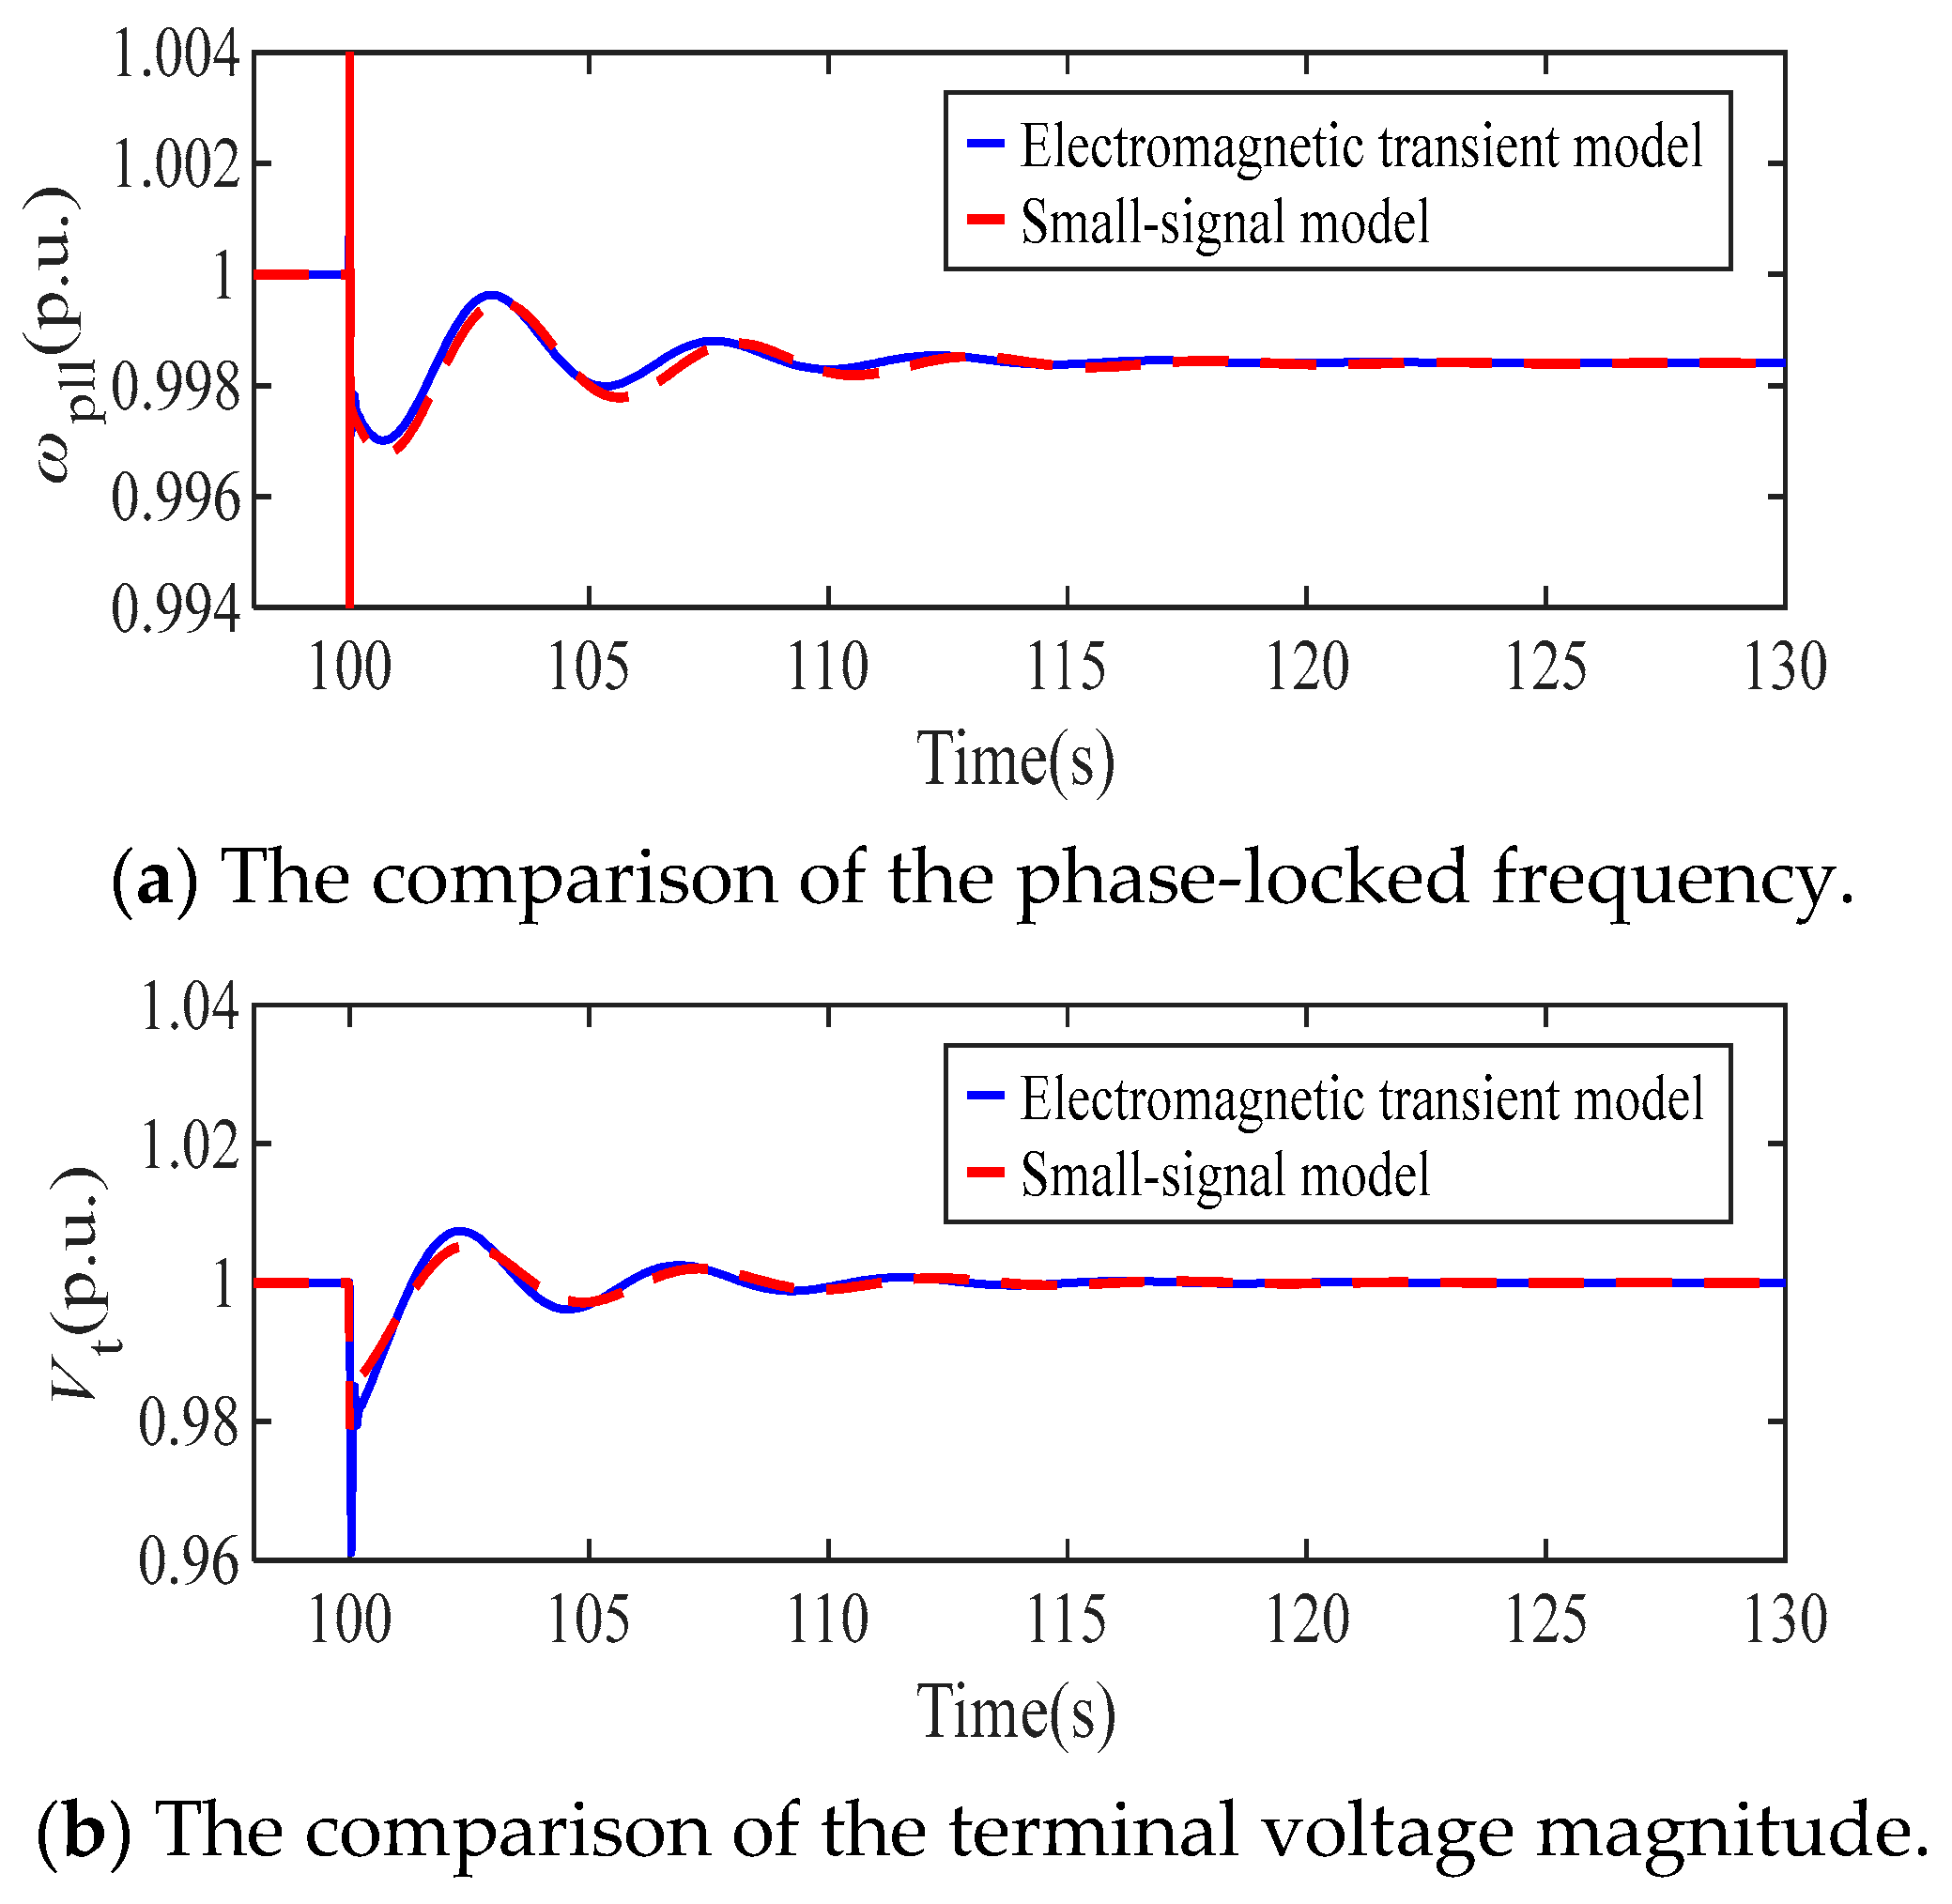
As shown in Figure A1, we perform the validation of the small-signal model in a single-machine system. Selecting the phase-locked frequency and terminal voltage magnitude as output variables, the outputs of the electromagnetic transient model and the small-signal model exhibit high consistency, which verifies the correctness of the small-signal model.
Figure A1. The validation of the small-signal model.
Energies 18 03365 g0a1

References

  1. Mo, W.; Chen, Y.; Chen, H.; Liu, Y.; Zhang, Y.; Hou, J.; Gao, Q.; Li, C.; Zhao, R. Analysis and Measures of Ultralow-Frequency Oscillations in a Large-Scale Hydropower Transmission System. IEEE J. Emerg. Sel. Top. Power Electron. 2018, 6, 1077–1085. [Google Scholar]
  2. Cebeci, M. The effects of Hydro Power Plant’s Governor Settings on the Turkish Power System Frequency. Master’s Thesis, Department of Electrical & Electronics Engineering, Middle East Technical University, Ankara, Turkey, 2008. [Google Scholar]
  3. Chen, G.; Liu, C.; Fan, C.; Han, X.; Shi, H.; Wang, G.; Ai, D. Research on Damping Control Index of Ultra-Low Frequency Oscillation in Hydro-Dominant Power Systems. Sustainability 2020, 12, 7316. [Google Scholar] [CrossRef]
  4. Pico, H.V.; McCalley, J.D.; Angel, A.; Leon, R.; Castrillon, N.J. Analysis of very low frequency oscillations in hydro-dominant power systems using multi-unit modeling. IEEE Trans. Power Syst. 2012, 27, 1906–1915. [Google Scholar] [CrossRef]
  5. Shen, J.Y.; Gong, K.Q.; Zhou, B. Ultralow Frequency Oscillation Induced by Primary Frequency Modulation of Hydropower and Parameter Optimization. J. Electr. Power 2018, 33, 392–398. [Google Scholar]
  6. Lu, X.M.; Chen, L.; Chen, Y.P.; Min, Y.; Hou, J.; Liu, Y.S. Ultra-low-frequency Oscillation of Power System Primary Frequency Regulation. Autom. Electr. Power Syst. 2017, 41, 67–70. [Google Scholar]
  7. Liu, C.X.; Zhang, J.F.; Chen, Y.P.; Zhang, J.X.; Xu, M.; Wang, G.H. Mechanism Analysis and Simulation on Ultra-ow Frequency Oscillation of Yunnan Power Grid in Asynchronous Interconnection Mode. South. Power Syst. Technol. 2016, 10, 29–34. [Google Scholar]
  8. Wang, P.; Li, B.; Zhao, J.; Liu, T.; Jiang, Q.; Chen, G. The Mechanism of Ultra-Low Frequency Oscillations with the Same Mode Shapes. IEEE Access 2020, 8, 198047–198057. [Google Scholar] [CrossRef]
  9. Shi, P. Wind Power Integrated Power System Small Signal Stability Analysis Based on Frequency Response Method; Zhejiang University: Zhejiang, China, 2019. [Google Scholar]
  10. Zhang, G.Z. Research on Low Frequency and Ultra-Low Frequency Stability Analysis and Control Strategy for Power Systems with High Renewable Energy Penetration; University of Electronic Science and Technology of China: Chengdu, China, 2022. [Google Scholar]
  11. Niasse, M.; Zheng, Q.; Xin, A.; Quan, F.A.F.; Simiyu, P. Mitigating Ultra-Low-Frequency Oscillations in Wind-Penetrated Hydro-dominant Power Grid through Virtual Inertia Emulation Strategy. In Proceedings of the 2020 4th International Conference on Power and Energy Engineering (ICPEE), Xiamen, China, 19–21 November 2020; pp. 130–137. [Google Scholar]
  12. Sun, L.; Zhao, X. Modelling and Analysis of Frequency-Responsive Wind Turbine Involved in Power System Ultra-Low Frequency Oscillation. IEEE Trans. Sustain. Energy 2021, 13, 844–855. [Google Scholar] [CrossRef]
  13. Zhang, T.; Zhou, T.; Bu, J.; Chen, L.; Xu, Z. Influence Mechanism Analysis of Wind Power Integration on Ultra-low Frequency Oscillation Based on Comprehensive Inertial Control. In Proceedings of the 2021 IEEE Sustainable Power and Energy Conference (iSPEC), Nanjing, China, 23–25 December 2021; 383–389. [Google Scholar]
  14. Zhou, Y.; Zhu, D.; Hu, J.; Zou, X.; Kang, Y. Collaborative design of multiloop controllers for DFIG-based wind turbines to optimize inertia characteristics. IEEE Trans. Power Electron. 2025, 40, 6177–6191. [Google Scholar] [CrossRef]
  15. Liu, L.; Luo, X.; Xiong, L.; Guo, J.; Liu, X.; Liu, Y.; Zhang, H. Preset Power Based Droop Control for Improving Primary Frequency Regulation of Inverters Under Large Disturbances. IEEE Trans. Power Electron. 2025, 40, 9153–9166. [Google Scholar] [CrossRef]
  16. Li, Z.L. Research and Analysis on Parameter Identification and Power System Stability of Steam Turbine Governing System; North China Electric Power University: Beijing, China, 2020. [Google Scholar]
  17. Du, Y.W.; Wang, Q.; Jiang, C.M.; Li, Z.H.; Luo, Y.Z. Comparison of Typical Speed Governor Model with Power System Primary Frequency Characteristics. Water Resour. Power 2017, 35, 163–167. [Google Scholar]
  18. Deng, L.; Gui, S.; Wang, Z.F.; Gao, T. Physics Resolution for Mathematics Model of Synchronous Generator. Northeast. Electr. Power Technol. 2012, 33, 5–7. [Google Scholar]
  19. Tang, W.; Hu, J.; Chang, Y.; Liu, F. Modeling of DFIG-Based Wind Turbine for Power System Transient Response Analysis in Rotor Speed Control Timescale. IEEE Trans. Power Syst. 2018, 33, 6795–6805. [Google Scholar] [CrossRef]
  20. Wei, H. Study of Electromechanical-Time Scale Characteristics of Doubly Fed Induction Generator Type Wind Turbine and its Impact on Power System Electromechanical Dynamics; Huazhong University of Science and Technology: Wuhan, China, 2018. [Google Scholar]
  21. Rimorov, D.; Kamwa, I.; Joós, G. Quasi-Steady-State Approach for Analysis of Frequency Oscillations and Damping Controller Design. IEEE Trans. Power Syst. 2016, 31, 3212–3220. [Google Scholar] [CrossRef]
  22. Vournas, C.D.; Mantzaris, J.C. Application of QSS Modeling to Stabilizer Design for Interarea Oscillations. IEEE Trans. Power Syst. 2010, 25, 1910–1917. [Google Scholar] [CrossRef]
  23. Chen, L.; Lu, X.M.; Chen, Y.P.; Min, Y.; Zhang, Y.; Tang, Z.Y. Analysis of Ultra-low-frequency Oscillations in Multi-machine System and Equivalent Method. Autom. Electr. Power Syst. 2017, 41, 10–15. [Google Scholar]
  24. Li, G.Q.; Liu, X.Z.; Xin, Y.C.; Jiang, T.; Yan, K.F.; Wang, T. Research on Frequency Stability of Power System with High Penetration Renewable Energy: A Review. High Volt. Eng. 2024, 50, 1165–1181. [Google Scholar]
Figure 1. A two-machine model for a system with DFIG.
Energies 18 03365 g001
Figure 2. Model of steam turbine SG [16,17].
Energies 18 03365 g002
Figure 3. Control block diagram of DFIG with inertia control [19].
Energies 18 03365 g003
Figure 4. Linearization block diagram [20].
Energies 18 03365 g004
Figure 5. ESFR for multi-machine systems [24].
Energies 18 03365 g005
Figure 6. Simplified ESFR for two-machine system.
Energies 18 03365 g006
Figure 7. The wind turbine operates in various operational areas.
Energies 18 03365 g007aEnergies 18 03365 g007b
Figure 8. The influence of inertia control on the ULFO.
Energies 18 03365 g008
Figure 9. The wind turbine operates in varying operational conditions.
Energies 18 03365 g009
Figure 10. Bode diagram of GSG(s) and sΣM(s).
Energies 18 03365 g010
Figure 11. The physical process of the inertia control.
Energies 18 03365 g011
Figure 12. Bode diagram comparison of equivalent inertia.
Energies 18 03365 g012
Figure 13. Participation factors under the dominant modal conditions.
Energies 18 03365 g013
Figure 14. Bode diagrams of inertia under different parameters of k. (a) sMadd(s), (b) sΣM(s) and GSG(s).
Energies 18 03365 g014
Figure 15. Curves of the system frequency under different k.
Energies 18 03365 g015
Figure 16. Bode diagrams of inertia under different parameters of k. (a) sMadd(s), (b) sΣM(s) and GSG(s).
Energies 18 03365 g016
Figure 17. Curves of the system frequency under different k.
Energies 18 03365 g017
Figure 18. Bode diagrams of inertia under different parameters of kpβ1. (a) sMadd(s) (b) sΣM(s) and GSG(s).
Energies 18 03365 g018
Figure 19. Curves of the system frequency under different k1.
Energies 18 03365 g019
Figure 20. Bode diagrams of the inertia under different parameters of kpβ2. (a) sMadd(s), (b) sΣM(s) and GSG(s).
Energies 18 03365 g020
Figure 21. Curves of the system frequency under different k2.
Energies 18 03365 g021
Figure 22. Bode diagrams of inertia under different parameters of k2. (a) sMadd(s), (b) sΣM(s) and GSG(s).
Energies 18 03365 g022
Figure 23. Curves of the system frequency under different k2.
Energies 18 03365 g023
Figure 24. Inertia Bode diagrams with and without MPPT control. (a) sMadd(s), (b) sΣM(s) and GSG(s).
Energies 18 03365 g024
Figure 25. Curves of the system frequency with and without MPPT control.
Energies 18 03365 g025
Figure 26. The extended three-machine, nine-bus system.
Energies 18 03365 g026
Figure 27. Simulation results when (a) k2 and (b) k2 changes.
Energies 18 03365 g027
Table 1. Modal calculations without frequency regulation control.
ModalEigenvalueOscillation
Frequency
Damping
Ratio
λ1,2−0.336 ± j 0.177 0.028 Hz 0.884
λ3,4−0.635 ± j 0.508 0.081 Hz 0.781
λ5,6−3.163 ± j 20.43 3.252 Hz 0.153
Table 2. Modal calculations with frequency regulation control.
ModalEigenvalueOscillation
Frequency
Damping
Ratio
λ1,2−0.092 ± j 0.307 0.049 Hz 0.287
λ3,4−0.155 ± j 0.056 0.009 Hz 0.941
λ5,6−2.154 ± j 0.868 0.138 Hz 0.928
λ7,8−15.09 ± j 15.38 2.448 Hz 0.700
Table 3. The changing trend of the ULFO as each parameter increases.
Parameterkpωkiωkpβ1kpβ2kiβ2Introducing MPPT
Oscillation Frequency
Oscillation Damping Ratio
Disclaimer/Publisher’s Note: The statements, opinions and data contained in all publications are solely those of the individual author(s) and contributor(s) and not of MDPI and/or the editor(s). MDPI and/or the editor(s) disclaim responsibility for any injury to people or property resulting from any ideas, methods, instructions or products referred to in the content.