
Research on Multi-Cycle Injection–Production Displacement Characteristics and Factors Influencing Storage Capacity in Oil Reservoir-Based Underground Gas Storage


Abstract
1. Introduction
2. Basic Overview of the Oil Reservoir
2.1. Characteristics of the Oil Reservoir
2.2. Fluid Properties
2.3. Temperature and Pressure Systems
3. Materials and Methods
3.1. Microscopic Displacement Experiment
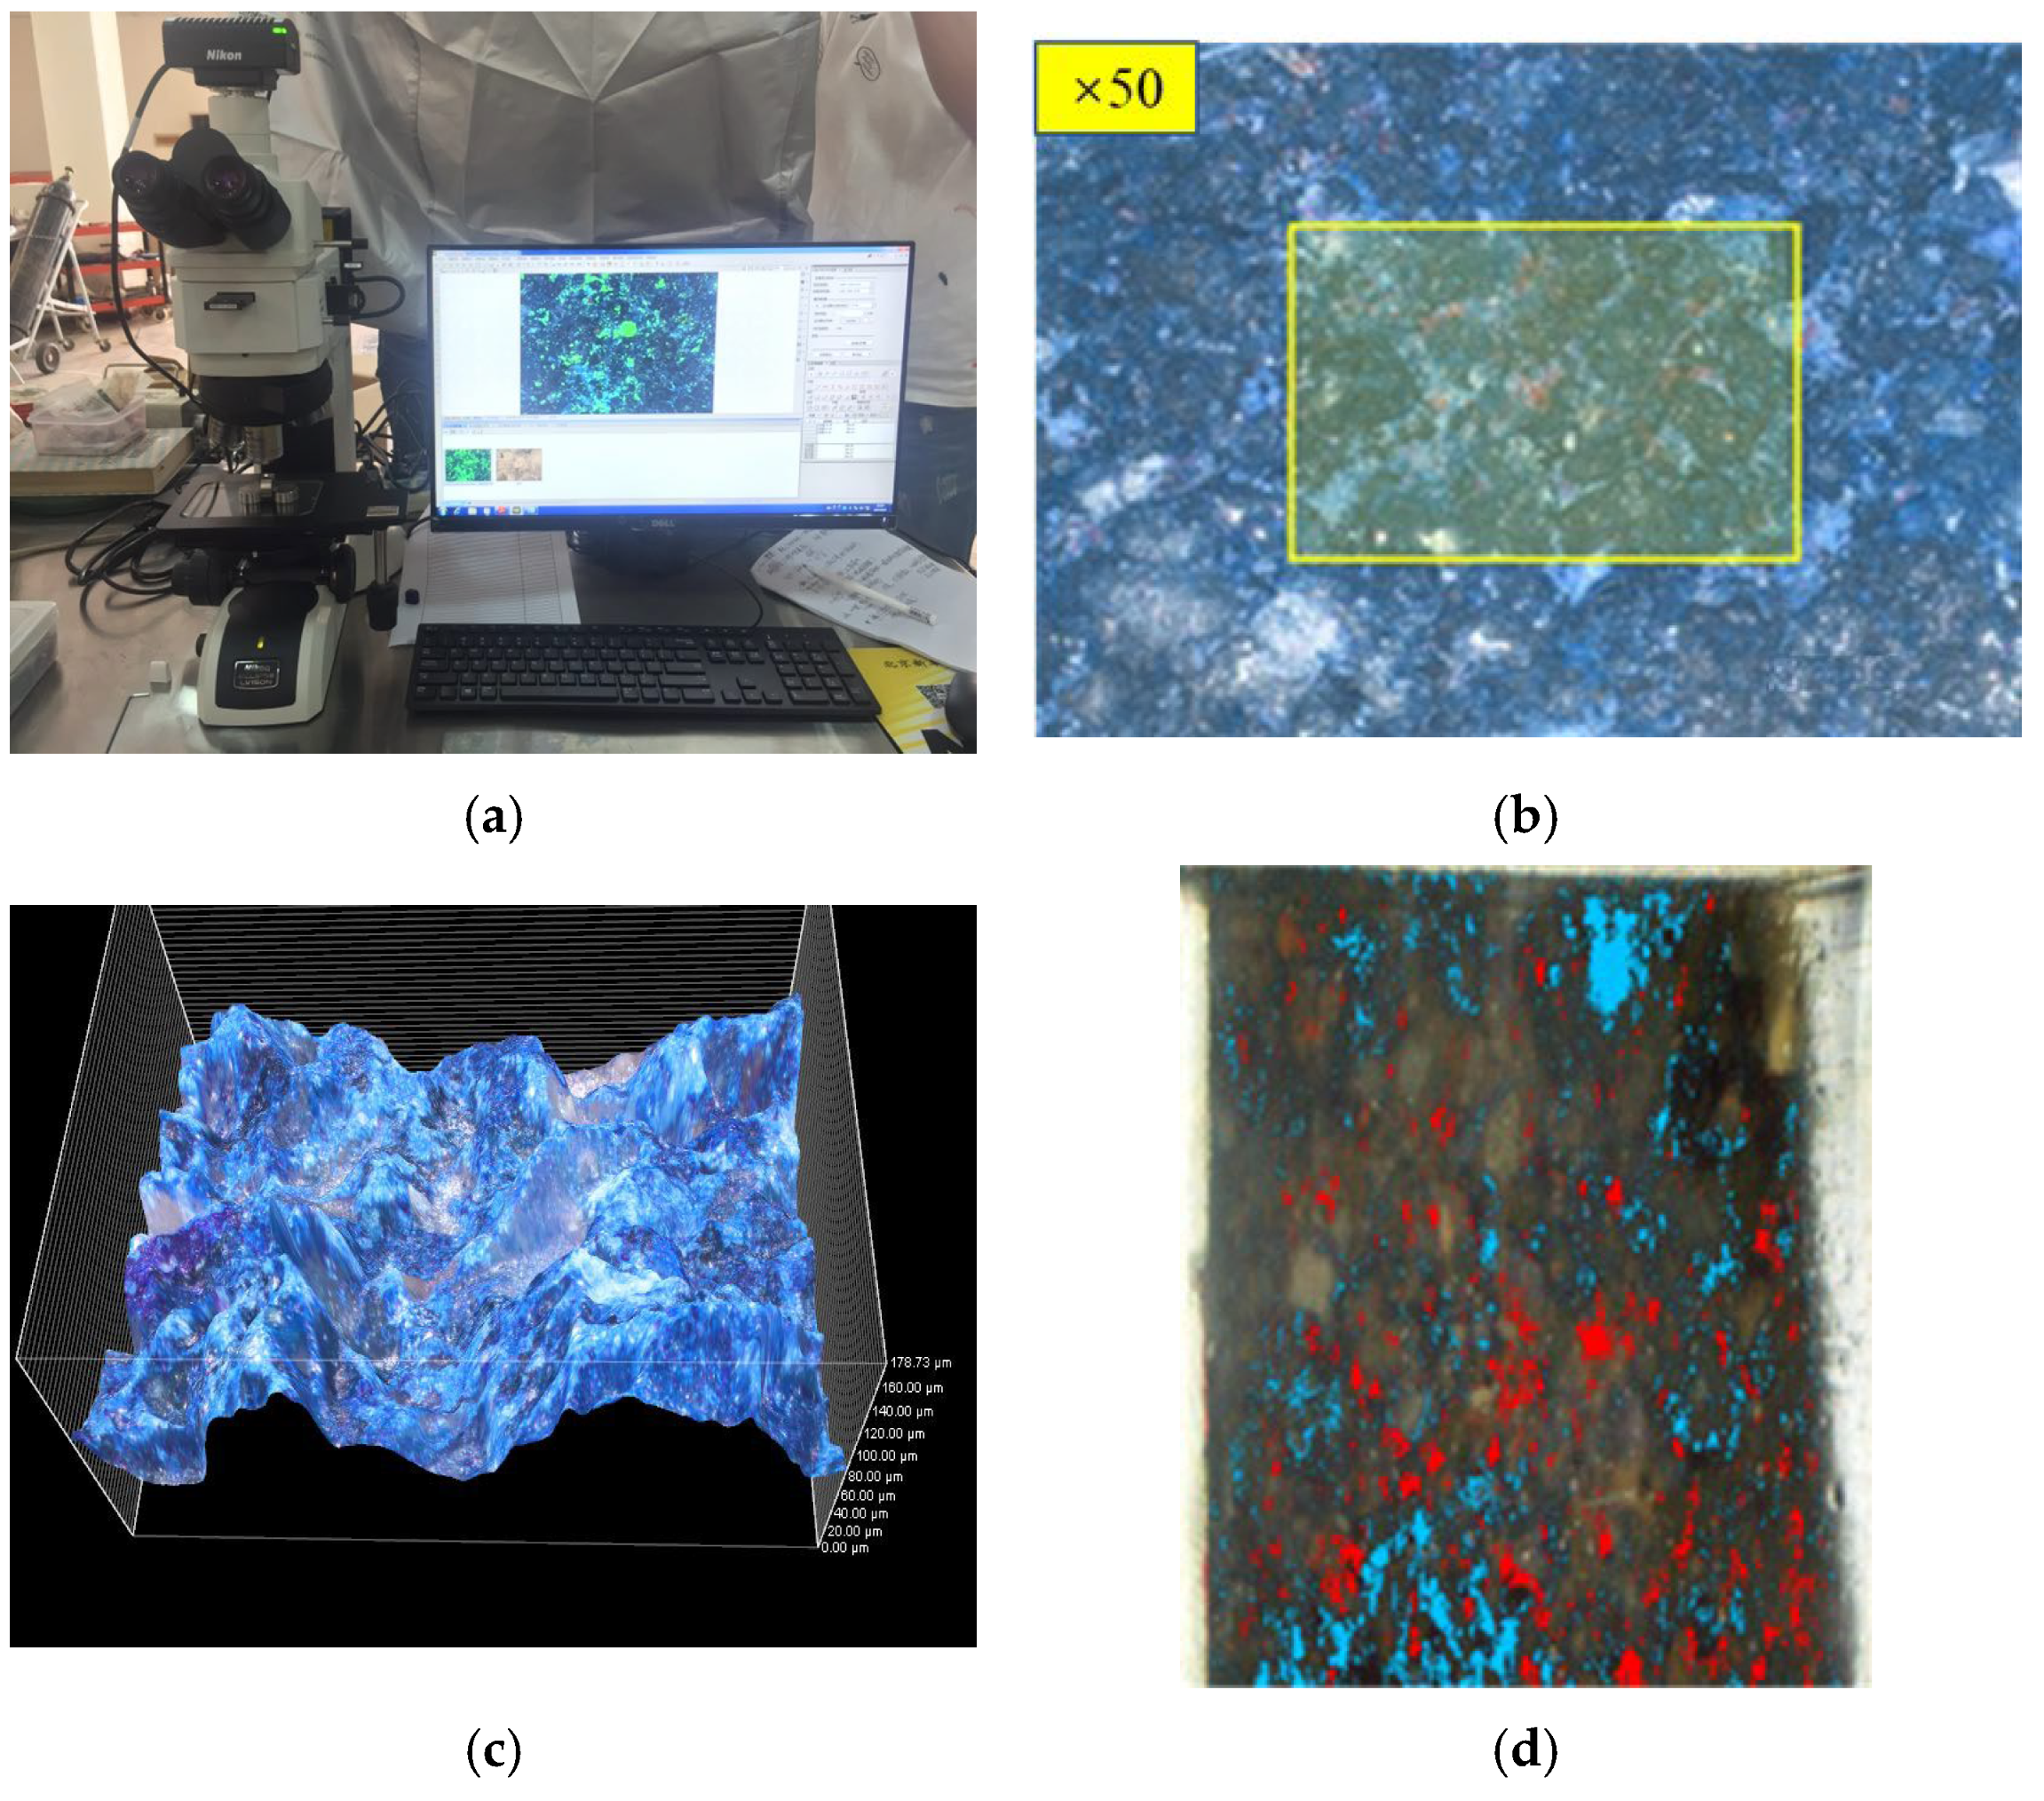
3.1.1. Experimental Preparation
- (a)
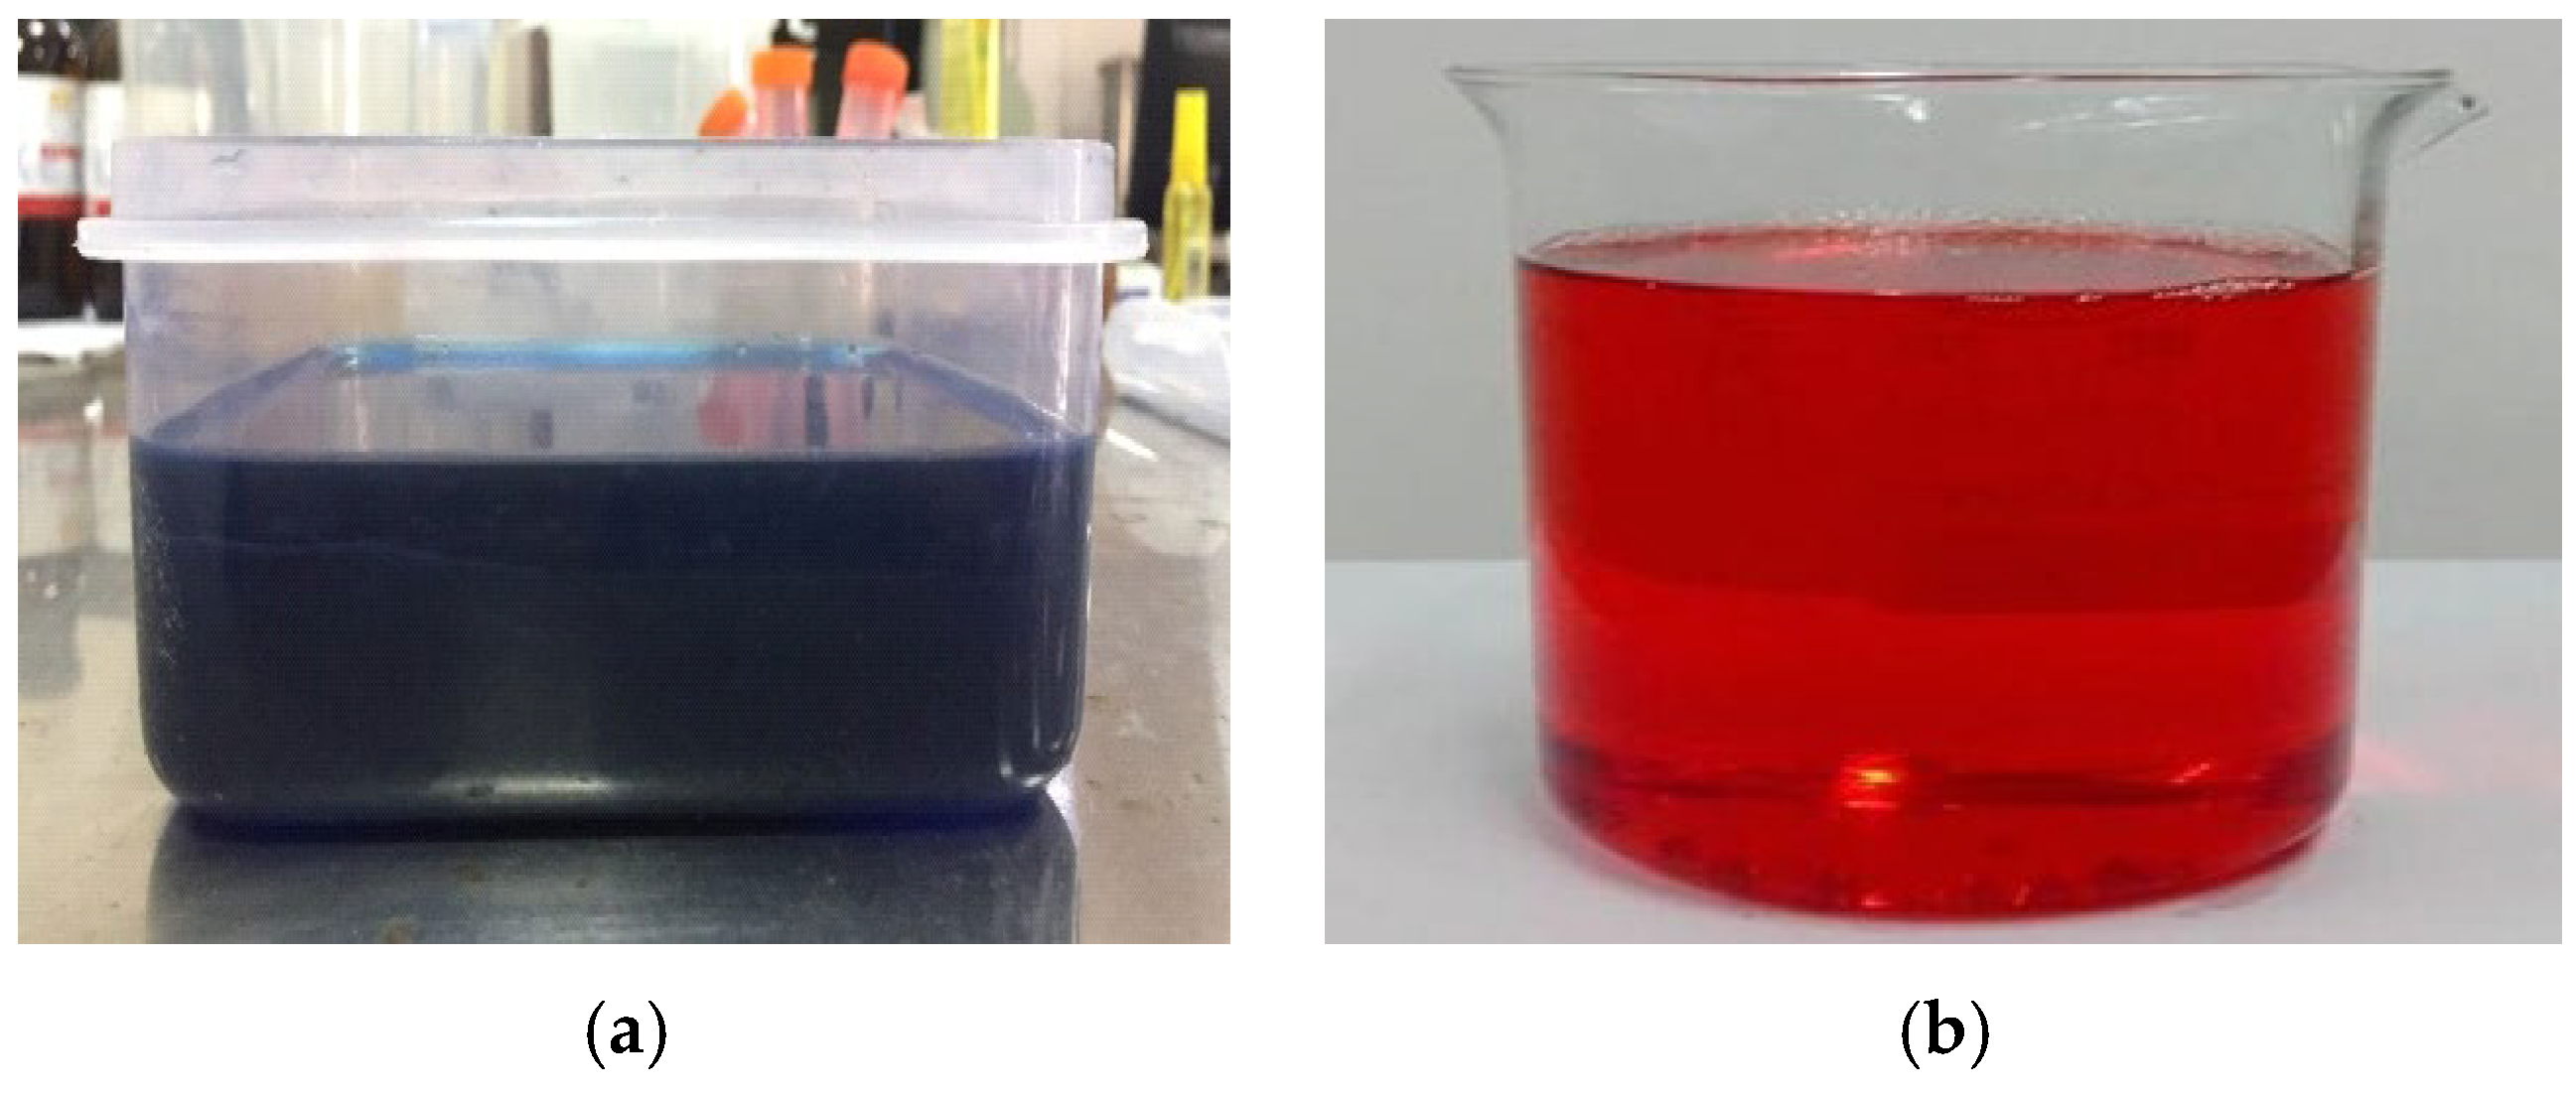
- Image Acquisition and Preprocessing: Microscopic imaging, adding different colored tracers to the oil and water phases, image calibration, and preprocessing.
- (b)
- Phase Separation: Accurately classify the pixels in the images into the oil phase, water phase, and rock matrix (boundary of pore space).
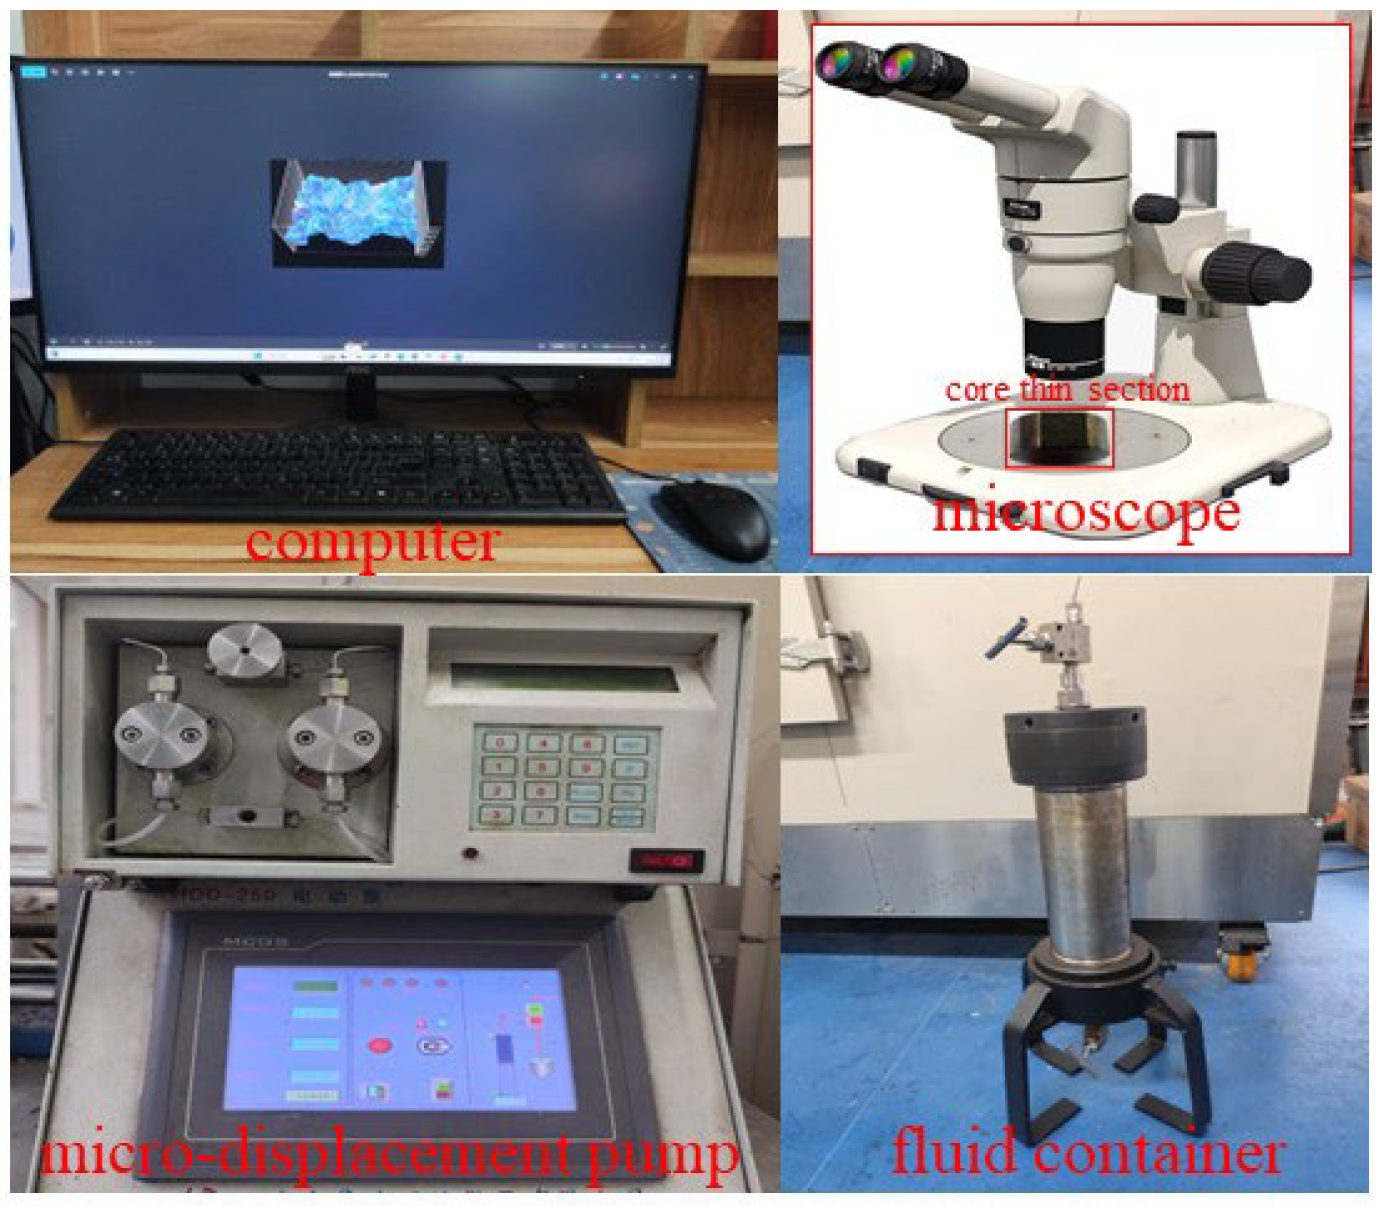
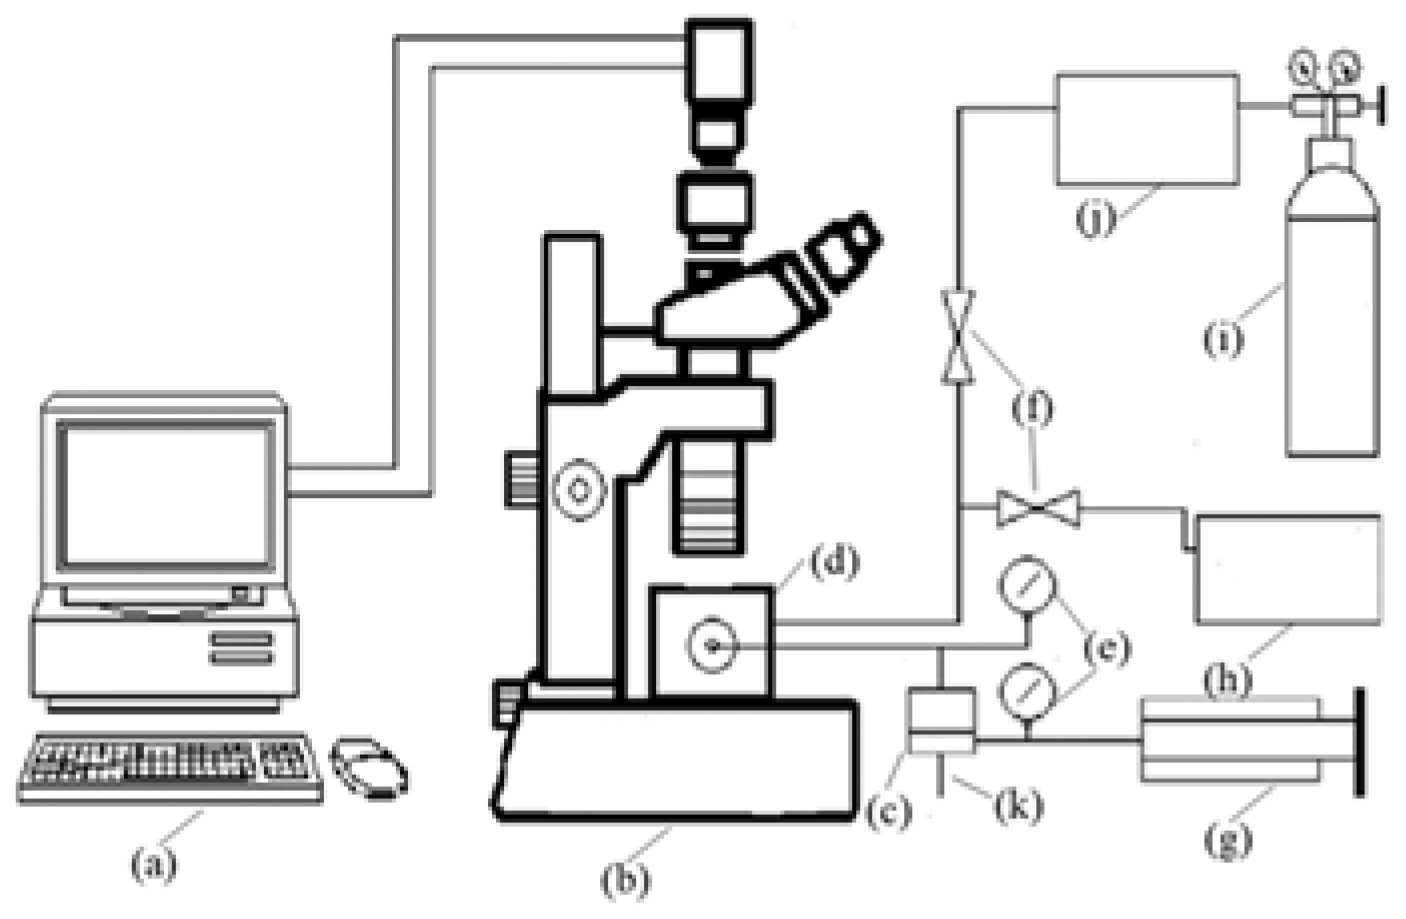
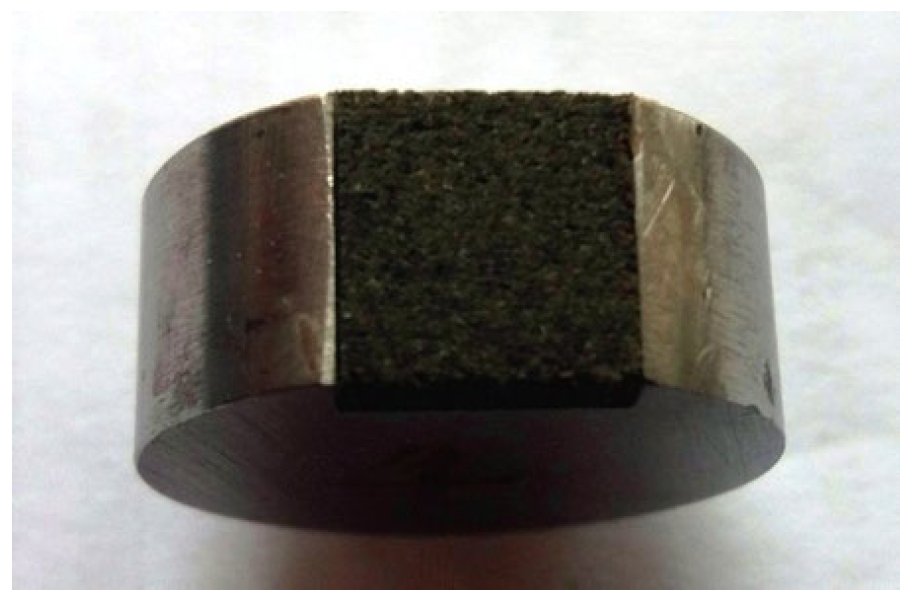
3.1.2. Experimental Procedure
- (a)
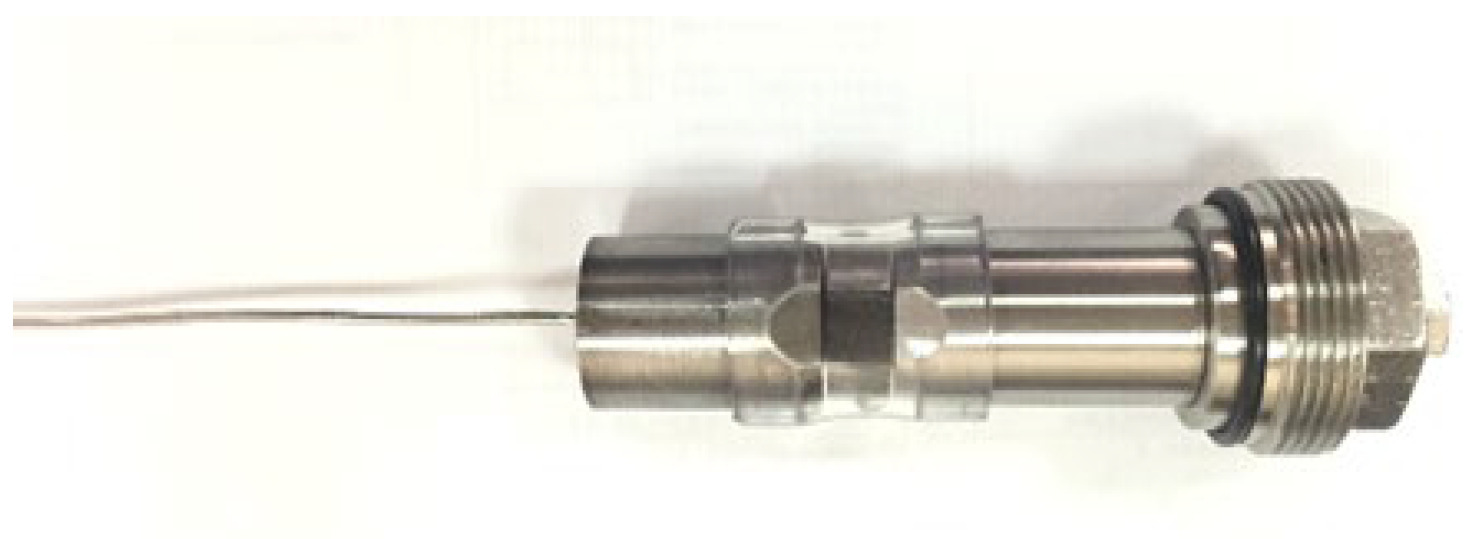
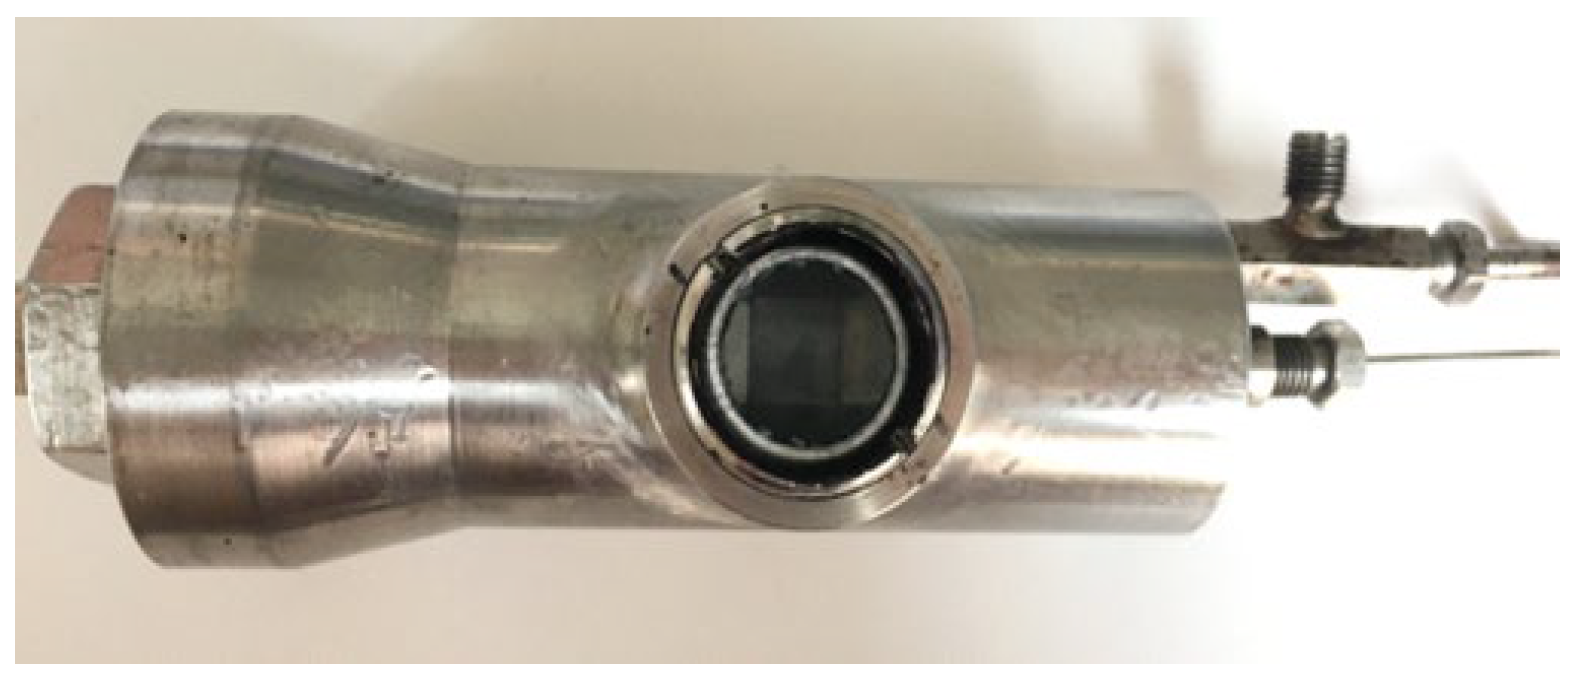
- Cut core samples to make thin sections, which are then placed into the holder and connected to the pipelines.
- (b)
- Apply confining pressure and saturate the core thin sections with light-colored formation water to establish the initial water saturation.
- (c)
- Adjust the equipment and select the imaging area of the core model.
- (d)
- Displace the core thin section saturated with formation water using simulated oil and observe the images until there is no further change in the images.
- (e)
- Gas flooding for oil displacement: Inject N2 into the thin-section core model saturated with simulated oil, and continuously capture images of the designated imaging area of the thin-section core model. Observe the dynamic process of the images.
- (f)
- Water flooding followed by gas flooding for oil displacement: Inject dyed formation water into the thin-section core model saturated with simulated oil, and continuously capture images of the designated imaging area of the thin-section core model. Observe the dynamic process of the images and record them. Stop the injection when there is no further change in the images. Then, switch to N2 flooding for displacement, observe the dynamic process of the images again, and record them. Stop the N2 injection when there is no further change in the images.
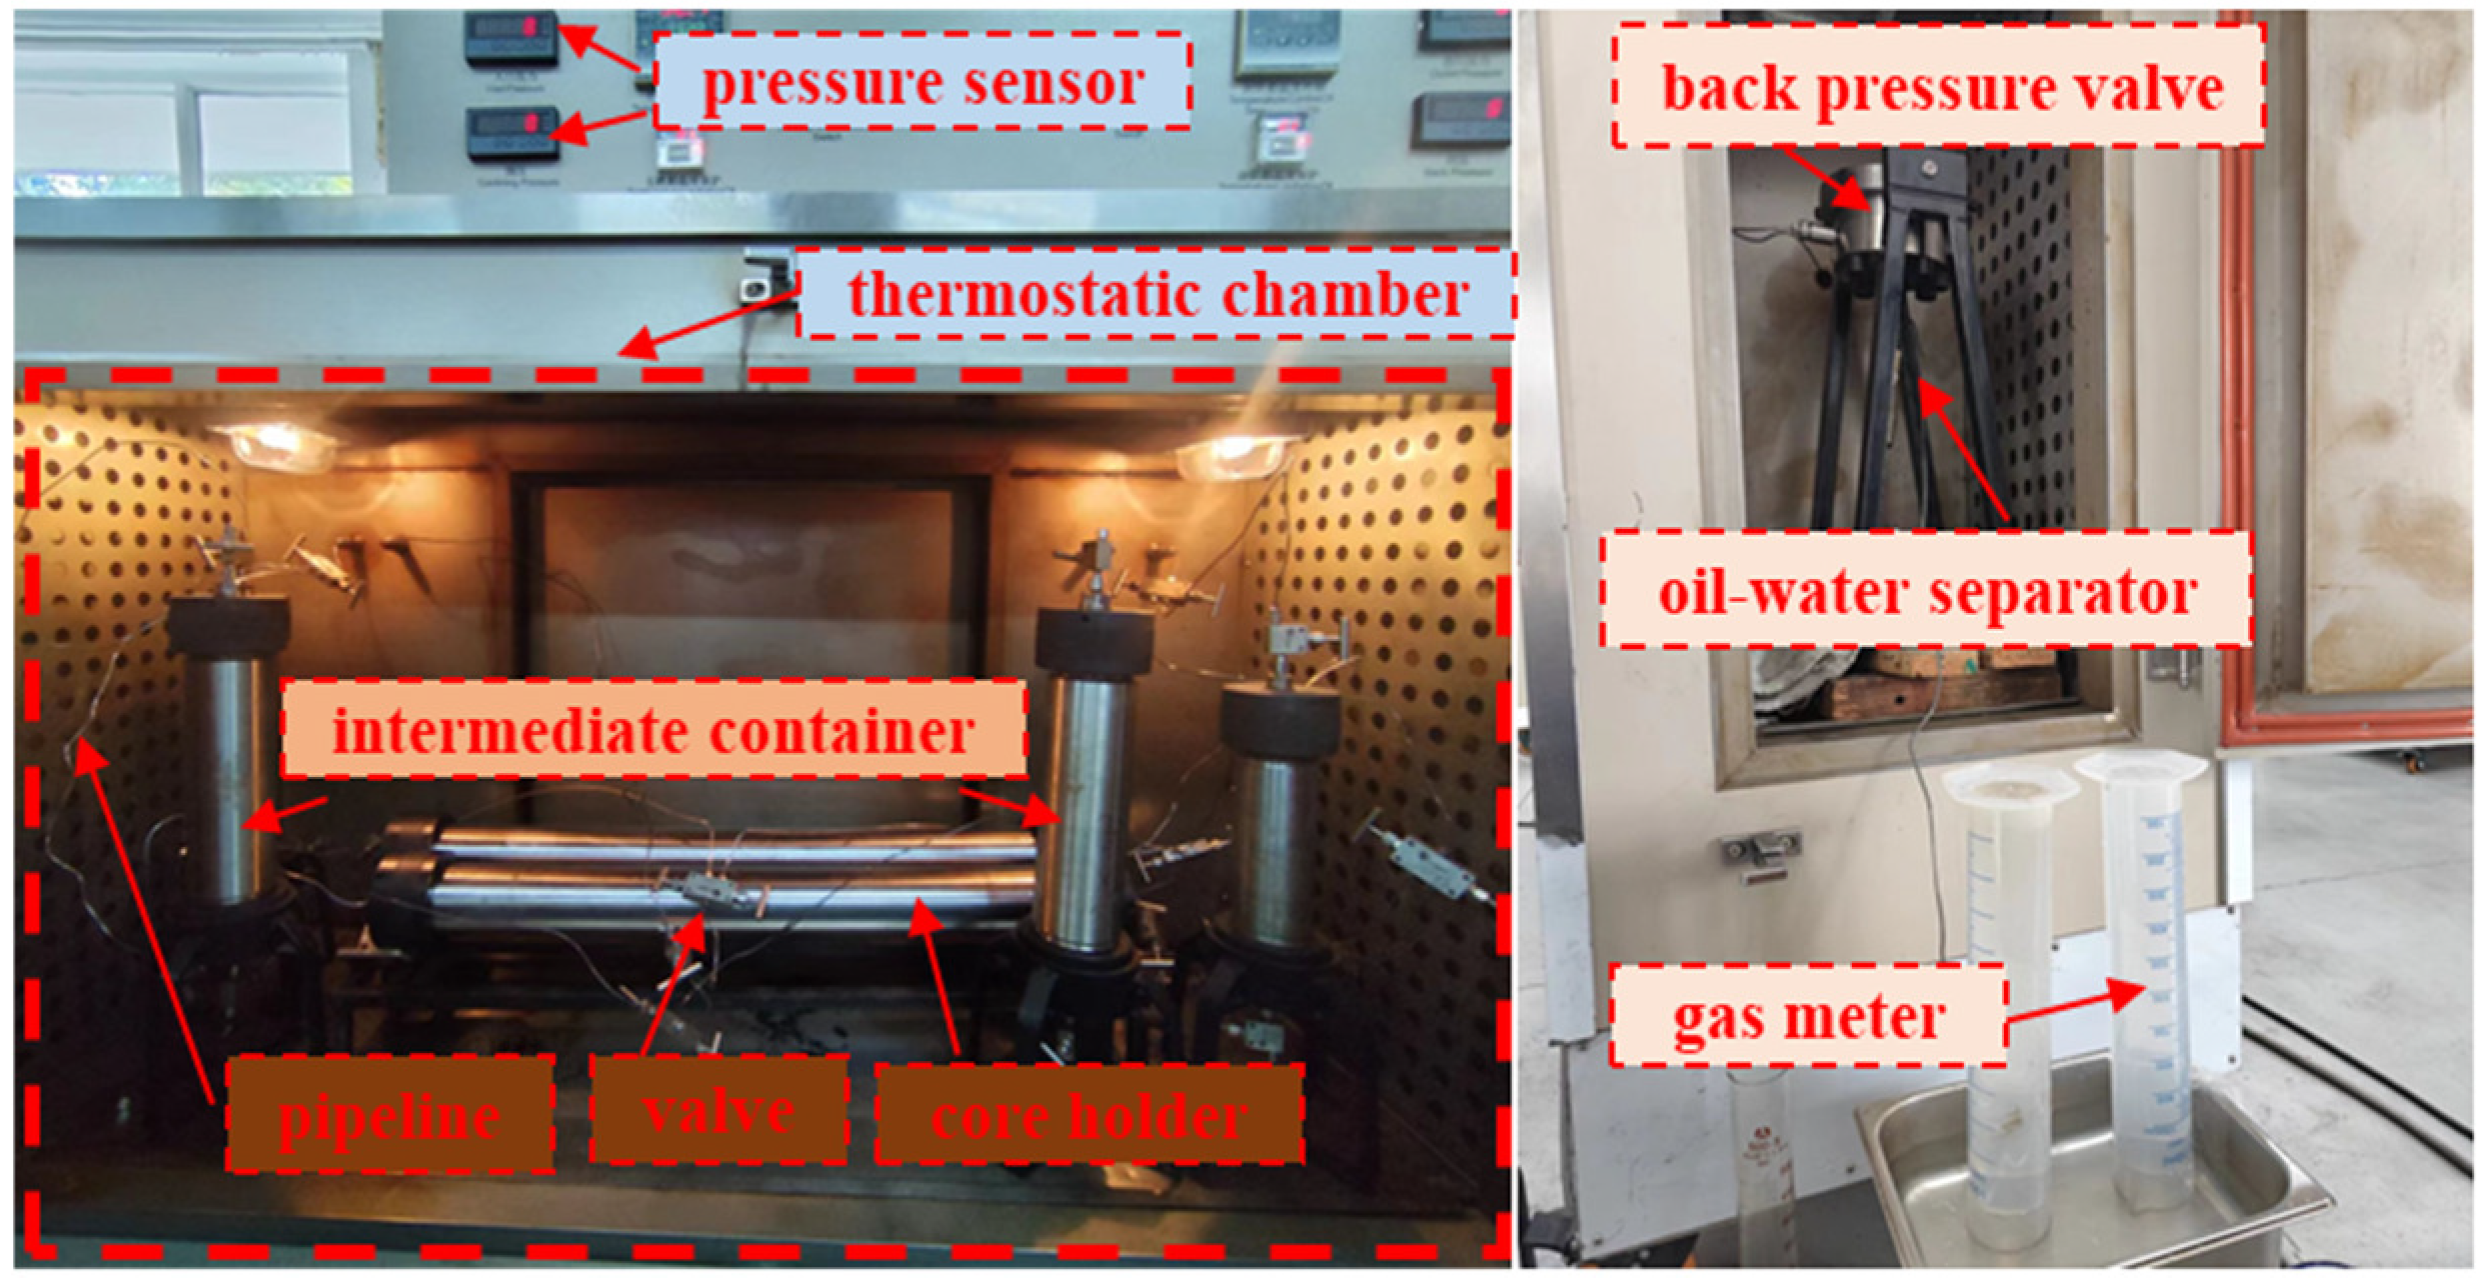
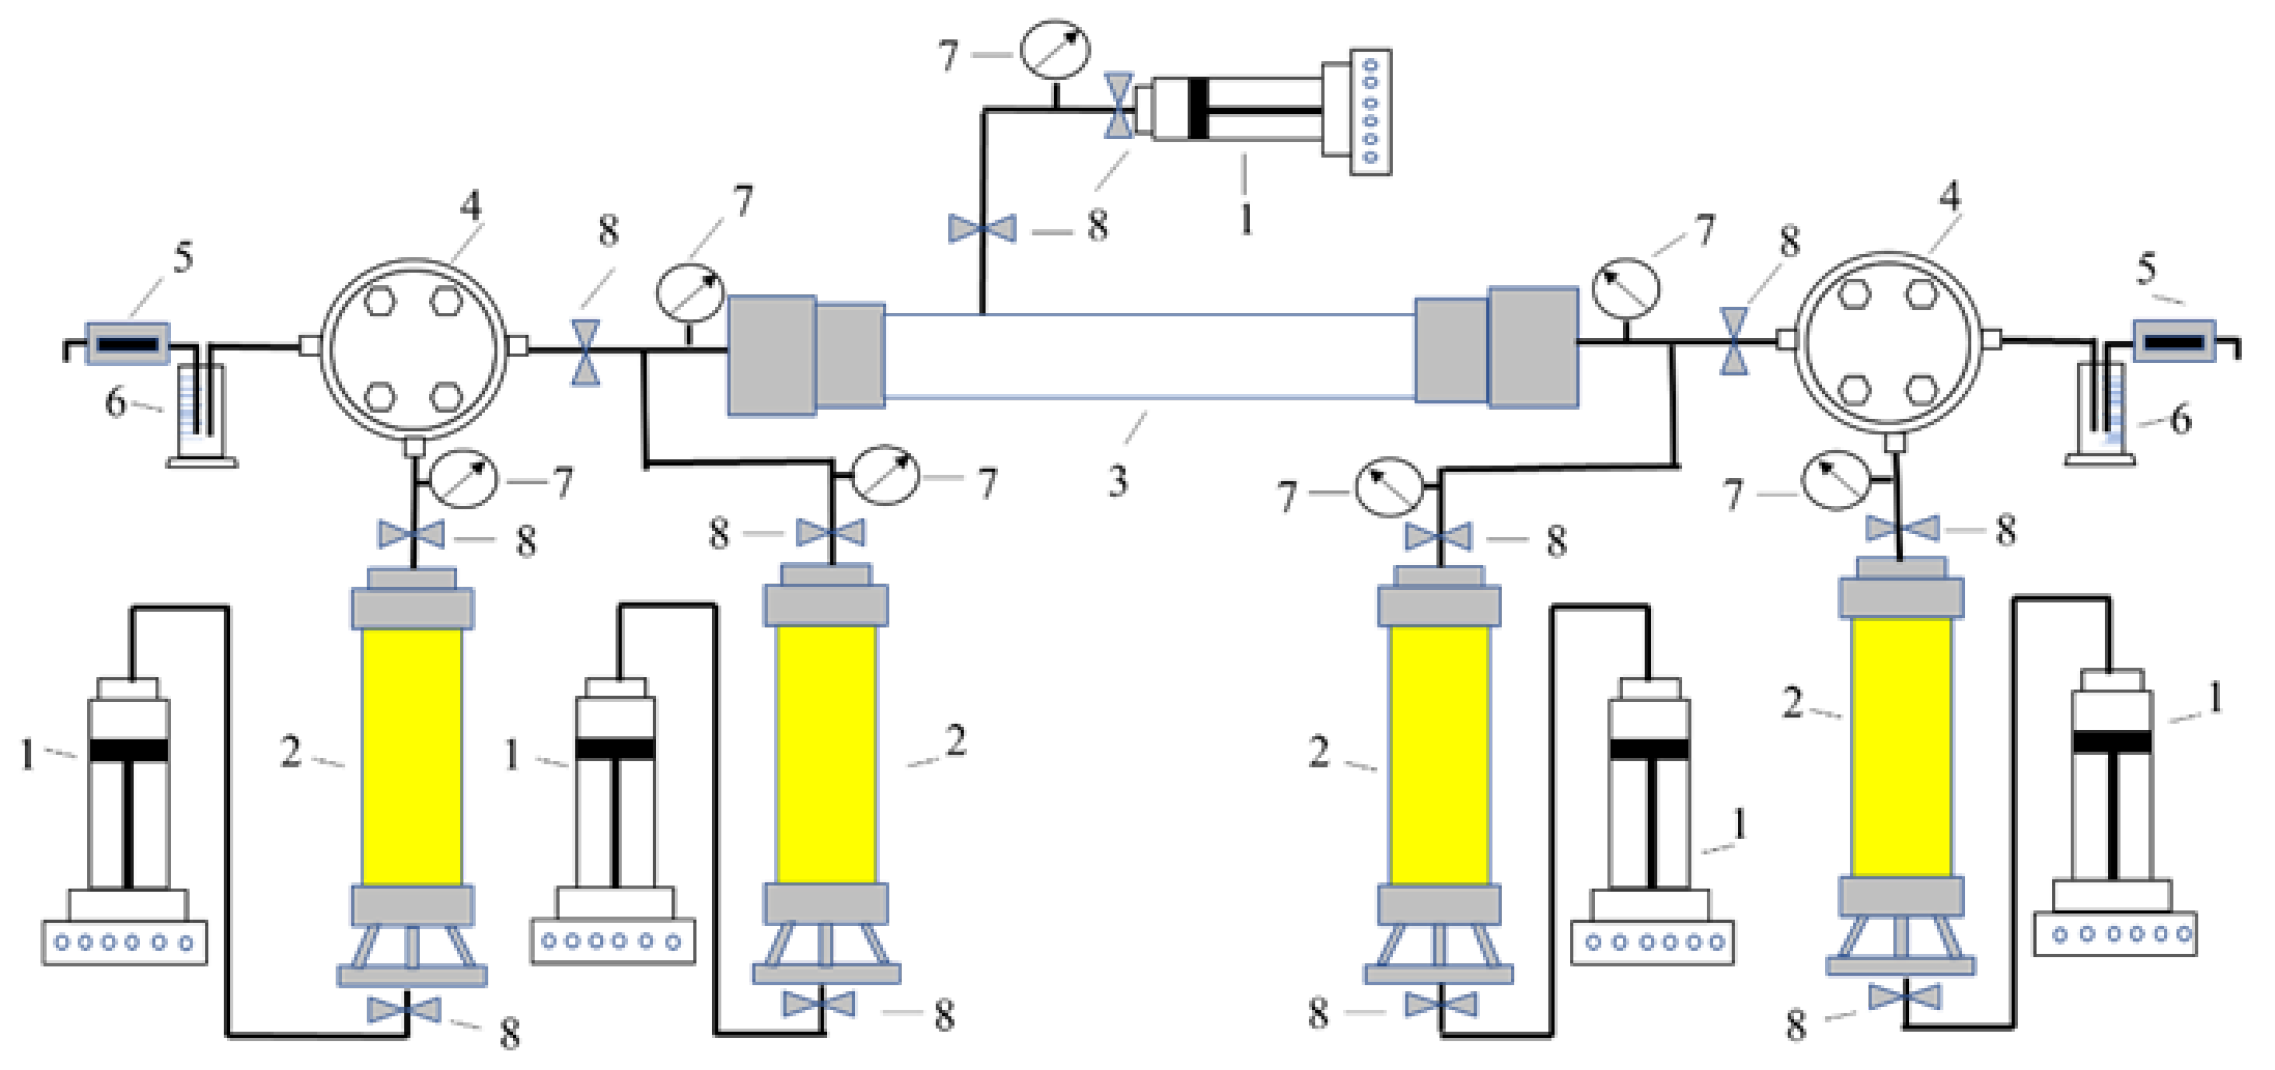
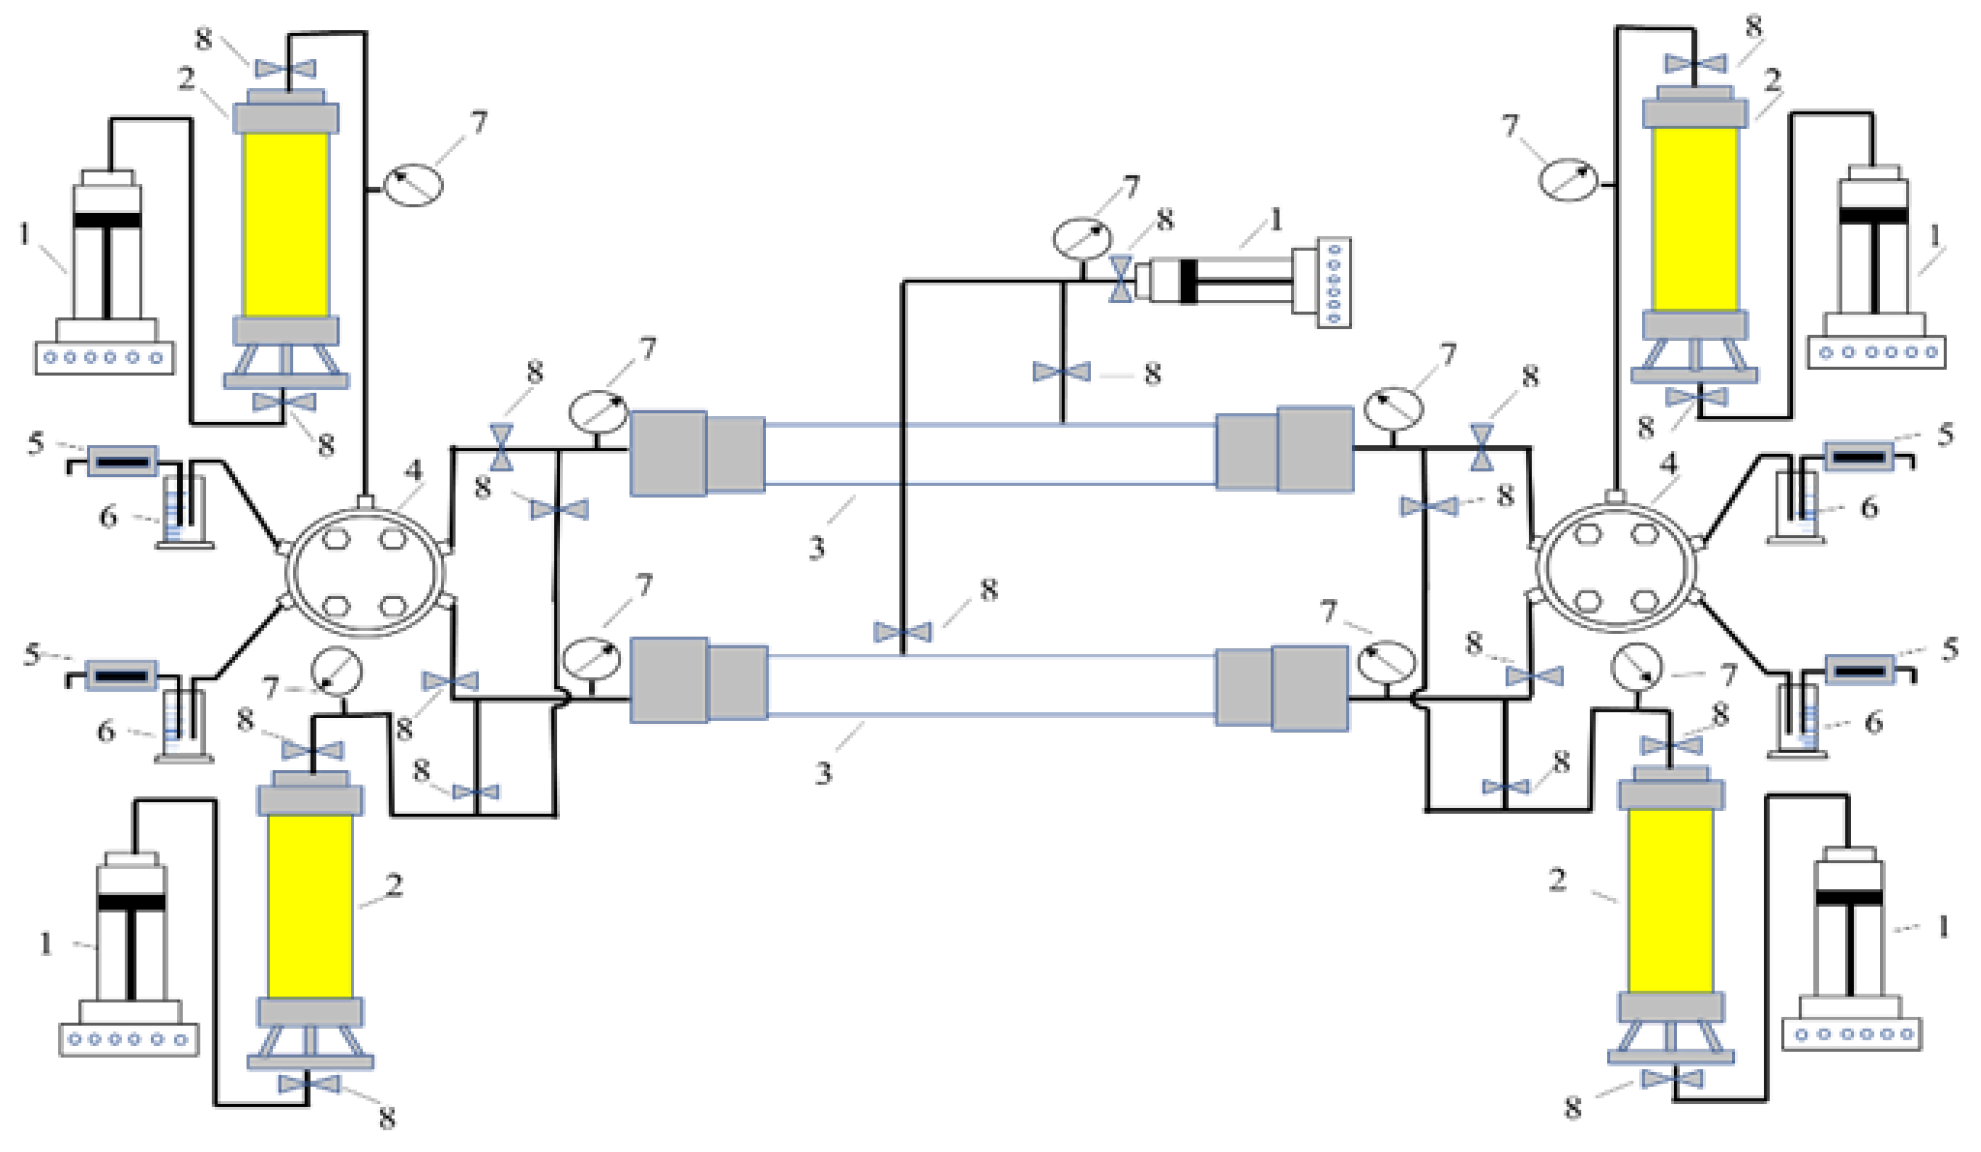
3.2. Long-Core Displacement Experiment
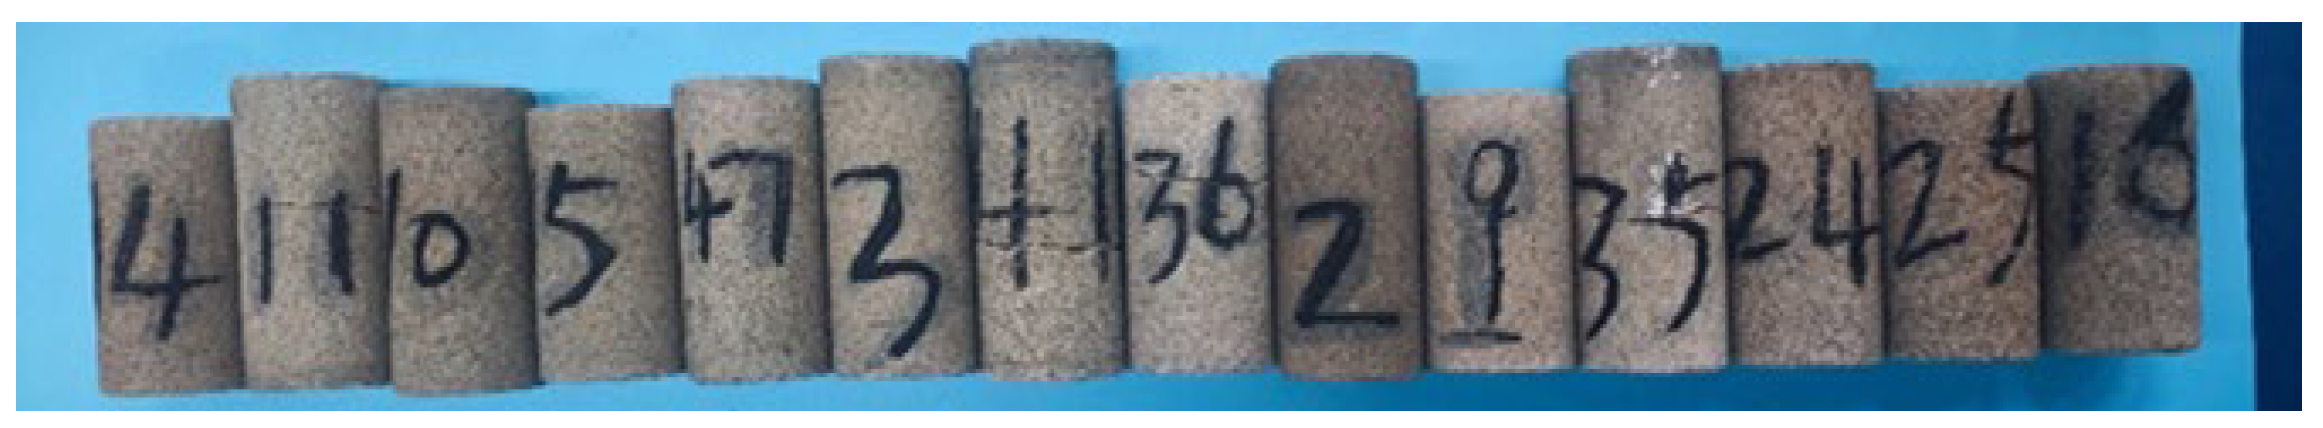
3.2.1. Experimental Preparation
3.2.2. Experimental Design
3.2.3. Experimental Procedure
- (a)
- The irreducible water saturation was established through the following experimental procedure: First, the long-core samples were sorted according to harmonic mean permeability and loaded into a long-core holder. After vacuum pumping to remove residual gases, the cores were saturated with formation water under controlled pressure. Subsequently, surface-degassed crude oil was injected to displace the formation water under reservoir conditions, thereby establishing the target irreducible water saturation.
- (b)
- The fluid displacement experimental conditions were established by injecting reconstituted reservoir crude oil to displace surface-degassed oil under simulated reservoir temperature and pressure conditions. The displacement process was maintained until a constant producing gas–oil ratio was achieved at the outlet.
- (c)
- After establishing the experimental fluid conditions, the core flooding tests were systematically conducted. Following each experimental run, the core was thoroughly cleaned using toluene/methanol azeotrope (7:3 v/v) to restore initial wettability. The standardized procedures (a) vacuum saturation and (b) initial fluid saturation were then repeated prior to subsequent tests. This protocol was rigorously executed for all five experimental sets to ensure data reproducibility.
4. Results
4.1. Multi-Cycle Seepage Characteristics
4.2. Impact of Injection–Production Strategies on Displacement Efficiency and Storage Capacity
4.2.1. Depletion Regime
4.2.2. Non-Depletion Regime
4.2.3. Comparative Analysis
4.3. Impact of Permeability Contrast on Displacement Efficiency and Storage Capacity
5. Conclusions
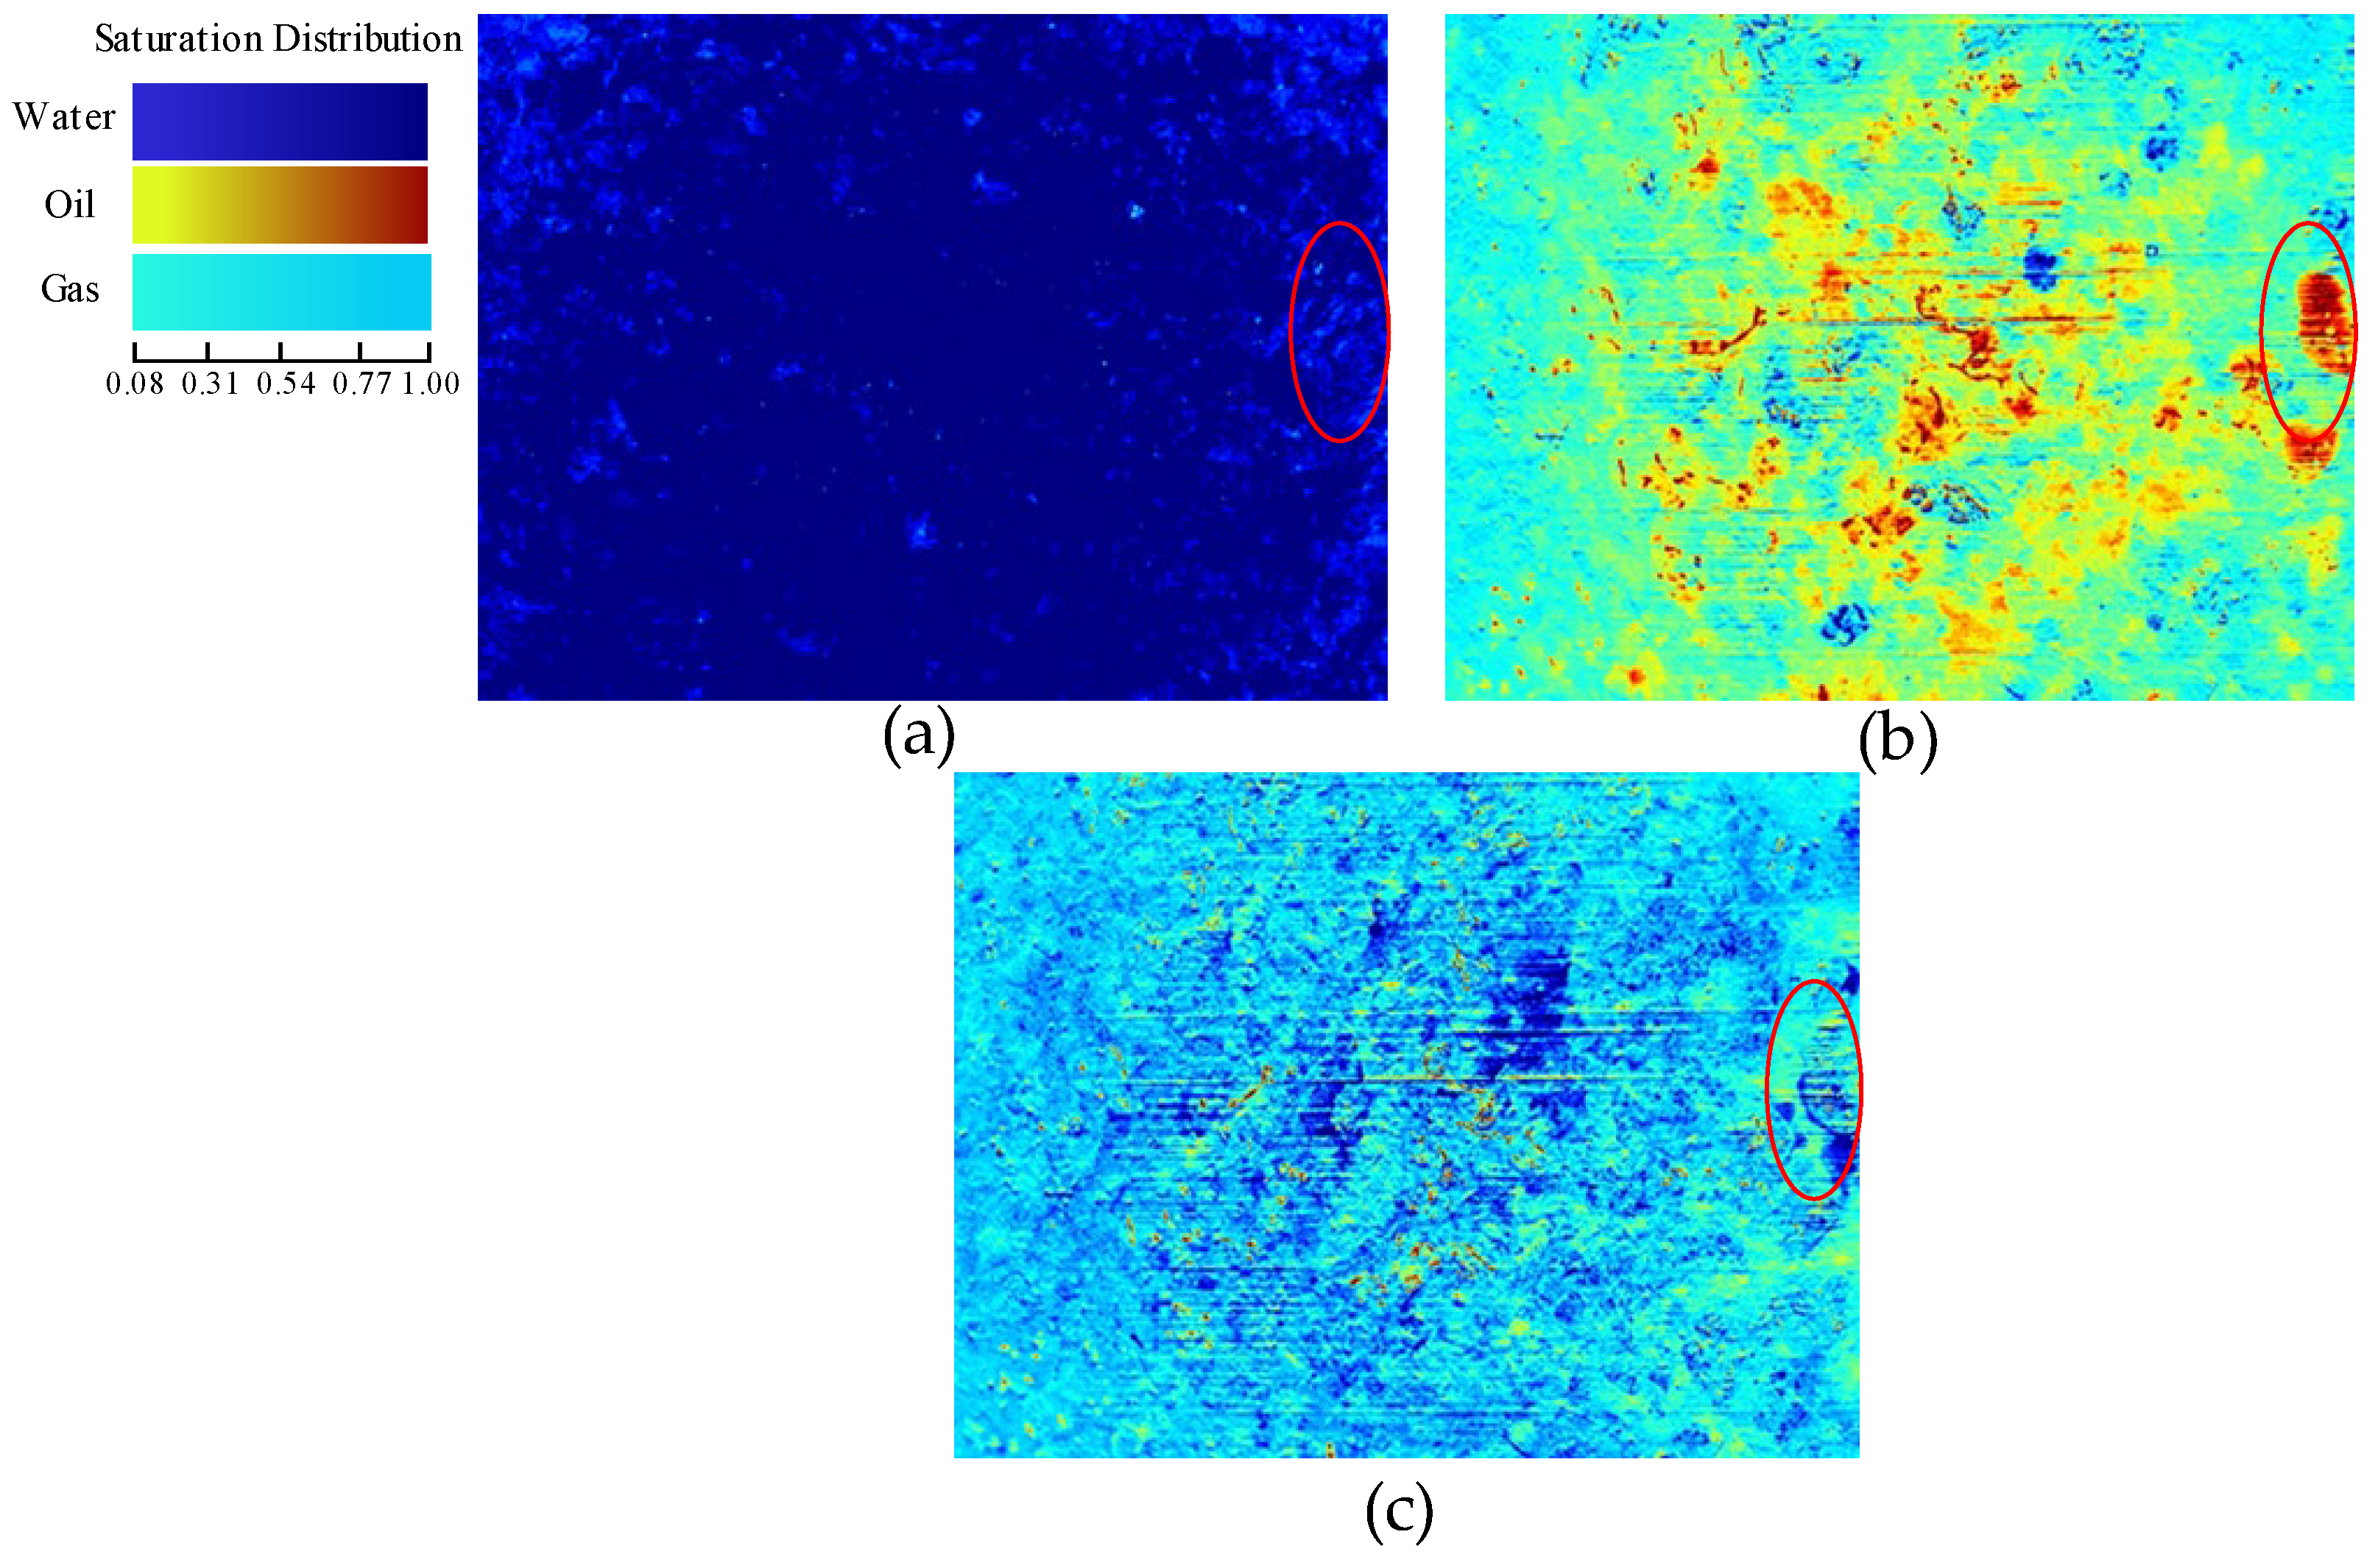
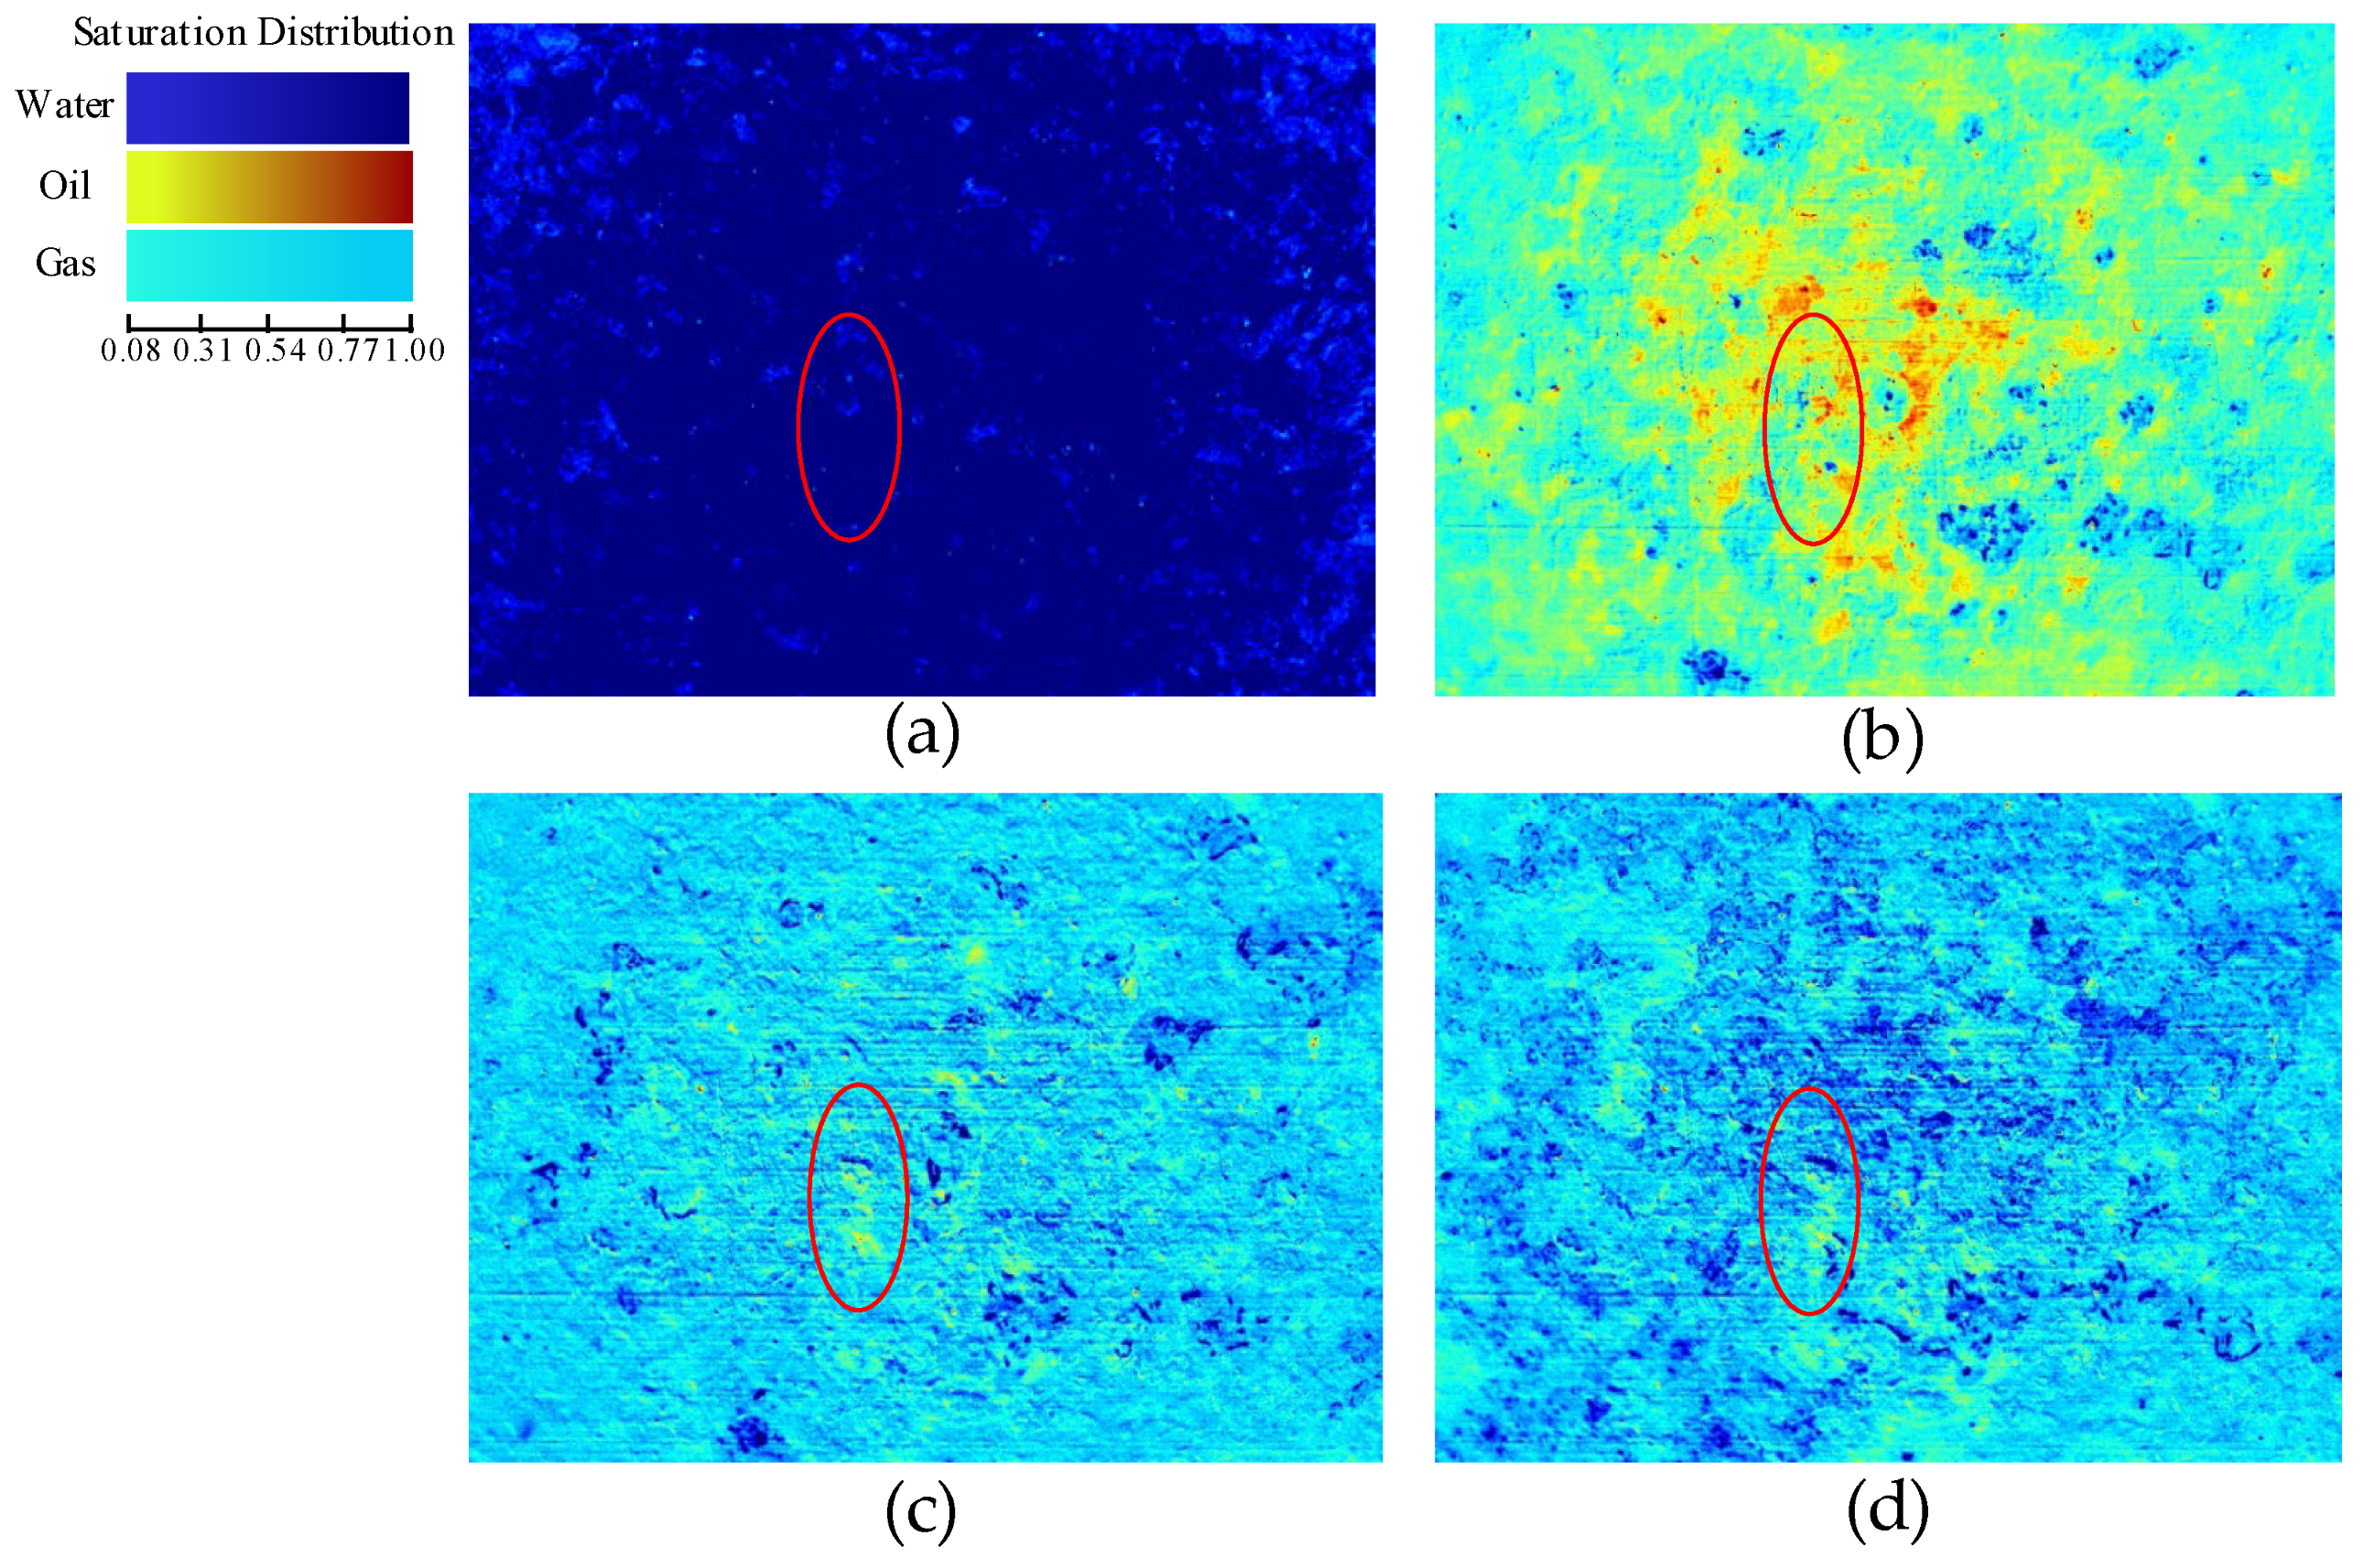
- (1)
- Microscopic displacement experiments indicate that as the gas injection time increases, the gas sweep area expands, and the contact area between the gas and liquid phases also continuously enlarges. As a result, the simulated oil is progressively displaced, and the decline in liquid saturation is significant. The remaining oil is primarily distributed in the dead pores and tiny pores of the core in the form of micro-bead chains and films. After the displacement process, professional software was used to calculate the oil displacement efficiency, which was found to be 41.85% for gas flooding and 60.46% for the transition from water flooding to gas flooding. This suggests that gas injection can further displace the simulated oil that was not reached by water flooding, thereby reducing the liquid saturation and increasing the storage capacity space by 2.17%.
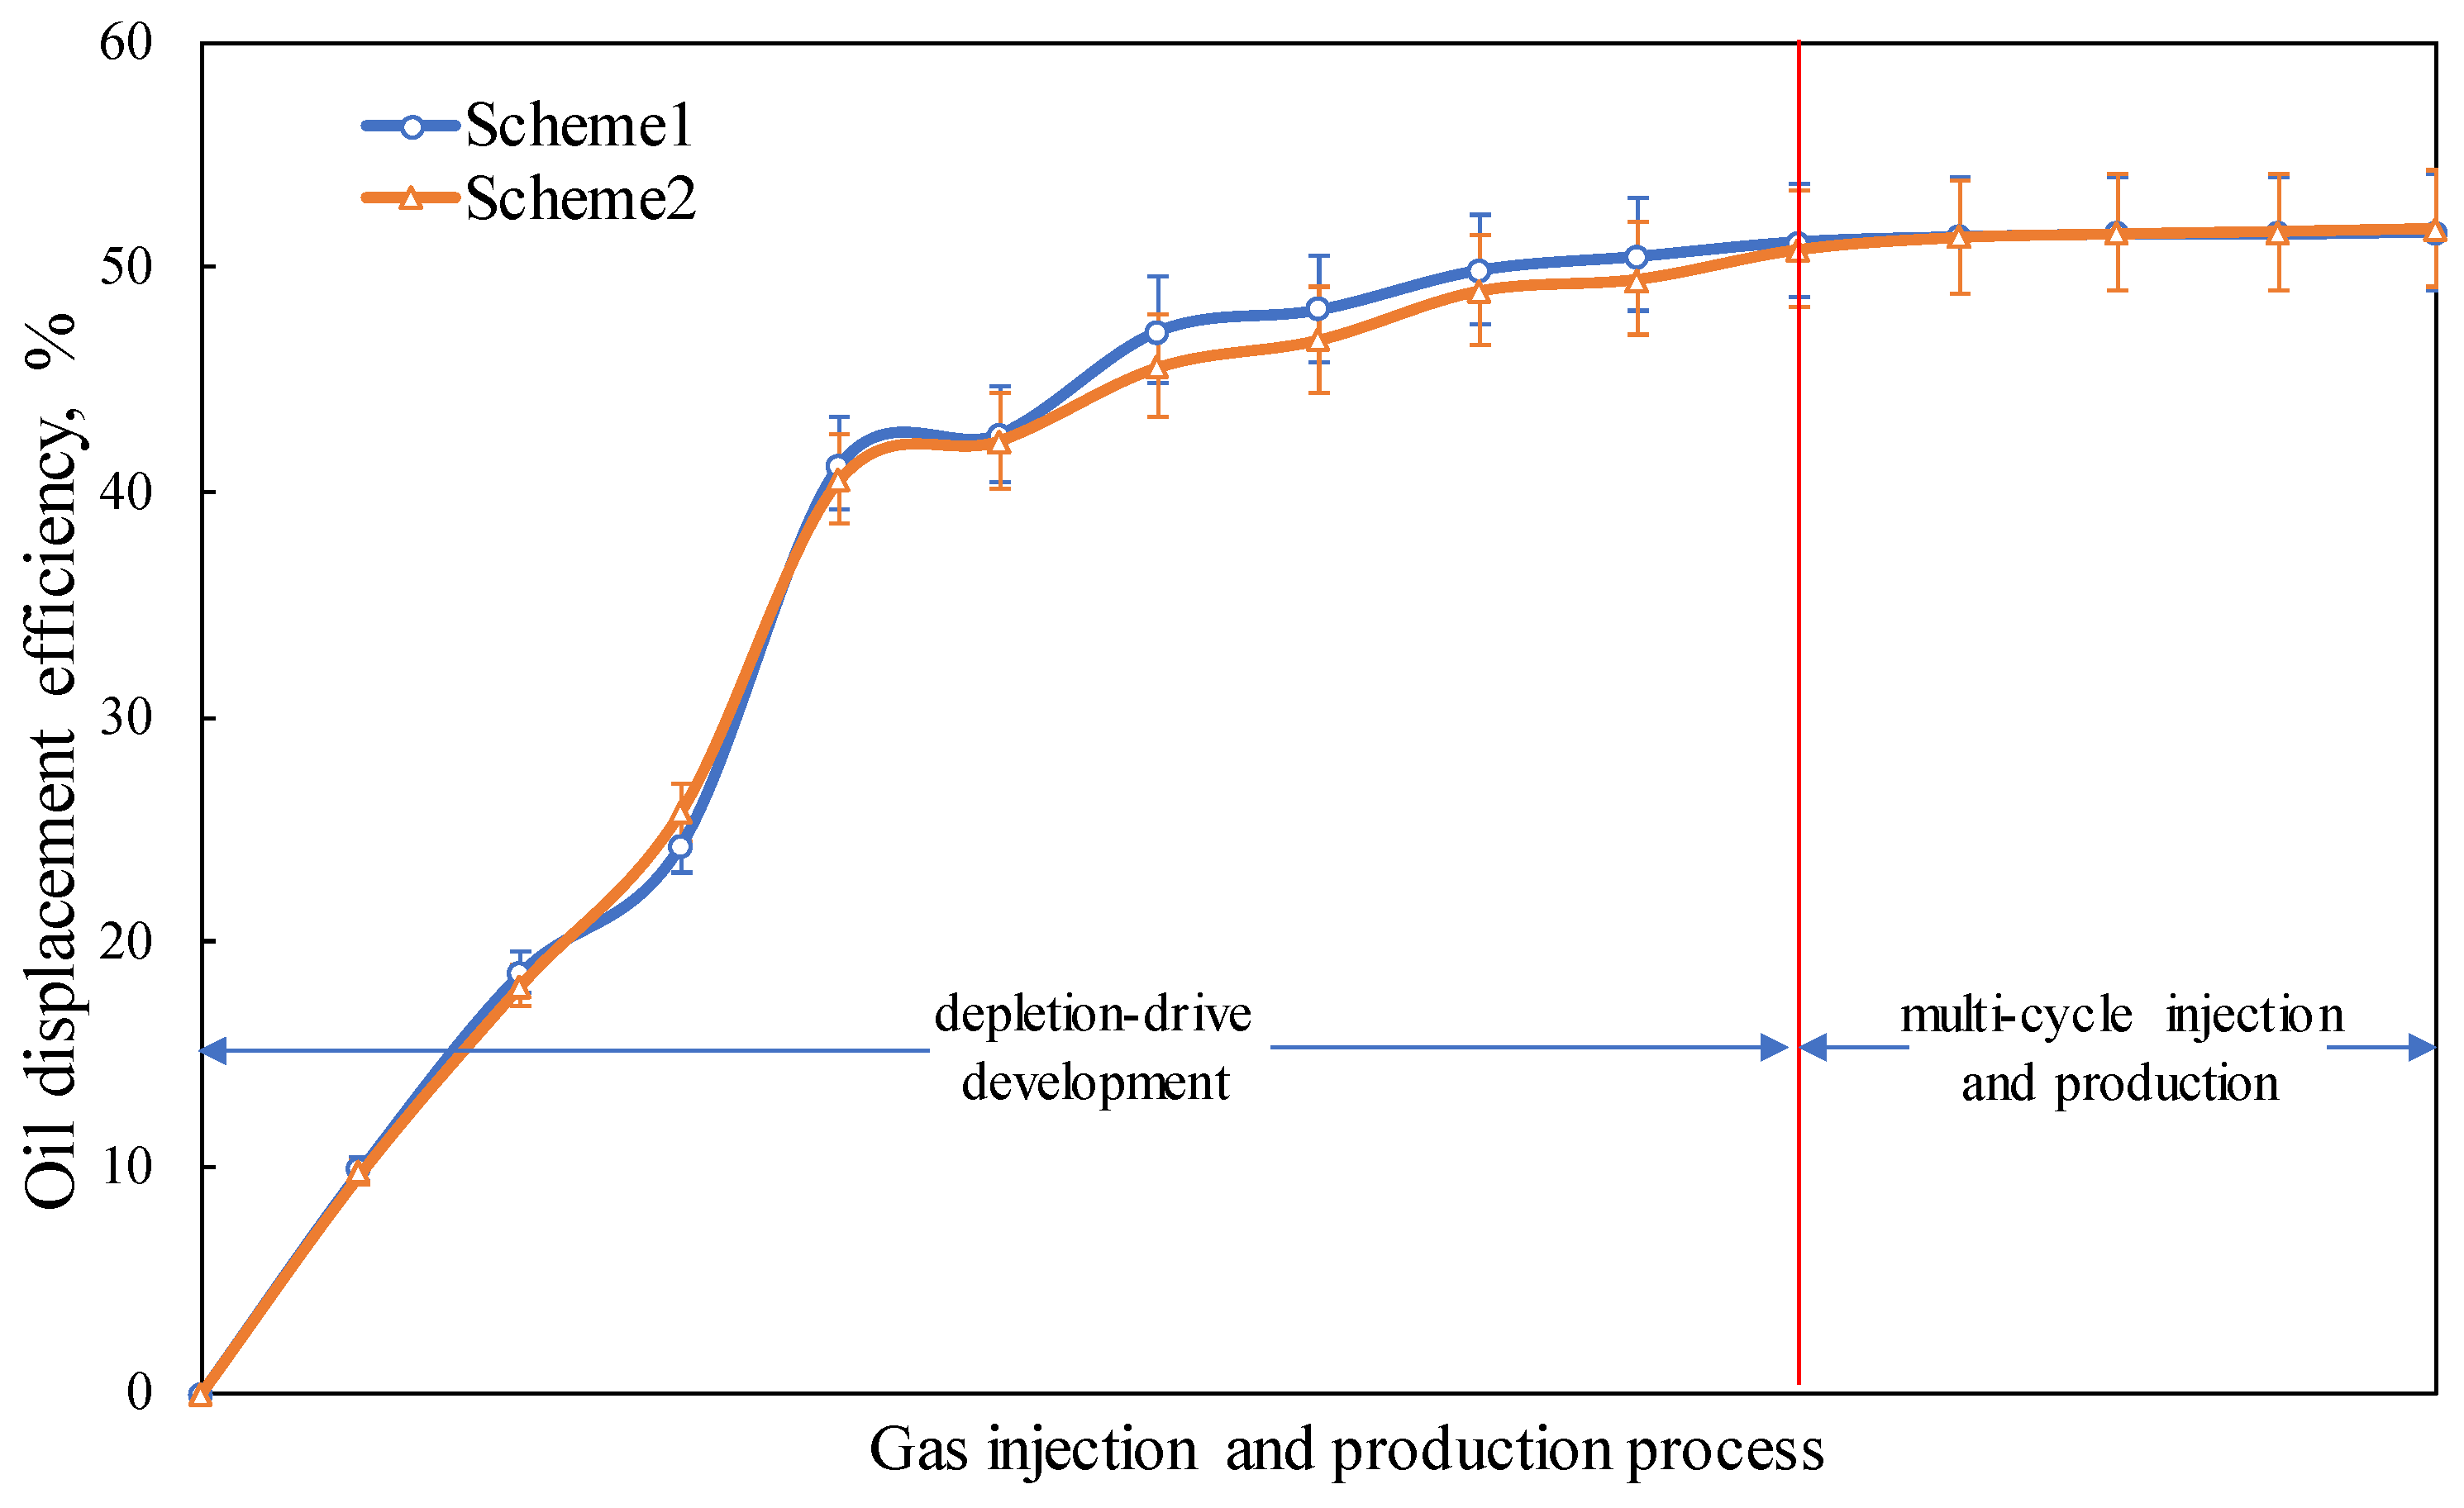
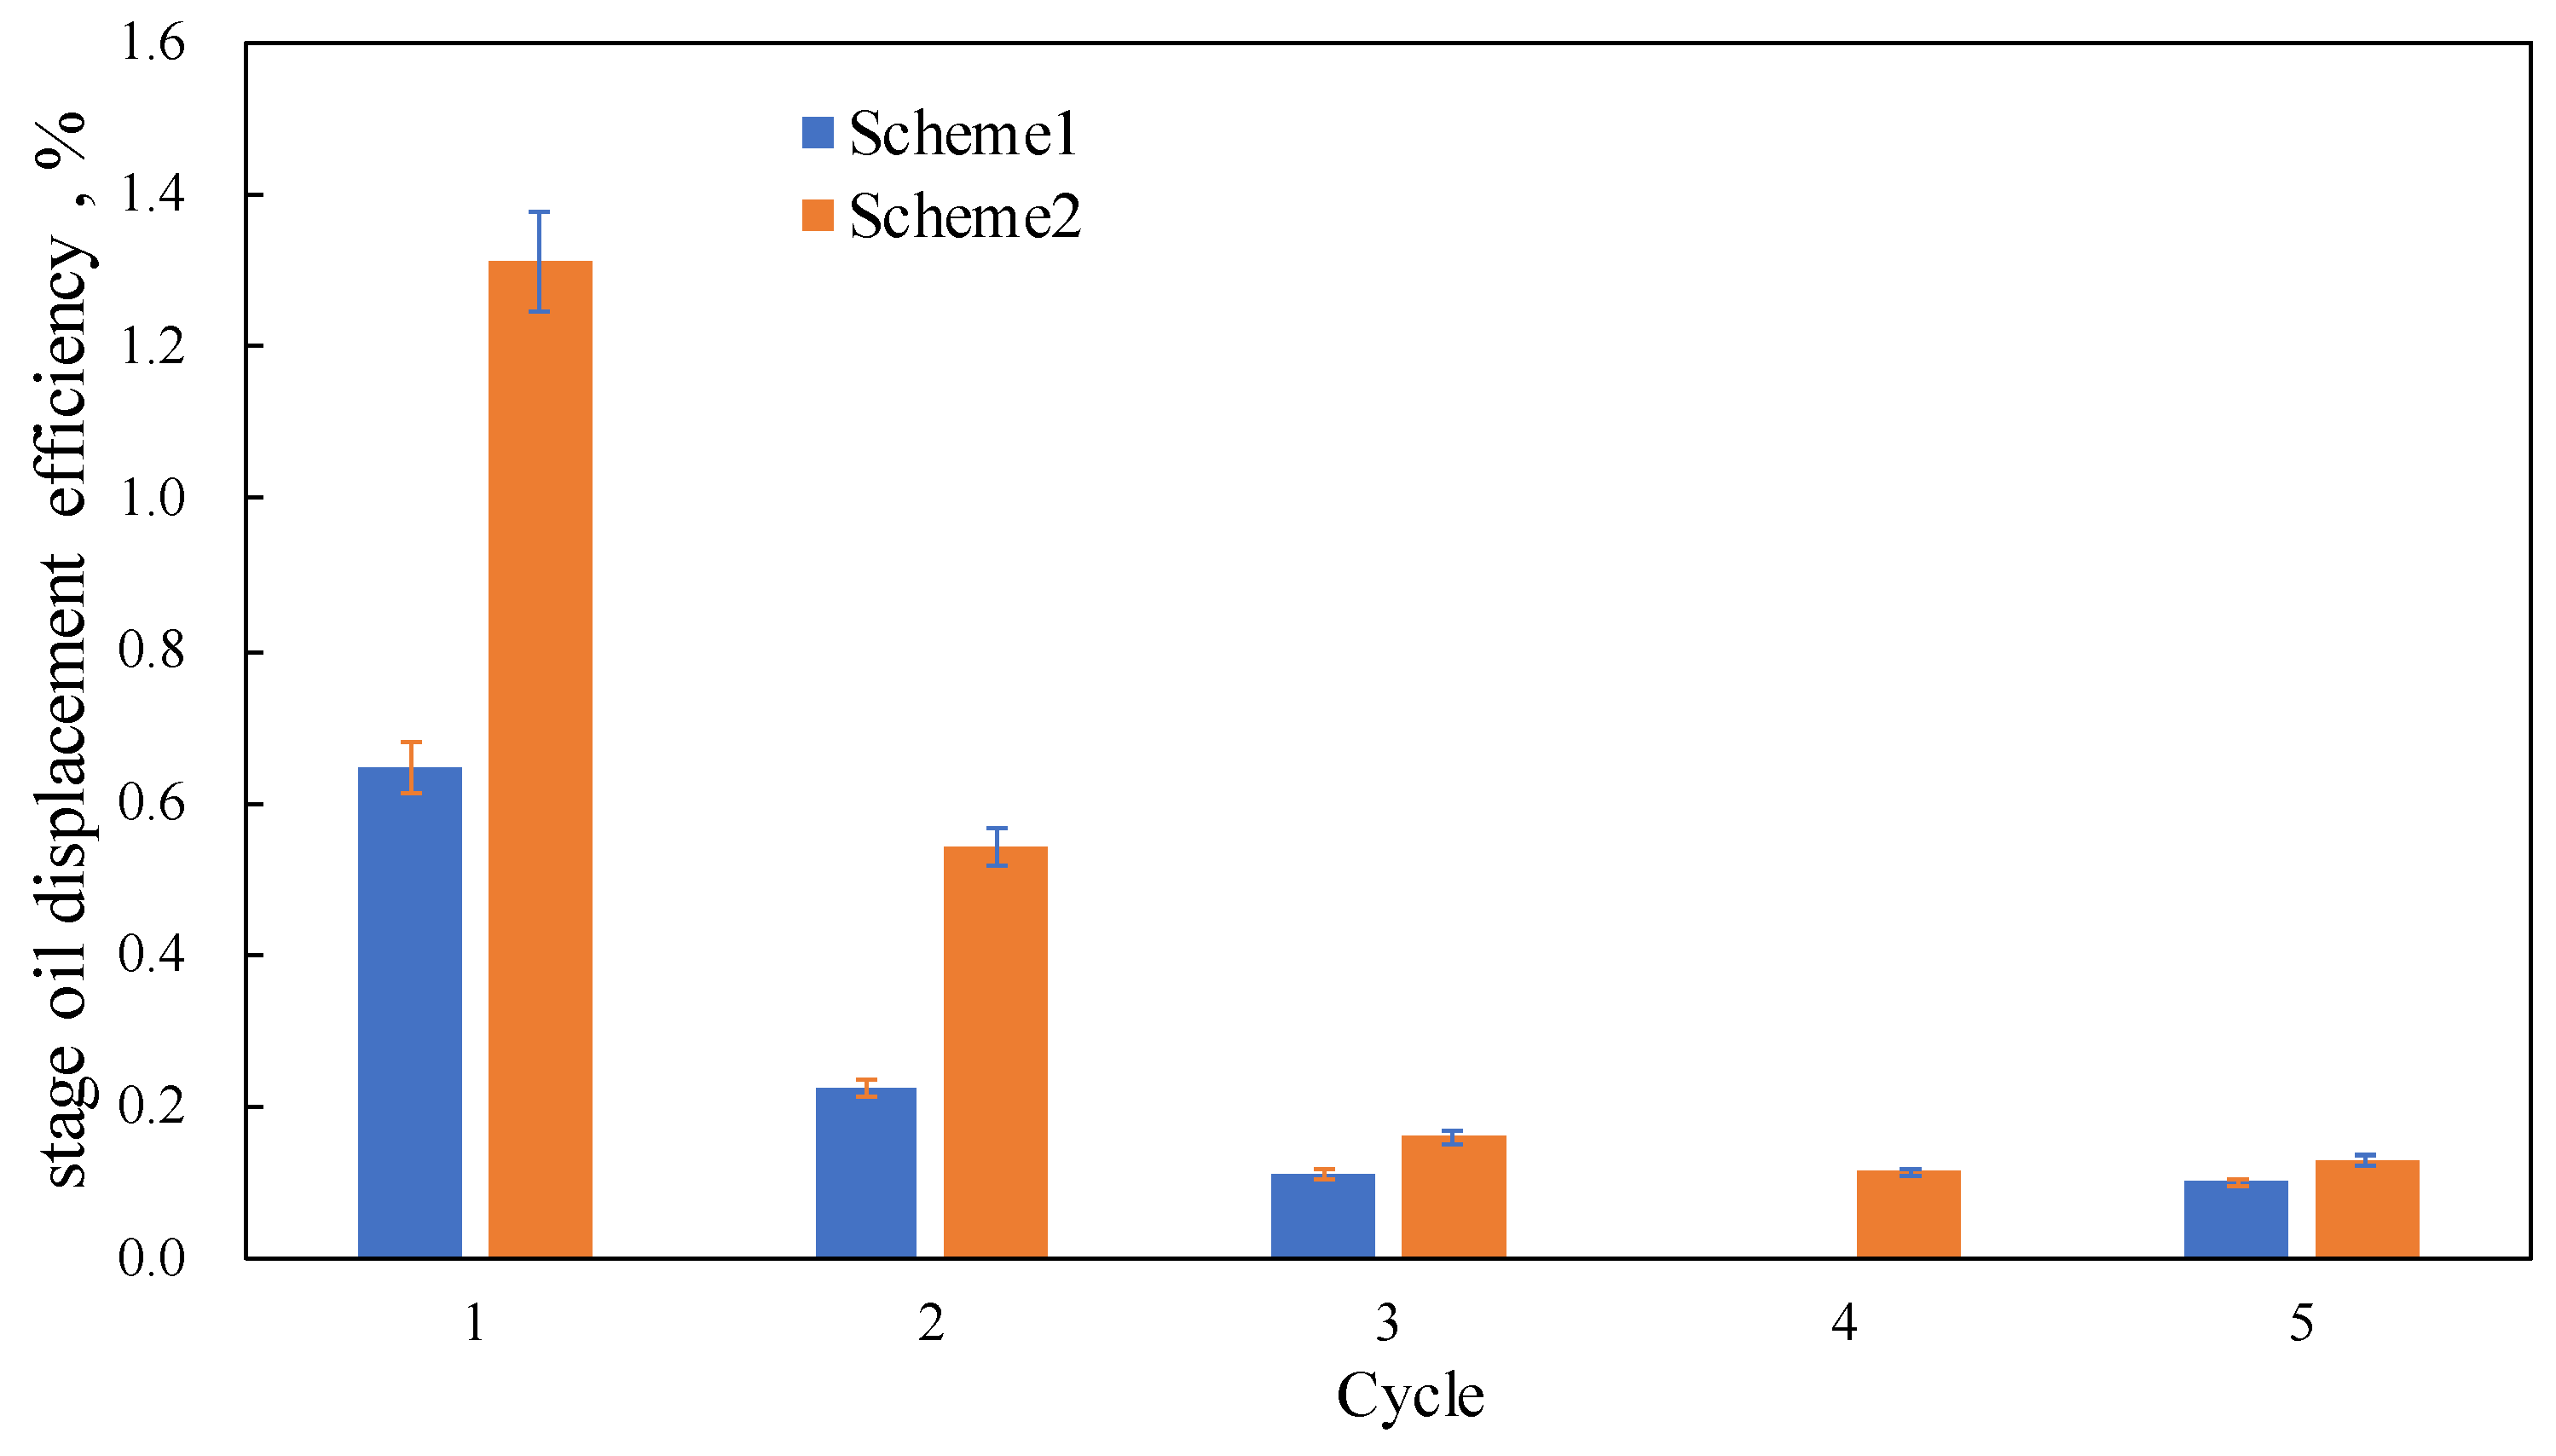
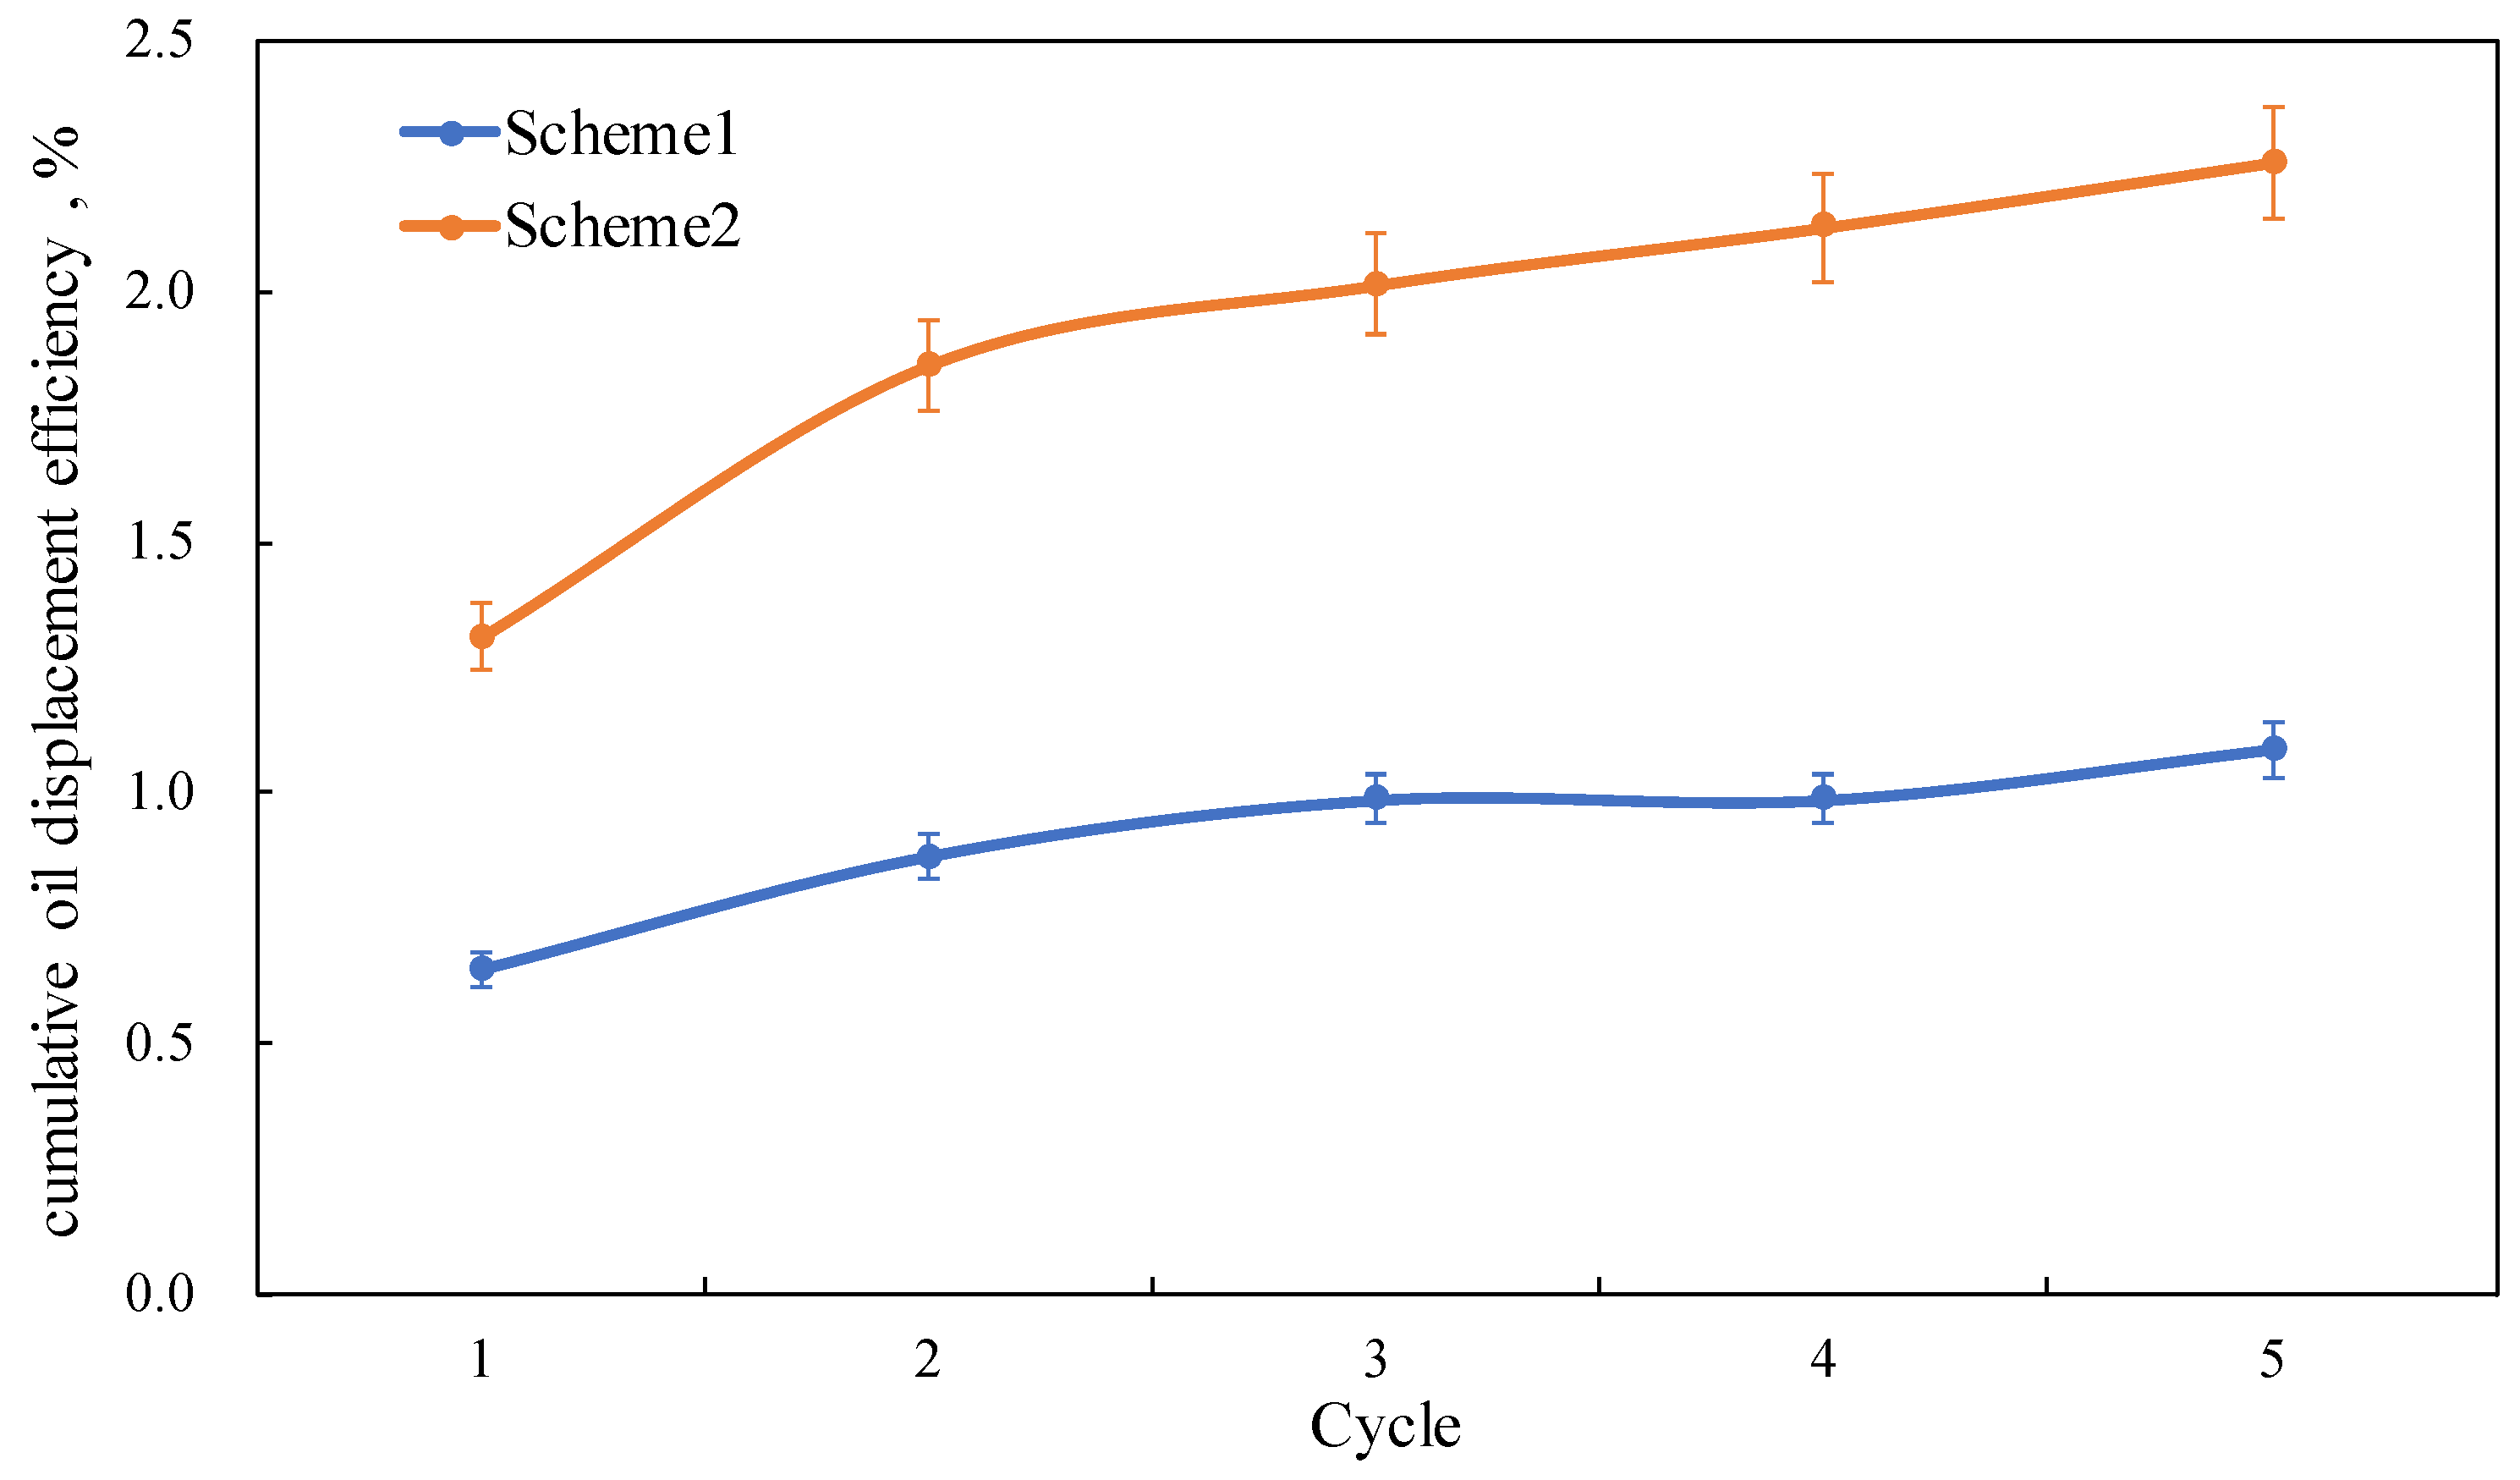
- (2)
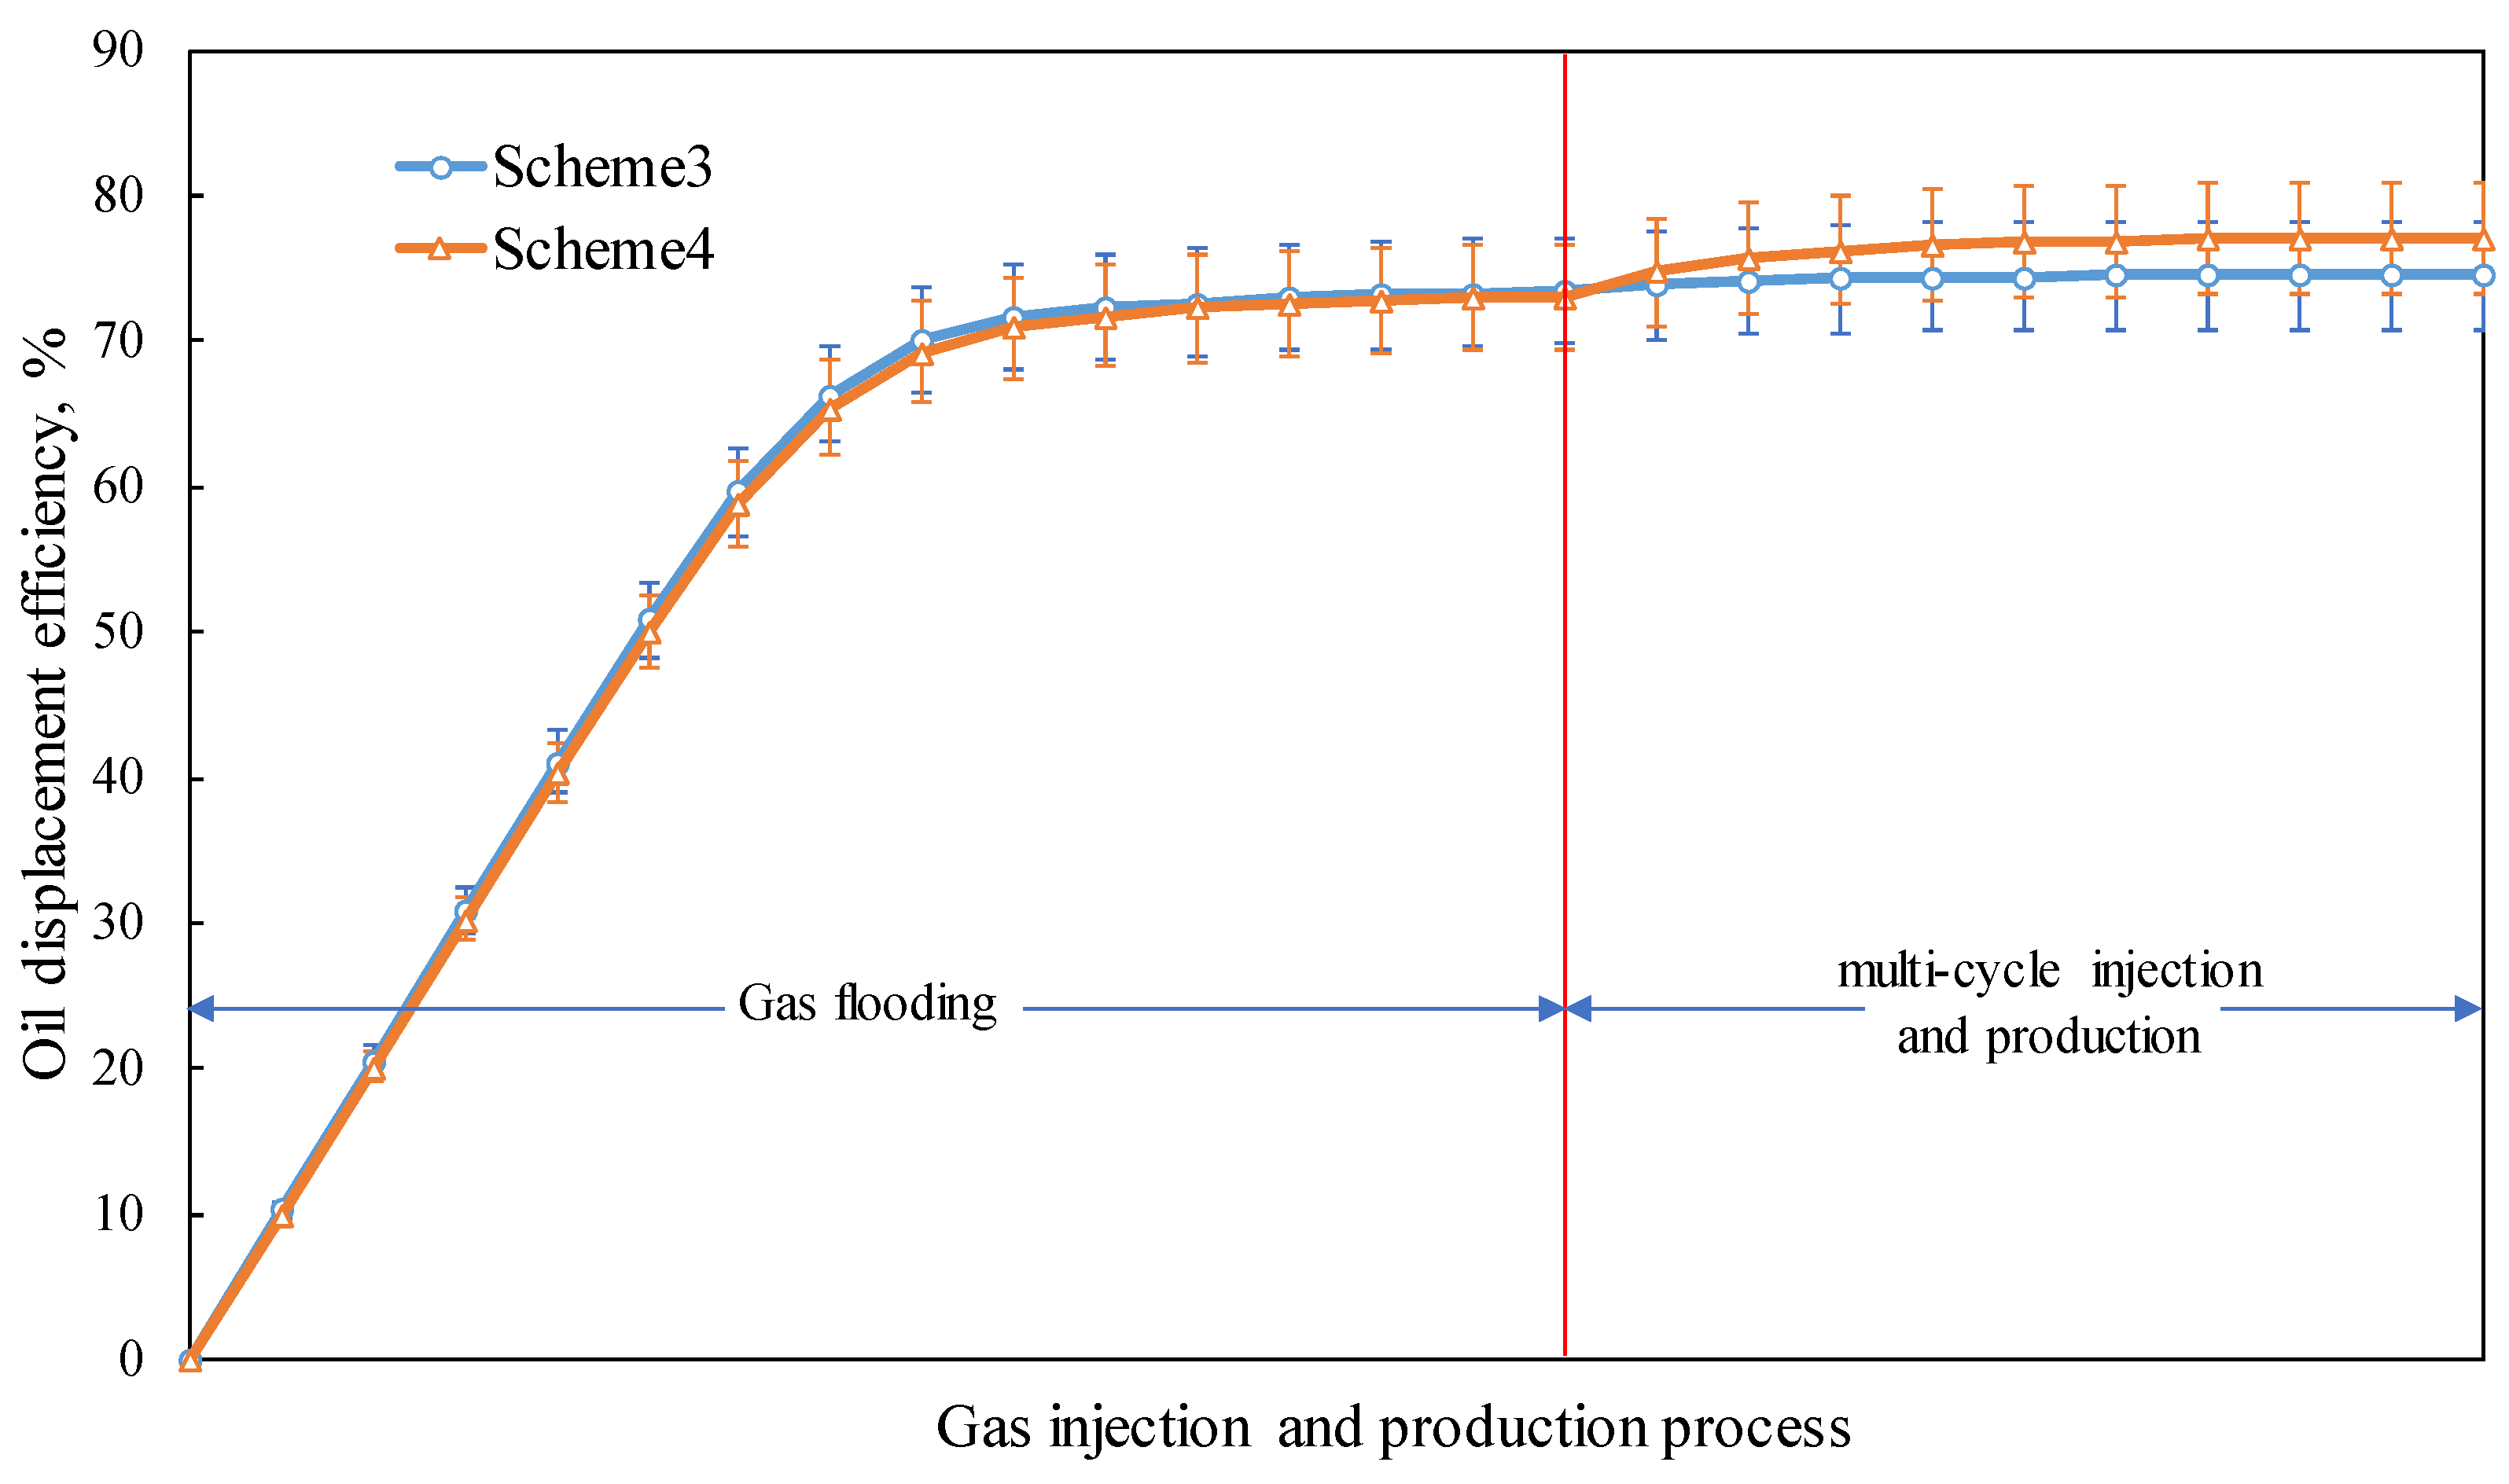
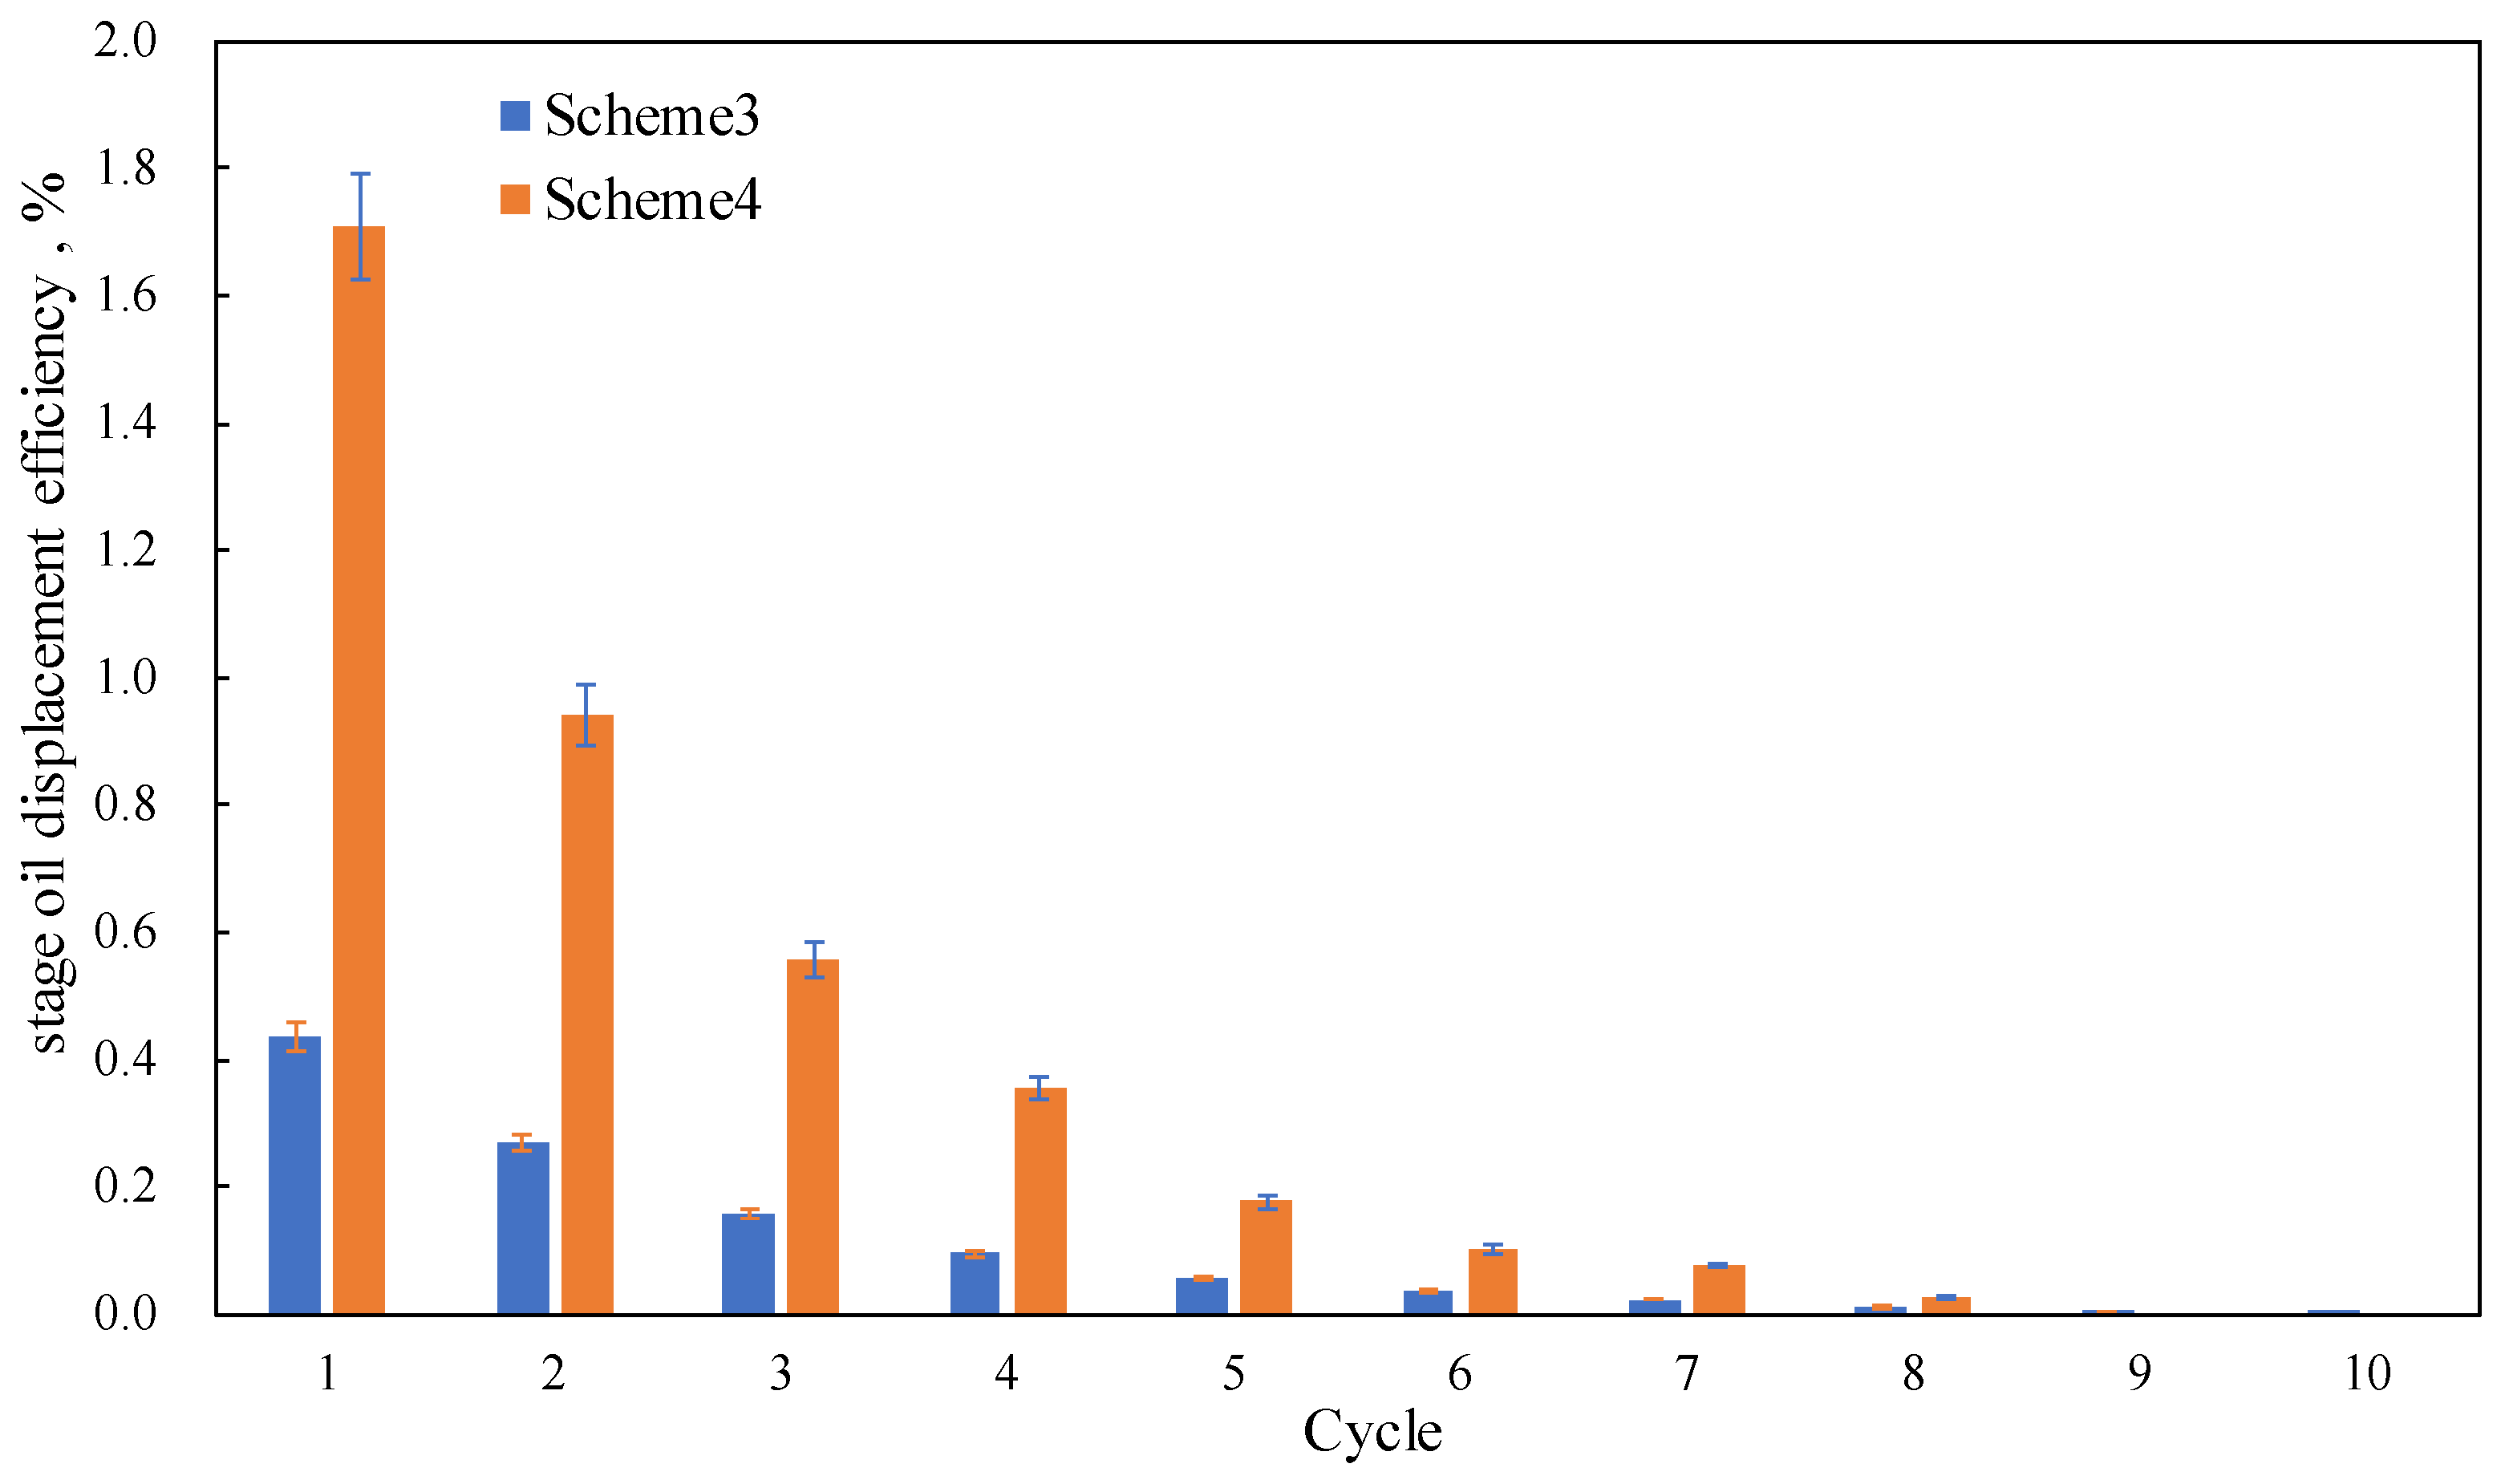
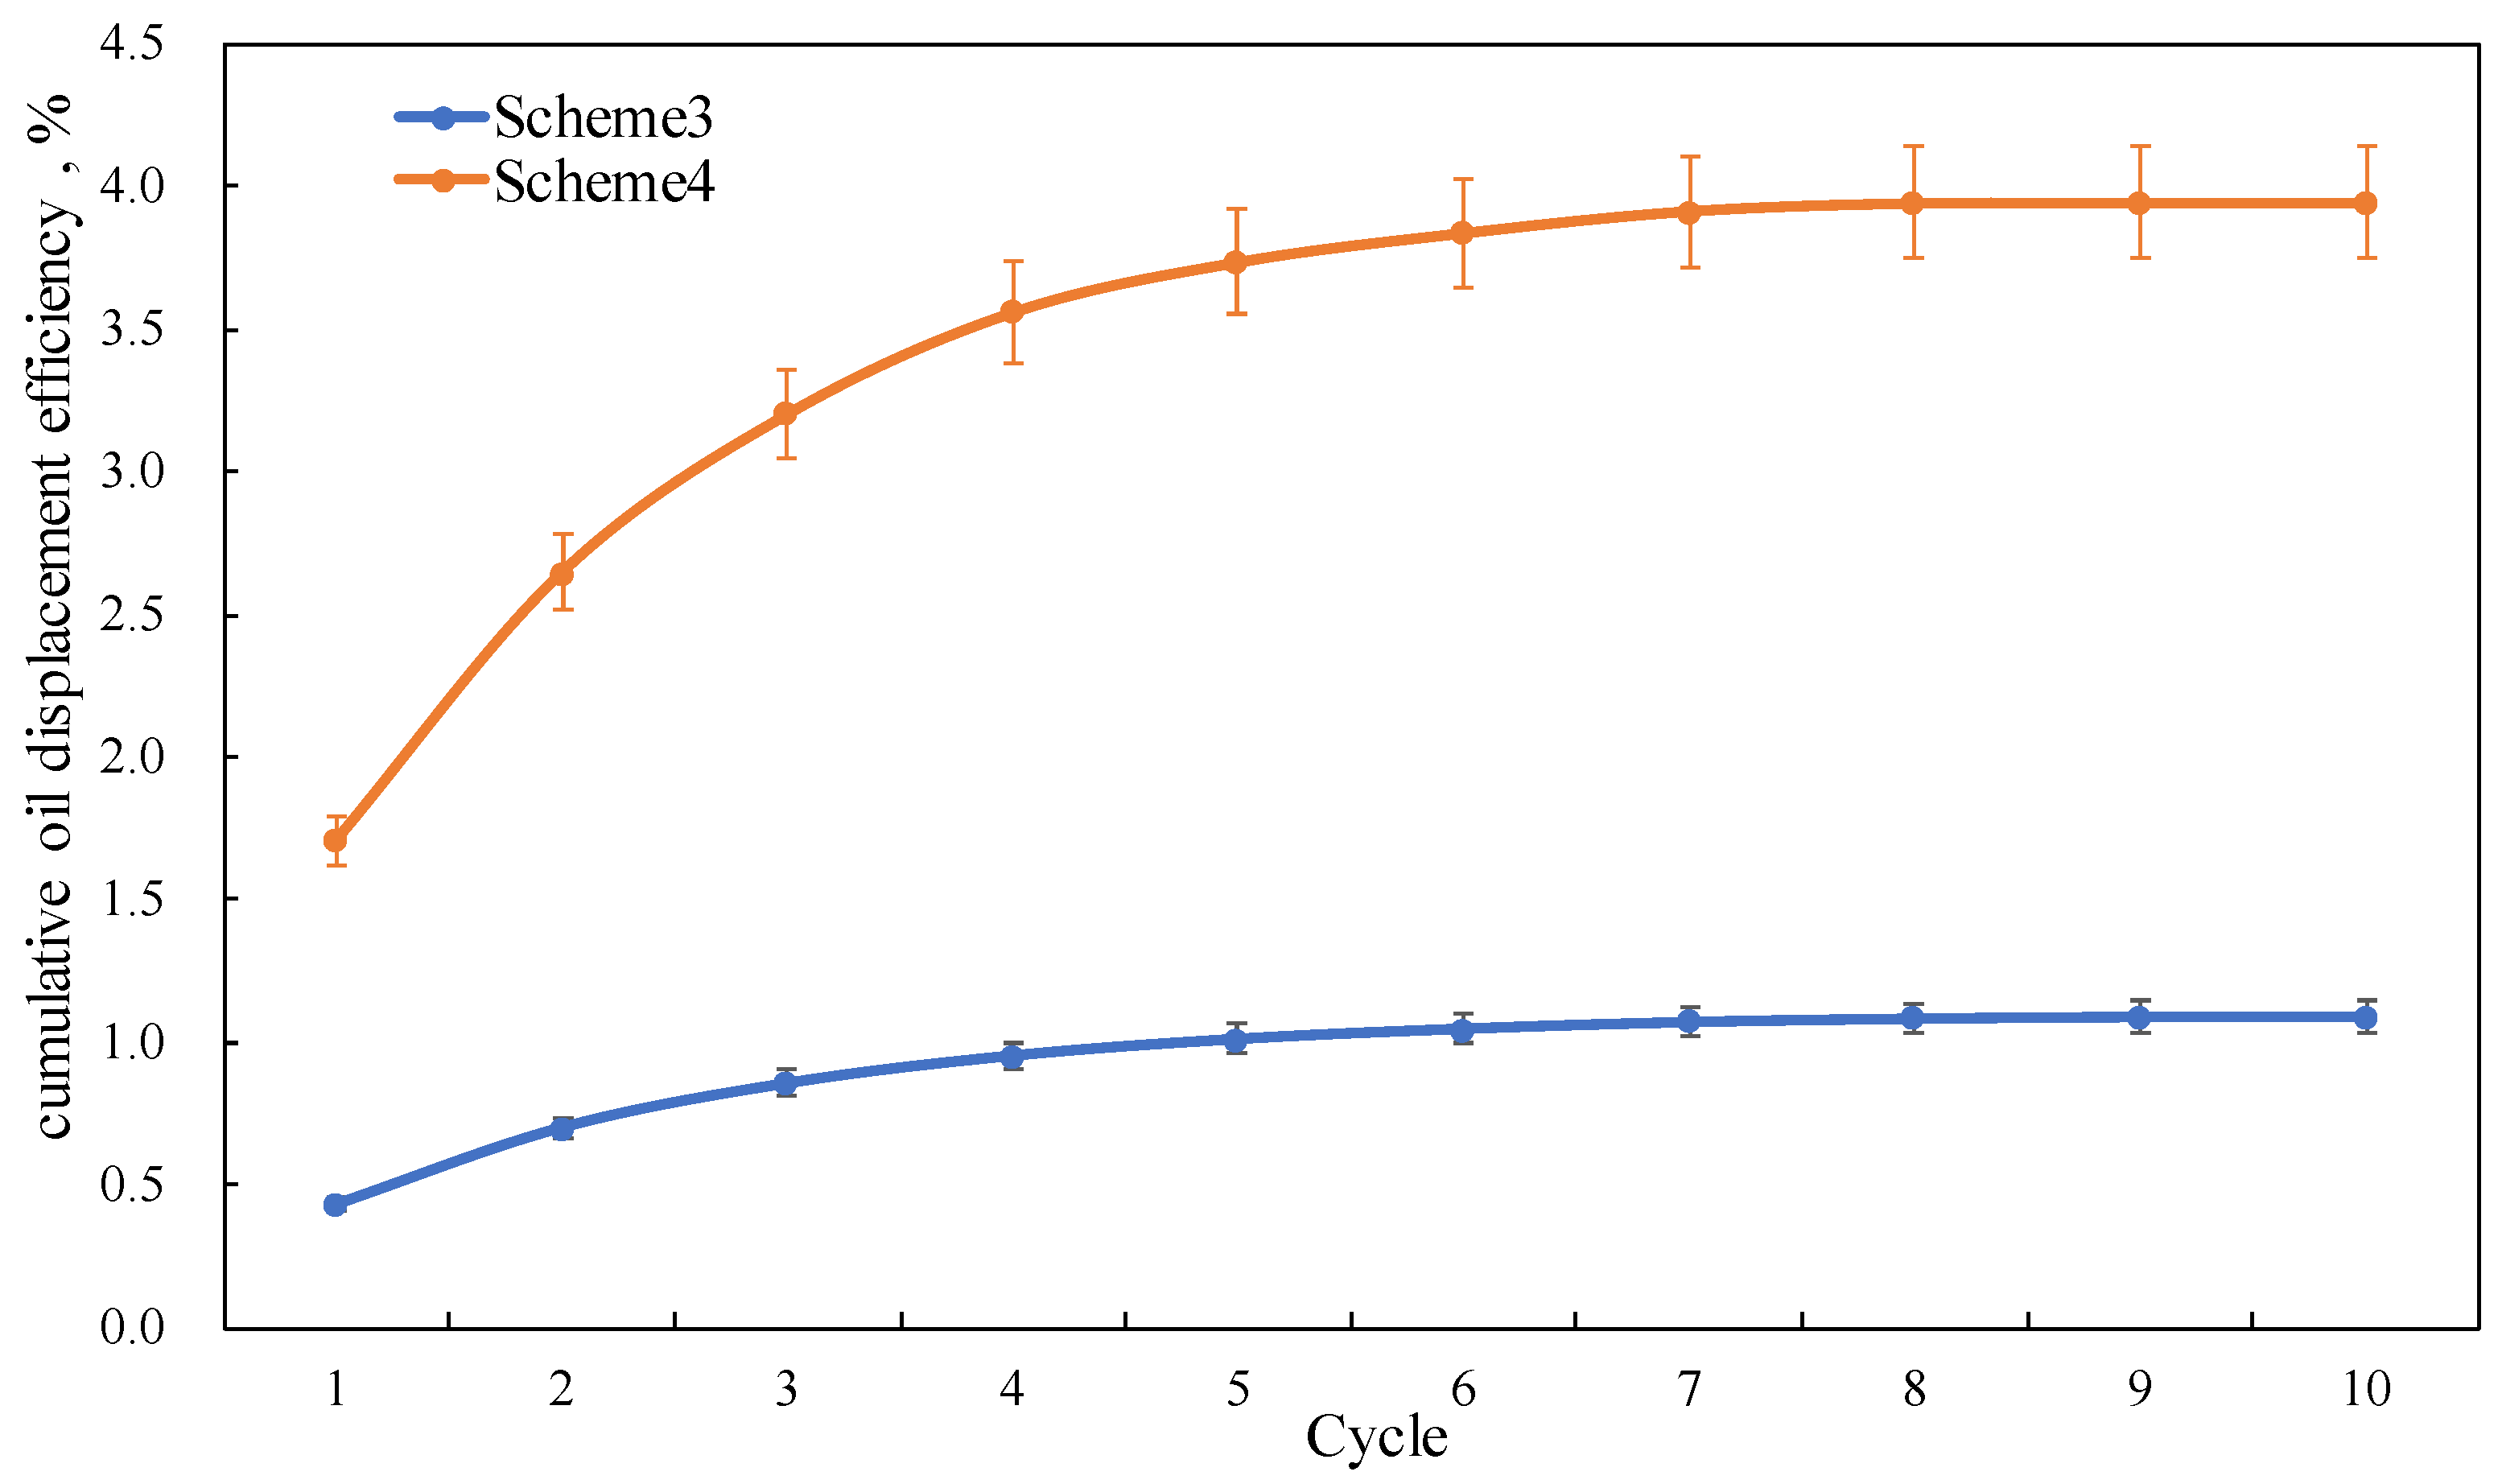
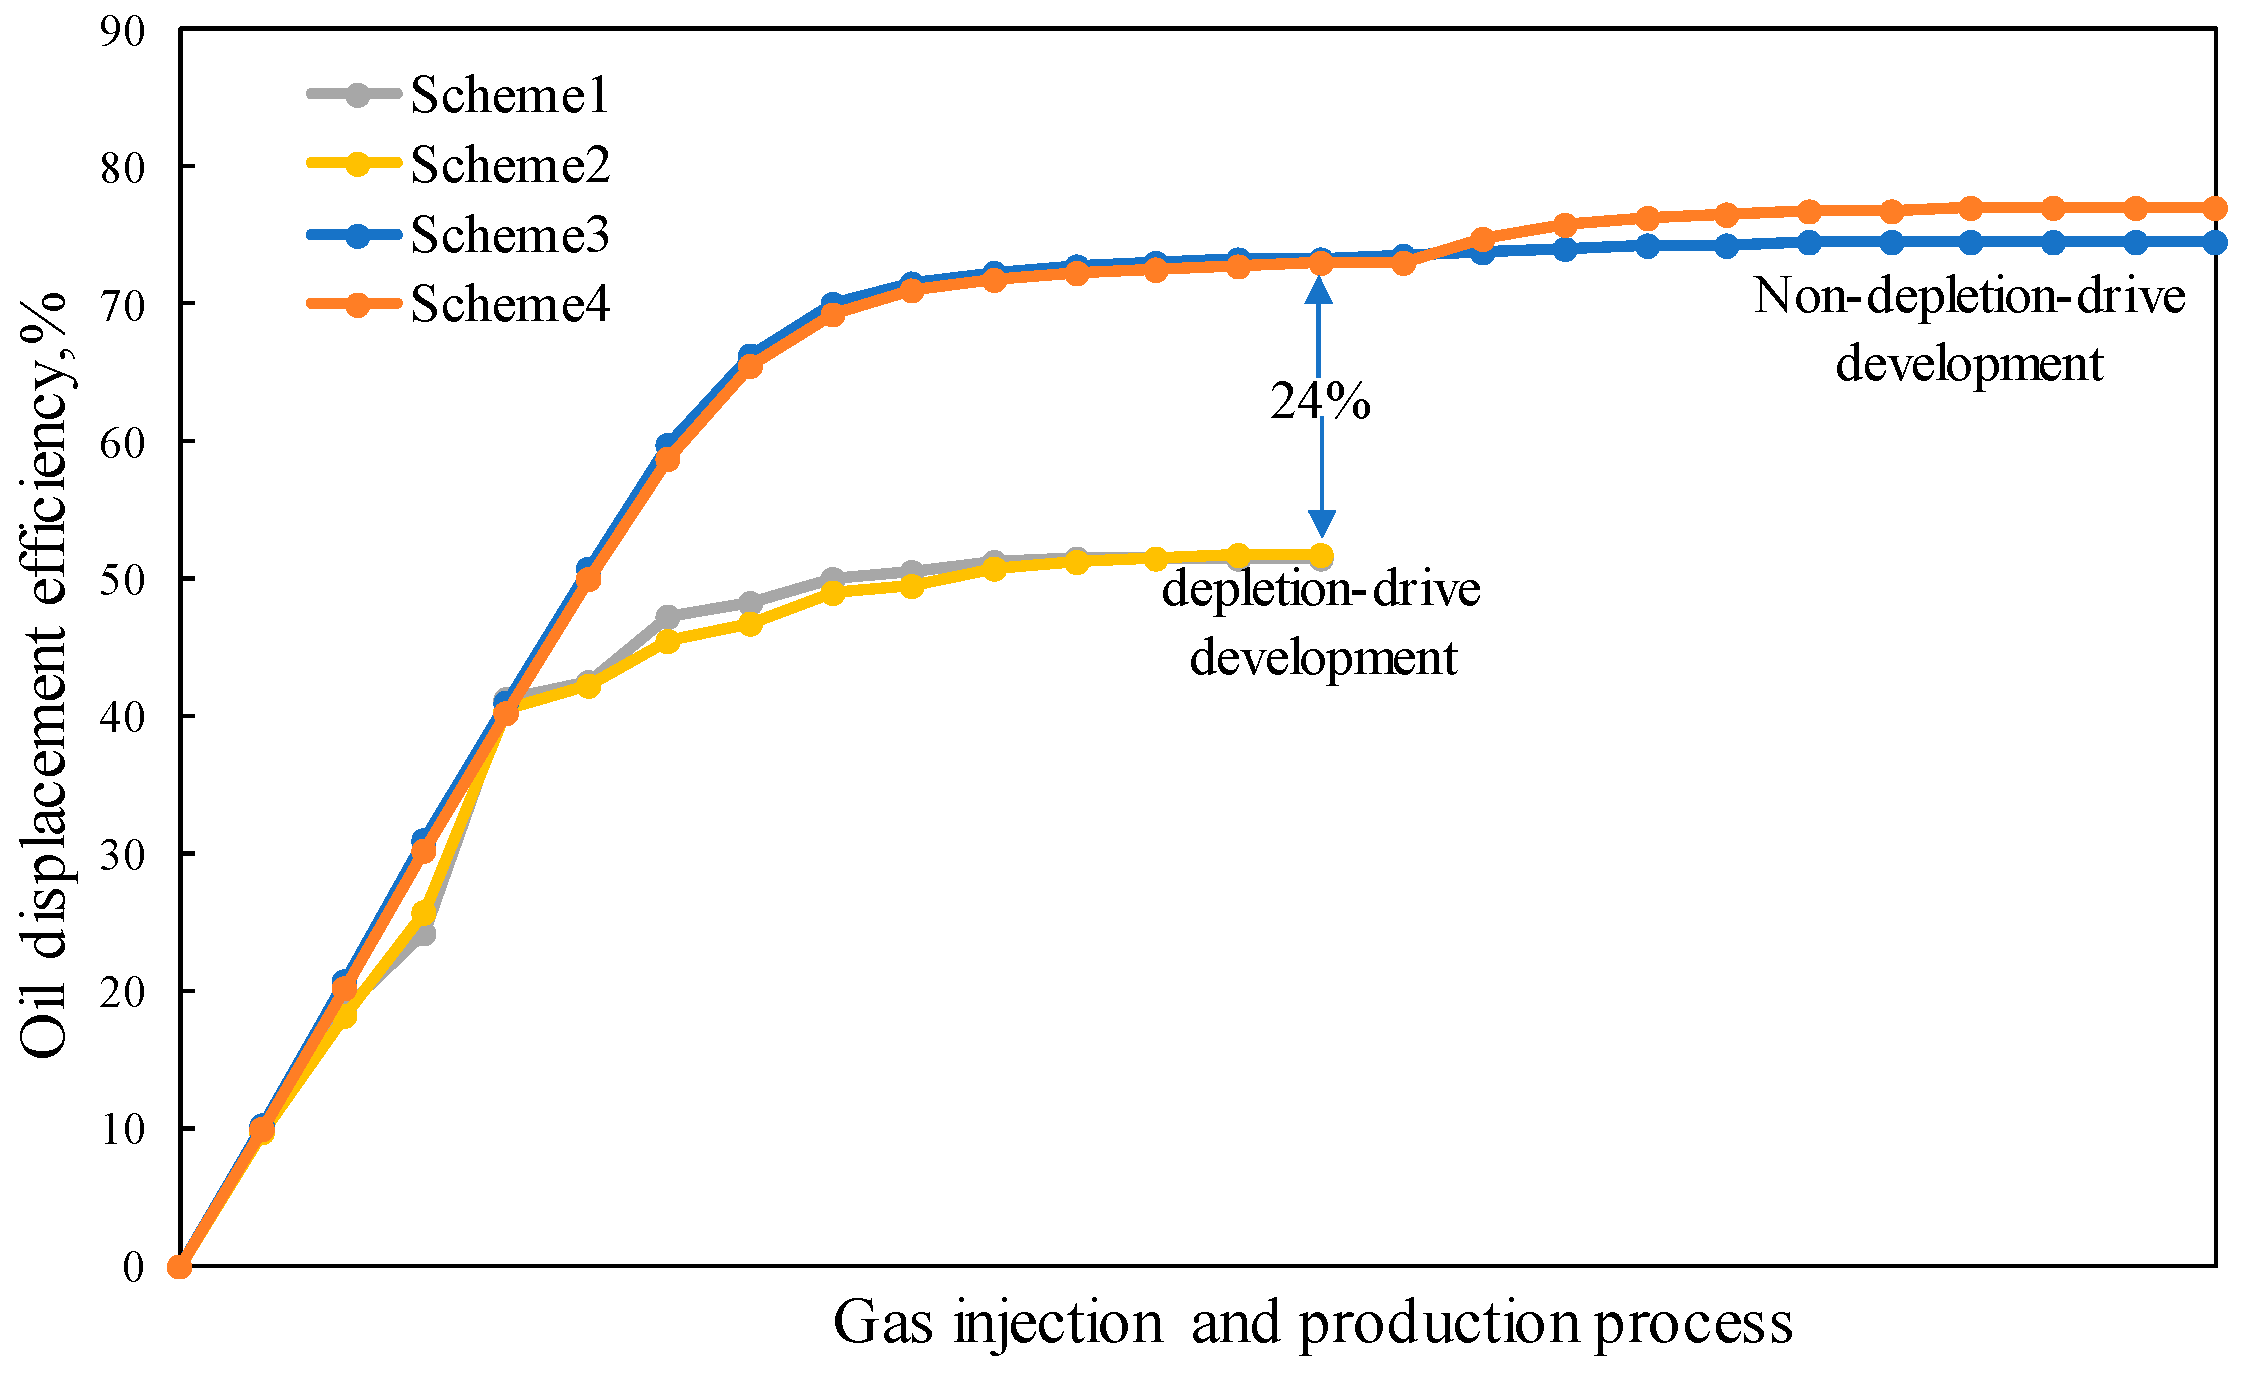
- Single-tube long-core displacement experiments reveal that during the collaborative construction of a gas storage facility, the overall oil displacement efficiency without a depletion process is approximately 24% higher than that with a depletion process. This indicates that depletion production is detrimental to enhancing oil recovery and expanding the capacity of the gas storage facility. During the cyclic injection–production stage, the crude oil recovery rate increases by 1% to 4%. As the number of cycles increases, the incremental oil displacement efficiency in each stage gradually decreases, and so does the increase in cumulative oil displacement efficiency. Better capacity expansion effects are achieved when gas is produced simultaneously from both ends.
- (3)
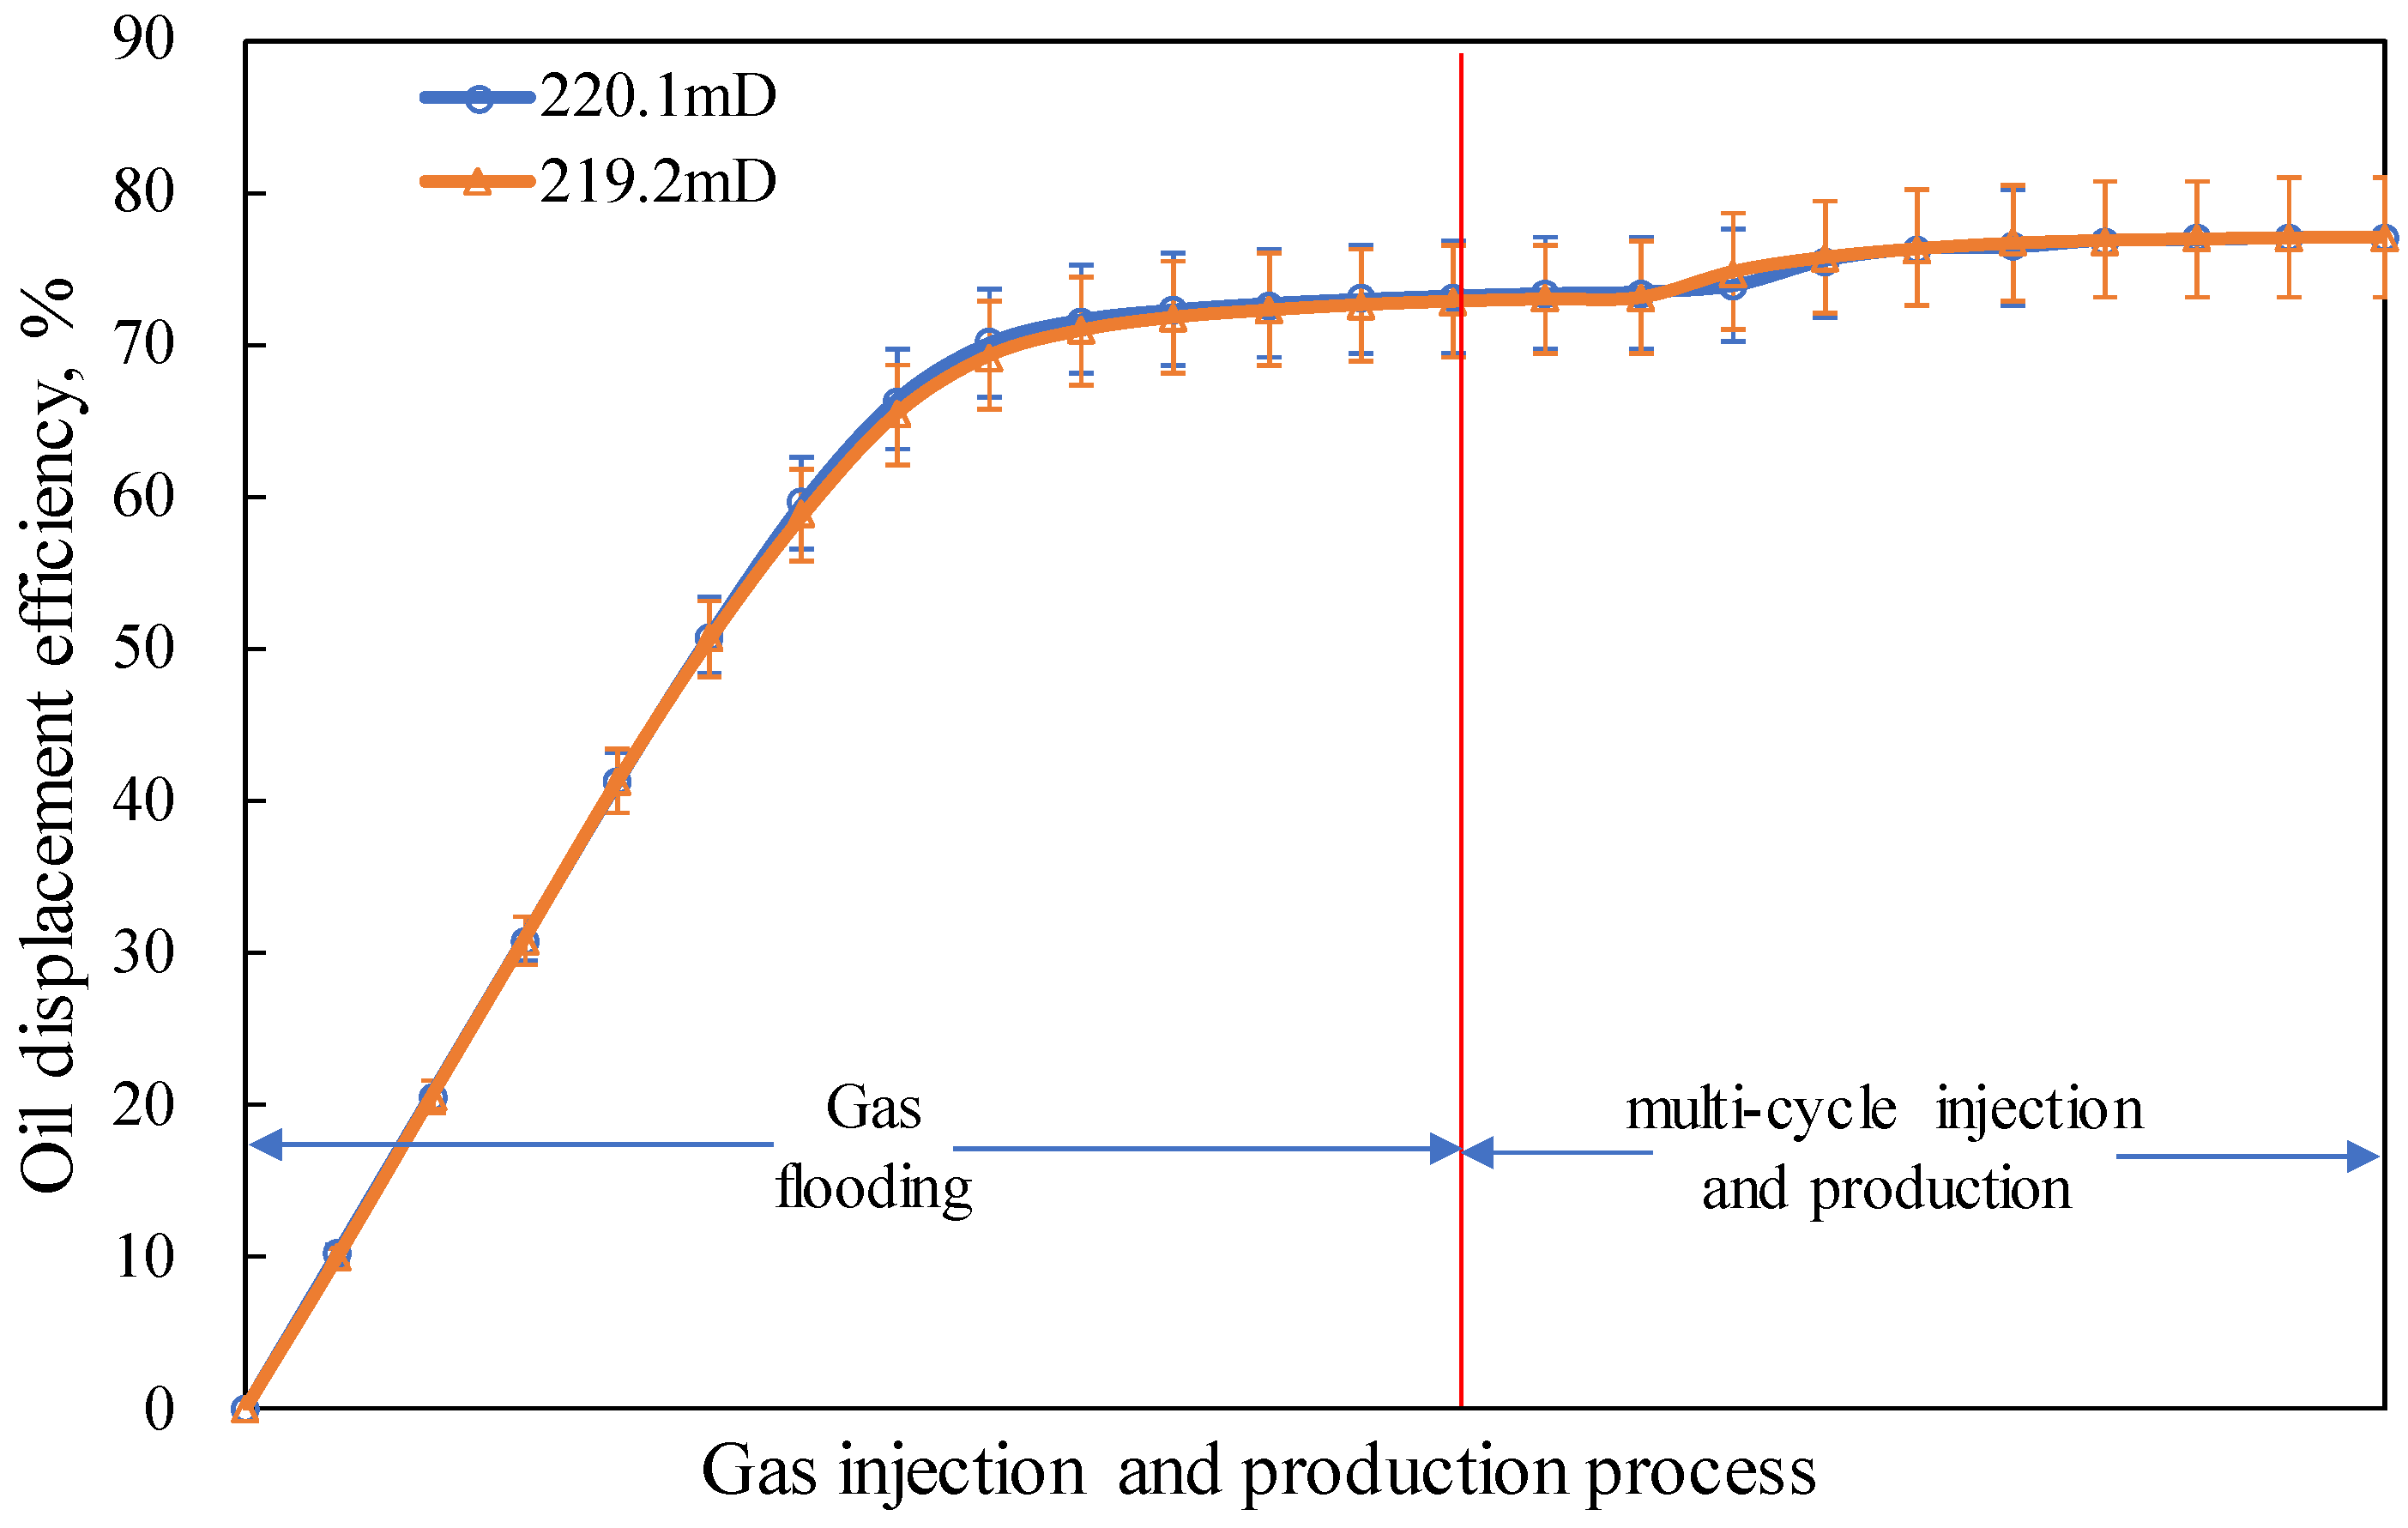
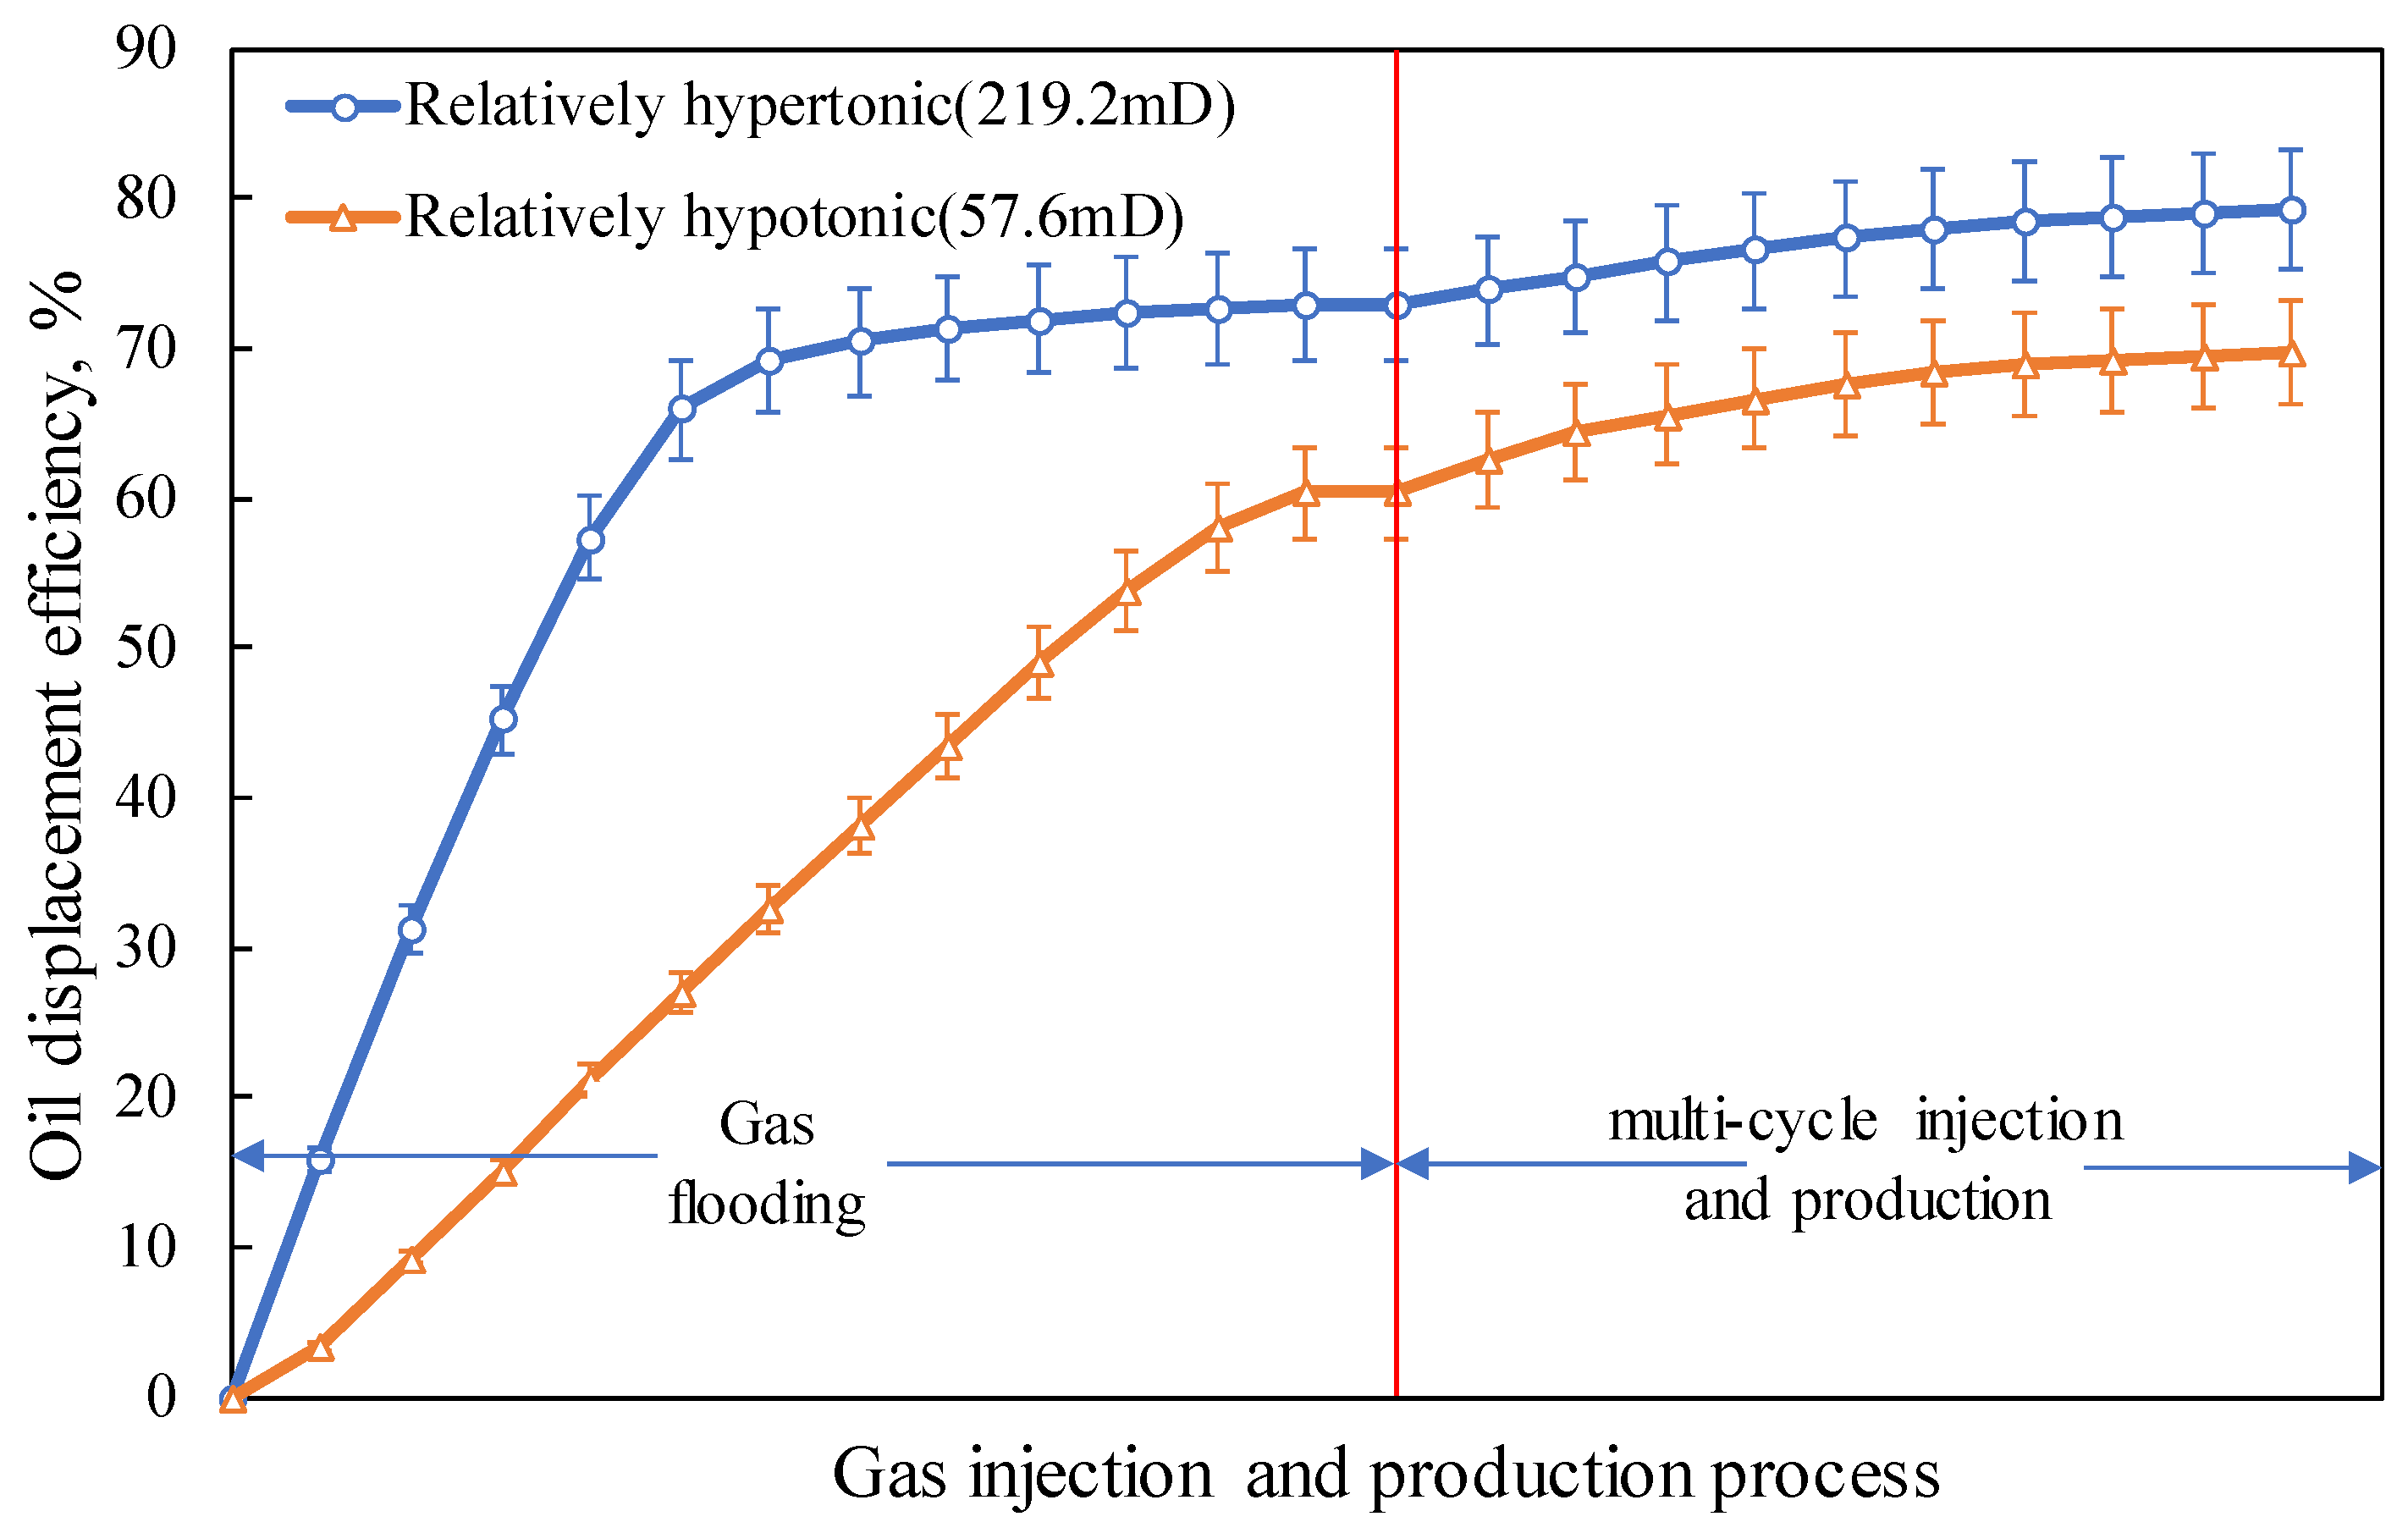
- Parallel double-tube long-core displacement experiments demonstrate that when the permeability is the same, the oil displacement efficiencies during the gas flooding stage and the cyclic injection–production stage are essentially identical. When there exists a permeability contrast, the oil displacement efficiency of the high-permeability core is 9.56% higher than that of the low-permeability core. The ratio of the oil displacement efficiency between the high-permeability end and the low-permeability end is positively correlated with the permeability contrast; the greater the permeability contrast, the larger the ratio.
Author Contributions
Funding
Data Availability Statement
Conflicts of Interest
References
- Chen, Y.; Liu, D.; Li, Y.; Li, Z.; Zhu, Y. Two-Dimensional Modified Darcy Model for Calculating Seepage Problems in Underground Gas Storage Reservoirs. Geoenergy Sci. Eng. 2025, 253, 213971. [Google Scholar] [CrossRef]
- Zhang, K.; Miao, M.; Zhang, L. Thoughts on “Dual Carbon” Goals and China’s Energy Transition (Part 1)-Energy Transition and Carbon Peak/Carbon Neutrality. Sino-Glob. Energy 2022, 27, 16. [Google Scholar]
- Hassan, A.; Abdalla, M.; Mahmoud, M.; Glatz, G.; Al-Majed, A.; Al-Nakhli, A. Condensate-Banking Removal and Gas-Production Enhancement Using Thermochemical Injection: A Field-Scale Simulation. Processes 2020, 8, 727. [Google Scholar] [CrossRef]
- Si, B.; Yan, Q.; Liu, Q.; Zhang, Y.; Fu, C.; Qi, H. Experimental Study on Synergistic Construction of Underground Gas Storage and Natural Gas Flooding in Oil Reservoirs: A Case Study of Sanjianfang Formation in Pubei Oilfield. Xinjiang Pet. Geol. 2023, 44, 321–326. [Google Scholar]
- Song, Y.; Liu, H.; Min, Z.; Liu, M.; Qiu, X.; Liu, J.; Yang, C. Mechanism of Fault Slippage in Underground Gas Storage and Preliminary Application in the Shuang 6 UGS in China. Geoenergy Sci. Eng. 2025, 251, 213881. [Google Scholar] [CrossRef]
- Lv, D.; Li, H.; Li, J.; Cheng, Y.; Li, B. Seepage Simulation Experiment and Productivity Prediction of Sandstone Reservoir Reconstructed as Gas Storage: A Case Study of Block Ban 37 in Dagang Oilfield. Reserv. Eval. Dev. 2025, 1–9. [Google Scholar]
- Jiang, T.; Wang, J.; Wang, Z.; Zhou, D. Practice and Understanding of Collaborative Construction of Underground Gas Storage and Natural Gas Flooding. Nat. Gas Ind. 2021, 41, 66–74. [Google Scholar]
- Hussain, A.; Pan, P.-Z.; Hussain, J.; Feng, Y.; Zheng, Q. Data-Driven Machine Learning Models for Predicting Deliverability of Underground Natural Gas Storage in Aquifer and Depleted Reservoirs. Energy 2025, 319, 134974. [Google Scholar] [CrossRef]
- Wang, J.; Shi, L.; Zhang, Y.; Zhang, K.; Li, C.; Chen, X.; Sun, J.; Qiu, X. Simulation of Oil-Gas Phase Behavior During the Entire Injection-Production Process in Gas Reservoir-Based Underground Gas Storage. Pet. Explor. Dev. 2022, 49, 1198–1205, 1233. [Google Scholar] [CrossRef]
- Tang, Y.; Tang, Z.; Qin, J.; He, Y.; Luo, Y.; Cheng, M.; Wang, Z. Research on seepage and phase change characteristics during multi-cycle Injection–Production in oil reservoir-based underground gas storage. Energies 2025, 18, 2550. [Google Scholar] [CrossRef]
- Liu, S.; Zhao, E.; Ma, B.; Liu, H.; Yang, J.; Sui, G.; Yuan, X.; Ma, X.; Wang, L. Analysis of the influence of alternating stress in the multi-cycle injection production process. Processes 2025, 13, 1158. [Google Scholar] [CrossRef]
- Fan, J.; Wu, Z.; Yu, S.; Zhou, D.; Yan, G.; Wang, C. Influencing Factors of Effective Storage Capacity in Abnormal High-Pressure Water-Bearing Condensate Gas Reservoirs. Xinjiang Pet. Geol. 2022, 43, 463–467. [Google Scholar]
- Zhang, S.; Liao, W.; Hu, S.; Luo, H.; Li, X.; Zhang, J. Gas-Water Migration Dynamics and Storage Capacity Variation Patterns in Edge-Bottom Water Gas Reservoir Storage. Nat. Gas Explor. Dev. 2025, 48, 124–134. [Google Scholar]
- Chu, H.; Zhang, L.; Lu, H.; Chen, D.; Wang, J.; Zhu, W.; Lee, W.J. Transient Pressure Prediction in Large-Scale Underground Natural Gas Storage: A Deep Learning Approach and Case Study. Energy 2024, 311, 133411. [Google Scholar] [CrossRef]
- Feng, H.; Wang, Z.; Min, Z.; Qiao, L.; Guo, J.; Liu, J.; Zhao, G. Fine 3D Geological Modeling Method for Underground Gas Storage and Application in Injection-Production Optimization. Gas Sci. Eng. 2025, 134, 205542. [Google Scholar] [CrossRef]
- Fan, Y.; Gao, X.; Ning, F.; Peng, J.; Li, L.; Peng, H.; Chen, M. Seepage Characteristics of Gas Reservoir-Based Underground Gas Storage Under Multi-Cycle Injection-Production Operations. Nat. Gas Ind. 2023, 43, 103–111. [Google Scholar]
- Jiao, G.; Zhu, S.; Xie, F.; Yang, S.; Xiang, Z.; Xu, J. Study of the characterisation method of effective two-phase seepage flow in the construction of gas storage reservoirs. Energies 2023, 16, 242. [Google Scholar] [CrossRef]
- Ding, Y.; He, Y.; Qin, Z.; Liu, W. Study on Influencing Factors and Variation Rules of Storage Capacity in Reservoir-Type Underground Gas Storage. J. Liaoning Pet. Chem. Univ. 2024, 44, 43–48. [Google Scholar]
- Zhang, J.; Fang, F.; Lin, W.; Gao, S.; Li, Y.; Li, Q.; Yang, Y. Research on injection-production capability and seepage characteristics of multi-cycle operation of underground gas storage in gas Field—Case study of the wen 23 gas storage. Energies 2020, 13, 3829. [Google Scholar] [CrossRef]
- Liu, W.; Wang, Q.; Sun, Y.; Gao, G.; He, H.; Jia, Q.; Xiang, Z.; Lei, H.; Liu, Z. Feasibility Evaluation of Gas Storage Construction in Volatile Oil Reservoirs Based on Multi-Cycle Injection-Production Seepage Experiments. Nat. Gas Ind. 2022, 42, 65–71. [Google Scholar]
- Geng, J.; Zhang, H.; Yue, P.; Qu, S.; Wang, M.; Chen, B. Experimental and numerical simulation studies on the synergistic design of gas injection and extraction reservoirs of condensate gas reservoir-based underground gas storage. Processes 2024, 12, 2668. [Google Scholar] [CrossRef]
- Bao, Z. Technology and Practice for Achieving Capacity and Production Targets in Wen 96 Gas Storage. Nat. Gas Technol. Econ. 2024, 18, 24–31. [Google Scholar]
- Zhang, M.; Chen, X.; Lyu, W.; Han, H. Mechanism of Microbubble Vibration Enhancing Microscopic Oil Displacement Efficiency in Water-Gas Dispersion System. Pet. Explor. Dev. 2024, 51, 1363–1373. [Google Scholar] [CrossRef]
- Zhang, X.; Li, H.; Liu, S.; He, L.; Luo, L.; He, G. Performance Evaluation of In-Situ Emulsion System and Microscopic Displacement Experiment for Ordinary Heavy Oil. Pet. Chem. Appl. 2023, 42, 45–52. [Google Scholar]
- He, H.; Xin, C.; Shang, L.; Zhu, S.; Xiang, Z.; Gao, G.; Sun, Y.; Wang, Y. Experimental Study on Effective Storage Space of Gas Storage Reconstructed from Pugu 2 Oil Reservoir. Spec. Oil Gas Reserv. 2025, 1–11. [Google Scholar]
- Ren, Z.; Yang, X.; Chang, D.; Wang, N.; Meng, D. Study of the Effect of Salt Deposition on Production Capacity and Storage Capacity in Underground Gas Storage. Front. Earth Sci. 2024, 12, 1362776. [Google Scholar]
- GB/T 28912-2012; Test Method for Two Phase Relative Permeability in Rock. China Standard Press: Beijing, China, 2013.
- Wang, L.; Zhang, W.; Li, Q. Quantitative Evaluation of Stress Sensitivity Damage in Depletion Development of Low-Permeability Reservoirs. Pet. Explor. Dev. 2023, 50, 345–352. [Google Scholar]
- Al-Shalabi, E.W. Depletion-Induced Permeability Loss in Tight Oil Reservoirs. SPE Reserv. Eval. Eng. 2023, 26, 1–18. [Google Scholar] [CrossRef]
- Van der Meer, L.G.H. Subsurface Risks of Depleted Gas Field Utilization. Energy Procedia 2017, 114, 1774–1781. [Google Scholar] [CrossRef]
- Wang, H.; Liu, Q.; Zhang, Y. Impact of Depletion Development on Stress-Sensitive Reservoirs: A Case Study of Tight Gas Fields. Energies 2021, 14, 2125. [Google Scholar]
- Al-Shalabi, M.A.; Alkasabi, F.; Ali, M. Reservoir Damage and Productivity Decline in Depletion-Driven Development of Fractured Carbonates. J. Pet. Sci. Eng. 2020, 193, 107421. [Google Scholar]
- Gao, C.; Rao, X.; Guo, P. Economic Risks of Depletion Production in Mature Oilfields Under Low Oil Prices. Energy Rep. 2022, 8, 12345–12356. [Google Scholar]
- Tao, Q.; Ezulike, D.O.; Dehghanpour, H. Negative Effects of Depletion on Shale Gas Recovery: Geomechanical and Flow Diagnostics. SPE J. 2023, 28, 1234–1250. [Google Scholar]
- Santos, L.; Lopes, J.; Alves, I. Subsidence and Caprock Integrity in Offshore Depletion Development: Numerical Modeling Insights. Mar. Pet. Geol. 2024, 161, 106678. [Google Scholar]
- Liu, Q.; Sun, L.; Yang, Z. Economic Limit Production in Depletion Development of Low-Permeability Reservoirs. Pet. Sci. Bull. 2019, 4, 456–465. [Google Scholar]
- Zhao, X.; Chen, J.; Liu, H. Quantitative Evaluation of Productivity Loss Due to Fracture Closure in Tight Gas Depletion Development. Nat. Gas Ind. 2021, 41, 60–68. [Google Scholar]
- Wang, F.; Pan, Z.; Zhang, S.; Wu, Y. Optimization of Multi-Stage Fracturing in Tight Oil Reservoirs Using Integrated Geological and Engineering Data. Energies 2021, 14, 4567. [Google Scholar]
- Liu, P.; Li, X.; Zhang, J. Temporary Plugging and Diverting Fracturing in Low-Permeability Heterogeneous Reservoirs. J. Pet. Sci. Eng. 2020, 195, 107653. [Google Scholar]
- Wang, Y.; Rahman, S.S. Nanofluid-Assisted Spontaneous Imbibition for Enhanced Oil Recovery in Tight Reservoirs. Energies 2022, 15, 1021. [Google Scholar]
- Guo, H.; Li, Y.; Wang, F. Mechanisms of Surfactant-Enhanced Imbibition in Shale Oil Reservoirs. SPE J. 2019, 24, 2751–2767. [Google Scholar]
- Zhang, K.; Jia, N.; Li, S. CO2 Injection Strategies for Enhanced Oil Recovery in Low-Permeability Reservoirs: Experimental and Simulation Study. Energies 2021, 14, 7584. [Google Scholar]
- Alotaibi, M.B.; Yousef, A.A. Low-Salinity Waterflooding in Carbonate Reservoirs: Impact of Brine Composition. Energies 2019, 12, 1082. [Google Scholar]
- Zhao, F. Mobility Control Using Nano-Sized Polymer Microspheres for Low-Permeability Reservoirs. Fuel 2022, 310, 122341. [Google Scholar]


| Core No | Permeability (mD) | Porosity (%) |
|---|---|---|
| 1 | 156 | 20.3 |
| 2 | 93 | 17.2 |
| Core No | Core Length (cm) | Permeability (mD) | Porosity (%) |
|---|---|---|---|
| 1 | 4.50 | 71.6 | 21.63 |
| 2 | 4.07 | 68.83 | 21.59 |
| 3 | 3.43 | 63.37 | 21.42 |
| 4 | 3.98 | 60.42 | 21.67 |
| 5 | 4.20 | 93.78 | 22.58 |
| 6 | 3.80 | 45.65 | 21.70 |
| 7 | 4.34 | 104.37 | 23.33 |
| 8 | 3.68 | 113.19 | 23.55 |
| 9 | 4.47 | 33.82 | 20.79 |
| 10 | 4.33 | 121.95 | 23.85 |
| 11 | 4.29 | 28.72 | 21.79 |
| 12 | 4.34 | 231.29 | 22.58 |
| 13 | 3.87 | 205.29 | 22.25 |
| 14 | 4.57 | 521.05 | 24.67 |
| Core No | Core Length (cm) | Permeability (mD) | Porosity (%) |
|---|---|---|---|
| 1 | 5.55 | 223.3 | 24.97 |
| 2 | 5.63 | 205.1 | 23.22 |
| 3 | 6.21 | 225.7 | 24.45 |
| 4 | 5.12 | 241.3 | 26.86 |
| 5 | 5.47 | 196.4 | 22.46 |
| 6 | 6.08 | 192.6 | 22.38 |
| 7 | 5.97 | 189.7 | 21.10 |
| 8 | 5.11 | 257.1 | 23.29 |
| 9 | 5.18 | 176.3 | 21.90 |
| 10 | 5.23 | 293.4 | 22.15 |
| Core No | Core Length (cm) | Permeability (mD) | Porosity (%) |
|---|---|---|---|
| 1 | 5.51 | 221.4 | 24.54 |
| 2 | 5.72 | 205.6 | 24.44 |
| 3 | 6.13 | 223.4 | 22.13 |
| 4 | 5.38 | 239.1 | 20.56 |
| 5 | 5.61 | 198.4 | 25.02 |
| 6 | 5.92 | 192.7 | 24.57 |
| 7 | 6.02 | 191.2 | 25.07 |
| 8 | 5.04 | 256.3 | 25.66 |
| 9 | 4.83 | 175.9 | 26.95 |
| 10 | 5.40 | 290.1 | 22.08 |
| Core No | Core Length (cm) | Permeability (mD) | Porosity (%) |
|---|---|---|---|
| 1 | 5.55 | 40.28 | 22.11 |
| 2 | 5.61 | 46.35 | 19.21 |
| 3 | 5.31 | 29.94 | 19.19 |
| 4 | 5.54 | 64.81 | 22.76 |
| 5 | 6.40 | 11.85 | 20.61 |
| 6 | 5.26 | 68.04 | 22.90 |
| 7 | 5.33 | 82.90 | 26.83 |
| 8 | 5.44 | 66.99 | 25.60 |
| 9 | 5.40 | 66.61 | 21.40 |
| 10 | 5.52 | 98.67 | 18.51 |
| Cation | Anion | TDS (mg/L) | PH | Water-Based | |||||
|---|---|---|---|---|---|---|---|---|---|
| Na+, K+ | Mg2+ | Ca2+ | Cl− | SO42− | HCO3− | CO32− | |||
| 1601 | 6 | 7 | 353 | 26 | 3286 | 60 | 5462 | 7~8 | NaHCO3 |
| Scheme No | Displacement Process | ||
|---|---|---|---|
| Gas Flooding | Depletion Development | Cyclic Injection–Production | |
| 1 | / | Pressure depletion to the lower limit | Cyclic gas injection–production at the inlet |
| 2 | / | Pressure depletion to the lower limit | Cyclic gas injection was conducted through the inlet terminal while simultaneous gas production was maintained at both the inlet and outlet terminals. |
| 3 | Gas flooding continued until oil production ceased | / | Cyclic gas injection–production at the inlet |
| 4 | Gas flooding continued until oil production ceased | / | Cyclic gas injection was conducted through the inlet terminal while simultaneous gas production was maintained at both the inlet and outlet terminals. |
| 5 (Control Group) | Gas flooding continued until oil production ceased | / | Cyclic gas injection was conducted through the inlet terminal while simultaneous gas production was maintained at both the inlet and outlet terminals. |
| 6 (Experimental Group) | |||
| Main Parameters | Unit |
|---|---|
| Inlet pressure | MPa |
| Outlet pressure | MPa |
| Confining pressure | MPa |
| Back pressure | MPa |
| Liquid production rate | mL |
| Gas production rate | mL |
| Core NO | Experimental Protocol | Water Flooding Recovery Efficiency (%) | Gas Flooding Recovery Efficiency (%) | Ultimate Recovery Efficiency (%) |
|---|---|---|---|---|
| 1 | Gas flooding | / | 41.85 | 41.85 |
| 2 | Water flooding-to-gas flooding transition | 42.77 | 17.69 | 60.46 |
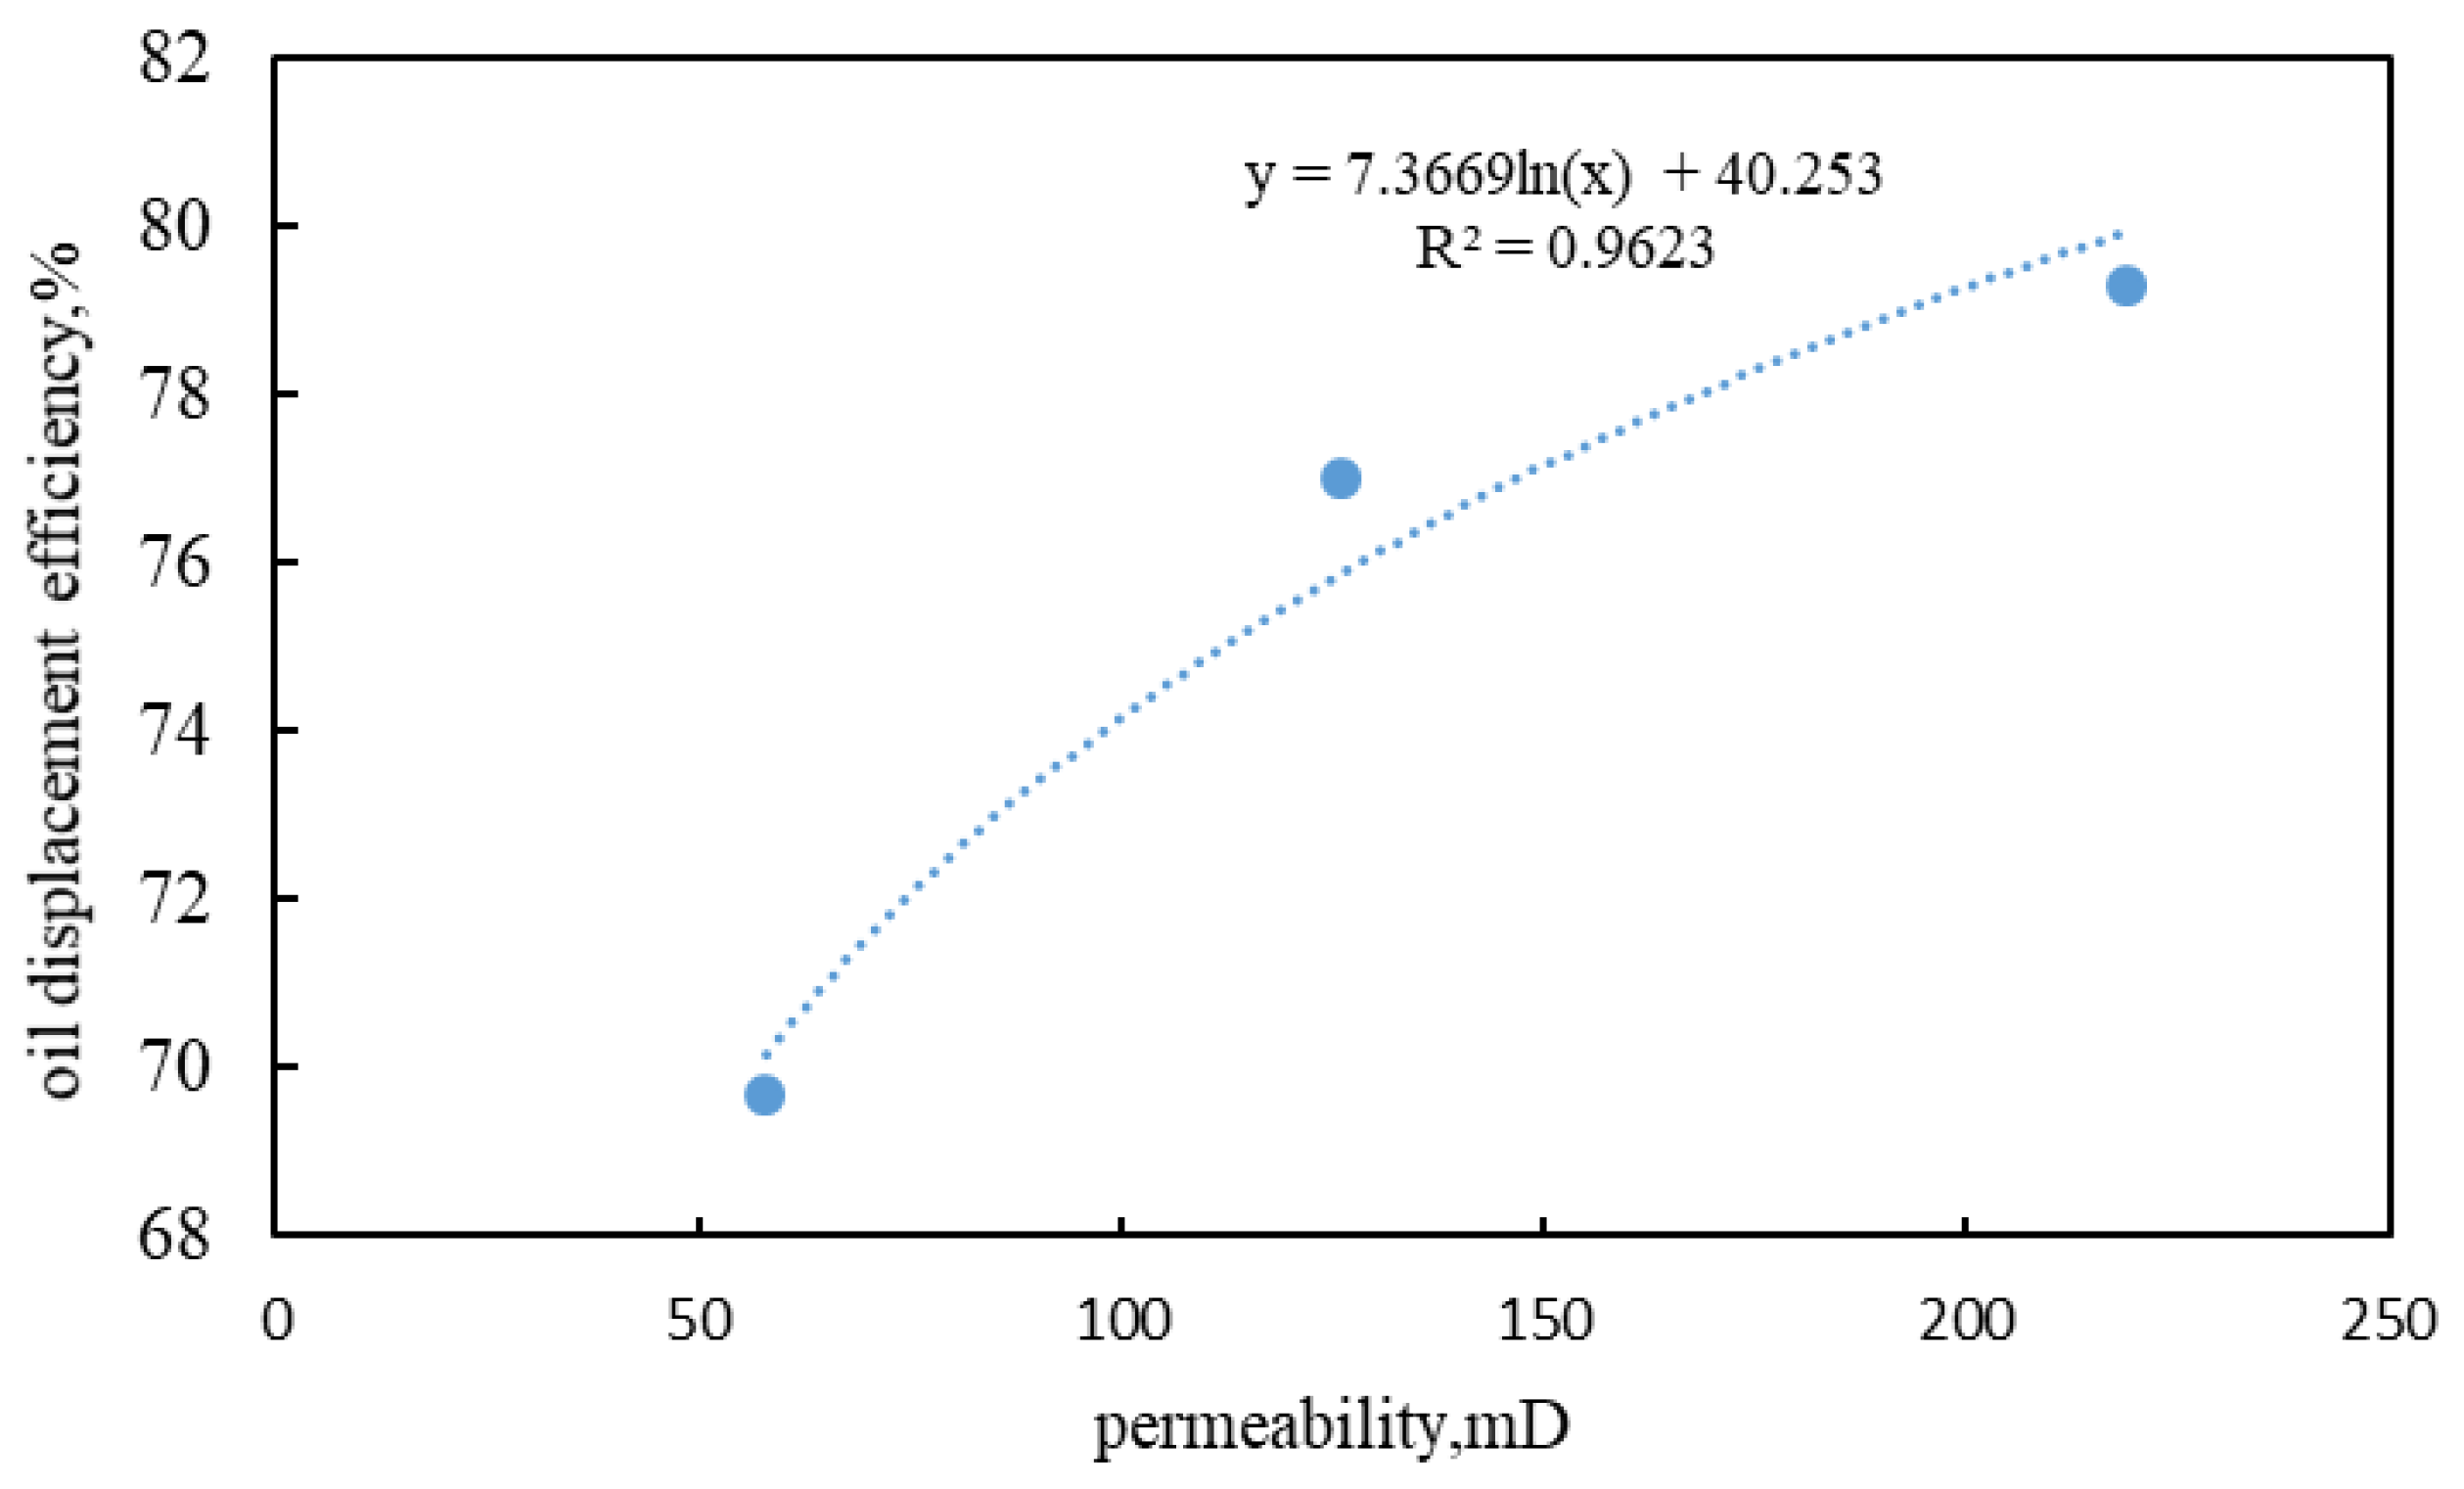
| Scheme No | Average Core Permeability (mD) | Oil Displacement Efficiency (%) |
|---|---|---|
| 6 (Low Permeability) | 57.6 | 69.7 |
| 4 | 126.0 | 77.0 |
| 6 (High Permeability) | 219.2 | 79.3 |
Disclaimer/Publisher’s Note: The statements, opinions and data contained in all publications are solely those of the individual author(s) and contributor(s) and not of MDPI and/or the editor(s). MDPI and/or the editor(s) disclaim responsibility for any injury to people or property resulting from any ideas, methods, instructions or products referred to in the content. |
© 2025 by the authors. Licensee MDPI, Basel, Switzerland. This article is an open access article distributed under the terms and conditions of the Creative Commons Attribution (CC BY) license (https://creativecommons.org/licenses/by/4.0/).
Share and Cite
Tang, Y.; Zheng, P.; Tang, Z.; Cheng, M.; Wang, Y. Research on Multi-Cycle Injection–Production Displacement Characteristics and Factors Influencing Storage Capacity in Oil Reservoir-Based Underground Gas Storage. Energies 2025, 18, 3330. https://doi.org/10.3390/en18133330
Tang Y, Zheng P, Tang Z, Cheng M, Wang Y. Research on Multi-Cycle Injection–Production Displacement Characteristics and Factors Influencing Storage Capacity in Oil Reservoir-Based Underground Gas Storage. Energies. 2025; 18(13):3330. https://doi.org/10.3390/en18133330
Chicago/Turabian StyleTang, Yong, Peng Zheng, Zhitao Tang, Minmao Cheng, and Yong Wang. 2025. "Research on Multi-Cycle Injection–Production Displacement Characteristics and Factors Influencing Storage Capacity in Oil Reservoir-Based Underground Gas Storage" Energies 18, no. 13: 3330. https://doi.org/10.3390/en18133330
APA StyleTang, Y., Zheng, P., Tang, Z., Cheng, M., & Wang, Y. (2025). Research on Multi-Cycle Injection–Production Displacement Characteristics and Factors Influencing Storage Capacity in Oil Reservoir-Based Underground Gas Storage. Energies, 18(13), 3330. https://doi.org/10.3390/en18133330