Article

Detailed Building Energy Impact Analysis of XPS Insulation Degradation Using Existing Long-Term Experimental Data

1
Department of Architectural Engineering, Chungbuk National University, Cheongju 28644, Republic of Korea
2
BECUBE. Inc., Cheongju 28644, Republic of Korea
*
Author to whom correspondence should be addressed.
Energies 2025, 18(13), 3260; https://doi.org/10.3390/en18133260 (registering DOI)
Submission received: 25 April 2025 / Revised: 19 May 2025 / Accepted: 18 June 2025 / Published: 21 June 2025

Abstract

:
This study investigates the long-term impact of insulation degradation on building heating energy consumption, with a focus on extruded polystyrene (XPS) insulation. Year-by-year degradation in thermal transmittance was derived from long-term experimental data and applied to prototypical energy models of multifamily apartment buildings and office buildings. Simulations were performed using both Actual Meteorological Year (AMY) and Typical Meteorological Year (TMY) data for six cities representing Korea’s major climate zones. The results showed that insulation degradation led to a significant increase in heating energy consumption from 23.2% to 34.9% in AMY simulations and 23.5% to 36.2% in TMY simulations for multifamily apartment buildings over 15 years. The difference between the AMY and TMY estimates was within 4%, demonstrating the reliability of TMY for long-term performance assessments. Notably, the southern and Jeju zones exhibited higher sensitivity to degradation due to their relaxed insulation standards and lower initial thermal performance. Office buildings were less affected, with increases below 8%, attributed to smaller envelope areas and higher internal heat gains. These findings highlight the need for zone-specific insulation standards and differentiated energy-saving design strategies by building type to ensure long-term energy efficiency.

1. Introduction

At the COP26 conference, the South Korean government announced an enhanced 2030 Nationally Determined Contribution (NDC), aiming to reduce greenhouse gas emissions by 40% compared to 2018 levels. In alignment with this commitment, the Ministry of Land, Infrastructure, and Transport (MLIT) has introduced a Carbon Neutral Roadmap designed to achieve ‘Net-Zero Emissions’ in the building sector by 2050. According to this roadmap, the MLIT aims to reduce carbon emissions from the building sector by 32.8% compared to 2018 levels by 2030. The primary measures proposed to achieve this target include expanding the mandatory scope of zero-energy buildings and promoting green remodeling projects for existing buildings [1].
Similar to South Korea, the fundamental approach adopted by countries around the world to achieve their national greenhouse gas reduction targets is the formulation and implementation of building energy policies. A key aspect of these policies is the establishment of appropriate minimum insulation performance standards, which serve as an essential element in the promotion of energy conservation within the building sector.
As shown in Table 1, major countries such as Korea [2,3,4,5,6,7], Denmark [8,9,10,11], the United States [12,13,14,15,16,17], and Germany [18,19] have continuously strengthened their thermal transmittance (U-value) standards for the exterior walls of buildings over the past 15 years. This trend of strengthening standards reflects a global effort to improve the thermal performance of building envelopes in pursuit of carbon neutrality goals.
In particular, South Korea has strengthened its external wall U-value standards by approximately 62% over the past 15 years compared to the 2007 level, which is significantly higher than the corresponding increases observed in the United States (56%), Germany (37%), and Denmark (25%). This indicates that while all countries have commonly pursued more stringent standards, Korea has exhibited the most rapid rate of enhancement.
In addition, Korea’s climatic-zone-specific U-value standards for external walls shows that the southern and Jeju zones have maintained relatively more relaxed requirements due to their milder climate characteristics, compared to the central zones.
The thermal transmittance of insulation materials plays a crucial role in determining the overall thermal performance (U-value) of the building envelope. Accordingly, the continued tightening of these standards is recognized as a key strategy for improving buildings’ energy efficiency and reducing greenhouse gas emissions.
Polystyrene is one of the most commonly employed organic insulation materials. Within this category, expanded polystyrene (EPS) and extruded polystyrene (XPS) are characterized by their unique manufacturing processes and aging characteristics, despite both being derived from polystyrene. The production of EPS involves the steam expansion of pentane-infused polystyrene beads, resulting in open-cell structures with a density ranging from 11 to 32 kg/m3. This process is followed by block molding and curing to eliminate residual blowing agents. In contrast, XPS is produced through a continuous extrusion process utilizing CO2/HFC blowing agents, which yields closed-cell matrices with a density between 28 and 45 kg/m3, complemented by protective surface skin layers.
The degradation patterns of thermal resistance for these materials exhibit notable differences. EPS demonstrates a 2.96% loss in R-value over a 20-year period, attributable to its open-cell structure that mitigates the impact of residual blowing agents [20]. Conversely, XPS exhibits a 10–15% decline in thermal performance over 50 years due to the gradual diffusion of the blowing agent trapped within its closed-cell structure [21].
There appears to be significant variation in the reported long-term thermal performance degradation of XPS, depending on the manufacturer, researcher, and experimental methodology. For example, Choi and Kang (2013) conducted an experimental study on the long-term performance of XPS insulation in accordance with KS M ISO 11561 [22]. This standard utilizes accelerated aging tests to assess the long-term thermal resistance changes in closed-cell plastic insulation materials. According to their findings, the thermal conductivity of XPS increased by 25.4%, to 41.8% [22]. Similarly, Lee and Nah (2017) [23] analyzed the performance degradation of XPS insulation extracted from buildings with service lives ranging from 1 to 10 years, using the KS M ISO 11561:2009 standard. They reported an increase in thermal conductivity ranging from 0.85% to 8.52% [23]. G. Eleftheriadis and M. Hamdy (2018), citing the work of Singh (2007), analyzed the impact of insulation performance degradation on building energy consumption [24,25]. They asserted that in the first year of installation, the thermal conductivity of the insulation could increase by a factor of 1.55 [24,25]. Although the existing literature reports varying degrees of long-term increases in the thermal transmittance of XPS insulation, it is clear that XPS can have a significant impact on a building’s long-term energy consumption.
In South Korea, while the minimum thermal transmittance standards for building envelope components such as exterior walls are clearly defined, there are currently no explicit regulatory criteria that directly reflect the long-term degradation characteristics of insulation materials such as XPS. Instead, manufacturers are required to present performance values that account for aging when applying for KS certification, and the Building Energy-Saving Design Standards (BESDS) have been gradually strengthened in terms of overall insulation performance, serving as an indirect response. Recently, discussions have also been held regarding the introduction of design correction factors based on long-term degradation data [26]. However, in order to incorporate such correction factors into design standards, it is necessary to first quantitatively evaluate the impact of insulation degradation on actual building energy consumption. Since it is difficult to secure foundational data—such as long-term climate data, insulation degradation characteristics, and validated prototypical building models—related studies remain limited.
In this study, to demonstrate the impact of thermal transmittance degradation on heating energy consumption, a series of detailed building energy simulations were developed, categorized by building type and climatic zones. Regarding long-term thermal transmittance degradation data for XPS insulation, Choi et al.’s (2018) [27] experimental research results were used. Six climatic-zone-representative cities were selected, and two types of prototypical building energy models were utilized. Both long-term actual weather data (AMY) and typical weather data (TMY) were constituted throughout a web-based weather generation tool.

2. Literature Review

Conducting research on the long-term thermal transmittance of building insulation materials is challenging due to difficulties in obtaining actual aged samples. For this reason, accelerated aging test methods, such as those specified in the KS M ISO 11561 standard, are commonly employed. (Kim et al., 2020) [28].
Kim & Choi (2019) [26] obtained insulation samples from buildings that had been in use for an extended period after completion. They measured the thermal transmittance of the aged insulation and estimated its impact on building energy consumption, comparing the results with the performance of the insulation in its initial state [26].
Choi et al. (2018) [27] conducted a long-term experiment over approximately 7200 days to observe the degradation of insulation performance. In this experiment, XPS insulation materials produced within three days were installed under interior insulation conditions in the wall structure of an actual building and stored under constant indoor conditions (temperature 23 ± 2 °C, relative humidity 50 ± 5%) according to KS A 0006 (Standard Atmospheric Conditions for Testing). Long-term thermal performance changes were monitored. As a result, after about 5000 days, the thermal resistance (R-value) of the XPS insulation decreased by approximately 39.8 ~ 42.7% compared to its initial value. In a subsequent study, Choi (2022) [29] compared the thermal resistance of the same specimens after 7200 days (approximately 20 years) with the thermal resistance obtained from an accelerated aging test simulating 25 years of aging, using the method specified in KS M ISO 11561. While there was a difference in the point at which the transition in thermal resistance occurred between the two experiments, the final thermal resistance values showed a tendency to converge within a 10% difference after approximately 10 years.
A. Batard et al. (2018) [30] performed one of the few simulation studies that have been conducted so far on the long-term performance of insulation materials. They simulated and analyzed the energy consumption of low-energy buildings according to the aging characteristics of vacuum insulation materials. They compared their results with those of other studies that measured the thermal performance degradation of insulation materials and its impact on energy consumption. The simulation results indicate that the thermal conductivity of VIP insulation installed in a flat roof undergoes a notable increase during the initial 2 to 3 years. Subsequently, around 20 years later, the thermal conductivity shows an approximately 50% increase compared to the initial period [30].
D’Agostino et al. (2022) measured the change in long-term thermal transmittance of ETICSs (External Thermal Insulation Composite Systems) made of polyurethane (PU) and EPS through accelerated testing and thermal resistance according to EAD 040,083 (European Assessment Documents) and EN12667 [31]. The findings from the measurements indicated a marginal escalation in thermal conductivity, approximately 4%. These results were subsequently incorporated into an energy model for a single-family residence situated in three distinct Italian cities: Palermo, Naples, and Turin. A comparative analysis between the initial heating energy consumption and that after eight years revealed an annual increase of 1% to 2% in all three studied cities. This finding suggests that the performance degradation of ETICSs (External Thermal Insulation Composite Systems) may differ from the deterioration patterns previously anticipated in studies focused solely on the insulation materials themselves.
When assessing the long-term performance degradation of insulation materials, not only the change in thermal conductivity over time but also the sensitivity to environmental factors, such as operating temperature and humidity, must be carefully considered. Khoukhi (2018) [32] conducted a study on polystyrene-based insulation materials and found that their insulation performance significantly deteriorates with increasing temperature and humidity. Specifically, the calculated cooling load at 28 °C and 30% relative humidity increased by approximately 8% compared to that at 24 °C and 0% relative humidity. Additionally, Yang et al. (2022) [33] experimentally confirmed that the thermal conductivity of XPS increased by about 9.4% under 98% relative humidity compared to dry conditions. Such temperature- and humidity-dependent behavior suggests that the degradation of insulation performance may be further exacerbated in hot and humid climates. Therefore, to more accurately analyze the long-term degradation characteristics of insulation, it is necessary to consider not only time-dependent degradation but also property changes under hygrothermal conditions.
Table 2 is an additional review summary of studies on changes in insulation performance or changes in energy consumption associated with it. Each study shows a different rate of long-term performance change in insulation materials, but a clear performance degradation can be observed.
The insulation degradation model constructed in this study is based on long-term experimental data of XPS insulation materials presented by Choi et al. (2018) [27] and Choi (2022) [29]. Since the experiments were conducted under conditions simulating an interior insulation structure, the degradation simulation model used in this study also assumes interior insulation conditions. Accordingly, it may differ from exterior insulation or fully exposed outdoor conditions. Therefore, the potential mitigating effects of special finishing materials or external protective layers on insulation degradation are not within the scope of this study.
In addition, the long-term experimental data used in this study were obtained under standard conditions (23 ± 2 °C, 50 ± 5% relative humidity) specified in KS A 0006, over a period of approximately 20 years. The observed degradation reflects time-dependent behavior and is interpreted not as a simple material property change but as the cumulative result of multiple mechanisms, such as gas diffusion and moisture penetration over time. This degradation trend was implemented in the building energy simulation tool as a change in U-value.
Based on these assumptions, this study aims to quantitatively assess the impact of long-term insulation performance degradation on building energy consumption, targeting typical multifamily and office buildings with interior insulation structures in representative Korean climate conditions.

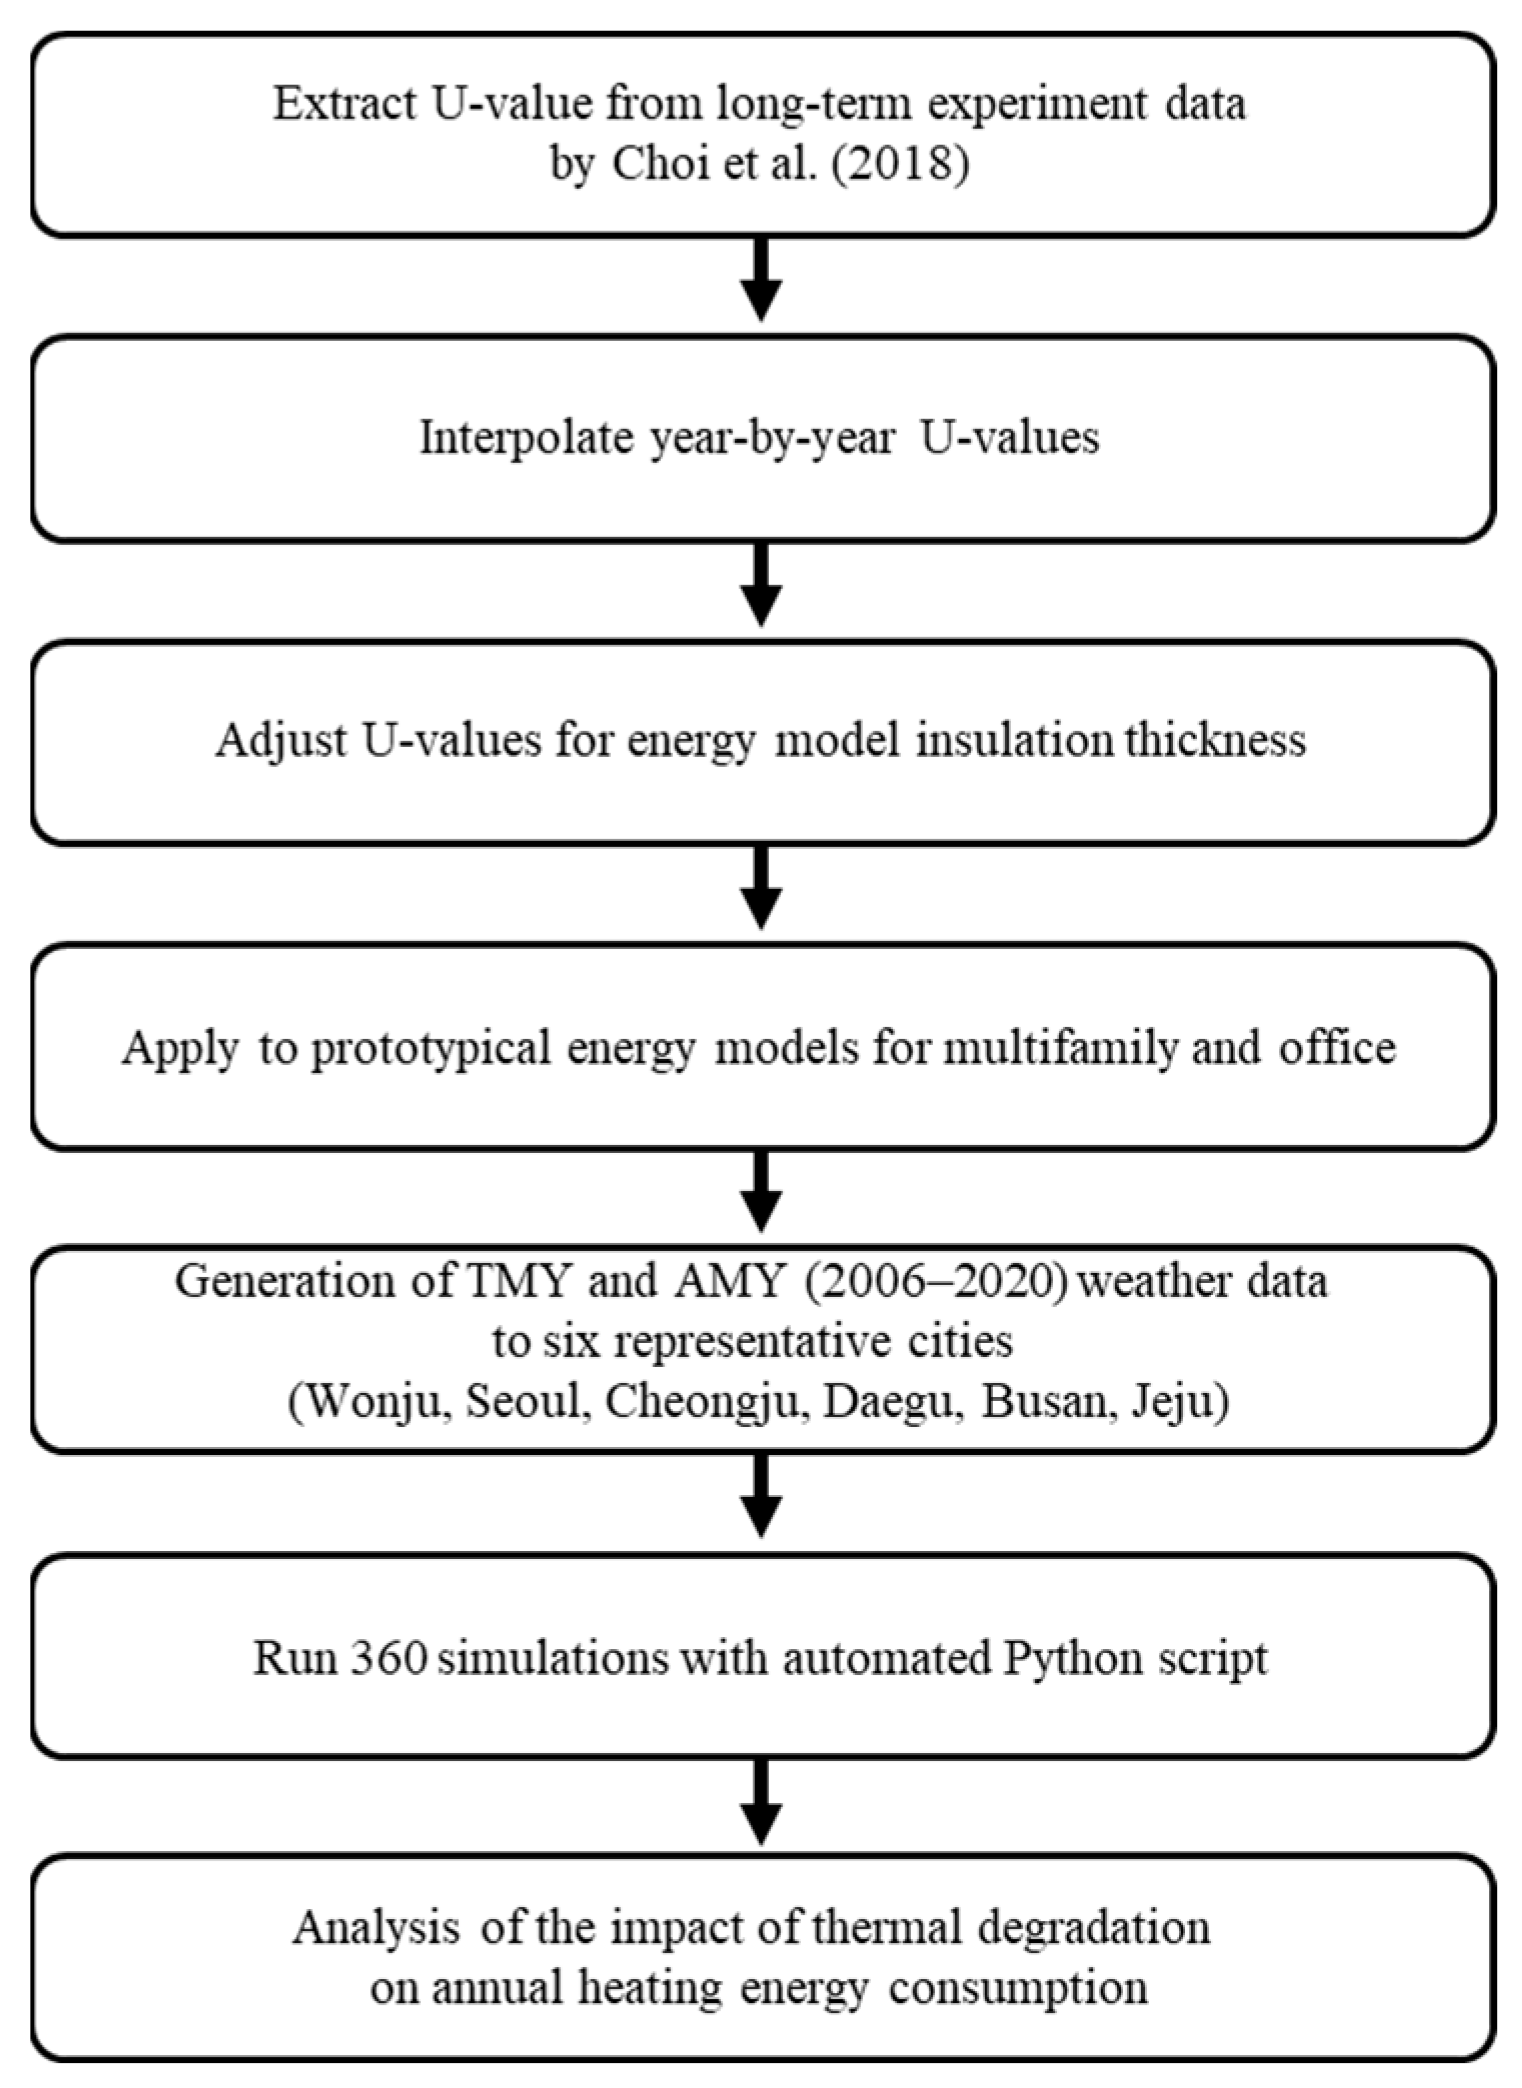
3. Data and Energy Models’ Collection, Simulation, and Analysis

This study was conducted through a systematically structured methodology to evaluate the long-term impact of insulation performance degradation on building energy consumption. The overall research process is illustrated in Figure 1. First, based on the experimental data from Choi et al. (2018) [27], the degradation of thermal resistance was interpolated year by year, and the corresponding thermal conductivity values were estimated. These thermal conductivity changes were applied to the insulation layer properties of prototypical energy models for two representative building types: multifamily apartment buildings and office buildings.
Simulations were performed for six cities (Wonju, Seoul, Cheongju, Daegu, Busan, and Jeju) representing three major climate zones: central, southern, and Jeju. For each city, both Typical Meteorological Year (TMY) data and Actual Meteorological Year (AMY) data from 2006 to 2020 were generated and applied to reflect climate variation. A total of 360 simulations were conducted, and a Python-based automation script (developed using Python 3.11.0) was utilized to streamline input file generation, simulation execution, and result aggregation. Finally, the influence of long-term thermal transmittance degradation on annual heating energy consumption was quantitatively analyzed under various climatic and building conditions.
Through such processes, it is expected that the long-term impact of insulation degradation on building energy consumption can be quantified based on variables such as climate and building usage.

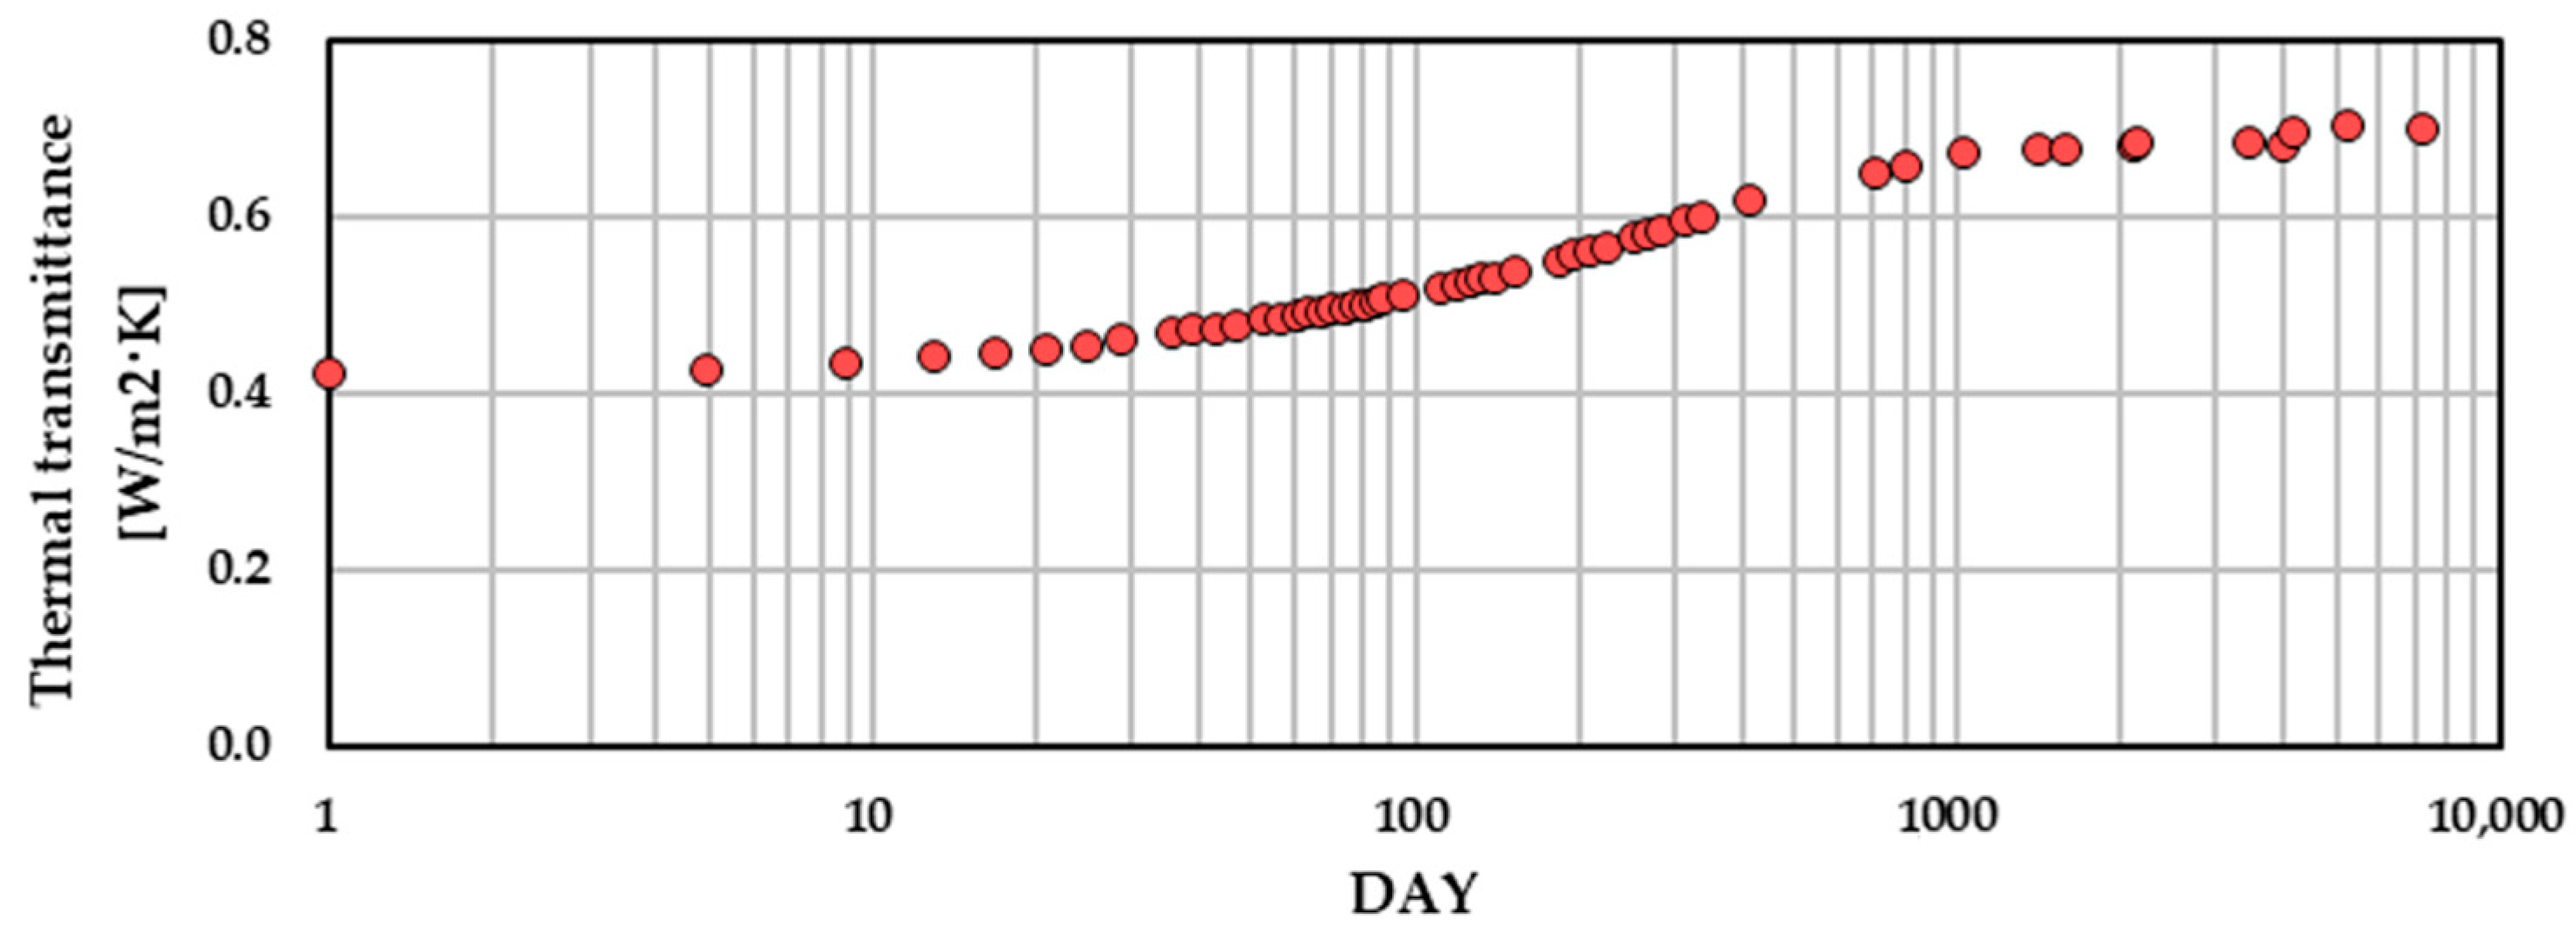
3.1. Determination of Yearly XPS Insulation Thermal Transmittance

In this study, instead of relying on accelerated aging tests, the long-term experimental data from Choi et al. (2018 and 2022) [27,29], who conducted real-time measurements of XPS insulation performance, were utilized. The referenced study intermittently measured the thermal resistance (R-value) of XPS insulation over approximately 7200 days. These irregularly spaced measurements were linearly interpolated to create an annual U-value dataset for use in yearly energy simulations. This approach was designed to reflect the gradual year-by-year degradation of insulation performance after building completion. The annually adjusted U-values were incorporated into the building energy simulation model as part of the thermal envelope inputs, and then combined with AMY (Actual Meteorological Year) data to estimate energy consumption for each corresponding year.

3.1.1. Extracting Yearly Thermal Transmittance

Figure 2 depicts the thermal transmittance measurement results of EPS insulation over a period of about 20 years following construction, as derived from the research conducted by Choi et al. (2018 and 2022) [27,29]. During the initial approximately 1000 days, there was a significant change in the U-value, after which the rate of change gradually decreased.
To simulate the gradual rise in heating energy consumption attributed to the increasing thermal transmittance, it was presumed that the thermal transmittance increases by an annual increment. Table 3 displays the interpolated outcomes of annual thermal transmittance over a span of 20 years, utilizing the temporally irregular data from Figure 2. The calculations revealed that the change rate after 15 years was less than 0.1%, suggesting the assumption that thermal transmittance stabilized after 15 years.

3.1.2. Calculation of Thermal Transmittance for the Building Energy Model

In this study, it is assumed that the target building was newly constructed in 2006. Table 4 summarizes the BESDS in effect at the time of construction, while Table 5 presents the recalculated annual U-values that incorporate insulation degradation, based on the degradation trends shown in Table 3. In South Korea, U-value standards are categorized by building envelope component, building use, and climate zone.
Unlike Table 3, which presents the U-value changes of XPS insulation alone, Table 5 shows the annual U-value and its rate of change for the entire exterior wall assembly, which includes the aging insulation material. As a result, the annual rate of change differs between the two tables due to the influence of other wall components that remain stable over time.

3.2. Building Energy Model and Input Data

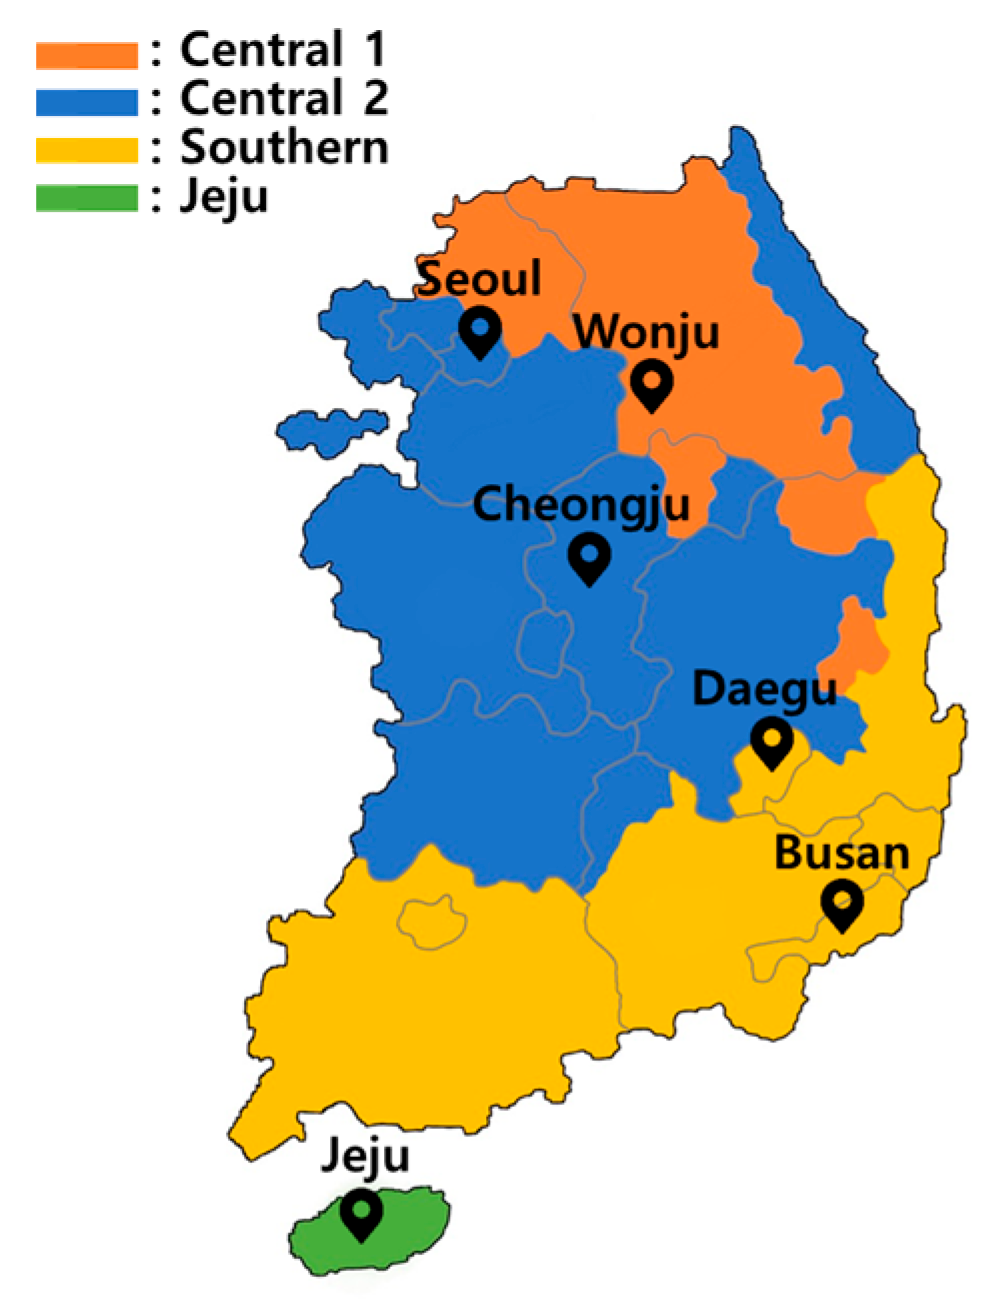
3.2.1. Selection of Representative Cities by Climate Zone and Generation of TMY and AMY Data

Figure 3 illustrates the geographical locations and categorized climate zones of the BESDS. Additionally, Table 6 provides the latitude, longitude, and heating and cooling degree-days information of the selected cities for this research.
In this research, building energy simulations were carried out utilizing both actual Annual Meteorological Year (AMY) data covering a 15-year period (2006–2020) and Typical Meteorological Year (TMY) data representing typical climate characteristics for the same duration. The generation of TMY and AMY datasets for each city was accomplished using the Typical Meteorological Data Processor, developed based on Seo (2010) [37] and the NREL TMY2 Manual (NREL, 1995) [38]. The raw weather data used for this process were obtained from hourly observation records provided by the Korea Meteorological Administration (KMA) for each respective city. The TMY and AMY data are available at https://becube.kr (accessed on 15 December 2024).

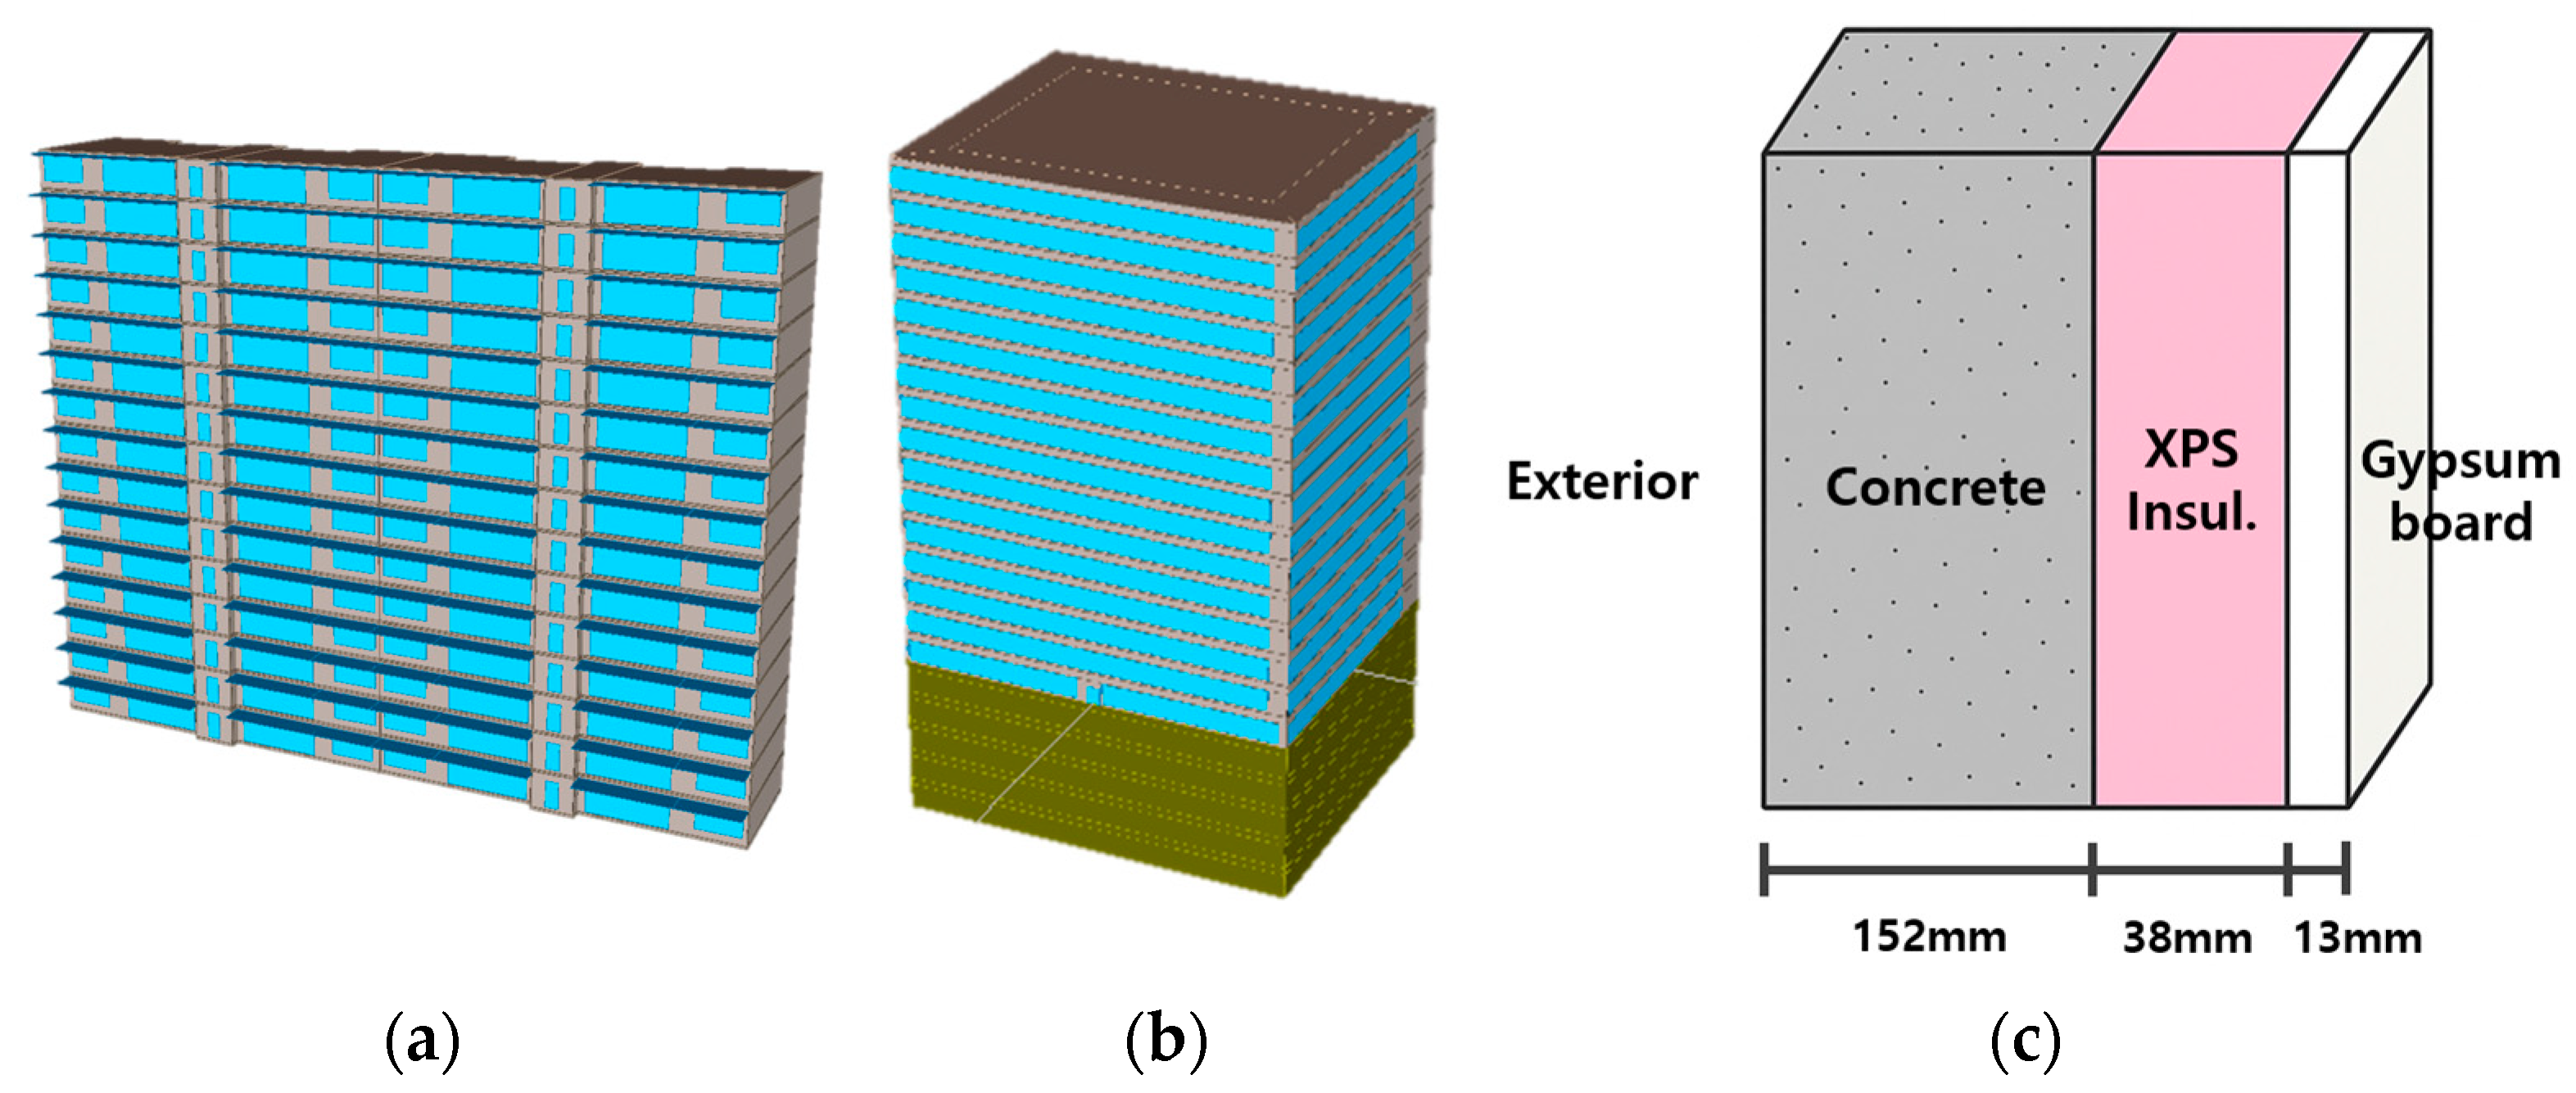
3.2.2. Prototypical Building Energy Models

To evaluate the impact of thermal transmittance degradation of the building envelope on heating energy consumption, this study constructed simulation models for multifamily apartment buildings and office buildings by referencing prototypical energy models proposed in the studies by Seo et al. (2014) [39] and Choi et al. (2016) [40] (Table 7A,B and Figure 4). The multifamily apartment building model was defined based on a comprehensive analysis of public building databases, governmental reports, and domestic and international prototypical model literature (Seo et al., 2014) [39], and its energy consumption was validated through comparison with residential energy benchmark data developed using the Household Energy Panel Survey (HEPS) [41] in Korea (Kim et al., 2023) [42]. The office building model was defined using data from the Permanent Sample Survey on Building Energy Consumption (Choi et al., 2016) [40], and its validity was verified through comparison with actual annual energy consumption data (Kim et al., 2021) [43].
Accordingly, the two building energy models used in this study are representative simulation models constructed and validated based on empirical data from national statistics, and they appropriately reflect the typical energy performance characteristics of Korean multifamily apartment buildings and office buildings with interior insulation systems.
Multifamily apartment buildings are classified as envelope-load-dominated buildings, whereas office buildings—particularly medium–large-scale ones—are typically considered to be internal-load-dominated buildings. Therefore, it can be expected that changes in heating energy consumption resulting from increases in envelope U-values will differ between the two building types due to these distinct load characteristics.
Given the necessity for a total of 360 simulations (2 × 6 × 15 × 2), an automation code was developed using Python to facilitate tasks such as input file editing, simulation, and results summary.

4. Impact on Heating Energy by Annual Thermal Transmittance Change

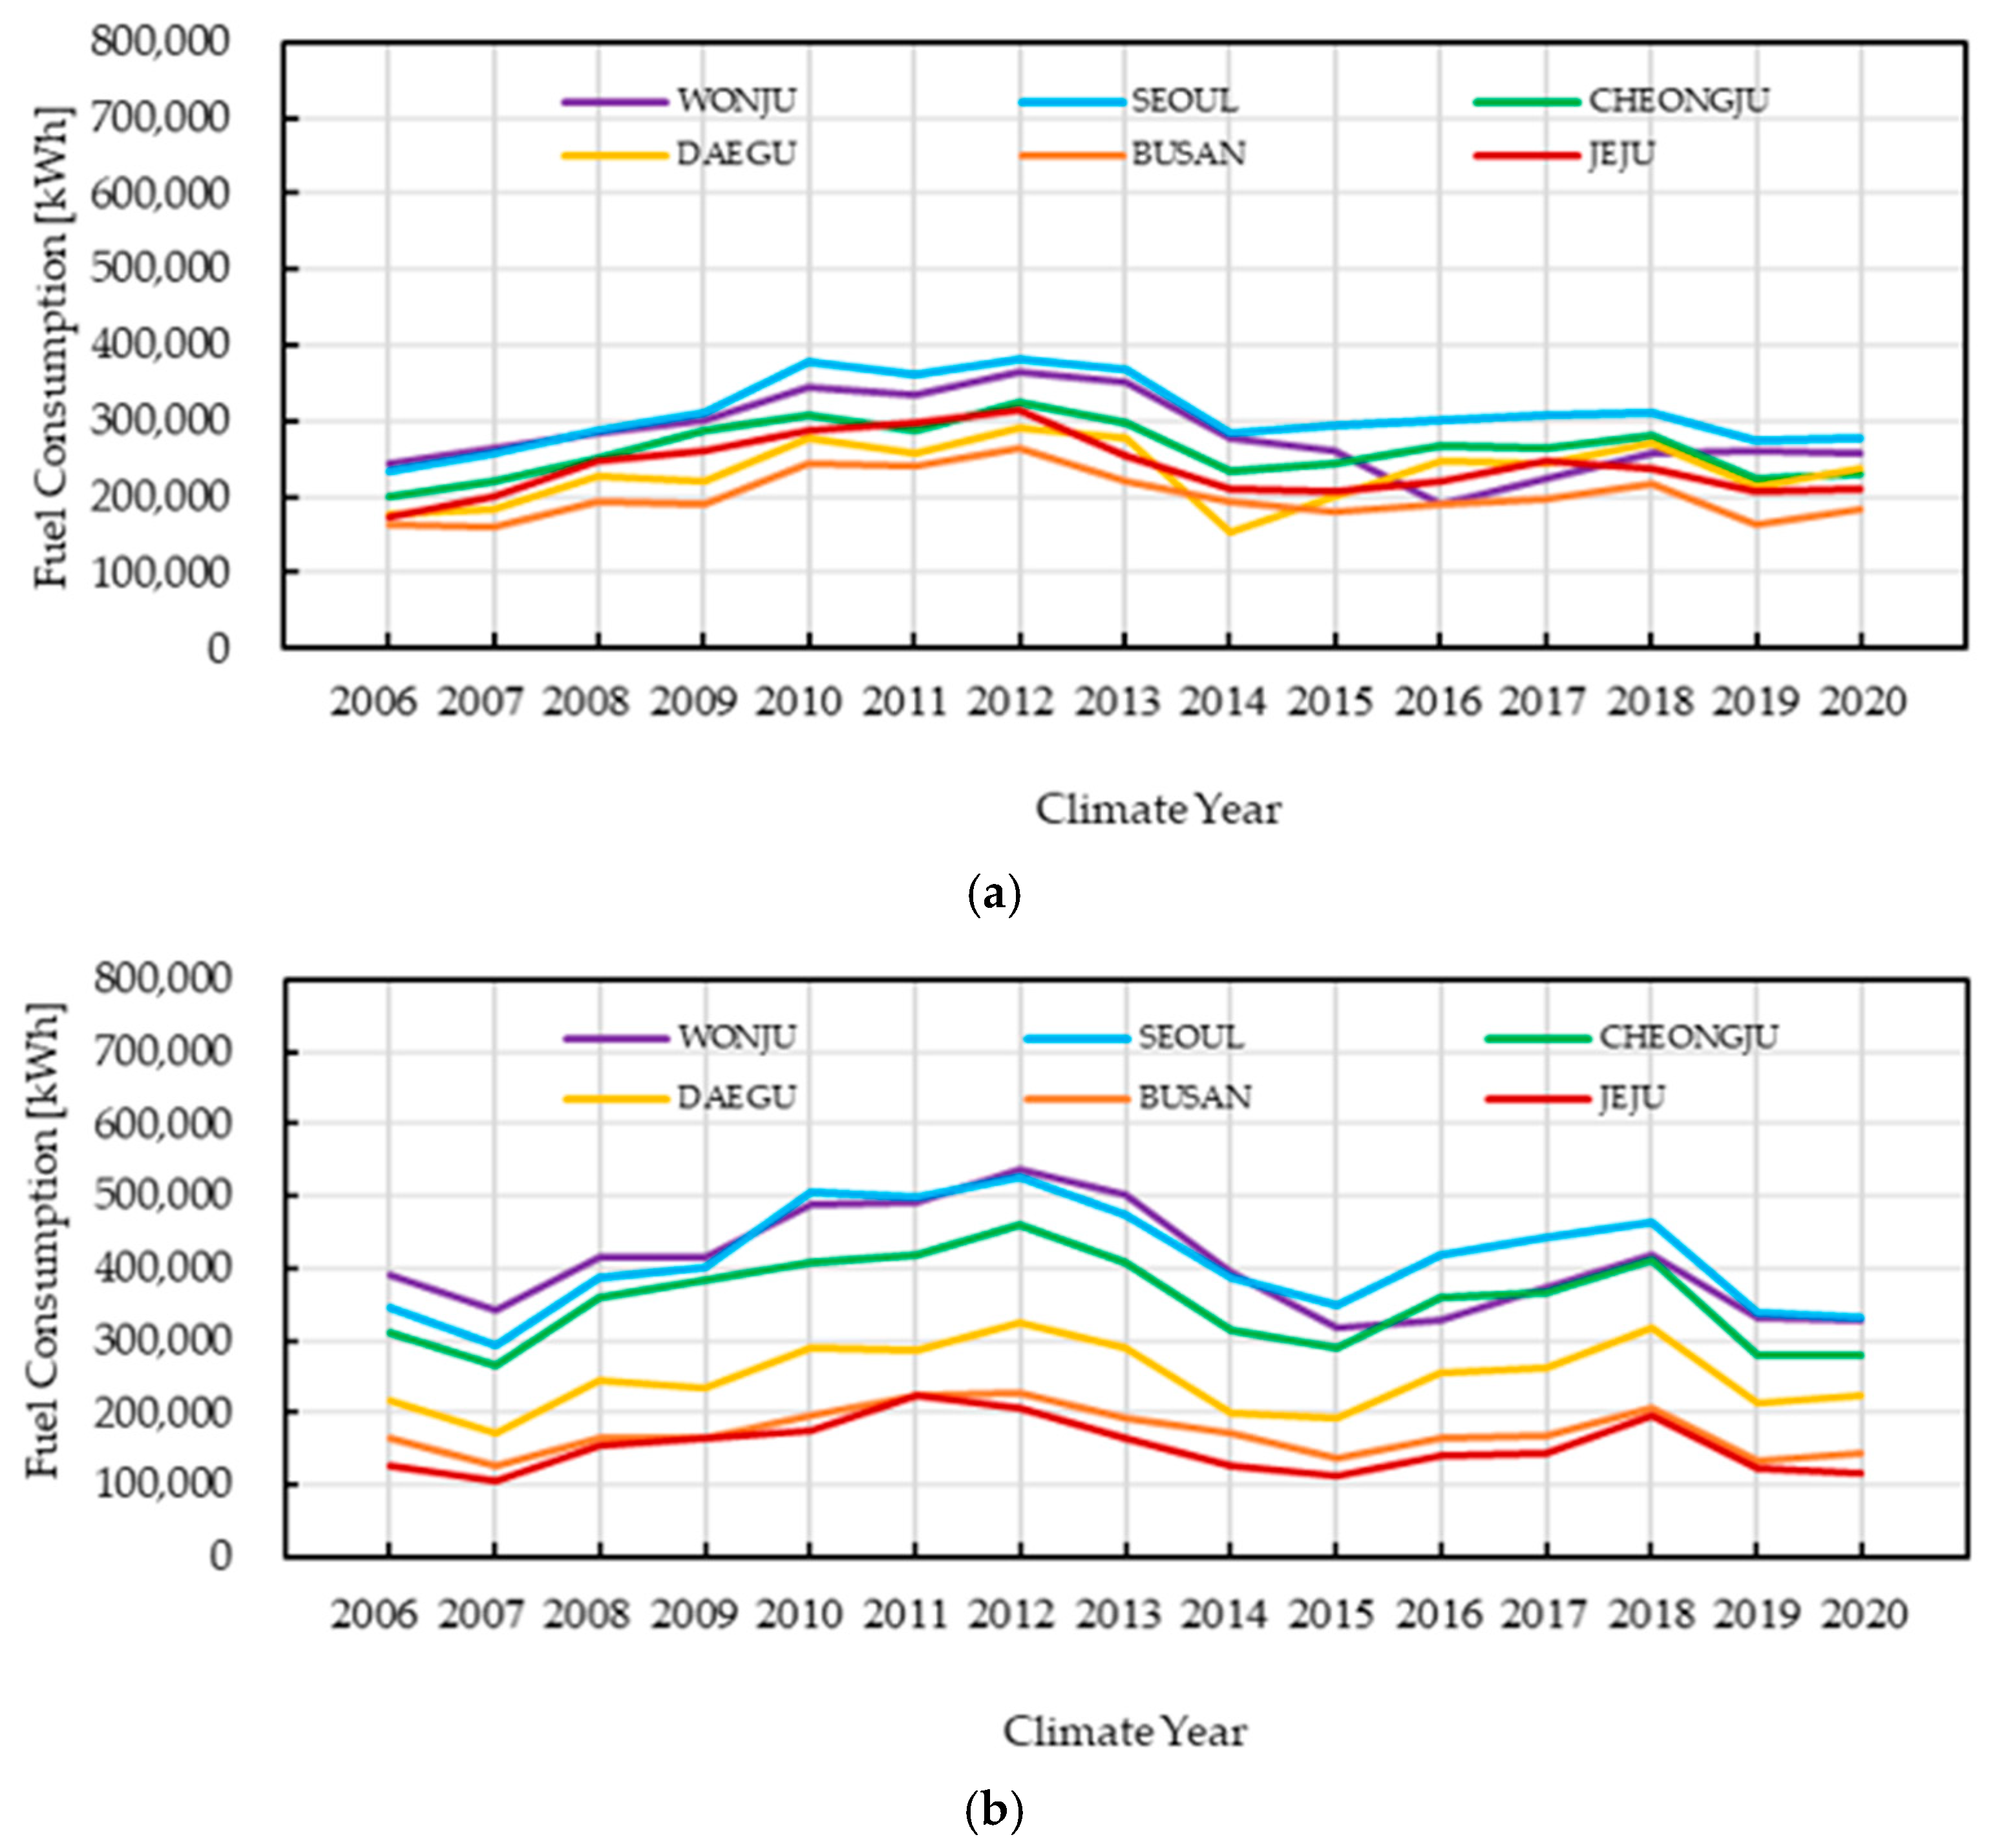
4.1. Estimation of Annual Energy Consumption with AMY Data

Figure 5 illustrates the annual electricity consumption from 2006 to 2020 for (Figure 5a) multifamily apartment buildings and (Figure 5b) office buildings in six cities, based on yearly simulations using AMY (Actual Meteorological Year) data. The variations in electricity consumption reflect actual year-by-year climate conditions, including outdoor temperature, solar radiation, and humidity, resulting in considerable annual fluctuations. While increases in U-value due to insulation degradation were expected to impact electricity consumption, the effects are not clearly distinguishable. This is likely because inter-annual climate variability exerts a more dominant influence on energy use, thereby masking the impact of the gradual decline in insulation performance.
Figure 6 illustrates the annual fuel consumption from 2006 to 2020 for six cities, based on AMY data, with (Figure 6a) multifamily apartment buildings and (Figure 6b) office buildings. Fuel consumption appears higher in central cities such as Seoul, Cheongju, and Wonju, whereas southern cities like Busan and Jeju show lower consumption levels. Meanwhile, although the increase in thermal transmittance due to insulation degradation was reflected in the simulation, its impact did not appear clearly, as the influence of inter-annual climate variability was relatively more dominant. Therefore, in order to accurately assess the isolated impact of increasing thermal transmittance, further analysis under climate-normalized or controlled weather conditions is required.

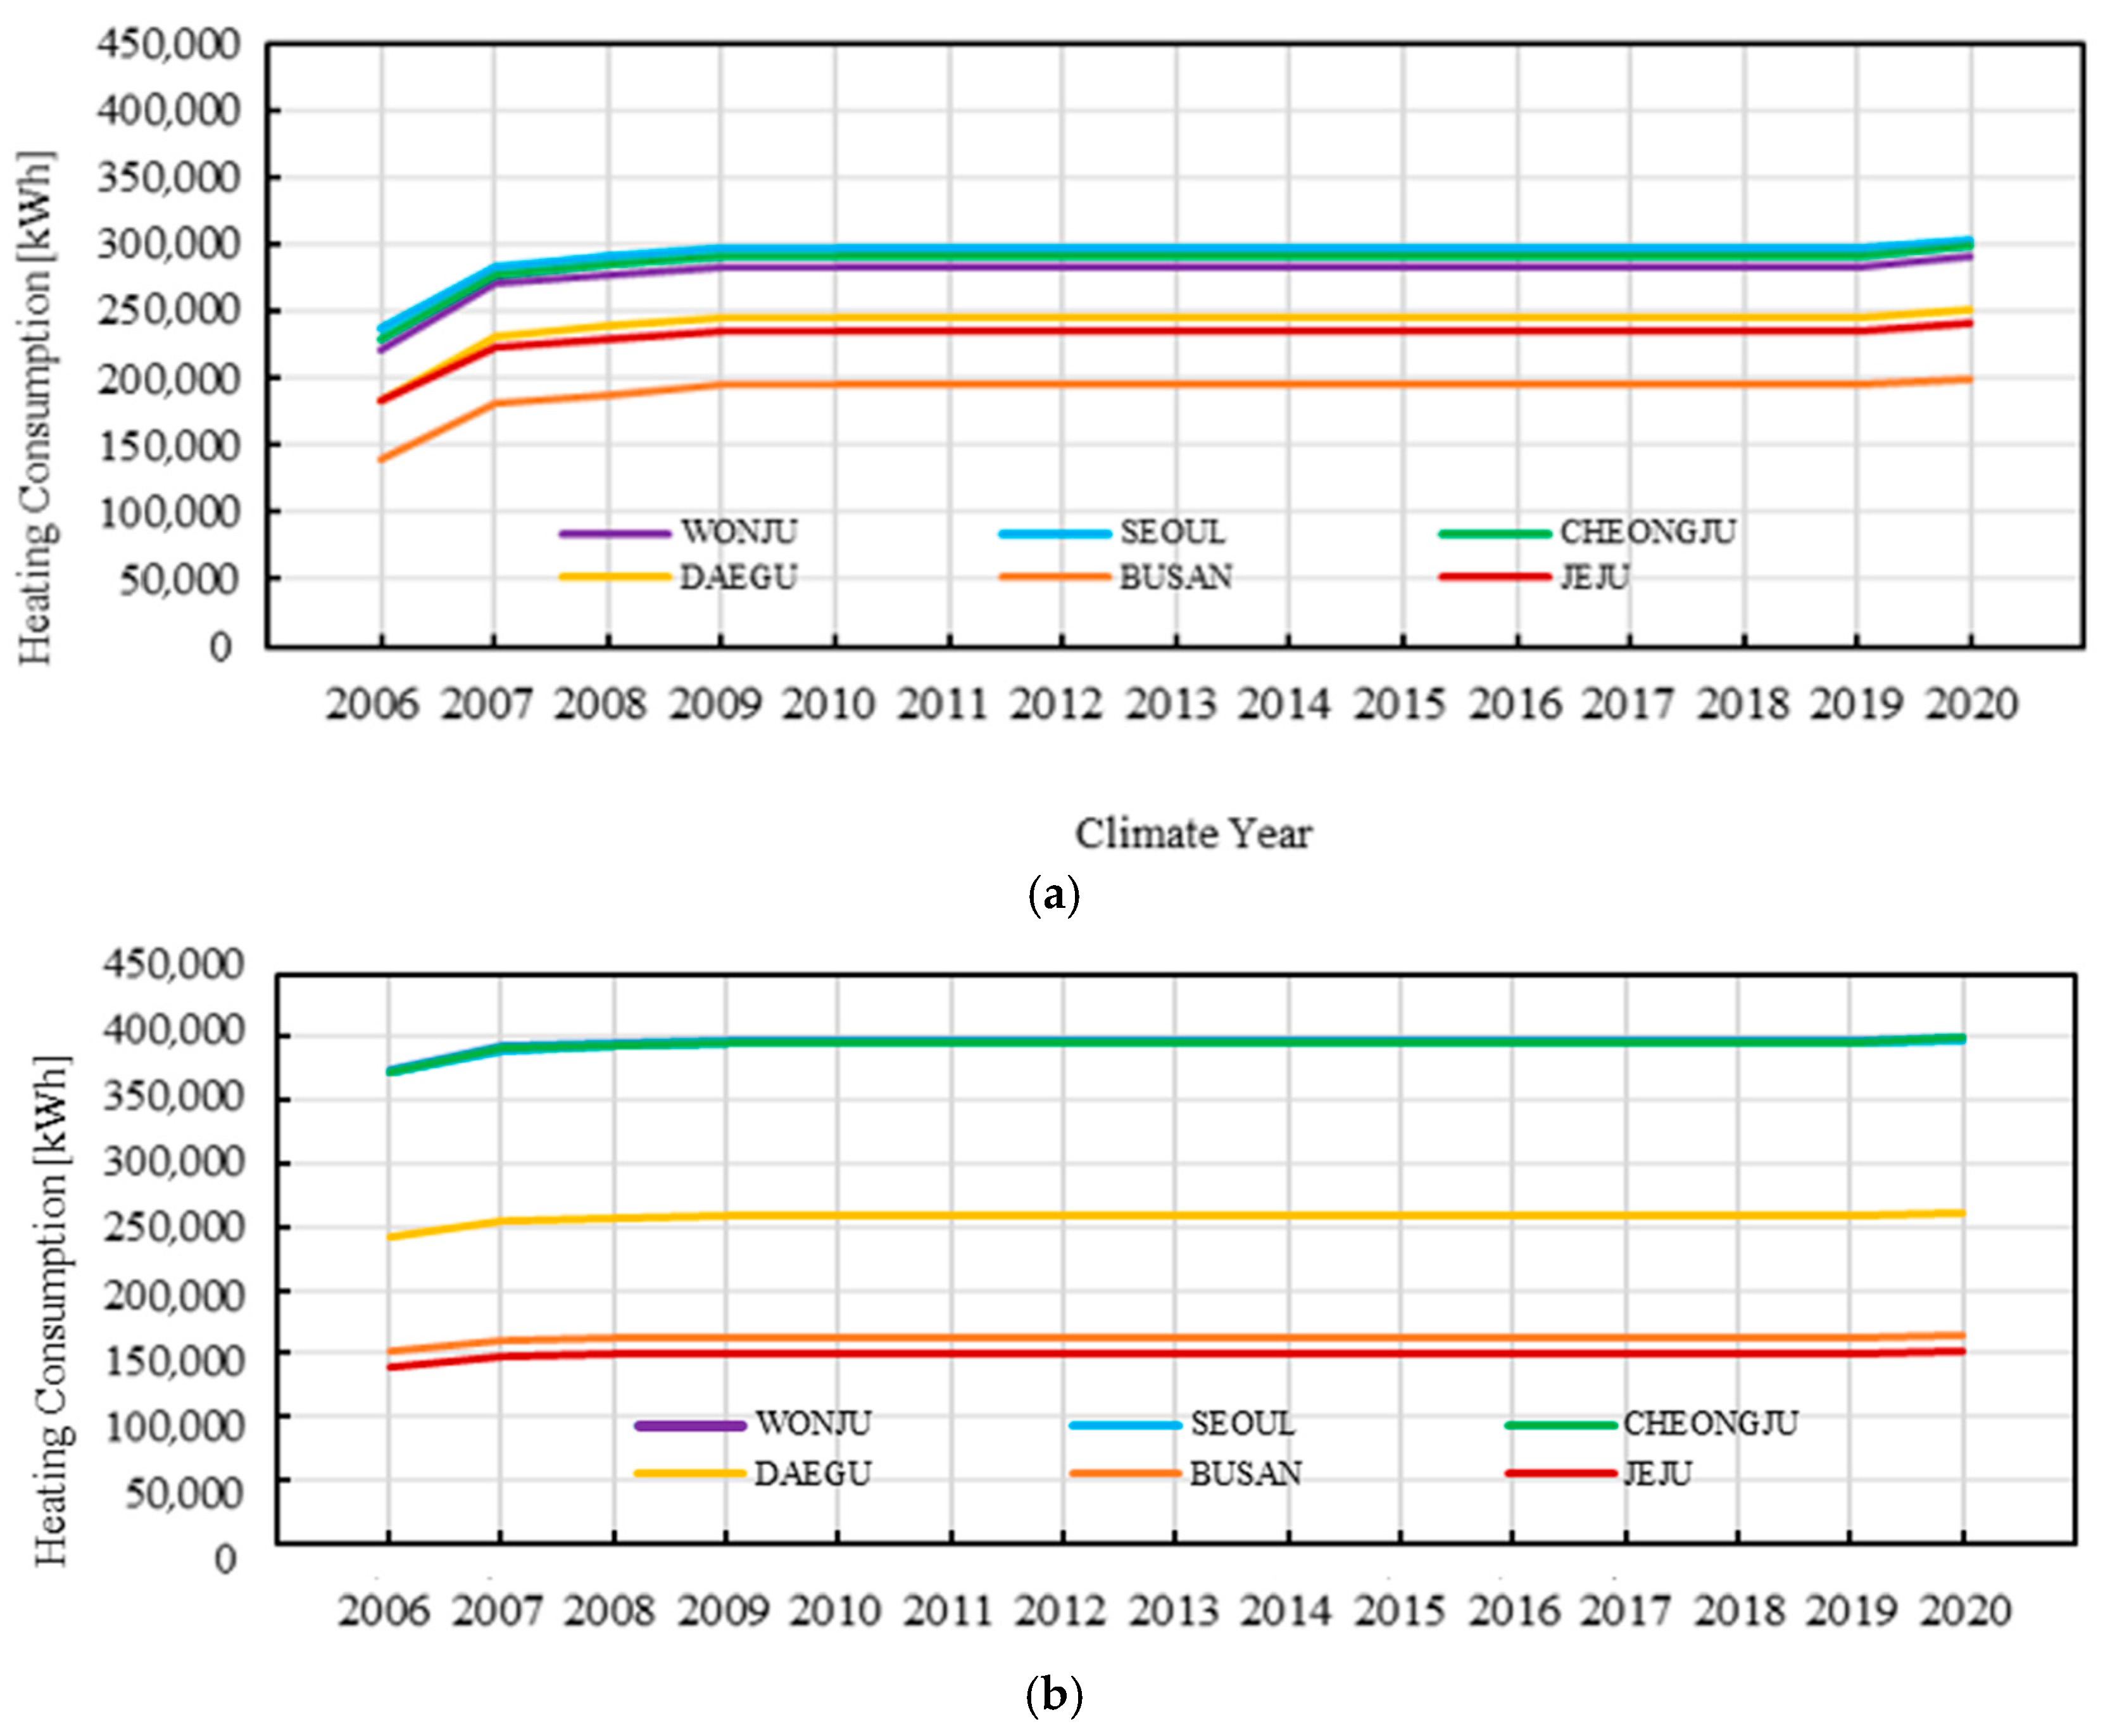
4.2. Estimation of Annual Heating Energy Consumption with TMY Data

Since the thermal transmittance of envelopes mainly impacts heating energy, an analysis focusing solely on the heating energy consumption from the total fuel (heating, DHW, etc.) consumption is required. This analysis also involves the use of TMY data for each city to eliminate the climatic influences. Figure 7 illustrates the annual variation in heating energy consumption by building types in six cities when TMY data are consistently applied each year. The results indicate a distinct upward trend in fuel consumption, due to the increase in the thermal transmittance of the insulation.

4.3. Comparative Analysis Based on Degradation and Weather Data

In this section, the annual variation in heating energy consumption is analyzed through a comparative approach using two scenarios based on AMY and TMY data, with the aim of identifying the pure impact of insulation degradation and the influence of weather data type on heating demand.
The first scenario (with insulation degradation) assumes that the performance of the insulation gradually deteriorates over time, reflecting year-by-year degradation. The second scenario (without insulation degradation) assumes that the initial insulation performance remains constant throughout the analysis period. Since AMY-based analysis includes year-to-year climatic fluctuations, the annual heating energy consumption is normalized by the corresponding Heating Degree Days (HDD) for each year. In contrast, TMY data represent 30-year averaged typical weather conditions, allowing direct year-to-year comparison without the need for additional normalization. This approach minimizes the effect of inter-annual climate variability and enables clearer identification of the isolated impact of insulation degradation on heating load.
Furthermore, by performing simulations using both AMY and TMY data under these two scenarios, the difference in heating energy consumption predictions under actual and typical weather conditions can be quantitatively compared.

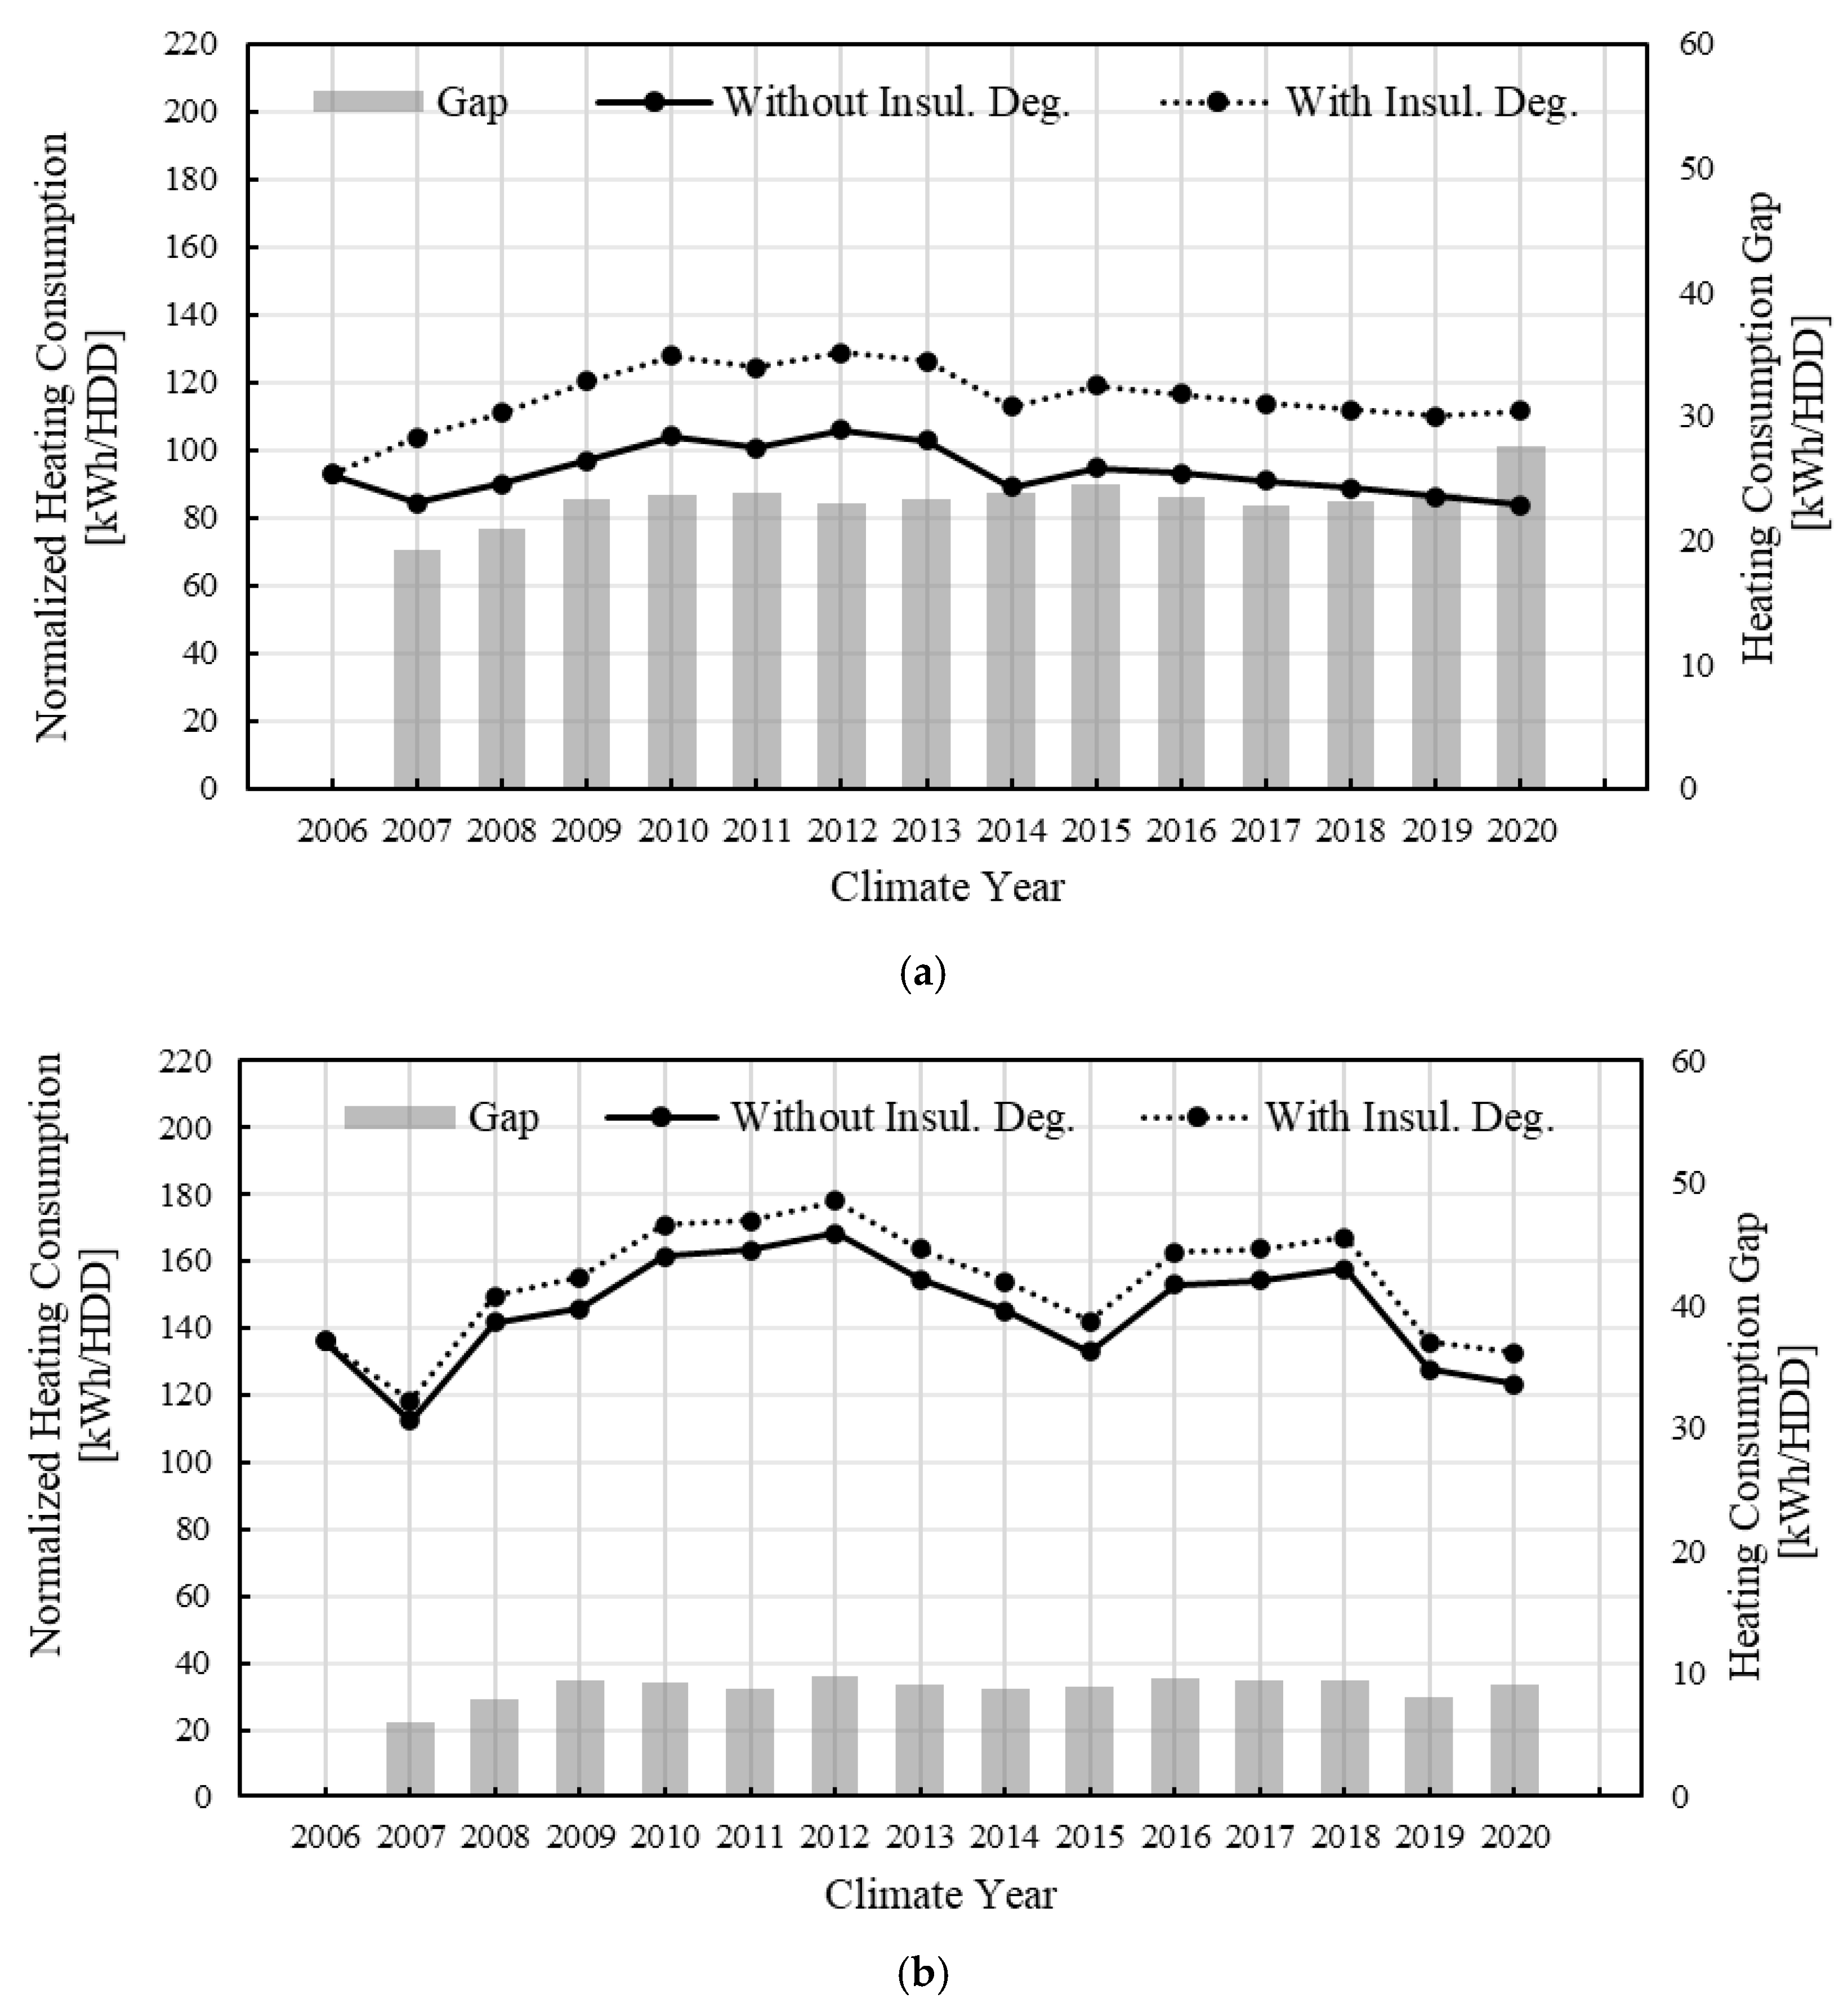
4.3.1. Impact of Insulation Degradation on Annual Heating Energy: AMY-Based

Figure 8 illustrates the year-by-year variation in heating energy consumption for multifamily apartment buildings and office buildings in Seoul, under two scenarios: with and without insulation degradation. The difference in energy consumption between the two scenarios (gap) shows a gradual increase during the initial three years, remaining relatively stable after this period.
This pattern is consistent with the increasing trend of heating energy observed in the TMY-based simulation results presented in Section 4.2, and it provides a clearer interpretation of the pure effect of insulation degradation under actual year-specific climate conditions (AMY). These results reaffirm that the long-term deterioration of insulation performance has a tangible and cumulative impact on heating energy consumption.

4.3.2. Results Summary for Six Cities in Multifamily Apartment Buildings (AMY and TMY)

Table 8 presents the results of a 15-year cumulative heating energy consumption simulation for multifamily apartment buildings across different cities, with the same process described in Section 4.3.1. The analysis shows that when insulation degradation is reflected, heating energy consumption increases in all cities. In particular, southern cities such as Busan (34.9%), Daegu (31.2%), and Jeju (31.9%) exhibited higher increases than central cities such as Seoul (23.2%), Cheongju (26.1%), and Wonju (26.9%).
By removing weather effects through HDD-based normalization, this result shows two noticeable intuitions: First, southern cities use more energy due to relatively the high U-value requirements in BESDS (Table 4). Second, southern cities are more sensitive to degradation of insulation by the law of diminishing returns.
Table 9 summarizes the similar results of Section 4.3.2 with TMY-based simulations. The analysis revealed an increase ranging from 23.5% to 36.2% compared to the initial condition. These rates are very similar to the results of the AMY-based simulations, indicating that the TMY-based analysis reliably reflects trends comparable to those derived from actual climate data. Overall, the difference in heating energy consumption increase rates between the TMY and AMY simulations was found to be less than 4% in most cities, demonstrating that TMY-based simulations also reliably reflect the impact of insulation degradation.

4.3.3. Results Summary for Six Cities in Office Buildings

Table 10 presents a comparison of cumulative heating energy consumption over a 15-year period across different cities for office buildings, considering two simulation scenarios—with and without insulation degradation. The results show that even when insulation degradation is taken into account, the increase in heating energy consumption remains below 8% in all regions and typically falls within the 5–7% range. This suggests that office buildings are relatively less sensitive to insulation degradation in terms of heating load variation.
This outcome can be attributed to the unique heating load composition of office buildings. Figure 9 illustrates the proportion of each component contributing to the total heating load during the initial three years (2006–2009) in Busan, categorized by building type. Heating load consists of heat loss components—such as windows, opaque envelope (walls and roof), and infiltration—and heat gain components like internal heat gain, which are expressed as negative values due to their load-reducing effect.
Specifically, Figure 9 shows that in multifamily apartment buildings, the proportion of envelope load increases over time in response to the aging of the insulation materials. In contrast, office buildings exhibit minimal change in envelope load share, indicating that insulation degradation has a negligible impact on their overall thermal load profile. Therefore, office buildings can be considered less vulnerable to insulation degradation compared to multifamily apartment buildings. This highlights the need for differentiated insulation standards based on building type.

5. Conclusions

This study aimed to quantitatively assess the long-term impact of insulation degradation of extruded polystyrene (XPS) on buildings’ heating energy consumption. To this end, experimental data from Choi et al. (2018) [27] were used to interpolate year-by-year changes in thermal transmittance (U-value) over approximately 7200 days, and these values were applied to prototypical energy models for multifamily apartment buildings and office buildings. Simulations were conducted using both Typical Meteorological Year (TMY) and Actual Meteorological Year (AMY) data across six cities representing Korea’s three major climate zones.
The main conclusions of this study are as follows:
(1)
Simulations were conducted assuming two conditions: one where the initial thermal performance of insulation was maintained over 15 years, and another where degradation progressed over the same period. As a result, the cumulative heating energy consumption for multifamily apartment buildings increased by 23.2% to 34.9% in the AMY-based simulations, and by 23.5% to 36.2% in the TMY-based simulations, compared to the condition without degradation. This indicates that insulation degradation has a significant long-term impact on heating energy consumption.
(2)
The southern and Jeju zones exhibited heating energy consumption increases about 5–10% higher than those in the central zone, a trend that was consistently observed in both the AMY and TMY simulations. This suggests that zones with more relaxed minimum insulation standards are more sensitive to insulation degradation effects.
(3)
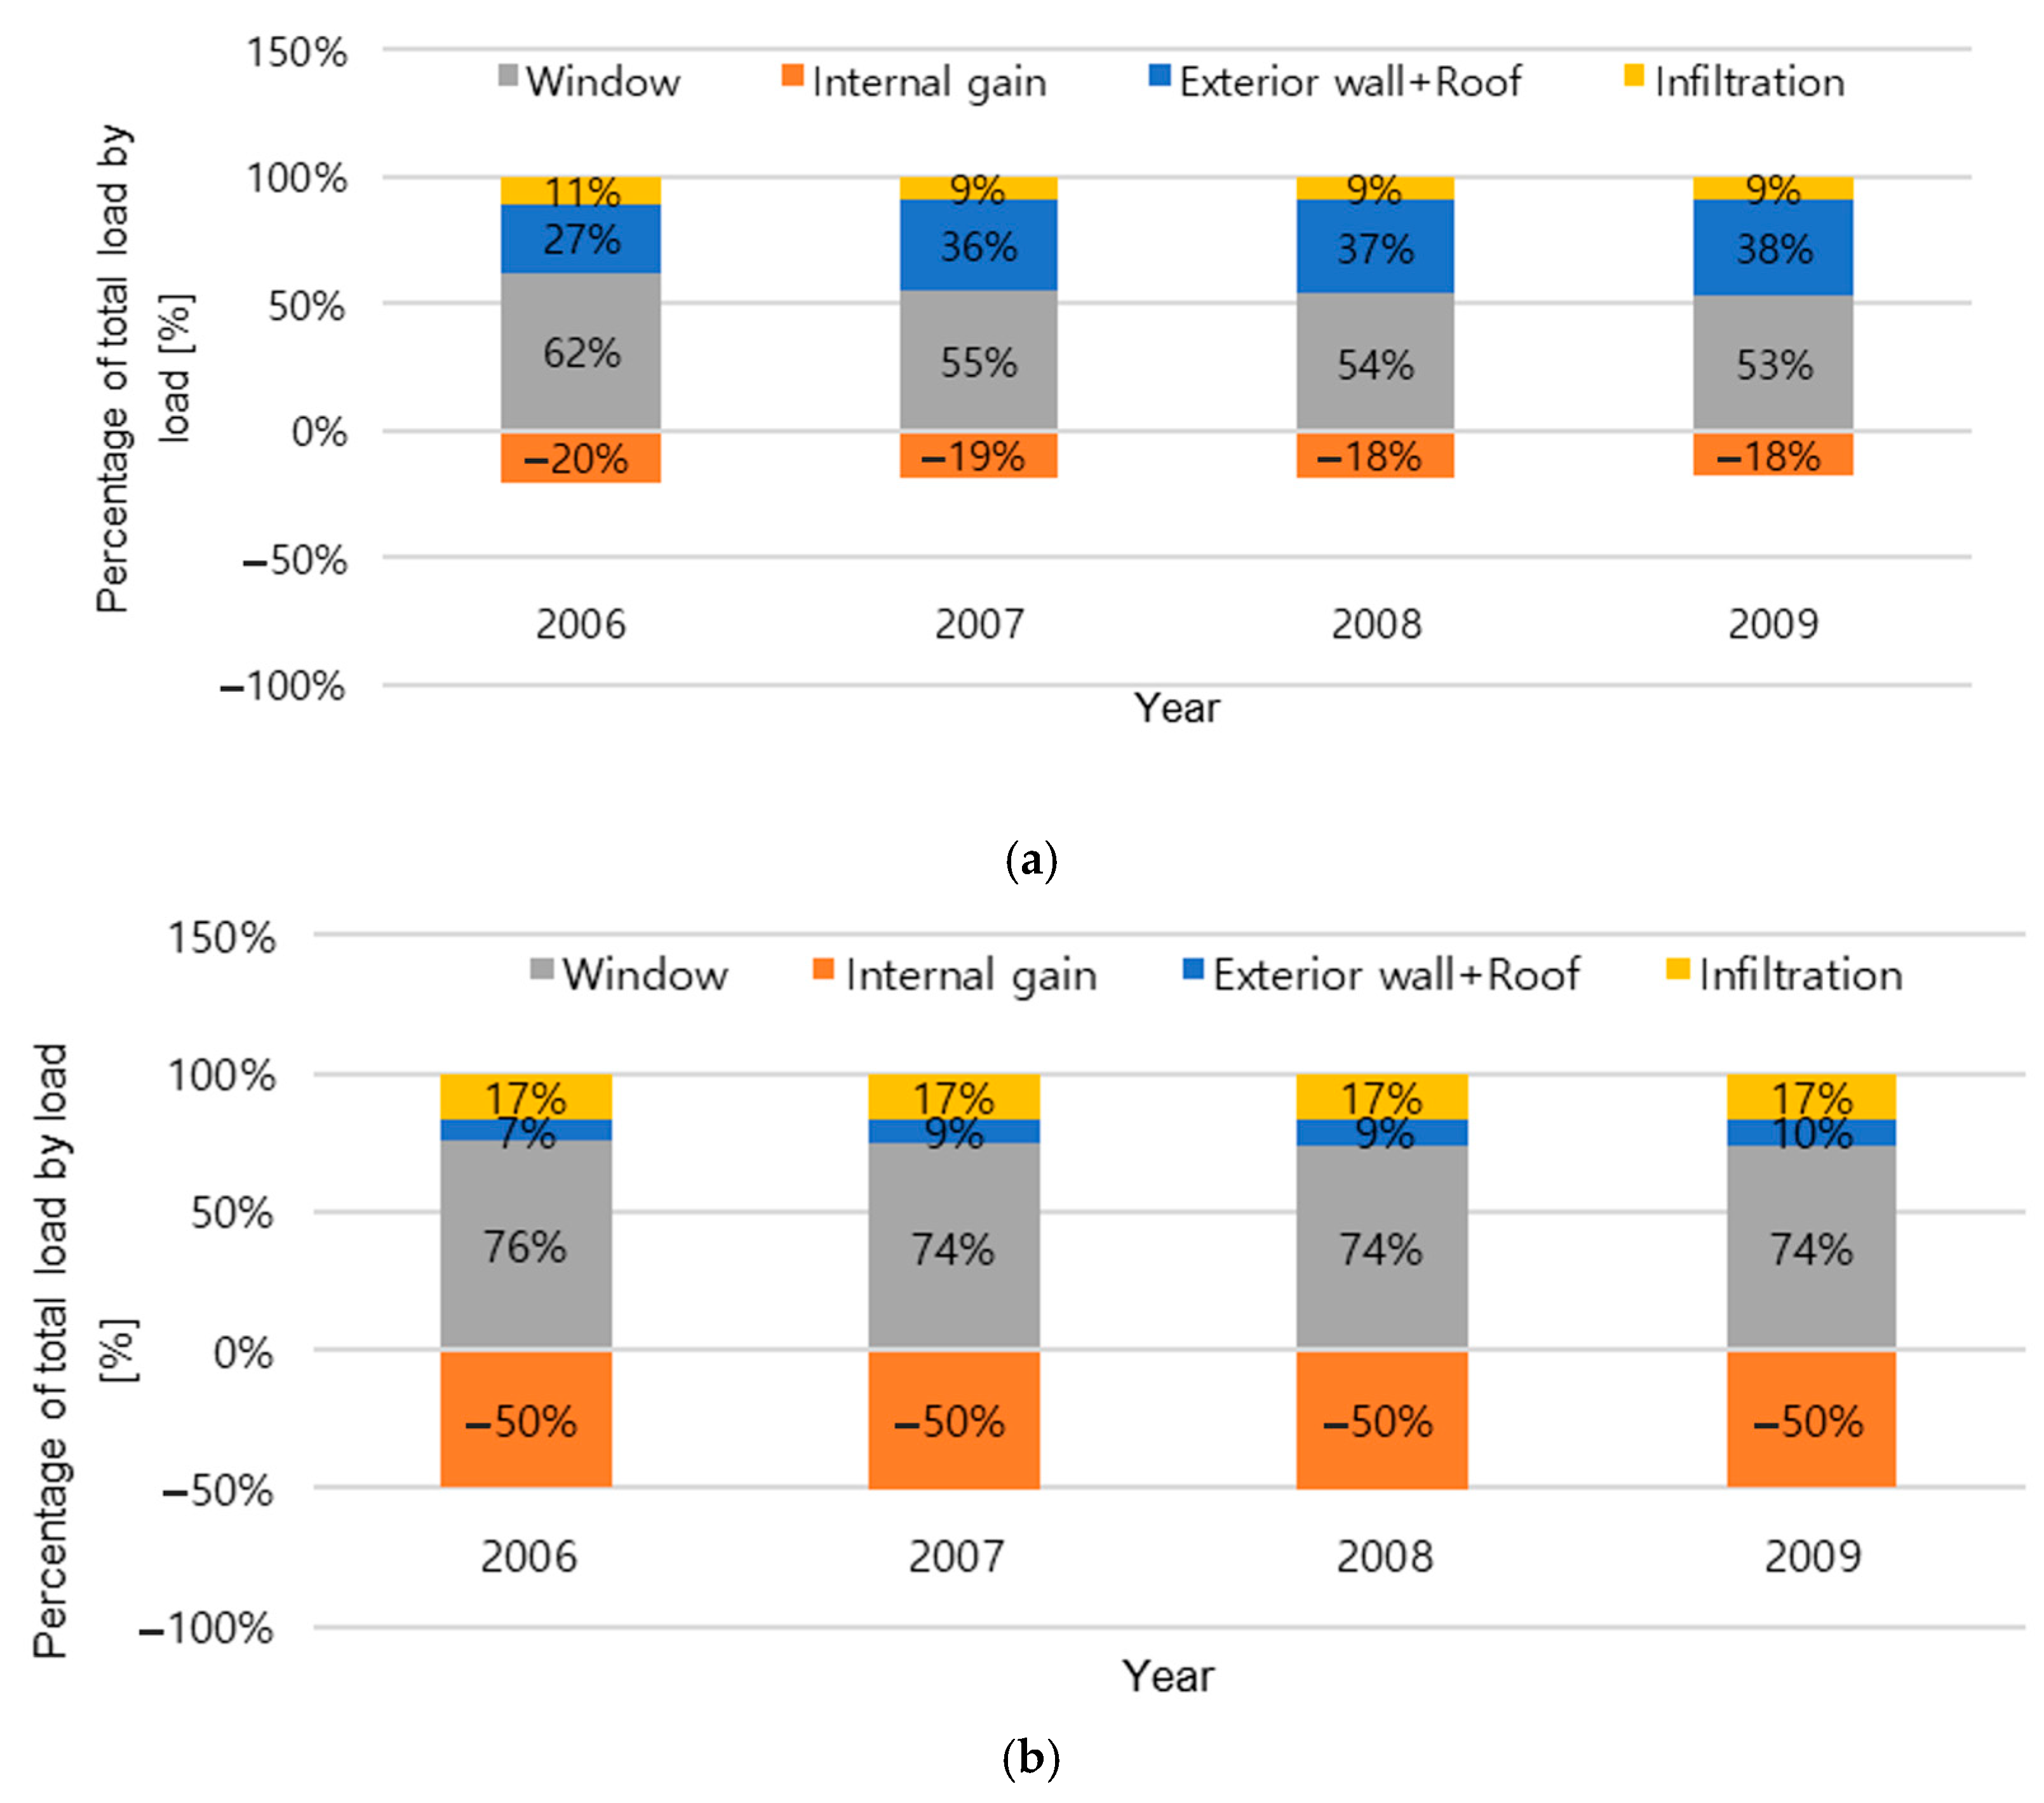
Office buildings showed less sensitivity to insulation degradation, with the heating energy consumption increases remaining below 8% in most cases. This can be attributed to the smaller envelope area and internal heat gains more than 2.5 times greater than those of multifamily apartment buildings, highlighting that the impact of insulation degradation varies depending on building type.
(4)
Although AMY data were expected to predict heating energy consumption more accurately due to reflecting actual year-by-year weather variations, the difference between the AMY- and TMY-based simulation results was less than 4% in most cities. This confirms that TMY-based analyses can also provide sufficiently reliable results for long-term insulation performance evaluation.
(5)
Overall, this study emphasizes that the long-term degradation of insulation performance has a considerable cumulative impact on buildings’ energy consumption. Therefore, it is necessary to establish design standards that incorporate long-term insulation performance from the design stage, and differentiated insulation standards should be considered based on building type. In particular, office buildings, which are less sensitive to insulation degradation, could adopt lower insulation standards compared to residential buildings. Furthermore, while AMY enables more precise evaluations, considering the complexity and difficulty in acquiring AMY data, TMY-based simulations are also sufficiently practical alternatives for long-term performance analysis.

6. Discussion

Most previous studies have primarily focused on the degradation phenomena of insulation itself, and there are few cases that have empirically presented how such degradation affects actual building energy consumption through long-term simulation. This study quantifies the effect of long-term degradation in XPS insulation on heating energy consumption by (1) evaluating the deviation introduced when using TMY or AMY weather data in long-term simulations, (2) assessing the sensitivity of heating energy consumption across building usages and climate zones, and (3) furnishing reference data for researchers and policymakers involved in building energy regulation; together, these contributions define the distinctive value of the present work.
However, this study is based on several assumptions: First, the energy analysis tool (eQUEST) used in this study does not consider dynamic moisture diffusion, so the degradation over time was reflected primarily using experimentally measured annual thermal transmittance (U-value) data. These values include the integrated effects of complex phenomena such as gas leakage and vapor intrusion, but the simulation analyzed the results only in terms of thermal property changes. Second, the purpose of this study was to quantify the trend of heating energy consumption changes due to insulation degradation, and intervention scenarios such as maintenance or replacement and life-cycle cost (LCC) analysis were not included. These aspects may be considered as future research topics.
Future studies need to expand in the following directions: First, the applicability should be examined in more diverse climate conditions—including extreme hot or cold regions. Second, analysis should be extended to include various types of insulation materials other than XPS and a broader range of building types. Third, through economic analysis, it is necessary to evaluate whether the degradation of insulation should be reflected in actual policies and standards, and to develop research that provides quantitative evidence usable for establishing maintenance strategies.

Author Contributions

Conceptualization, S.-H.P. and D.-H.S.; methodology, S.-H.P. and D.-H.S.; software, J.-Y.J.; validation, S.-H.P. and D.-H.S.; formal analysis, S.-H.P.; investigation, S.-H.P.; resources, S.-H.K. and D.-H.S.; data curation, S.-H.K.; writing—original draft preparation, S.-H.P.; writing—review and editing, D.-H.S.; visualization, S.-H.P.; supervision, D.-H.S.; project administration, H.-J.K.; funding acquisition, H.-J.K. All authors have read and agreed to the published version of the manuscript.

Funding

This research was supported by the Chungbuk National University Development Project (2023); and by a grant from the 2024 Start-up Growth Technology Development Program through the Korea Technology and Information Promotion Agency for SMEs (TIPA), funded by the Ministry of SMEs and Startups (MSS), Republic of Korea (No. RS-2024-00468914).

Data Availability Statement

The raw data supporting the conclusions of this article will be made available by the authors upon request.

Conflicts of Interest

Author Seok-Ho Kim was employed by the company BECUBE. Inc. The remaining authors declare that the research was conducted in the absence of any commercial or financial relationships that could be construed as a potential conflict of interest.

References

  1. Korea Ministry of Land, Infrastructure and Transport (MOLIT). National Land and Transport Roadmap (2021); Korea Ministry of Land, Infrastructure and Transport (MOLIT): Sejong, Republic of Korea, 2021; Available online: https://www.molit.go.kr/USR/NEWS/m_71/dtl.jsp?lcmspage=1&id=95086352 (accessed on 15 November 2024).
  2. Ministry of Land, Infrastructure and Transport. (2001). Energy Conservation Design Standards for Buildings [Enforcement on 1 June 2001] [Notification No. 2001-118]. Available online: http://www.molit.go.kr/USR/I0204/m_45/dtl.jsp?idx=504 (accessed on 10 November 2024).
  3. Ministry of Land, Infrastructure and Transport. (2010). Energy Conservation Design Standards for Buildings [Enforcement on 1 July 2010] [Notification No. 2010-371, June 11, 2010, Partial Amendment]. Available online: https://www.law.go.kr/admRulLsInfoP.do?chrClsCd=010202&admRulSeq=2000000052431 (accessed on 10 November 2024).
  4. Ministry of Land, Infrastructure and Transport. (2013). Energy Conservation Design Standards for Buildings [Enforcement on 1 September 2013] [Notification No. 2013-149, 13 March 2013, Partial Amendment]. Available online: https://www.law.go.kr/LSW//admRulLsInfoP.do?chrClsCd=&admRulSeq=2000000089123 (accessed on 10 November 2024).
  5. Ministry of Land, Infrastructure and Transport. (2016). Energy Conservation Design Standards for Buildings [Enforcement on 1 January 2016] [Notification No. 2015-1108, 31 December 2015, Partial Amendment]. Available online: https://www.law.go.kr/LSW//admRulLsInfoP.do?chrClsCd=&admRulSeq=2100000035773 (accessed on 10 November 2024).
  6. Ministry of Land, Infrastructure and Transport. (2018). Energy Conservation Design Standards for Buildings [Enforcement on 1 September 2018] [Notification No. 2017-881, 28 December 2017, Partial Amendment]. Available online: https://www.law.go.kr/LSW//admRulLsInfoP.do?chrClsCd=&admRulSeq=2100000106860 (accessed on 10 November 2024).
  7. Ministry of Land, Infrastructure and Transport. (2022). Energy Conservation Design Standards for Buildings [Enforcement on 29 July 2022] [Notification No. 2022-52, 28 January 2022, Partial Amendment]. Available online: https://www.law.go.kr/LSW//admRulLsInfoP.do?chrClsCd=&admRulSeq=2100000208640 (accessed on 10 November 2024).
  8. Danish Ministry of Economic and Business Affairs. (17 December 2008). Bekendtgørelse om Offentliggørelse af Bygningsreglement 2008 (BR08) [Publication of the Building Regulations 2008 (BR08)]. Social, Bolig og Ældreministeriet. Available online: https://www.retsinformation.dk/eli/lta/2008/45 (accessed on 10 November 2024).
  9. Danish Ministry of Economic and Business Affairs. (28 June 2010). Bekendtgørelse om Offentliggørelse af Bygningsreglement 2010 (BR10) [Publication of the Building Regulations 2010 (BR10)]. Social, Bolig og Ældreministeriet. Available online: https://www.retsinformation.dk/eli/lta/2010/810 (accessed on 10 November 2024).
  10. Danish Ministry of Economic and Business Affairs. (12 December 2019). Bekendtgørelse om Bygningsreglement 2018 (BR18) [Publication of the Building Regulations 2018 (BR18)]. Social, Bolig og Ældreministeriet. Available online: https://www.retsinformation.dk/eli/lta/2019/1399 (accessed on 10 November 2024).
  11. Thomsen, K.E.; Wittchen, K.B.; Ostertag, B.; Severinsen, R.; Palm, J.; Hartung, T.; Varming, N.B. Implementation of the EPBD Denmark. 2016. Available online: https://www.ca-epbd.eu/Media/638373601209185553/Implementation-of-the-EPBD-in-Denmark--2020.pdf (accessed on 10 November 2024).
  12. ANSI/ASHRAE/IES Standard 90.1-2007; Energy Standard for Sites and Buildings Except Low-Rise Residential Buildings. ASHRAE: Atlanta, GA, USA, 2007.
  13. ANSI/ASHRAE/IES Standard 90.1-2010; Energy Standard for Sites and Buildings Except Low-Rise Residential Buildings. ASHRAE: Atlanta, GA, USA, 2010.
  14. ANSI/ASHRAE/IES Standard 90.1-2013; Energy Standard for Sites and Buildings Except Low-Rise Residential Buildings. ASHRAE: Atlanta, GA, USA, 2013.
  15. ANSI/ASHRAE/IES Standard 90.1-2016; Energy Standard for Sites and Buildings Except Low-Rise Residential Buildings. ASHRAE: Atlanta, GA, USA, 2016.
  16. ANSI/ASHRAE/IES Standard 90.1-2019; Energy Standard for Sites and Buildings Except Low-Rise Residential Buildings. ASHRAE: Atlanta, GA, USA, 2019.
  17. ANSI/ASHRAE/IES Standard 90.1-2022; Energy Standard for Sites and Buildings Except Low-Rise Residential Buildings. ASHRAE: Atlanta, GA, USA, 2022.
  18. Energie Einspar Verordnung (EnEV). Available online: https://www.bbsr-geg.bund.de/GEGPortal/DE/Archiv/EnEV/enev_node.html (accessed on 10 November 2024).
  19. Gebäude und zur Änderung Weiterer Gesetze (GEG). Available online: https://www.bbsr-geg.bund.de/GEGPortal/DE/Archiv/GEG/GEG-node.html (accessed on 10 November 2024).
  20. Kim, J.-H.; Kim, S.-M.; Kim, J.-T. Comparison of Thermal Conductivity and Long-Term Change of Building Insulation Materials According to Accelerated Laboratory Test Methods of ISO 11561 and EN 13166 Standard. Energies 2024, 17, 6105. [Google Scholar] [CrossRef]
  21. EPS Industry Alliance. Polystyrene Foam Insulation in Long-Term Building Applications—Effective R-Values, Resource Library—EPS Industry Alliance. Available online: https://www.airfoam.com/rigid-insulation/Polystyrene-Foam-Insulation-Long-Term-R-Values.pdf (accessed on 15 February 2025).
  22. Choi, B.-H.; Kang, J.-S. The Thermal Performance of Building Insulation Materials According to Long-Term Aging. Korean J. Air-Cond. Refrig. Eng. 2013, 25, 617–623. [Google Scholar] [CrossRef]
  23. Lee, D.-H.; Nah, H.-S. Analysis of Heat Loss Due to Time Dependent Aging of Insulation Applied to Office Building. Journal of the Korean Solar Energy Society. Korean Sol. Energy Soc. 2017, 37, 65–75. [Google Scholar] [CrossRef]
  24. Eleftheriadis, G.; Hamdy, M. The Impact of Insulation and HVAC Degradation on Overall Building Energy Performance: A Case Study. Buildings 2018, 8, 23. [Google Scholar] [CrossRef]
  25. Singh, S.N.; Coleman, P.D. Accelerated Aging Test Methods for Predicting the Long Term Thermal Resistance of Closed-Cell Foam Insulation. 2007. Available online: https://www.semanticscholar.org/paper/Accelerated-Aging-Test-Methods-for-Predicting-the-Singh-Coleman/6ea32a2fe7f70bf209d8b5a6b5f6d8664ff4a36e (accessed on 10 November 2024).
  26. Kim, H.-J.; Choi, S.-J. An Experimental Study on a Performance Evaluation of Internal Insulation of Buildings over 20 Years Old. J. Korea Inst. Build. Constr. 2019, 19, 539–547. [Google Scholar] [CrossRef]
  27. Choi, H.-J.; Kang, J.-S.; Huh, J.-H. A Study on Variation of Thermal Characteristics of Insulation Materials for Buildings According to Actual Long-Term Annual Aging Variation. Int. J. Thermophys. 2018, 39, 2. [Google Scholar] [CrossRef]
  28. Kim, J.-H.; Kim, S.-M.; Kim, J.-T. Comparisons of Thermal Insulation Performance and Aging Characteristics of Building Insulation Materials According to Accelerated Ageing Test. J. Korean Inst. Archit. Sustain. Environ. Build. Syst. 2020, 14, 791–802. [Google Scholar] [CrossRef]
  29. Choi, H.-J. A Study on the Long-Term Change of Thermal Resistance Properties of Cellular Plastic Insulation Materials. Ph.D. Thesis, University of Seoul, Department of Architectural Engineering, Seoul, Republic of Korea, 2022. [Google Scholar]
  30. Batard, A.; Duforestel, T.; Flandin, L.; Yrieix, B. Prediction method of the long-term thermal performance of Vacuum Insulation Panels installed in building thermal insulation applications. Energy Build. 2018, 178, 1–10. [Google Scholar] [CrossRef]
  31. D’Agostino, D.; Landolfi, R.; Nicolella, M.; Minichiello, F. Experimental Study on the Performance Decay of Thermal Insulation and Related Influence on Heating Energy Consumption in Buildings. Sustainability 2022, 14, 2947. [Google Scholar] [CrossRef]
  32. Khoukhi, M. The combined effect of heat and moisture transfer dependent thermal conductivity of polystyrene insulation material: Impact on building energy performance. Energy Build. 2018, 169, 228–235. [Google Scholar] [CrossRef]
  33. Yang, W.; Zhang, G.; He, W.; Liu, J. The Effect of Relative Humidity Dependent Thermal Conductivity on Building Insulation Layer Thickness Optimization. Buildings 2022, 12, 1864. [Google Scholar] [CrossRef]
  34. Ryu, S.-H.; Ryu, J.-H.; Hong, W.-H. A Study on Timing Estimation for the Thermal Insulation Remodeling by Analyzing Annual Variation of Exterior Walls Thermal Insulation Performance in Public Buildings. J. Archit. Inst. Korea Plan. Des. 2015, 31, 163–171. [Google Scholar] [CrossRef]
  35. Lee, J.-H.; Yoon, S.-H.; Kang, J.-S.; Choi, G.-S.; Choi, H.-J. Analysis of Change in Energy Load of Building According to Long-Term Aging of Building Insulation Material; The Society of Air-Conditioning and Refrigerating Engineers of Korea (2017-06): Seoul, Republic of Korea, 2017; pp. 286–289. [Google Scholar]
  36. Berardi, U.; Nosrati, R.H. Long-term thermal conductivity of aerogel-enhanced insulating materials under different laboratory aging conditions. Energy 2018, 147, 1188–1202. [Google Scholar] [CrossRef]
  37. Seo, D.-H. Development of a Universal Model for Predicting Hourly Solar Radiation—Application: Evaluation of an Optimal Daylighting Controller (Order No. 3404058). ProQuest Dissertations & Theses Global. (500031344). 2010. Available online: https://www.proquest.com/dissertations-theses/development-universal-model-predicting-hourly/docview/500031344/se-2 (accessed on 24 November 2024).
  38. Marion, W.; Urban, K. User’s Manual for TMY2s (Typical Meteorological Years)-Derived from the 1961–1990 National Solar Radiation Data Base (No. NREL/TP-463-7668); National Renewable Energy Lab. (NREL): Golden, CO, USA, 1995. [Google Scholar]
  39. Seo, D.-H.; Noh, B.-I.; Ihm, P.-C. A Research on Prototypical Apartment House Definition for Detailed Building Energy Simulation. J. Reg. Assoc. Archit. Inst. Korea 2014, 16, 285–296. [Google Scholar]
  40. Choi, D.-Y. Building Energy Consumption Permanent Sample Survey Study (3rd Year); Korea Energy Economics Institute: Ulsan, Republic of Korea, 2016. [Google Scholar]
  41. Energy Economics Research Institute. Household Energy Panel Survey Report for the Year 2020 (Based on 2019 Data); Korea Energy Economics Institute: Ulsan, Republic of Korea, 2020. [Google Scholar]
  42. Kim, H.-J.; Shin, J.-K.; Seo, D.-H. Development of Residential Building Energy Benchmark Data. J. Korean Inst. Archit. Sustain. Environ. Build. Syst. 2023, 17, 482–496. [Google Scholar] [CrossRef]
  43. Kim, H.-J.; Choi, D.-Y.; Seo, D. Development and Verification of Prototypical Office Buildings Models Using the National Building Energy Consumption Survey in Korea. Sustainability 2021, 13, 3611. [Google Scholar] [CrossRef]
Figure 1. Research flowchart. Long-term degradation data based on [27].
Energies 18 03260 g001
Figure 2. The time-dependent thermal transmittance data for XPS insulation over a span of approximately 20 years [regenerated from Choi et al., 2018 and 2022 [27,29]].
Energies 18 03260 g002
Figure 3. Classification of climate zones and selected representative cities.
Energies 18 03260 g003
Figure 4. A 3D view of the defined prototypical building energy model with eQUEST: (a) multifamily apartment building; (b) office building; (c) exterior wall section showing layer composition.
Energies 18 03260 g004
Figure 5. Variation in annual electricity consumption by city with AMY data: (a) multifamily apartment buildings; (b) office buildings.
Energies 18 03260 g005
Figure 6. Variation in annual fuel consumption by city with AMY data: (a) multifamily apartment buildings; (b) office buildings.
Energies 18 03260 g006
Figure 7. Variation in annual fuel consumption by city with TMY data: (a) multifamily apartment buildings; (b) office buildings.
Energies 18 03260 g007
Figure 8. Comparison of annual heating energy consumption with and without insulation degradation, using AMY data in Seoul: (a) multifamily apartment building; (b) office building.
Energies 18 03260 g008
Figure 9. Proportion of heating load component’s impact on total heating load for each building type in Busan over the initial 3 years: (a) multifamily apartment building; (b) office building. Note: Not all load components are shown in the figure; only selected components (e.g., window, opaque envelope, infiltration, internal gain) relevant to the analysis are included. As such, the percentages do not sum to 100%.
Energies 18 03260 g009
Table 1. External wall thermal transmittance enforcement trends of selected countries for residential buildings.
CountriesClimate ZoneYear and U-Value [W/m2·K]
2007
~2009
2010
~2012
2013
~2015
2016
~2018
2019
~2021
2022~
KoreaCentral 10.470.360.270.210.150.15
Central 20.470.360.270.210.170.17
Southern0.580.450.340.260.220.22
Jeju0.760.580.440.360.290.29
DenmarkN/A0.400.400.400.300.300.30
USAClimate Zone 40.640.480.280.280.280.28
GermanyN/A0.450.280.280.280.280.28
Table 2. Additional literature review summary.
AuthorYearSummary
Ryu et al. [34]2015Building Samples: On-site measurements in 11 real buildings.
Analysis Conducted: Thermal transmittance based on different exterior finishing materials.
Insulation Degradation Rates: For public buildings older than 15 years, the degradation rates were found to be 66.2% (paint), 30.1% (brick), and 15.4% (tile).
Lee & Nah [23]2017Compliance Standard: EPS with KS M ISO 11561.
Thermal Resistance Reduction: After 100 days, decreased by 10.7%.
Energy Simulation: Building energy simulations with TRISCO RADCON module.
Simulation Results: Increase in heat loss from exterior walls ranging from 1.38% to 8.52%.
Lee et al. [35]2017Measurement Standard: Thermal conductivity with KS L 9016.
Simulation Approach: Multifamily building with TRNSYS 17.
Performance Degradation: XPS insulation decreased by 35% from its initial state.
Heating Energy: Increased by 9.7% in Seoul, 10.3% in Ulsan, and 8.6% in Jeju.
Berardi & Nosrati [36]2018Test Method: Accelerated aging tests in laboratory for aerogel-enhanced insulation.
Condition: Thermal conductivity of the insulation increased by 10% after 20 years.
Long-term Performance: Similar to its initial conditions.
Table 3. Year-by-year values and change rates of thermal transmittance for XPS insulation (interpolated from experimental data *).
PeriodThermal
Transmittance
[W/m2·K]
Change Rate [%]PeriodThermal
Transmittance
[W/m2·K]
Change Rate [%]
Initial0.402-8 years later0.6820
1 year later0.60650.759 years later0.6820
2 years later0.6527.5910 years later0.6810
3 years later0.6712.9111 years later0.6810
4 years later0.6760.7512 years later0.6972.32
5 years later0.6780.3013 years later0.6990.28
6 years later0.6830.7414 years later0.7010.28
7 years later0.683015 years later0.7020.14
* The thickness of the XPS insulation specimen used in the experiment by Choi et al. (2018) [27] was 50.7 mm.
Table 4. Summary of the BESDS applied detailed energy models as an initial value [W/m2·K].
Building ComponentsBuilding TypeClimate Zone
CentralSouthernJeju
Exterior wallMultifamily APT buildings0.470.580.76
Other
RoofAll types0.290.350.41
SlabFloor heating0.350.410.47
Not floor heating
Sidewall of multifamily APT buildings0.350.470.58
Table 5. Calculated thermal transmittance of the exterior wall over 20 years based on insulation degradation.
PeriodThermal
Transmittance
[W/m2·K]
Change Rate [%]PeriodThermal
Transmittance
[W/m2·K]
Change Rate [%]
Initial0.470-8 years later0.7290
1 year later0.66240.759 years later0.7290
2 years later0.7026.1510 years later0.7280
3 years later0.7202.4711 years later0.7280
4 years later0.7230.5312 years later0.7411.83
5 years later0.7250.1913 years later0.7430.22
6 years later0.7300.7014 years later0.7450.22
7 years later0.729015 years later0.7450.11
Table 6. Geological and degree-days information of the selected cities.
CityClimate
Zone
Latitude
[Degree]
Longitude
[Degree]
CDD 20 °C
[°C-Days]
HDD 18 °C
[°C-Days]
WonjuCentral 137°20′15″ N127°56′47″ E5782794
SeoulCentral 237°34′17″ N126°57′56″ E6082663
CheongjuCentral 236°38′21″ N127°26′26″ E6632525
DaeguSouthern35°6′16″ N129°1′55″ E7132163
BusanSouthern35°52′40″ N128°39′10″ E5341825
JejuJeju33°30′50″ N126°31′46″ E6491526
Table 7. (A) Definition of selected parameters for prototypical building energy models—multifamily apartment buildings (excerpted from Seo et al., 2014; Choi et al., 2016) [39,40]. (B) Definition of selected parameters for prototypical building energy models—office buildings (excerpted from Seo et al., 2014; Choi et al., 2016) [39,40].
Building TypeFloor
(Underground/
Ground)
Floor HeightFloor AreaAspect RatioOrientation
(A)
Multifamily
APT
0/152.6 m382 m2
(85 m2/unit)
1:3South
HVACPrimary
System
WWRCooling and
Heating Period
Lighting Power
Density
  • Radiant floor
  • A/C
Gas boiler
  • South: 58%
  • North: 38%
  • Heating:
    11/1~3/31 (20 °C)
  • Cooling:
    6/11~9/10 (28 °C)
3.83 W/m2
(B)
Office5/163.7 m1752 m21:1.2East
HVACPrimary
System
WWRCooling and
Heating Period
Lighting Power
Density
CAV+FCU
  • Steam boiler
  • Direct-fired absorption chiller
  • Turbo chiller
  • South: 62%
  • North: 61%
  • East 56%
  • West: 57%
  • Heating:
    11/1~3/31 (21 °C)
  • Cooling:
    5/1~9/30 (26 °C)
5.49 W/m2
Table 8. Comparison of 15-year cumulative normalized heating energy consumption in multifamily apartment buildings (2006–2020, using AMY data).
RegionWithout Insulation
Degradation [kWh/HDD]
With Insulation
Degradation [kWh/HDD]
Percentage
Increase (%)
Wonju1183150126.9%
Seoul1406173223.2%
Cheongju1228154926.1%
Daegu1218159731.2%
Busan1215163934.9%
Jeju1865246131.9%
Table 9. Comparison of 15-year cumulative normalized heating energy consumption in multifamily apartment buildings (2006–2020, using TMY data).
RegionWithout Insulation
Degradation [kWh]
With Insulation
Degradation [kWh]
Percentage
Increase (%)
Wonju3,305,8424,181,83126.5%
Seoul3,543,2294,376,13723.5%
Cheongju3,437,7244,296,71525.0%
Daegu2,765,1263,597,74030.1%
Busan2,092,5272,850,40936.2%
Jeju2,756,3333,471,44730.6%
Table 10. Comparison of 15-year cumulative normalized heating energy consumption in office buildings (2006–2020, using AMY data).
RegionWithout Insulation
Degradation [kWh/HDD]
With Insulation
Degradation [kWh/HDD]
Percentage
Increase (%)
Wonju202121506.4%
Seoul217823025.7%
Cheongju196420886.3%
Daegu159717087.0%
Busan130314067.9%
Jeju139514957.2%
Disclaimer/Publisher’s Note: The statements, opinions and data contained in all publications are solely those of the individual author(s) and contributor(s) and not of MDPI and/or the editor(s). MDPI and/or the editor(s) disclaim responsibility for any injury to people or property resulting from any ideas, methods, instructions or products referred to in the content.

