Article

Experimental Study of the Effect by Double-Stage Throttling on the Pressure Relief Characteristics of a Large-Scale CO2 Transportation Pipeline

1
Shengli Oilfield Technology Inspection Center, Dongying 257000, China
2
School of Chemical Engineering, Dalian University of Technology, Dalian 116000, China
3
School of Safety Science and Engineering, Henan Polytechnic University, Jiaozuo 454000, China
*
Author to whom correspondence should be addressed.
Energies 2025, 18(13), 3244; https://doi.org/10.3390/en18133244
Submission received: 13 May 2025 / Revised: 6 June 2025 / Accepted: 18 June 2025 / Published: 20 June 2025

Abstract

:
The safety of pipeline transportation technology is the key to guaranteeing the development and application of CCUS. In the process of CO2 pipeline transportation, manual pressure relief may be required due to equipment failure, overpressure, or other reasons. However, the sharp temperature drop in the evacuation process may lead to the formation of dry ice, which may cause a pipeline blockage and equipment damage. Although the multi-stage throttling method of pressure relief can effectively control the stability of the equipment, the effect on the low temperature of the pipeline needs to be further investigated. Therefore, in order to evaluate the safety of multi-stage throttling pressure relief, a comparative experiment of dense-phase venting with double-stage throttling was carried out based on an industrial-scale pipeline experimental device. The results show that the double-stage throttling pressure relief scheme can significantly reduce the pressure drop rate and improve the stability of the pressure relief structure. Moreover, the temperature drop limit upstream of the main pipeline is controlled under the double-stage throttling scheme, but it exacerbates the low temperature level downstream, which is not conducive to mitigating the risk of freeze-plugging of the pressure relief valve. Therefore, it is recommended that the double-stage throttling relief scheme be used to close the valve in time to return to the temperature and to adopt an intermittent means of pressure relief.

1. Introduction

The report released by the IPCC points out that the increase in greenhouse gas emissions (mainly CO2) is a key cause of global warming [1]. In order to alleviate the situation, carbon capture, utilization, and storage (CCUS) technology is considered an effective means of reducing CO2 emissions [2,3]. The International Energy Agency (IEA) expects that CCUS technology will help achieve a 19% reduction in CO2 emissions by 2050 [4,5]. The construction of carbon dioxide pipelines is critical to the implementation of all decarbonization CCUS projects. Due to the presence of impurities (such as water, hydrogen sulfide, and hydrogen), carbon dioxide pipelines are at a significantly higher risk of corrosion [6]. Due to the complexity of pipeline service conditions, it is inevitable that maintenance work will need to be carried out, so it is necessary to carry out venting of the corresponding pipeline section before maintenance [7]. However, pipeline venting will cause the temperature to drop sharply [8,9], and DNVGL-RP-F104 clearly requires that the temperature drop during venting should be controlled to above the low temperature limit of the material to prevent dry ice deposition and brittle fracture [10]. Therefore, considering the operational efficiency and safety performance of the venting pipeline, it is particularly important to protect the CO2 pipeline from low temperatures during the venting process.
According to relevant research, 45% of CO2 pipeline accidents are caused by equipment failure [6]; so, pipeline equipment maintenance is crucial. The safety of CO2 transportation pipeline venting is an important guarantee for pipeline maintenance work [11]. In the process of venting, the phase change caused by the coke soup effect will form dry ice in the pipe when the temperature of the pipe drops below the temperature of the three-phase point of CO2 and, in serious cases, it will even block the pipeline to create secondary hazards [12]. In addition, due to the heavy gas nature of CO2 and the risk of suffocation [13], as venting continues, CO2 will be deposited on the surrounding surface, forming a zone of low temperature and risk of suffocation. In addition, there is also the phenomenon of dry ice scattering [14], which endangers the personal safety of operators [15]. Therefore, the study of the generation law of dry ice in the pipeline and the evaluation of prevention and control methods are the keys to ensuring the safety of pipeline venting.
Current studies on the risk assessment of dry ice during CO2 pipeline venting are mainly conducted on small pipelines. Vitali et al. [16] pointed out in their analysis of the thermodynamic challenges of CO2 pipeline design that gas hydrates and ice in the pipeline may cause blockages during long-distance CO2 transport and analyzed their impact on pipeline characteristics, design, and operation. Xie et al. [17] investigated the accidental leakage behavior of supercritical CO2 in a laboratory environment and found that the gas leakage may be caused by a dry ice blockage damaging the pipeline, which is the result of the coupled effects of multiple factors such as initial pressure, nozzle size, and phase state. Wang et al. [18] analyzed the dispersion behavior during the leakage of a high-pressure CO2 pipeline containing impurities. The initial internal pressure and temperature were found to have an impact on the leakage results, based on which Gu et al. [19] further pointed out that the concentration of impurities in the leakage process and the diameter of the nozzle are the main factors affecting the minimum temperature. Li et al. [20] calculated the leakage process of CO2 from a small pipeline using the Lax–Wendroff numerical method and the Redlich–Kwong equation of state and found that both the pressure and the mass outflow rate have an effect on the CO2 leakage rate. Koeijer et al. [21] conducted experiments and simulations of the two-phase transient flow in the depressurization of a CO2 pipeline and found that, during the depressurization process, the minimum temperature was −40 °C, which can lead to frost on the outer surface of the pipe and reduce the effective heat transfer coefficient.
Due to the limitations of small pipeline experiments, which result in a lack of applicability of the experimental results to industrial-scale pipelines, numerical simulation methods are more often used in current studies related to the venting of large industrial pipelines. Wareing et al. [22] compared diffusion modeling with several experimental datasets and showed significant consistency between the experimental datasets. Lankadasu et al. [23] developed a supercritical CO2 leakage and diffusion model and analyzed the temperature variations near the source point. Liu et al. [24] investigated the source strength and dispersion of the leakage field using a CFD model and concluded that rapid CO2 leakage from a high-pressure pipeline dominates the formation of near-field clouds. Aursand et al. [25] carried out a study based on numerical modeling and found that the CO2 saturation pressure is related to the type of impurity and the choice of equation of state and that low-temperature differences are more affected by heat transfer. Karpenko et al. [26] analyzed the effect of hydrodynamic processes on the fluid flow characteristics after the installation of angular connections in piping systems by means of CFD based on numerical simulations of the three-dimensional Reynolds-averaged Navier–Stokes equations, which resulted in results on pressure drops, turbulence modeling, flow coefficients, and energy losses under 45° and 90° angular fitted connections. Vitali et al. [27] conducted a performance study on the prediction of the gas–liquid equilibrium and density using state equations for CO2-rich mixtures in CCUS applications, providing experimental evidence for the selection of state equations in CCUS engineering. Mahgerefteh et al. [28] simulated the brittle fracture of gas-phase and dense-phase CO2 transport pipelines and found that the premise for discovering the pressure drop is that the thermal and compressive stresses exceed the fracture toughness of the pipe wall. In summary, the numerical simulation method is limited by the mesh optimization, the time step, and, for the dynamic multiphase flow simulation, the accuracy due to the phase change in the pipe, which also needs to be optimized. Therefore, in the study of industrial-scale CO2 transportation pipeline processes using numerical simulation methods, the reliability of the conclusions needs to be demonstrated in conjunction with experimental methods.
Therefore, in order to make up for the insufficient amount of small-scale pipeline research due to the “scaling effect”, and to provide a reference for the optimization of numerical simulation methods, we carried out the following work. First, an experimental platform for industrial-scale CO2 pipelines was built, and two sets of experimental studies with different venting schemes were carried out on the basis of this platform. By summarizing the experimental data, we obtained the changing rules of the dynamics and thermodynamics of industrial-scale CO2 pipelines under different venting schemes, discuss the risk of generation of dry ice, and put forward a low-temperature prevention and control program, which provides an important reference basis for practical engineering applications.

2. Experimental Setup

The total length of the experimental pipeline is 258 m with an inner diameter of 233 mm. The whole pipeline is supported by more than twenty concrete columns, with two adjacent concrete columns about 10 m apart, each about 1.3 m above the ground and constructed with a concrete reinforcement that can resist a recoil force of 4 × 10⁵ N and consists of two steel frames, ground bolts, steel plates, and concrete foundations. A vertical upward throttling and venting unit was installed at the end of the experimental pipeline, as shown in Figure 1. A heating device was installed in the pipeline, with heating tape wrapped around the outer wall of the pipeline and an adiabatic insulation layer wrapped around the outer layer, which was used to heat up the CO2 inside the pipeline to reach the high pressure required for the experiment. A total of seven data acquisition sections were set up in the main pipeline, the location of which is shown in Table 1. A pressure sensor and five K-type armored thermocouples with different height distributions were installed in each section, the distribution of which is shown in Figure 2, and used to measure the pressure and temperature changes in the CO2 inside the pipe in the course of the experiment. The vertical venting device was connected by installing an upward elbow structure at the end of the main pipe to finally realize the upward venting of CO2. The throttle valve V1 was installed above the elbow, and the outlet was connected to the vertical pipe. The vertical pipes consist of two manifolds, which were installed above the throttle valve V1, and the throttle valve V2 was installed between the two manifolds. The throttle valve selected was a ball valve with an inner diameter of 50 mm. The two throttle pipes had the same specifications, with a length of 2 m and an inner diameter of 50 mm. In the vertical pipe, five data acquisition sections were set up, and one pressure sensor and one thermocouple were installed in each section. In order to study the temperature changes in the ball valve, we installed in each ball valve body at different heights 3 temperature measurement thermocouples. The NI cRIO-9024 system was selected as the signal acquisition system, and LabVIEW 19.0 software was used to process the acquired signals.
The experimental steps are as follows:
(1)
First, inject gas-phase CO2 into the main pipeline for evacuation to sweep out the gas in the pipeline.
(2)
Inject liquid-phase CO2 into the main pipeline.
(3)
Turn on the heating system to heat the CO2 inside the pipeline so that its temperature and pressure reach the set experimental value.
(4)
Notify the experimenter to arrive at the designated location and check all data acquisition systems for normal operation.
(5)
Turn on the data acquisition system and open the throttle valve to conduct the venting experiment. The pressure and temperature were obtained by pressure sensors and type-K thermocouples, respectively. The pressure sensor had a response frequency of 5 Hz and a pressure measurement range of 0 to 16 MPa, while the type-K thermocouple had a response frequency of 5 Hz and a measurement range of −200 to 1300 °C. We performed some calibration of the response time of the thermocouple by suddenly removing the thermocouple from the surrounding air and placing it in an ice mixture. The temperature change was then recorded by an NI temperature card and a PC. The response times obtained from the two tests were 1.75 s and 0.87 s. Therefore, the average value of 1.31 s can be used as a reference.
This study carried out a total of two groups of emptying experiments. The specific parameters are shown in Table 2. We explored the advantages and disadvantages of the double-stage throttling and emptying program compared with the direct emptying program and analyzed the generation law of dry ice in the experimental pipeline and the risk of the freezing and blocking of the valve of the emptying pipeline.

3. Results

3.1. Pressure Variation Rule

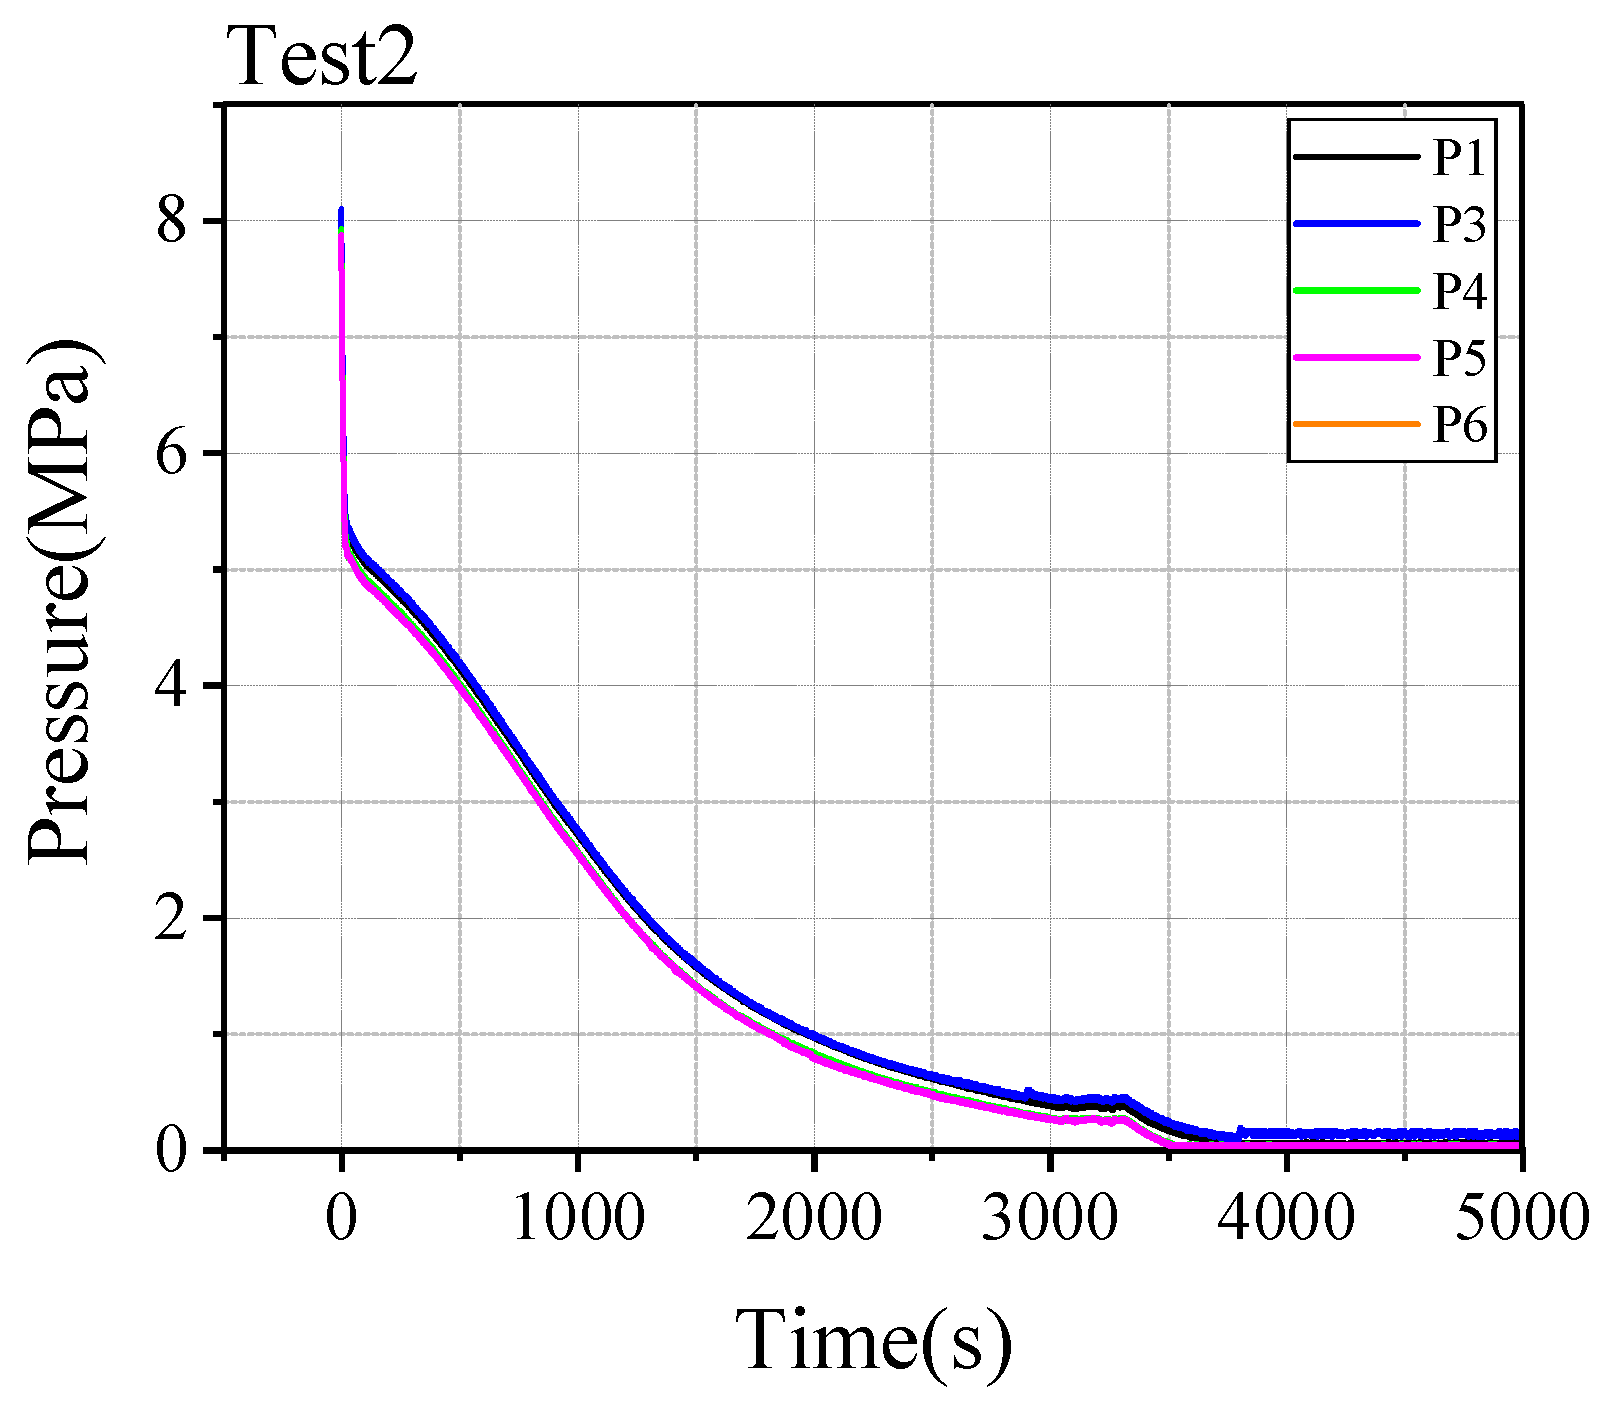
3.1.1. Result of Pressure Variation in the Main Pipeline

Figure 3 shows the pressure variation curve of Test1’s main pipeline with direct venting, from which it can be seen that the direct venting experiment lasts for a total of 1048.2 s and the pressure relief process can be divided into three stages. The first stage is the rapid pressure reduction process; the time is 0 s to 14.5 s, the average pressure drop rate is 0.199 MPa/s, and the pressure in the pipeline drops to 5.12 MPa. The second stage is the stable pressure reduction stage; the time is 14.5 s to 621.8 s, the pressure in the pipeline decreases to the CO2 triple-phase pressure of 0.52 MPa, and the average pressure drop rate is 0.008 MPa/s. The third stage is the rewarming process, which is described by the pressure variation curve of Test1’s main pipeline and lasts for 1048.2 s. The rewarming process ends when the pressure inside the pipeline finally drops to atmospheric pressure during this stage. Figure 4 shows the pressure drop in the main pipeline under the double-stage throttling condition in Test2, where both throttle valve openings were set to 50%. Test2 reduced the outflow area of the throttle valve compared with Test 1, thus prolonging the pressure relief time and leading to a significant reduction in the pressure drop rate. The double-stage throttling and venting program lasted a total of 5260.8 s and was also divided into three stages. The rapid pressure relief process occurred from 0 s to 20.1 s, with an average pressure drop rate of 0.139 MPa/s, and the pressure inside the pipe dropped to a minimum of 5.19 MPa. The second stage of the slow pressure drop process occurred from 20.1 s to 2352.4 s, with an average pressure drop rate of 0.002 MPa/s. The final stage is the return to the temperature at the end of the pressure relief process when the pressure inside the pipe finally drops to atmospheric pressure. It is very likely that dry ice will form in the pipeline at a later stage of the pressure relief process; however, the generation of dry ice is also related to the temperature inside the pipeline under low-pressure conditions, so the effect of temperature needs to be further considered.

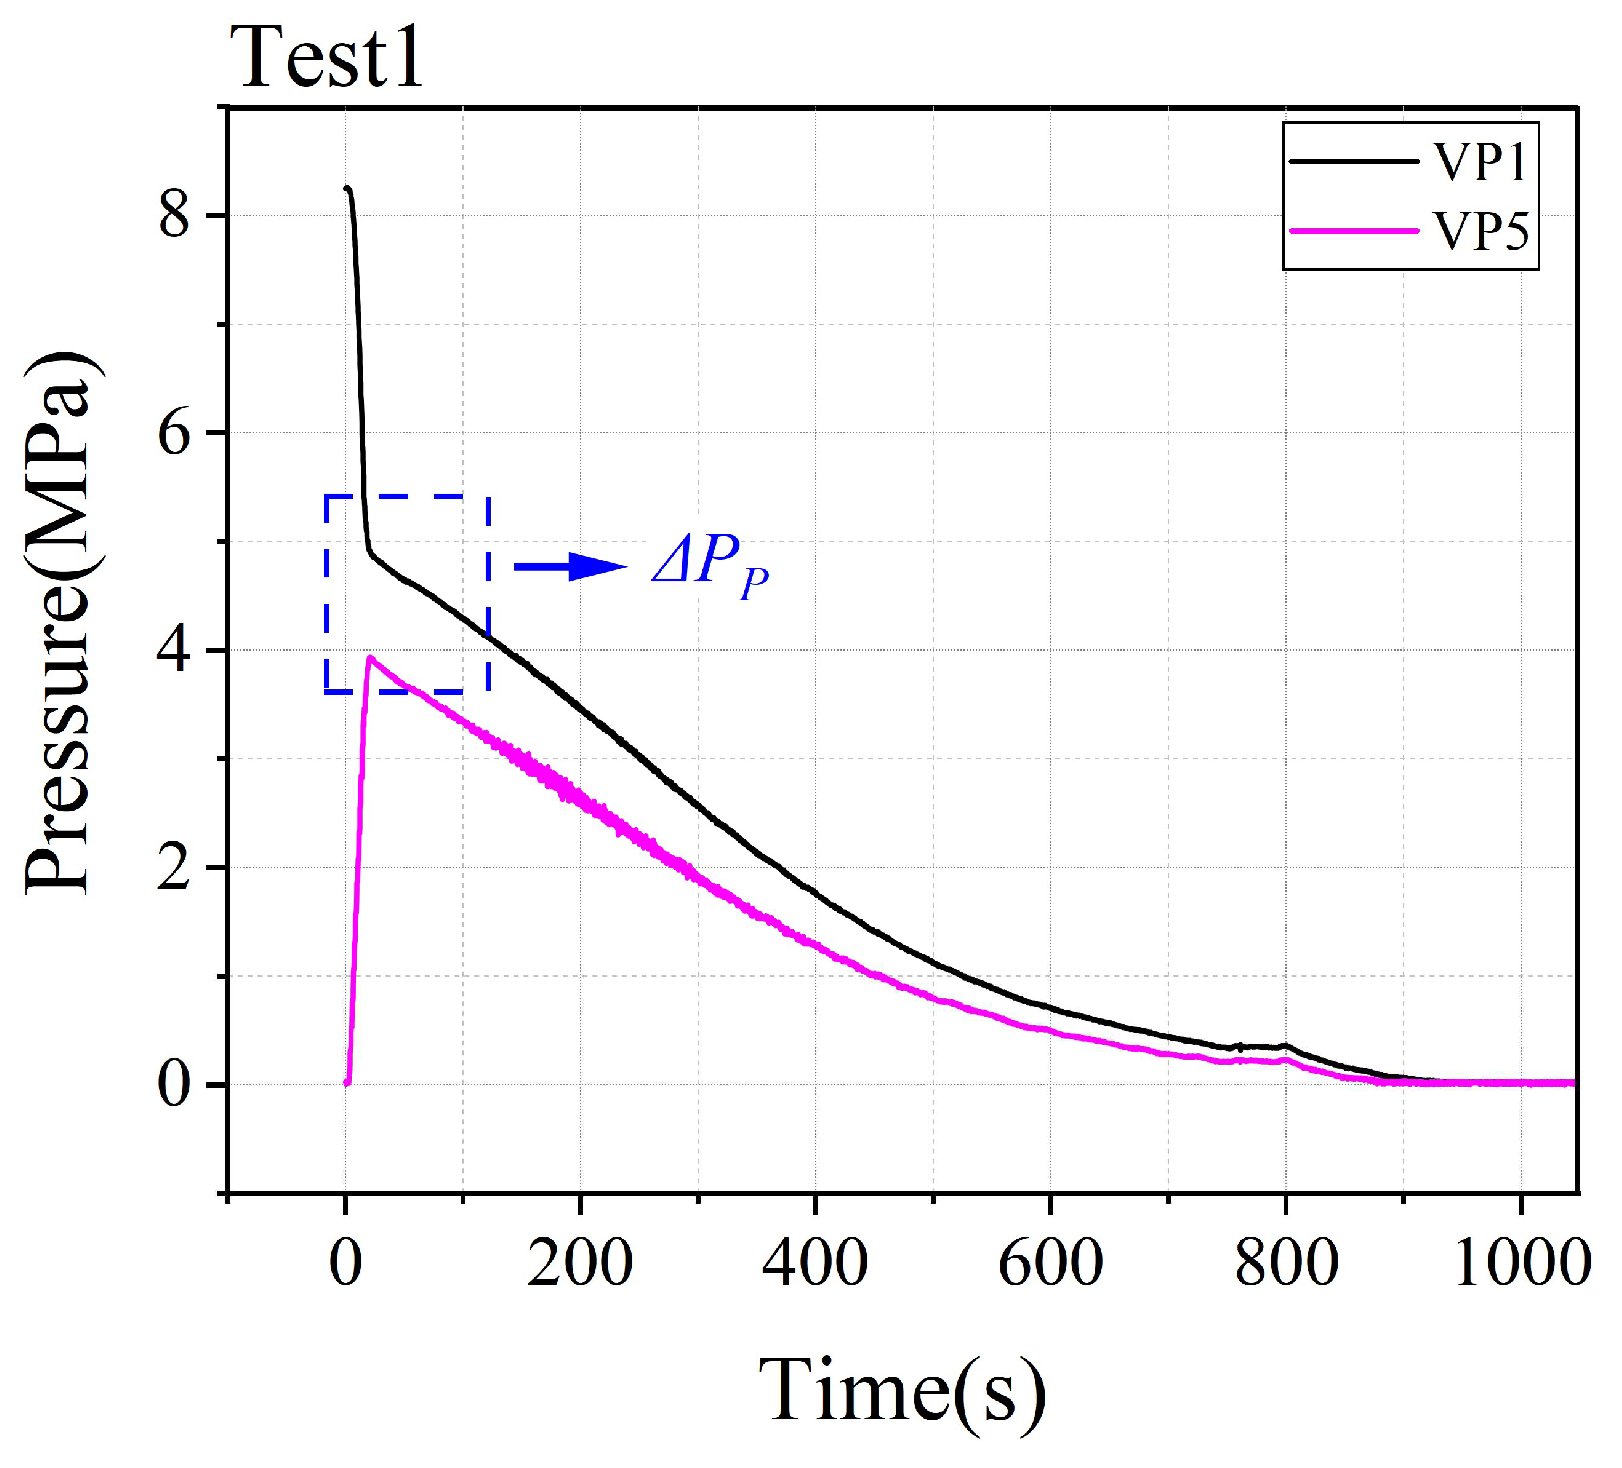
3.1.2. Results of Pressure Variation in the Vertical Pipe

Figure 5 shows the pressure variation curve of the Test1 vertical pipe for direct venting, where VP1 is connected to the main pipeline, and it therefore has the same pressure variation as the main pipeline. The pressure of the vertical pipe is related to the height of the measurement point, where the pressure is the highest at the bottom of the pipe and decreases the closer it is to the mouth of the pipe. During the complete pressure relief process, it was noted that the pressure change in the vertical pipe could be divided into two stages. The first stage is the pressure filling stage, during which the pressure is 0 MPa in the pipe as the valve is closed before the start of the pressure relief process and, when the valve is opened, the vertical pipe is rapidly pressurized, with the pressure at its highest level at the bottom of the pipe and decreasing the closer it is to the mouth of the pipe. The pipe mouth valve VP5 was opened after 20.9 s to reach a maximum pressure of 3.92 MPa (a rate of 0.188 MPa/s). At this time, the vertical pipe was in the holding pressure state, and the highest pressure difference between the bottom of the pipe and the mouth of the pipe was 0.95 MPa. In the double-stage throttling relief process shown in Figure 6, the maximum pressure of 1.71 MPa was reached at the vertical pipe mouth after 16.6 s (a rate of 0.103 MPa/s), and the maximum pressure difference between the bottom of the pipe and the mouth of the pipe was 3.81 MPa. Compared with the direct pressure relief process, the pressure increase rate of the vertical pipe in the pipe under the double-stage throttling relief condition was reduced by 45.2%, but the holding pressure level in the corresponding vertical pipe increased by 301.1%. Therefore, when using a multi-stage throttling and pressure relief program for industrial CO2 pipeline evacuation, the program for the vertical pipe’s pressure level needs to have higher requirements.
The industry standard for CO2 pipeline evacuation does not currently have a uniform and fixed pressure value, and the evacuation pressure is based on the dynamic range of pipeline designs, operating conditions, and safety analysis. Pressure relief structure design standards come mainly from the American Petroleum Institute, which developed the “Pressure-relieving and depressuring systems”, which provide that the maximum cumulative pressure in the pressure relief process should not exceed 116% of the structure’s structural design pressure. The valve used in this study was a ball valve with a maximum pressure of 16 MPa, and the design pressure of the pipeline is the same as that of the valve. Therefore, the pressure relief structure used in the experiments in this study meets the standard requirements, and the experimental results obtained are of great reference value for the design of the pressure relief structure of actual industrial pipelines.

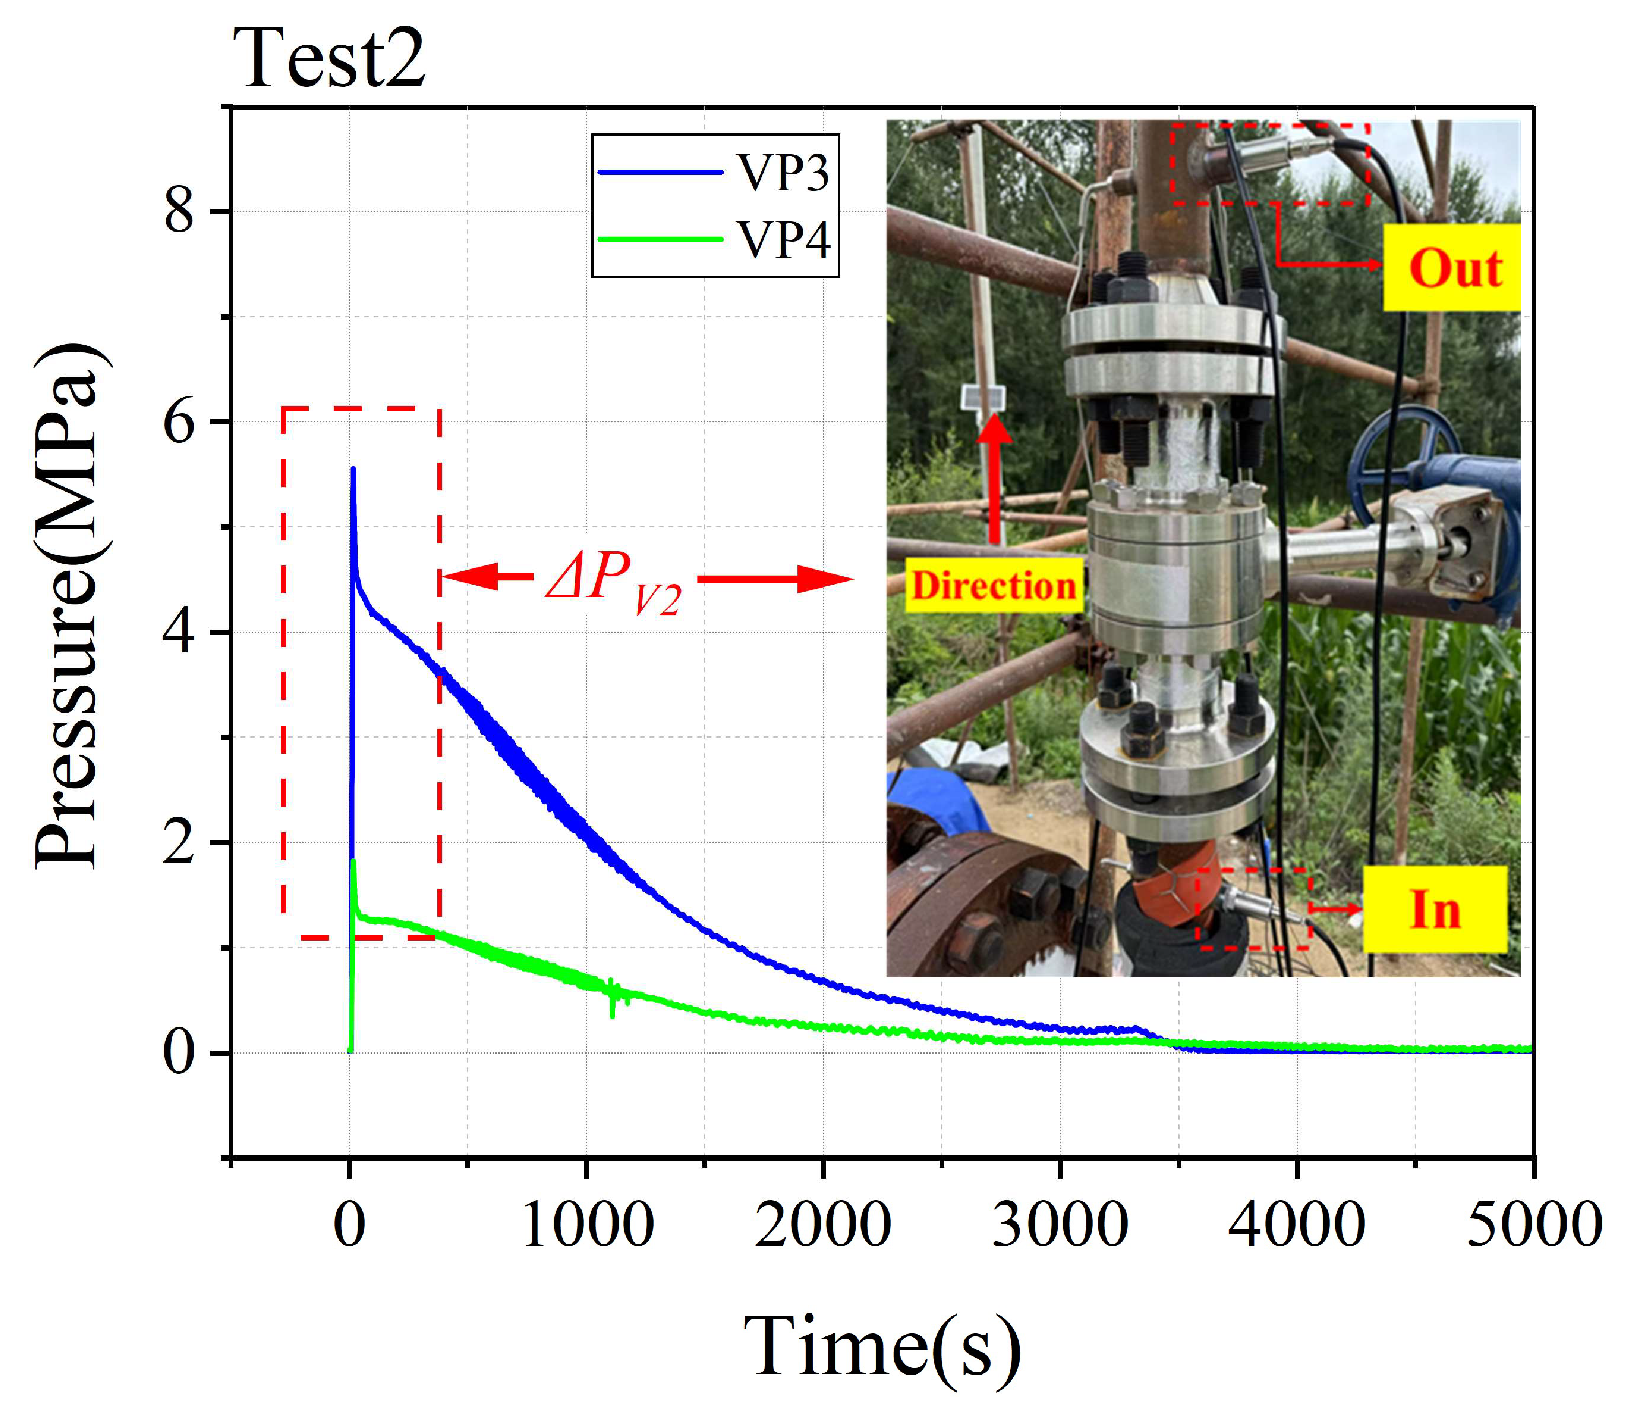
3.1.3. Results of Pressure Variation in the Venting Valve

For the measurement of the valve pressure, pressure sensors were installed at the inlet and outlet of each valve. As shown in Figure 7, the maximum holding pressure level in the valve was 0.27 MPa in the direct pressure relief scheme of Test1. Reducing the valve opening to 50% and using the double-stage throttling relief scheme, the maximum holding pressure level in the low-range valve V1 was 0.76 MPa, as shown in Figure 8. It is also noted that, during the transient charging process, the outlet pressure of the low-range valve V1 was equal to the inlet pressure at the highest pressure level. Therefore, the pressure-holding process in the low-range valve can be divided into two stages. The first stage occurs at the moment the valve opens; the valve instantaneously goes from the empty valve state to the initial conditions of the maximum differential pressure of 8 MPa, and then, in a very short period of time, the valve pressure increases to the same level as the inlet and outlet and the pressure-holding phenomenon disappears. Subsequently, within the second stage, the pressure-holding phenomenon again appears within the valve, and the pressure within the valve gradually increases to ΔPV1. After reaching the maximum intra-valve pressure, eventually, as the pressure relief continues, the pressure holding level gradually decreases until it disappears. During the double-stage throttling process in Test2, the maximum pressure in the low-range valve was 181.5% higher compared with the direct venting process in Test1. In the double-stage throttling pressure relief process in the high-range valve, as shown in Figure 9, the maximum holding pressure level was 3.72 MPa, while that of the low-range valve was 389.5% higher. It can be seen that, in the multi-stage throttling pressure relief process, the high-range valve is often faced with a higher pressure impact. So, when targeting the design of the venting system, the maximum pressure of the valve should be prioritized to ensure the safety of the high-range valve.
The reason for the valve holding pressure is the local pressure loss caused by the valve, which results in a more pronounced pressure difference between the entrance and exit of the valve. The localized pressure loss can be calculated by the following formula:
Δ p = K v 2 2 ρ
where ρ is the average density and K is the resistance coefficient of the valve, which can be calculated by the following equation:
K = K a + K b
where Ka is the resistance coefficient due to the change in the outflow area and direction, and Kb is the resistance coefficient inside the valve due to wall friction. Therefore, when pressure relief occurs, due to the outflow area changes and the influence of internal friction, the valve will inevitably produce an internal CO2 obstruction flow, so it leads to the occurrence of the valve pressure-holding phenomenon.

3.2. Temperature Variation Rule

3.2.1. Temperature Variation Results of the Main Pipeline

From Figure 10, it can be seen that the CO2 in the main pipeline cools down drastically due to thermal expansion during the pressure relief process. From the temperature drop law of the single cross-section in Test1, it can be seen that, in the radial direction of the pipeline in the pressure relief process, the temperature drop rate at the bottom of the pipe is the most rapid, and the closer to the top of the pipe, the higher the temperature is, and the better the overall performance of the upper hot and lower cold temperature drop law. This is due to flash vaporization, where a gas–liquid flash vapor interface will appear in the tube after the start of the pressure relief process. The liquid phase is located below the interface and the gas phase is above it. At the same time, the rapid vaporization process leads to rapid heat absorption in the lower part of the pipe, so that the temperature drop in the lower part of the pipe is particularly pronounced. The absorbed heat and vaporized CO2 float in the upper part of the pipe, thus forming a temperature drop pattern of hot above and cold below.
Taking the inlet end of the main pipe in Figure 10a as an example, during the entire pressure relief process, the temperature drops of T1, T2, T3, T4, and T5 are 0.035 °C/s, 0.058 °C/s, 0.071 °C/s, 0.093 °C/s, and 0.104 °C/s, respectively. In the axial direction of the main pipeline, the lowest temperature drop is −75.8 °C at the inlet, −75.1 °C at the outlet end, and −75.1 °C in the middle section of the pipe, so the temperatures at the inlet and outlet of the pipe are lower than those in the middle section of the pipe. As shown in Figure 10a, a temperature plateau of −56.6 °C occurs at the bottom of the pipe when the temperature drop is T5 at the inlet end section, thus proving that dry ice is generated at the inlet end of the pipe covering the bottom of the pipe. The temperature inside the pipe continues to decrease after the plateau period, and this phenomenon is caused by the sublimation and heat absorption of the dry ice. The middle section of the pipe shown in Figure 10b did not fall below the three-phase point during the temperature drop, so most of the dry ice at the inlet end had vaporized during migration with the gas–solid two-phase flow, making it difficult to interfere with the temperature drop in the middle section of the pipe. However, in Figure 10c, it can be observed that the temperature in the lower part of the pipe again shows a temperature drop plateau, but the lowest temperature of the plateau is −55.5 °C, which is higher than the three-phase point temperature of CO2. This is due to the fact that some dry ice particles are carried to the outlet end and then need to pass through the elbow structure before exiting the pipeline. However, the change in the flow direction causes the dry ice particles to be subjected to an increased gravitational force, which hampers the outflow process. As a result, the dry ice concentration at the outlet increases as the pressure relief continues and, because this process is still accompanied by the sublimation and heat absorption of the dry ice, the temperature drop is close to the low temperature of the CO2 triple-phase point.
Figure 11a shows the temperature drop curve of the main pipeline during the double-stage throttling pressure relief process. At the inlet end section of the main pipe, the temperature drops of T1, T2, T3, T4, and T5 are 0.007 °C/s, 0.013 °C/s, 0.018 °C/s, 0.023 °C/s, and 0.025 °C/s, respectively. Thus, the temperature drop pattern of the main pipe in the radial direction is similar to that of the direct pressure relief process for Test1. The minimum temperatures at the closed end of the bottom of the pipe under the two pressure relief schemes were −75.8 °C and −74.1 °C, respectively. Although the difference in the bottom temperatures was small, the temperature drop rate T5 at the bottom of the pipe for Test2 was reduced by 75.9% compared with that of Test1. Therefore, the use of the double-stage throttling scheme will significantly reduce the temperature drop rate of the main pipeline, which is mainly due to the increase in the pressure relief time due to the reduction in the valve aperture under the double-stage throttling effect. In the axial direction, the minimum temperatures at the inlet, middle, and outlet ends of the main pipe increased by 2.2%, 27.2%, and 4.8%, respectively, compared with Test1. Therefore, the use of a double-stage throttling scheme can reduce the temperature drop limit during the main pipe pressure relief process, with the most significant insulation effect in the middle section of the pipeline.

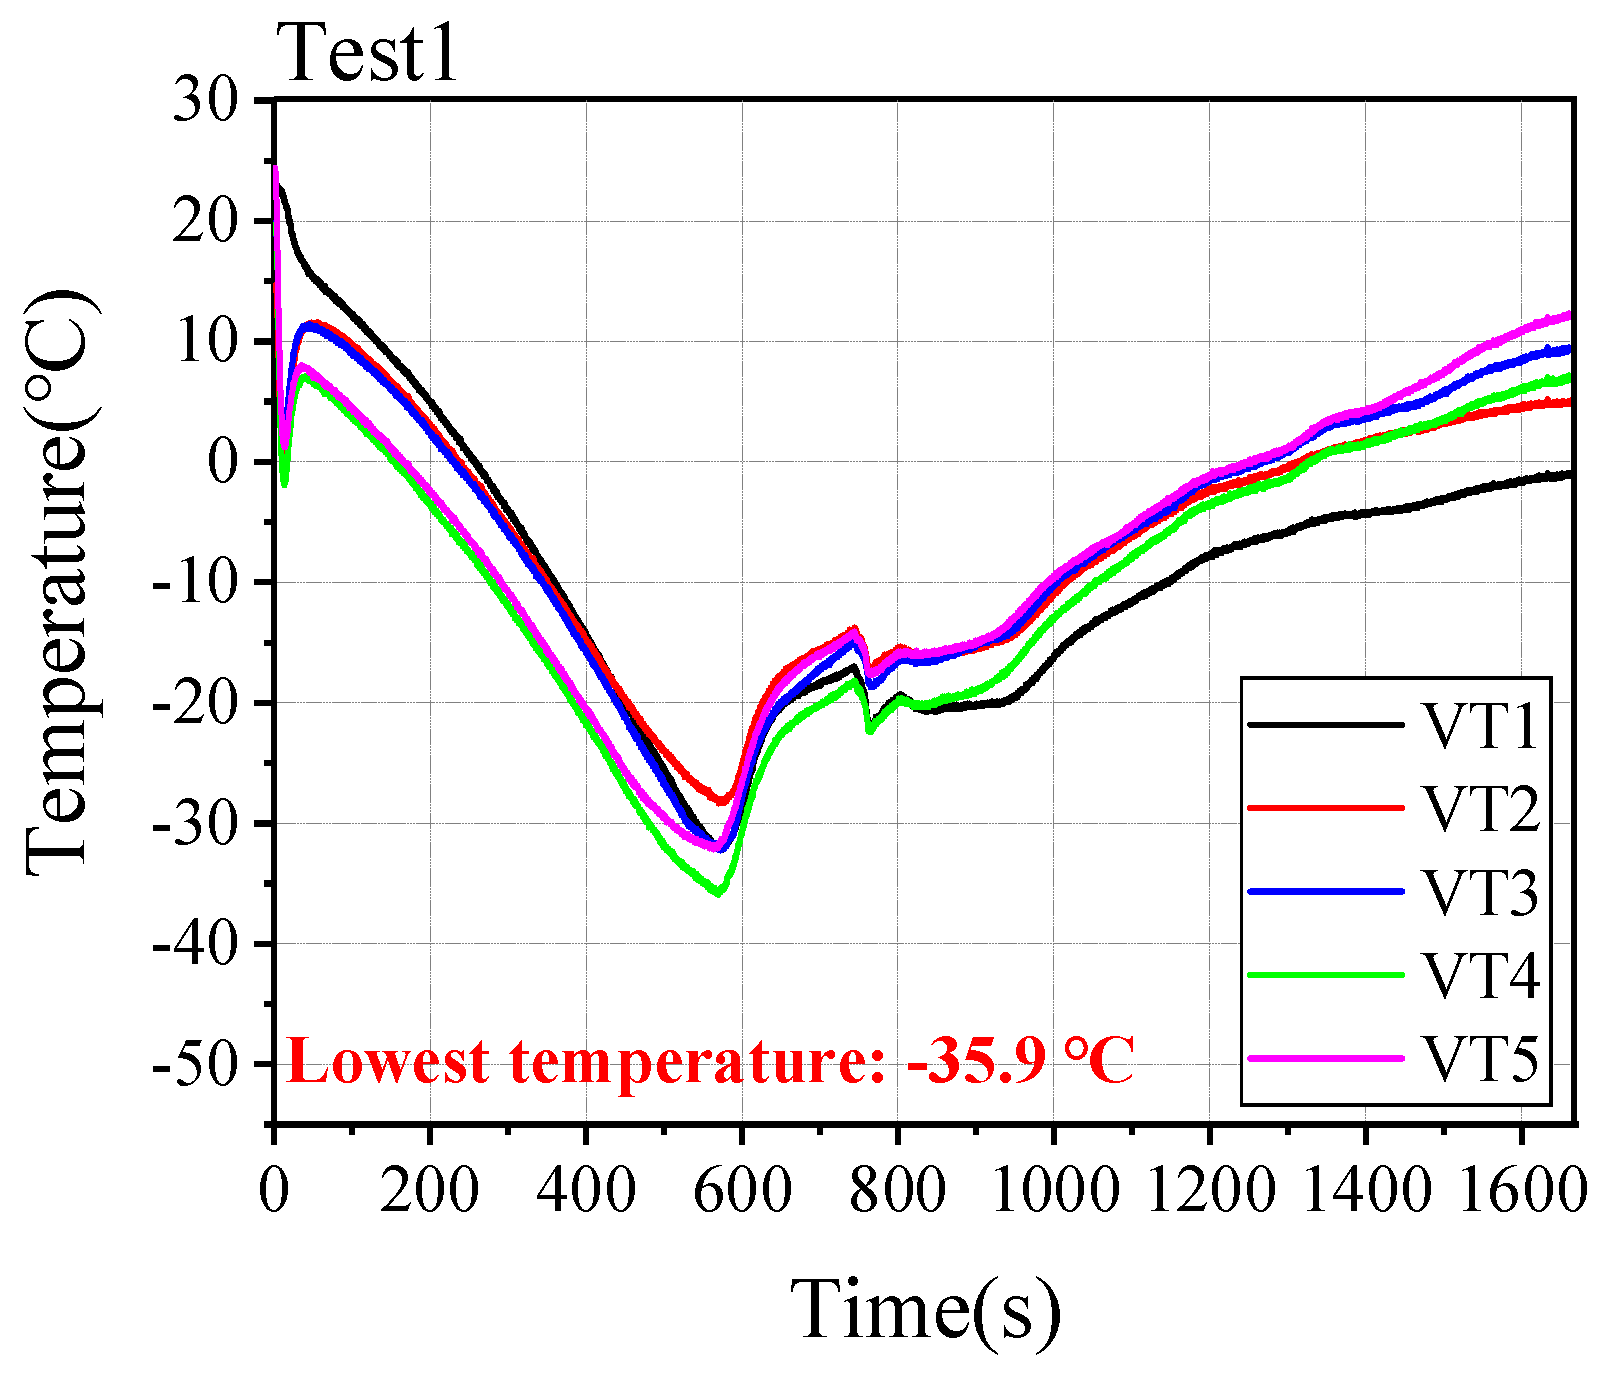
3.2.2. Results of Temperature Variation in the Vertical Pipe

As can be seen from Figure 12, the temperature variation in the vertical pipe in Test1, which is directly relieved, can be divided into four stages. Specifically, VT1 has a similar temperature drop pattern to the main pipeline because it is directly connected to the main pipeline. The first stage is a rapid temperature drop process, with a consistent temperature drop rate of 1.63 °C/s at all heights of the vertical pipe, and the temperature drops to a minimum of −1.94 °C, which takes 13.4 s. This is mainly due to the strong throttling effect at the instant of development, where high-pressure CO2 is discharged into the environment through the tiny valve leakage ports, which produces a drastic temperature drop due to the scorched soup effect. The second stage is a hot–medium temperature return process. The temperature return rate is 0.32 °C/s, the maximum temperature return is 11.6 °C, and the time required is 37.1 s. This is due to the gradual opening of the valve; the throttling effect is weakened, and the temperature variation in the CO2 containing heat in the main pipeline in a short period of time is small. At this time, the vertical pipe and the main pipeline are approximately the same system. The vertical pipe can be regarded as the main pipeline in the vertical direction of the extension. Therefore, when the CO2 flows through the vertical pipe, it will transfer heat into the wall, resulting in the temperature beginning to rise. The third stage is a cooling process. The temperature drop rate is 0.08 °C/s, the lowest temperature drops to −35.9 °C, and the time required is 534.7 s. This is due to the pressure relief continuing. The CO2 inside the pipe begins the phase expansion and heat absorption, resulting in a temperature drop occurring again. The final stage is the temperature return process. The temperature return rate is 0.04 °C/s, the highest temperature return is 12.1 °C, and the time required is 1089.5 s. This is due to the late pressure relief due to the weakening of the role of heat absorption in the CO2 phase transition. The increase in and environment of the heat transfer gradually dominate, so the vertical pipe temperature begins to rise to the ambient temperature.
Figure 13 shows the temperature variation process of the vertical pipe under the double-stage throttling and pressure relief scheme. This temperature variation process can also be divided into four stages. Figure 13 shows the first stage of the rapid temperature drop process, but, compared with the direct venting process of Test1, it is different. Near the mouth of VT5 and VT4, the temperature drop is the most intense, with a temperature drop rate of close to 0.51 °C/s. The temperature dropped to a minimum of −24.6 °C, and the length of time required was 106.7 s. The second stage is a hot–medium temperature return process. This process is close to that at the mouth of VT5 and VT4, but no longer back to the temperature; instead, it continues to cool down with the temperature drop rate of the first stage. The third stage is a cooling process. The temperature gradually dropped at the measurement point of the pipe mouth and that at the rest of the heights of the thermocouples converged. The temperature drop rate was 0.02 °C/s, the lowest temperature dropped to −45.9 °C, and the time required was 998.4 s. In the final cooling process, we observed that, 1386.5 s after the start of the pressure relief process, the temperature near the bottom of the vertical pipe cooled down again immediately after the start of the temperature return process, while the rate of temperature return at the mouth of the pipe began to decrease. This is due to the fact that dry ice started to form in the main pipeline at the late stage of the pressure relief process, and the dry ice particles sublimated and absorbed heat as they entered the vertical pipe, thus leading to a temperature drop in the lower part of the vertical pipe. The heat absorption of the dry ice as it rushed out of the vertical pipe also affected the flow field near the orifice, which slowed down the rate of warming there.

3.2.3. Results of Temperature Variation in the Venting Valve

Figure 14 shows the thermocouple installation position of each valve in the experiment. The use of high-strength, low-temperature-resistant tape allowed the T-type wall thermocouple to be tightly wrapped around the valve body so as to obtain the variation rule of the temperature at different heights of the valve. In Test1, the temperature variation curve in Figure 15 shows that the temperature difference between the top of the valve and the bottom of the valve is small, and the temperature variation process is similar to that of the vertical pipe. The difference is that the valve started to cool down 151.5 s after the start of the pressure relief process, and the lowest temperature of the valve dropped to −34.7 °C. This is mainly due to the fact that the valve is made of low-temperature-resistant material, so the heat transfer performance is more conservative and the heat transfer process between it and the CO2 in the pipe is contained. However, the position of the valve body in the center had a narrower range of temperature variation throughout the pressure relief process, the temperature difference between the top and bottom of the valve was large, and the maximum temperature difference was 23.4 °C, which was mainly due to the thicker specifications of the valve body in the center of the valve.
As shown in Figure 16, in the double-stage throttling and pressure relief process of Test2, although the temperature at the top and bottom of the low-pass valve V1 was lower than that of the valve body, the average temperature difference of the valve was significantly smaller than that in Test1. The temperature difference was 13.8 °C at most, which is 41.1% less than that in Test1. Therefore, the double-stage throttling and pressure relief scheme can effectively control the inhomogeneity in the heat of the low-pass venting valve, thus protecting against and mitigating the low-temperature hazard of the valve. However, as can be seen from Figure 17, the temperature difference of the high-range valve V2 varied considerably at this time, with its lowest temperature occurring at the top of the valve, which was as low as −59.6 °C. The maximum temperature difference of the valve was 46.3 °C, which is 235.5% higher compared with the low-range valve V1. Therefore, for the double-stage throttling and pressure relief program, the protection of the equipment against low temperatures should focus on the high-range valve, especially the top of the high-range valve, which is recommended to be artificially heated to be protected.

4. Discussion

During the manual pressure relief process of long-distance, industrial-grade CO2 pipelines, the control of cryogenic risks inside the pipe is a major concern for operational safety. Due to the large size of the pipe, the time required for the pressure relief process is extremely long. During the long pressure relief process, the risk of low temperatures brings a significant danger of dry ice accumulation in the pipe. On the one hand, the dry ice will migrate with the airflow to form a multiphase flow into the valve, leading to freezing and blocking. On the other hand, the prolonged contact between the pipe and the dry ice is very likely to destroy the material properties in the short term, thus generating a safety risk in the long term. The proposed method of double-stage throttling and pressure relief is aimed at alleviating the structural instability caused by the large pressure difference in the vertical pipe, but the low-temperature characteristics of the pipe during the pressure relief process still need to be studied.

4.1. Unsteady-State Phase Transitions

The phase change in the CO2 transportation pipeline during the artificial pressure relief process is more obviously affected by the pressure relief method, and the phase change processes at the inlet and outlet of the main pipeline during the direct pressure relief process are shown in Figure 18. Currently, the equations of state describing the physical properties of CO2 include PR, SRK, S-W, and GERG-2008. GERG-2008 has been widely used due to its high accuracy and wide fitting range. So, the gas–liquid saturation line was simulated using Multiflash 7.1 software in this study, and the physical property equations used to calculate the thermodynamic properties of the liquid and gas phases were taken from GERG-2008 Eos, which is expressed as a function of the Helmholtz free energy with temperature and density, as shown below:
α ρ , T = α 0 ρ , T + α τ ρ , T
In the above equation of state using the Helmholtz free energy α, the independent variables are the density ρ and the temperature. T. α0 denotes the properties of an ideal gas at a definite density and temperature, and ατ takes into account the residual fluid properties.
As can be seen from Figure 19, when the direct pressure relief scheme in Test1 is adopted, the CO2 in the pipe turns into a superheated state due to the rapid decompression after the start of the pipe venting process. The phase curve rapidly crosses the gas–liquid saturation line from the initial point, at which time a large number of bubbles are rapidly generated in the pipeline due to the superheating of the CO2, causing the pressure to stabilize at the downstroke limit. With the onset of the phase transition, the CO2 in the pipeline evaporates rapidly along the path of the gas–liquid saturation line in a top-to-bottom order of the pipeline height and gradually deviates from the saturation line into the gas-phase region. During the phase transition, it was found that the superheated state was most obvious at the outlet end, and the phase transition process here was affected by turbulence, which caused the CO2 at the bottom of the pipeline to enter the gas-phase region faster than that at the inlet end.
As can be seen from Figure 19, in the double-stage throttling and pressure relief process of Test2, the phase transition process at the inlet end of the main pipeline is similar to that of the direct pressure relief scheme. The difference is that the gasification rate gradually decreases in the late stage of pressure relief, and the pressure downwash is more obvious. The phase transition process at the outlet end of the pipeline also exhibits an obvious overheating phenomenon, but it is closer to the saturation line than the direct pressure relief scheme, so the gasification process is smoother and more uniform than the direct pressure relief scheme.

4.2. Temperature Drop Limit in the Main Pipeline

The minimum temperature of the main pipe during the pressure relief process is shown in Figure 20, which shows that the temperature drop limit of the upstream pipeline section of the main pipeline will be curbed when the double-stage throttling and pressure relief scheme is used. In the two sets of pressure relief experiments in this study, the minimum temperatures of the upstream sections C1, C2, and C3 in Test2 increased by 2.2%, 16.5%, and 27.2%, respectively, compared with Test1. Therefore, the use of a double-stage throttling relief scheme protects the distal section of the pipeline at the upper distance; however, as can be seen in Figure 20, the minimum temperatures of the proximal section close to the relief port drop even lower. The minimum temperatures of the downstream sections C4, C5, C6, and C7 in Test2 were respectively 8.8%, 4.9%, 39.2%, and 4.8% lower than those of Test1. Therefore, when using the double-stage throttling relief scheme, appropriate low-temperature protection measures should be taken for the downstream sections.
The minimum temperature of the main pipeline occurs in the later stages of the pressure relief process; so, when the temperature is below −56.6 °C, the pipeline can be considered to have a low-temperature risk zone for dry ice generation. As can be seen from Figure 20, at the inlet end of the main pipeline in Test1, the minimum temperature of the C2 section is lower than −56.6 °C, but the minimum temperature of the C3 section is higher than this range. Therefore, it can be seen that the maximum range of the dry ice risk zone at the inlet end of the pipeline is between the C2 and C3 sections, which is greater than 96.0 m and less than 149.2 m. When the secondary throttling scheme is used, the dry ice risk zone at the inlet end is shortened, and the widest range is greater than 20.6 m and less than 96.0 m. For the outlet end of the main pipeline, in the direct pressure relief scheme, with the outlet end as the origin, the dry ice cryogenic zone extends no farther than the C6 cross-section, so the maximum range is 7.4 m. When a secondary throttling scheme is used, the dry ice risk zone at the outlet end will extend as far as between the C3 and C4 cross-sections (greater than 54.2 m and less than 108.8 m).

4.3. Risk of Freezing of Vertical Pipe and Valves

The most serious threat to valves from low pipeline temperatures is valve clogging, so it is necessary to analyze the CO2 phase upstream of the valve to assess the potential for dry ice to enter the valve. The CO2 in the main pipeline, when passing through a small-diameter valve, will produce a sharp temperature drop. This temperature drop phenomenon comes from the Joule–Thomson effect, where the Joule–Thomson coefficient is expressed as follows:
Δ T Δ P T P H = μ J T
The Joule–Thomson coefficient of a CO2 pipeline is not a constant value in the process of venting, and in the dense-phase condition where the pressure is greater than 7.38 MPa and the temperature is lower than the critical point, the Joule–Thomson coefficient is greater than 0, but its absolute value is relatively small. Therefore, although the temperature drop is slower, the risk of low temperatures still exists. The existence of the throttling effect accelerates the flow rate, so that the actual temperature drop effect is smaller than the predicted value of the coefficient of the coke and soup, which leads to the phenomenon of phase change hysteresis. At the same time, the low-temperature region is concentrated at the throttle valve, increasing the chance of dry ice clogging.
As the CO2 flow rate during evacuation is high, it is almost too late for the CO2 to thermally interact with the outside world, so the CO2 evacuation process can be regarded as an adiabatic throttling process. Therefore, the temperature of CO2 can be predicted based on the adiabatic throttling theory. The flow process of the fluid in the pipeline obeys the following stable flow energy equation:
q = ( h 2 h 1 ) + ( v 2 2 v 1 2 ) 2 + g ( z 2 z 1 ) + w
where h1, h2 is the enthalpy of the fluid before and after the flow; v1, v2 is the flow rate of the fluid before and after the flow; z1, z2 is the height of the fluid; and w is the work done by the fluid to flow to the outside. Since the change in the equipment structure in the flow process is not obvious, the potential energy effect of the flow field is ignored:
g ( z 1 z 2 ) = 0
Since the heat exchange between the CO2 and the environment is neglected, the energy equation can be further simplified as follows:
h 2 + v 2 2 2 = h 1 + v 1 2 2 = C
where C is a constant. The flow field velocity v2 after the flow is:
v 2 = 2 ( h 1 h 2 )
After substituting the specific heat capacity, the above equation can be expressed as follows:
v 2 = 2 σ ( T 1 T 2 )
Since the enthalpy of the real gas requires the additional consideration of the isothermal enthalpy difference, the enthalpy before throttling, h1, is obtained from the following equation:
h 1 = h + Δ h
Subsequently, the enthalpy h2 after throttling can be obtained by iterative inversion of the relationship. Finally, the outlet temperature after throttling can be calculated by the relationship between enthalpy and temperature.
The CO2 phase transition process at the inlet of the low-range valve V1 under two artificial pressure relief schemes is shown in Figure 21. In Test1 of the direct pressure relief scheme, the CO2 at the inlet rapidly turns into a superheated state after the start of the pressure relief process, and its phase profile rapidly crosses the gas–liquid saturation line to reach the gas-phase region. This is followed by a continuous phase transition along the direction of the gas–liquid saturation line until it finally turns into the gas phase completely. It is noted that, during the process of gasification along the gas–liquid saturation line, although the trend of the CO2 phase change at the valve inlet is the same as that of the saturation line, it is always farther away from the saturation line, which proves that the CO2 at the inlet has been completely gasified at this time. In the double-stage throttling and pressure relief process of Test2, although the gasification process is closer to the saturation line than that of Test1, there is always an interval and fluctuation in the gas-phase region, so the degree of gasification is more complete.
Although the phase change process at the inlet of the vertical pipe valve in both pressure relief schemes does not involve the solid phase but does not exclude the possibility of dry ice entering the valve, the source of dry ice at this time is mainly the gas–solid two-phase flow in the main pipeline. Figure 18 and Figure 19 show the phase change process at the outlet end of the main pipeline. The CO2 at the outlet section of the main pipeline is close to the gas–solid saturation line, so it is very likely that dry ice particles will form at the valve here. No valve freeze-up was observed during the experiment, which is related to the limited pressure relief time of the experimental pipeline. Therefore, it is necessary to adopt an intermittent pressure relief program to mitigate the risk of valve freeze-up during the pressure relief process of long-distance industrial pipelines.
For CO2 pipelines, the use of a two-stage throttling scheme can optimize the stability of the pressure relief structure, but it complicates the actual industrial operation process. In order to avoid damage to the pipeline and equipment due to the rapid temperature drop during the pressure relief process, phased opening and closing of the valves will be unavoidable. Compared with direct venting, the throttling effect increases the risk of valve clogging; so, at the key pressure relief location pressure and temperature monitoring are also very necessary, which to a certain extent will increase the technical needs of the pipeline operation. The need to use a large number of pressure-reducing valve combinations and more human resources will also increase the maintenance costs of the pipeline. However, the throttling relief program will also effectively reduce the probability of accidents, so the choice of throttling program needs to take into account the actual pipeline maintenance conditions.

5. Conclusions

In this study, two sets of venting experiments were carried out through an industrial-scale experimental device to investigate the superiority of the double-stage throttling and pressure relief scheme for industrial-scale CO2 pipelines compared with the direct pressure relief process. Our main conclusions are as follows:
(1)
When using the double-stage throttling and pressure relief program, the increase in the length of the pressure relief process makes the pressure drop rate of the main pipeline decrease. Therefore, although the double-stage throttling and pressure relief program will increase the time required to relieve the pressure in long-distance industrial pipelines, it will effectively improve the structural stability of the pressure relief process.
(2)
The double-stage throttling relief process reduces the risk of hypothermia in the upstream section of the main pipeline compared with the direct pressure relief process, but increases the temperature drop limit in the downstream section. Therefore, when the double-stage throttling scheme is used to relieve pressure, the downstream section of the main pipeline should be protected from low temperatures by artificial heating.
(3)
Even if no dry ice is generated at the inlet of the relief device, the relief valve is still exposed to the threat of dry ice carried in by the gas–solid multiphase flow of the main pipeline. Therefore, in order to prevent the risk of valve freeze-up in long-distance industrial pipelines, it is recommended that the valve be shut down in order to return it to the appropriate temperature and an intermittent pressure relief program be used during the long pressure relief process.

Author Contributions

H.S.: investigation, writing—original draft, writing—review & editing. T.W.: writing—review & editing. J.Q.: investigation. K.J.: investigation. J.L.: investigation. F.L.: investigation. F.Q.: investigation. K.Z.: investigation. B.Y.: investigation. J.Y.: conceptualization, supervision, project administration. All authors have read and agreed to the published version of the manuscript.

Funding

This research was funded by the Natural Science Foundation of Shandong Province (ZR2024QE223).

Institutional Review Board Statement

Not applicable.

Informed Consent Statement

Not applicable.

Data Availability Statement

Data will be made available on request.

Conflicts of Interest

Authors Huifang Song, Tingyi Wang, Jingjing Qi, Kai Jin, Jia Liu and Feng Li were employed by the company Shengli Oilfield Technology Inspection Center. The remaining authors declare that the research was conducted in the absence of any commercial or financial relationships that could be construed as a potential conflict of interest.

References

  1. Pham, L.H.H.P.; Rusli, R. A review of experimental and modelling methods for accidental release behaviour of high-pressurised CO2 pipelines at atmospheric environment. Process Saf. Environ. Prot. 2016, 104, 48–84. [Google Scholar] [CrossRef]
  2. Al Baroudi, H.; Patchigolla, K.; Thanganadar, D.; Jonnalagadda, K. Experimental study of accidental leakage behaviour of liquid CO2 under shipping conditions. Process Saf. Environ. Prot. 2021, 153, 439–451. [Google Scholar] [CrossRef]
  3. Mocellin, P.; Vianello, C.; Maschio, G. Hazard investigation of dry–ice bank induced risks related to rapid depressurization of CCS pipelines: Analysis of different numerical modelling approaches. Int. J. Greenh. Gas Control 2016, 55, 82–96. [Google Scholar] [CrossRef]
  4. Khudhair Mohammed, R.; Farzaneh, H. Investigating the impact of the future carbon market on the profitability of carbon capture, utilization, and storage (CCUS) projects; the case of oil fields in southern Iraq. Energy Convers. Manag. X 2024, 22, 100562. [Google Scholar] [CrossRef]
  5. Liu, X.; Godbole, A.; Lu, C.; Michal, G.; Venton, P. Study of the consequences of CO2 released from high-pressure pipelines. Atmos. Environ. 2015, 116, 51–64. [Google Scholar] [CrossRef]
  6. Vitali, M.; Zuliani, C.; Corvaro, F.; Marchetti, B.; Tallone, F. Statistical analysis of incidents on onshore CO2 pipelines based on PHMSA database. J. Loss Prev. Process Ind. 2022, 74, 200–210. [Google Scholar] [CrossRef]
  7. Guo, X.; Yan, X.; Yu, J.; Yang, Y.; Zhang, Y.; Chen, S.; Mahgerefteh, H.; Martynov, S.; Collard, A. Pressure responses and phase transitions during the release of high pressure CO2 from a large-scale pipeline. Energy 2017, 118, 1066–1078. [Google Scholar] [CrossRef]
  8. Yan, X.; Guo, X.; Yu, J.; Chen, S.; Zhang, Y.; Mahgerefteh, H.; Martynov, S.; Brown, S. Flow characteristics and dispersion during the vertical anthropogenic venting of supercritical CO2 from an industrial scale pipeline. Energy Procedia 2018, 154, 66–72. [Google Scholar] [CrossRef]
  9. Chaczykowski, M.; Osiadacz, A.J. Dynamic simulation of pipelines containing dense phase/supercritical CO2-rich mixtures for carbon capture and storage. Int. J. Greenh. Gas Control 2012, 9, 446–456. [Google Scholar] [CrossRef]
  10. Yu, S.; Yan, X.; He, Y.; Hu, Y.; Qiao, F.; Yang, K.; Cao, Z.; Chen, L.; Liu, Z.; Yu, J.; et al. Study on the effect of valve openings and multi-stage throttling structures on the pressure and temperature during CO2 pipeline venting processes. Energy 2024, 308, 132967. [Google Scholar] [CrossRef]
  11. Guo, X.; Yan, X.; Zheng, Y.; Yu, J.; Zhang, Y.; Chen, S.; Chen, L.; Mahgerefteh, H.; Martynov, S.; Collard, A.; et al. Under-expanded jets and dispersion in high pressure CO2 releases from an industrial scale pipeline. Energy 2017, 119, 53–66. [Google Scholar] [CrossRef]
  12. Cao, Q.; Yan, X.; Yu, S.; Yu, J.; Chen, S.; Zhang, Y.; Guo, X. Experimental Investigation of the Characteristics of Supercritical CO2 during the Venting Process. Int. J. Greenh. Gas Control 2021, 110, 103424. [Google Scholar] [CrossRef]
  13. Woolley, R.M.; Fairweather, M.; Wareing, C.J.; Falle, S.A.; Mahgerefteh, H.; Martynov, S.; Brown, S.; Narasimhamurthy, V.D.; Storvik, I.E.; Sælen, L.; et al. CO2 PipeHaz: Quantitative Hazard Assessment for Next Generation CO2 Pipelines. Energy Procedia 2014, 63, 2510–2529. [Google Scholar] [CrossRef]
  14. Joshi, P.; Bikkina, P.; Wang, Q. Consequence analysis of accidental release of supercritical carbon dioxide from high pressure pipelines. Int. J. Greenh. Gas Control 2016, 55, 166–176. [Google Scholar] [CrossRef]
  15. Fan, X.; Wang, Y.; Zhou, Y.; Chen, J.; Huang, Y.; Wang, J. Experimental study of supercritical CO2 leakage behavior from pressurized vessels. Energy 2018, 150, 342–350. [Google Scholar] [CrossRef]
  16. Vitali, M.; Corvaro, F.; Marchetti, B.; Terenzi, A. Thermodynamic challenges for CO2 pipelines design: A critical review on the effects of impurities, water content, and low temperature. Int. J. Greenh. Gas Control 2022, 114, 103605. [Google Scholar] [CrossRef]
  17. Xie, Q.; Tu, R.; Jiang, X.; Li, K.; Zhou, X. The leakage behavior of supercritical CO2 flow in an experimental pipeline system. Appl. Energy 2014, 130, 574–580. [Google Scholar] [CrossRef]
  18. Wang, C.; Li, Y.; Teng, L.; Gu, S.; Hu, Q.; Zhang, D.; Ye, X.; Wang, J. Experimental study on dispersion behavior during the leakage of high pressure CO2 pipelines. Exp. Therm. Fluid Sci. 2019, 105, 77–84. [Google Scholar] [CrossRef]
  19. Gu, S.; Li, Y.; Teng, L.; Wang, C.; Hu, Q.; Zhang, D.; Ye, X.; Wang, J.; Iglauer, S. An experimental study on the flow characteristics during the leakage of high pressure CO2 pipelines. Process Saf. Environ. Prot. 2019, 125, 92–101. [Google Scholar] [CrossRef]
  20. Li, K.; Zhou, X.; Tu, R.; Tu, H.; Fang, Y.; Su, L. Investigation of flow characteristics in small-scale highly pressurized leaked CO2 jet plume from pipeline. Int. J. Therm. Sci. 2019, 141, 160–170. [Google Scholar] [CrossRef]
  21. Koeijer, G.; Borch, J.H.; Jakobsenb, J.; Drescher, M. Experiments and modeling of two-phase transient flow during CO2 pipeline depressurization. Energy Procedia 2009, 1, 1683–1689. [Google Scholar] [CrossRef]
  22. Wareing, C.J.; Fairweather, M.; Falle, S.A.; Woolley, R.M.; Ward, A.M. High pressure CO2 CCS pipelines: Comparing dispersion models with multiple experimental datasets. Int. J. Greenh. Gas Control 2016, 54, 716–726. [Google Scholar] [CrossRef]
  23. Lankadasu, A.; Tripathi, A.; Saysset, S.; Yackow, A.; De La Roussiere, B. Numerical Modeling of Supercritical CO2 Leaks and its Subsequent Dispersion in the Ambient Air. Procedia IUTAM 2015, 15, 49–56. [Google Scholar] [CrossRef]
  24. Liu, X.; Godbole, A.; Lu, C.; Michal, G.; Venton, P. Source strength and dispersion of CO2 releases from high-pressure pipelines: CFD model using real gas equation of state. Appl. Energy 2014, 126, 56–68. [Google Scholar] [CrossRef]
  25. Aursand, E.; Aursand, P.; Hammer, M.; Lund, H. The influence of CO2 mixture composition and equations of state on simulations of transient pipeline decompression. Int. J. Greenh. Gas Control 2016, 54, 599–609. [Google Scholar] [CrossRef]
  26. Karpenko, M.; Stosiak, M.; Šukevičius, Š.; Skačkauskas, P.; Urbanowicz, K.; Deptuła, A. Hydrodynamic Processes in Angular Fitting Connections of a Transport Machine’s Hydraulic Drive. Machines 2023, 11, 355. [Google Scholar] [CrossRef]
  27. Vitali, M.; Leporini, M.; Masi, O.; Speranza, A.; Corvaro, F.; Marchetti, B. Net zero Flow Assurance—Validation of various equations of state for the prediction of VLE and density of CO2-rich mixtures for CCUS applications. Int. J. Greenh. Gas Control 2023, 125, 103877. [Google Scholar] [CrossRef]
  28. Mahgerefteh, H.; Zhang, P.; Brown, S. Modelling brittle fracture propagation in gas and dense-phase CO2 transportation pipelines. Int. J. Greenh. Gas Control 2016, 46, 39–47. [Google Scholar] [CrossRef]
Figure 1. Emission experiment setup.
Energies 18 03244 g001
Figure 2. Measuring point setup of the main pipeline cross-section.
Energies 18 03244 g002
Figure 3. Direct venting pressure variation curve of main pipeline.
Energies 18 03244 g003
Figure 4. Double-stage throttling venting pressure variation curve of main pipeline.
Energies 18 03244 g004
Figure 5. Direct venting pressure variation curve of vertical pipe.
Energies 18 03244 g005
Figure 6. Double-stage throttling and venting pressure variation curve of vertical pipe.
Energies 18 03244 g006
Figure 7. Test1 valve pressure drop curve.
Energies 18 03244 g007
Figure 8. Test2 low-range valve pressure drop curve.
Energies 18 03244 g008
Figure 9. Test2 high-range valve pressure drop curve.
Energies 18 03244 g009
Figure 10. Test1 main pipeline temperature variation curve.
Energies 18 03244 g010aEnergies 18 03244 g010b
Figure 11. Test2 main pipeline temperature variation curve.
Energies 18 03244 g011
Figure 12. Test1 vertical pipe temperature drop curve.
Energies 18 03244 g012
Figure 13. Test2 vertical pipe temperature drop curve.
Energies 18 03244 g013
Figure 14. Valve thermocouple mounting location.
Energies 18 03244 g014
Figure 15. Test1 valve temperature drop curve.
Energies 18 03244 g015
Figure 16. Test2 low-range valve temperature drop curve.
Energies 18 03244 g016
Figure 17. Test2 high-range valve temperature drop curve.
Energies 18 03244 g017
Figure 18. P-T curve of the phase transition process in the main pipeline in Test1.
Energies 18 03244 g018
Figure 19. P-T curve of the phase transition process in the main pipeline in Test2.
Energies 18 03244 g019
Figure 20. Comparison of minimum pipeline temperatures.
Energies 18 03244 g020
Figure 21. Valve inlet phase transition process.
Energies 18 03244 g021
Table 1. Distance of the cross-section from the orifice of the pipeline.
Section SequenceC1C2C3C4C5C6C7
Length/m20.696.0149.2203.8247.6250.6257.3
Table 2. Parameters of emission experiments.
Experimental GroupInitial Temperature/°CInitial Pressure/MPaThrottle Valve OpeningEmptying Program
Test120.28.3100%Direct venting
Test219.88.150%Double-stage throttle
Disclaimer/Publisher’s Note: The statements, opinions and data contained in all publications are solely those of the individual author(s) and contributor(s) and not of MDPI and/or the editor(s). MDPI and/or the editor(s) disclaim responsibility for any injury to people or property resulting from any ideas, methods, instructions or products referred to in the content.

