Article

A Real Options Model for CCUS Investment: CO2 Hydrogenation to Methanol in a Chinese Integrated Refining–Chemical Plant

School of Economics and Management, China University of Petroleum (Beijing), Beijing 102249, China
*
Author to whom correspondence should be addressed.
Energies 2025, 18(12), 3092; https://doi.org/10.3390/en18123092
Submission received: 7 May 2025 / Revised: 1 June 2025 / Accepted: 8 June 2025 / Published: 12 June 2025
(This article belongs to the Section B3: Carbon Emission and Utilization)

Abstract

The scaling up of carbon capture, utilization, and storage (CCUS) deployment is constrained by multiple factors, including technological immaturity, high capital expenditures, and extended investment return periods. The existing research on CCUS investment decisions predominantly centers on coal-fired power plants, with the utilization pathways placing a primary emphasis on storage or enhanced oil recovery (EOR). There is limited research available regarding the chemical utilization of carbon dioxide (CO2). This study develops an options-based analytical model, employing geometric Brownian motion to characterize carbon and oil price uncertainties while incorporating the learning curve effect in carbon capture infrastructure costs. Additionally, revenues from chemical utilization and EOR are integrated into the return model. A case study is conducted on a process producing 100,000 tons of methanol annually via CO2 hydrogenation. Based on numerical simulations, we determine the optimal investment conditions for the “CO2-to-methanol + EOR” collaborative scheme. Parameter sensitivity analyses further evaluate how key variables—carbon pricing, oil market dynamics, targeted subsidies, and the cost of renewable electricity—influence investment timing and feasibility. The results reveal that the following: (1) Carbon pricing plays a pivotal role in influencing investment decisions related to CCUS. A stable and sufficiently high carbon price improves the economic feasibility of CCUS projects. When the initial carbon price reaches 125 CNY/t or higher, refining–chemical integrated plants are incentivized to make immediate investments. (2) Increases in oil prices also encourage CCUS investment decisions by refining–chemical integrated plants, but the effect is weaker than that of carbon prices. The model reveals that when oil prices exceed USD 134 per barrel, the investment trigger is activated, leading to earlier project implementation. (3) EOR subsidy and the initial equipment investment subsidy can promote investment and bring forward the expected exercise time of the option. Immediate investment conditions will be triggered when EOR subsidy reaches CNY 75 per barrel or more, or the subsidy coefficient reaches 0.2 or higher. (4) The levelized cost of electricity (LCOE) from photovoltaic sources is identified as a key determinant of hydrogen production economics. A sustained decline in LCOE—from CNY 0.30/kWh to 0.22/kWh, and further to 0.12/kWh or below—significantly advances the optimal investment window. When LCOE reaches CNY 0.12/kWh, the project achieves economic viability, enabling investment potentially as early as 2025. This study provides guidance and reference cases for CCUS investment decisions integrating EOR and chemical utilization in China’s refining–chemical integrated plants.

1. Introduction

In 2023, global carbon emissions reached 37.4 billion tons, with China contributing a significant 12.604 billion tons, or 31.2% of the total. CCUS is a crucial method for significantly reducing carbon dioxide CO2 emissions. EOR using CO2 has been an innovative practice since the 1960s [1]. In 2005, the Intergovernmental Panel on Climate Change (IPCC) officially defined carbon capture and storage (CCS) as a vital process where CO2 is extracted from energy production and industrial activities, then transported to a designated site for permanent storage, keeping it safely out of the atmosphere [2]. With advancements in carbon dioxide utilization technologies, CCS has been integrated into energy processes in China, leading to the emergence of CCUS [3]. Utilization is an essential complement to CCS, enriching our approach to environmental sustainability. As of March 2024, there are impressive 844 CCS/CCUS projects worldwide. The United States is at the forefront with an incredible 293 projects, followed by the United Kingdom (92), Canada (74), and Australia (36). China ranks sixth with 30 projects [4]. CCUS is developing an integrated industrial chain that includes capture, transportation, storage, enhanced oil recovery, and resource utilization. The global CO2 mitigation capacity of CCUS is projected to reach 1.6 billion tons per year (tCO2/a) by 2030, approximately 4.0 billion tCO2/a by 2035, and 7.6 billion tCO2/a by 2050. By that time, it is expected that around 50% of fossil fuels will be used in combination with CCUS, enabling the capture of about 3.5 billion tCO2/a from fossil fuel sources [5]. By 2060, China is anticipated to achieve an annual CO2 reduction of roughly 1.0 billion tCO2/a through the deployment of CCUS [6].
The refining industry faces substantial pressure to decrease its emissions. Refineries are major sources of CO2, with processes like crude oil fractionation and cracking producing substantial greenhouse gas emissions [7]. From 2000 to 2021, emissions from China’s refineries surged from 102.2 million tons to 313.3 million tons, highlighting the urgent need for effective climate policies [8]. Industries with high emissions, such as coal power, cement, steel, and refining, are facing increasing pressure to reduce their carbon output. Achieving net-zero production emissions will be nearly impossible without advanced technologies like CCUS. The current methods for utilizing carbon dioxide include geological, chemical, physical, and biological approaches. EOR and Enhanced Gas Recovery (EGR) technologies significantly increase hydrocarbon recovery rates and provide substantial economic benefits while helping to reduce carbon emissions [9]. As an important C1 feedstock, CO2 can be widely used in urea synthesis, methanol synthesis, and other processes [10]. Converting CO2 and hydrogen into methanol is especially promising within the CCUS sector [11,12]. CO2-to-methanol conversion offers synergistic benefits: effective utilization of surplus renewable electricity, efficient transformation of electrical energy into storable chemical energy, concurrent carbon emission reduction, and enhanced liquid fuel security.
CCUS exhibits inherent compatibility with the petrochemical industry. The potential for utilization in the petrochemical industry is much greater than in the coal-fired power sector. In the coal-fired power industry, CCUS options are relatively limited, primarily relying on geological storage and EOR. The economic feasibility of these options is largely influenced by policy support and the revenue generated from EOR. EOR can significantly boost profits when oil prices are high. However, during periods of low oil prices or when low oil prices accompany high carbon prices, the potential returns from EOR projects decrease significantly. This decline in returns can discourage investment in such initiatives. In contrast, chemical utilization offers more stable economic growth opportunities. CCUS in the petrochemical industry offers a broader range of pathways, including methanol synthesis, urea production, fuel generation, cyclic carbonate and polycarbonate synthesis, and salicylic acid production. In addition to relying on policy incentives and EOR revenues, these industries can also earn extra income through product sales. This facilitates the development of market-driven carbon utilization chains and enhances their economic self-sufficiency. Despite its great potential, CCUS technologies face significant challenges, including low technology maturity, high costs, and long payback periods, which result in cautious investment. CCUS investment in the petrochemical industry is influenced by various uncertainties, so it is necessary to conduct a scientific analysis of CCUS investment decisions and put forward policies on this basis. The incentive strategy is critical for advancing the commercial deployment of CCUS. As shown in Table 1, among the various methanol production pathways, coal-based methanol currently exhibits the lowest production cost, typically ranging from CNY 1800 to 3300 per ton. However, this route is highly sensitive to coal price fluctuations and is associated with significant carbon emissions. With the increasing stringency of carbon pricing mechanisms, the cost advantage of coal-based methanol is expected to diminish. In the future, as coal prices continue to rise, its production cost is projected to exceed CNY 3000 per ton. Methanol derived from natural gas demonstrates a degree of economic competitiveness, yet it remains constrained by limited resource availability and pronounced price volatility. Electricity-based methanol, produced from CO2 and green hydrogen, is currently more costly, with estimated production costs ranging from CNY 4000 to 4600 per ton. Nonetheless, ongoing reductions in the cost of renewable electricity and carbon capture technologies, coupled with continuous process optimization, are expected to drive significant cost declines, potentially lowering production costs to CNY 2100–2200 per ton in the long term. This pathway is well aligned with carbon neutrality objectives and is projected to become a mainstream production option in the medium to long term. Biomass-based methanol currently incurs production costs of approximately CNY 3800 per ton. Despite this, it offers considerable potential for cost optimization and serves as a valuable supplementary option in regions with abundant biomass resources. In the long term, its production cost is projected to decline to around CNY 2300 per ton, or even as low as CNY 1900 per ton under favorable conditions. Overall, methanol produced from renewable sources is anticipated to reach cost parity with fossil-based methanol in the foreseeable future, thereby supporting the transition toward a low-carbon energy system.
The key contributions of this study are as follows: First, most prior research concentrates on the deployment of CCUS in the coal-fired power sector, primarily assessing the economic feasibility of retrofitting or constructing new units. In contrast, limited attention has been paid to its applications in the refining and petrochemical industries. This paper extends the scope of CCUS analysis by focusing on an integrated refining–chemical enterprise. Second, in contrast to conventional approaches that emphasize CO2 utilization via EOR alone, this study proposes a hybrid utilization pathway that integrates EOR with methanol synthesis. By embedding this dual-route within a CCUS business model, the analysis captures synergistic benefits arising from diversification and enhanced resource efficiency, thereby offering a more resilient and commercially viable CCUS strategy. Third, a real options framework is developed to model investment decisions under multiple interacting uncertainties, including carbon and oil price fluctuations, dynamic capital costs driven by technological learning curves, and variable revenues from both EOR and methanol production. The model is solved through dynamic programming and least squares Monte Carlo simulation. Sensitivity analyses are performed on oil prices, carbon prices, photovoltaic electricity costs, EOR subsidies, and initial equipment investment subsidies to quantify their impacts on investment thresholds and optimal timing. These findings provide a rigorous decision-support tool for CCUS deployment in the petrochemical sector and deliver policy-relevant insights to inform the design of carbon pricing mechanisms and investment incentives.
The remainder of this paper is organized as follows: Section 2 presents a literature review on the application of real options theory in the CCUS field. Section 3 describes the problem and outlines the theoretical assumptions. Section 4 focuses on solving the model, while Section 5 contains a case study analysis. Finally, Section 6 concludes the study.

2. Literature Review

Research on CCS investments has increasingly shifted towards CCUS, with analytical methods moving from Net Present Value (NPV) to the more flexible real options method. Scholars worldwide have extensively examined the economic viability of CCS investments, particularly through techno-economic analyses. NPV models have evaluated the influence of carbon prices on CCS investments in power plants. In China, the critical carbon prices for CCS investments were estimated at USD 61 per ton for coal-fired plants, and USD 72 per ton for integrated gasification combined cycle (IGCC) plants [14]. Research showed that pulverized coal (PC) technology was the most cost-effective without carbon constraints, while IGCC is more advantageous under stringent regulations [15]. Further analysis indicates that pre-investments had limited impact on IGCC costs and that IGCC could achieve significant emissions reductions under moderate carbon prices [16]. Rubin et al. (2007) [17] highlighted the rising costs of CCS due to increased capital and operational expenses and stressed the need to assess environmental impacts. Zhai et al. (2015) [18] found that CCUS retrofits in U.S. coal-fired units could reduce CO2 emissions by 30%. Liang et al. (2009) [19] identified factors such as investment type and carbon prices that influence the feasibility of CO2 Capture Ready (CCR) investments in Guangdong, China. Dahowski et al. (2012) [20] showed that over 80% of major emission sources in China could be sequestered at a cost below CNY 70 per ton. It is important to note that NPV was a static tool that cannot adequately capture the variability and uncertainties associated with CCUS projects [21]. Consequently, it had significant limitations in investment evaluation, was ineffective in optimizing investment timing, and could not account for optimal timing or project uncertainties [22].
In contrast, the real options approach employed dynamic stochastic modeling to quantitatively incorporate managerial flexibility, significantly improving both asset valuation precision and risk mitigation capacity. Myers (1977) [23] introduced real options as a way to integrate financial options theory into investment decision-making, highlighting project uncertainty and managerial flexibility. Fuss et al. (2010) [24] modeled technological progress in CCS as a Poisson process and analyzed how uncertainties in technology and fuel prices affect CCS investment strategies. Compared to traditional discounted cash flow (DCF) methods, the real options approach was more effective in evaluating uncertain investments [25]. Real options pricing included discrete-time models, like tree-based methods, and continuous-time models, such as Monte Carlo simulations [26]. For instance, Zhang et al. (2021) [27] used a binomial tree to assess policy incentives for CCUS investment in China while accounting for uncertainties like carbon prices and technological progress. Trinomial trees and quadrinomial trees further expanded these models, allowing for additional scenarios, such as stable carbon prices. Fan et al. (2023) [28] combined a CCUS source-sink matching model with a trinomial tree to determine the critical carbon price for CCUS investment in China. Li et al. (2024) [29] applied a real options trinomial tree model for coal-to-hydrogen investments, identifying a critical carbon price of CNY 353.3 per ton and highlighting optimal regions for “blue hydrogen” production. Wang and Du (2015) [30] created a quadrinomial tree model for CCUS investments in coal-fired power plants, focusing on carbon trading and fuel prices. While multi-tree models faced challenges in capturing continuous carbon price fluctuations, Monte Carlo simulations generated multiple scenarios to more accurately assess investment values and timing. Research by Geske et al. (2010) [31] found that government carbon regulations push firms to monitor carbon prices, while technological innovation reduced profitability risks. Zhu and Fan (2011) [32] integrated real options and Monte Carlo simulations to evaluate CCS investment in China and found that climate policies greatly influenced CCS adoption. In further studies, they and others analyzed external and internal uncertainties affecting the feasibility of CCS retrofitting in power plants [33]. Chen et al. (2016) [34] created a model to analyze investment decisions under uncertainty, using Monte Carlo simulation to study how power generation subsidies affect CCS retrofitting in Chinese coal-fired power plants. Chu et al. (2016) [35] examined the influence of carbon prices, cost reductions, and subsidies on power plant investments, finding that carbon price fluctuations significantly affect investment timing. Yao et al. (2019) [36] concluded that although Coal-to-Liquids with Carbon Capture and Storage (CTL-CCS) projects are currently unviable, delayed investments may hold value under high carbon prices or supportive policies.
In addition, recent research on CCUS has increasingly focused on its business models and investment decision-making. CCUS business models primarily consisted of several operational modes, including state-owned enterprise operation, joint operation, independent transporter, and operator modes. These models could be fully funded and managed by a single entity, or a project company can be established for joint financing and collaboration among multiple stakeholders. Currently, the investment in China’s pilot demonstration projects mainly comes from key state-owned enterprises, particularly in the oil, gas, and electric power sectors. Yao et al. (2018) [37] identified four CCUS business models and found that the vertically integrated model is suitable for China’s early demonstration phase, recommending storage subsidies and stable carbon pricing to support large-scale deployment. Jarvis and Samsatli (2018) [38] assessed performance metrics of CO2 conversion technologies, while Mikhelkis and Govindarajan (2020) [39] compared CCS and CCU investments at Exergi’s waste-to-energy plant, showing that a combined CCS-CCU approach has greater investment potential. Wang (2023) [40] used a system dynamics approach to determine that the vertically integrated model is most viable for coal-fired plants.
While research predominantly targets the coal power sector, the petrochemical industry, especially refineries, has received less attention. Refineries generated significant carbon emissions that could be used in carbon trading systems and as feedstocks for chemical processes. On the basis of previous studies, this paper establishes a project-level techno-economic evaluation model based on real option theory. The aim of this research is to address a gap in the academic literature and to guide investors in the petrochemical industry on how to apply the real options approach. This approach is intended to enhance the scientific rigor of investment decisions and to increase the flexibility value of management.

3. Problem Formulation and Model Establishment

3.1. Description of Issue

This study focuses on a refining–chemical integrated plant (RCIP) as the primary case study (Figure 1). China’s national carbon market currently includes key sectors such as power generation, steel, cement, and aluminum, and is rapidly expanding to the petrochemical and chemical industries. Based on this trend, this study assumes that the RCIP participates in the national carbon trading scheme. An integrated CCUS business model is adopted. The system encompasses catalytic and steam cracking (as the main CO2 sources), CO2 capture and transport, and subsequent utilization via two pathways: methanol synthesis and enhanced oil recovery. The steam cracker of refinery generates high-concentration, low-cost CO2 suitable for chemical conversion. CO2 is captured at the flue gas outlet using dedicated equipment, then purified, liquefied, and stored in on-site tanks. (1) Methanol Synthesis: The process consists of hydrogen production, CO2 purification, catalytic methanol synthesis, and distillation. Hydrogen is generated via water electrolysis powered by local solar energy. Sixty percent of the captured CO2 (150,000 t/a) is purified and hydrogenated under optimized temperature and pressure conditions. The methanol production system includes synthesis reactors (100,000 t/a), distillation columns, and compressors. Crude methanol is first synthesized and then refined through distillation to obtain high-purity methanol. The project achieves an annual methanol output of 110,080 tons. (2) EOR: The remaining 40% of CO2 (100,000 t/a) is transported via tank trucks to nearby oilfields (within 100 km) for injection into reservoirs, increasing crude oil output. This integrated approach leverages upstream–downstream synergies to create a closed-loop carbon utilization system. It maximizes the use of point-source CO2 emissions and enhances resource value through both EOR and chemical conversion.

3.2. Theoretical Assumptions

3.2.1. Carbon Price

Assuming that the carbon emission allowance price, hereinafter referred to as the carbon price, Pc(t) follows a geometric Brownian motion, it satisfies the following equation:
d P c ( t ) = μ c P c ( t ) dt + σ c P c ( t ) dz
where μc represents the expected growth rate of the carbon price, σc denotes the volatility of the carbon price, and dz is a standard Wiener process that follows a standard normal distribution. Based on the average monthly carbon price data, we have the following:
r t = P c ( t + 1 ) P c ( t ) ,   ( t = 1 ,   2   ,   n )
Let Pc(t+1) and Pc(t) represent the average carbon prices in months t + 1 and t, and rt represents the monthly growth factor of the carbon price. The parameters μc and σc can be estimated using the following equation:
& r ¯ = 1 n t = 1 n r t 1 & S 2 = 1 n 1 t = 1 n r t 1 2 n r ¯ & r ¯ = μ month Δ t & S 2 = σ 2 month Δ t μ month = & r ¯ / Δ t σ 2 month = & S 2 / Δ t μ c = 12 μ month σ c = σ month 12
Denote (rt − 1) as the simple monthly return for month t,   & r ¯ as the sample mean of these n simple monthly returns, and S2 as the sample variance of these n simple monthly returns. The time interval for the monthly statistics is represented by Δt, where Δt = 1 corresponds to one month. Let μmonth represent the expected monthly simple return (estimated by & r ¯ when Δt = 1). Its standard deviation, σmonth, is given by the square root of the variance of monthly simple returns. Finally, μc and σc denote the estimated annualized expected growth rate and annualized volatility, respectively, derived from these monthly statistics.

3.2.2. Oil Price

Suppose the crude oil price Pc(t+1) follows a geometric Brownian motion, it satisfies the following equation:
d p oil ( t ) = μ oil p oil ( t ) dt + σ oil p oil ( t ) dz
where μoil represents the expected growth rate of the oil price, σoil denotes the volatility of oil prices, and dz refers to a standard Wiener process that follows a standard normal distribution. The calculation methods for μoil and σoil are similar to those for μc and σc, so further details will not be provided here.

3.2.3. Equipment Investment and Operating Costs

Assuming that CCUS equipment investment is a one-time expense, the retrofit cost is denoted by I, with an initial value of IC,0. The variable Y denotes the operating cost, with YC,0 as its initial value. As technological progress continues, both the investment and operating costs decrease over time, following the learning curve effect. The costs associated with CCUS equipment investment and operation follow the equations below:
I = I C , 0 × * e it
Y = Y C , 0 × e lt
The variable i represents the effect of technological advancements on equipment retrofit costs, and l indicates the influence of technological progress on operating costs after retrofitting.

3.2.4. Assumptions on Project Lifespan and Investment Period

The project period, also known as the option validity period, T is defined as the timeframe within which the RCIP must make an investment decision. The construction period is expected to last two years, and the operational lifespan of the facility after completion is specified as TL.

3.3. Model Framework

3.3.1. Investment Return Model

Based on the analysis of the above indicators and the model assumptions, the additional annual revenue CIt generated by the CCUS project can be expressed as follows:
C I t = C I t C + C I t O + C I t M
Define C I t C as the revenue generated from carbon emission trading as a result of carbon reduction efforts. Therefore
C I t C = p c ( t ) × q c × w 1
The term C I t O represents the incremental crude oil revenue resulting from EOR. Thus
C I t O = p oil ( t ) × q c × w 1 × w 2 × α + q c × w 1 × w 2 × p y × α
where poil denotes the crude oil price; qc refers to the carbon dioxide reduction (the amount of carbon dioxide captured); w1, w2 represent the carbon capture rate and the proportion of captured CO2 used for EOR, respectively; and α indicates the oil displacement efficiency. Here, poil(t) * × qc × w1 × w2 × α refers to the revenue generated from oil displacement, while pc(t) represents the price of carbon emission allowances. Additionally, pc(t) × qc × w1 denotes the revenue from reducing CO2 emissions. The variable qc × w1 × w2 × py × α indicates the government subsidy for EOR. py represents the unit incremental subsidy for EOR.
C I t M denotes revenue from the synthetic methanol module:
C I t M = q M × p M
Here, qM denotes the volume of methanol production, pM refers to the market unit price of methanol, and qM × pM reflects the revenue generated from the chemical utilization of methanol production.
The additional annual cash outflow, COt, can be expressed as follows:
C O t = C O t O + C O t H + C O t M
Let C O t O refer to the cost of the EOR module, C O t H to the cost of the hydrogen production module, and C O t M to the cost of the synthetic methanol module. Then
C O t O = q c × w 1 × u c + q c × w 1 × u t × S + q c × w 1 × w 2 × u E + Y C , t
Here, uc denotes the unit capture cost, and qc × w1 × uc indicates the total capture cost. ut refers to the unit transportation cost. S indicates the transportation distance from the RCIP to the oil field; qc × w1 × ut × S captures the total transportation cost. uE signifies the unit oil displacement cost, and qc × w1 × w2 × uE corresponds to the total oil displacement cost. Finally, YC,t denotes the operational cost of the capture device, taking into account the learning curve effect.
C O t H = q H × u H + Y H + W H
where qH refers to the amount of hydrogen consumed for methanol production, uH refers to the unit hydro-power cost for hydrogen production, and qH × uH denotes the total cost of the hydrogen production process. YH indicates the operational and maintenance costs associated with the hydrogen production unit. WH signifies the employee welfare expenses related to the hydrogen production unit.
C O t M = U M + q M × u t M + Y M + W M
In this context, UM represents the hydroelectric cost associated with methanol production, while qM denotes the amount of methanol output. Additionally, u t M refers to the unit transportation cost for selling methanol. The term qM × u t M indicates the total transportation costs incurred for the sales of methanol products. YM encompasses both the operational and maintenance costs of the methanol production facility, as well as the hydroelectric expenses. Lastly, WM represents the employee welfare costs related to the methanol synthesis unit.
Thus, the net annual cash flow NCFt generated from investing in the CCUS project can be expressed as follows:
NCF t = C I t C O t
Using the discounted cash flow formula with continuous compounding interest, if e r = 1 + r is provided, the NPV of the CCUS project at time t can be expressed as follows:
NPV = i = t T NCF t × e ( i t ) r ( 1 θ ) I C , t I M I H
Let θ represent the government subsidy coefficient for the RCIP’s investment in CCUS, which primarily covers the costs associated with modifying equipment. (1 − θ)IC,t refers to the investment required for the RCIP’s equipment modifications at a specific time t. Let r denote the risk-free rate. Define IM as the investment amount allocated to methanol production facilities, and IH as the investment amount associated with hydrogen production infrastructure.
The value of the investment decision made by the investor at any given time should reflect the expected value of the project under various uncertain conditions. Therefore, the investment value Vt of the project in year t can be expressed as follows:
V t = E i = t T NCF t × e ( i t ) r ( 1 θ ) I C , t I M I H

3.3.2. Investment Decision Model

The decision to invest in CCUS can be likened to a time-continuous American call option. This means that investors have the flexibility to defer their investment for an indefinite period, depending on prevailing conditions. In this context, we denote the investment decision variable as χ k :
χ k = 1 , make   the   investment   in   year   k 0 , defer   the   investment   in   year   k
An investor has the option to invest now or postpone their decision by comparing the present value of an immediate investment with the expected future value of the project. Assuming rational behavior, the investor will choose to invest when the project’s investment value is at its highest. The specific form should be the following:
F = max 1 t T max ( V t , 0 ) × e rt
where F denotes the maximum investment value of the project.

4. Model Solution

4.1. Solution Method

This study utilizes the least squares Monte Carlo (LSM) simulation method, which combines Monte Carlo simulation, least squares regression, and dynamic programming. LSM is particularly effective for determining continuous values and optimal investment timing, showcasing high accuracy and efficiency, especially in the pricing of American options. By solving recursively in a backward manner, LSM effectively identifies the optimal exercise boundary, making it a powerful tool for pricing financial derivatives.

4.2. Solution Process

Based on the basic approach previously outlined for the LSM method, the steps of the algorithm for the entire model are as follows:
Simulate the path of the carbon price Pc(t) by dividing the option’s maturity period T into N − 1 investment intervals. Including the initial investment point, there are N investment points to consider, with each interval having a length of Δ t = T N .
The carbon price follows a geometric Brownian motion, as described in Equation (1). To better capture its trajectory, Ito’s Lemma is applied to transform the equation. We start by defining a smooth function that closely approximates the geometric Brownian motion.
f ( P c ( t ) , t ) = ln ( P c ( t ) , t )
By applying the chain rule of Ito’s Lemma, the following expression can be derived:
df = f P c ( t ) d P c ( t ) + f t dt + 1 2 2 f P c ( t ) 2 d 2 P c ( t )
Using the expression of function f ( P c ( t ) , t ) , the solution is derived as follows:
f P c t = 1 P c t f t = 0 2 f P c t 2 = 1 P c t 2
Substituting into Equation (1) and performing the integration, the following result is obtained:
P c ( t + Δ t ) = P c ( t ) exp ( μ c σ c 2 2 ) Δ t + σ c z Δ t
In the subsequent steps of the solution process, σc and μc are constant. Therefore, for any given time t, the following holds:
P c ( t ) = P c ( 0 ) exp ( u c σ c 2 2 ) Δ t + σ c z t
Since Vt is a function of Pc(t), the corresponding path for Vt can be obtained based on the simulated carbon and oil price paths.
Simulate multiple investment value paths based on the volatility of carbon and oil prices. For each path j, it is necessary to iterate backward from the end investment time point (excluding the terminal node) to the starting investment time point. At each step, the expected return from delaying the investment is compared to the return from making an immediate investment, and the decision information, along with the maximized investment value, is updated. Thus, for path j, we have the following:
F t , j = max 1 t T V t , j , E t ( F t + 1 , j ) × e r
Define Ft,j as the maximum investment value achieved along the path after the iteration process; Vt,j indicates the current investment value of the project at a specific point on path j and E t ( F t + 1 , j ) × e r refers to the expected value of continuing to hold the investment opportunity, which is calculated using a basis function fitted through least squares after the decision is made to delay investment at the current time point.
At this stage, the decision variable χ j , t at time t on the corresponding path j can be expressed as follows:
χ j , t = 1 , V t , j > E t ( F t + 1 , j ) × e r 0 , V t , j < E t ( F t + 1 , j ) × e r
The variable Q denotes the total number of paths. Repeat the previous steps for all paths to identify the optimal investment time point and the corresponding maximum investment value for each path. Let tmax,j represent the optimal investment time point on path j. The final optimal investment time point tmax should be the mode of the set {tmax,j}. The maximum investment value Fmax of the project is the average investment value at time tmax across all Q paths. The specific formulation is as follows:
t max = inf { t | χ j , t = 1 } , t [ 1 , T ] F max = E ( j = 1 Q F t max , j * e r * t max ) , j [ 1 , Q ]

5. Case Analysis

5.1. Model Parameters

Using the parameters and their specified values listed in Table 2, the model is calculated to identify the optimal timing for investment and the associated investment value under the given conditions. Following this, a sensitivity analysis is conducted on the key parameters.

5.2. Calculation Results

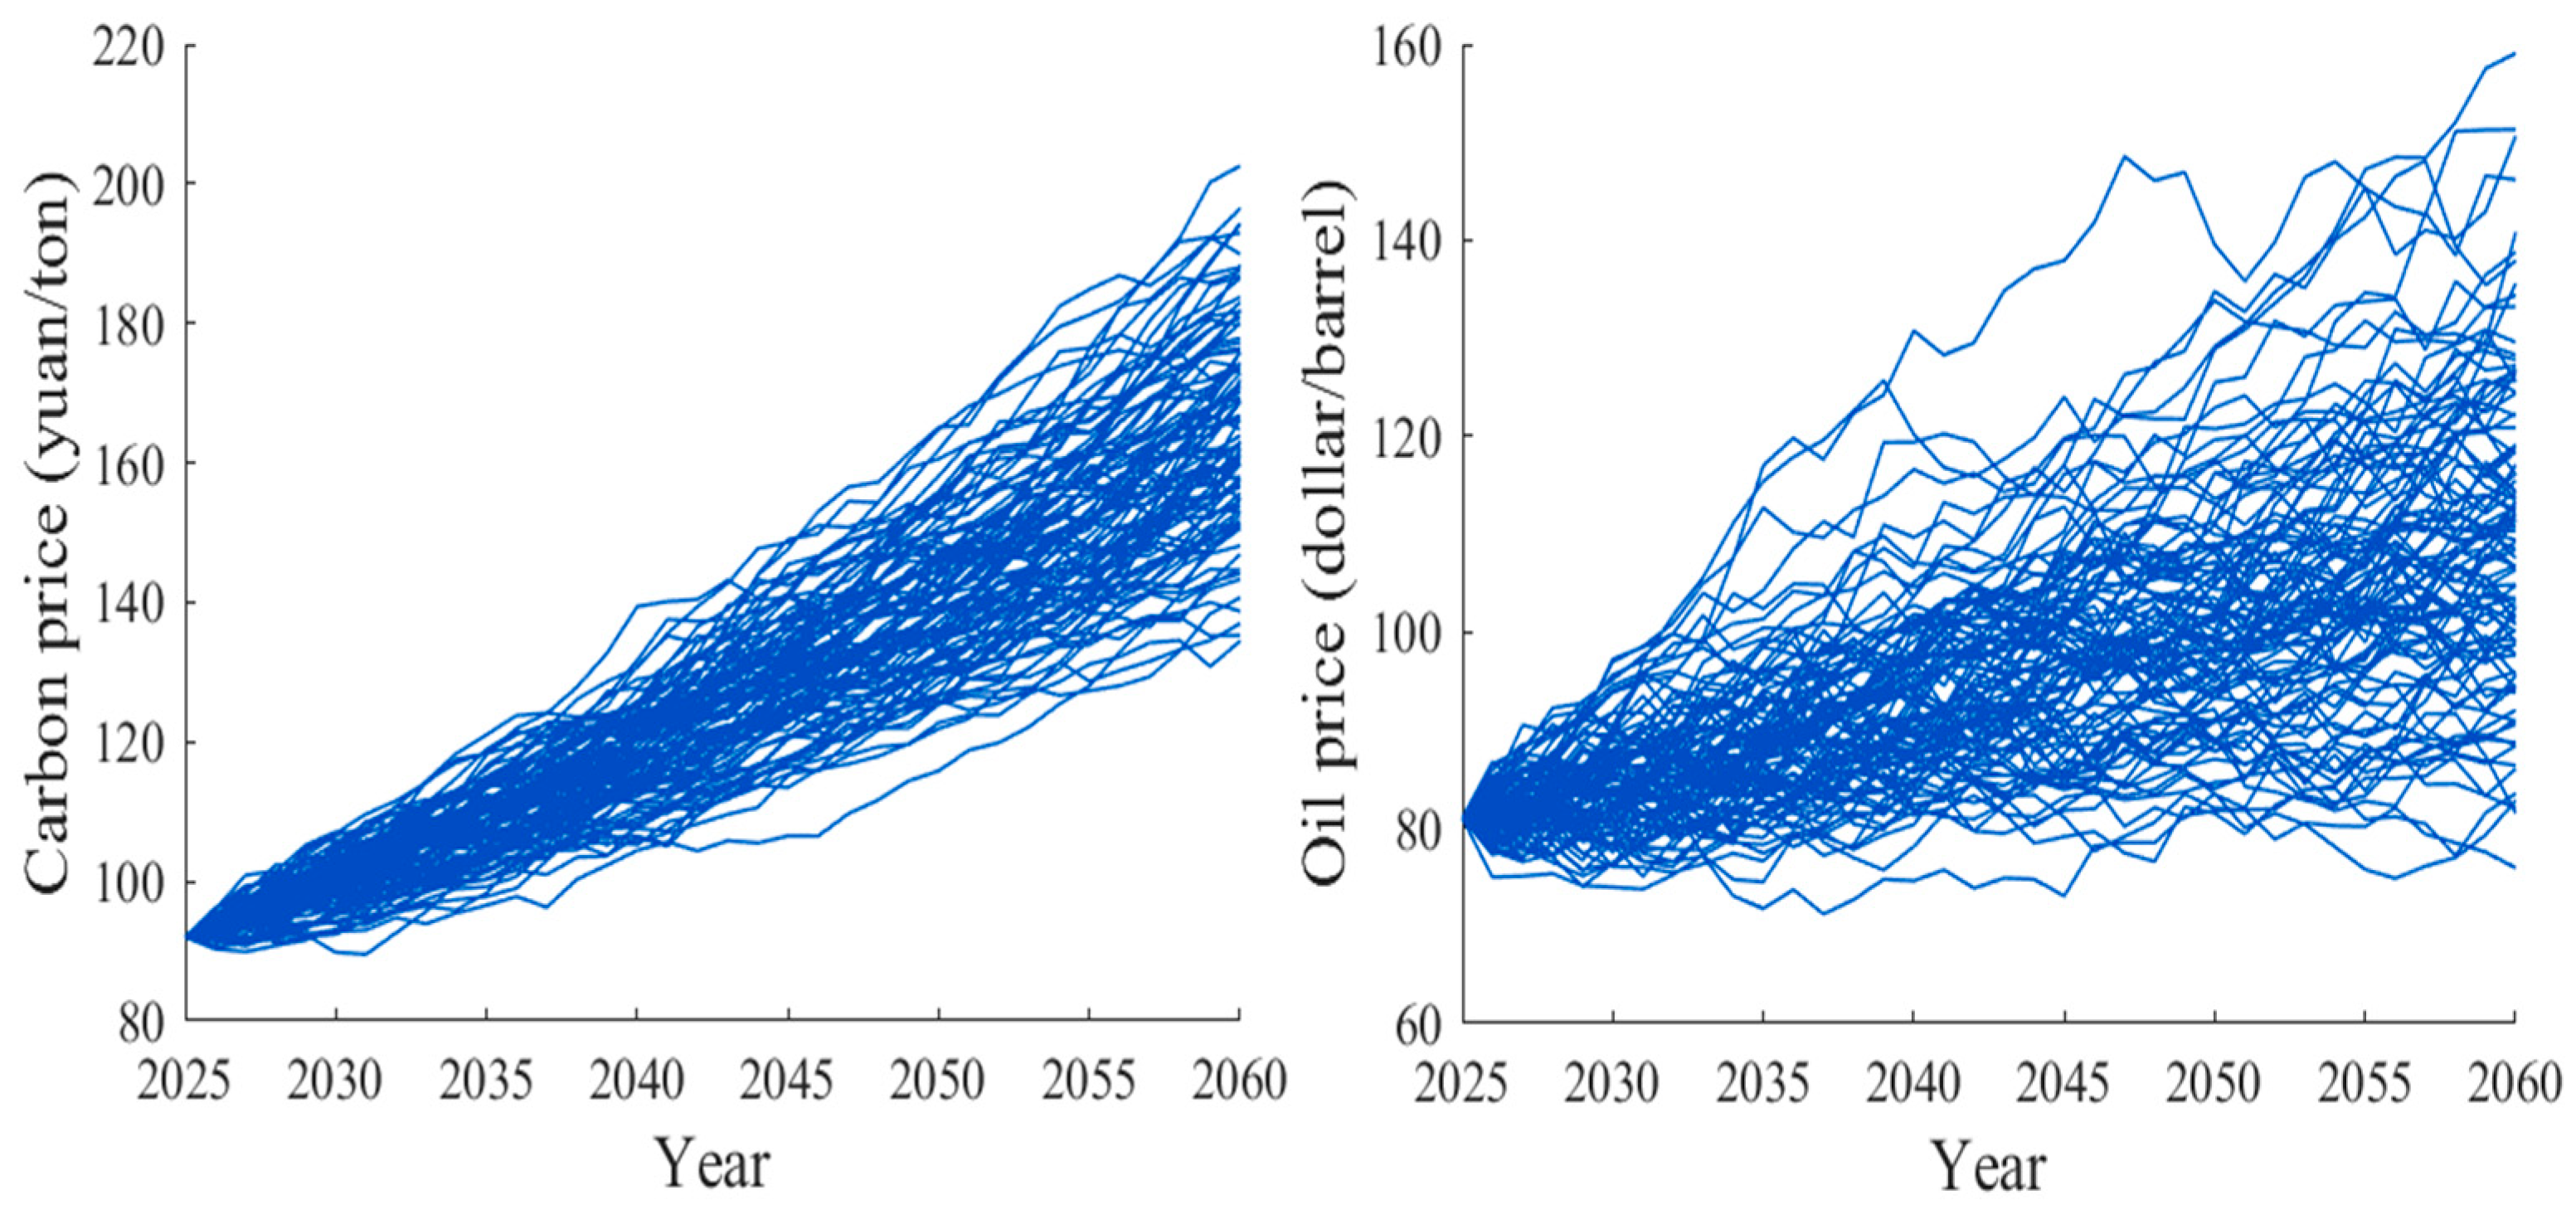
Figure 2 showcases 100 sample paths, which are selected from 1,000,000 simulated paths generated using Matlab(R2021b). Each sample path is represented by a line in a different color, illustrating the potential variations in carbon and oil prices over time. The carbon price demonstrates a general upward trend as time progresses, while the oil price displays a range of patterns, including increases, decreases, and periods of stability.
The ideal timing for investing in CCUS projects is determined by specific parameters. Across all simulated scenarios, the most favorable time for investment is consistently identified as the year 2033, with a probability approaching 100%. Therefore, this study concludes that 2033 is the optimal year for making investments in the entire project. In a delayed investment scenario, the year represents the point at which the maximum investment value can be achieved.
E ( N P V i ) = 20520000 y u a n   ( i = 1 , 2 , 3 1000000 )
When the investment project’s option value is not considered, and the traditional NPV method is applied, the value of investing immediately in the project in 2025 is calculated as follows:
E ( N P V j ) = 7162100 y u a n   ( j = 1 , 2 , 3 1000000 )
The calculations indicate that the additional profit from delaying the investment in the project amounts to CNY 13.3579 million when considering the option value. The decision to postpone the investment is primarily influenced by four factors: carbon price, oil price, initial investment costs, and operating costs.
When the investment is delayed, the stable additional return from postponing it for one year arises from reductions in initial investment costs and operating expenses, referred to as A. Conversely, the risk associated with delaying the investment primarily stems from the missed profits that could have been gained from carbon dioxide capture and utilization, labeled as B.
If A exceeds B, it implies that the stable additional return from delaying the investment is greater than the opportunity loss incurred by not investing and missing out on the benefits of carbon dioxide capture and utilization. In this scenario, delaying the investment is more profitable than proceeding with it immediately.
The optimal time to invest is identified when the cumulative difference between A and B reaches its maximum. Beyond this point, the annual return from reductions in initial investment costs and operating expenses will consistently be lower than the additional profits generated by carbon dioxide capture and utilization activities.
To ensure the reliability of the LSM model, this paper evaluates its effectiveness through a convergence test. By setting different numbers of simulation paths (10,000; 100,000; 500,000; 1,000,000), the stability of two key indicators, the optimal investment time and the maximum investment value, was tested. The results show that the optimal investment time is stable in the eighth year under each simulation path, and the relative difference in the maximum investment value is less than 0.01% under 500,000 and 1,000,000 paths. This shows that the 1,000,000 simulation paths used in this study can ensure the convergence of the results.

5.3. Sensitivity Analysis

5.3.1. Sensitivity of Carbon Price

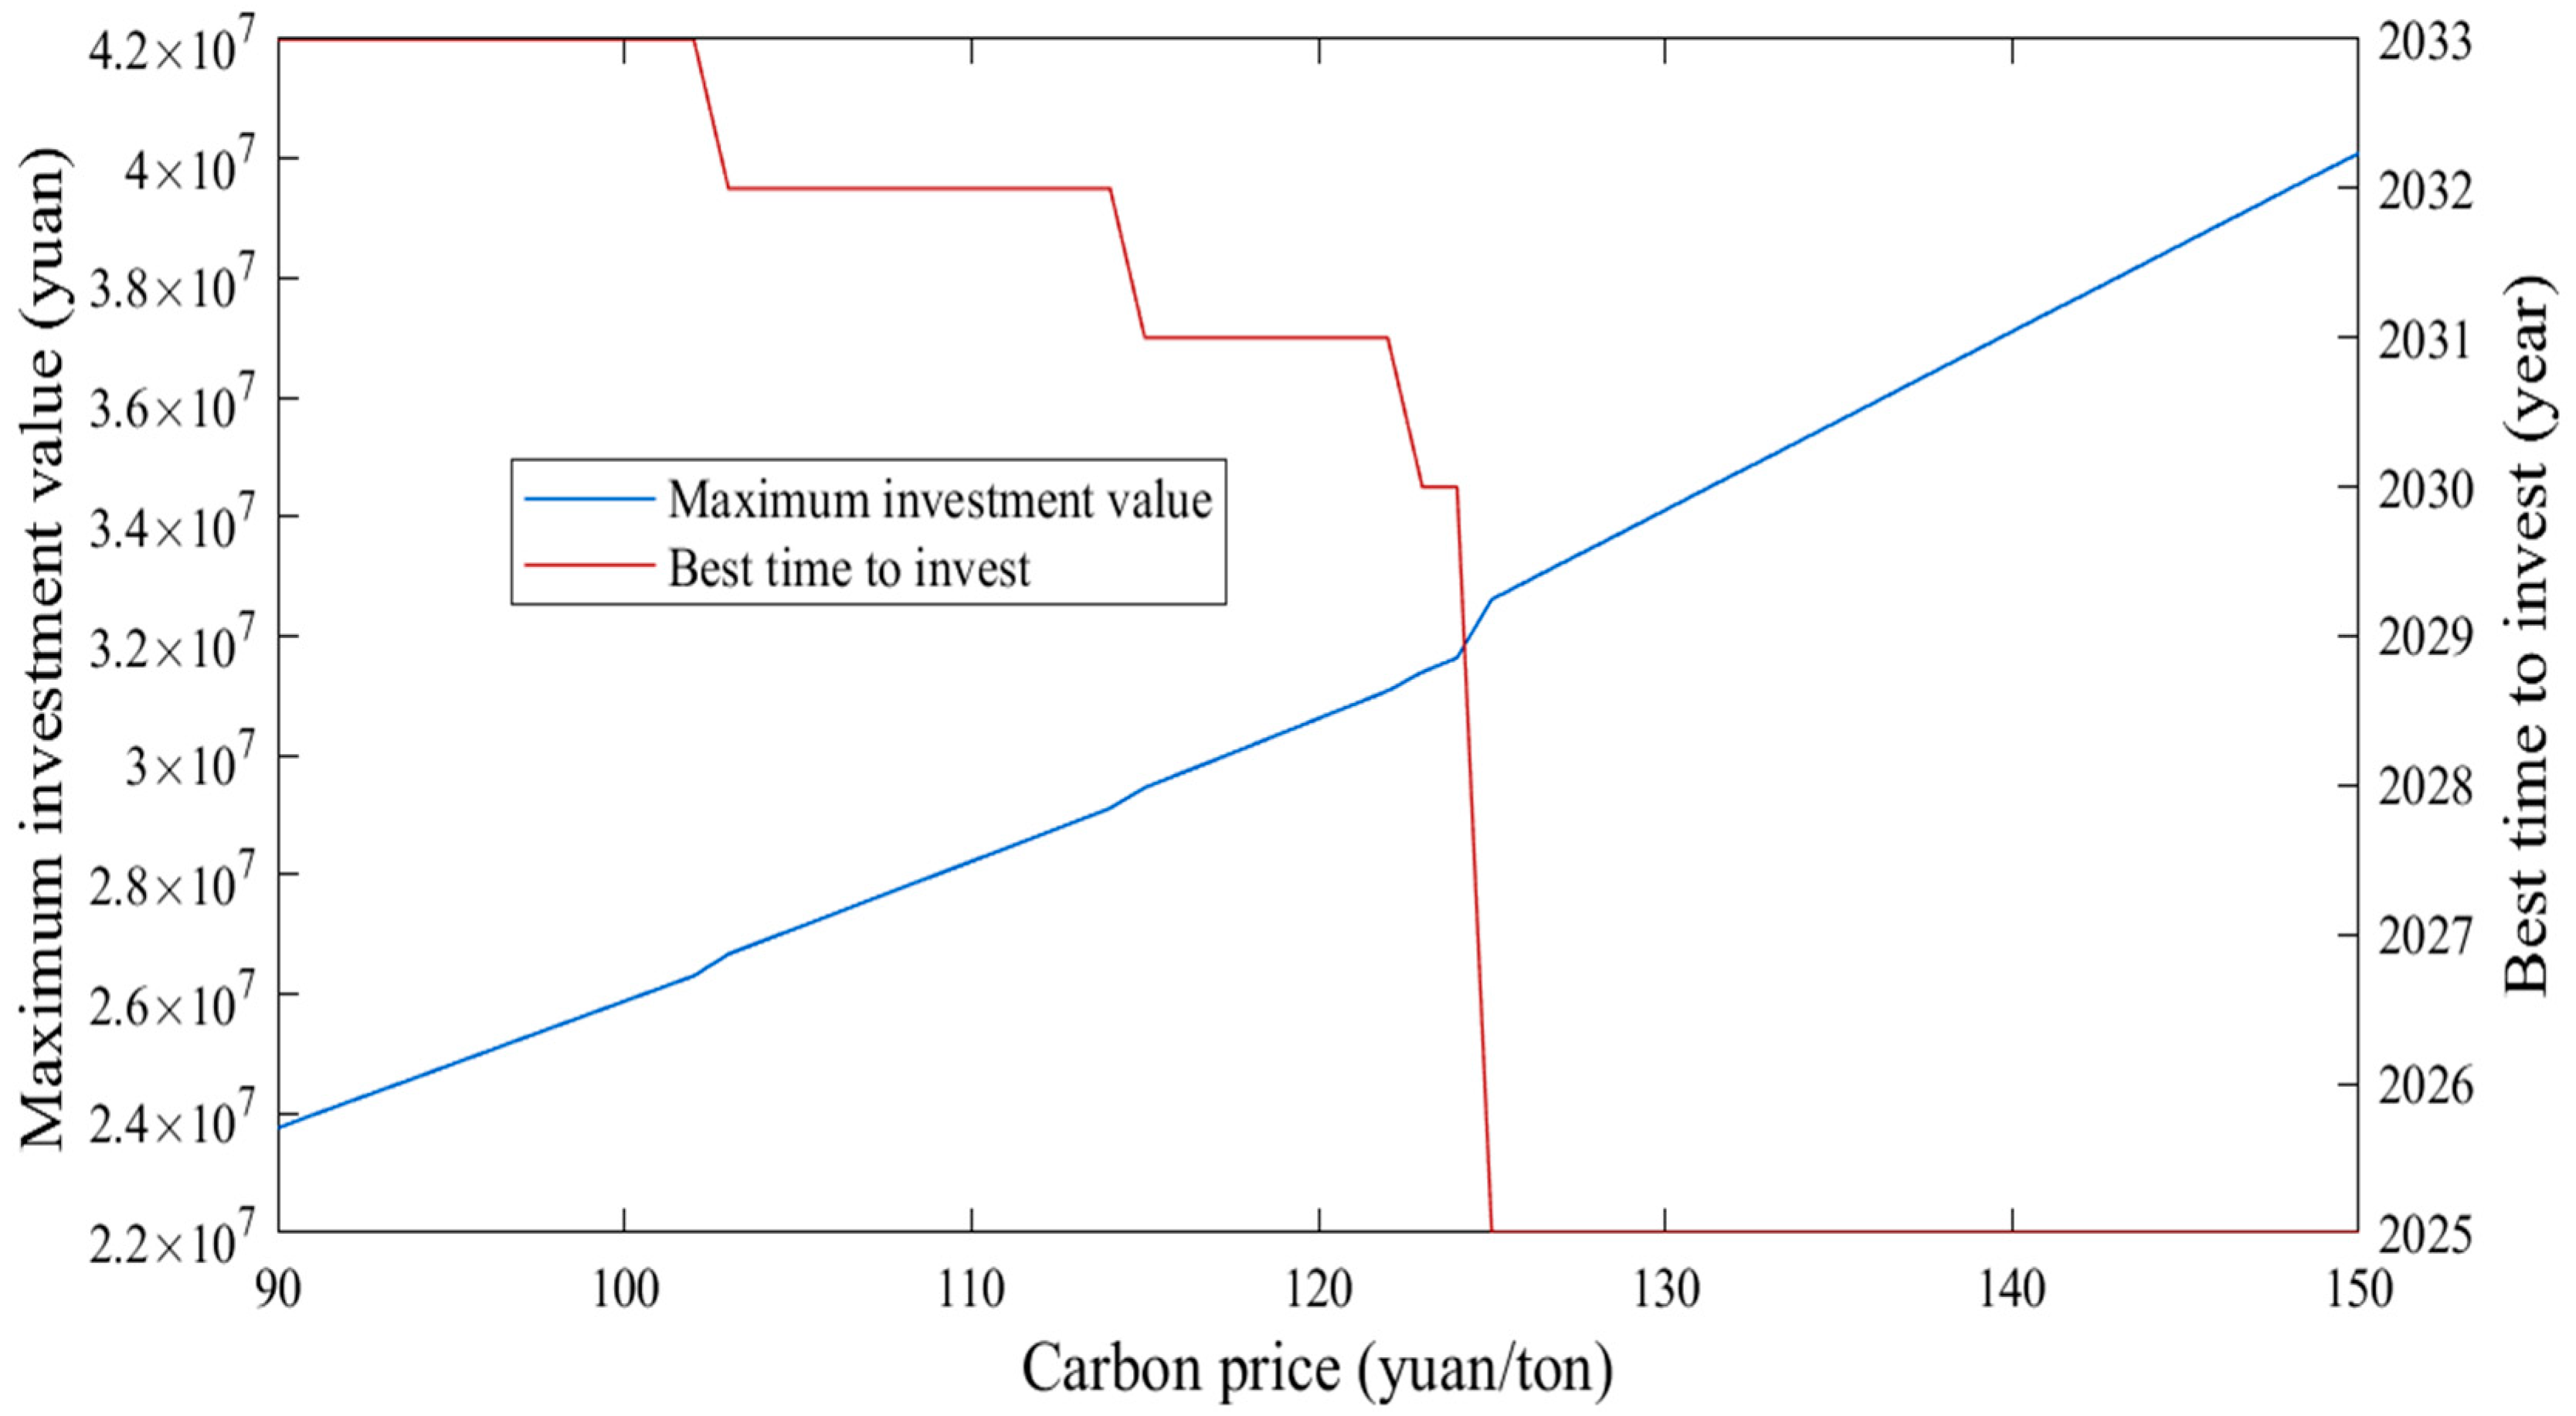
Figure 3 presents the relationship between initial carbon price levels and project investment decisions, assuming ceteris paribus. A strong correlation exists between carbon pricing and investment decision-making for the project. Three critical carbon price thresholds are identified: at 103, 115, and 123 CNY/ton, the optimal investment timing is to advance progressively from 2033 to 2032, 2031, and 2030, respectively. As the carbon price rises to CNY 125 per ton or higher, it triggers the conditions for immediate investment, allowing the investor to proceed. Consequently, targeted policy incentives should be implemented to stimulate near-term investment decisions at prevailing carbon price levels.

5.3.2. Sensitivity of Carbon Price Volatility

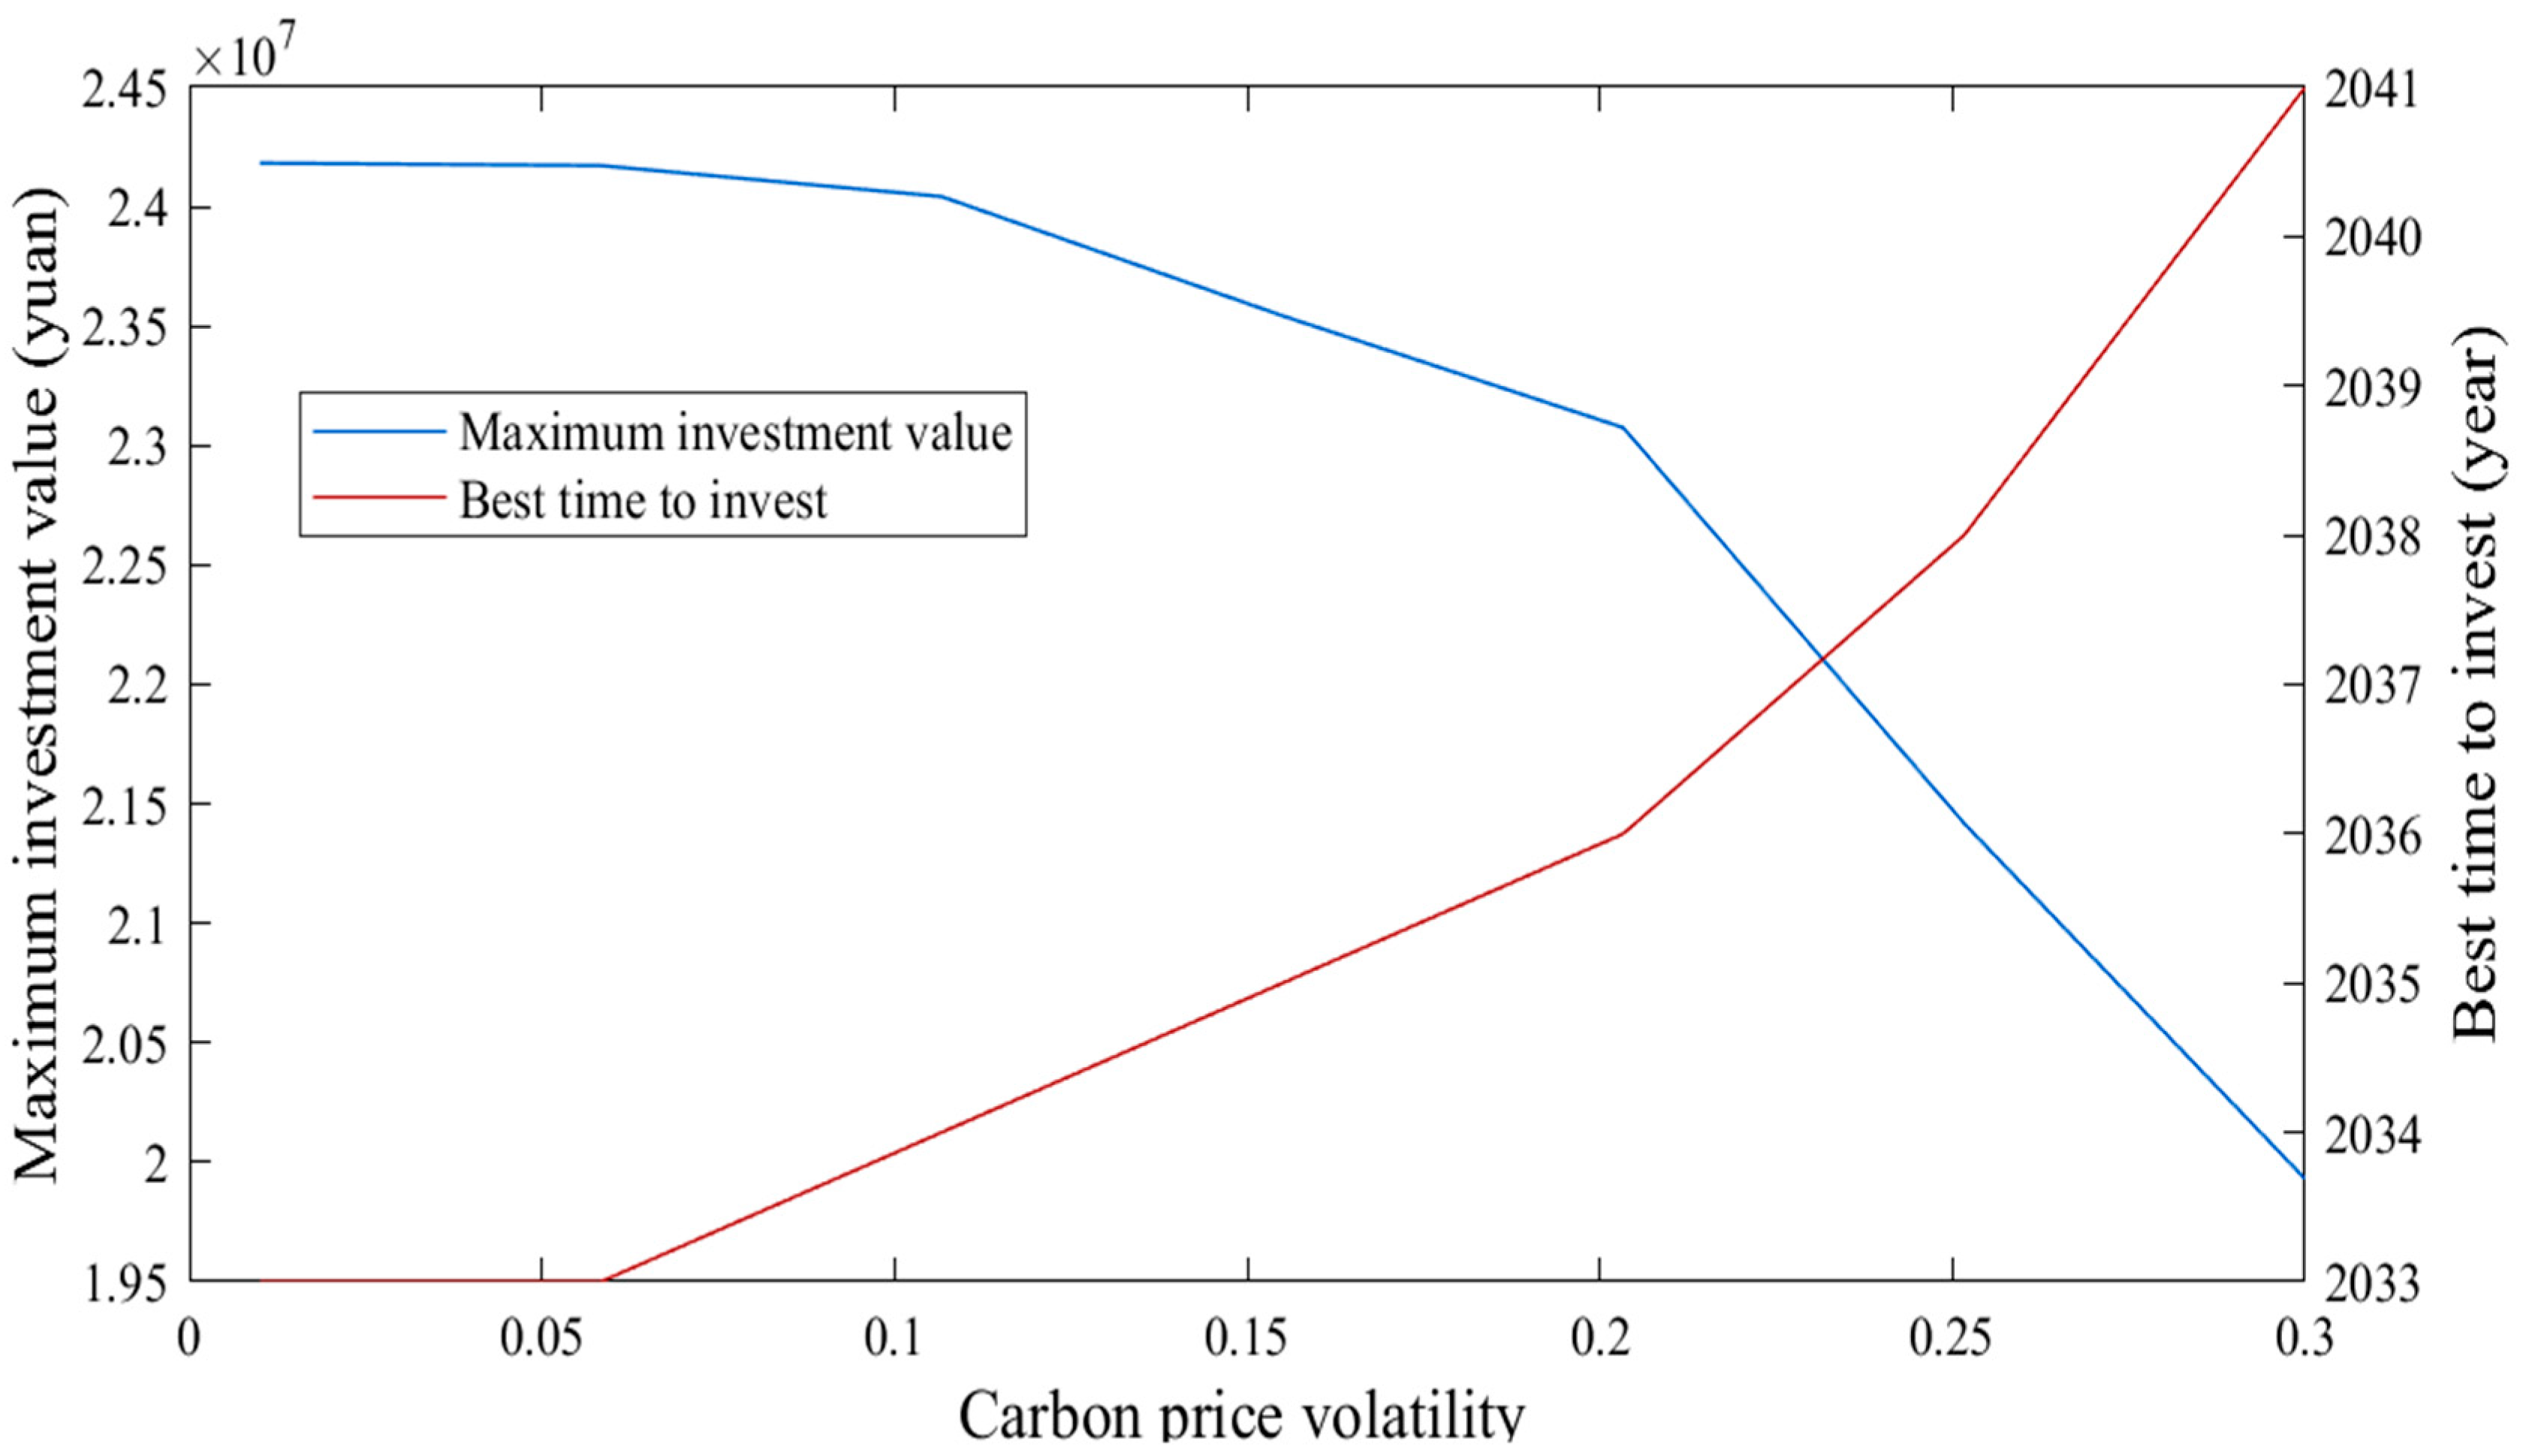
Figure 4 illustrates the investment decisions for the project under varying levels of carbon price volatility, while keeping other conditions constant. It is evident that when the carbon price volatility is approximately 0.058, the optimal time for investment is projected to be in 2033. As the carbon price volatility increases to 0.2, the optimal investment time is delayed until 2036, and the maximum investment value declines. When carbon price volatility exceeds 0.25, the optimal time for investment is further postponed to 2039, and the decrease in the maximum investment value becomes more significant. This suggests that more stable carbon price volatility can enhance investment in the project, resulting in higher returns.

5.3.3. Sensitivity of Oil Price Levels

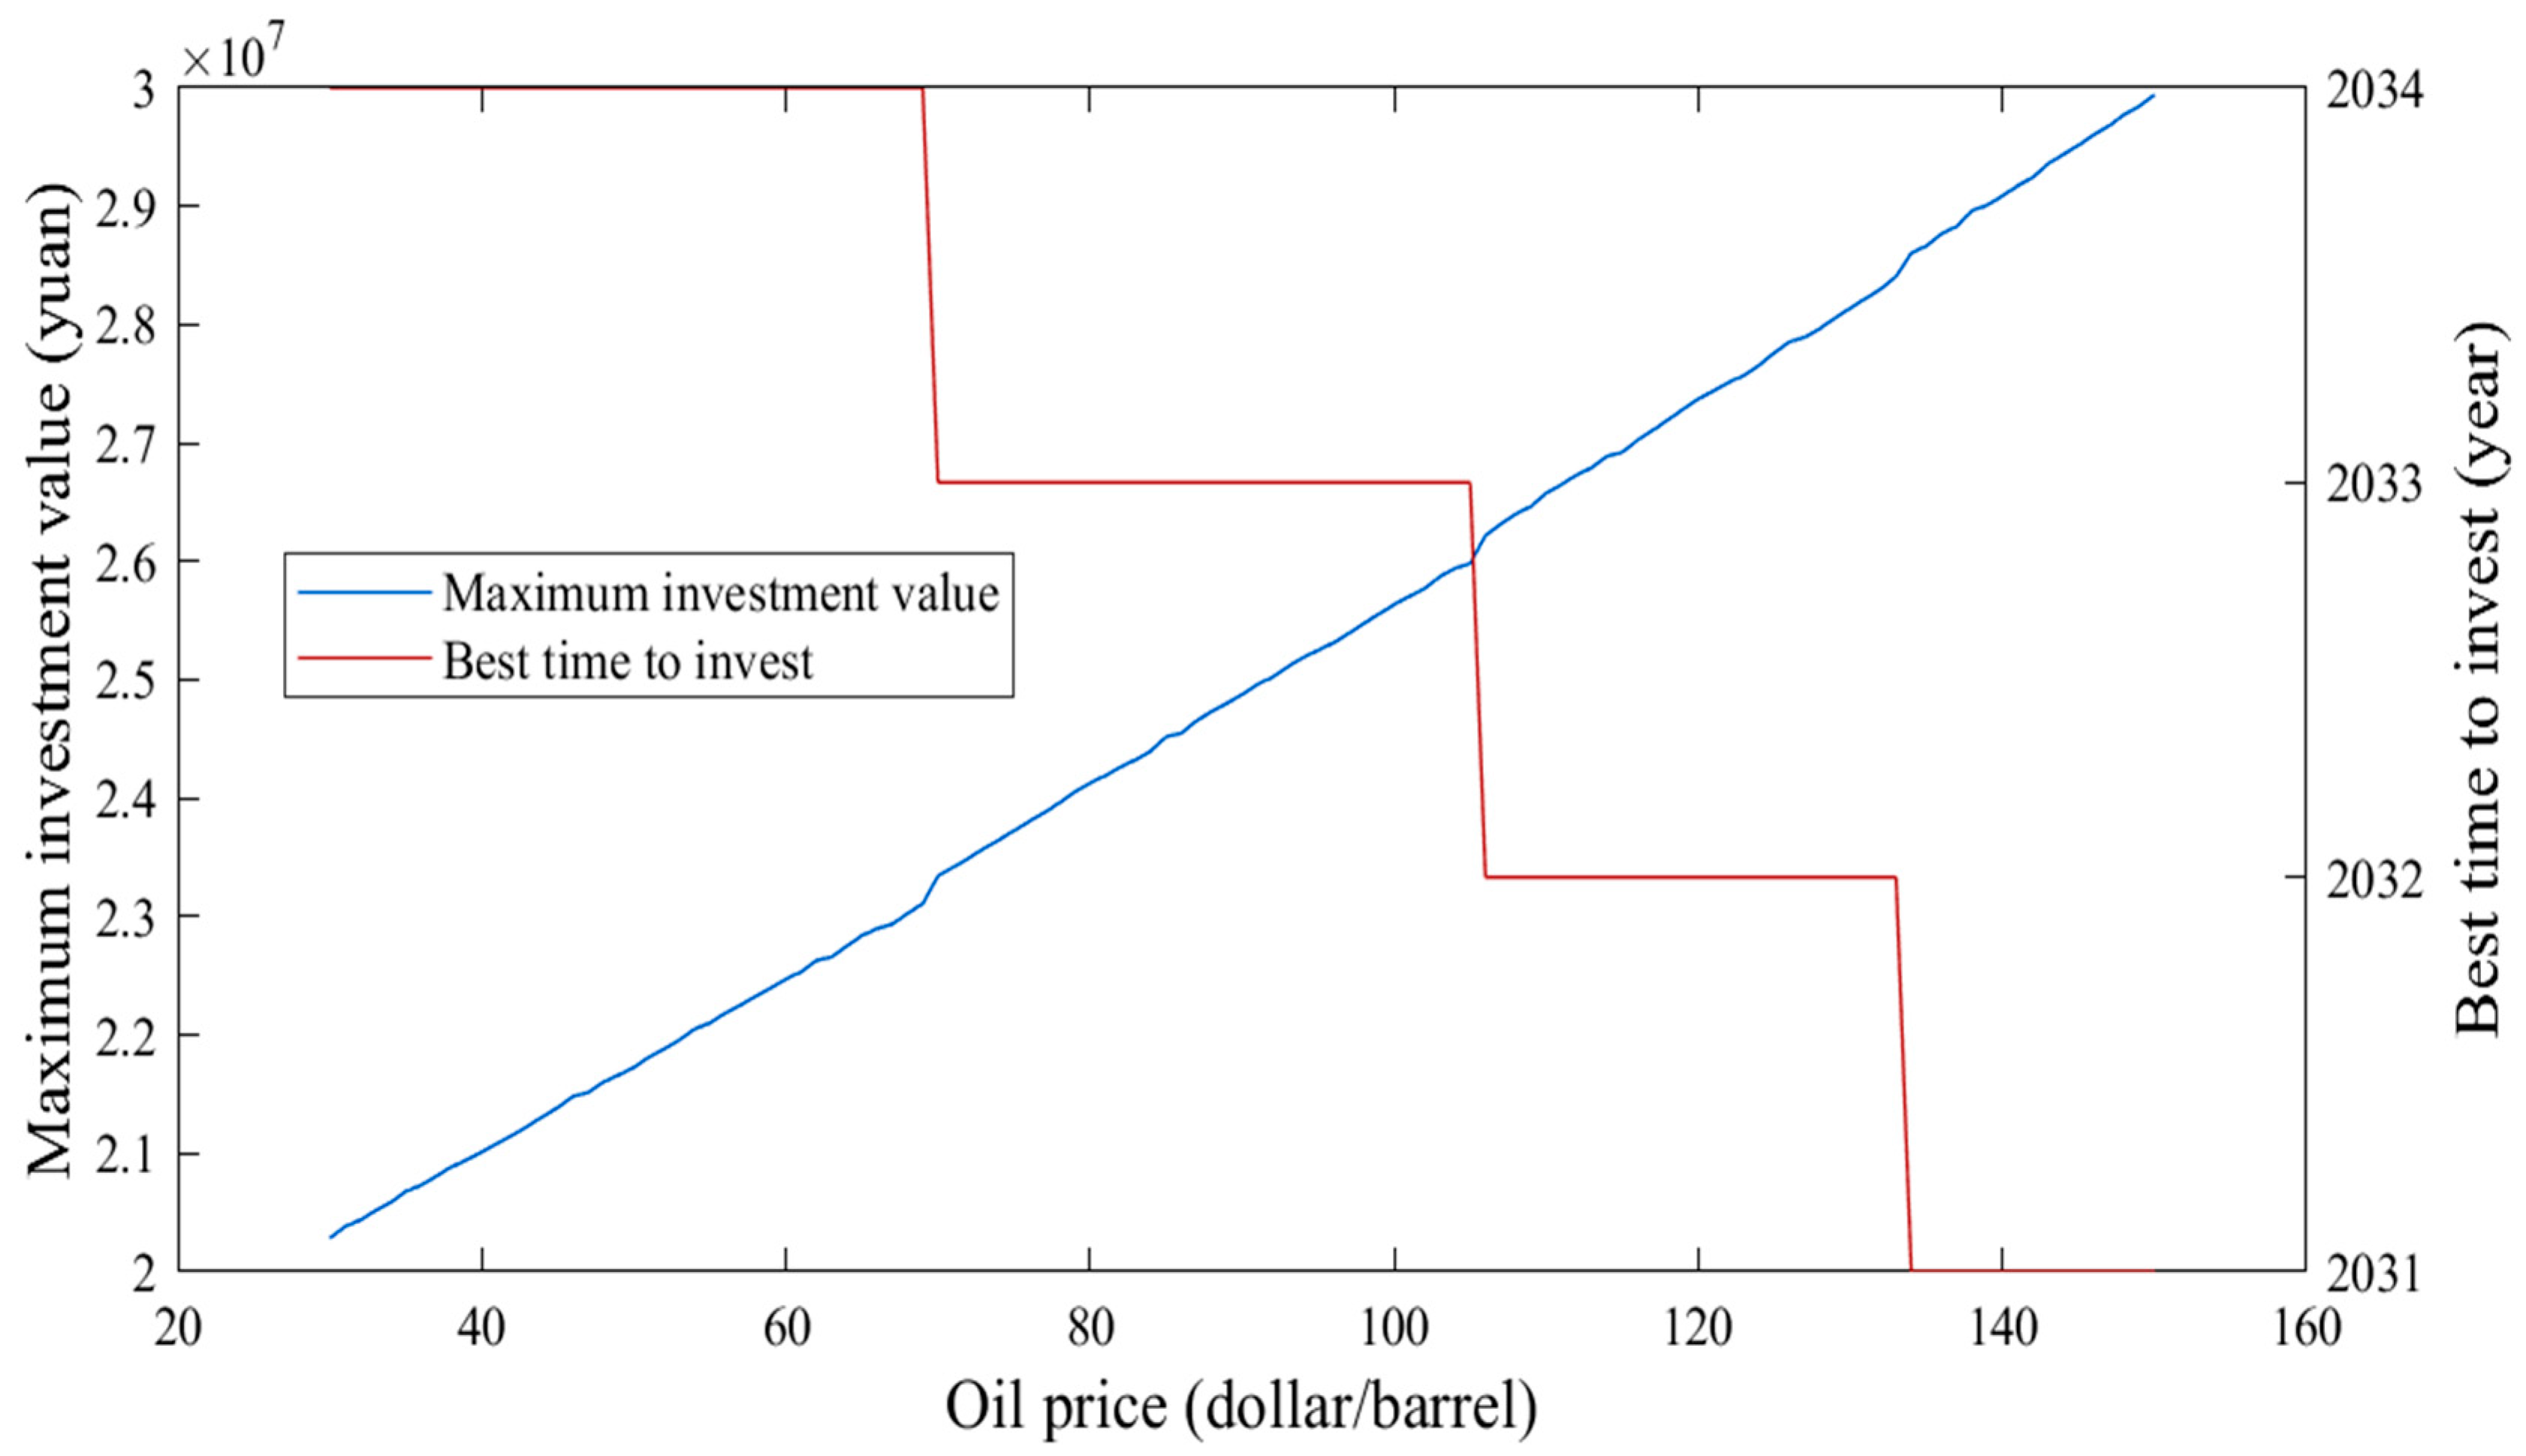
The project’s investment decisions across various initial oil prices are illustrated in Figure 5, while keeping all other conditions constant. We observe that as the initial oil price increases, the maximum investment value also rises. Price increases below USD 70 per barrel have minimal impact on investment schedules. A phase transition is observed in the USD 70–105 per barrel range, where the optimal investment year advances from 2034 to 2033. This temporal optimization continues as prices reach USD 106–133 per barrel, with investment timing shifting to 2032. The most notable change occurs when the price surpasses the USD 134 per barrel threshold, pushing the optimal investment year to around 2031. These results quantitatively demonstrate that oil price escalation effectively drives investment acceleration in CCUS projects.

5.3.4. Sensitivity of EOR Subsidies

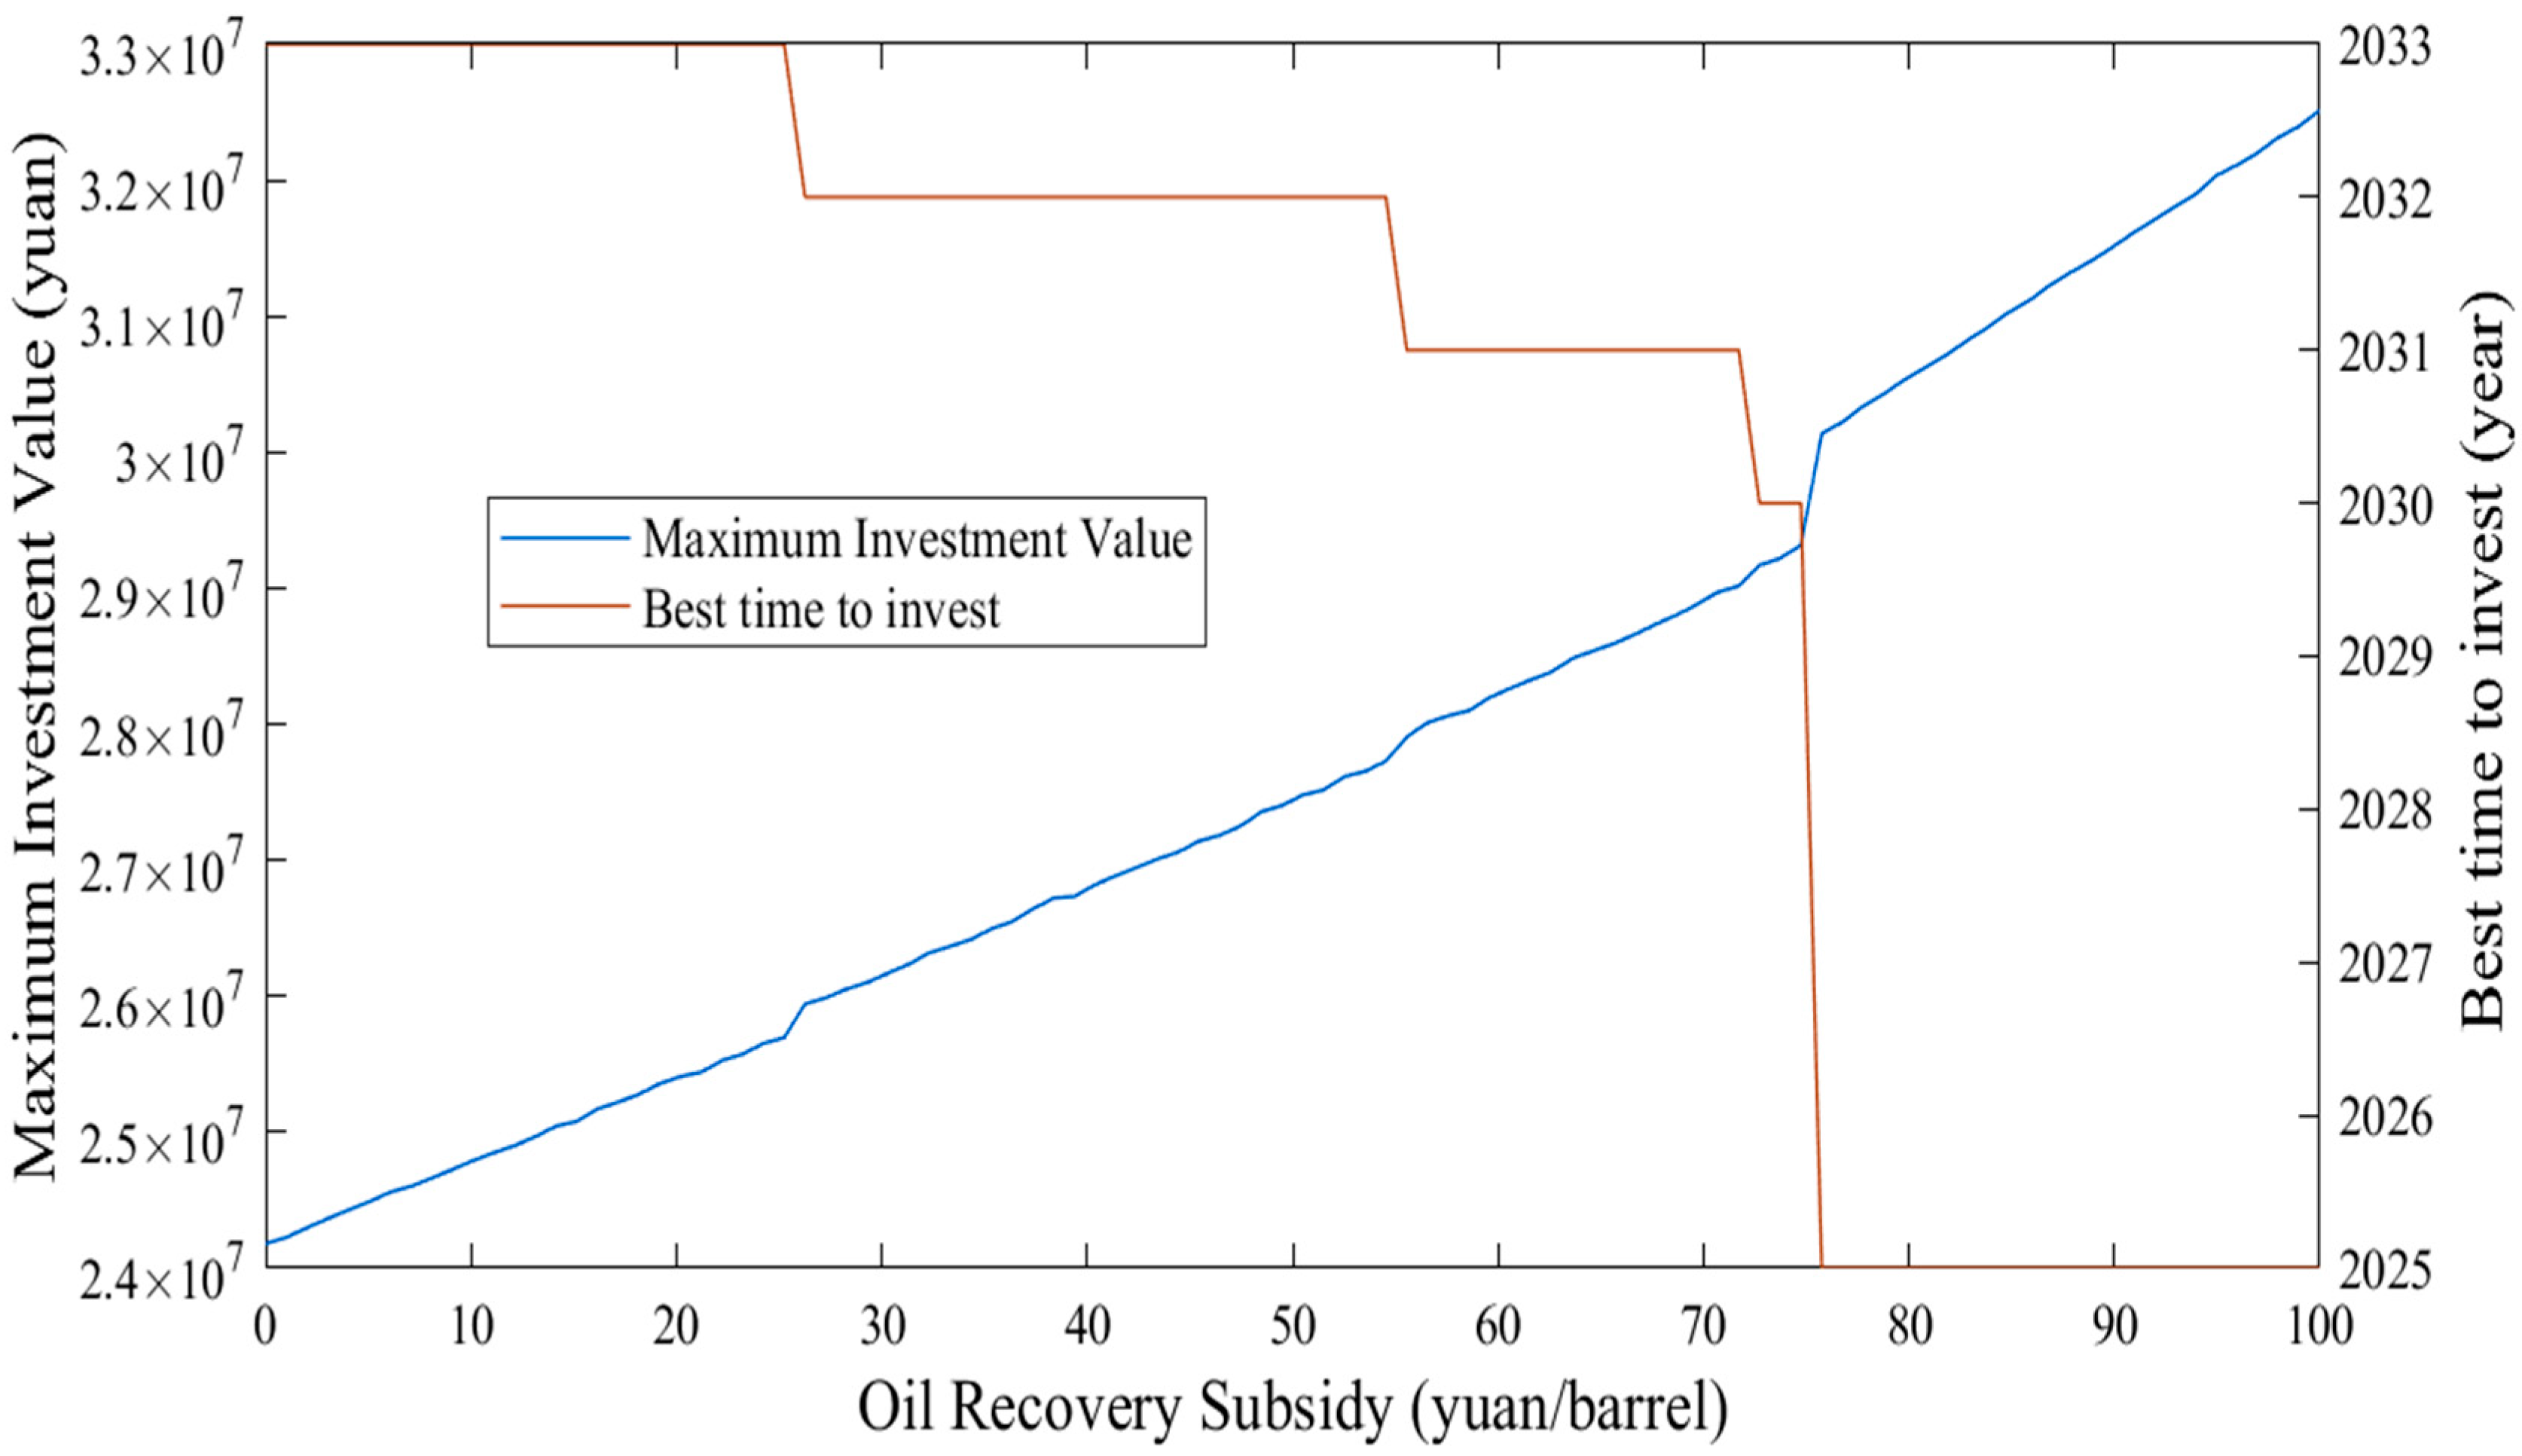
Based on varying EOR subsidies, with all other conditions held constant, Figure 6 illustrates the project’s investment decisions. The data indicates that when the EOR subsidy is less than or equal to CNY 25 per barrel, its effect on stimulating investment is limited. However, when the subsidy increases from CNY 25 per barrel to CNY 75 per barrel, the optimal investment timing shifts to 2031. If the subsidy exceeds CNY 75 per barrel, immediate investment conditions are activated, further advancing the investment timing to 2025. These findings suggest that policy support proves crucial for securing prompt investor engagement given existing conditions.

5.3.5. Sensitivity of Equipment Investment Subsidy Coefficient

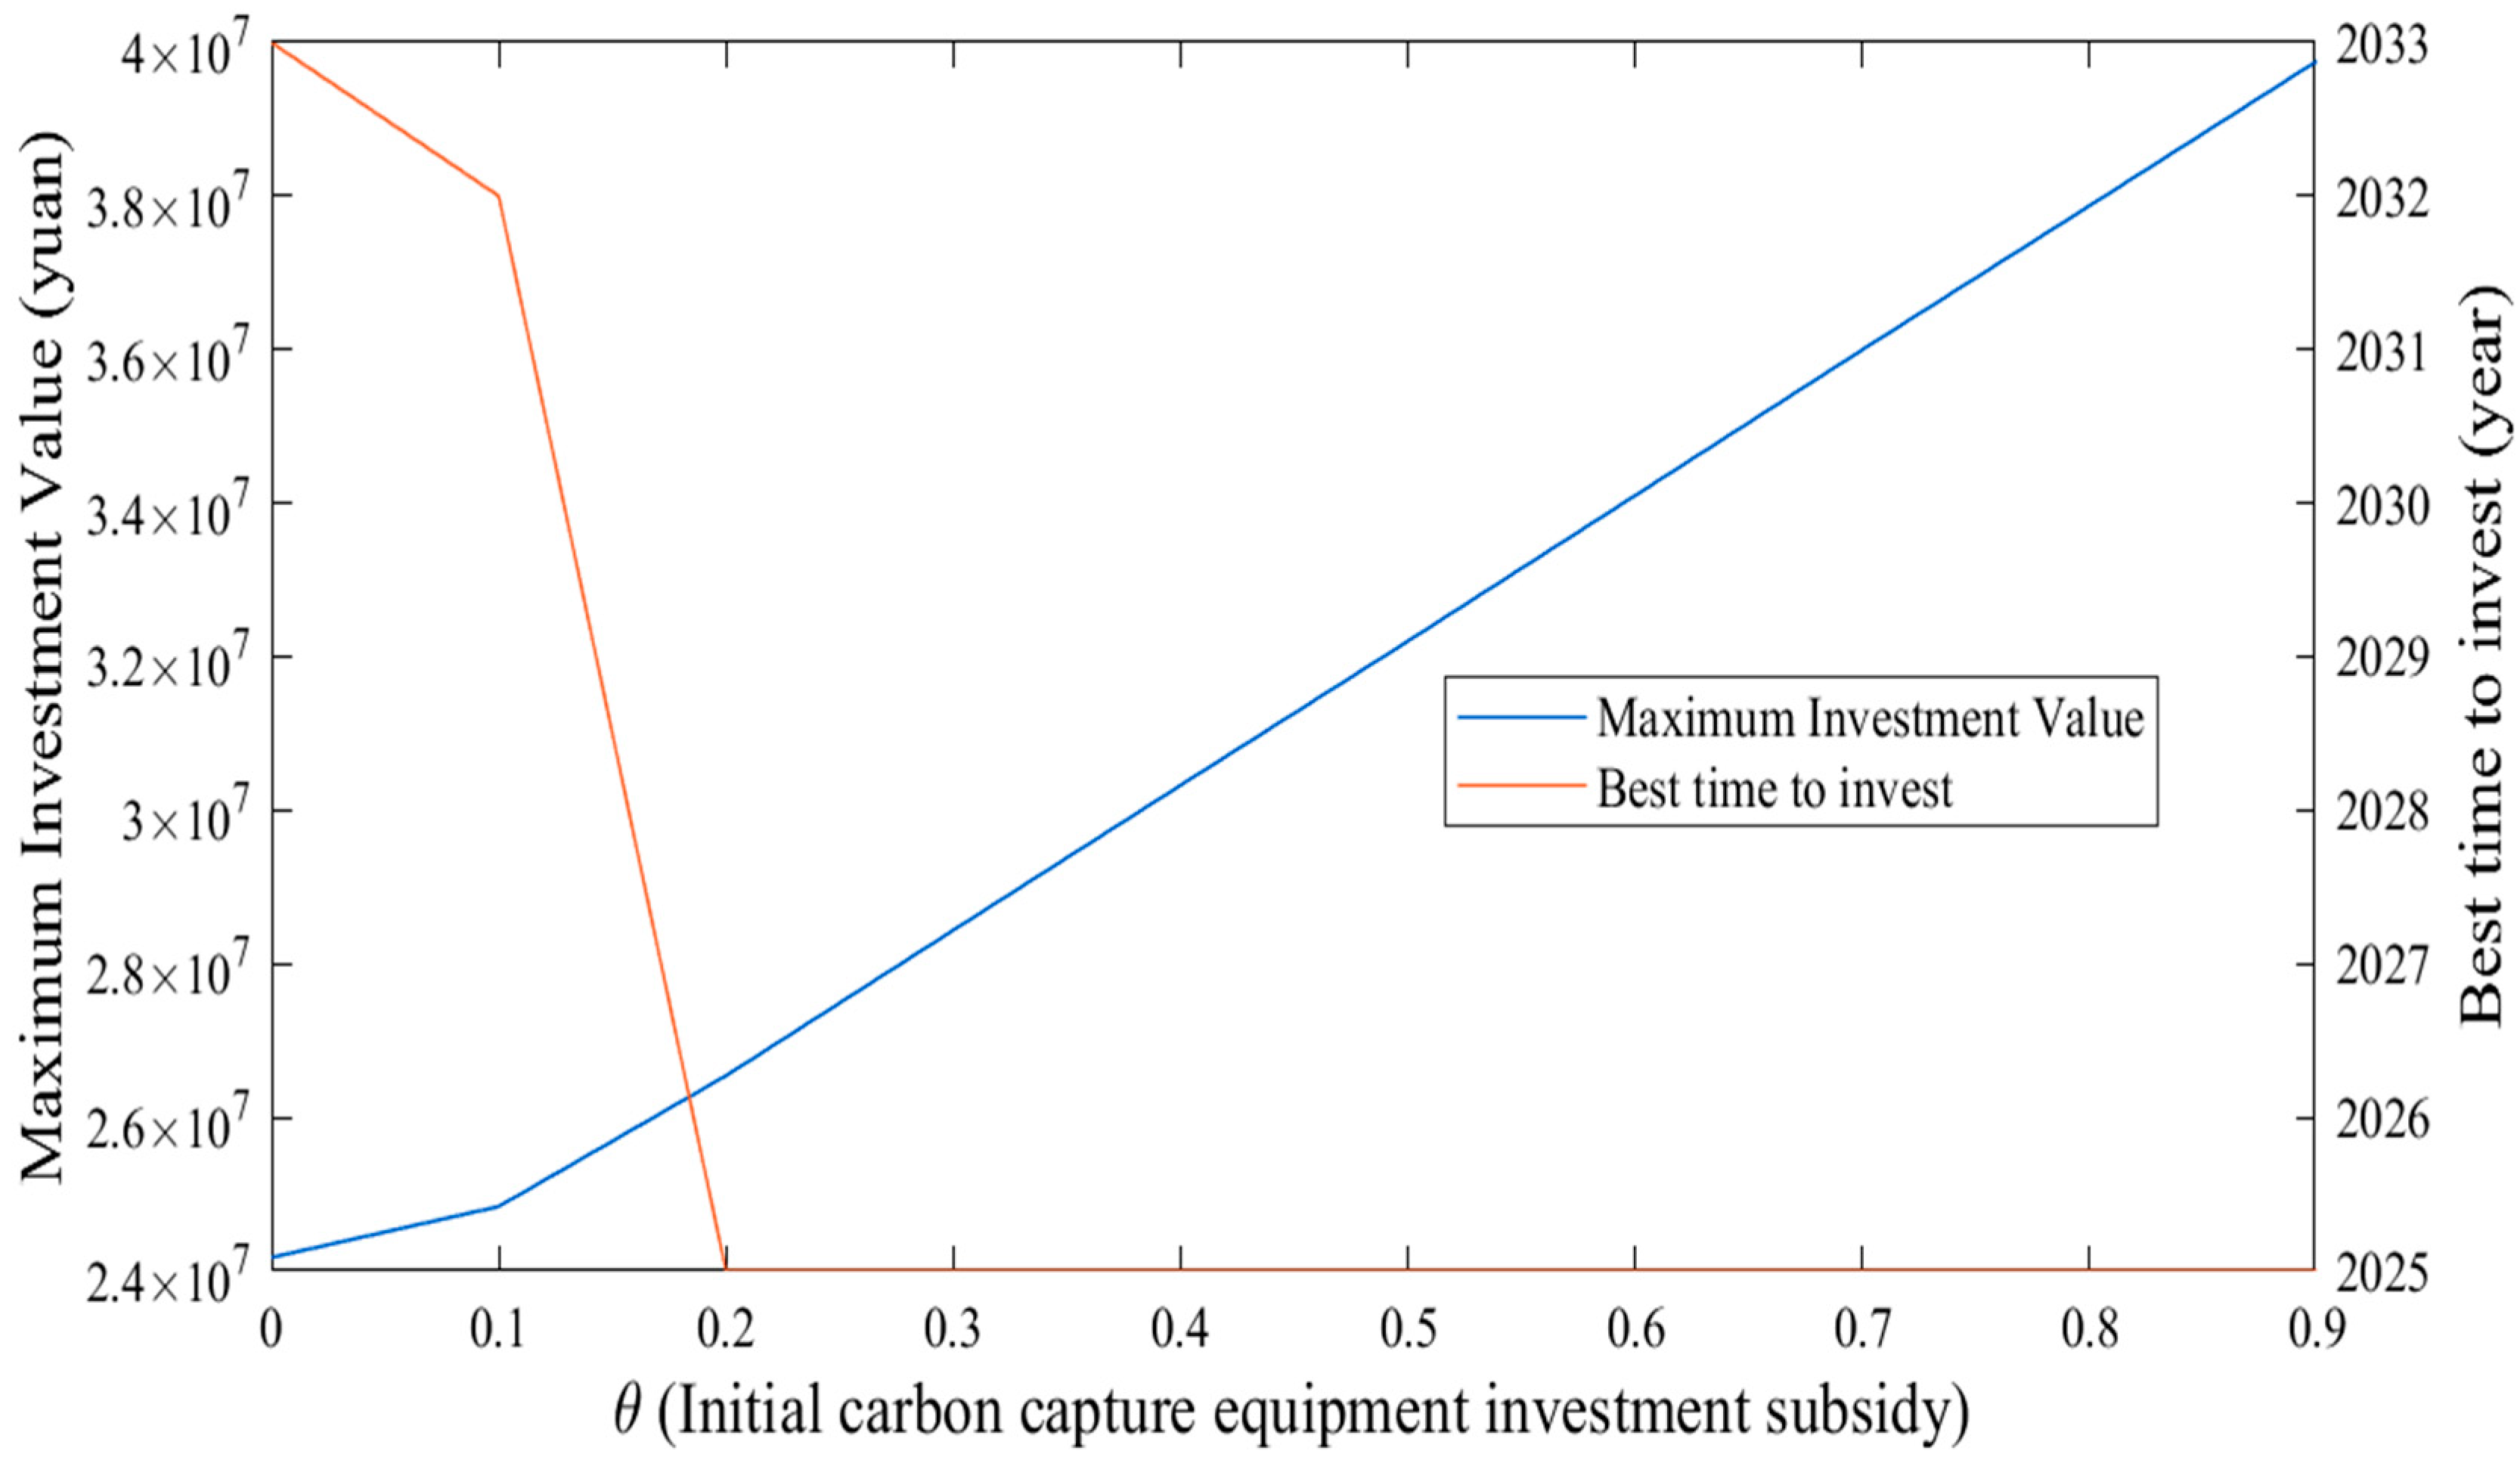
The investment dynamics of the project, in relation to varying levels of equipment investment subsidies, are illustrated in Figure 7. The immediate effect occurs when the equipment investment subsidy coefficient reaches or exceeds 0.2, indicating that the incentive policy is effective even at relatively low subsidy levels. Furthermore, once the subsidy coefficient exceeds a certain threshold, the maximum investment value of the project continues to increase while the optimal timing for investment stabilizes. At this stage, the marginal benefit of further increasing the subsidy coefficient begins to decline. Therefore, it is essential to consider the trade-off between the enhanced incentive effects of higher equipment investment subsidies and the associated fiscal costs to optimize the policy’s effectiveness.

5.3.6. Sensitivity of Photovoltaic Levelized Electricity Cost Coefficient

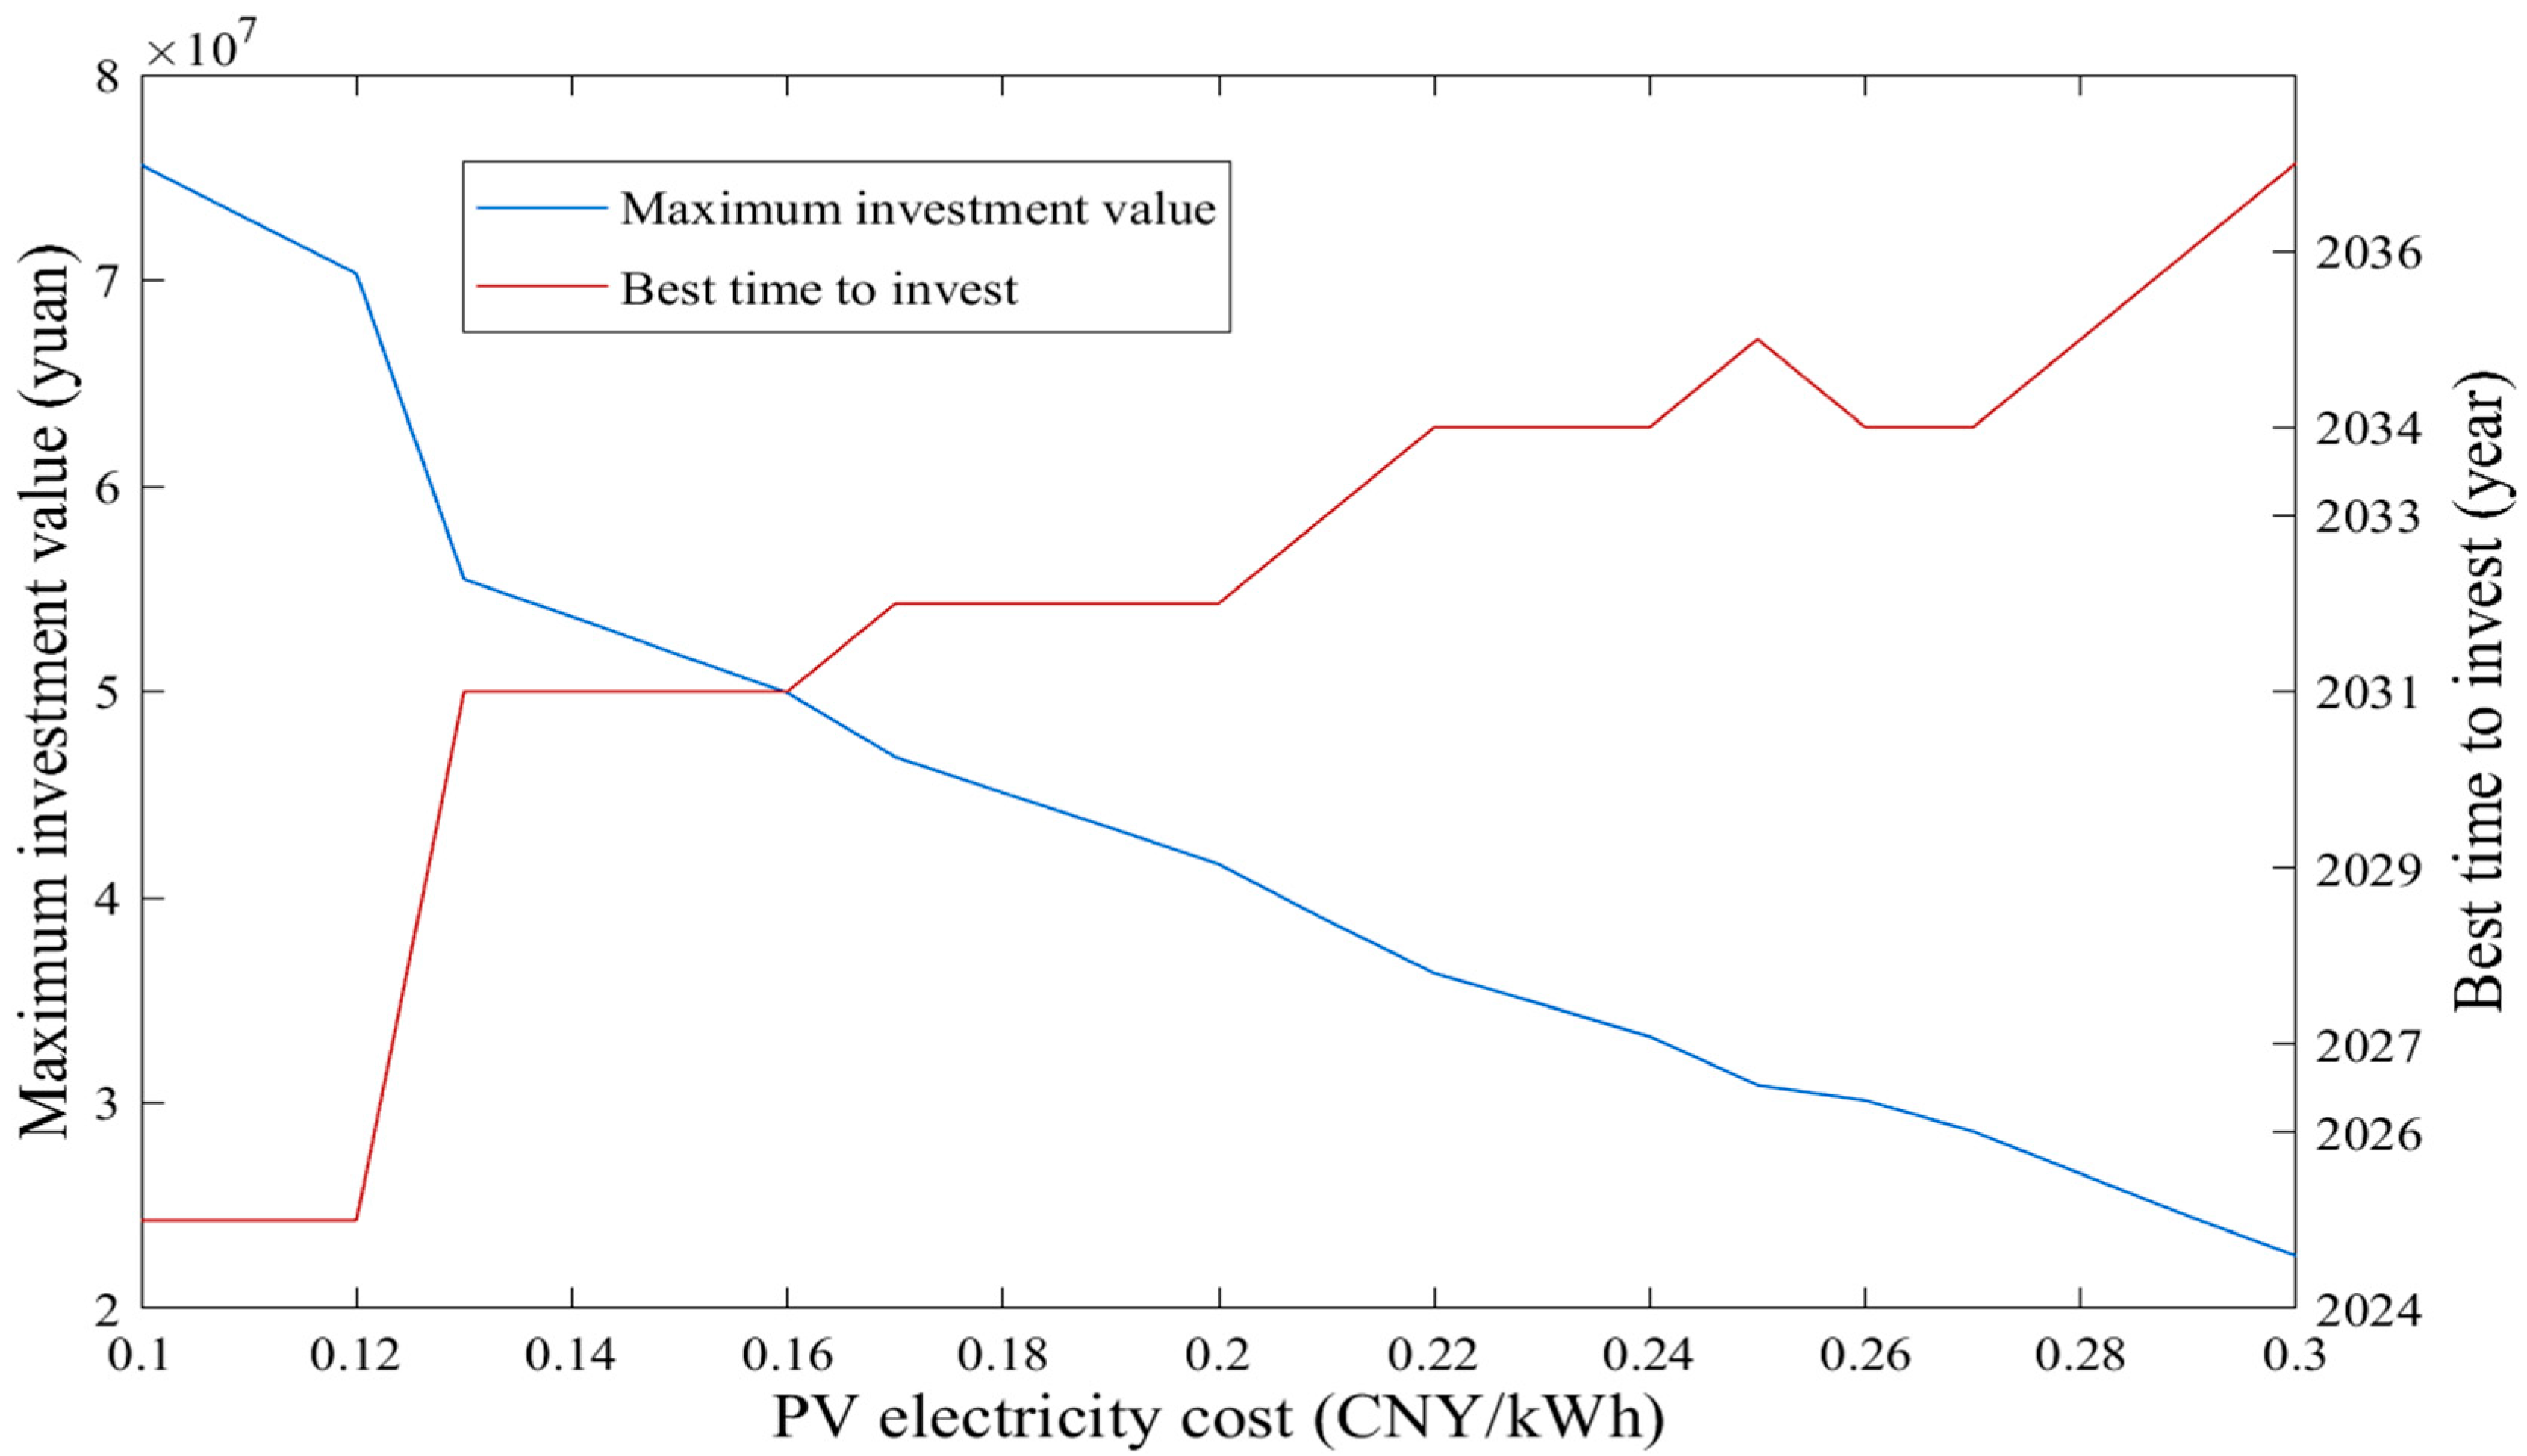
Given that the LCOE from photovoltaic (PV) sources is a key determinant of hydrogen production costs in this project, the impact of hydrogen cost on investment decisions is assessed indirectly by analyzing variations in PV electricity prices. Currently, the average on-grid price for centralized PV power in China ranges from CNY 0.3 to 0.5 per kWh; the lower bound is adopted for this analysis. According to Figure 8, when the LCOE remains relatively high (e.g., CNY 0.30/kWh), the optimal investment timing is significantly delayed. As the LCOE steadily declines from CNY 0.30 to approximately CNY 0.22/kWh, the investment window advances markedly, shifting from around 2037 to 2032. A further reduction to just above CNY 0.12/kWh continues to bring investment forward. Notably, when the LCOE reaches CNY 0.12/kWh or below, immediate investment becomes economically viable, and the optimal investment year moves up to as early as 2025. The findings indicate that the LCOE plays a critical role in determining the optimal timing of project investment. Declining electricity costs are shown to significantly accelerate investment decisions.

6. Conclusions

This study applies real options theory to evaluate the maximum investment value and optimal timing for refining–chemical integrated plants in the context of CCUS. It considers uncertainties related to carbon prices, the volatility of oil prices, and the reduction in both initial investment and operating costs due to technological advancements. The model is solved using the Matlab tool, followed by a sensitivity analysis to assess the effects of carbon prices, their volatility, oil prices, EOR subsidies, and coefficients for initial investment subsidies. The main findings are summarized as follows:
First, carbon pricing emerges as a primary determinant of CCUS investment behavior. Prices in China’s national carbon market remain relatively low and are insufficient to incentivize large-scale deployment; investment becomes viable when the initial carbon price reaches CNY 125 per ton. Compared to oil prices—where investment is triggered only when prices exceed USD 134 per barrel—carbon pricing demonstrates a stronger influence on decision-making, particularly under the “CO2-to-methanol + EOR” model.
Second, volatility in carbon pricing significantly affects investor confidence and strategy. Large fluctuations may delay or deter investment, underscoring the need for a stable and transparent carbon market. Strengthening carbon price signals through policy refinement and market development is essential to de-risk CCUS investment and accelerate adoption.
Third, targeted subsidies—especially for enhanced oil recovery (EOR) and initial equipment investment—play a catalytic role. When EOR subsidies reach CNY 75 per barrel or equipment subsidies exceed a coefficient of 0.2, immediate investment becomes economically viable. The results reinforce the necessity of strong government support through well-designed financial incentive frameworks.
Lastly, the LCOE from photovoltaic sources is a critical determinant of hydrogen production economics. A sustained decrease in LCOE significantly accelerates the optimal investment window. When the LCOE falls to approximately CNY 0.12/kWh or lower, projects become economically viable, and investment can be brought forward—potentially as early as 2025. These findings underscore the strategic importance of lowering renewable electricity costs to enable the large-scale deployment of green hydrogen and CCUS technologies.
This study offers important insights into CCUS investment decisions by simulating the behavior of investors in integrated refining–chemical plants. While valuable, the analysis remains subject to limitations. Real-world conditions are more complex than the model assumes, and volatile factors such as crude oil, carbon, and methanol prices introduce additional uncertainty. In particular, the methanol price is treated as a fixed value sufficient to cover production costs, without reflecting its market volatility. Furthermore, key risk dimensions—including market, technological, and policy risks—are not comprehensively addressed. Future research should adopt more advanced risk modeling to capture these dynamics and develop a structured policy scenario framework with parameterized sub-scenarios to systematically assess the economic viability and investment risks of CCUS under different policy pathways. Finally, as the study is based on a business model that integrates refining and chemical production, certain data inputs may require adjustment depending on commercialization levels and specific business configurations.

Author Contributions

R.F.: Writing—Review and Editing, Writing—Original Draft, Methodology, Formal Analysis, Visualization. X.G.: Writing—Original Draft, Data Curation, Methodology, Software. Y.B.: Writing—Review and Editing, Investigation, Data Curation, Formal Analysis, Visualization. L.F.: Writing—Review and Editing, Funding Acquisition, Resources, Supervision. All authors have read and agreed to the published version of the manuscript.

Funding

This study was funded by the National Natural Science Foundation of China, grant number NO. 72274212.

Data Availability Statement

The data presented in this study are available on request from the corresponding author.

Conflicts of Interest

The authors declare no conflicts of interest.

References

  1. Hill, L.B.; Li, X.; Wei, N. CO2-EOR in China: A comparative review. Int. J. Greenh. Gas Control 2020, 103, 103173. [Google Scholar] [CrossRef]
  2. Metz, B.; Davidson, O.; de Coninck, H.; Loos, M.; Meyer, L. IPCC Special Report on Carbon Dioxide Capture and Storage; Intergovernmental Panel on Climate Change: Geneva, Switzerland, 2005. Available online: https://www.osti.gov/biblio/20740954 (accessed on 25 April 2025).
  3. Qin, J.; Han, H.; Liu, X. Application and enlightenment of carbon dioxide flooding in the United States of America. Pet. Explor. Dev. 2015, 42, 232–240. [Google Scholar] [CrossRef]
  4. International Energy Agency. CCUS Projects Database; IEA: Paris, France, 2024; Available online: https://www.iea.org/data-and-statistics/data-product/ccus-projects-database (accessed on 25 April 2025).
  5. International Energy Agency. Net Zero by 2050: A Roadmap for the Global Energy Sector; IEA: Paris, France, 2023; Available online: https://www.iea.org/reports/net-zero-by-2050 (accessed on 25 April 2025).
  6. Zhang, X.; Yang, X.; Lu, X.; Chen, J.; Cheng, J.; Diao, Y.; Fan, J.; Gao, L.; Gao, S.; Han, L.; et al. China Carbon Capture, Utilization, and Storage (CCUS) Annual Report 2023; The Administrative Centre for China’s Agenda 21: Beijing, China, 2023; Available online: https://file.jgvogel.cn/124/upload/resources/file/421008.pdf (accessed on 25 April 2025).
  7. Da, H.; Xu, D.; Li, J.; Tang, Z.; Li, J.; Wang, C.; Luan, H.; Zhang, F.; Zeng, Y. Influencing factors of carbon emission from typical refining units: Identification, analysis, and mitigation potential. Energies 2023, 16, 6527. [Google Scholar] [CrossRef]
  8. Ma, S.; Lei, T.; Meng, J.; Liang, X.; Guan, D. Global oil refining’s contribution to greenhouse gas emissions from 2000 to 2021. Innovation 2023, 4, 100361. [Google Scholar] [CrossRef]
  9. Liang, B.; Chen, C.; Jia, C.; Wang, C.; Wang, X.; Zha, Y.; Wang, R.; Meng, Z.; Wang, H. Carbon capture, utilization and storage (CCUS) in oil and gas reservoirs in China: Status, opportunities and challenges. Fuel 2024, 375, 132353. [Google Scholar] [CrossRef]
  10. Qiao, Y.; Liu, W.; Guo, R.; Sun, S.; Zhang, S.; Bailey, J.J.; Fang, M.; Wu, C. Techno-economic analysis of integrated carbon capture and utilisation compared with carbon capture and utilisation with syngas production. Fuel 2023, 332, 125972. [Google Scholar] [CrossRef]
  11. Zang, G.; Sun, P.; Elgowainy, A.; Wang, M. Technoeconomic and life cycle analysis of synthetic methanol production from hydrogen and industrial byproduct CO2. Environ. Sci. Technol. 2021, 55, 5248–5257. [Google Scholar] [CrossRef] [PubMed]
  12. Sollai, S.; Porcu, A.; Tola, V.; Ferrara, F.; Pettinau, A. Renewable methanol production from green hydrogen and captured CO2: A techno-economic assessment. J. CO2 Util. 2023, 68, 102345. [Google Scholar] [CrossRef]
  13. 2024 China Green Methanol Industry Overview: Trillion-Level Clean Energy Track Driven by Dual-Carbon Strategy, Outlook for Explosive Growth in the Industrial Chain (Executive Summary). Available online: https://pdf.dfcfw.com/pdf/H3_AP202504251662297519_1.pdf?1745611283000.pdf (accessed on 21 May 2025).
  14. Wu, N.; Parsons, J.E.; Polenske, K.R. The impact of future carbon prices on CCS investment for power generation in China. Energy Policy 2013, 54, 160–172. [Google Scholar] [CrossRef]
  15. Sekar, R.C.; Parsons, J.E.; Herzog, H.J.; Jacoby, H.D. Future Carbon Regulations and Current Investments in Alternative Coal-Fired Power Plant Designs; MIT Joint Program on the Science and Policy of Global Change: Cambridge, MA, USA, 2005; Available online: https://dspace.mit.edu/handle/1721.1/30594 (accessed on 25 April 2025).
  16. Bohm, M.C.; Herzog, H.J.; Parsons, J.E.; Sekar, R.C. Capture-ready coal plants–Options, technologies and economics. Int. J. Greenh. Gas Control 2007, 1, 113–120. [Google Scholar] [CrossRef]
  17. Rubin, E.S.; Chen, C.; Rao, A.B. Cost and performance of fossil fuel power plants with CO2 capture and storage. Energy Policy 2007, 35, 4444–4454. [Google Scholar] [CrossRef]
  18. Zhai, H.; Ou, Y.; Rubin, E.S. Opportunities for decarbonizing existing U.S. coal-fired power plants via CO2 capture, utilization and storage. Environ. Sci. Technol. 2015, 49, 7571–7579. [Google Scholar] [CrossRef]
  19. Liang, X.; Reiner, D.; Gibbins, J.; Li, J. Assessing the value of CO2 capture ready in new-build pulverised coal-fired power plants in China. Int. J. Greenh. Gas Control 2009, 3, 787–792. [Google Scholar] [CrossRef]
  20. Dahowski, R.T.; Davidson, C.L.; Li, X.C.; Wei, N. A $70/tCO2 greenhouse gas mitigation backstop for China’s industrial and electric power sectors: Insights from a comprehensive CCS cost curve. Int. J. Greenh. Gas Control 2012, 11, 73–85. [Google Scholar] [CrossRef]
  21. Wang, X.; Cai, Y.; Dai, C. Evaluating China’s biomass power production investment based on a policy benefit real options model. Energy 2014, 73, 751–761. [Google Scholar] [CrossRef]
  22. Fan, Y.; Mo, J.-L.; Zhu, L. Evaluating coal bed methane investment in China based on a real options model. Resour. Policy 2013, 38, 50–59. [Google Scholar] [CrossRef]
  23. Myers, S.C. Determinants of corporate borrowing. J. Financ. Econ. 1977, 5, 147–175. [Google Scholar] [CrossRef]
  24. Fuss, S.; Szolgayová, J. Fuel price and technological uncertainty in a real options model for electricity planning. Appl. Energy 2010, 87, 2938–2944. [Google Scholar] [CrossRef]
  25. Laurikka, H. Option value of gasification technology within an emissions trading scheme. Energy Policy 2006, 34, 3916–3928. [Google Scholar] [CrossRef]
  26. Agaton, C.B. Application of real options in carbon capture and storage literature: Valuation techniques and research hotspots. Sci. Total Environ. 2021, 795, 148683. [Google Scholar] [CrossRef]
  27. Zhang, W.; Dai, C.; Luo, X.; Ou, X. Policy incentives in carbon capture utilization and storage (CCUS) investment based on real options analysis. Clean Technol. Environ. Policy 2021, 23, 1311–1326. [Google Scholar] [CrossRef]
  28. Fan, J.-L.; Li, Z.; Ding, Z.; Li, K.; Zhang, X. Investment decisions on carbon capture utilization and storage retrofit of Chinese coal-fired power plants based on real option and source-sink matching models. Energy Econ. 2023, 126, 106972. [Google Scholar] [CrossRef]
  29. Li, Z.; Yu, P.; Xian, Y.; Fan, J.-L. Investment benefit analysis of coal-to-hydrogen coupled CCS technology in China based on real option approach. Energy 2024, 294, 130293. [Google Scholar] [CrossRef]
  30. Wang, X.; Du, L. Study on carbon capture and storage (CCS) investment decision-making based on real options for China’s coal-fired power plants. J. Clean. Prod. 2016, 112, 4123–4131. [Google Scholar] [CrossRef]
  31. Geske, J.; Herold, J. Carbon capture and storage investment and management in an environment of technological and price uncertainties. SSRN Working Paper, 2010; 20 pages. [Google Scholar] [CrossRef]
  32. Zhu, L.; Fan, Y. A real options–based CCS investment evaluation model: Case study of China’s power generation sector. Appl. Energy 2011, 88, 4320–4333. [Google Scholar] [CrossRef]
  33. Zhu, L.; Fan, Y. Modelling the investment in carbon capture retrofits of pulverized coal-fired plants. Energy 2013, 57, 66–75. [Google Scholar] [CrossRef]
  34. Chen, H.; Wang, C.; Ye, M. An uncertainty analysis of subsidy for carbon capture and storage (CCS) retrofitting investment in China’s coal power plants using a real-options approach. J. Clean. Prod. 2016, 137, 200–212. [Google Scholar] [CrossRef]
  35. Chu, H.; Ran, L.; Zhang, R. Evaluating CCS investment of China by a novel real option-based model. Math. Probl. Eng. 2016, 2016, 8180674. [Google Scholar] [CrossRef]
  36. Yao, X.; Fan, Y.; Xu, Y.; Zhang, X.; Zhu, L.; Feng, L. Is it worth to invest?—An evaluation of CTL-CCS project in China based on real options. Energy 2019, 182, 920–931. [Google Scholar] [CrossRef]
  37. Yao, X.; Zhong, P.; Zhang, X.; Zhu, L. Business model design for the carbon capture utilization and storage (CCUS) project in China. Energy Policy 2018, 121, 519–533. [Google Scholar] [CrossRef]
  38. Jarvis, S.M.; Samsatli, S. Technologies and infrastructures underpinning future CO2 value chains: A comprehensive review and comparative analysis. Renew. Sustain. Energy Rev. 2018, 85, 46–68. [Google Scholar] [CrossRef]
  39. Mikhelkis, L.; Govindarajan, V. Techno-economic and partial environmental analysis of carbon capture and storage (CCS) and carbon capture, utilization, and storage (CCUS): Case study from proposed waste-fed district-heating incinerator in Sweden. Sustainability 2020, 12, 5922. [Google Scholar] [CrossRef]
  40. Wang, X.; Tang, R.; Meng, M.; Su, T. Research on CCUS business model and policy incentives for coal-fired power plants in China. Int. J. Greenh. Gas Control 2023, 125, 103871. [Google Scholar] [CrossRef]
  41. Wang, X.; Gao, Z. Research on CCUS investment decision-making in coal-fired power plants based on real options. Clean Coal Technol. 2023. Available online: http://kns.cnki.net/kcms/detail/11.3676.TD.20230816.1054.002.html (accessed on 25 April 2025).
  42. Cai, B.F.; Li, Q.; Zhang, X.; Cao, C.; Cao, L.; Chen, W.; Chen, Z.; Dong, J.; Fan, J.; Jiang, Y.; et al. Annual Report of China’s CO2 Capture, Utilization and Storage (CCUS) (2021)—China CCUS Path Study; Chinese Academy of Environmental Planning of the Ministry of Ecology and Environment: Beijing, China, 2021; Available online: https://www.caep.org.cn/sy/dqhj/gh/202107/W020210726513427451694.pdf (accessed on 25 April 2025).
  43. Yang, L.; Xu, M.; Yang, Y.; Fan, J.; Zhang, X. Comparison of subsidy schemes for carbon capture utilization and storage (CCUS) investment based on real option approach: Evidence from China. Appl. Energy 2019, 255, 113828. [Google Scholar] [CrossRef]
  44. Nikolova, C.; Gutierrez, T. Use of microorganisms in the recovery of oil from recalcitrant oil reservoirs: Current state of knowledge, technological advances and future perspectives. Front. Microbiol. 2020, 10, 2996. [Google Scholar] [CrossRef]
  45. Tan, X.; Luo, D.; Song, X. Analysis and discussion on the economics and development models of CCUS-EOR considering dual benefits of oil displacement and carbon emission reduction. Pet. Geol. Recovery Effic. 2024, 31, 70–78. [Google Scholar] [CrossRef]
  46. Lin, B.; Tan, Z. How much impact will low oil price and carbon trading mechanism have on the value of carbon capture utilization and storage (CCUS) project? Analysis based on real option method. J. Clean. Prod. 2021, 298, 126768. [Google Scholar] [CrossRef]
  47. Rubin, E.S.; Yeh, S.; Antes, M.; Berkenpas, M.; Davison, J. Use of experience curves to estimate the future cost of power plants with CO2 capture. Int. J. Greenh. Gas Control 2007, 1, 188–197. [Google Scholar] [CrossRef]
  48. Zhang, X.; Li, Y. Techno-economic analysis of green methanol production processes. Mod. Chem. Ind. 2023, 43, 209–212. [Google Scholar] [CrossRef]
  49. Zhu, C.; Tian, D.; Zhang, H.; Qu, C.; Dong, L. Techno-economic analysis of methanol production systems via CO2 hydrogenation and electrolysis. Low-Carbon Chem. Chem. Eng. 2023, 48, 117–124. Available online: https://link.cnki.net/urlid/51.1336.TQ.20221212.1504.001 (accessed on 25 April 2025).
  50. Wang, Y.; Jin, Q.; Pan, F. Feasibility study on low-carbon methanol production based on green hydrogen. Mod. Chem. Ind. 2024, 44, 229–234. [Google Scholar] [CrossRef]
  51. Shu, B.; Fan, M.; Xiong, J. Cost estimation and prediction of green methanol production via CO2 hydrogenation. Electr. Power Technol. Environ. Prot. 2024, 40, 191–197. [Google Scholar] [CrossRef]
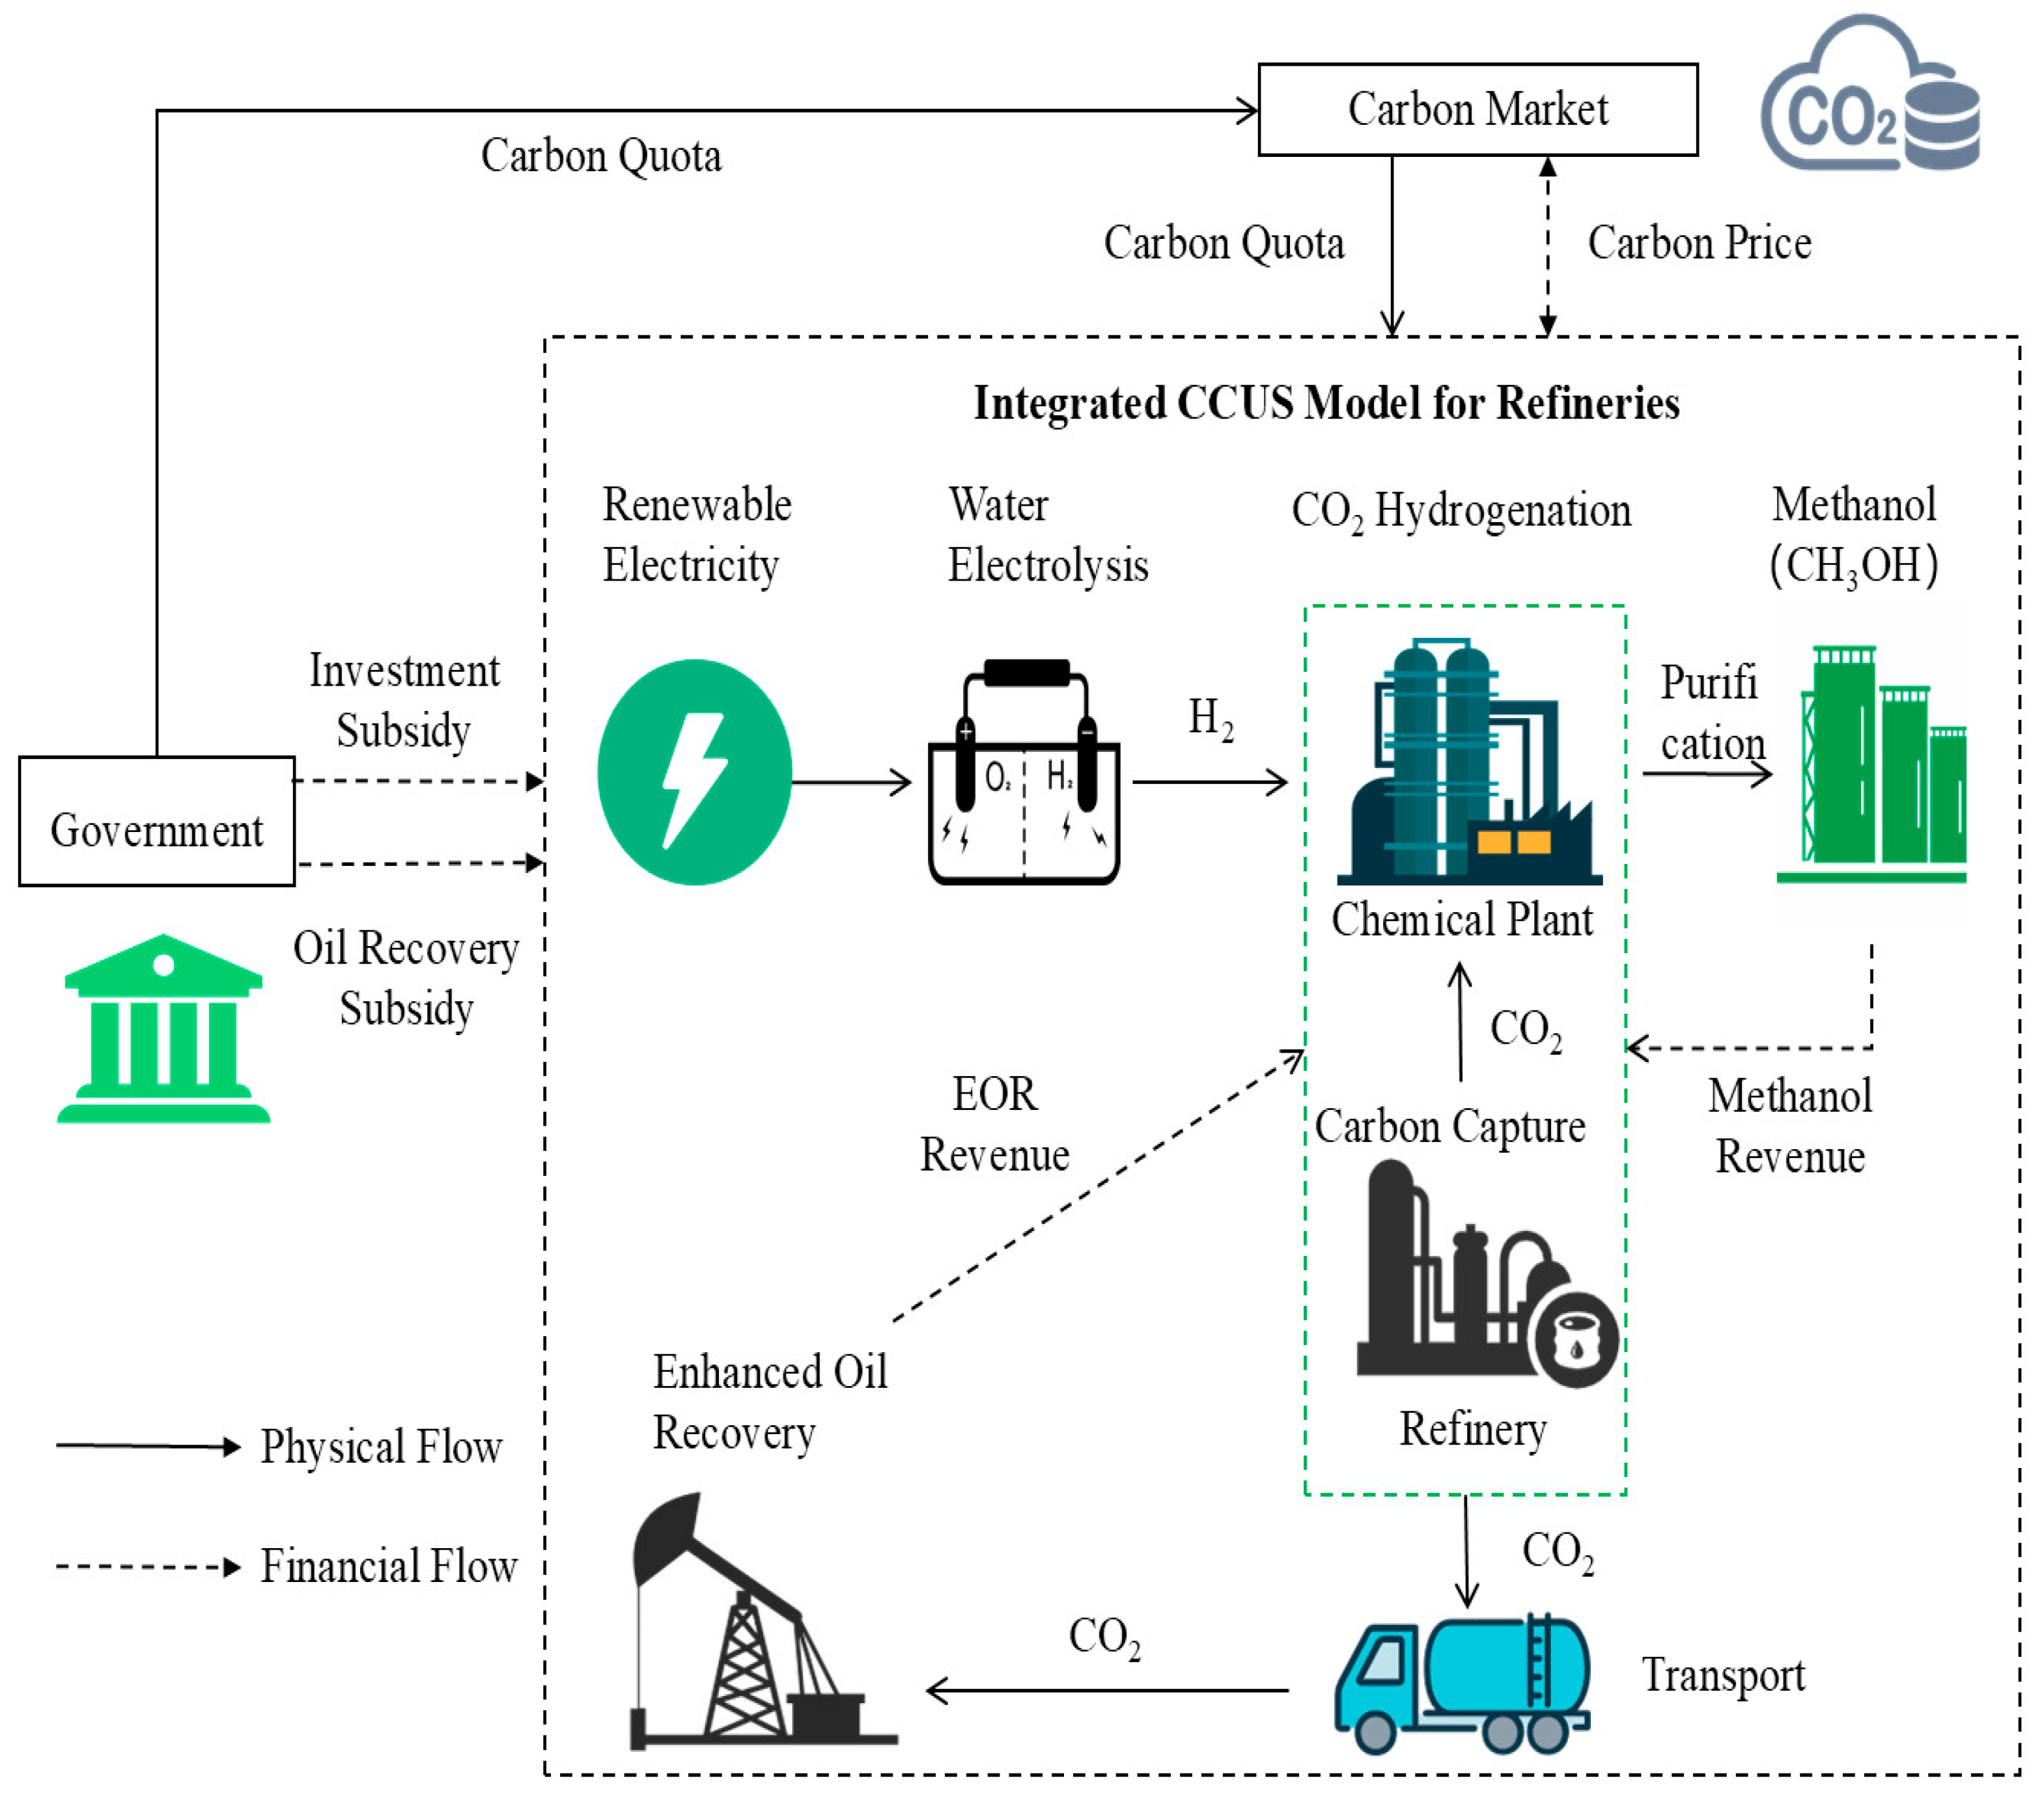
Figure 1. CCUS process diagram.
Energies 18 03092 g001
Figure 2. Simulation of carbon and oil price trajectories.
Energies 18 03092 g002
Figure 3. Optimal investment timing and maximum investment value trends of CCUS project at different initial carbon price levels.
Energies 18 03092 g003
Figure 4. Optimal investment timing and maximum investment value trends of CCUS project under different carbon price volatilities.
Energies 18 03092 g004
Figure 5. Optimal investment timing and maximum investment value trends of CCUS projects under different initial oil price levels.
Energies 18 03092 g005
Figure 6. Optimal investment timing and maximum investment value trends of CCUS project under different EOR subsidies.
Energies 18 03092 g006
Figure 7. Optimal investment timing and maximum investment value of CCUS projects under varying carbon capture equipment subsidy coefficients.
Energies 18 03092 g007
Figure 8. Optimal investment timing and maximum investment value of CCUS projects under different photovoltaic levelized electricity cost scenarios.
Energies 18 03092 g008
Table 1. Comparison of costs across different methanol production technologies [13].
Technical RouteCurrent Cost (CNY/ton)Future Cost (CNY/ton)Cost-Driving FactorsDevelopment Potential
Coal-based methanol1800–27002700–3600Coal price,
carbon price
Low, constrained by carbon prices
Gas-based methanol1600–30002800–3500Gas price,
carbon price
Low, constrained by limited domestic resources and volatile global gas prices
Biomass-based methanol3800–50001900–2500Biomass pellet pricesModerate, dependent on biomass pellet price reduction
Electricity-based methanol4400–46002100–2200Green electricity price, carbon capture costHigh, may become mainstream
Table 2. Related parameters.
ParameterUnitValueData Source
μcCarbon Price Drift Rate (%)0.01726Using China’s carbon market price data (up to 2024), calculate using Formula (4)
σcCarbon Price Volatility (%)0.01419
μ0Crude Oil Price Drift Rate (%)0.0092With reference to Brent crude oil prices over the past 5 years, perform calculations based on a modified version of Formula (4)
σ0Crude Oil Price Volatility (%)0.0252
poilInitial Crude Oil Price (USD/barrel)72Using the 5-year average Brent crude price, converted at the 2024 USD to CNY exchange rate
pcInitial Carbon Price (CNY/ton)92With reference to the average carbon price in China’s carbon market in 2024
qcCarbon Dioxide Reduction (ton)280,000
w1Carbon Dioxide Capture Rate (%)90Wang and Gao, 2025 [41]
w2Proportion of Carbon Dioxide Used for EOR (%)40
ucUnit Carbon Dioxide Capture Cost (CNY/ton)250Zhang, X., Yang, X., Lu, X. et al., 2023 [6]
u E Unit Carbon Dioxide EOR Cost (CNY/ton)349
utUnit Carbon Dioxide Transportation Cost (CNY/(ton·km))1Cai, B. F., Li, Q., Zhang, X. et al., 2021 [42]
IC,0Initial carbon capture unit retrofit cost (CNY 10,000)22,644Yang et al., 2019 [43]
YC,0Initial operating cost for carbon capture system (10,000 CNY/year)377
iThe impact of technological advancements on the retrofit cost of carbon capture units0.021
lThe effect of technological progress on the cost of retrofitting carbon capture equipment0.057
pyUnit EOR incremental subsidy (CNY/barrel)0Set the parameters based on current Chinese policies
αEnhanced the oil recovery rate (%)15Nikolova, C., and Gutierrez, T., 2020 [44]
θGovernment’s Initial Subsidy Coefficient for CCUS (%)0Set the parameters based on current Chinese policies
STransportation distance of tank trucks from the plant to the oil displacement site (kilometers)100
T Investment period for the CCUS project (years)20Tan et al., 2024 [45];
Lin and Tan, 2021 [46]
T L Project operational lifespan (years)30
r Risk-free interest rate (%)6Rubin et al., 2007 [47]
qHHydrogen consumption for methanol production (tons)21,000This parameter is primarily based on the green methanol synthesis unit of the 100,000 tons per year Liquid Sunshine Project in Ordos, Inner Mongolia, China
uHWater and electricity cost per unit of hydrogen produced via water electrolysis (CNY/ton)3526Zhang et al., 2023 [48]
WHEmployee welfare costs for the hydrogen production unit (10,000 CNY/year)1200
IHInvestment cost for the hydrogen synthesis unit (CNY 10,000)81,000Zhang et al., 2023 [48]. The hydrogen production capacity is up to 48,000 m3/h, with an annual hydrogen output of 20,000 tons. Alkaline water electrolysis equipment was selected as the primary hydrogen production technology
YHOperation and maintenance costs of the hydrogen production facility (10,000 CNY/year)1620 Calculate   at   2 %   of   I H
qMMethanol production volume (tons)110,080A standard commercial unit size for methanol plants
pMUnit price of methanol (CNY)4300Zhu et al., 2023 [49]; the price represents a reasonable mid-term expectation and falls within the cost range of CO2 hydrogenation-based methanol production in China
u t M Transportation cost per unit of methanol sold (CNY/ton)145Wang et al., 2024 [50]
IMInvestment cost for the methanol synthesis unit(CNY 10,000)60,000
YMOperation and maintenance costs of the methanol production facility
(10,000 CNY/year)
900Shu et al., 2024 [51]
WMEmployee welfare costs for the methanol synthesis unit
(10,000 CNY/year)
80040 staff, with an annual average salary of CNY 200,000 per person
UMWater and electricity costs for methanol production
(10,000 CNY/year)
11,516.8Power usage: 13,961 kWh/h; water usage: 435 tons/h
Disclaimer/Publisher’s Note: The statements, opinions and data contained in all publications are solely those of the individual author(s) and contributor(s) and not of MDPI and/or the editor(s). MDPI and/or the editor(s) disclaim responsibility for any injury to people or property resulting from any ideas, methods, instructions or products referred to in the content.