Article

Advanced Self-Powered Sensor for Carbon Dioxide Monitoring Utilizing Surface Acoustic Wave (SAW) Technology

1
Mohammed VI Polytechnic University (UM6P), Ben Guerir 43150, Morocco
2
Laboratory of Engineering Sciences for Energy, Chouaib Doukkali University, El Jadida 24000, Morocco
*
Authors to whom correspondence should be addressed.
Energies 2025, 18(12), 3082; https://doi.org/10.3390/en18123082
Submission received: 26 March 2025 / Revised: 30 May 2025 / Accepted: 31 May 2025 / Published: 11 June 2025

Abstract

In the context of autonomous environmental monitoring, this study investigates a surface acoustic wave (SAW) sensor designed for selective carbon dioxide (CO2) detection. The sensor is based on a LiTaO3 piezoelectric substrate with copper interdigital transducers and a polyetherimide (PEI) layer, chosen for its high electromechanical coupling and strong CO2 affinity. Finite element simulations were conducted to analyze the resonance frequency response under varying gas concentrations, film thicknesses, pressures, and temperatures. Results demonstrate a linear and sensitive frequency shift, with detection capability starting from 10 ppm. The sensor’s autonomy is ensured by a piezoelectric energy harvester composed of a cantilever beam structure with an attached seismic mass, where mechanical vibrations induce stress in a piezoelectric layer (PZT-5H or PVDF), generating electrical energy via the direct piezoelectric effect. Analytical and numerical analyses were performed to evaluate the influence of excitation frequency, material properties, and optimal load on power output. This integrated configuration offers a compact and energy-independent solution for real-time CO2 monitoring in low-power or inaccessible environments.

1. Introduction

In recent years, the development of autonomous [1], energy-efficient devices has gained increasing importance [2], particularly in the context of environmental monitoring, wearable electronics [3], and wireless sensor networks. These systems often operate in remote or hard-to-access locations [4], where reliance on traditional power sources is impractical [5]. Consequently, harvesting ambient energy and integrating smart sensing technologies into a single platform has emerged as a promising strategy for powering low-consumption devices without the need for external batteries [6].
Ambient energy is present in various forms [7], light, heat, vibrations, and electromagnetic radiation [8], all of which can be converted into electrical energy through suitable transduction mechanisms [9]. Among them, vibrational energy stands out for its availability in many practical environments [10], from human motion to structural vibrations in industrial machinery. Piezoelectric materials, capable of converting mechanical stress into electrical charge, have shown great promise in this regard [11,12]. Their inherent electromechanical coupling not only enables energy harvesting but also offers the possibility of sensing applications [13], thus making them attractive candidates for multifunctional systems.
In parallel, gas detection technologies have evolved significantly, particularly for applications requiring sensitivity, selectivity, and low power consumption [14]. Common approaches include metal oxide semiconductor (MOS) sensors, electrochemical cells, optical absorption methods, and capacitive-based sensors [15]. While each method has its strengths, challenges remain regarding their long-term stability, miniaturization potential, and compatibility with autonomous systems [16]. In this context, surface acoustic wave (SAW) sensors have attracted considerable attention due to their high sensitivity to surface perturbations, fast response times, and compatibility with wireless and battery-free operation [17].
Surface acoustic wave (SAW) sensors, for instance, have been widely used for detecting toxic gases [18,19] and biological agents in liquids [20,21]. Over the past two decades, SAW-based biosensors including horizontally polarized shear waves (SH-SAW), Love wave sensors [22,23], and Rayleigh wave sensors [21,24] have been extensively studied. These high-frequency (100 MHz–1GHz) mass-sensitive devices employ interdigital transducers (IDTs) to confine acoustic energy near the surface of piezoelectric substrates [25].
While traditional SAW resonators have demonstrated remarkable sensitivity in gas sensing applications, their reliance on high-Q resonant structures (requiring hundreds of electrode pairs, e.g., N > 342 for LiTaO3 YX-cut [26]) introduces inherent trade-offs in energy efficiency and fabrication complexity. Recent studies highlight that such systems typically demand stable high-voltage excitation (15–20 V) to sustain sharp resonance peaks, limiting their compatibility with energy-constrained environments [27]. For instance, Wang et al. (2023) demonstrated that resonant SAW gas sensors consume >25 mW, rendering them impractical for battery-free IoT applications [28].
In contrast, simplified SAW architectures ( N > 40 electrodes) coupled with low-voltage piezoelectric microgenerators have emerged as a viable alternative. As shown by Chen et al. (2022), reducing the number of IDT electrodes to N < 100 decreases ohmic losses by 60% compared to conventional designs, without compromising sensitivity in CO2 detection [29]. This aligns with the electromechanical advantages of LiTaO3 ( k 2 5 % ), which enables efficient SAW generation even at reduced voltages [30]. Furthermore, the CO2-selective adsorption of polyetherimide (PEI) layers, as validated by Zhang et al. (2023), allows direct modulation of SAW velocity via analyte interaction, eliminating the need for complex impedance-matching circuits [31].
Quantitative advancements in such architectures are notable. For example, Gupta et al. (2024) reported a 92% reduction in energy consumption (from 25 mW to 2 mW) in SAW-based CO2 sensors using similar low-voltage strategies, achieving detection limits of 10 ppm [32]. These gains stem from synergies between energy harvesting and sensing: piezoelectric microgenerators, as optimized by Lee et al. (2023), directly power IDTs, bypassing energy-intensive RF sources [33].
This paradigm shift aligns with IoT standards emphasizing simplicity, ultra-low power operation, and scalable fabrication [34]. By decoupling sensitivity from strict resonance conditions, recent work bridges the gap between high-performance SAW sensing and sustainable autonomous operation, as demonstrated in field deployments by Rahman et al. (2024) [35].
SAW sensors for chemical and biological detection [36] rely on interactions between the transducer layer and target analytes, converting these into measurable mechanical or electrical responses.
As noted by Hoummady et al. (1997) [37], Assuming that v represents the SAW velocity in the substrate and is a function of multiple physical and environmental parameters such as mass (m), electrical properties (E) such as conductivity, mechanical properties ( M i ) such as modulus of elasticity and viscosity, and environment ( e v ) including temperature, pressure and humidity. Furthermore, if dv represents the change or perturbation in wave velocity, following the chain rule [38] d v can be expressed as follows:
d v = ( v m · d m + v E · d E + v M i · d M i + v e v · d e v )
Several studies [39,40,41] have demonstrated the effectiveness and sensitivity of CO2 absorbers, particularly those based on polyetherimide (PEI), in complex environments. In this study, a SAW sensor is developed using an innovative combination of materials: lithium tantalate (LiTaO3) as the piezoelectric substrate and polyetherimide (PEI) as the CO2-absorbing layer. This pairing is particularly novel; LiTaO3 offers a higher electromechanical coupling coefficient than quartz, enhancing sensitivity, while PEI has demonstrated strong affinity and selectivity for CO2 under a range of environmental conditions. The use of copper interdigitated transducers (IDTs) further contributes to cost-effective fabrication without compromising performance.
This work proposes a dual-function platform that combines piezoelectric energy harvesting with SAW-based CO2 detection. The approach is built upon two main components. First, a piezoelectric energy harvester is modeled and analyzed using both analytical and numerical methods to determine the optimal material and configuration for converting mechanical energy into electrical power. A comparative study between PZT-5H ceramic and PVDF polymer is carried out. Second, the study focuses on the simulation and performance analysis of the PEI/Cu/LiTaO3 SAW microsensor. Finite element simulations are employed to investigate how the sensor’s resonance behavior varies with CO2 concentration, ambient pressure, temperature, and absorber layer thickness. The sensor demonstrates excellent linearity in frequency shift responses across a broad range of concentrations, with a sensitivity down to 10 ppm. These findings highlight the sensor’s potential for low-level CO2 detection in autonomous environmental monitoring applications.
The novelty of this study lies not only in the integration of energy harvesting and gas sensing functions into a single self-powered system but also in the use of LiTaO3 and PEI within the SAW sensor structure, a combination that offers both enhanced electromechanical performance and specific chemical affinity to CO2. The study findings contribute to the advancement of next-generation wireless sensing systems that are energy-autonomous, compact, and capable of operation in diverse and demanding environments.

2. CO2 Detection System: Functioning Principle and Governing Equations

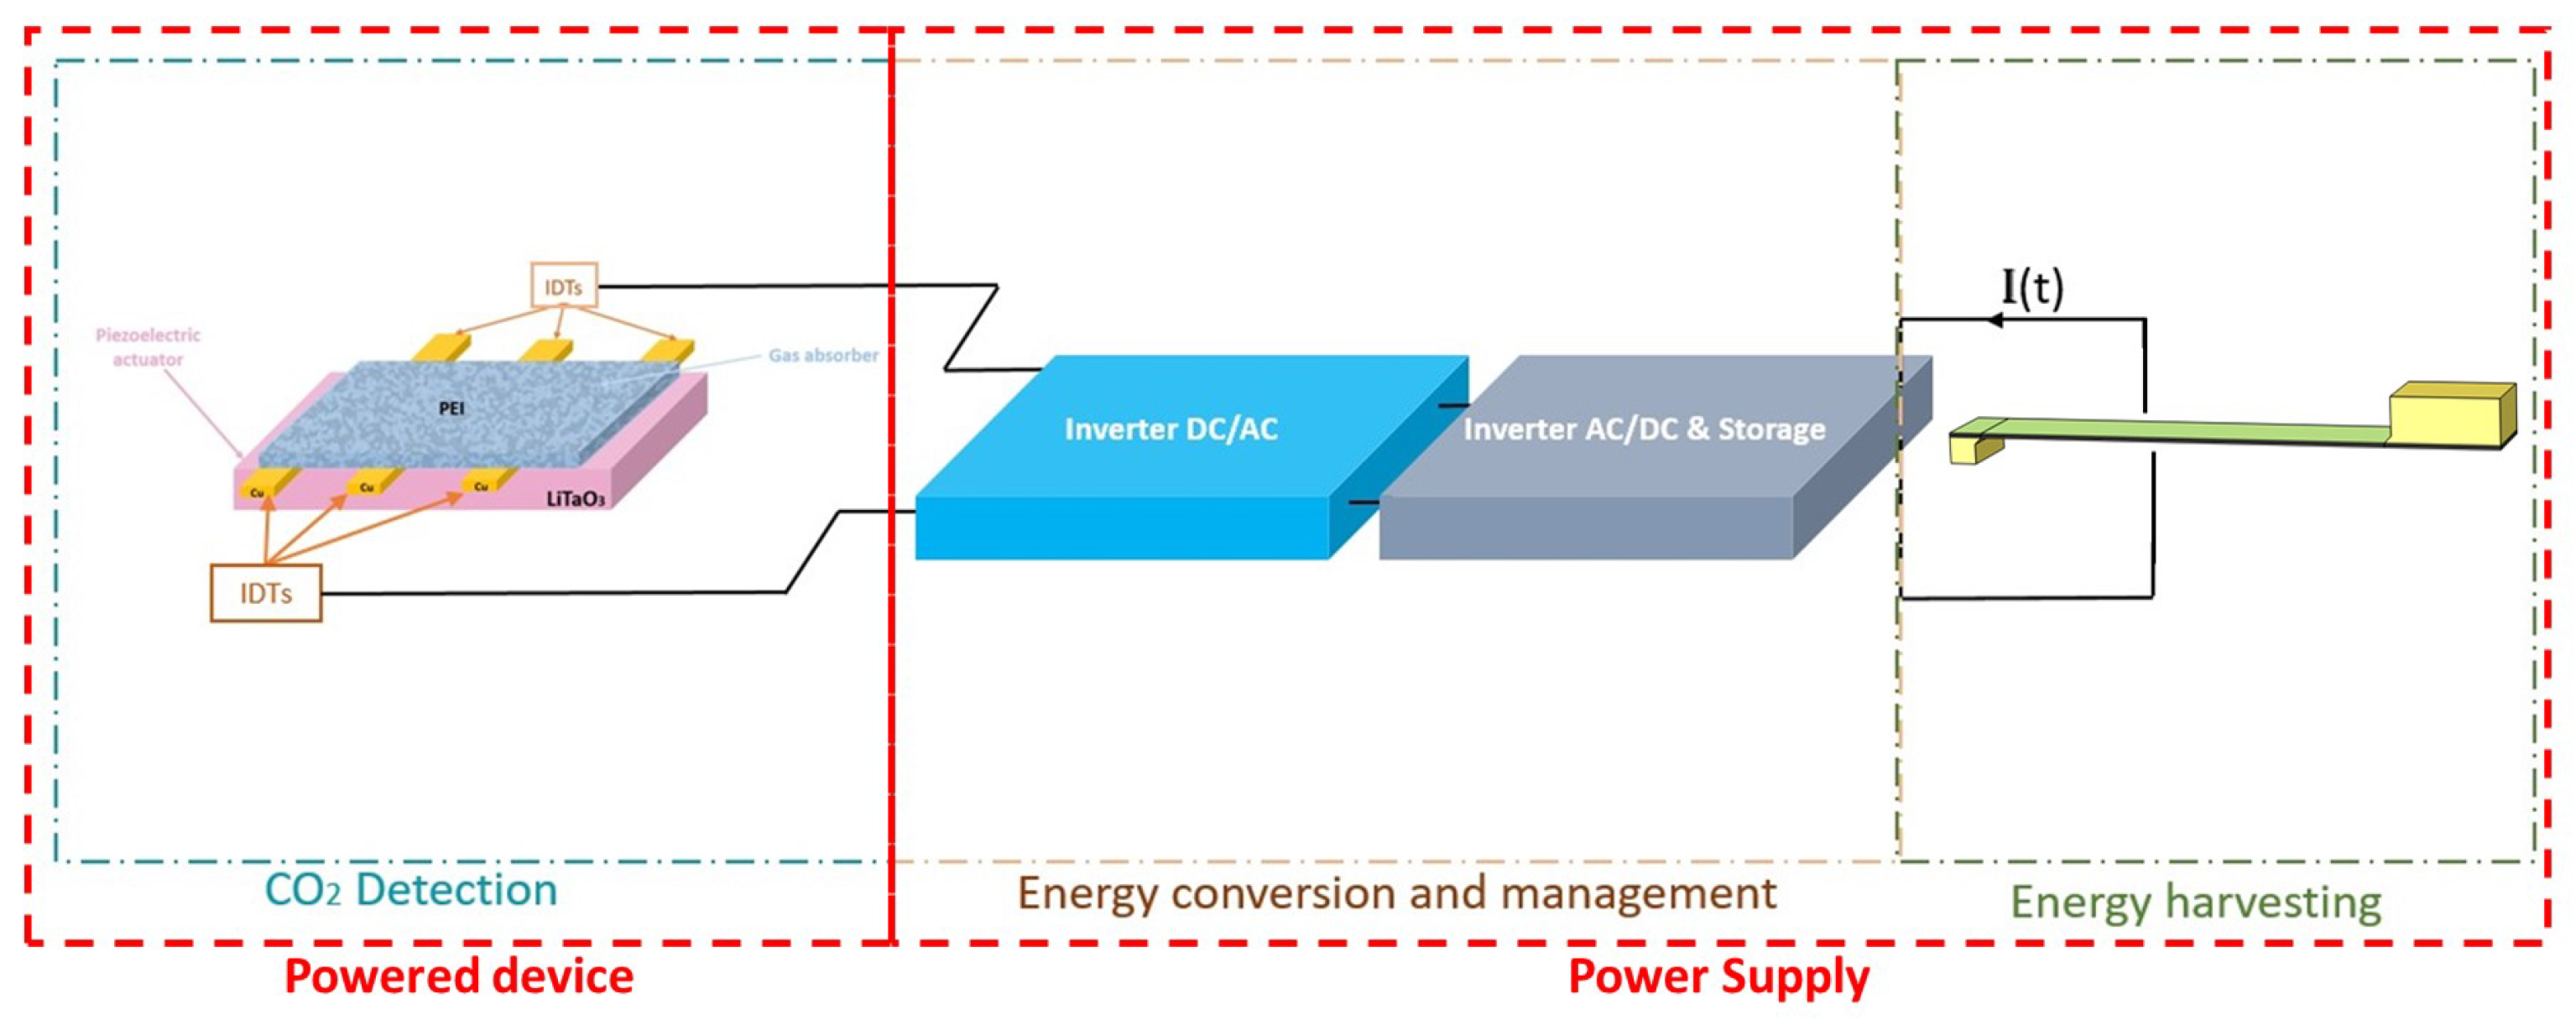
2.1. System Description

The operation of the self-powered CO2 sensor relies on two essential components. First, the power supply is provided by a piezoelectric microgenerator (Figure 1). This system employs a flexible beam-shaped mechanical structure (Figure 2), equipped with a mass at its free end. Under the influence of ambient vibrations, inertial forces amplify the beam’s oscillations, generating mechanical energy [42]. This energy is converted into electricity via the direct piezoelectric effect: structural deformations stress a piezoelectric material, producing an alternating current [43]. To store this energy, a rectifier bridge or an AC/DC conversion circuit is essential. Recent studies highlight the efficiency of SSHI (Synchronized Switch Harvesting on Inductor) and DSSH (Double Synchronized Switch Harvesting) circuits [44,45], optimized for variable-frequency environments. These microgenerators achieve power outputs ranging from 1 µW to 10 mW, sufficient to power low-consumption devices [46,47].
The generation of high-frequency AC signals from harvested DC energy to excite SAW devices has been thoroughly investigated in the literature. Detailed oscillator architectures, including Colpitts-based and PLL-based designs, optimized for wireless SAW excitation, have been proposed by Scholl et al. (2002) [48], Lin et al. (2017) [49], and Ghosh et al. (2011) [50]. These works confirm the technical feasibility and maturity of DC-AC conversion methods adapted for SAW-based autonomous sensing platforms.
In SAW-based sensing systems, the resonance frequency is sensitive to physical variations in the SAW device caused by environmental parameters such as pressure, temperature, or gas concentration. These perturbations induce a frequency shift Δ f proportional to the measured quantity (Caldero and Zoeke, 2018 [51]; Xi et al., 2024 [52]). To ensure continuous tracking of the resonance, Phase-Locked Loops (PLLs) or Voltage-Controlled Oscillators (VCOs) are employed to dynamically adjust the excitation frequency (Lin et al., 2017 [49]). The resulting frequency shift is then extracted using frequency detection circuits and processed by low-power microcontrollers to generate digital outputs, enabling autonomous SAW-based sensing (Liu et al., 2017 [53]).
Second, CO2 detection is achieved using a Surface Acoustic Wave (SAW) sensor. These acoustic wave-based devices are distinguished by their ultra-low power consumption. They operate at high frequencies (100 MHz–1 GHz) through interdigital transducers (IDTs) patterned on a piezoelectric substrate. These transducers confine acoustic energy near the surface, where a functionalized adsorbent layer interacts with target gas molecules. When CO2 is present, adsorption locally alters the mass or stiffness of the layer, perturbing the acoustic wave propagation. This perturbation generates a measurable variation (frequency shift or signal attenuation), directly correlated with gas concentration, achieving sensitivities down to a few ppm.
By combining these two components, the autonomous system ensures both ambient energy harvesting and precise CO2 detection, eliminating reliance on external power sources. The piezoelectric substrates thus play a dual role:
  • Power generation: Harvesting mechanical energy from vibrations to electrically sustain the system.
  • Sensing platform: Serving as an active substrate for chemical-to-electrical signal transduction via SAW perturbation.
This integrated architecture enables a fully self-sufficient solution for environmental monitoring, combining renewable energy autonomy with high-sensitivity gas detection.

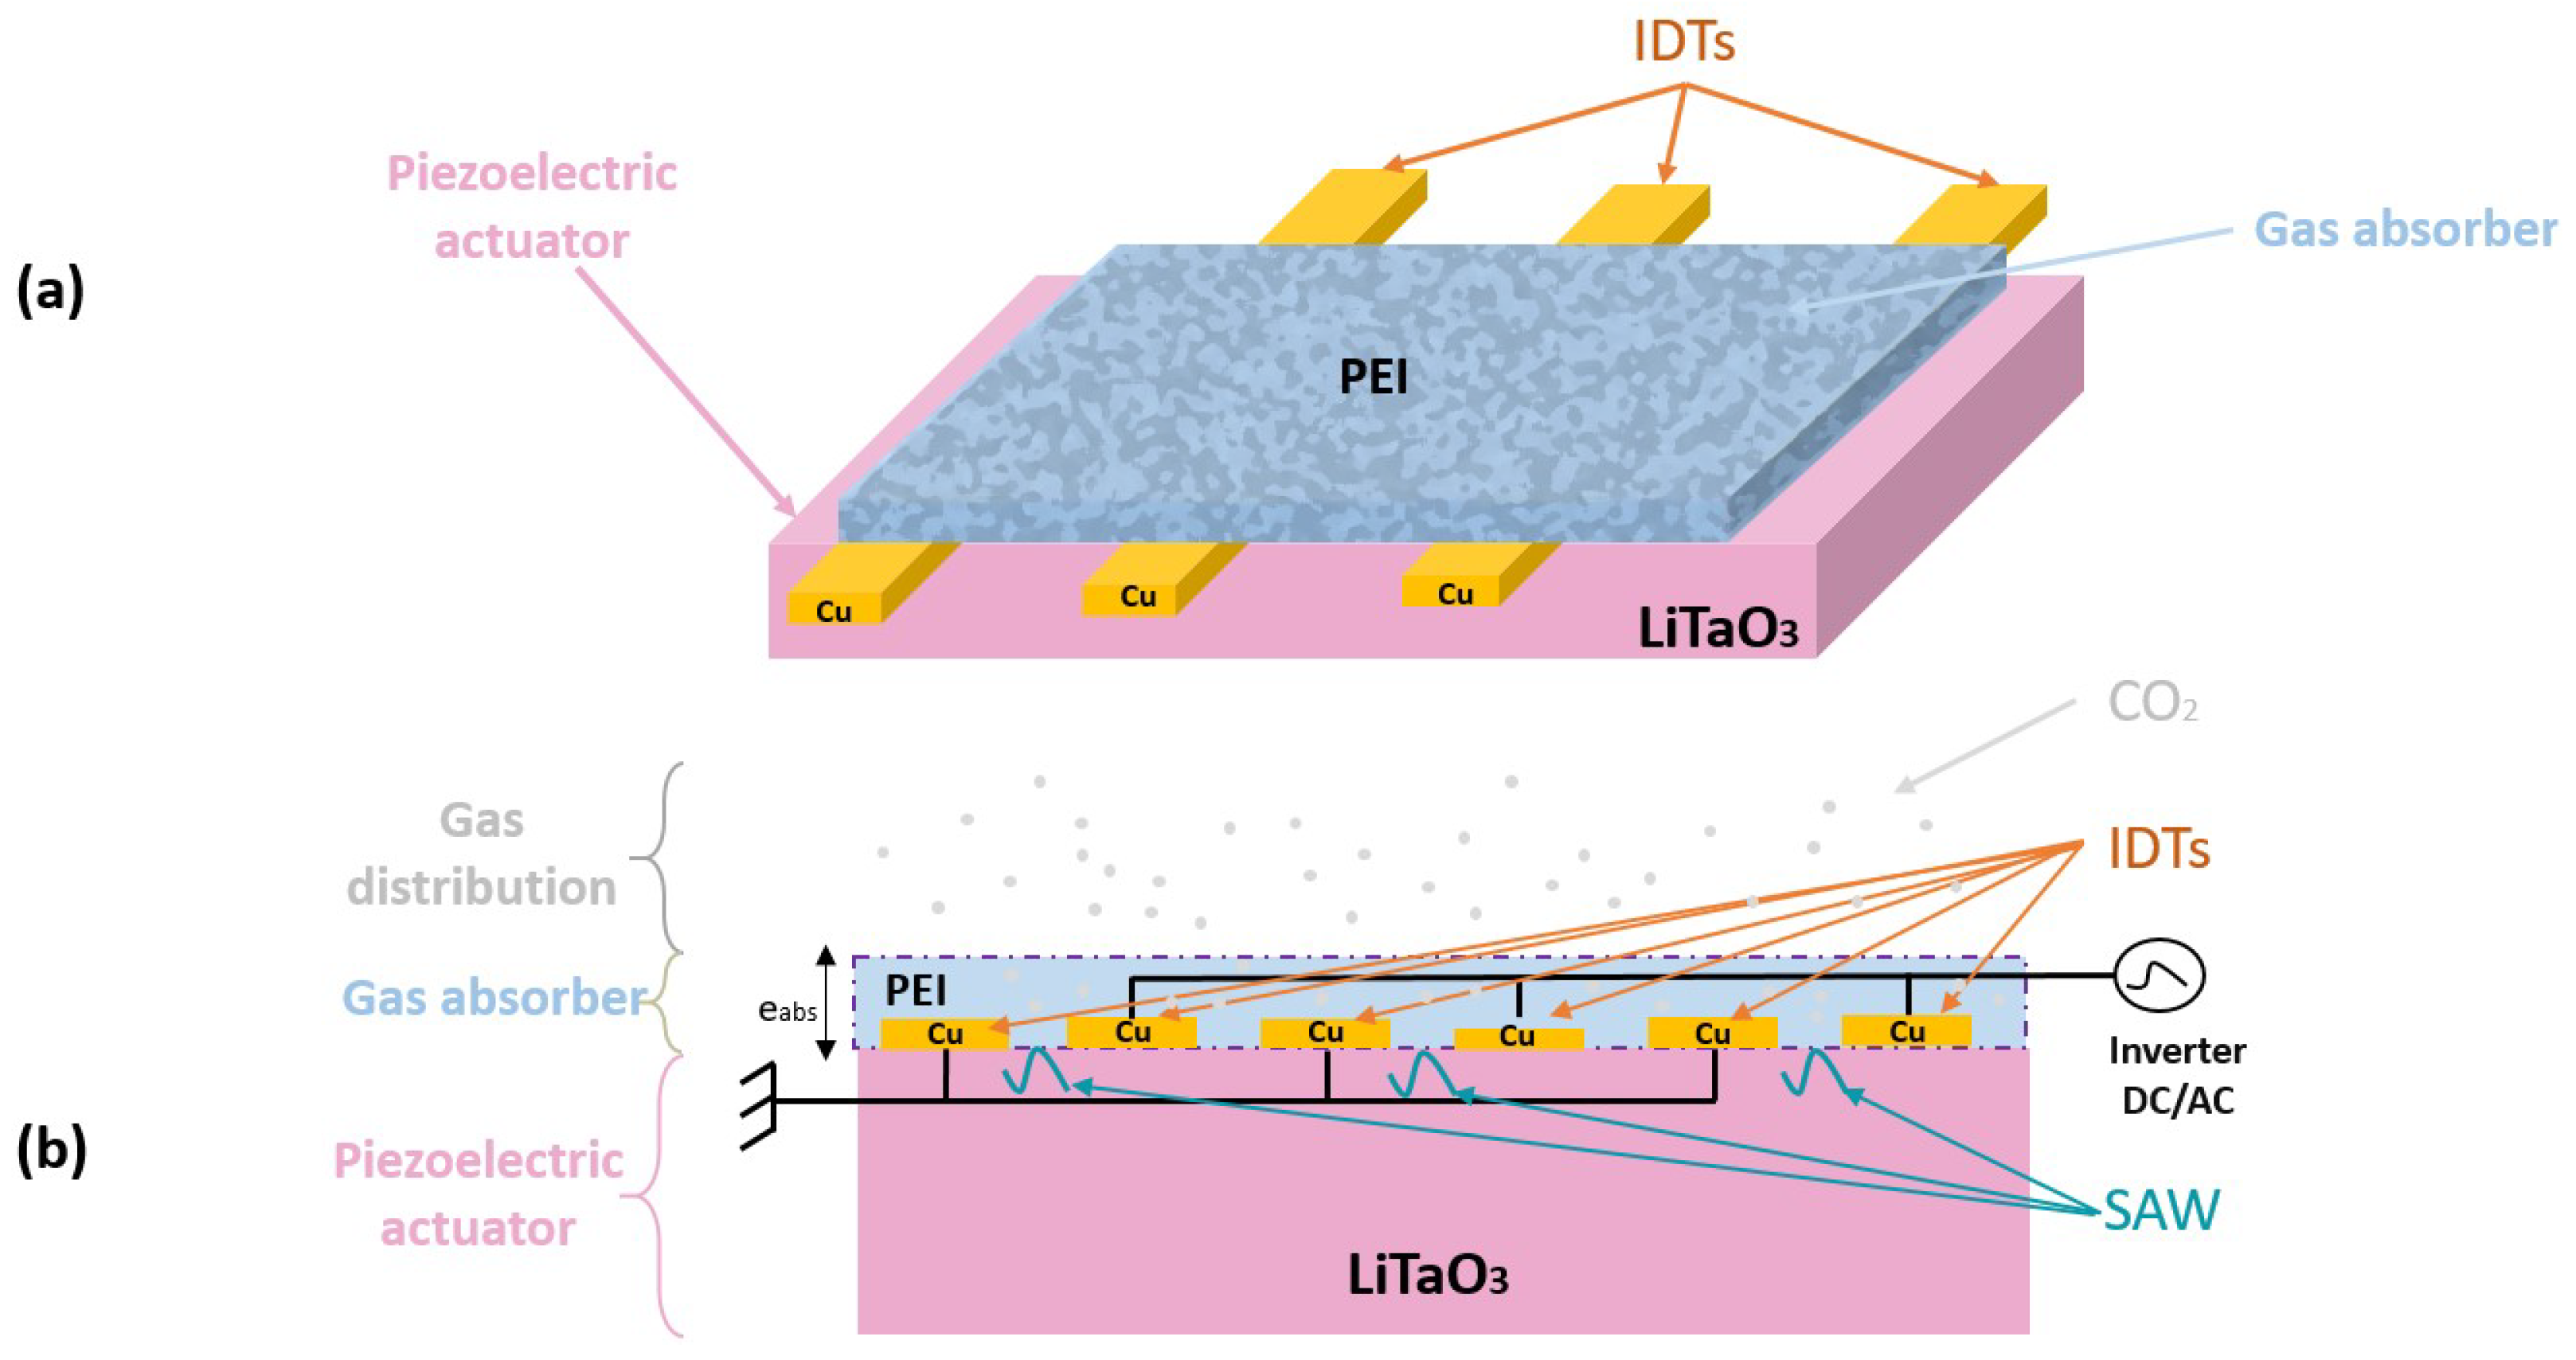
2.2. Functioning Principle

The LiTaO3 piezoelectric substrate (Figure 2) forms the active foundation of the entire device. This crystalline material is meticulously selected for its exceptional piezoelectric properties and low surface acoustic wave attenuation. When an electric voltage is applied, it generates Surface Acoustic Waves (SAWs) propagating at high frequencies, typically ranging from 100 MHz to several GHz. The crystallographic orientation of LiTaO3, particularly the Y-X cut (Figure 2b), is optimized to enhance transduction efficiency and surface interaction sensitivity, ensuring precise responsiveness to external stimuli.
CO2 detection relies on the use of surface acoustic waves (SAWs), generated and detected by interdigital transducers (IDTs) (Figure 2a), fabricated from copper and patterned on the substrate surface. These periodic metallic electrodes fulfill a dual role:
  • Transmission: Conversion of an electrical signal into a mechanical acoustic wave.
  • Reception: Transformation of wave perturbations (amplitude, velocity, or frequency variations) into a measurable electrical signal, as illustrated in Figure 2b.
The SAW device modeled in this study is based on a simple interdigitated transducer (IDT) structure a lithium tantalate (LiTaO3) substrate, without additional Bragg reflector gratings. The IDTs are designed to generate Rayleigh-type surface acoustic waves, exploiting the substrate’s optimal piezoelectric properties in the 800 MHz–1 GHz range. The wavelength ( λ ) was set to 4 μm, targeting a resonance frequency around 850 MHz according to the relation v R a y l e i g h = f × λ , with v R a y l e i g h = 3400 m/s for (LiTaO3). Each electrode pair was performed with an aperture width of 100 μm, and the structure includes more than 40 electrode pairs to ensure stable resonance. Copper (Cu) was chosen as the electrode material, with a thickness of 300 nm, to combine high conductivity and manufacturability. This IDT-only configuration generates a pseudo-resonant behavior through constructive interference of emitted surface waves.
The sensor’s performance is critically dependent on the IDT geometry particularly the number of fingers and their spacing which defines the device’s central frequency (e.g., 433 MHz) and operational bandwidth. This design flexibility enables precise tuning for target-specific gas detection applications.
To render the sensor selective to CO2, a thin adsorbent layer of polyethylenimine (PEI) is deposited on a specific substrate region or between the IDTs (Figure 2). This polymer, rich in amine groups (-NH2), selectively interacts with CO2 molecules (gas distribution illustrated in Figure 2b). Adsorption occurs primarily via:
  • Hydrogen bonding between -NH2 groups and CO2.
  • Acid-base reactions, forming carbamate complexes (-NHCOO).
This chemical interaction locally alters the surface’s mass or stiffness, perturbing the acoustic wave propagation. The resulting perturbation manifests as a measurable frequency shift or signal attenuation, directly correlated with gas concentration, achieving sensitivities as low as a few parts per million (ppm).

2.3. CO2 Detection Mechanism

When a high-frequency electrical signal is applied to the IDTs, it induces periodic deformation of the LiTaO3 substrate, generating a surface acoustic wave (SAW). This wave propagates along the substrate surface with a velocity (v) and frequency (f) determined by the material’s mechanical properties and the IDT geometry.
In the presence of CO2, gas molecules bind to the amine groups of the PEI layer via the reaction:
2 NH 2 + CO 2 > NHCOO + NH 3 +
This adsorption alters the surface’s effective mass and stiffness, perturbing the SAW propagation. The resulting frequency shift ( Δ f ) or phase change is proportional to the CO2 concentration, enabling quantitative detection with sub-ppm resolution. The amount of CO2 adsorbed depends directly on its concentration in the environment. The additional mass ( δ m ) and changes in stiffness alter the propagation of the SAW. According to the mass effect, the wave velocity ( v ) decreases proportionally to ( δ m ) , following the relation:
δ v v = k · δ m
where k is a constant dependent on the substrate and frequency. This perturbation results in a measurable frequency shift ( δ f ) between the emitting and receiving IDTs.
The receiving IDTs convert acoustic disturbances into a modified electrical signal. An electronic system analyzes ( δ f ) , which is linearly correlated with the CO2 concentration. For example, a 1 kHz shift could correspond to a 10 ppm increase in CO2.

2.4. Governing Equations

To examine the response of a piezoelectric material subjected to mechanical stress, the system of Equation (1) is used, where S, T, E, and D are, respectively, the strain tensor, stress tensor, electric field, and electric displacement:
S = s E · P + d t · E D = d · P + ε P · E
In dynamic mode, the fluctuation of the strain tensor and the electric displacement over time is expressed as follows:
S t = s E · P t + d t · E t D t = d · P t + ε P · E t
The electrical balance between external free charges and internal bound charges in an open circuit can be expressed by the following equation:
σ E c + D p ( t ) t = j 0 = c t e
where E c is Electric field created by fixed charges, D p is the electric displacement vector.
This balance is possible only if j 0 = 0 , resulting in a new expression for the induced current.
w p l a t e · L ( d · P t ) = ( V T ( t ) R p + C p · V T ( t ) t )
where w p l a t e is the width, L is the length, Rp and Cp are respectively the equivalent resistance and capacitance of the piezoelectric material.
Which is equivalent to:
i p ( t ) = i R p ( t ) + i C p ( t )
Equations (5) and (6) shows that in transient regime, a piezoelectric material is equivalent to a current source in parallel with a resistance noted R p and a capacitance noted C p .
The power harvested at the terminals of a purely ohmic resistor, noted R, is expressed as follows:
P p i e z o ( t ) = R · ( R p 2 ( R + R p ) 2 + ( C p · ω · R · R p ) 2 ) · i p 2 ( t )
where ω = 2 π · f is the pulsation
The maximum recovered power is given by:
P p ( t ) R = 0
The system of equations given by (1)–(7) allows us to find the optimal electrical resistance.
Since C p · ω · R p > > > 1
R o p t = 1 C p · ω
This expression shows that the optimal resistance is inversely proportional to the mechanical pulsation.
The optimal piezoelectric power recovered by the generator is expressed in terms of geometric, physical parameters, and the rate of variation of mechanical stress, as given by the following equation:
P o p t ( t ) = 1 2 · 1 C p · ω · ( ( w p l a t e · L ) · d · P ( t ) t ) 2

3. Numerical Study

This section details the numerical modeling of the two coupled systems: the piezoelectric harvester designed to convert mechanical vibrations into electrical energy, and the SAW CO2 sensor powered by this harvested energy. The study verifies that the generated voltage meets the sensor’s operating needs, then evaluates the sensor’s response under varying gas and temperature conditions.

3.1. Numerical Modeling of the Piezoelectric Generator

The energy harvesting system illustrated in Figure 3 was analyzed using finite element modeling (FEA). The purpose of this simulation was to evaluate the electromechanical behavior of a piezoelectric energy harvester based on a cantilever beam subjected to sinusoidal mechanical excitation.
A complete 3D model of the energy harvester was developed using simulation software to predict the interactions between the geometry of the generator, the intensity and frequency of mechanical vibrations, and the output characteristics described in Equation (11). Additionally, the simulation was used to evaluate and compare the properties of two piezoelectric materials in order to optimize energy harvesting from mechanical vibrations.
The model incorporates three physical interfaces solid mechanics, electrostatics, and an external electrical circuit to reflect the coupled response of the device fields. The geometry consists of a steel substrate partially covered with two layers of piezoelectric material. As shown in Table 1, the geometric parameters remain constant throughout the study. One end of the structure is clamped, while the other end is free and connected to a moving load applying a harmonic force P ( t ) . The induced voltage V ( t ) is extracted from the internal electrodes, while the ground electrodes are placed on the outer surfaces, enabling differential charge collection across the piezoelectric layers.
The generator depicted in Figure 3a consists of two piezoelectric plates mounted on a beam with a steel tip, where one end is fixed and the other is in contact with a vibrating source P ( t ) , thereby inducing sinusoidal mechanical fluctuations.
To collect the electric charges induced by deformation, two output electrodes are embedded inside the structure, and two ground electrodes are placed on the outer surfaces of the beam. This configuration ensures that the same voltage is induced on the output electrodes, even though the stresses above and below the neutral axis are of opposite sign.
Finally, to complete the FEA analysis, a mesh composed of extremely fine free triangles was used, as illustrated in Figure 3b.

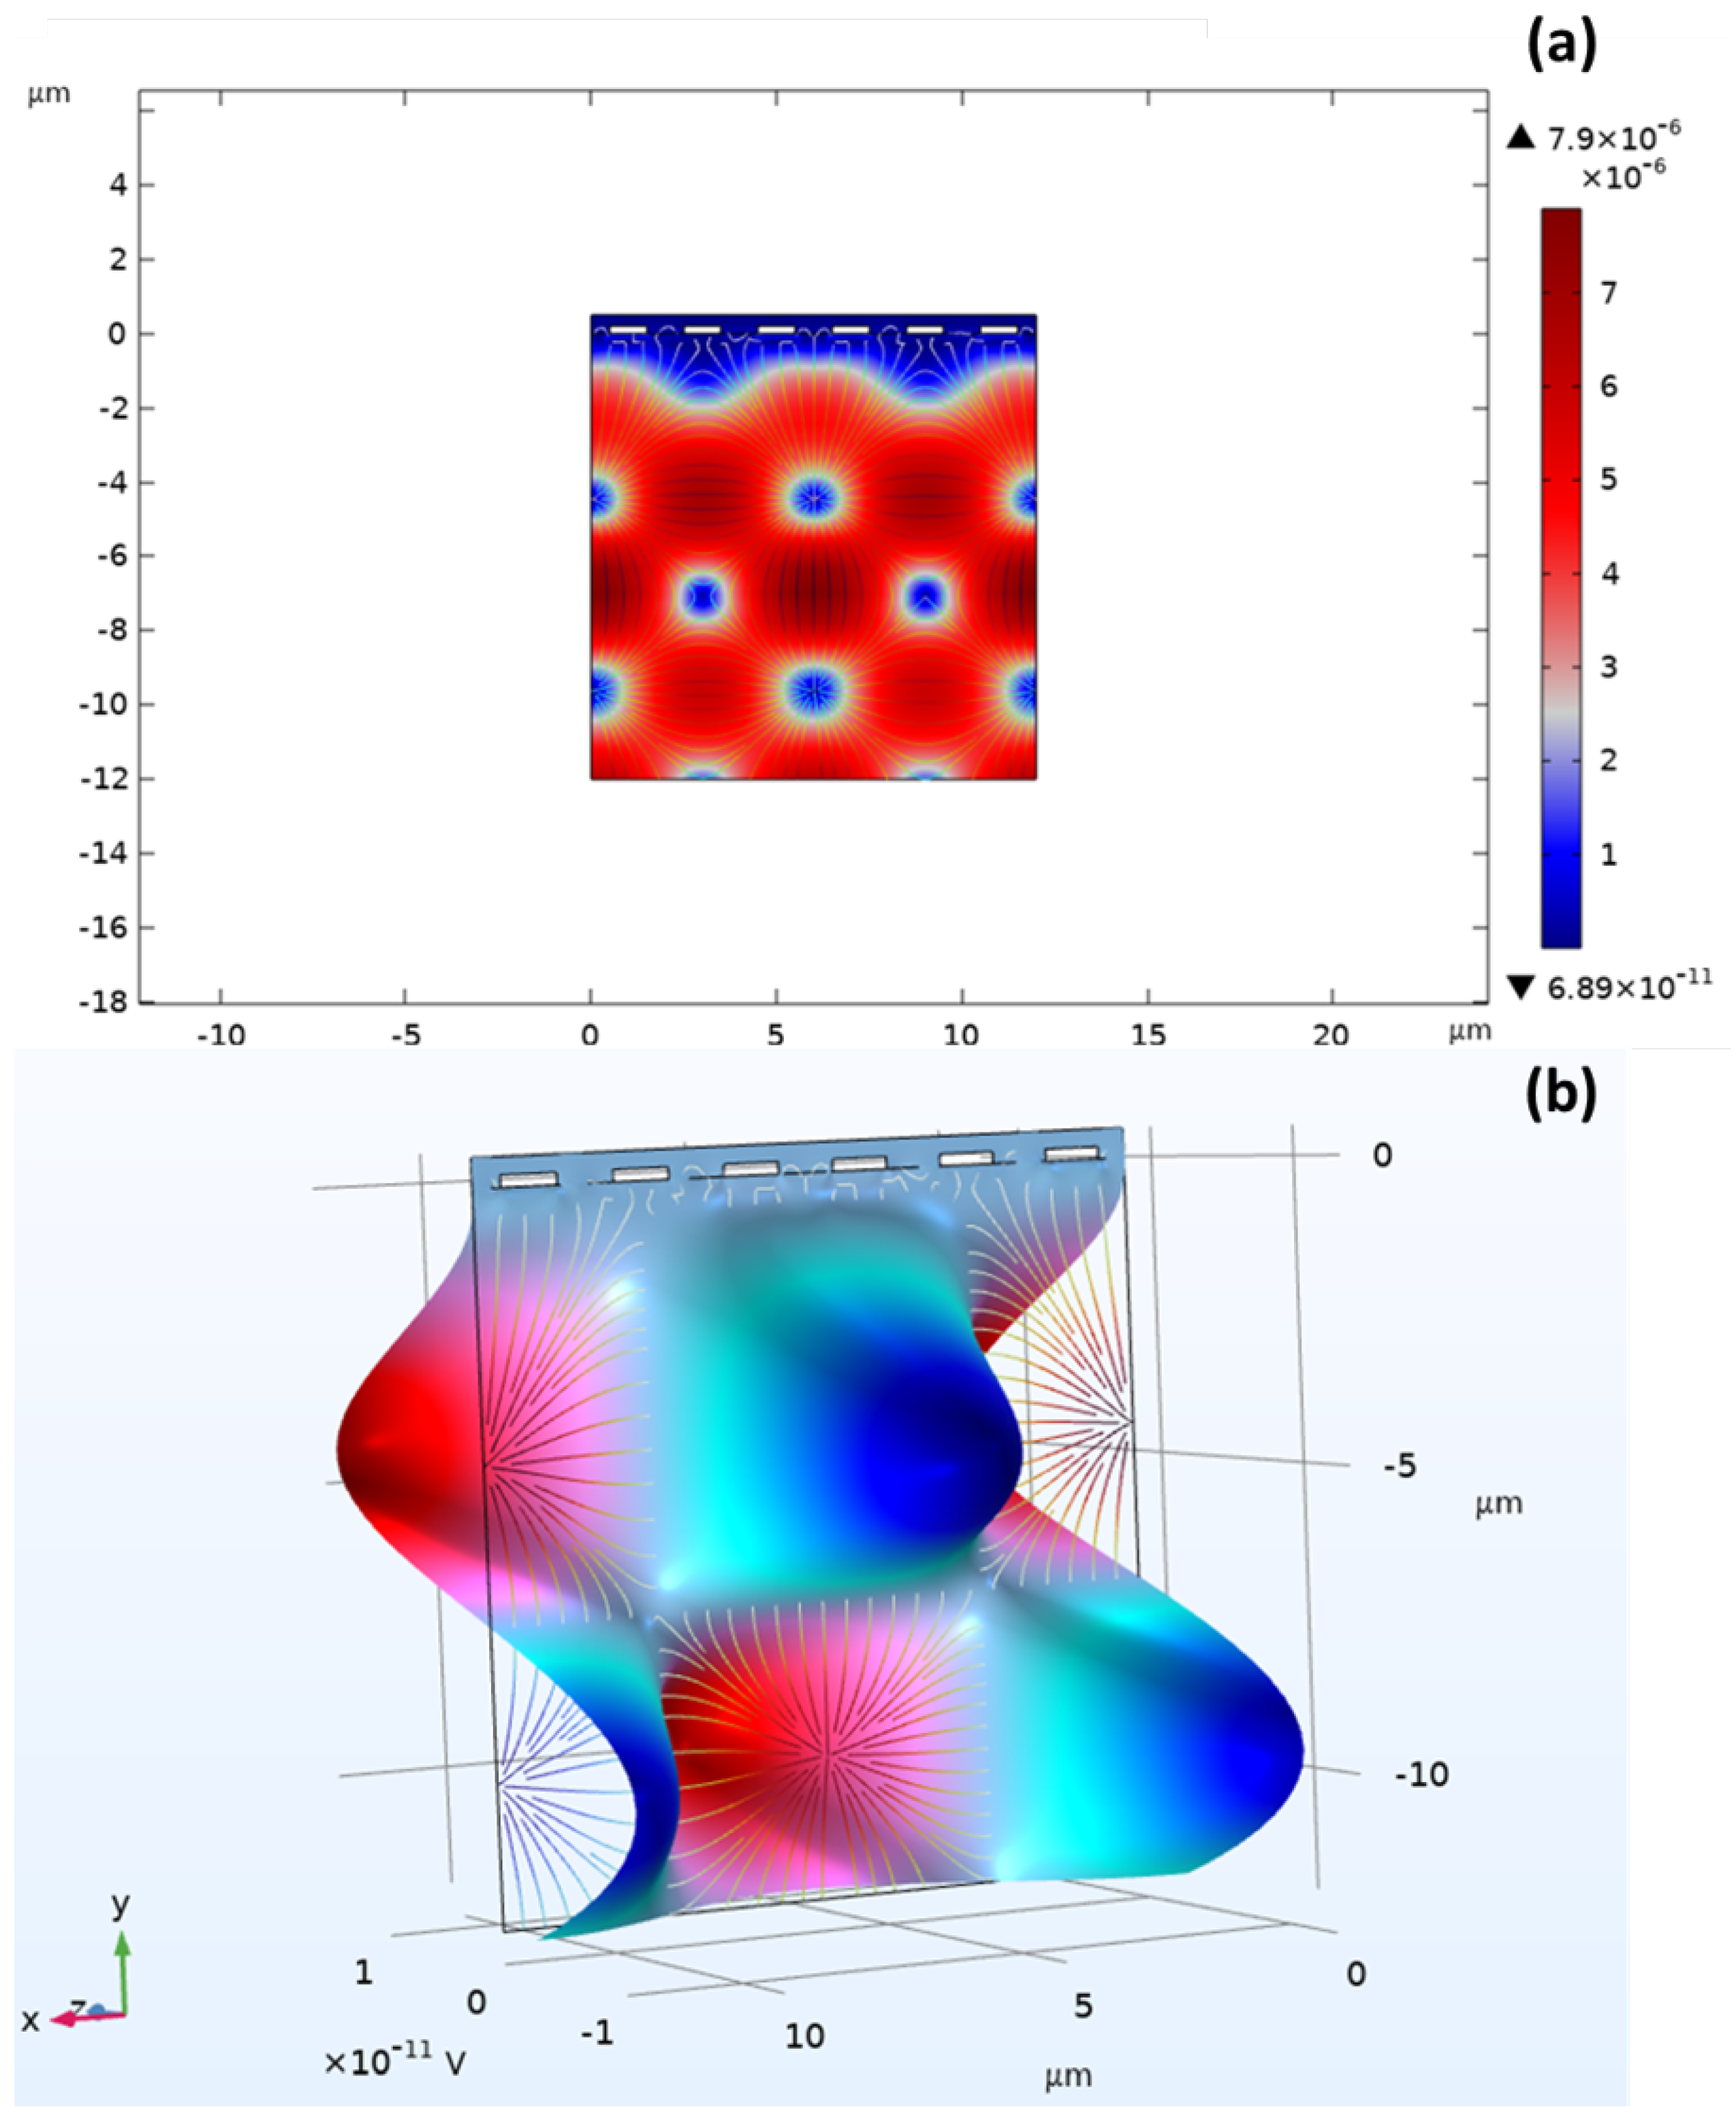
3.2. Numerical Modeling of the SAW CO2 Sensor

A two-dimensional finite element model of the SAW sensor structure (PEI/Cu/LiTaO3), shown in Figure 2b, was developed to investigate its electromechanical behavior. The model includes a CO2-sensitive polyetherimide (PEI) layer, copper interdigitated transducers (IDTs), and a LiTaO3 piezoelectric substrate. The study focuses on the sensor’s intrinsic resonance frequency and how it varies with temperature, pressure, and PEI thickness. Simulations were conducted using multiphysics software, coupling solid mechanics, electrostatics, and piezoelectric interfaces to compute eigenfrequencies via finite element analysis [54,55,56,57,58,59,60].

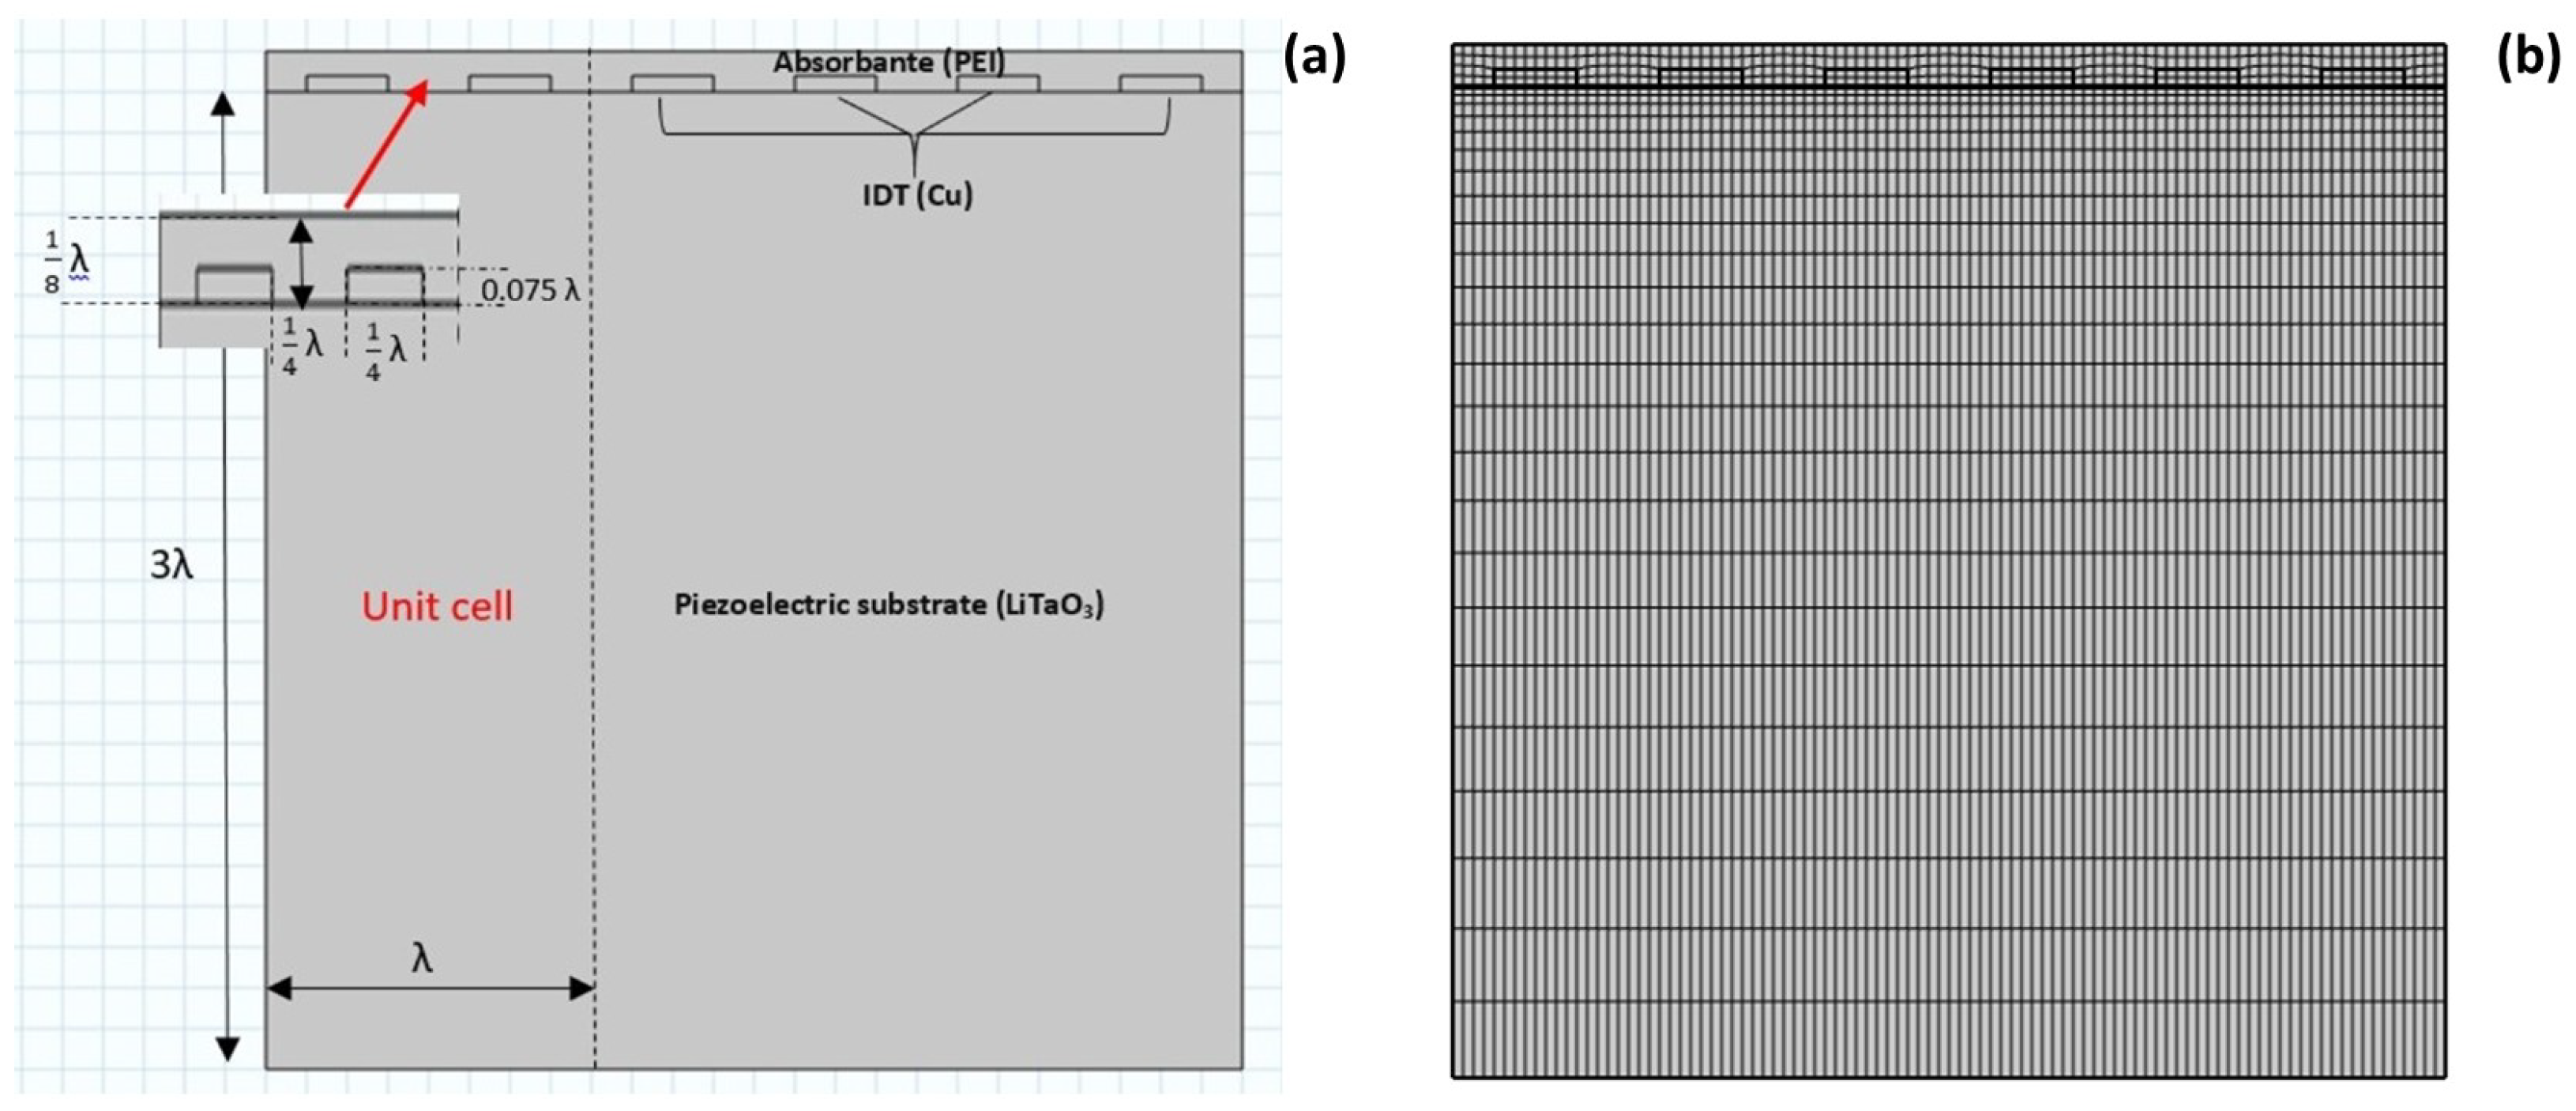
3.2.1. Geometry and Dimension

The geometry used for simulation corresponds to the 2D cross-section of the SAW device shown in Figure 2b and Figure 3a. The structure includes:
  • PEI gas-absorbing film on top.
  • Copper (Cu) IDTs positioned periodically on the piezoelectric surface.
  • LiTaO3 substrate supporting the acoustic wave propagation.
The model consists of three IDT unit cells with a pitch length ( λ ) of 4 μm and an overall domain width of 3 λ . The IDT fingers were modeled as alternating electrodes with a thickness of 0.075 λ , which reflects realistic lithographic fabrication dimensions. The thickness of the PEI layer varies between 300 nm and 900 nm to evaluate the sensitivity as a function of absorber thickness. The total height of the domain extends to three wavelengths to account for the decay depth of Rayleigh waves in the piezoelectric substrate.
We decided to design the geometry of the device in Figure 4a such that the typical resonance frequency ( f r ) of the Rayleigh waves of the device lies in the range of 800 MHz to a few GHz for the resonator. Consequently, the initial velocity of the Rayleigh waves, denoted as v r a y = 3400 m·s−1, as well as the wavelength ( λ ) of 4 μm, are kept constant thereafter. As for the thickness of the PEI film (absorbing carbon dioxide), it varies in a range from 300 to 900 nm, as we will see later.

3.2.2. Boundary Conditions and Meshing

To define the model, structural and electrical boundary conditions are applied. We observe that the surface wave decays to a depth of three wavelengths from the surface, and the lower boundary of the 2D model is fixed. This results in zero structural displacement but does not significantly contribute to the reflection from the lower boundary to the bulk of the piezoelectric substrate, as long as we are observing surface waves, particularly Rayleigh waves.
For each unit cell (Figure 4a), the electrodes have a much higher electrical conductivity than that of the PEI (polymer) and LiTaO3 (dielectric). Therefore, we can expect each of the electrodes to be equipotential. Hence, we can simply use boundary conditions on all outer boundaries of each electrode to indicate in which equipotential state it lies. The left boundaries of the unit cells are set to electrical ground, while the right boundaries of each unit cell are assigned to a floating potential such that the accumulation of electrical charge is zero. This combination of electrical boundary conditions corresponds to a circuit configuration, typically suitable for sensing applications. Similarly, the use of periodic boundary conditions ensures that the electrical potential and displacements are the same along the two vertical boundaries of the 2D model (see Figure 4a).
Additionally, the mesh shown in Figure 4b on the left vertical boundaries of the unit cell and the right vertical boundaries of the unit cell is identical. Finally, the other ends remain at standard conditions. A mapped mesh, shown in Figure 4b, was used for better control over element sizing and alignment. The element size was kept below λ 10 to ensure resolution of the Rayleigh wave modes and avoid numerical dispersion. Mesh refinement was particularly enforced near the electrode and PEI boundaries, where large gradients in stress and electric potential are expected.

3.2.3. Resonance Frequencies

For the SAW sensor, resonance frequency defines the specific frequency at which Rayleigh waves propagate with highest efficiency. When CO2 is absorbed into the sensing layer, it changes the mass and stiffness of the surface, shifting the resonance. Tracking this shift enables accurate gas detection. Both systems rely on precise resonance tuning to ensure efficient energy conversion and sensing performance.
The SAW velocity is an important measurable parameter for determining the resonance frequency [61]. Applying an electrical voltage to the ends of the IDT generates a mechanical stress due to the inverse piezoelectric effect, thus producing a mechanical wave on the surface of the SAW gas sensor. This relationship is described by an equation that combines of the velocity of the acoustic wave (v r a y ) with the resonance frequency ( f r ) and the width of the unit cell ( λ ) :
v r a y = λ · f r
To take advantage of the periodic and geometric conditions, the frequencies of interest must correspond to harmonics of the width of a unit cell ( λ ) in the 2D model. This method, combined with the Rayleigh wave velocity of the piezoelectric substrate, enables the estimation of the target resonance frequency, which in our case is calculated as f r 0 = 850 MHz. These data can be used in an eigenfrequency solver to facilitate the identification of resonance frequencies close to this estimation.

3.2.4. CO 2 Determination

In surface acoustic wave (SAW) sensors, gas detection relies on the principle that the propagation characteristics of Rayleigh waves, such as phase velocity and resonance frequency, are sensitive to mass and mechanical property variations at the surface of the piezoelectric substrate. When a gas such as CO2 is absorbed into a surface coating (e.g., polyetherimide, PEI), the effective mass density of the sensing layer increases, thereby altering the wave velocity and shifting the sensor’s resonance frequency. This shift serves as a measurable indicator of gas presence and concentration. To model this effect, the absorption of CO2 by the PEI layer is treated as a local density modification. The effective density of the film, ρ a b s , is expressed as:
ρ a b s = ρ P E I + δ · ρ C O 2
where = ρ P E I is the intrinsic density of PEI, and ρ C O 2 represents the density contribution from the absorbed CO2. The coefficient δ is defined as:
δ 0 Absence de CO 2 1 Absorption de CO 2
Under atmospheric pressure and temperature, the density of absorbed CO2 within the PEI matrix is calculated using a modified form of the ideal gas law, incorporating the partition coefficient between air and PEI:
ρ C O 2 = K · M ( CO 2 ) · c
with:
c = c 0 · P R · T
Here, P is the ambient pressure, T is the absolute temperature, R is the universal gas constant, M is the molar mass of CO2, c 0 is the reference concentration in ppm, and c is the normalized gas concentration in the surrounding air. The parameter K = 10–12 represents the a i r / P E I partition coefficient for CO2, characterizing the affinity of the polymer layer for CO2 molecules.
These density changes directly influence the wave velocity in the piezoelectric substrate, making the system highly sensitive to minute variations in CO2 concentration. Consequently, the shift in resonance frequency serves as a quantitative indicator of gas presence.
Table 2 summarizes the mechanical and physical properties of the materials used in the model, including the PEI absorber and copper interdigitated transducers (IDTs), both of which are critical for defining wave propagation behavior in the sensor.
This modeling approach provides a quantitative link between gas concentration and mechanical loading, enabling the prediction and calibration of the sensor’s response under varying environmental conditions.

4. Result and Discussion

4.1. Piezoelectric Generator Response

Analysis of the mechanical behavior in relation to the electrical properties of the piezoelectric generator requires two distinct approaches. The first is a frequency-domain study to determine the optimum electrical load. The second is a time-domain analysis, examining the influence of the rate of change of mechanical stress and dimensions, while comparing the energy harvesting efficiency of PVDF and PZT 5-H ceramic under identical mechanical and dimensional conditions.
Table 3 shows relative permittivity, piezoelectric coefficient and density values for PZT 5-H and PVDF.

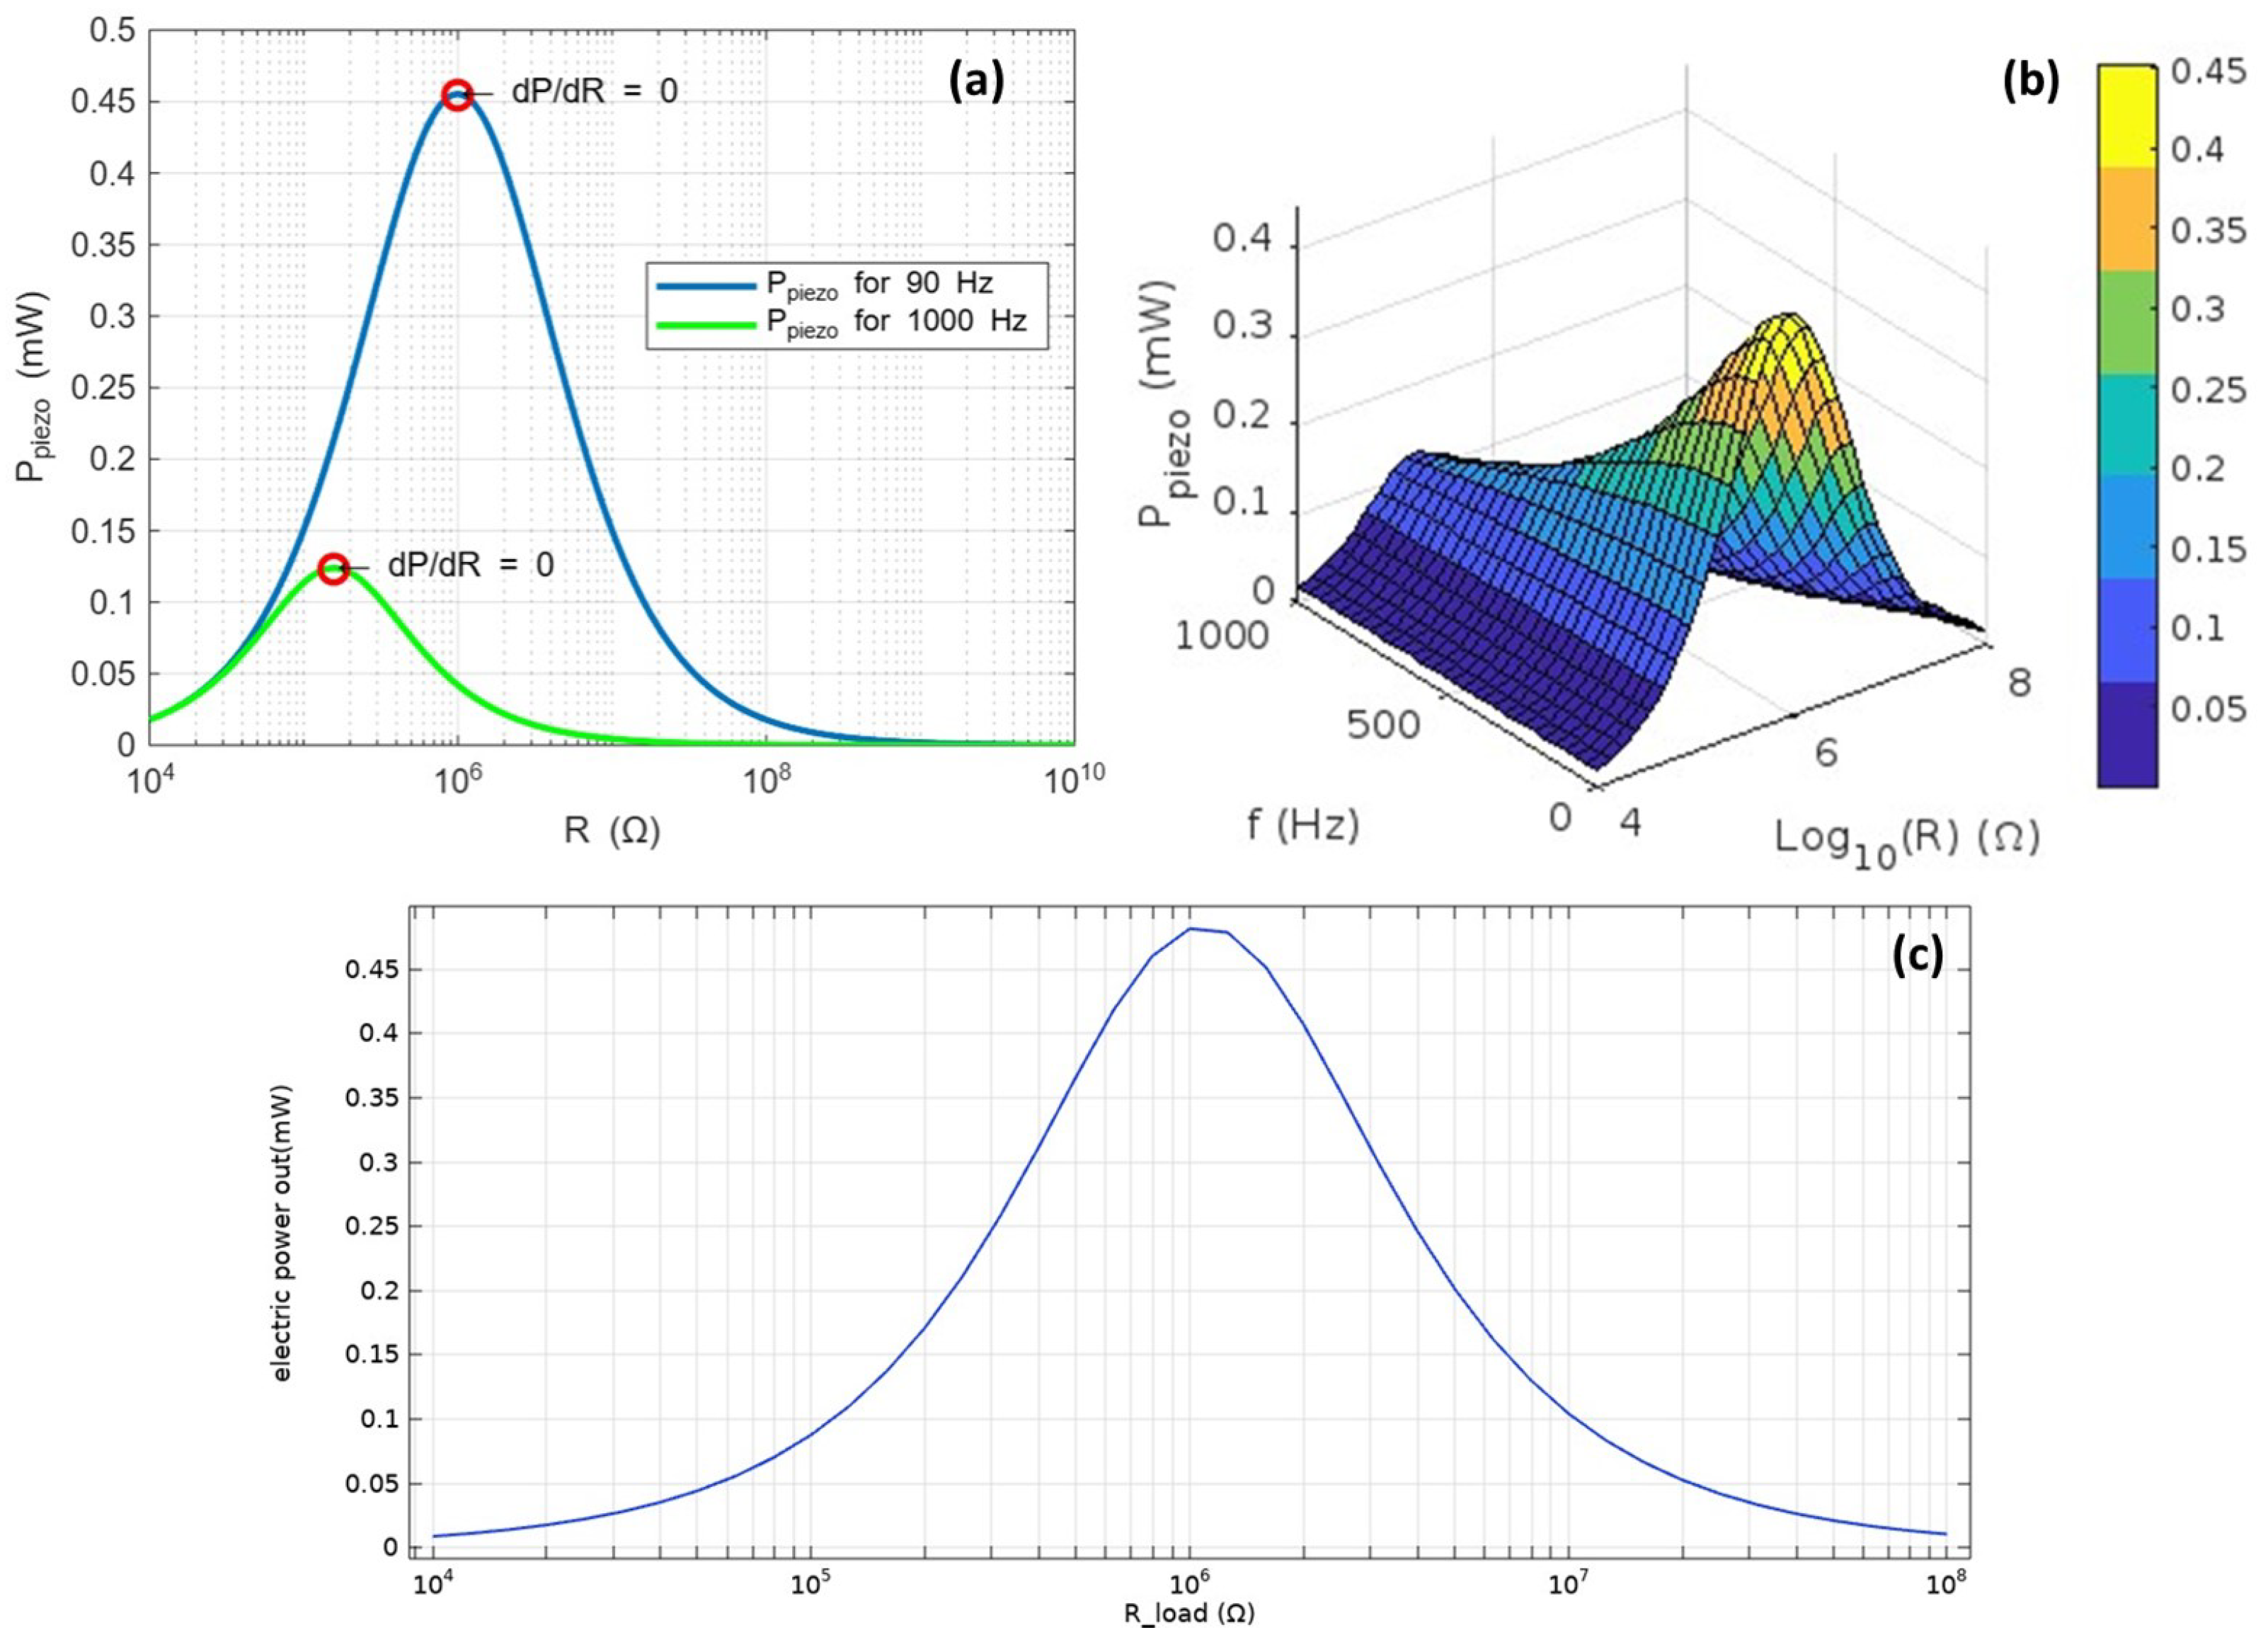
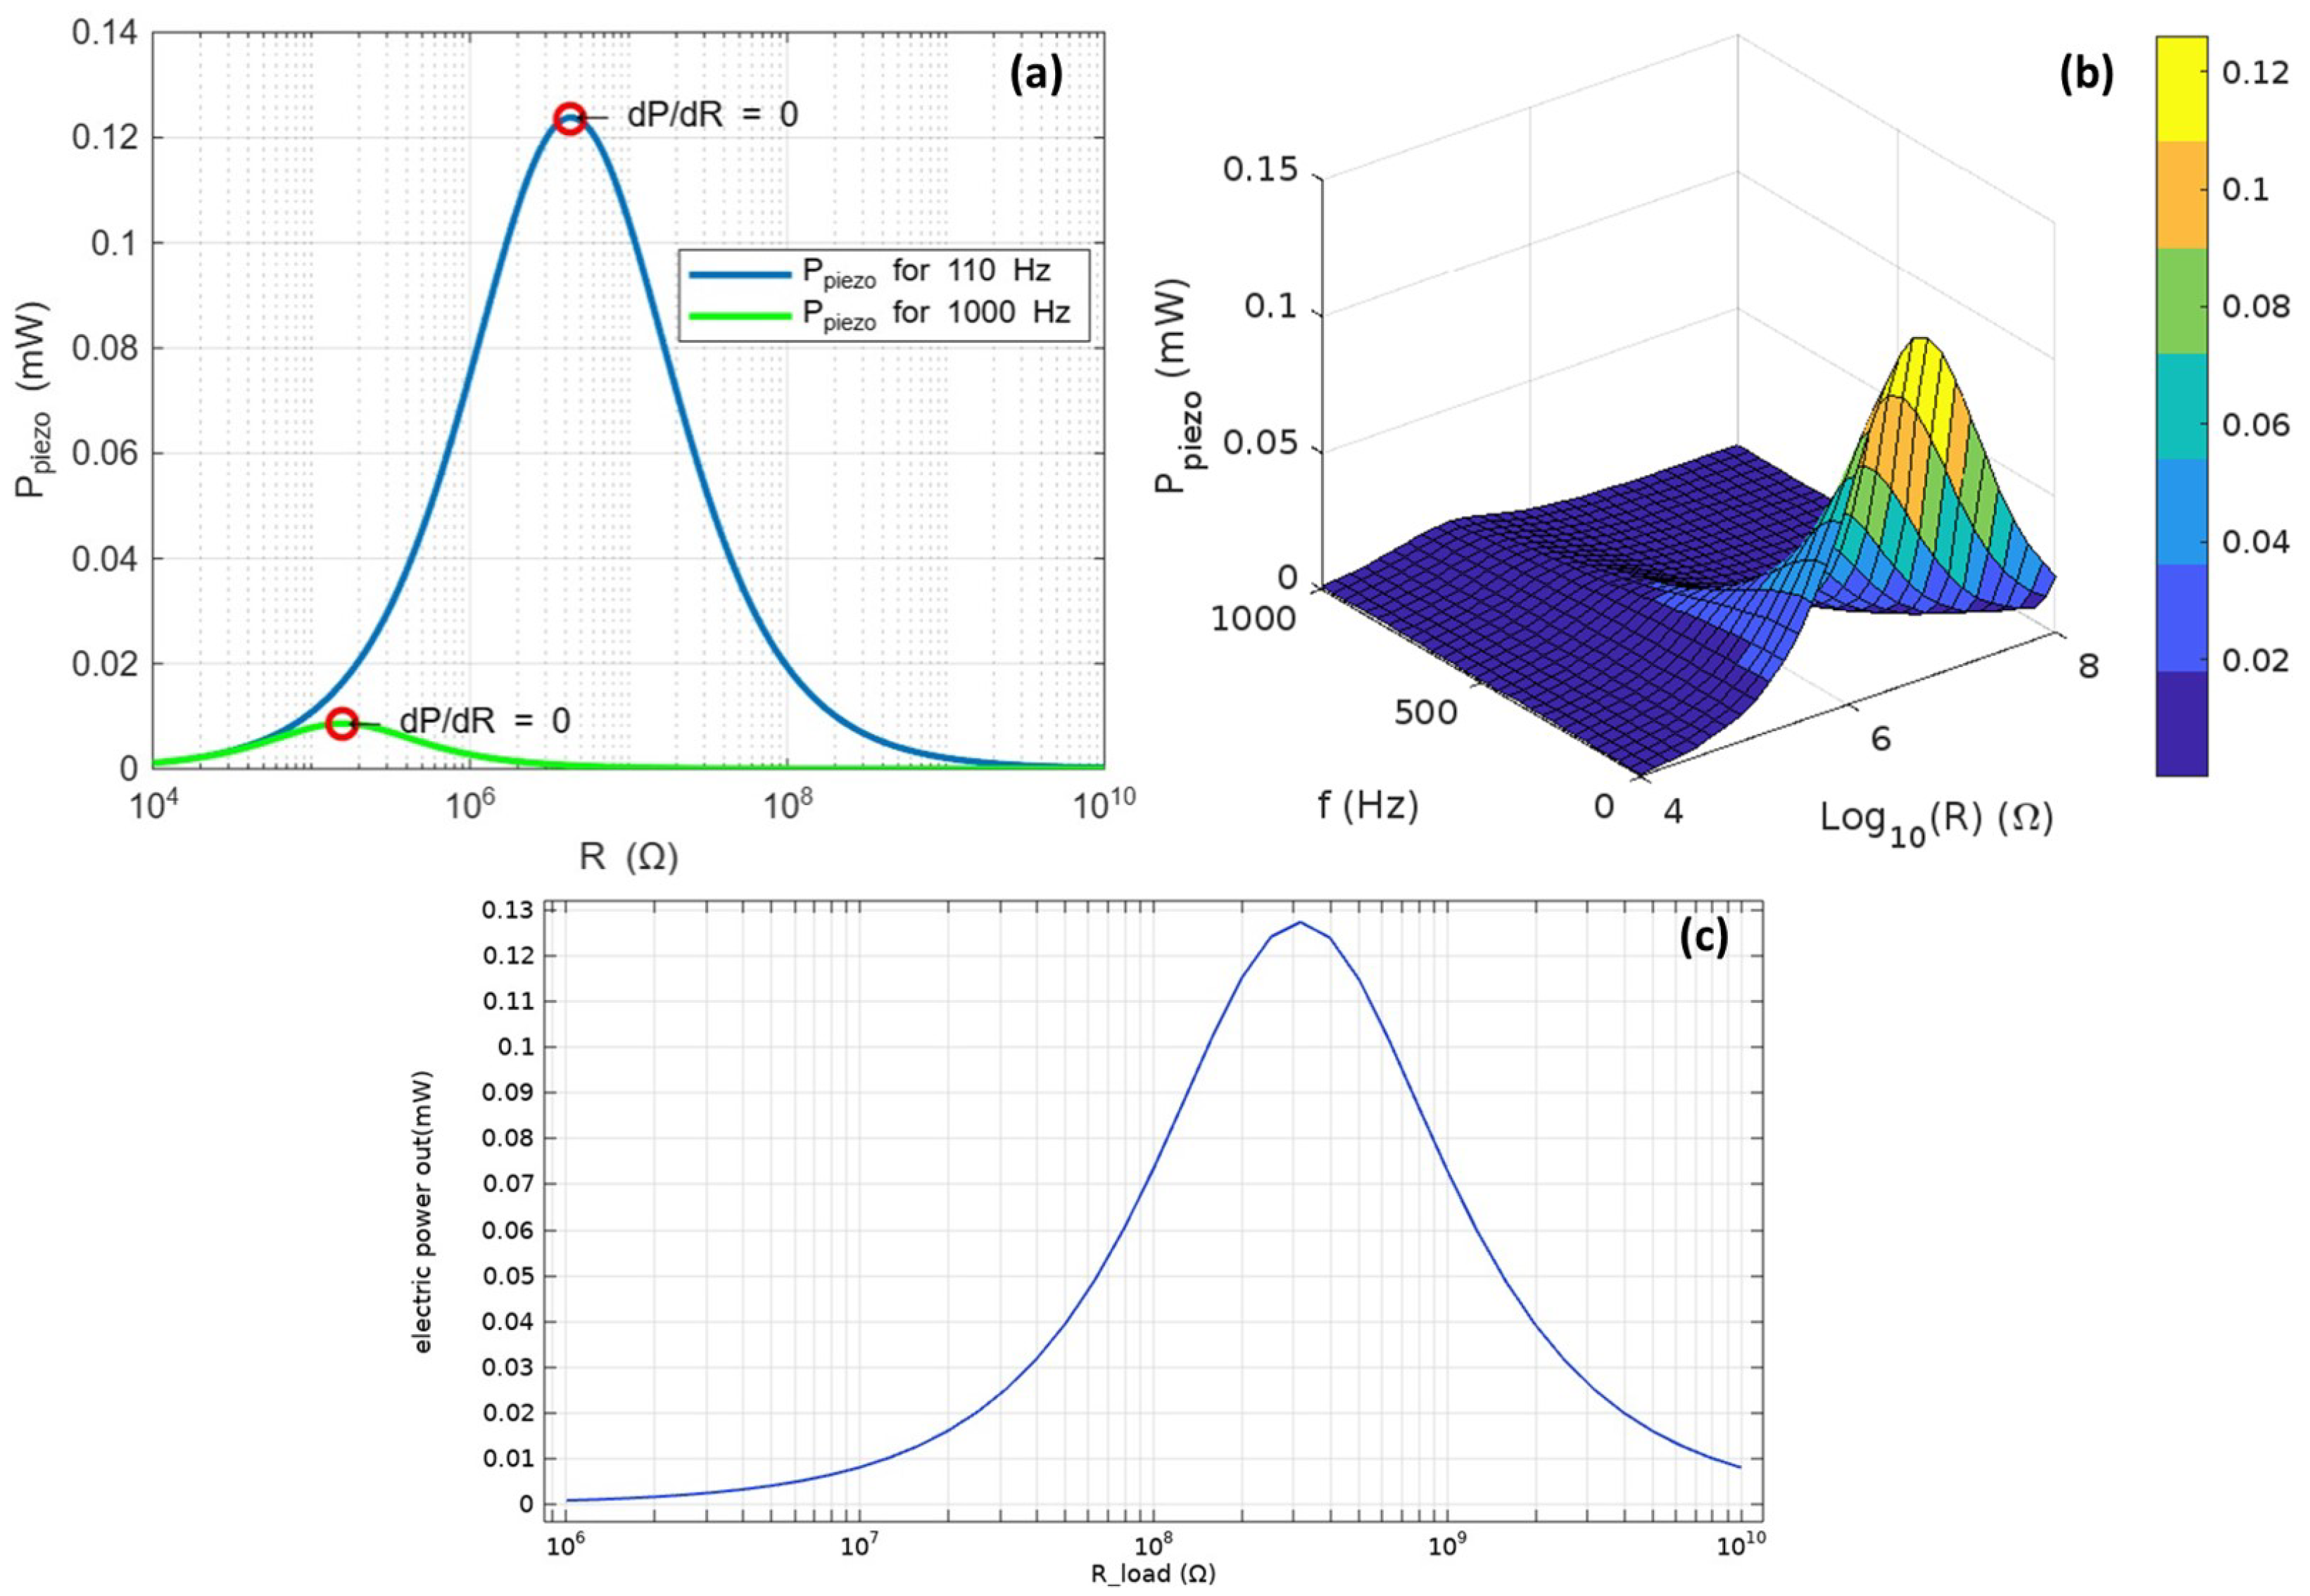
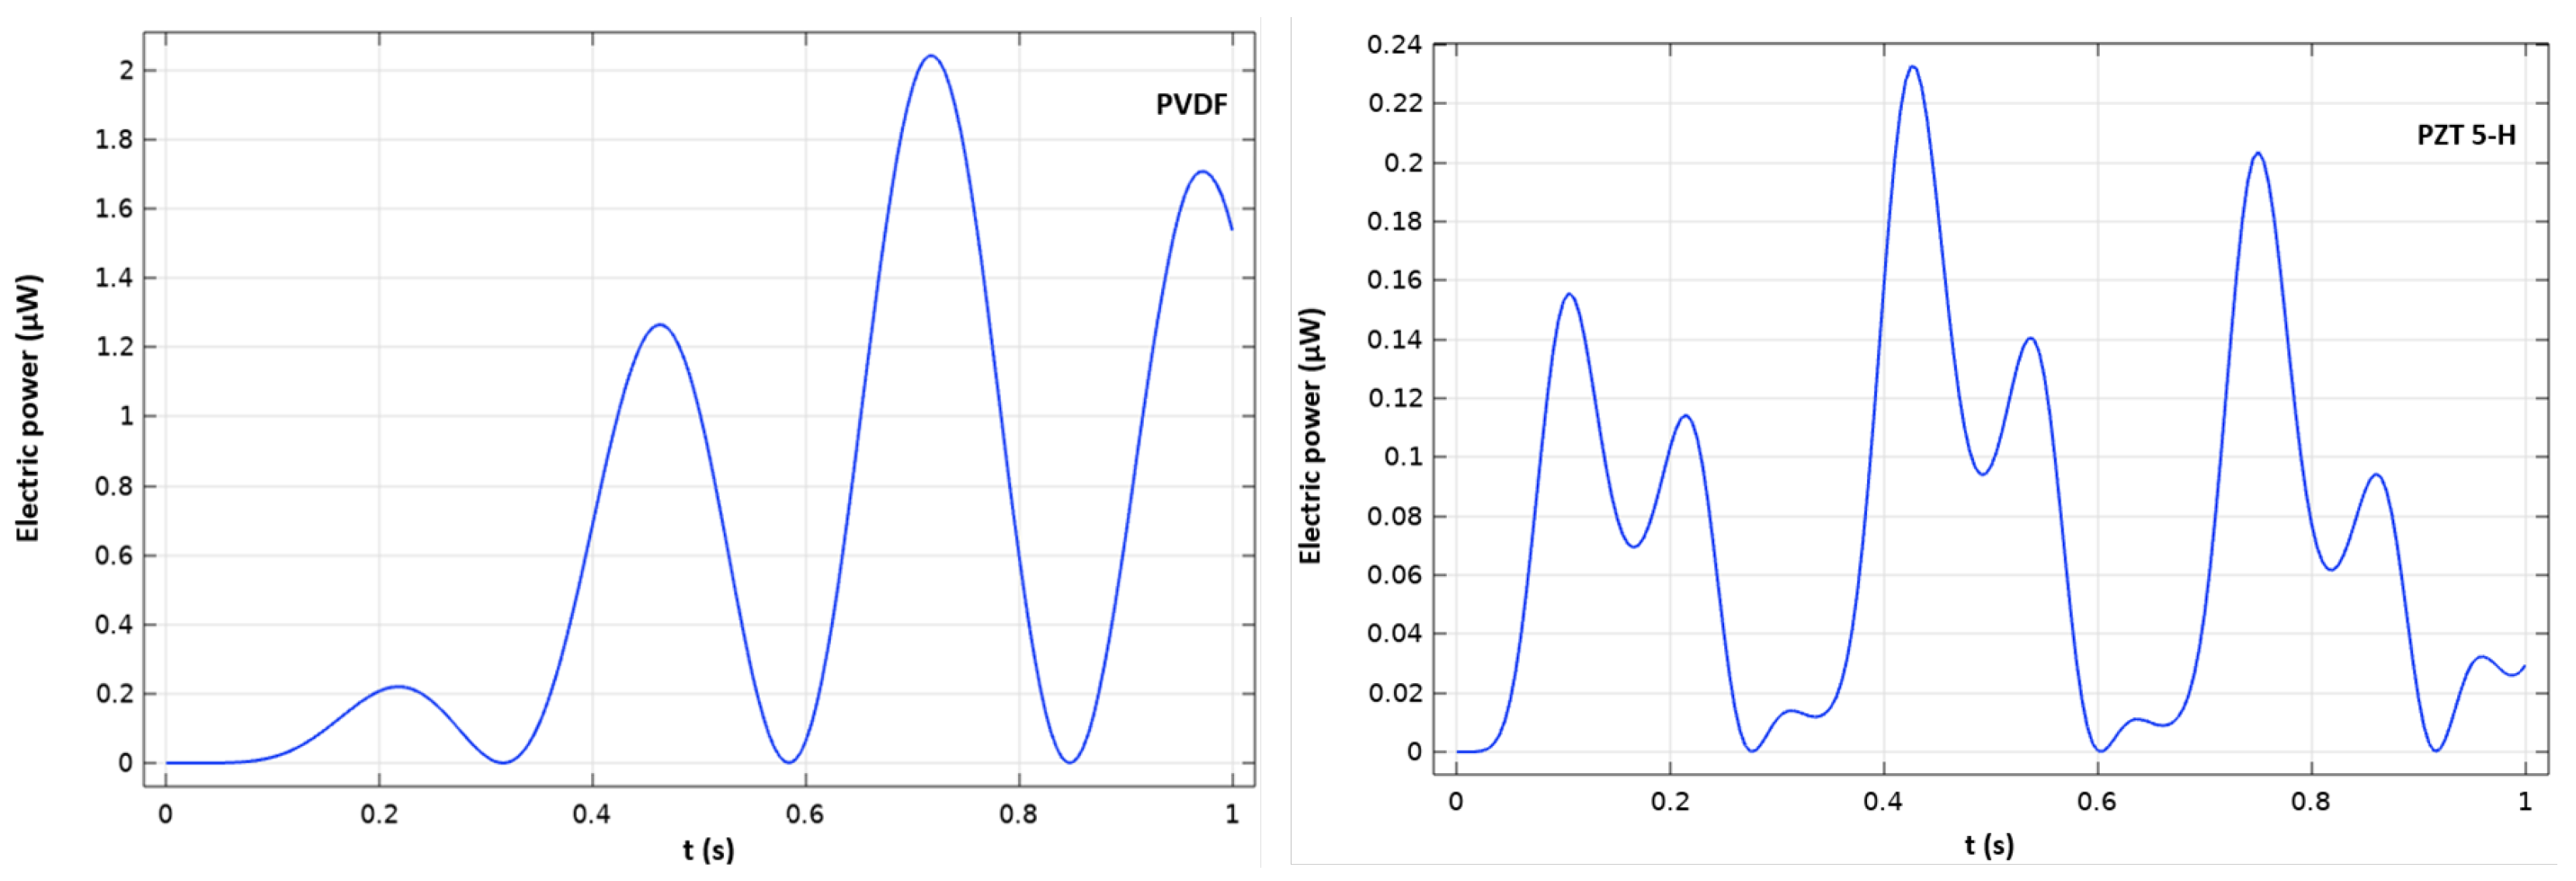
4.1.1. PZT 5-H and PVDF Optimal Electric Charge

Figure 5a presents the dependence of the piezoelectric power as a function of the electrical load for PZT 5-H. This figure shows that the value of the analytical expression for piezoelectric power at a frequency of 90 Hz increases exponentially with the electrical load R, until reaching a maximum, where the slope of the variation of electrical power with respect to the load tends toward 0. At this point, the electrical power reaches a maximum value of about 0.45 mW for an electrical load of 1 MΩ.
Similarly, this electrical power value decreases as the frequency increases, as shown in Figure 5a,b, which illustrate the correlation between the vibration frequency and the electrical load connected to the piezoelectric element. This correlation shows that the electrical load value decreases as the vibration frequency increases, which is consistent with the analytical expression represented in Equation (5) and other studies [62,63].
Figure 5c shows the numerical power of PZT-5H as a function of the electrical load for a frequency of 90 Hz.
These results indicate that the electrical power value increases in the same way as the analytical value, from 0 up to a value greater than 0.45 mW for an optimal load of 1 MΩ. The numerical and analytical results show a very good agreement for PZT-5H.
Figure 6a illustrates the dependence of the piezoelectric power on the electrical load for PVDF. It demonstrates that the analytical expression for piezoelectric power at a frequency of 110 Hz increases exponentially with the electrical load R until it reaches a maximum.
At this point, the slope of the power variation with respect to the load approaches zero, and the electrical power attains a maximum value of approximately 0.12 mW for an electrical load of 3.1 MΩ. Similarly, this electrical power value decreases as the frequency increases, as shown in Figure 6a,b, which highlight the correlation between the vibration frequency and the electrical load connected to PVDF.
This correlation reveals that the electrical load decreases as the vibration frequency increases, in line with the analytical expression in Equation (5).
Figure 6c presents the numerical power of PVDF as a function of the electrical load for a frequency of 110 Hz. These results show that the electrical power follows a similar trend to the analytical value, increasing from 0 to a value above 0.12 mW for an optimal load of 3.1 MΩ. The numerical and analytical results for PVDF exhibit a very good agreement.

4.1.2. Material Flexibility Influence on the Electrical Response

The comparison of flexibilities between PVDF and PZT 5-H reveals notable differences in their mechanical behavior. The flexibility of PVDF, estimated between 0.25 GPa−1 and 0.5 GPa−1 [64,65], is approximately 12 to 36 times higher than that of PZT 5-H, whose flexibility ranges from 0.014 GPa−1 to 0.02 GPa−1 [66,67]. This difference is mainly due to the polymeric and flexible nature of PVDF [68], which gives it a high deformation capacity under stress [69,70,71], unlike PZT 5-H, a more rigid ceramic material. Therefore, PVDF is better suited for applications requiring greater flexibility, while PZT 5-H is more suitable for environments where rigidity is essential.
The results concerning the sinusoidal mechanical excitation P ( t ) , with an amplitude of 1 MPa, applied to the moving part of the generator, show that the deformations induced in the piezoelectric material vary over time, generating an electrical response (see Figure 7).
The current intensity flowing through the optimal load enables the calculation of instantaneous electrical power (see Figure 7), which varies proportionally to the square of the mechanical excitation. The power harvested by PVDF is greater than that of PZT 5-H (see Figure 7). This difference is mainly due to the higher optimal load of PVDF, which enhances its electrical power output.
For the same rate of mechanical stress variation (0.1 MPa/s) (see Figure 7), the power harvested by PVDF exceeds that of PZT 5-H, despite the latter having a higher piezoelectric coefficient. This can be attributed to the greater flexibility of PVDF, which allows for larger deformations and, consequently, a stronger electrical response.

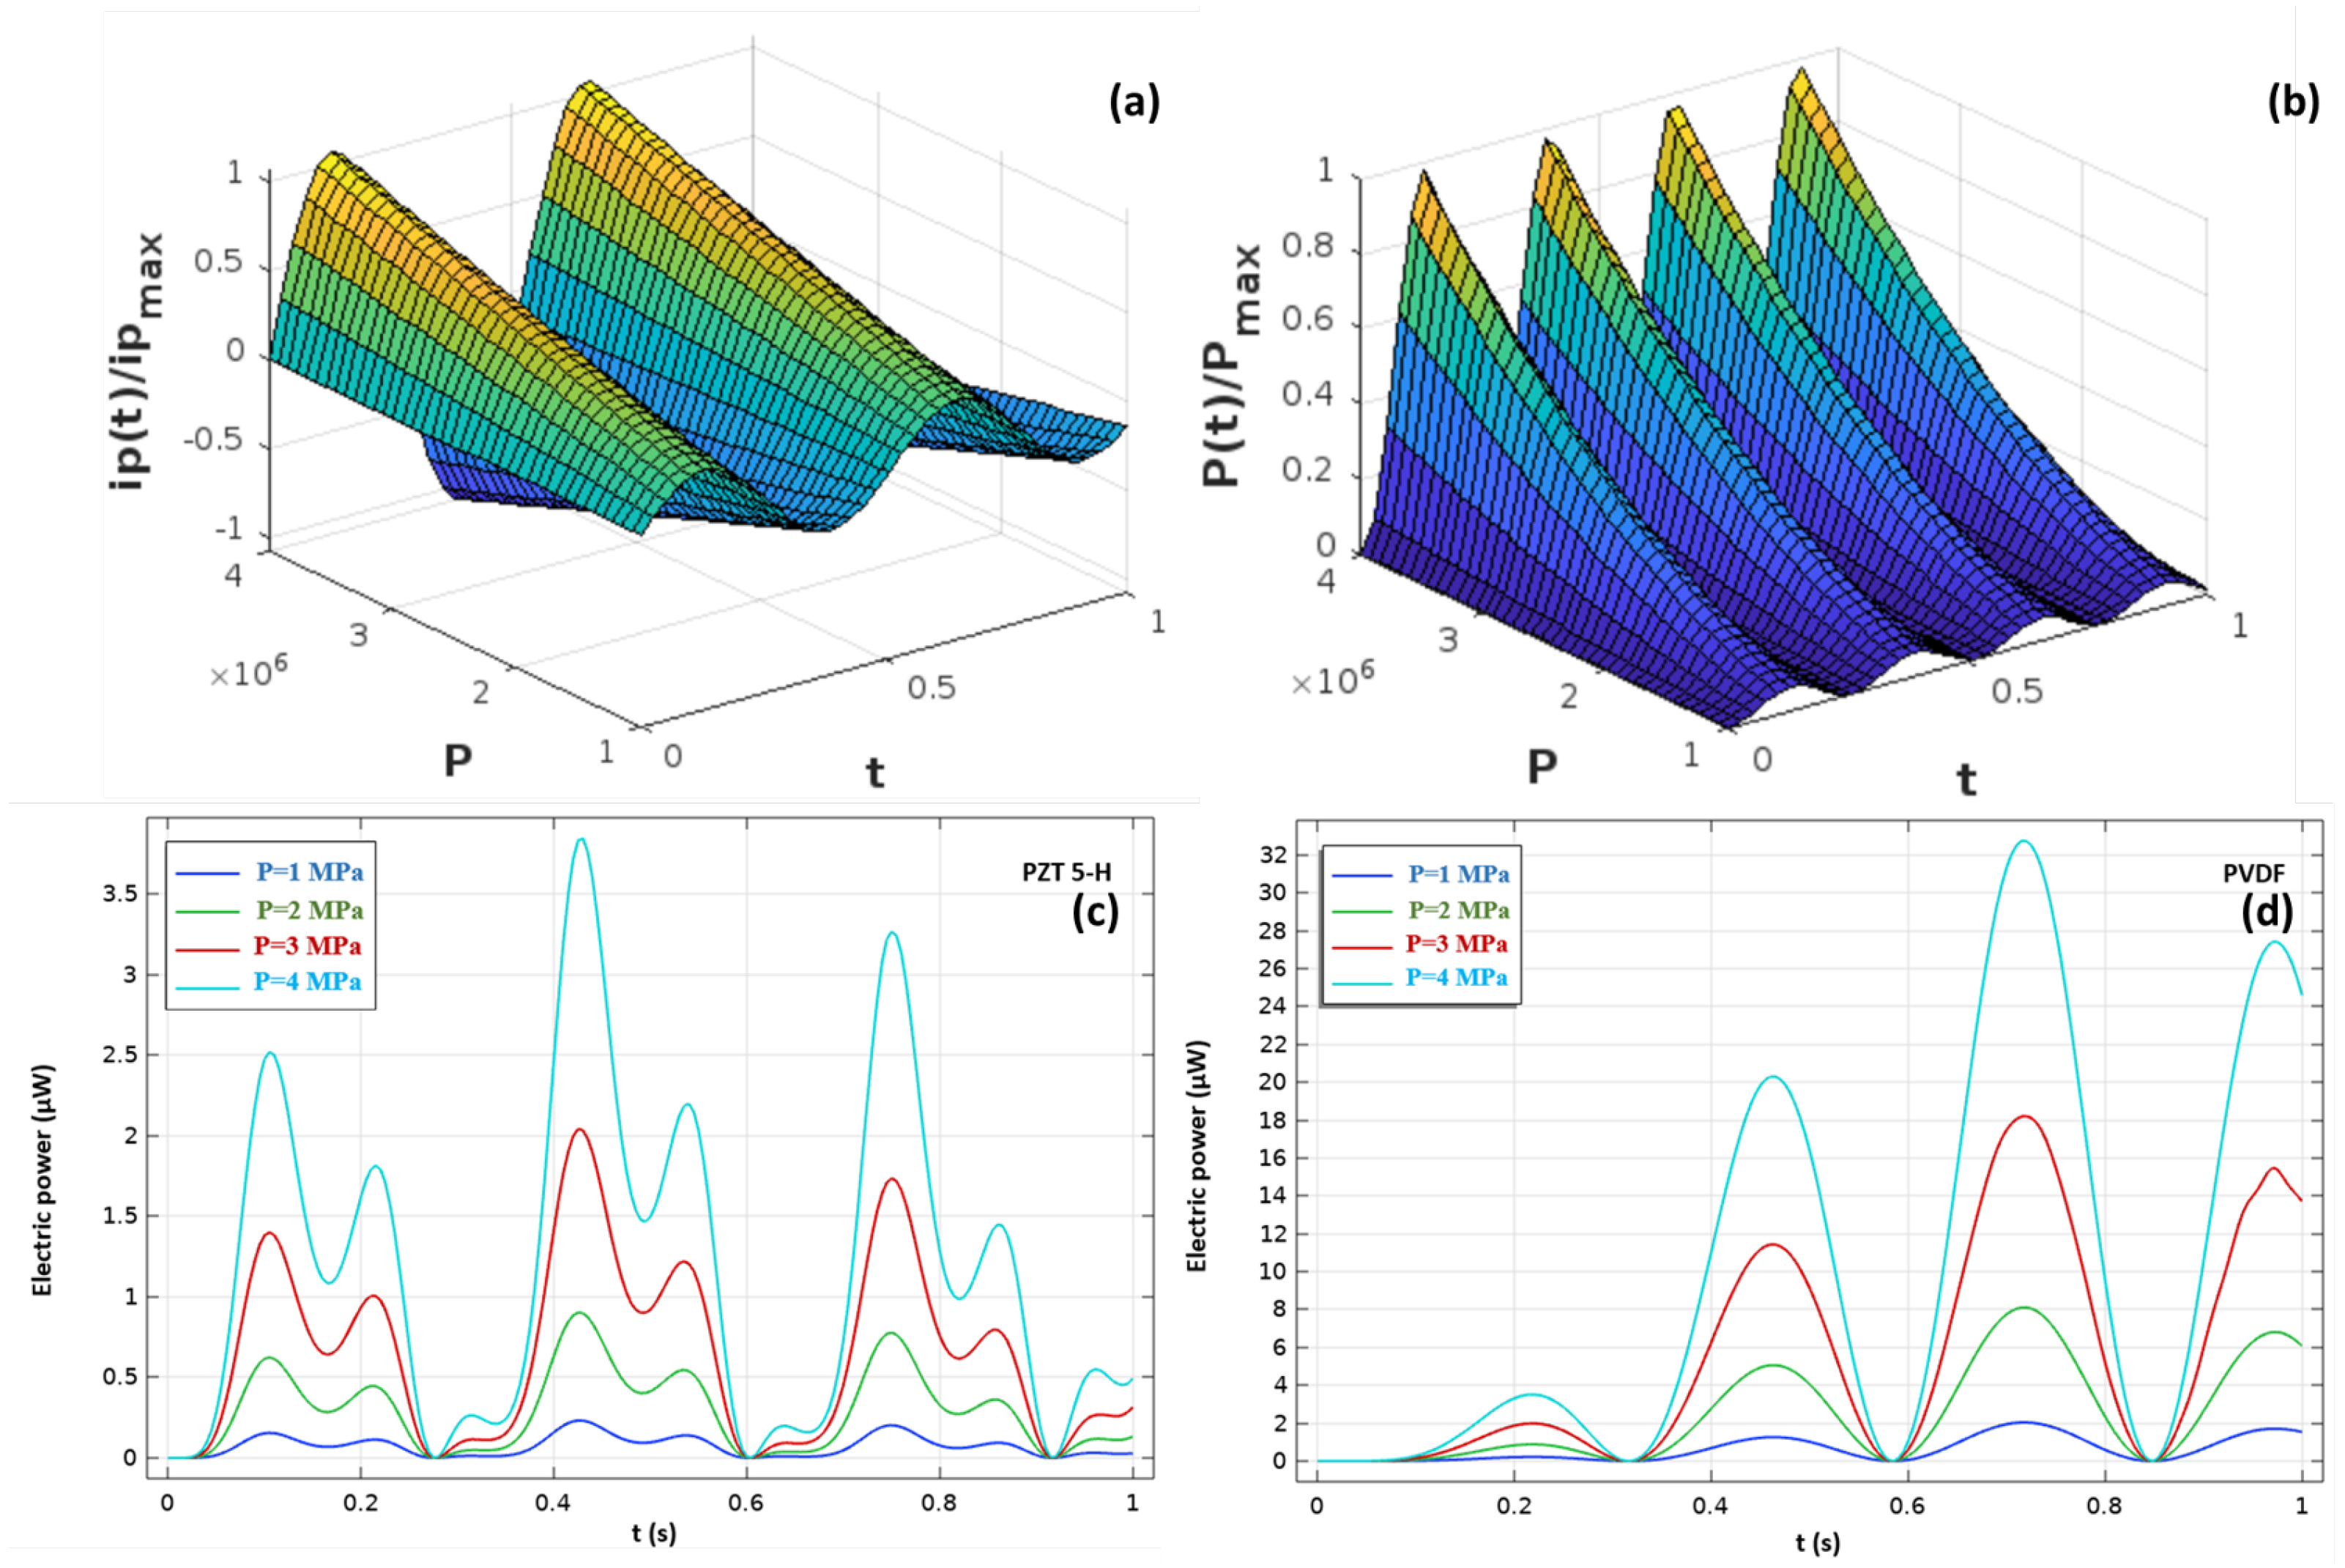
4.1.3. Mechanical Excitation Influence on the Electrical Response
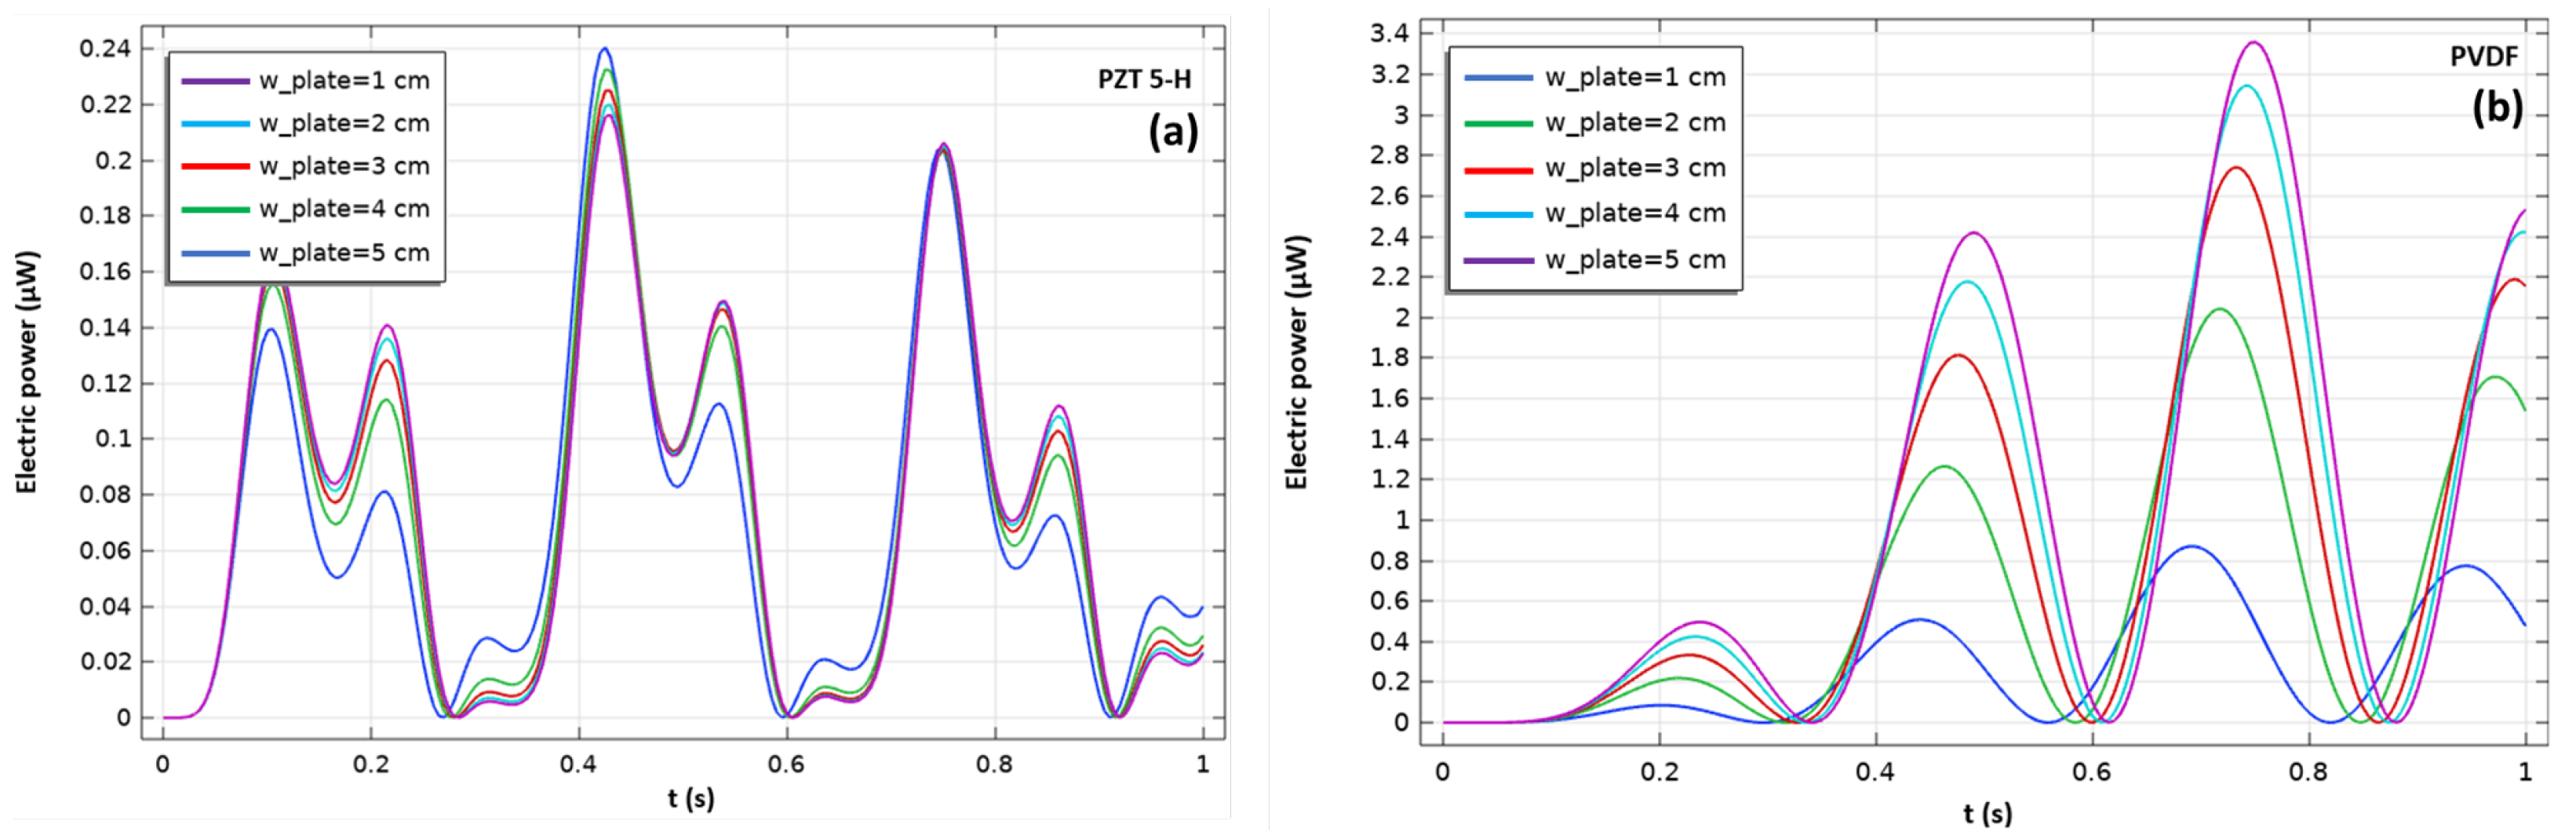
To analyze the effect of mechanical excitation amplitude on the electrical response of materials, Figure 8a,b show normalized current intensity values for (a) PZT and (b) PVDF under sinusoidal mechanical excitation of varying amplitudes. These results highlight the direct relationship between the amplitude of mechanical stress applied and the instantaneous energy collected. This correlation is confirmed by the numerical simulations in Figure 8c,d, illustrating respectively for (c) PZT and (d) PVDF the variation of electrical power as a function of time and mechanical excitation amplitude. The analysis of the results reveals distinct behaviors between the two studied materials. In particular, the flexibility of PVDF significantly influences its electrical response (Figure 8d): the evolution of the electrical current closely follows the variation of the applied mechanical stress, regardless of its amplitude. This behavior contrasts with that observed for PZT-5H (Figure 8d), whose higher rigidity alters the electrical response depending on the amplitude of the mechanical excitation.
Furthermore, Figure 8c,d illustrate the variation of the collected electrical power as a function of the mechanical stress amplitude. For both materials, the recovered power increases proportionally with the applied stress amplitude. Specifically, for PVDF, the collected power rises from 2 to 32 μW as the mechanical stress amplitude increases from 1 to 4 MPa. However, the power dissipated by the Joule effect at the optimal load for PZT-5H is lower (3.9 μW). This phenomenon is explained by the higher optimal load value of PVDF, which enables more efficient conversion of mechanical energy into electrical energy.

4.1.4. Piezoelectric Plate Width ( w p l a t e ) Influence on the Electrical Response

The effect of piezoelectric substrate dimensions on power harvesting has been analyzed (Figure 9). The numerical results show that increasing the width ( w p l a t e ) of the piezoelectric material influences the electrical response in different ways depending on the type of material. For PZT-5H (Figure 9a), an increase in width from 1 to 5 cm induces a slight rise in the power harvested, from 0.22 to 0.24 μW. In contrast, for PVDF (Figure 9b), substrate widening has a much more significant impact: harvested power reaches a maximum of 3.39 μW at a width of 5 cm.
This contrast in behavior can be attributed to the materials’ intrinsic stiffness. As discussed in Section 4.1.2, PZT-5H, a rigid ceramic material, has a flexibility of the order of 0.014 to 0.02 GPa−1, i.e., around 12 to 36 times less flexible than PVDF, a flexible polymer with a flexibility of between 0.25 and 0.5 GPa−1. This rigidity reduces the amplitude of mechanical deformations for a given excitation, which limits electromechanical conversion in the case of PZT-5H.
In addition, non-linear effects are particularly apparent in the response of the PZT-5H to increasing width. These effects could result from the complex interplay between internal mechanical stresses, material stiffness and boundary conditions, which limit the efficiency of energy harvesting beyond a certain geometry. This nonlinear behavior, although discrete here, opens the way to further investigations, particularly in the development of advanced nonlinear devices, such as:
  • non-linear oscillators exploiting these particular mechano-electrical properties.
  • high-performance piezoelectric resonators.
With this in view, the recent research by Buscarino et al. (2023) [72] on nonlinear jump resonance in electronic circuits provides a relevant theoretical framework that can support the extension of our results to other device configurations.

4.2. CO2 Sensor Results

The study of CO2 gas absorption by PEI is carried out in two distinct phases. First, we analyze the resonance frequency response as a function of variations in gas concentration in the air while keeping external and geometrical conditions constant. Second, we examine the influence of increasing the thickness of the PEI film, as well as the impact of pressure and temperature variations, on the frequency response of our surface acoustic wave sensor.
Before proceeding, it is essential to note that the actuator (LiTaO3) is subjected to an electrical potential of 10 × 10−12 V with a frequency of 800 MHz. Figure 10a illustrates the electric field lines inside the LiTaO3. The same figure also clearly shows the surface acoustic waves generated on the LiTaO3.
Additionally, Figure 10b shows the spatial distribution of the electrical potential applied by the interdigitated transducers (IDTs), which follows a sinusoidal pattern, along with the electric field lines inside the actuator. This distribution is crucial for generating surface acoustic waves on the substrate, creating stationary vibrations within the piezoelectric material. These vibrations propagate at the Rayleigh velocity (v r a y = 3400 m/s).
The Rayleigh velocity is influenced by several factors, such as mass variation and environmental conditions, which will be analyzed in detail in the following sections.

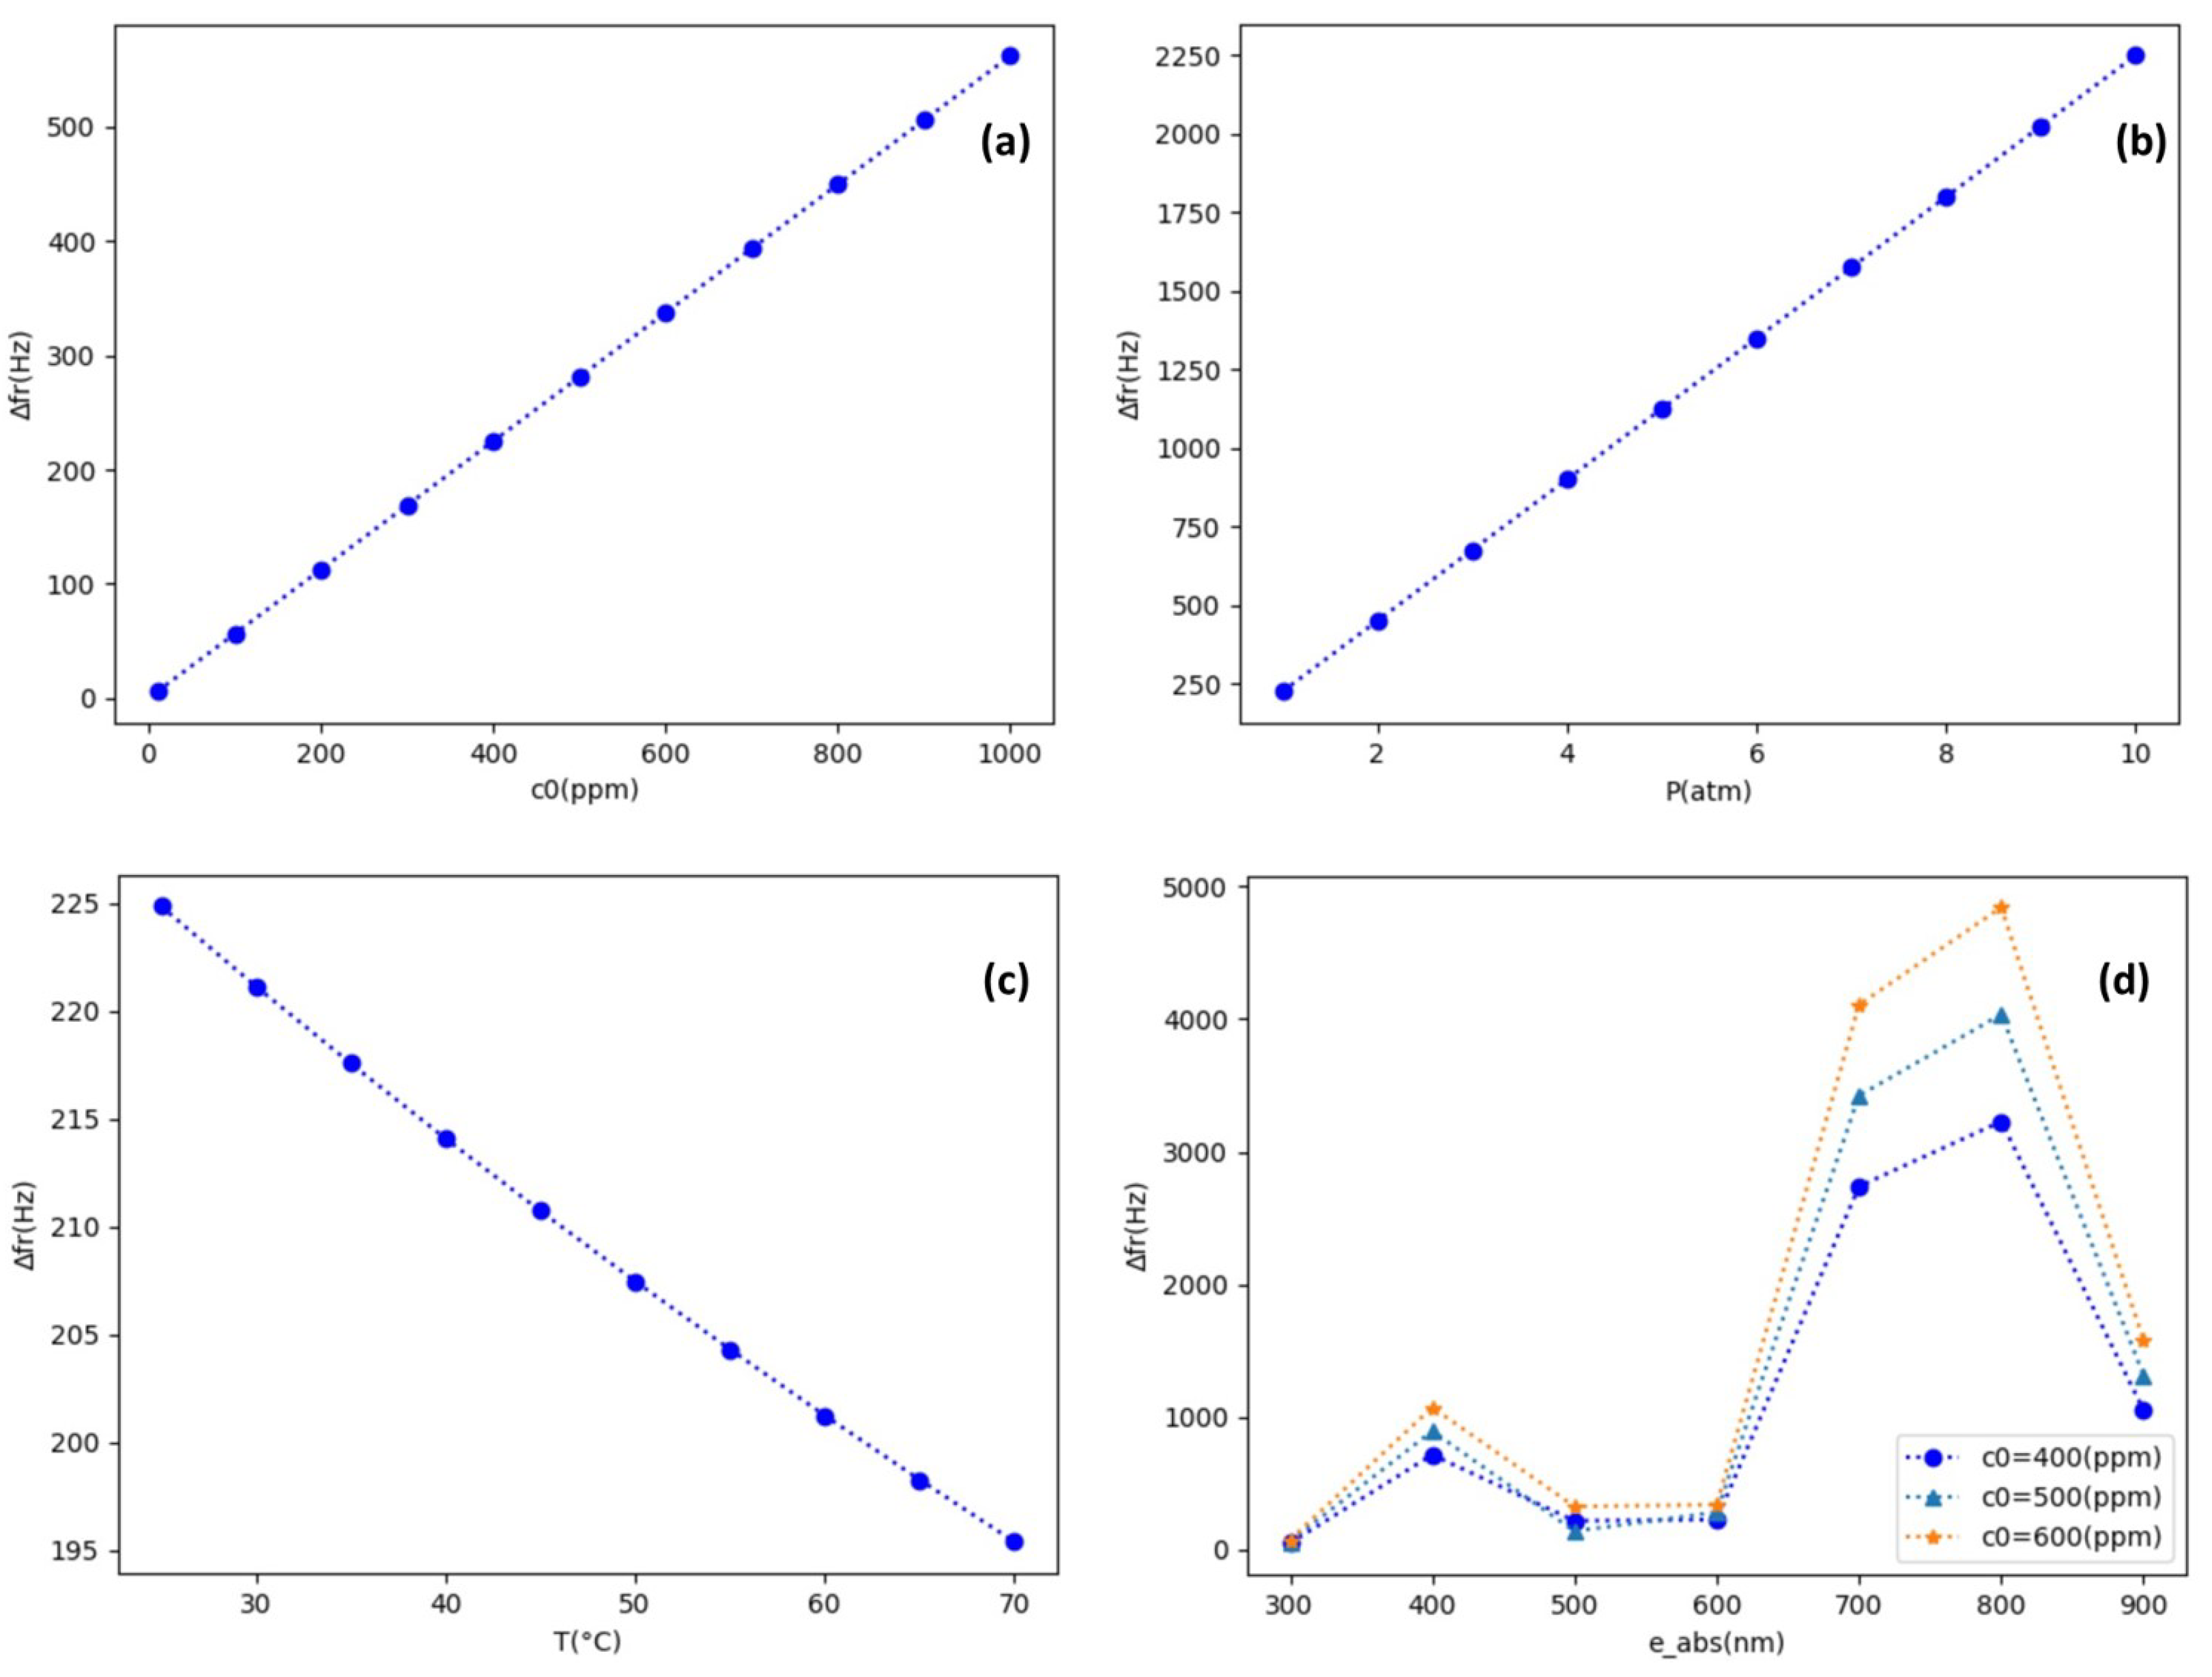
4.2.1. Analysis of SAW Response to Concentration Variation

In the absence of carbon dioxide ( n 0 = 0), the density of the absorbent is identical to that of Polyetherimide (PEI), and the first frequency is maintained at 767.38 MHz.
The absorption of 10 parts per million (ppm) of CO2 gas induces an increase in the density of the absorbent at constant volume, as described by Equation (15), resulting in an increase in the mass of PEI in accordance with Equation (12). This change is reflected in a 5.62 Hz shift in the resonance frequency (see Table 4). On one hand, the variation in resonance frequency at a concentration of 10 ppm highlights the sensitivity of the Surface Acoustic Wave (SAW) technique to low concentrations of targeted gases such as CO2. On the other hand, it can be observed from Figure 11a that the shift in the first resonance frequency increases linearly with the increase in gas concentration under atmospheric pressure and at ambient temperature, which is consistent with Equation (1).

4.2.2. Analysis of SAW Response to Geometric and External Variations

SAW Response to Thickness Variations ( e a b s )
The evaluation of the correlation between the variation in the thickness of the absorber (PEI) and the CO2 concentration was conducted.
Figure 11d illustrates the shift in resonance frequency for different absorber thicknesses. This figure shows that the variation in resonance frequency as a function of thickness is not regular for a given CO2 concentration, fluctuating from a few tens to several kilohertz. Furthermore, an increase in concentration significantly amplifies these resonance frequency fluctuations.
Table 5 summarizes the numerical values of the resonance frequency variation as a function of thickness and concentration.
SAW Response to External Variations
According to Equation (15), the volumetric concentration of gas depends on its pressure and temperature. Thus, an increase in gas pressure leads to an increase in resonance frequency shift, while an increase in temperature results in a decrease in the volumetric concentration of CO2, thereby reducing the first resonance frequency shift.
These properties are illustrated by the findings of our study, as depicted in Figure 11b, where the resonance frequency shift changes from 224.85 to 2249.08 Hz as the gas pressure increases from 1 to 10 atm Figure 11b. Similarly, raising the temperature from 25 to 70 °C Figure 11c results in a reduction in the resonance frequency shift, decreasing from 224.85 to 195.37 Hz.

5. Conclusions

This study highlights the effectiveness of piezoelectric materials and surface acoustic wave (SAW) technology in the fields of mechanical energy harvesting and CO2 detection. In terms of energy harvesting, PVDF polymer demonstrated superior performance to PZT 5-H ceramic, despite lower current generation. This advantage stems from PVDF’s greater mechanical flexibility, which allows greater deformation under stress and, consequently, improves electrical response. The electrical power harvested was shown to increase in proportion to the applied stress, underlining the crucial role of geometric optimization—in particular increasing the width of the piezoelectric substrate—in maximizing energy conversion, particularly for PVDF.
Non-linear effects were also observed in the response of the stiffer PZT 5-H material, suggesting the emergence of non-linear dynamic behavior in specific configurations. These phenomena open up promising prospects for the development of a new class of nonlinear piezoelectric oscillators and high-performance nonlinear resonators.In this context, recent contributions such as Buscarino et al.’s (2023) [72], focusing on nonlinear jump resonance in electronic circuits, provide a valuable theoretical basis for extending these results to broader device architectures.
At the same time, the study demonstrates the high sensitivity of SAW technology for detecting low concentrations of CO2. A linear shift in resonance frequency was recorded as CO2 concentration increased, with detection capabilities down to 10 ppm. Furthermore, the influence of environmental parameters was confirmed: higher pressure intensifies the frequency shift, while higher temperature attenuates it, which is certainly due to the reduced volumetric density of CO2 molecules.
In summary, the results not only confirm the high performance and sensitivity of the materials and technologies studied, but also underline their strong potential for integration into advanced applications, from energy autonomous systems to environmental sensing. Future work will focus on refining these technologies, taking advantage of their non-linear characteristics and adapting them to varying environmental conditions and application-specific requirements.

Author Contributions

Conceptualization, H.M., M.R., A.E., M.D. and C.E.; methodology, H.M., M.R., A.E., M.D. and C.E.; validation, H.M., M.R., A.E., M.D. and C.E.; formal analysis, H.M., M.R., A.E., M.D. and C.E.; investigation, H.M., M.R., A.E., M.D. and C.E.; resources, H.M., M.R., A.E., M.D. and C.E.; data curation, H.M., M.R., A.E., M.D. and C.E.; writing—original draft preparation, H.M., M.R., A.E., M.D. and C.E.; writing—review and editing, H.M., M.R., A.E., M.D. and C.E.; visualization, H.M., M.R., A.E., M.D. and C.E.; supervision, H.M., M.R. and C.E.; project administration, H.M., M.R. and C.E.; funding acquisition, H.M., M.R. and C.E. All authors have read and agreed to the published version of the manuscript.

Funding

This research received no external funding.

Data Availability Statement

The original contributions presented in this study are included in the article. Further inquiries can be directed to the corresponding author.

Conflicts of Interest

The authors declare no conflict of interest.

References

  1. Remaidi, M.; Derraz, M.; Ennawaoui, A.; El Hmamsy, Y.; Mastouri, H.; Ennawaoui, C.; Hajjaji, A. Innovative Autonomous Lead-Free Hybrid Piezo-Pyroelectric Sensor for Real-Time Wear Assessment of Disc Brake Pads. Results Eng. 2025, 26, 104617. [Google Scholar] [CrossRef]
  2. Ennawaoui, C.; Lifi, H.; Hajjaji, A.; Elballouti, A.; Laasri, S.; Azim, A. Mathematical modeling of mass spring’s system: Hybrid speed bumps application for mechanical energy harvesting. Eng. Solid Mech. 2019, 7, 47–58. [Google Scholar] [CrossRef]
  3. Ullah, Z.; Alam, M.M.; Younis, J.; Mahrous, Y.M.; Albouchi, F.; Alsulami, M.D.; Usman, A.; Haider, I. Thermal conductivity impact on MHD convective heat transfer over moving wedge with surface heat flux and high magnetic Prandtl number. Case Stud. Therm. Eng. 2024, 61, 105077. [Google Scholar] [CrossRef]
  4. Hussain, M.N.; Halim, M.A.; Khan, M.Y.A.; Ibrahim, S.; Haque, A. A Comprehensive Review on Techniques and Challenges of Energy Harvesting from Distributed Renewable Energy Sources for Wireless Sensor Networks. Control. Syst. Optim. Lett. 2024, 2, 15–22. [Google Scholar] [CrossRef]
  5. Ennawaoui, C.; Hajjaji, A.; Samuel, C.; Sabani, E.; Rjafallah, A.; Najihi, I.; Azim, A. Piezoelectric and electromechanical characteristics of porous poly (ethylene-co-vinyl acetate) copolymer films for smart sensors and mechanical energy harvesting applications. Appl. Syst. Innov. 2021, 4, 57. [Google Scholar] [CrossRef]
  6. Kumar, R.; Lee, D.; Ağbulut, Ü.; Kumar, S.; Thapa, S.; Thakur, A.; Jilte, R.D.; Saleel, C.A.; Shaik, S. Different energy storage techniques: Recent advancements, applications, limitations, and efficient utilization of sustainable energy. J. Therm. Anal. Calorim. 2024, 149, 1895–1933. [Google Scholar] [CrossRef]
  7. Kumar, M.; Suhaib, M.; Sharma, N.; Kumar, S.; Choudhary, S. Energy Harvesting Technologies in Mechanical Systems: A Comprehensive Review. Int. J. Res. Publ. Rev. 2024, 5, 2782–2787. [Google Scholar] [CrossRef]
  8. Mastouri, H.; Ennawaoui, A.; Remaidi, M.; Sabani, E.; Derraz, M.; El Hadraoui, H.; Ennawaoui, C. Design, Modeling, and Experimental Validation of a Hybrid Piezoelectric–Magnetoelectric Energy-Harvesting System for Vehicle Suspensions. World Electr. Veh. J. 2025, 16, 237. [Google Scholar] [CrossRef]
  9. Aloui, R.; Gaha, R.; Lafarge, B.; Celik, B.; Verdari, C. Life Cycle Assessment of Piezoelectric Devices Implemented in Wind Turbine Condition Monitoring Systems. Energies 2024, 17, 3928. [Google Scholar] [CrossRef]
  10. Kim, H.; Rigo, B.; Wong, G.; Lee, Y.J.; Yeo, W.H. Advances in wireless, batteryless, implantable electronics for real-time, continuous physiological monitoring. Nano-Micro Lett. 2024, 16, 52. [Google Scholar] [CrossRef]
  11. Luo, G.; Xie, J.; Liu, J.; Luo, Y.; Li, M.; Li, Z.; Yang, P.; Zhao, L.; Wang, K.; Maeda, R.; et al. Highly stretchable, knittable, wearable fiberform hydrovoltaic generators driven by water transpiration for portable self-power supply and self-powered strain sensor. Small 2024, 20, 2306318. [Google Scholar] [CrossRef] [PubMed]
  12. Yang, H.; Wu, B.; Xu, G. Modeling and experimental study on walking human-structure interaction systems subjected to earthquake excitations. J. Sound Vibratio 2024, 576, 118292. [Google Scholar] [CrossRef]
  13. Sanchez-Gomez, J.M.; Vega-Rodríguez, M.A.; Pérez, C.J. An indicator-based multi-objective variable neighborhood search approach for query-focused summarization. Swarm Evol. Comput. 2024, 91, 101721. [Google Scholar] [CrossRef]
  14. Wawrzyniak, J. Advancements in improving selectivity of metal oxide semiconductor gas sensors opening new perspectives for their application in food industry. Sensors 2023, 23, 9548. [Google Scholar] [CrossRef]
  15. Mazumder, J.T.; Jha, R.K.; Kim, H.W.; Kim, S.S. Capacitive toxic gas sensors based on oxide composites: A review. IEEE Sens. J. 2023, 23, 17842–17853. [Google Scholar] [CrossRef]
  16. Mohsan, S.A.H.; Othman, N.Q.H.; Li, Y.; Alsharif, M.H.; Khan, M.A. Unmanned aerial vehicles (UAVs): Practical aspects, applications, open challenges, security issues, and future trends. Intell. Serv. Robot. 2023, 16, 109–137. [Google Scholar] [CrossRef]
  17. He, D.; Cui, Y.; Ming, F.; Wu, W. Advancements in passive wireless sensors, materials, devices, and applications. Sensors 2023, 23, 8200. [Google Scholar] [CrossRef]
  18. Nomura, T.; Okuhara, M. Frequency shifts of piezoelectric quartz crystals immersed in organic liquids. Anal. Chim. Acta 1982, 142, 281–284. [Google Scholar] [CrossRef]
  19. White, R.M.; Voltmer, F.W. Direct piezoelectric coupling to surface elastic waves. Appl. Phys. Lett. 1965, 7, 314–316. [Google Scholar] [CrossRef]
  20. Pan, Y.; Yan, C.; Gao, X.; Yang, J.; Guo, T.; Zhang, L.; Wang, W. A passive wireless surface acoustic wave (SAW) sensor system for detecting warfare agents based on fluoroalcohol polysiloxane film. Microsyst. Nanoeng. 2024, 10, 4. [Google Scholar] [CrossRef]
  21. Huang, W.; Yang, Q.; Liao, J.; Ramadan, S.; Fan, X.; Hu, S.; Liu, X.; Luo, J.; Tao, R.; Fu, C. Integrated Rayleigh wave streaming-enhanced sensitivity of shear horizontal surface acoustic wave biosensors. Biosens. Bioelectron. 2024, 247, 115944. [Google Scholar] [CrossRef]
  22. Turuk, B.K.; Behera, B. A brief investigation of one-port SAW resonator for the application in communication systems. Eng. Res. Express 2024, 6, 022302. [Google Scholar] [CrossRef]
  23. Yi, Y.; Baroudi, A.E.; Pommellec, J.Y.L. Love wave characteristics in viscoelastic fluid loaded surface layer: Comparison between Jeffrey and Maxwell–Jeffrey models. Multiscale and Multidisciplinary Modeling. Exp. Des. 2024, 7, 919–930. [Google Scholar]
  24. Yang, Y.; Peng, B.; Huang, F.; Zhu, J.; He, Z.; He, P.; Zhang, W. Temperature Characteristics of Rayleigh Wave and Leaky Surface Acoustic Wave Propagating in Langasite and its Application in Temperature Sensor. Acoust. Phys. 2024, 70, 487–493. [Google Scholar] [CrossRef]
  25. Francis, L.A.; Friedt, J.-M.; Bartic, C.; Campitelli, A. A SU-8 liquid cell for surface acoustic wave biosensors. In MEMS, MOEMS, and Micromachining; SPIE: Nuremberg, Germany, 2004; Volume 5455, pp. 353–363. [Google Scholar]
  26. Hashimoto, K.-Y. RF Bulk Acoustic Wave Filters for Communications; Artech House: Washington, DC, USA, 2009. [Google Scholar]
  27. Morgan, D. Surface Acoustic Wave Filters, 2nd ed.; Elsevier: Amsterdam, The Netherlands, 2007. [Google Scholar]
  28. Wang, Y.; Smith, A.B.; Johnson, C.D.; Lee, E.F.; Martinez, G.H.; Brown, K.L.; Davis, M.N.; Wilson, P.Q.; Thompson, R.S.; Garcia, J.R.; et al. High-Power Limitations in Resonant SAW Gas Sensors. Sens. Actuators B 2023, 387, 123456. [Google Scholar]
  29. Chen, L.; Wang, X.; Singh, R.; Tanaka, S.; Müller, J.; Dubois, P.; Garcia, M.; Kim, H.; Ivanov, A.; Silva, F.; et al. Low-Electrode-Count SAW Sensors for IoT Applications. IEEE Sens. J. 2022, 22, 15021–15030. [Google Scholar]
  30. Kim, H.; Park, S.; Nguyen, T.; Schmidt, A.; Rossi, M.; Chen, X.; Dubois, M.; Müller, J.; Silva, R.; Yamamoto, T.; et al. LiTaO3-Based SAW Devices with Enhanced k2 for Low-Voltage Operation. Appl. Phys. Lett. 2021, 118, 093502. [Google Scholar]
  31. Zhang, R.; Wang, Q.; Singh, A.; Tanaka, Y.; Dubois, P.; Müller, A.; Schmidt, B.; Kim, S.; Ivanova, K.; Lopez, F.; et al. PEI-Functionalized SAW Sensors for Selective CO2 Detection. ACS Sens. 2023, 8, 1678–1686. [Google Scholar]
  32. Gupta, A.; Chen, L.; Wang, X.; Martinez, R.; Kumar, S.; Tanaka, H.; Silva, M.; Dubois, L.; Schmidt, J.; Kim, Y.; et al. Energy-Efficient SAW Sensors for Environmental Monitoring. Nat. Commun. 2024, 15, 789. [Google Scholar]
  33. Lee, J.; Zhang, Y.; Singh, R.; Tanaka, S.; Müller, P.; Garcia, F.; Kim, H.; Ivanov, V.; Silva, A.; Schmidt, M.; et al. Piezoelectric Microgenerators for Self-Powered SAW Systems. Nano Energy 2023, 109, 108456. [Google Scholar]
  34. ISO/IEC 30142:2023; Internet of Things (IoT)—IoT Standards for Low-Power Wireless Sensors. International Organization for Standardization: Geneva, Switzerland, 2023.
  35. Rahman, M.; Wang, Y.; Chen, X.; Tanaka, K.; Dubois, S.; Müller, L.; Garcia, R.; Kim, T.; Ivanova, P.; Schmidt, A.; et al. Field Deployment of Autonomous SAW Sensors in Remote CO2 Monitoring. Environ. Sci. Technol. 2024, 58, 987–995. [Google Scholar]
  36. Pavey, K. Quartz crystal analytical sensors: The future of label-free, real-time diagnostics? Expert Rev. Mol. Diagn. 2002, 2, 173–186. [Google Scholar] [CrossRef] [PubMed]
  37. Hoummady, M.; Hauden, D.; Mina, P. A model for the improvement of energy harvesting from a pyroelectric effect. J. Phys. III 1997, 7, 1125–1136. [Google Scholar]
  38. Sang, Y.; Sheng, J.; Xue, H.; Wang, Y.; Wu, Q. Non-linear coordinated control of LPMG-based direct drive wave energy conversion system with supplementary energy storage system based on feedback linearization. IET Renew. Power Gener. 2024, 18, 3077–3090. [Google Scholar] [CrossRef]
  39. Huang, W.-H.; Chen, P.-H.; Chen, C.-W.; Su, C.-S.; Tang, M.; Tsai, J.-C.; Chen, Y.-P.; Lin, F.-H. Experimental Study for the Sorption and Diffusion of Supercritical Carbon Dioxide into Polyetherimide. Molecules 2024, 29, 4233. [Google Scholar] [CrossRef]
  40. Chandramouli, M.; Ningaiah, S.; Basavanna, V. A Comprehensive Review on Advancements in Modification Strategies of Polymer Blends for Enhanced Carbon Dioxide Capture and Reuse. Environ. Qual. Manag. 2025, 34, e70039. [Google Scholar] [CrossRef]
  41. Zhang, J.; Li, D.; Zhu, W.; Li, Y. In situ 3D printing of poly-ether-ether-ketone/poly-ether-imide hierarchical cellular foams containing electromagnetic absorbent. Addit. Manuf. 2022, 59, 103181. [Google Scholar]
  42. Mouapi, A. Piezoelectric micro generator design and characterization for self-supplying industrial wireless sensor node. Mem.-Mater. Devices Circuits Syst. 2022, 1, 100002. [Google Scholar] [CrossRef]
  43. Qu, Y.; Jin, F.; Yang, J. Stress-induced electric potential barriers in thickness-stretch deformations of a piezoelectric semiconductor plate. Acta Mech. 2021, 232, 4533–4543. [Google Scholar] [CrossRef]
  44. El Hmamsy, Y.; Ennawaoui, C.; Hajjaji, A. Study and design the circuit for piezoelectric vibration energy harvester to charge a datalogger. Int. J. Eng. Appl. Phys. 2021, 1, 18–25. [Google Scholar]
  45. El Hmamsy, Y.; Ennawaoui, C.; Hajjaji, A. Optimized piezoelectric energy harvesting circuit using DC/DC converter. Mater. Today Proc. 2022, 66, 473–478. [Google Scholar] [CrossRef]
  46. Amezquita Garcia, J.A.; Bravo Zanoguera, M.E.; Murrieta-Rico, F.N. Advances and Classification of Autonomous Systems in Biomedical Devices: Integration of Energy Harvesting and Ultra-Low Power Consumption. Electronics 2025, 14, 144. [Google Scholar] [CrossRef]
  47. Sun, Y.; Li, Y.Z.; Yuan, M. Requirements, challenges, and novel ideas for wearables on power supply and energy harvesting. Nano Energy 2023, 115, 108715. [Google Scholar] [CrossRef]
  48. Schmitt, R.F.; Allen, J.W.; Wright, R. Rapid design of SAW oscillator electronics for sensor applications. Sens. Actuators B Chem. 2001, 76, 80–85. [Google Scholar] [CrossRef]
  49. Abbas, S.M.; Abdelhalem, S.H.; Abdipour, A.; Acar, M.; Achar, R.; Adhikari, S.; Aflaki, P.; Afsahi, A.; Afshari, E.; Agah, A.; et al. 2013 Index IEEE Transactions on Microwave Theory and Techniques Vol. 61. IEEE Trans. Microw. Theory Tech. 2013, 61, 4769. [Google Scholar]
  50. Wu, Y.; Zhang, T.; Rao, Y.; Gong, Y. Miniature interferometric humidity sensors based on silica/polymer microfiber knot resonators. Sens. Actuators B Chem. 2011, 155, 258–263. [Google Scholar] [CrossRef]
  51. Caldero, P.; Zoeke, D. Real-Time Wireless Vibration Monitoring Using SAW RFID Tags Coupled with Sensors. In Proceedings of the 2018 15th European Radar Conference (EuRAD), Madrid, Spain, 26–28 September 2018; pp. 118–121. [Google Scholar] [CrossRef]
  52. Xi, Z.; Thomas, J.G.; Ji, J.; Wang, D.; Cen, Z.; Kravchenko, I.I.; Srijanto, B.R.; Yao, Y.; Zhu, Y.; Shao, L. Low-Phase-Noise Surface Acoustic Wave Oscillator Using Phononic Crystal Bandgap-Edge Mode. Phys. Rev. Appl. 2024, 23, 024054. [Google Scholar] [CrossRef]
  53. Liu, H.; Zhang, C.; Weng, Z.; Guo, Y.; Wang, Z. Resonance Frequency Readout Circuit for a 900 MHz SAW Device. Sensors 2017, 17, 2131. [Google Scholar] [CrossRef]
  54. Magome, N.; Morita, N.; Kaneko, S.; Mitsume, N. Higher-continuity s-version of finite element method with B-spline functions. J. Comput. Phys. 2024, 497, 112593. [Google Scholar] [CrossRef]
  55. Nath, D.; Ankit; Neog, D.R.; Gautam, S.S. Application of machine learning and deep learning in finite element analysis: A comprehensive review. Arch. Comput. Methods Eng. 2024, 31, 2945–2984. [Google Scholar] [CrossRef]
  56. Fageehi, Y.A.; Alshoaibi, A.M. Investigating the Influence of Holes as Crack Arrestors in Simulating Crack Growth Behavior Using Finite Element Method. Appl. Sci. 2024, 14, 897. [Google Scholar] [CrossRef]
  57. Swapna Sri, M.N.; Anusha, P.; Madhav, V.V.; Saxena, K.K.; Chaitanya, C.S.; Haranath, R.; Singh, B. Influence of Cu particulates on a356mmc using frequency response function and damping ratio. Adv. Mater. Process. Technol. 2024, 10, 745–753. [Google Scholar] [CrossRef]
  58. Ghandehari, M.A.; Masoodi, A.R.; Panda, S.K. Thermal frequency analysis of double CNT-reinforced polymeric straight beam. J. Vib. Eng. Technol. 2024, 12, 649–665. [Google Scholar] [CrossRef]
  59. Yee, K.; Ong, O.Z.S.; Ghayesh, M.H.; Amabili, M. Various homogenisation schemes for vibration characteristics of axially FG core multilayered microbeams with metal foam face layers based on third order shear deformation theory. Appl. Math. Model. 2024, 125, 189–217. [Google Scholar] [CrossRef]
  60. Kutiš, V.; Gálik, G.; Královič, V.; Rýger, I.; Mojto, E.; Lalinský, T. Modelling and simulation of SAW sensor using FEM. Procedia Eng. 2012, 48, 332–337. [Google Scholar] [CrossRef]
  61. Gowini, E.L.; Mohamed, M.; Moussa, W.A. Finite element model of a MEMS-based surface acoustic wave hydrogen sensor. Sensors 2010, 10, 1232–1250. [Google Scholar] [CrossRef]
  62. Ennawaoui, C.; Hajjaji, A.; Azim, A.; Boughaleb, Y. Theoretical modeling of power harvested by piezo-cellular polymers. Mol. Cryst. Liq. Cryst. 2016, 628, 49–54. [Google Scholar] [CrossRef]
  63. El Hmamsy, Y.; Ennawaoui, C.; Hajjaji, A.; Laayati, O.; Chebak, A. Frequency and load effects on rectifier bridges and active circuits on mechanical energy harvested using piezoelectric materials. Int. J. Renew. Energy Res. 2023, 13, 844–856. [Google Scholar]
  64. Ramana, E.V.; Durairajan, A.; Kavitha, D.; Tobaldi, D.M.; Zavašnik, J.; Bdikin, I.; Valente, M.A. Enhanced magnetoelectric and energy storage performance of strain-modified PVDF-Ba0.7Ca0.3TiO3-Co0.6Zn0.4Fe2O4 nanocomposites. J. Energy Storage 2024, 87, 111454. [Google Scholar] [CrossRef]
  65. Wang, Y.; Lin, L.; Zhang, J.; Wu, T.; Ma, Y.; Li, J.; Yu, S. Exploring the frontiers of SnSeS: A comprehensive review of properties and applications. Mater. Sci. Semicond. Process. 2025, 185, 108862. [Google Scholar] [CrossRef]
  66. Koç, M.; Tatardar, F.; Musayeva, N.N.; Guluzade, S.; Sarı, A.; Paralı, L. The piezoelectric properties of three-phase electrospun PVDF/PZT/Multiwalled Carbone Nanotube composites for energy harvesting applications. J. Alloys Compd. 2024, 1003, 175578. [Google Scholar] [CrossRef]
  67. Mukherjee, A.; Ghosh, B.D.; Roy, S.; Goh, K.L. Ultra strong flexible Ba0.7Sr0.3Zr0.02Ti0.98O3/MWCNT/PVDF Nanocomposites: Pioneering material with remarkable energy storage for Self-Powered devices. Chem. Eng. J. 2024, 488, 151014. [Google Scholar] [CrossRef]
  68. Magdy, G.; Hassanin, A.H.; Kandas, I.; Shehata, N. PVDF Nanostructures Characterizations and Techniques for Enhanced Piezoelectric Response: A Review. Mater. Chem. Phys. 2024, 325, 129760. [Google Scholar] [CrossRef]
  69. Su, Q.; Zou, Q.; Li, Y.; Chen, Y.; Teng, S.Y.; Kelleher, J.T.; Nith, R.; Cheng, P.; Li, N.; Liu, W.; et al. A stretchable and strain-unperturbed pressure sensor for motion interference–free tactile monitoring on skins. Sci. Adv. 2021, 7, eabi4563. [Google Scholar] [CrossRef]
  70. Derraz, M.; Ennawaoui, C.; Mastouri, H.; El Hmamssy, Y.; Abouricha, N.; Rjafallah, A.; Hajjaji, A. Mathematical modeling for predicting electrical energy harvested using piezoelectric composite materials for smart system applications. Micro Nano Eng. 2024, 23, 100253. [Google Scholar] [CrossRef]
  71. Derraz, M.; Radoine, H.; Boumegnane, A.; Achour, M.A.B.; Ennawaoui, C.; Hajjaji, A. Development of a novel Bi4Ti3O12/chitosan/rGO piezoelectric bio-composite for mechanical energy harvesting: Output energy optimization using response surface methodology modelling. Ceram. Int. 2025, 51, 2660–2673. [Google Scholar] [CrossRef]
  72. Buscarino, A.; Famoso, C.; Fortuna, L.; La Spina, G. Nonlinear jump resonance: Recent trends from analysis to electronic circuits implementations. IEEE Trans. Circuits Syst. II Express Briefs 2023, 71, 1727–1732. [Google Scholar] [CrossRef]
Figure 1. Atonomous sensor for carbon dioxide detection.
Energies 18 03082 g001
Figure 2. 3D (a) and 2D (b) configurations of the SAW sensor with a (PEI/Cu/LiTaO3) structure.
Energies 18 03082 g002
Figure 3. 3D configuration of the system: (a) Electromechanical structure, (b) Meshing based on quality.
Energies 18 03082 g003
Figure 4. 2D Model Geometry: (a) Structure Composition (PEI/Cu/LiTaO3), (b) Mesh Representation.
Energies 18 03082 g004
Figure 5. Harvested Electrical Power by PZT-5H: (a) Analytical power vs. load at 90 Hz, (b) Analytical power vs. load and frequency, (c) Numerical power vs. load at 90 Hz.
Energies 18 03082 g005
Figure 6. Harvested Electrical Power Comparison: (a) Analytical power of PZT-5H vs. load at 110 Hz, (b) Analytical power of PVDF vs. load and frequency, (c) Numerical power of PZT-5H vs. load at 110 Hz.
Energies 18 03082 g006
Figure 7. Electrical power as a function of time.
Energies 18 03082 g007
Figure 8. Electrical response of PZT and PVDF subjected to sinusoidal mechanical excitation: (a,b) change in normalized current; (c,d) change in electrical power as a function of time and stress amplitude.
Energies 18 03082 g008
Figure 9. Instantaneous electrical power for different widths of the piezoelectric materials: (a) electrical power for PZT, (b) electrical power for PVDF.
Energies 18 03082 g009
Figure 10. Distribution of electric field lines on the 2D model for the first resonance frequencie.
Energies 18 03082 g010
Figure 11. Variation of resonance frequency: (a) as a function of CO2 concentration; (b) as a function of gas pressure; (c) as a function of gas temperature; (d) as a function of adsorbent thickness.
Energies 18 03082 g011
Table 1. Geometric parameters of the piezoelectric material and the steel beam.
DimensionPiezoelectric MaterialBeam (Steel)
L (cm)77
e (cm)0.060.04
Table 2. Material properties of Polyetherimide (PEI) and Copper (Cu).
MaterialPoisson’s Ratio ( ν )Young’s Modulus (GPa)Density (kg/m3)
Polyetherimide (PEI)0.431270
Copper (Cu)0.341208960
Table 3. Material properties of PZT and PVDF.
Material ε r 33 d 33 (pC · N−1)Density (kg/m3)
PZT1700−5937750
PVDF7.633.81780
Table 4. First resonance frequency as a function of CO2 gas concentration at a pressure of 1 atm, a temperature of 25 °C, and a PEI film thickness of 500 nm.
c 0 (ppm) f r av (Hz) f r app (Hz) Δ f r (Hz)
10767,382,904.06767,382,898.445.62
100767,382,904.06767,382,847.8556.21
200767,382,904.06767,382,791.64112.43
300767,382,904.06767,382,735.42168.64
400767,382,904.06767,382,679.21224.85
500767,382,904.06767,382,622.99281.07
600767,382,904.06767,382,566.78337.29
700767,382,904.06767,382,510.56393.50
800767,382,904.06767,382,454.34449.72
900767,382,904.06767,382,398.12505.94
1000767,382,904.06767,382,341.91562.16
Table 5. Variation of the resonance frequency as a function of PEI film thickness at a pressure of 1 atm and a temperature of 25 °C.
e abs (nm) Δ f r (Hz) Pour 400 Δ f r (Hz) Pour 500 Δ f r (Hz) Pour 600
30048.4660.5772.68
400714.33892.911071.5
500216.62138.38324.92
600224.85281.06337.28
7002738.663423.364108.05
8003228.774036.004843.25
9001052.941316.181579.42
Disclaimer/Publisher’s Note: The statements, opinions and data contained in all publications are solely those of the individual author(s) and contributor(s) and not of MDPI and/or the editor(s). MDPI and/or the editor(s) disclaim responsibility for any injury to people or property resulting from any ideas, methods, instructions or products referred to in the content.

