1. Introduction
With the construction of a multi-energy power generation base, renewable energy, namely, wind, photovoltaics, and hydropower, is developing rapidly. However, due to the uncertainty of wind and photovoltaics, the smooth operation of the power grid is affected through the integration of a single power generation base of wind and photovoltaics. Therefore, it is necessary to complement power generation bases with dynamic regulation characteristics. Limited by minimum start and stop times, thermal power generation bases struggle with timely reductions in power during peak load periods of wind and photovoltaics. In contrast, the outputs of hydropower generation bases are flexible to adjust by adjusting the generation flow. Therefore, the rapid response capability and dynamic regulation characteristics of hydropower generation bases are promising for improving the reliability of the power grid by maximizing the consumption of wind and photovoltaic.
The large-scale integration of wind and photovoltaic power generation bases is challenging in the planning of the power grid. It is of interest to study how to utilize the complementarity of wind–photovoltaic–hydropower to improve the reliability of the power grid [
1,
2,
3,
4,
5,
6,
7,
8,
9,
10]. Based on different scenarios, Jia et al. analyzed the complementarity of photovoltaic–hydropower with the optimization scheduling model [
4]. Hu et al. studied the intelligent optimization operation strategy of a wind–photovoltaic–hydropower power generation base [
5]. Utilizing the rapid response capability and dynamic regulation characteristics of hydropower, Zhang et al. suppressed abandoned wind and abandoned light effectively with an optimization operation model [
6]. To maximize the consumption of wind and photovoltaics, Ding et al. validated the effectiveness of the optimization operation model [
7]. By analyzing the complementarity of wind, photovoltaics, and hydropower, Cheng et al. presented a collaborative optimization scheduling model [
8]. To contribute to the development of multi-energy power generation bases, Gu et al. studied their efficiency [
9]. To minimize the cost of the power grid, Wu et al. developed an optimization operation model to improve the efficiency of the multi-energy power generation base effectively [
10].
To develop renewable energy power generation technology, the complementary operation of multi-energy power generation bases has been studied widely [
11,
12,
13,
14,
15,
16,
17,
18,
19,
20]. To simulate outputs of wind and photovoltaics, the complementary operation scheduling model was presented by Xiao et al., with which the feasible complementary operation area of wind and photovoltaics is calculated [
15]. To describe the self-healing process of wind and hydropower, the complementary operation coordination strategy was developed by Golshani et al., who improved the reliability of the power grid by adopting the complementary operation coordination strategy [
16]. Jurasz et al. presented a mixed-integer nonlinear programming model to simulate the complementary operation of wind power, photovoltaic power, and hydropower; the amount of abandoned wind and abandoned light in the power grid was decreased significantly [
17]. To improve the power generation plan of the multi-energy power generation base, a robust complementary operation scheduling model was developed by Ming et al. to optimize outputs of wind and photovoltaics [
18]. To improve the penetration rate of wind and photovoltaic significantly, Lu et al. studied the multi-energy power generation base by simulating different operation scenarios [
19]. To evaluate the capacity of the renewable energy accurately, Bhandari et al. presented a small-scale multi-energy power generation system, where the reliability of the power grid was improved effectively by optimizing the outputs of wind and photovoltaics [
20].
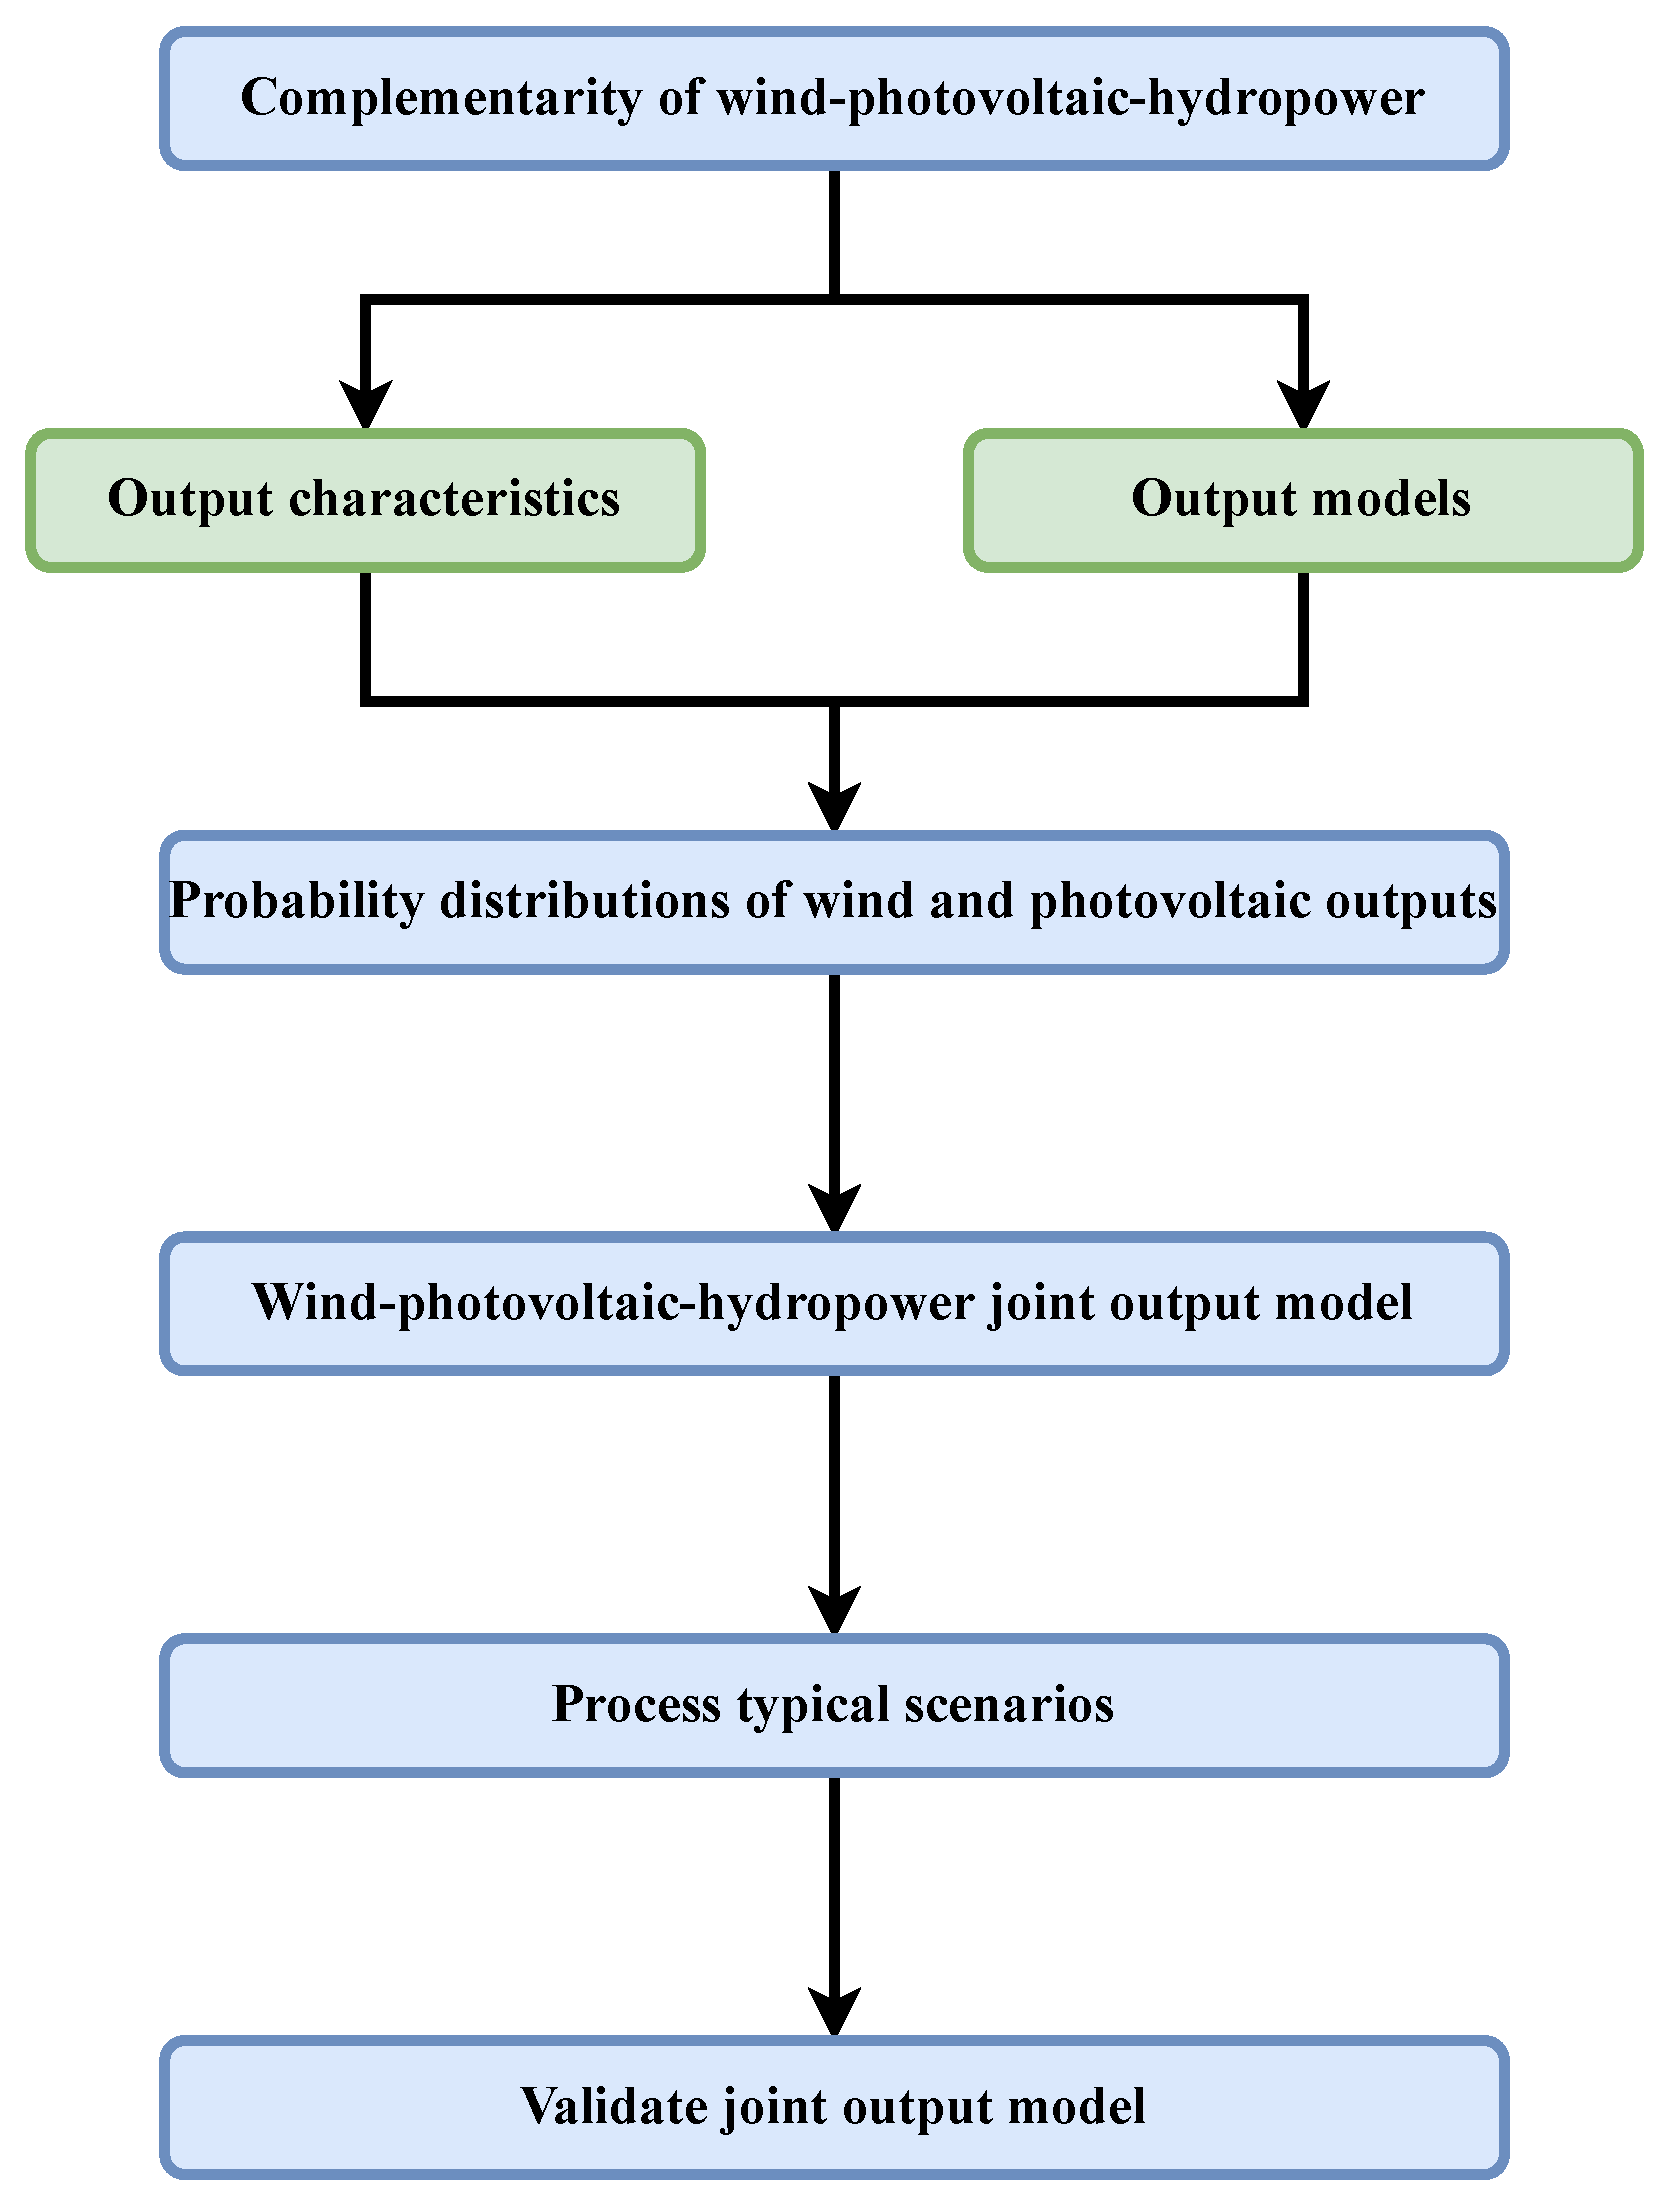
The complementary operation of renewable energy, namely, wind and photovoltaics, is widely studied. The fluctuation of wind and photovoltaic outputs affects the reliability of the power grid, which is sensitive to wind speed and light intensity. However, a wind–photovoltaic joint output model related to wind speed and light intensity is absent. To decrease the amount of abandoned wind and abandoned light, it is necessary to conduct a correlation analysis of wind–photovoltaic–hydropower outputs. Studying the output characteristics of wind, photovoltaics, and hydropower, as well as the impact of the large-scale renewable energy integrated into the power grid, is promising in terms of maximizing the consumption of renewable energy and improving the reliability of the power grid. Aiming to overcome the limitations of existing studies, this study followed the workflow shown in
Figure 1. Firstly, the present work analyzes the complementarity of wind–photovoltaic–hydropower, where the output characteristics of wind, photovoltaics, and hydropower are introduced, and output models related to wind speed, light intensity, and water level are established. Then, the probability distributions of wind and photovoltaic outputs are calculated with the maximum likelihood method, and the correlation analysis of wind–photovoltaic–hydropower outputs is conducted, where the wind–photovoltaic–hydropower joint output model is established. Lastly, to process typical scenarios of wind–photovoltaic joint output, the k-means clustering algorithm is adopted. Compared to more advanced clustering algorithms, like DBSCAN, hierarchical clustering, and spectral clustering, the k-means clustering algorithm is conceptually straightforward, and is easier to implement. In addition, the computational efficiency and scalability of the k-means clustering algorithm is more advantageous, which is suitable for large-scale datasets. Meanwhile, the k-means clustering algorithm requires the minimal computational resources compared to more advanced clustering algorithms, and is more business-friendly. To validate the wind–photovoltaic–hydropower joint output model, a case study was conducted.
2. Wind–Photovoltaic–Hydropower Output Characteristics
To realize high-quality power output from a wind–photovoltaic–hydropower power generation base, understanding output characteristics of wind–photovoltaic–hydropower is important.
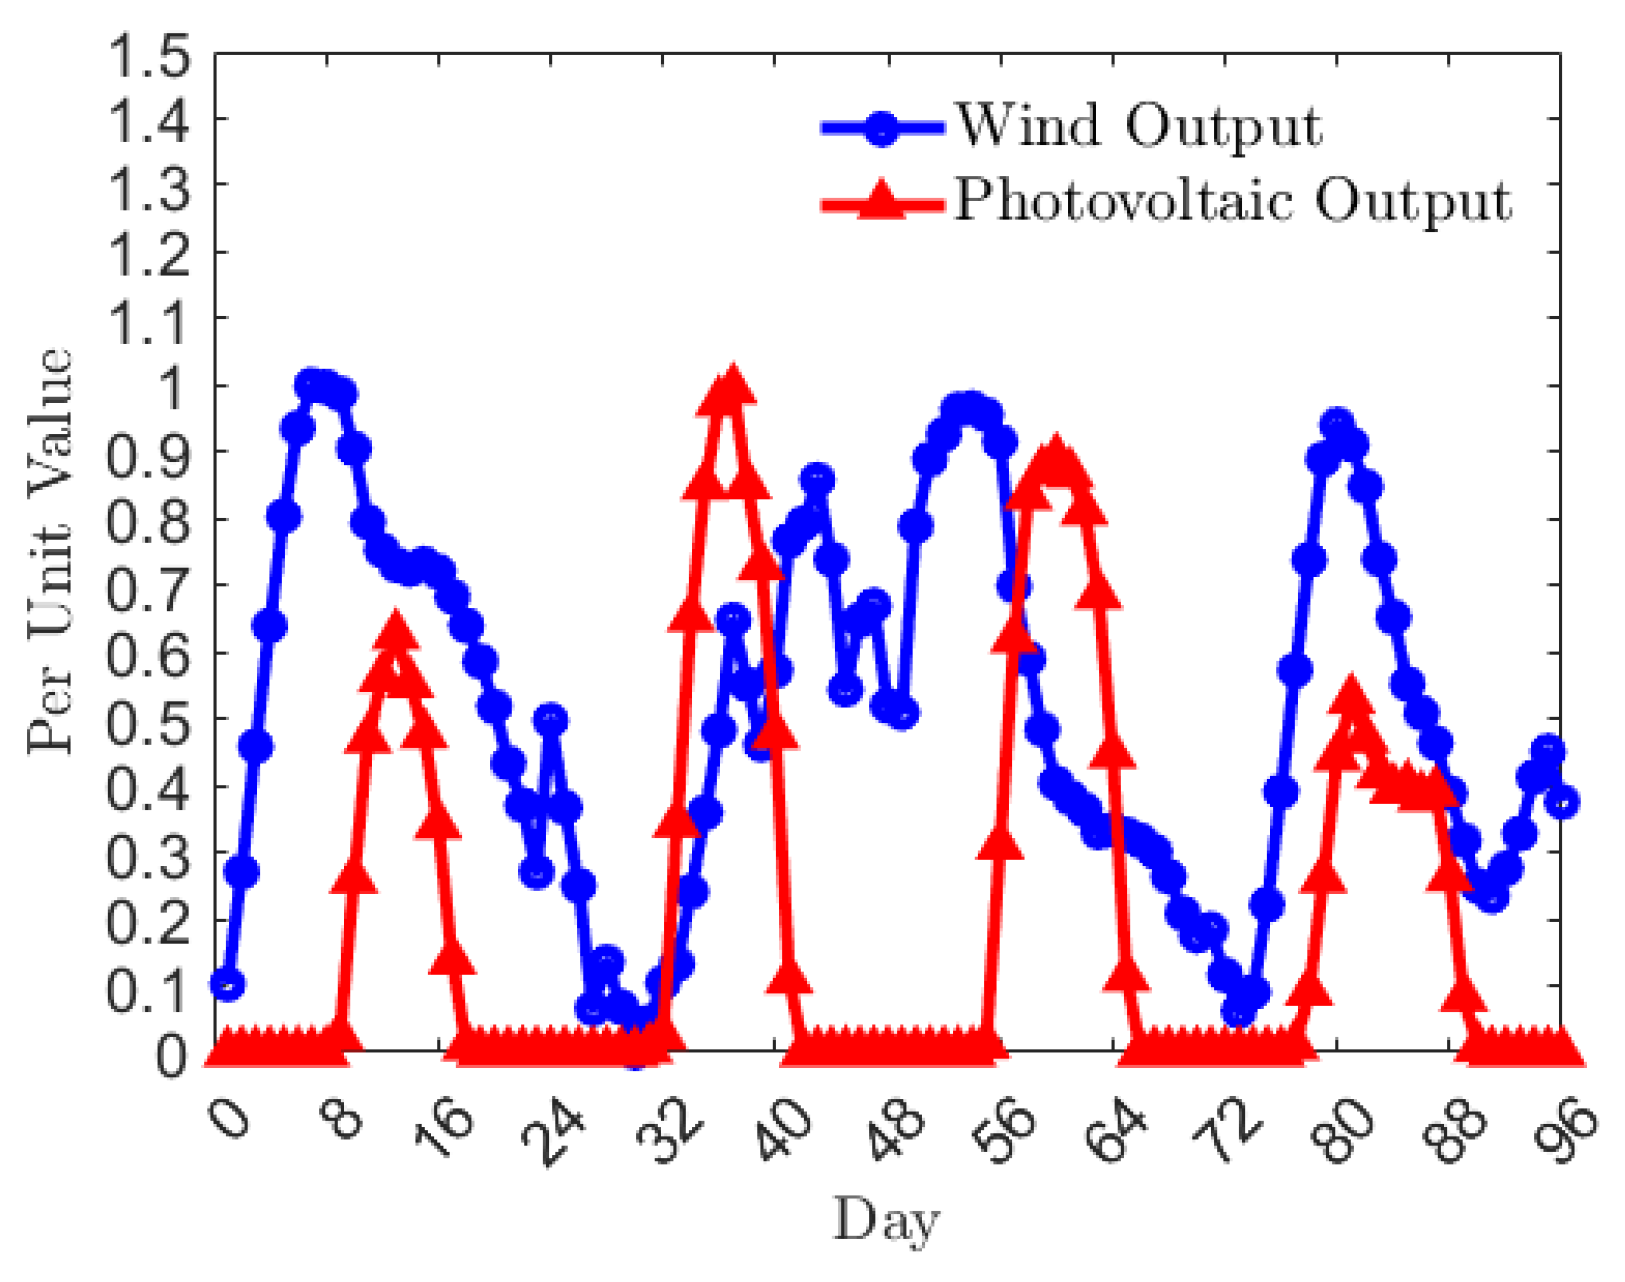
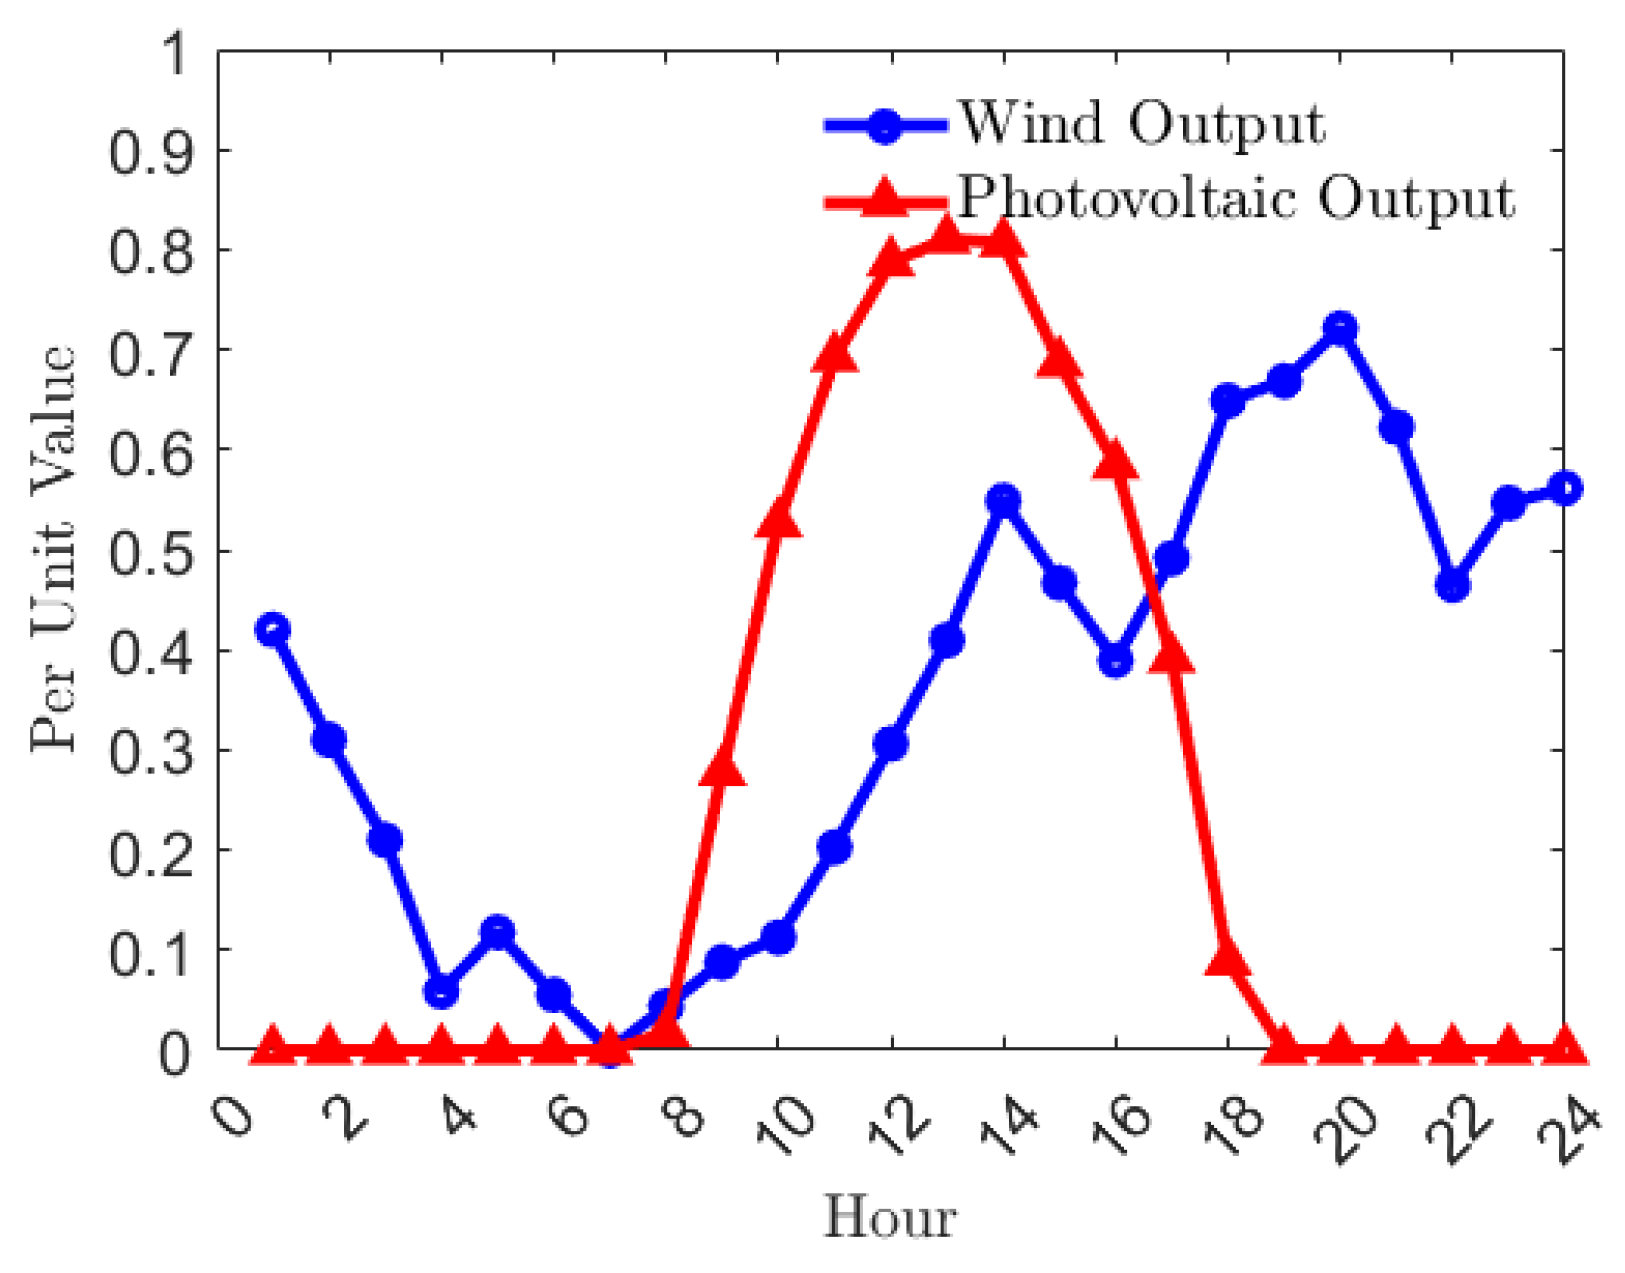
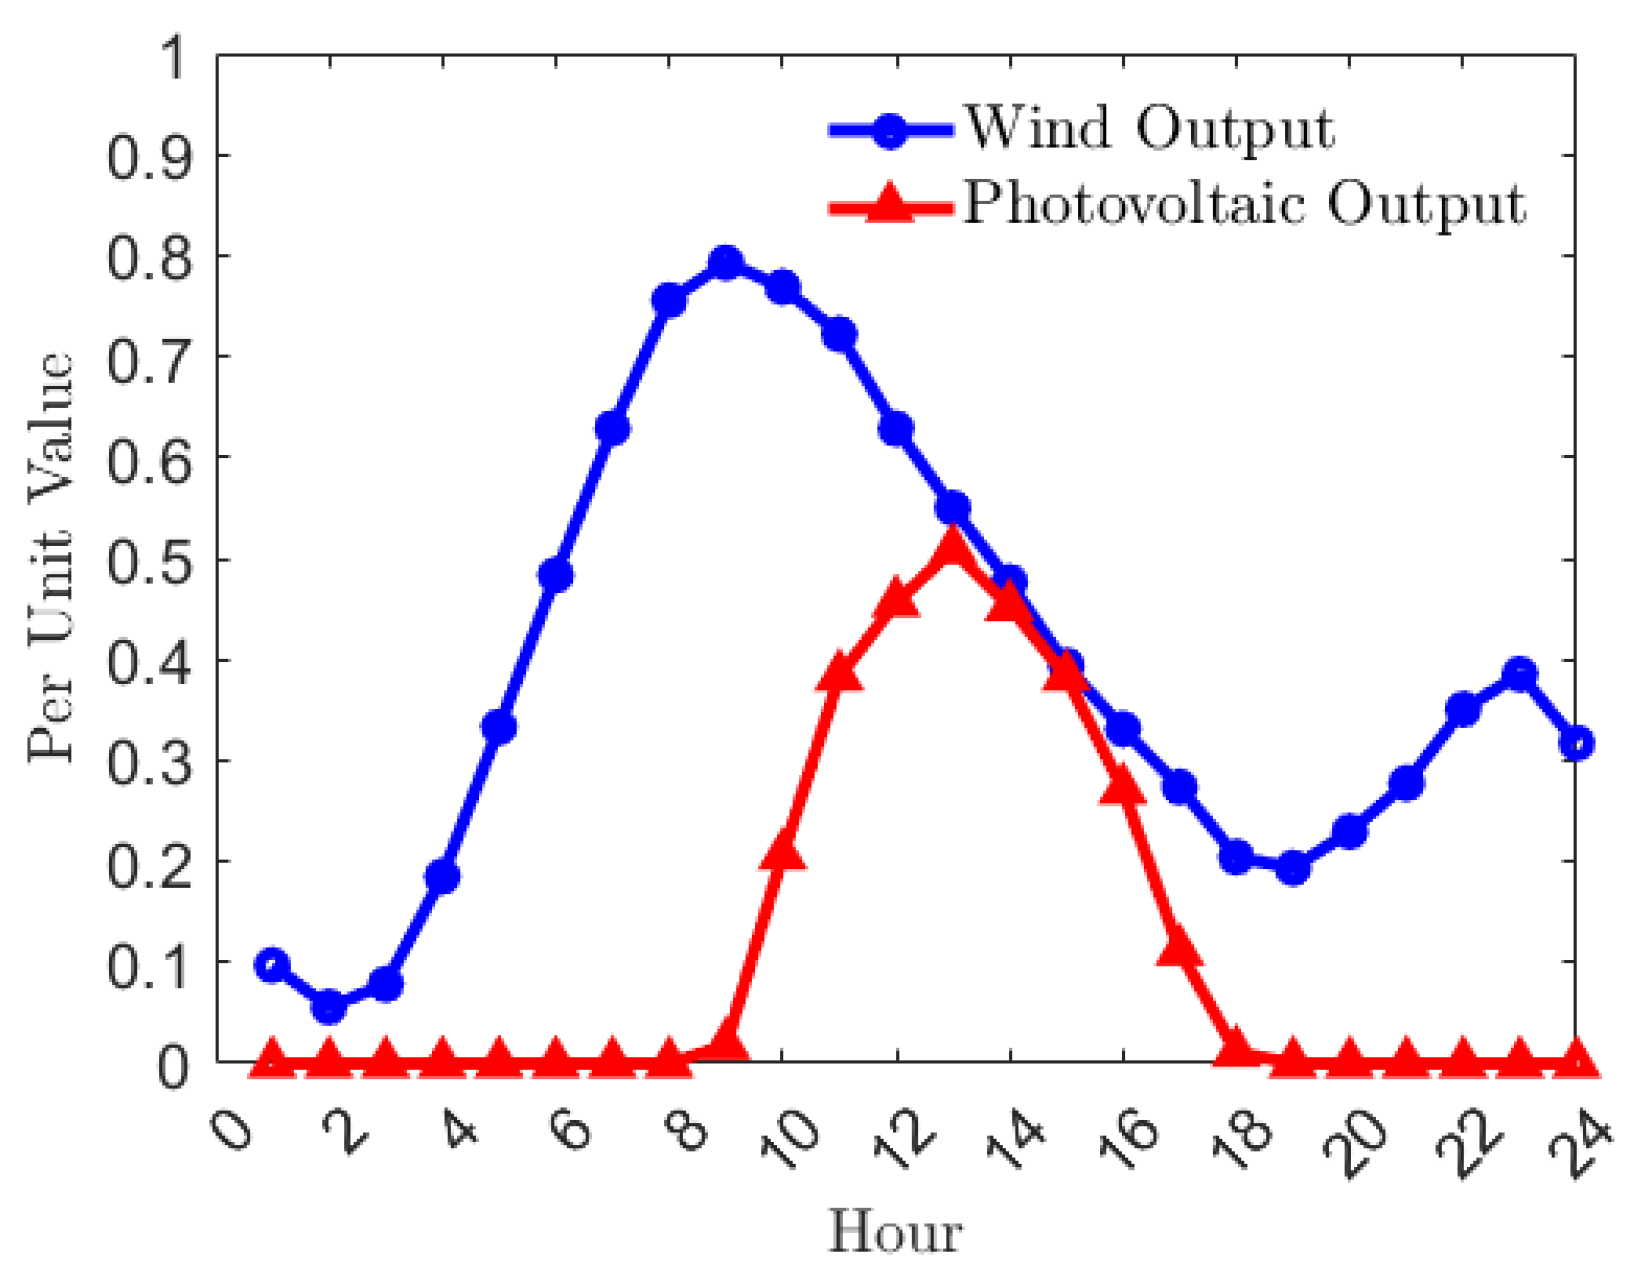
Figure 2 shows output characteristics of wind and photovoltaic power generation bases in Qinghai Province. The uncertainty of wind and photovoltaic outputs is obvious. Affected by climatic conditions, wind stations can only generate electricity when wind speeds meet certain conditions, while photovoltaic stations can only generate electricity when light intensity is sufficient. Due to unstable wind and photovoltaic outputs, abandoned wind and abandoned light occur.
Regarding clean renewable energy, water energy resources are inexhaustible. Hydropower stations built near large reservoirs can regulate water energy resources, which store water energy during low-load periods and release it to generate electricity during peak-load periods, improving the quality of electricity effectively. Unlike wind and photovoltaic power, hydropower output is not affected by climatic conditions completely. Hydropower stations can utilize the storage characteristics of reservoirs to determine electricity based on water and adjust water based on electricity, which is more flexible.
3. Wind–Photovoltaic–Hydropower Output Models
The generator of the wind turbine is driven by wind energy, converting wind energy to electricity. The output of the wind turbine is related to the wind speed directly, which is approximately dependent on the wind speed linearly:
where
is the output of the wind turbine,
is the rated output of the wind turbine,
v is the wind speed,
is the cut-in wind speed,
is the cut-out wind speed, and
is the rated wind speed.
Different to the wind turbine, the light energy is converted to electricity directly by the photovoltaic cell. The photovoltaic power generation base is made up of photovoltaic arrays, converters, and inverters. The output of the photovoltaic power generation base is related to the light intensity directly:
where
is the output of the photovoltaic power generation base,
is the rated output of the photovoltaic power generation base,
I is the light intensity,
is the conversion efficiency of the photovoltaic cell,
T is the temperature of the photovoltaic cell,
is the rated temperature, and
is the conversion efficiency of the inverter. Since the light intensity and temperature of the photovoltaic cell are reported, the output of the photovoltaic power generation base is calculated.
Unlike wind and photovoltaic power, hydropower output is not completely affected by climatic conditions. The output of hydropower is related to its generation flow, reservoir capacity and water head. The generation flow and water head are affected by the reservoir water level. Therefore, the output of hydropower is related to the generation flow and reservoir water level:
where
is the output of hydropower,
K is the generator conversion efficiency,
Q is the generation flow,
L is the upstream reservoir water level, and
is the tail reservoir water level. The reservoir capacity varies with time, which is related to the upstream reservoir inflow, the generation flow, and the waste water:
where
is the reservoir capacity at the end of time
t,
is the reservoir capacity at the beginning of time
t,
is the upstream reservoir inflow,
is the generation flow,
is the waste water, and
is the time interval.
To establish output models of wind–photovoltaic–hydropower, some key inputs and assumptions are needed, which are listed in
Table 1.
5. Correlation Analysis of Wind–Photovoltaic–Hydropower Outputs
Although wind and photovoltaic outputs are uncertain, the output of hydropower is affected by the upstream reservoir inflow; there is a certain complementarity among them [
27,
28,
29,
30,
31]. To measure the correlation between two random variables, the Kendall rank correlation coefficient is adopted, which is the difference between the probability of observation values being consistent and inconsistent between two randomly selected groups of samples, that is,
The Kendall rank correlation coefficient indicates that the changes in the two variables are completely consistent, indicates that the changes in the two variables are completely opposite, indicates that the two variables are independent, indicates that is positively correlated with , and indicates that is negatively correlated with . The principle of wind–photovoltaic–hydropower complementarity is to fully utilize the rapid response capacity and dynamic regulation characteristics of hydropower to achieve energy storage supported by electricity during large-scale wind and photovoltaic power generation, and energy storage supported by hydropower during small-scale wind and photovoltaic power generation, smoothing the fluctuation in wind and photovoltaic outputs.
The multi-variable joint distribution function is described using multi-variable distribution functions and the Copula function. Assuming that the distribution functions of random variables
x and
y are
and
, respectively, and
is the joint distribution function of these two variables, there is a function that satisfies
The Copula function makes up for the lack of correlation description between multiple variables and lays the foundation for establishing correlation models:
where
indicates that there is a positive correlation between the random variables,
indicates that there is a negative correlation between the random variables, and
indicates that the random variables are nearly independent.
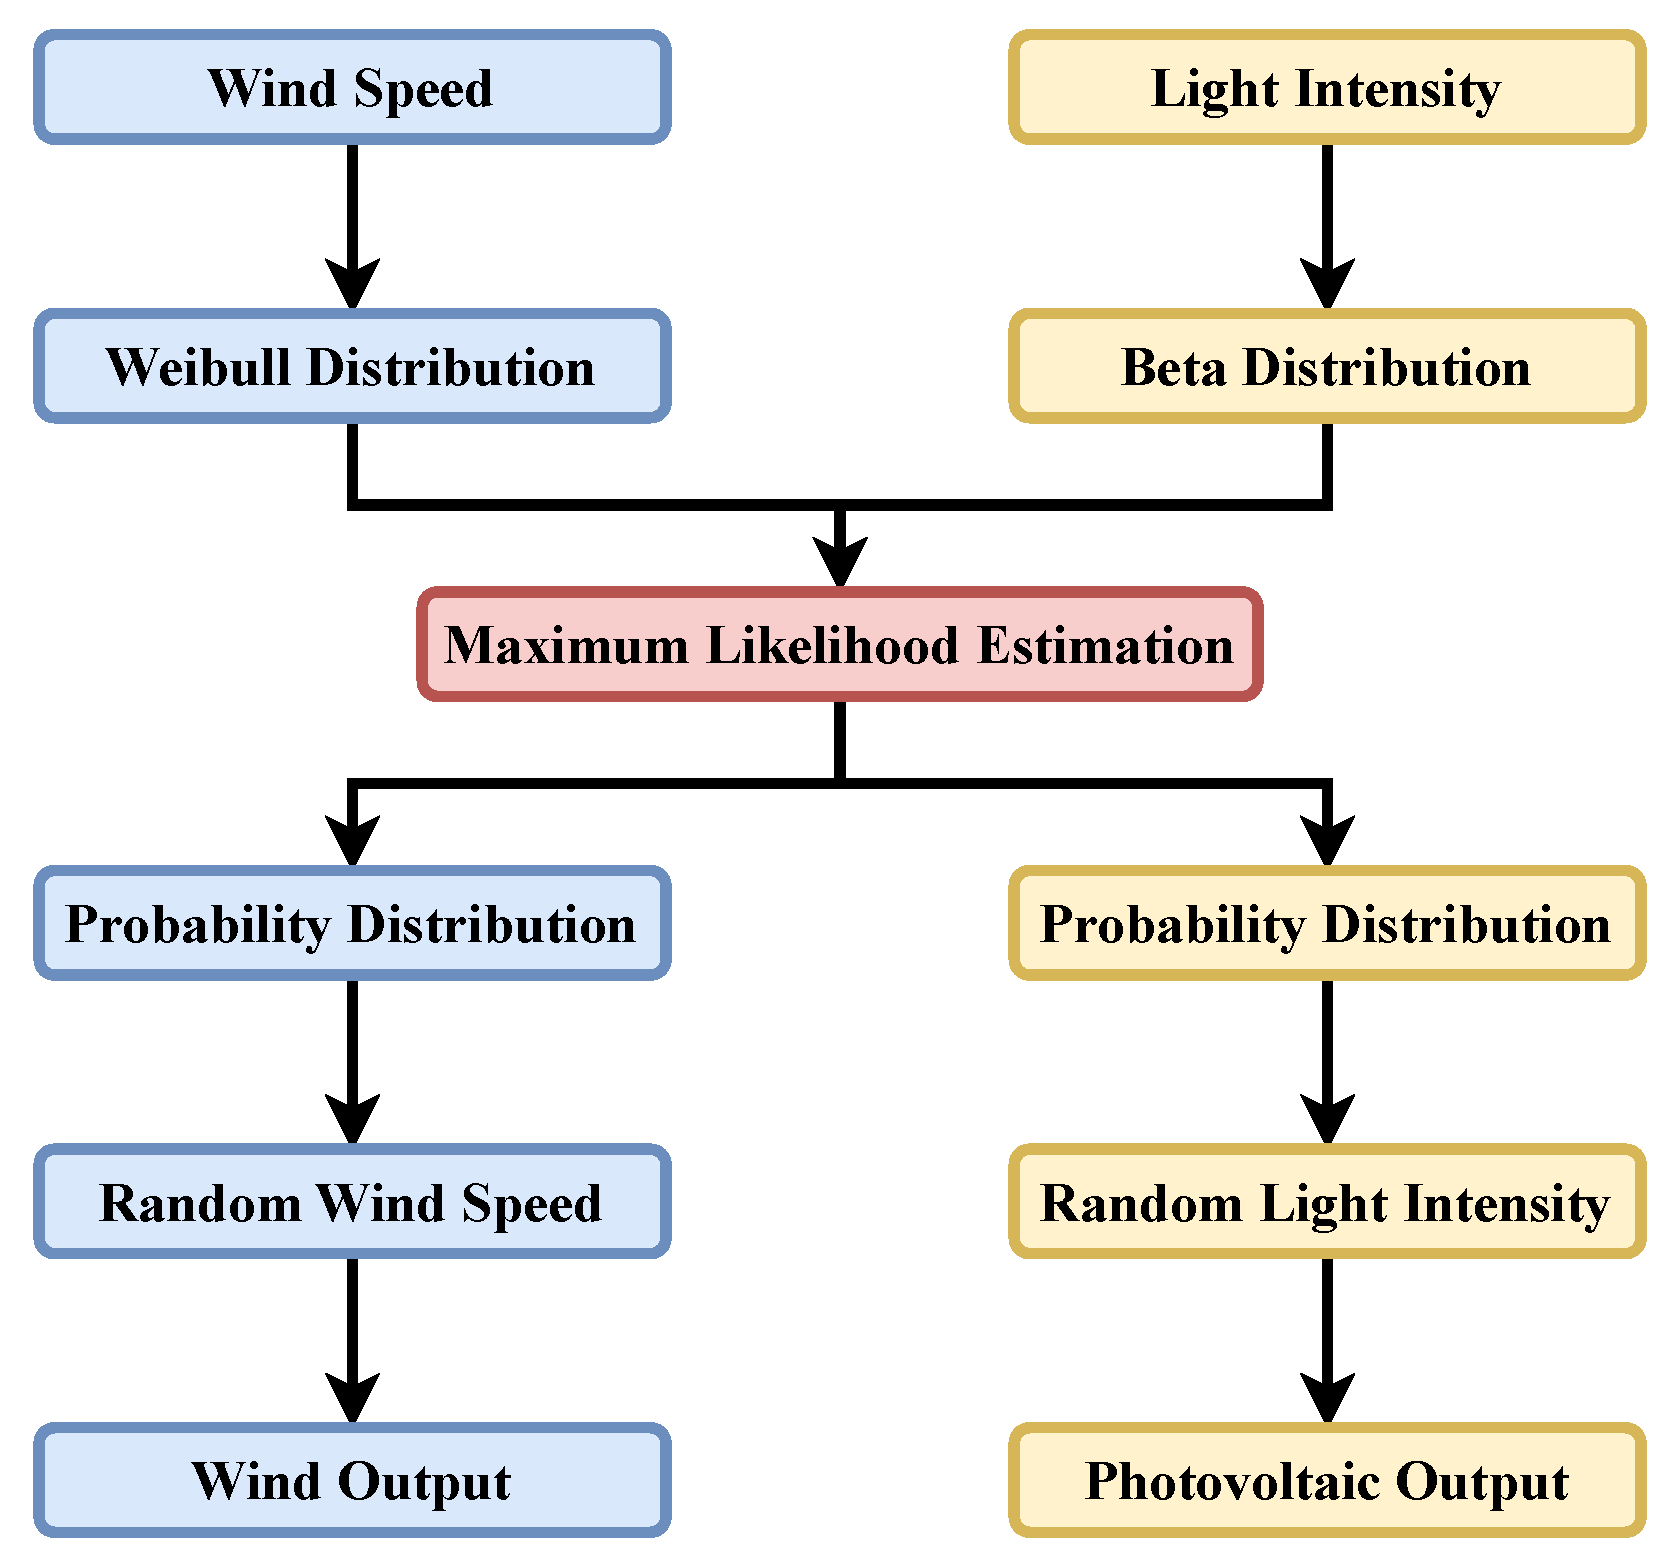
Figure 4 shows the development of the wind–photovoltaic joint output model through the adoption of the Copula function. Firstly, wind speed and light intensity data are read, and wind and photovoltaic outputs are calculated. Next, the probability distributions of wind and photovoltaic outputs are estimated with maximum likelihood estimation. Then, the joint probability distribution function of the wind–photovoltaic joint output is established based on the Copula function. Lastly, the Kendall rank correlation coefficient is calculated. The closer the Kendall rank correlation coefficient to that of wind and photovoltaic outputs, the better the fitting goodness of the Copula function. We should point out that the Copula function is estimated dynamically across time windows, since wind and photovoltaic outputs vary with time.
To process typical wind–photovoltaic joint output scenarios, the k-means clustering algorithm is adopted, which is an unsupervised clustering algorithm with the advantages of a simple principle and fast clustering speed [
32,
33,
34,
35,
36]. Compared to more advanced clustering algorithms, like DBSCAN, hierarchical clustering, and spectral clustering, the k-means clustering algorithm is conceptually straightforward, and is easier to implement. In addition, the computational efficiency and scalability of the k-means clustering algorithm is more advantageous, which is suitable for large-scale datasets. Meanwhile, the k-means clustering algorithm requires the minimal computational resources compared to more advanced clustering algorithms, and is more business-friendly. The k-means clustering algorithm is a process of repeatedly moving the center point of a class, where the Euclidean distance is adopted. The cluster centroid is computed to be the mean of all points in the cluster. The k-means clustering algorithm aims to minimize the within-cluster sum of squares, which is equivalent to minimizing the sum of squared Euclidean distances between data points and their assigned cluster centroids. During each iteration, points are assigned to the cluster with the closest centroid, which is determined by the Euclidean distance. In the present study, to determine the optimal number of clusters k, the elbow method is adopted, which is relatively simple and visual. The within-cluster sum of squares (WCSS) is computed for varying k. The relationship between k and WCSS is plotted, the elbow is observed, where WCSS decline slows, and the optimal number of cluster k is selected. To adopt the clustering, the cluster number is determined, where the elbow method is adopted, and the dataset is divided according to the Euclidean distance between the data. In calculating the Euclidean distance, the Euclidean distance between data points within a class is minimized. If the maximum number of iterations is
N, the output sets are
, and the clustering is evaluated by minimizing the squared error
E:
where
is the centroid of class
, that is,
In using the present wind–photovoltaic joint output model, the probability distribution function of each time period is selected to generate abundant joint output scenarios. The generated abundant wind–photovoltaic joint output scenarios are reduced with clustering algorithms. The representative scenario is selected with the data point adjacent to the clustering centeroid, which is the typical wind–photovoltaic joint output scenario. Then, scenario clustering is mainly used to reduce typical daily operating scenarios, mainly divided into summer typical days and winter typical days, as shown in
Figure 5 and
Figure 6.
6. Case Study
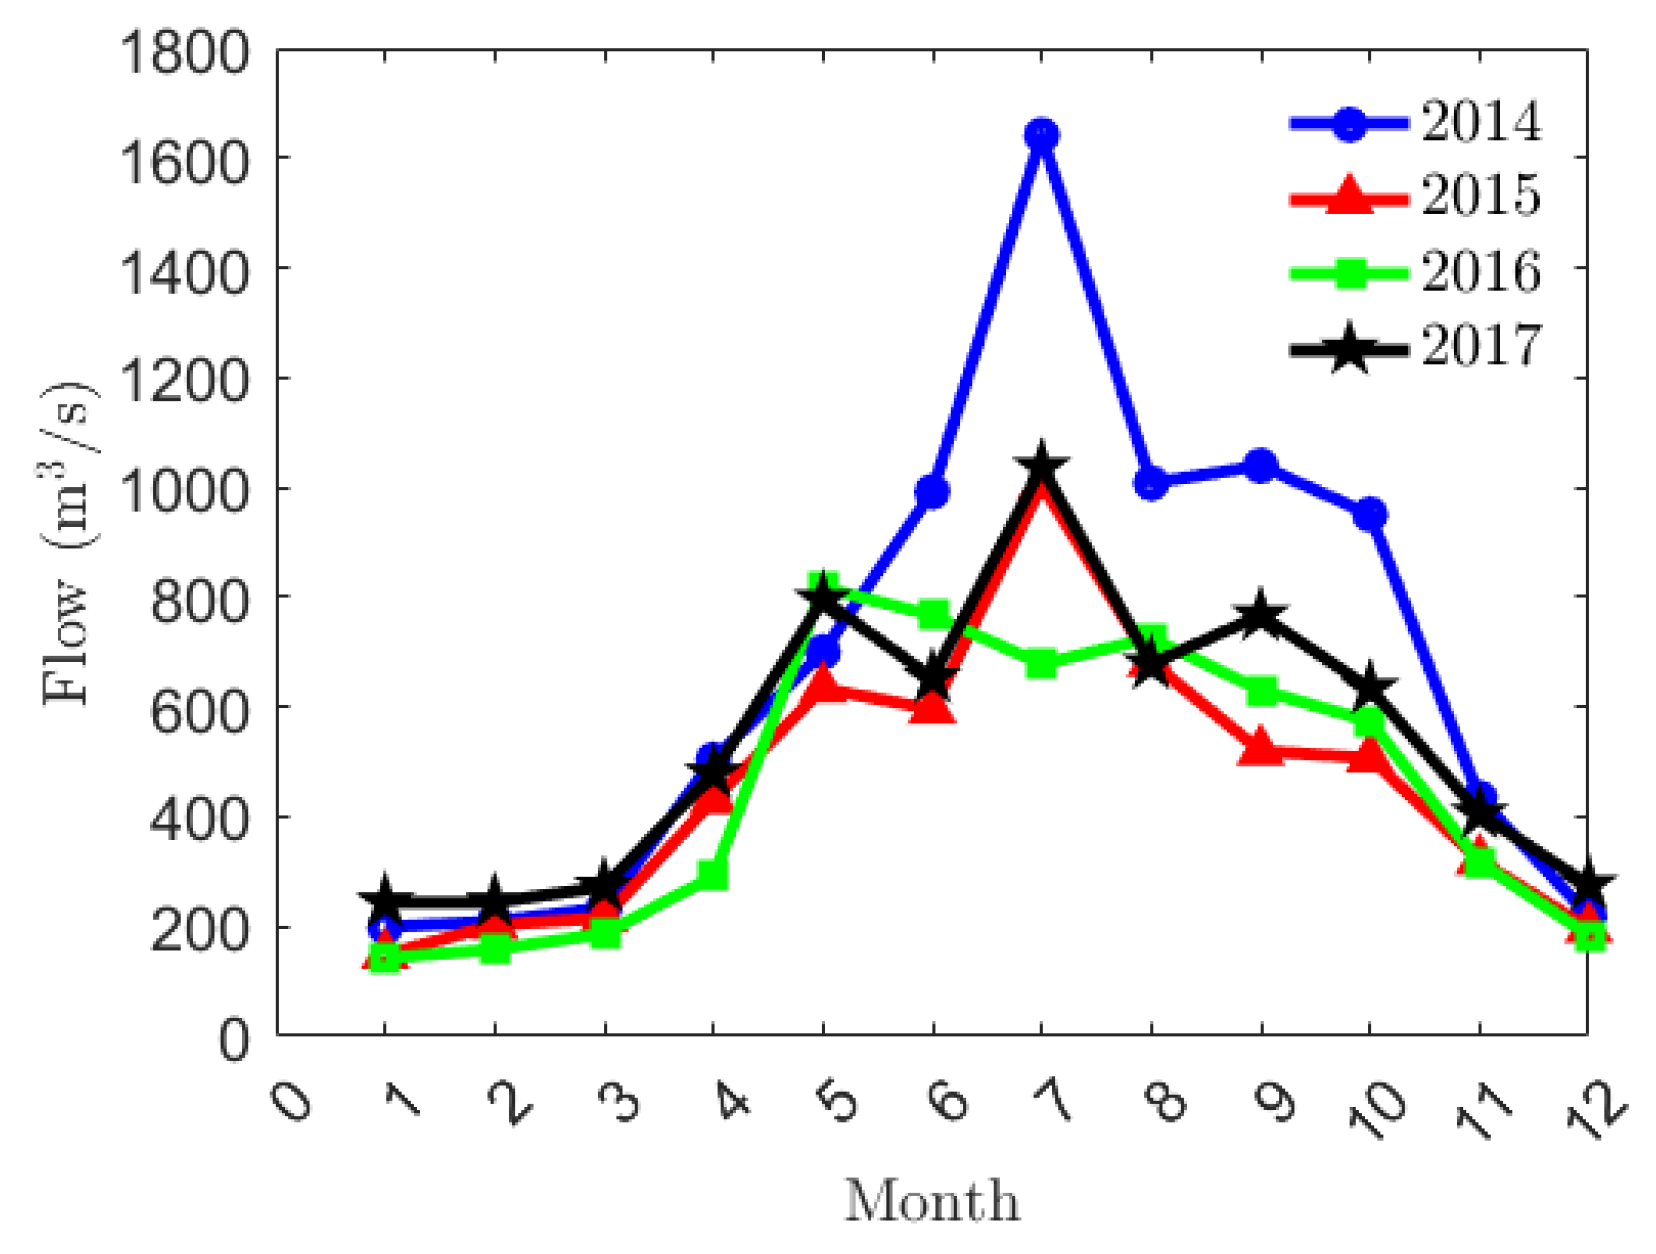
There are complex landforms, numerous rivers, and abundant water resources in Qinghai Province, China. Long-yang-xia Reservoir is built along the main stream of Huang River in Qinghai Province, which is the primary cascade of the Huang River and a multi-year regulating reservoir. The Long-yang-xia Hydropower Station is equipped with four hydroelectric generating units. Since the altitude of Qinghai Province is high, the sunshine hours of Qinghai Province are long, and the solar radiation of Qinghai Province is strong. The abundant solar energy resources make Qinghai Province advantageous for developing photovoltaic power generation. The west part of Qinghai Province is dry and windy, with abundant wind energy resources. The continuous construction of photovoltaic and wind power generation bases is challenging to the reliability of the power grid of Qinghai Province. To absorb wind and solar energy and ensure the reliable operation of the power grid of Qinghai Province, a complementary analysis of wind–photovoltaic–water data samples from Xining City, Qinghai Province, was conducted. In terms of historical hydrological data, the monthly inflow of the Long-yang-xia Reservoir over the years is shown in
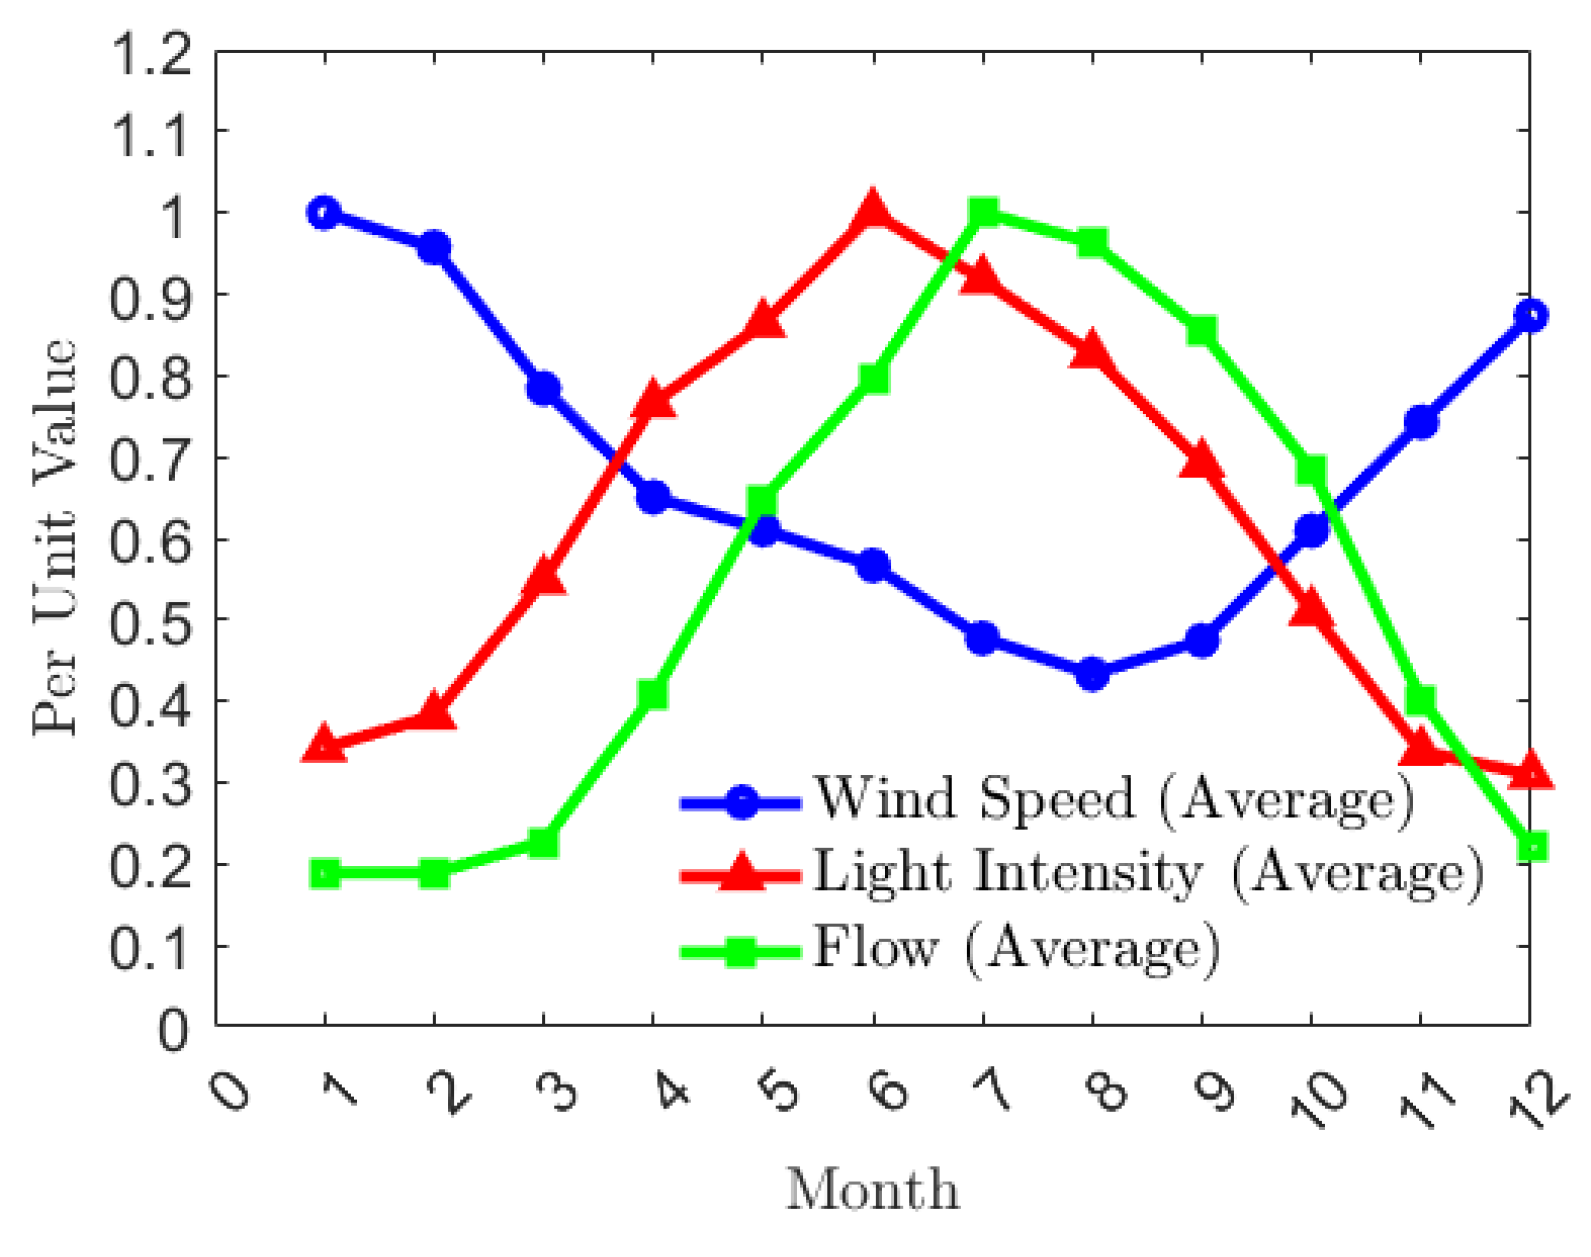
Figure 7. According to the monthly inflow data, the years are divided into wet year, normal year, and dry year. According to the probability of 0.5 for normal hydrological years and 0.25 for wet and dry years in historical hydrological years, the average monthly inflow of the reservoir was calculated. The monthly average wind speed, monthly average light intensity, and monthly average flow of Xining City are shown in
Figure 8. Though the monthly average wind speed and light intensity are unable to describe the fluctuation, the trend in the fluctuation is similar, namely, the monthly average wind speed and light intensity are able to validate the joint output model. The wind speed satisfies the Weibull distribution as follows:
The light intensity satisfies the Beta distribution as follows:
where
v is the wind speed,
and
are the parameters of the Weibull distribution,
I is the light intensity, and
,
, and
are the parameters of the Beta distribution.
The Kendall rank correlation coefficients are listed in
Table 2. The wind–light Kendall rank correlation coefficient is −0.5539, the wind–water Kendall rank correlation coefficient is −0.9540, and the light–water Kendall rank correlation coefficient is −0.5758. In terms of the Kendall rank correlation coefficients, wind speed and light intensity exhibit opposite trends over a long time scale, with the Kendall rank correlation coefficient of −0.5539, indicating that there is a certain complementarity between wind and photovoltaic energy. Wind speed and incoming water also show opposite trends over a long period of time, with the Kendall rank correlation coefficient of −0.9540, indicating that there are strong complementary characteristics between wind and hydropower. The water and light intensity show the same trend in change over a long time, indicating that the complementary characteristics of water and light are relatively poor. To realize the joint scheduling of photovoltaic–hydropower complementarity, hydropower is adopted as energy storage to adapt to the photovoltaics.
7. Conclusions
The complementary power generation base of wind–photovoltaic–hydropower is a direction for future development. To improve the economic efficiency and reliability of the multi-energy power grid, the complementarity of multi-energy is analyzed, and the feasibility of the multi-energy complementary power generation base is validated. With the increase in the wind and photovoltaic power capacity, fluctuation in wind and photovoltaic is inevitable, and the smooth operation of the power grid is affected. To improve the reliability of the multi-energy power grid, the dynamic regulation ability of hydropower is utilized, making up for the fluctuation in wind and light intensity and decreasing the amount of wind abandoned and light abandoned. The complementarity of hydropower–wind–light is suitable for the development of multi-energy power generation systems, where wind, light, and water output characteristics are introduced, and output models related to wind speed, light intensity, and water level are established. Furthermore, in adopting the maximum likelihood estimation, the probability distributions of wind and photovoltaic power outputs are calculated, and wind–light correlation analysis was conducted, establishing the combined wind–light power output model. Lastly, the advantageous clustering algorithm was adopted to obtain typical wind–light combined output scenarios, and a case study was conducted to validate the feasibility of the joint power generation model. Based on the Kendall rank correlation coefficient, in configuring the respective output reasonably, including hydropower, wind, and photovoltaic, the goal of decreasing the amount of wind abandoned and light abandoned was reached.
To realize real-time source–grid coordination, there are still some limitations. Firstly, output models of wind and photovoltaics related to wind speed and light intensity are not constant during the life cycle. The efficiency of wind turbines and photovoltaic cells will decrease with time, and the calculated outputs of wind turbines and photovoltaic cells are not strictly equal to the actual outputs, affecting the adjustment of hydropower output. Secondly, though the dynamic regulation characteristics of hydropower are flexible, there is a time delay between the predicted output and the actual output, which will affect the supply–demand relationship of the power system. In addition, the demand of the power system varies with time, and is difficult to accurately predict, making it difficult to realize source–grid coordination. Though there are some limitations to realize the real-time source–grid coordination, developing the wind–photovoltaic–hydropower complementary power system is still promising.


