3.1. I−V and I−P Polarization Curves with Concentration Loss
A representative method for evaluating the performance of a PEMFC is to analyze the I−V and I−P polarization curves. The I−V curve reflects the electrochemical reaction rate and internal resistance characteristics of the fuel cell, while the I−P curve is used to determine the operating conditions at which the fuel cell delivers maximum power [
22]. Therefore, in this study, the power performance of the fuel cell was analyzed by varying the mass flow rates of hydrogen and oxygen. If the reactant flow rate inside the fuel cell is insufficient, concentration loss increases due to a lack of reactants, whereas excessive flow rates can reduce the overall system efficiency.
Figure 9a presents the numerical analysis results of current density under varying hydrogen and oxygen inlet flow rates. Under all conditions, the current density exhibited a proportional increase with higher flow rates, while the operating voltage decreased. This behavior was attributed to the boundary conditions and governing equations implemented in the study, which accounted for activation loss, ohmic loss, and concentration loss within the PEMFC system.
Figure 9b illustrates the power density as a function of the inlet flow rate. Since power density was influenced by current density, it showed a proportional relationship in the low-current-density region. However, in the high-current-density region, power density peaked and then decreased due to concentration loss.
Additionally,
Table 4 provides the current density and power density values corresponding to the results shown in
Figure 9a,b.
For Case 1 with hydrogen 0.76 LPM and oxygen 2.39 LPM, the minimum flow rate was applied, and the maximum current density observed was 0.30 A/cm2. In the high-voltage regions of 1.0 V and 0.9 V, voltage reduction due to activation loss was prominent, followed by concentration loss caused by insufficient flow rates. This resulted in a steeper voltage decline compared to the increase in current density, with a faster drop relative to other cases. The maximum power density of 0.18 W/cm2 occurred at a cathode terminal operating voltage of 0.7 V. In high-current regions, power density decreased due to an inefficient relationship between rising current density and voltage.
For Case 2 with hydrogen 1.50 LPM and oxygen 4.67 LPM, where flow rates doubled compared to Case 1, the maximum current density increased to 0.53 A/cm2. The improved reactant supply mitigated activation and ohmic losses, resulting in a gentler voltage decline. However, insufficient flow rates still induced concentration loss, causing a sharp voltage drop after 0.8 V. The maximum power density reached 0.32 W/cm2 at 0.8 V, marking a 77.78% increase over Case 1, attributed to enhanced current density from higher flow rates.
For Case 3 with hydrogen 2.26 LPM and oxygen 7.17 LPM, tripling the flow rates of Case 1, the maximum current density rose to 0.75 A/cm2. As flow rates stabilized, voltage drops from activation and ohmic losses slowed. Conversely, concentration loss became more significant, driving voltage decline after 0.8 V. The maximum power density of 0.42 W/cm2 at 0.8 V represented a 31.25% improvement over Case 2.
For Case 4 with hydrogen 3.02 LPM and oxygen 9.56 LPM, quadrupling the flow rates of Case 1, the maximum current density reached 0.93 A/cm2. Voltage drops from activation/ohmic losses remained gradual, while concentration loss emerged at 0.7 V. Further flow rate increases had minimal impact on voltage improvement. The maximum power density of 0.50 W/cm2 at 0.7 V showed a 19.05% increase over Case 3, though power density gains began to diminish.
For Case 5 with hydrogen 3.77 LPM and oxygen 11.94 LPM, five times the flow rates of Case 1, the maximum current density reached 1.02 A/cm2, corresponding to the limiting current density under the PEMFC model conditions. The maximum power density of 0.52 W/cm2 at 0.7 V showed only a 4.0% increase over Case 4, indicating diminishing returns despite higher flow rates.
In PEMFCs, the phenomenon where the rate of current density increase diminished despite rising flow rates stemmed from the interaction between reactant diffusion and electrochemical reaction kinetics. This was explained within the numerical analysis of the PEMFC model using the convection–diffusion equation, Butler–Volmer equation, and Darcy’s law in porous media. Specifically, under high-flow conditions, increased flow velocity in the convection term and insufficient time for reactants to diffuse or reside within the porous GDL and CL led to reactant expulsion before reaching the catalyst layer. This resulted in concentration loss due to hindered reactant supply in the catalyst layer, causing a slowdown in current density growth. Thus, at low flow rates, flooding caused by crossover blocked reaction channels and pores, impairing performance, while at high flow rates, excessive velocity itself became a performance-limiting factor.
Additionally, it was observed that at a cell voltage of 0.4 V, all flow rate conditions exhibited the maximum current density. This reflects the characteristic where the current load continued to increase even as the voltage decreased. Furthermore, since power density was derived from the relationship between current and voltage, it did not necessarily peak at the same voltage. Therefore, for high-current operation, ensuring sufficient flow supply is essential, and optimizing the flow rate to minimize concentration loss remains critical, even as the cell voltage decreases.
Figure 10 presents the current density distribution generated by electrochemical reactions across the PEM plane and the A-B cross-section of
Figure 3a under different operating voltages. In
Figure 10a,b, corresponding to Case 1 and 2 conditions, insufficient flow rates prevented uniform diffusion of reactants across the entire area, resulting in unreacted zones and low current density. Additionally, reactant deficiency reduced current density again at 0.5 V and 0.4 V.
In
Figure 10c,d, corresponding to Case 3 and 4 conditions, the increased inlet flow rates eliminated reactant deficiency up to 0.8 V compared to previous cases. This reduction in reactant deficiency was due to decreased concentration loss effects.
In
Figure 10e, corresponding to Case 5 with the maximum inlet flow rate, unlike Case 4, no reactant deficiency was observed up to an operating voltage of 0.7 V. Additionally, the I−P curve in
Figure 9b showed that the maximum power of 0.52 W/cm
2 occurred at 0.7 V, attributed to the uniform distribution of reactants across the entire flow channel area, generating current density throughout the entire surface.
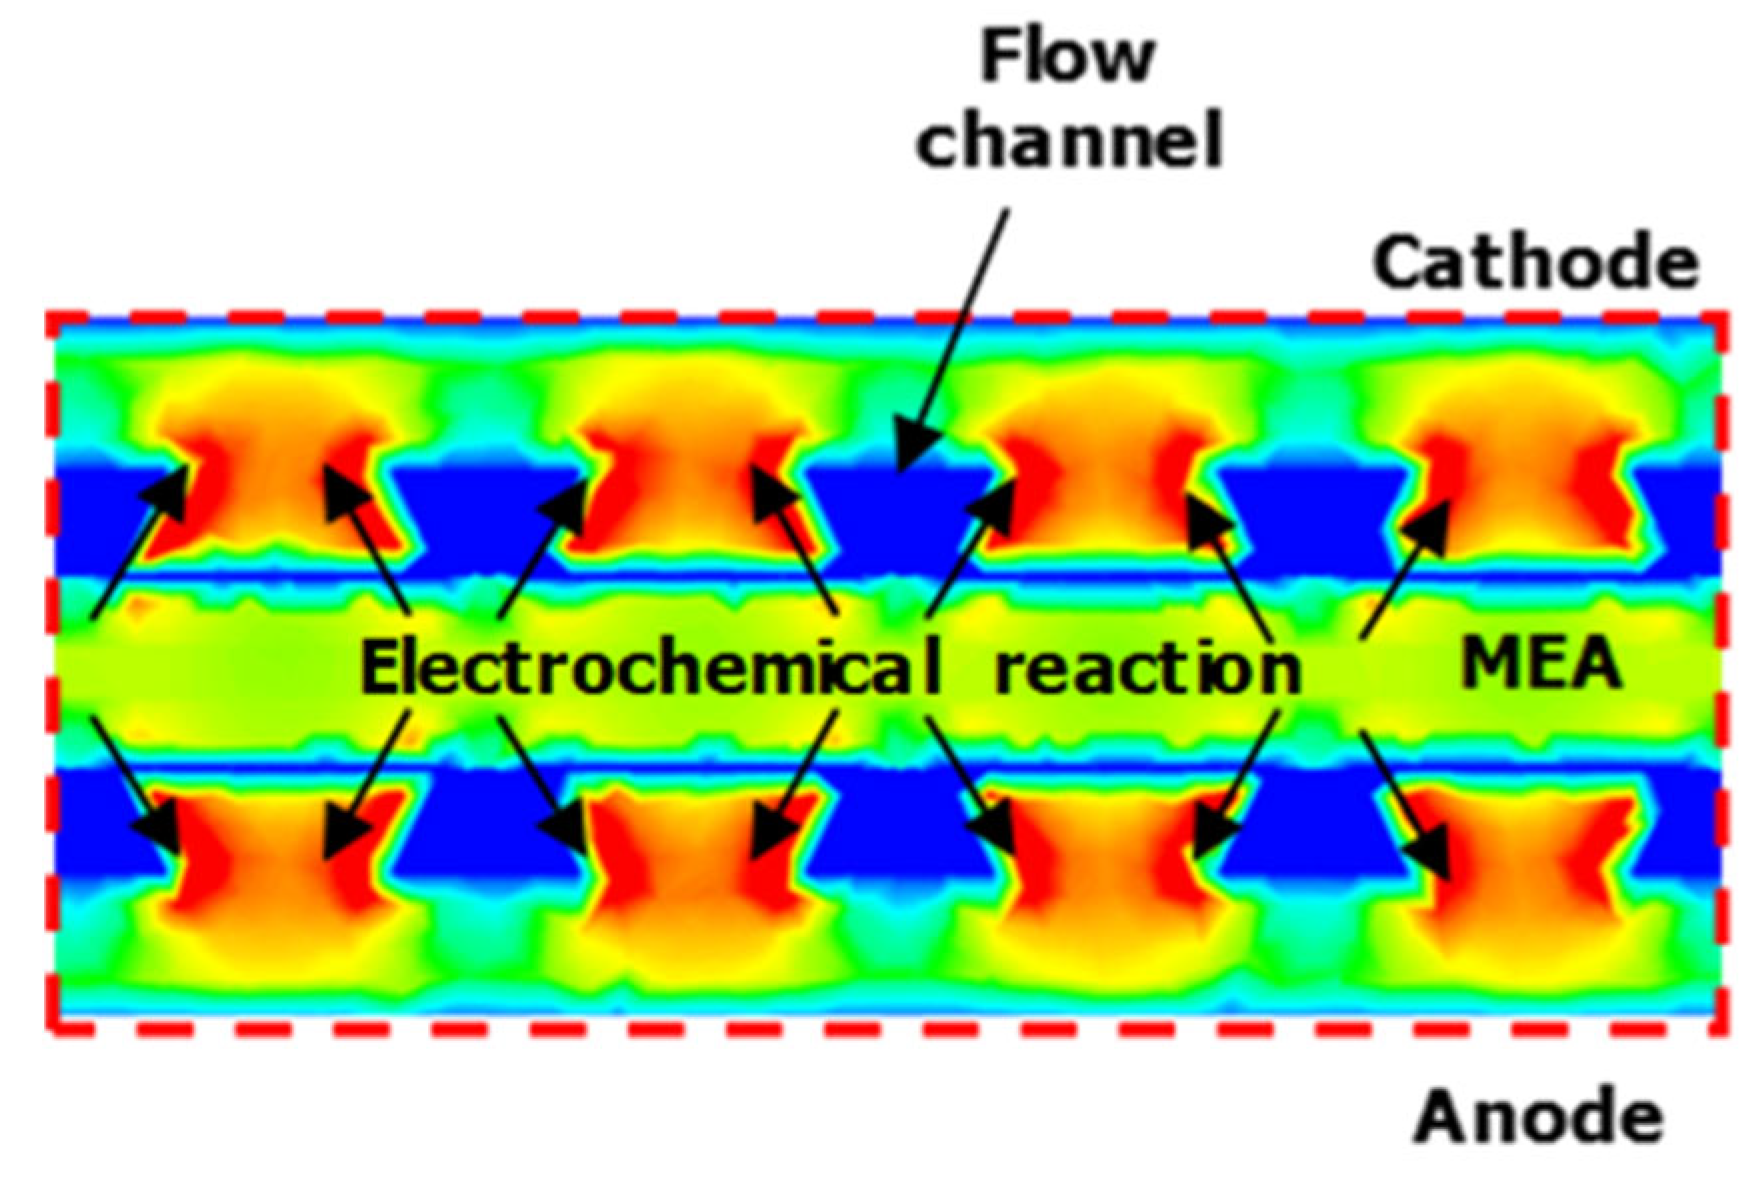
Figure 11 corresponds to the detailed current density distribution generated by electrochemical reactions under Case 5 conditions. The current was produced by electrochemical reactions at MEA, which consisted of GDL, CL, and PEM. Additionally, it was observed that the generated current circulated between the anode and cathode until the equilibrium potential was maintained. The current then migrated to CC, the conductive components of each electrode, in accordance with electrical conductivity. The non-conductive flow channels solely supplied reactants and exhibited no current density due to the absence of electron movement. This enabled the tracking of electron movement generated by electrochemical reactions.
3.2. Cell Temperature of Each Structure with Mass Flow Rate
In a PEMFC system, temperature variations affect the electrochemical reaction rate and evaporation/condensation phenomena within the flow channels. Additionally, efficient thermal management prevents degradation and extends the fuel cell’s lifespan. Therefore, proper temperature regulation during PEMFC operation plays a critical role in optimizing system performance [
23].
In a PEMFC system, temperature changes occur due to heat generated by electrochemical reactions in the cathode CL, and these temperature differences induce heat conduction through each contacted structural component.
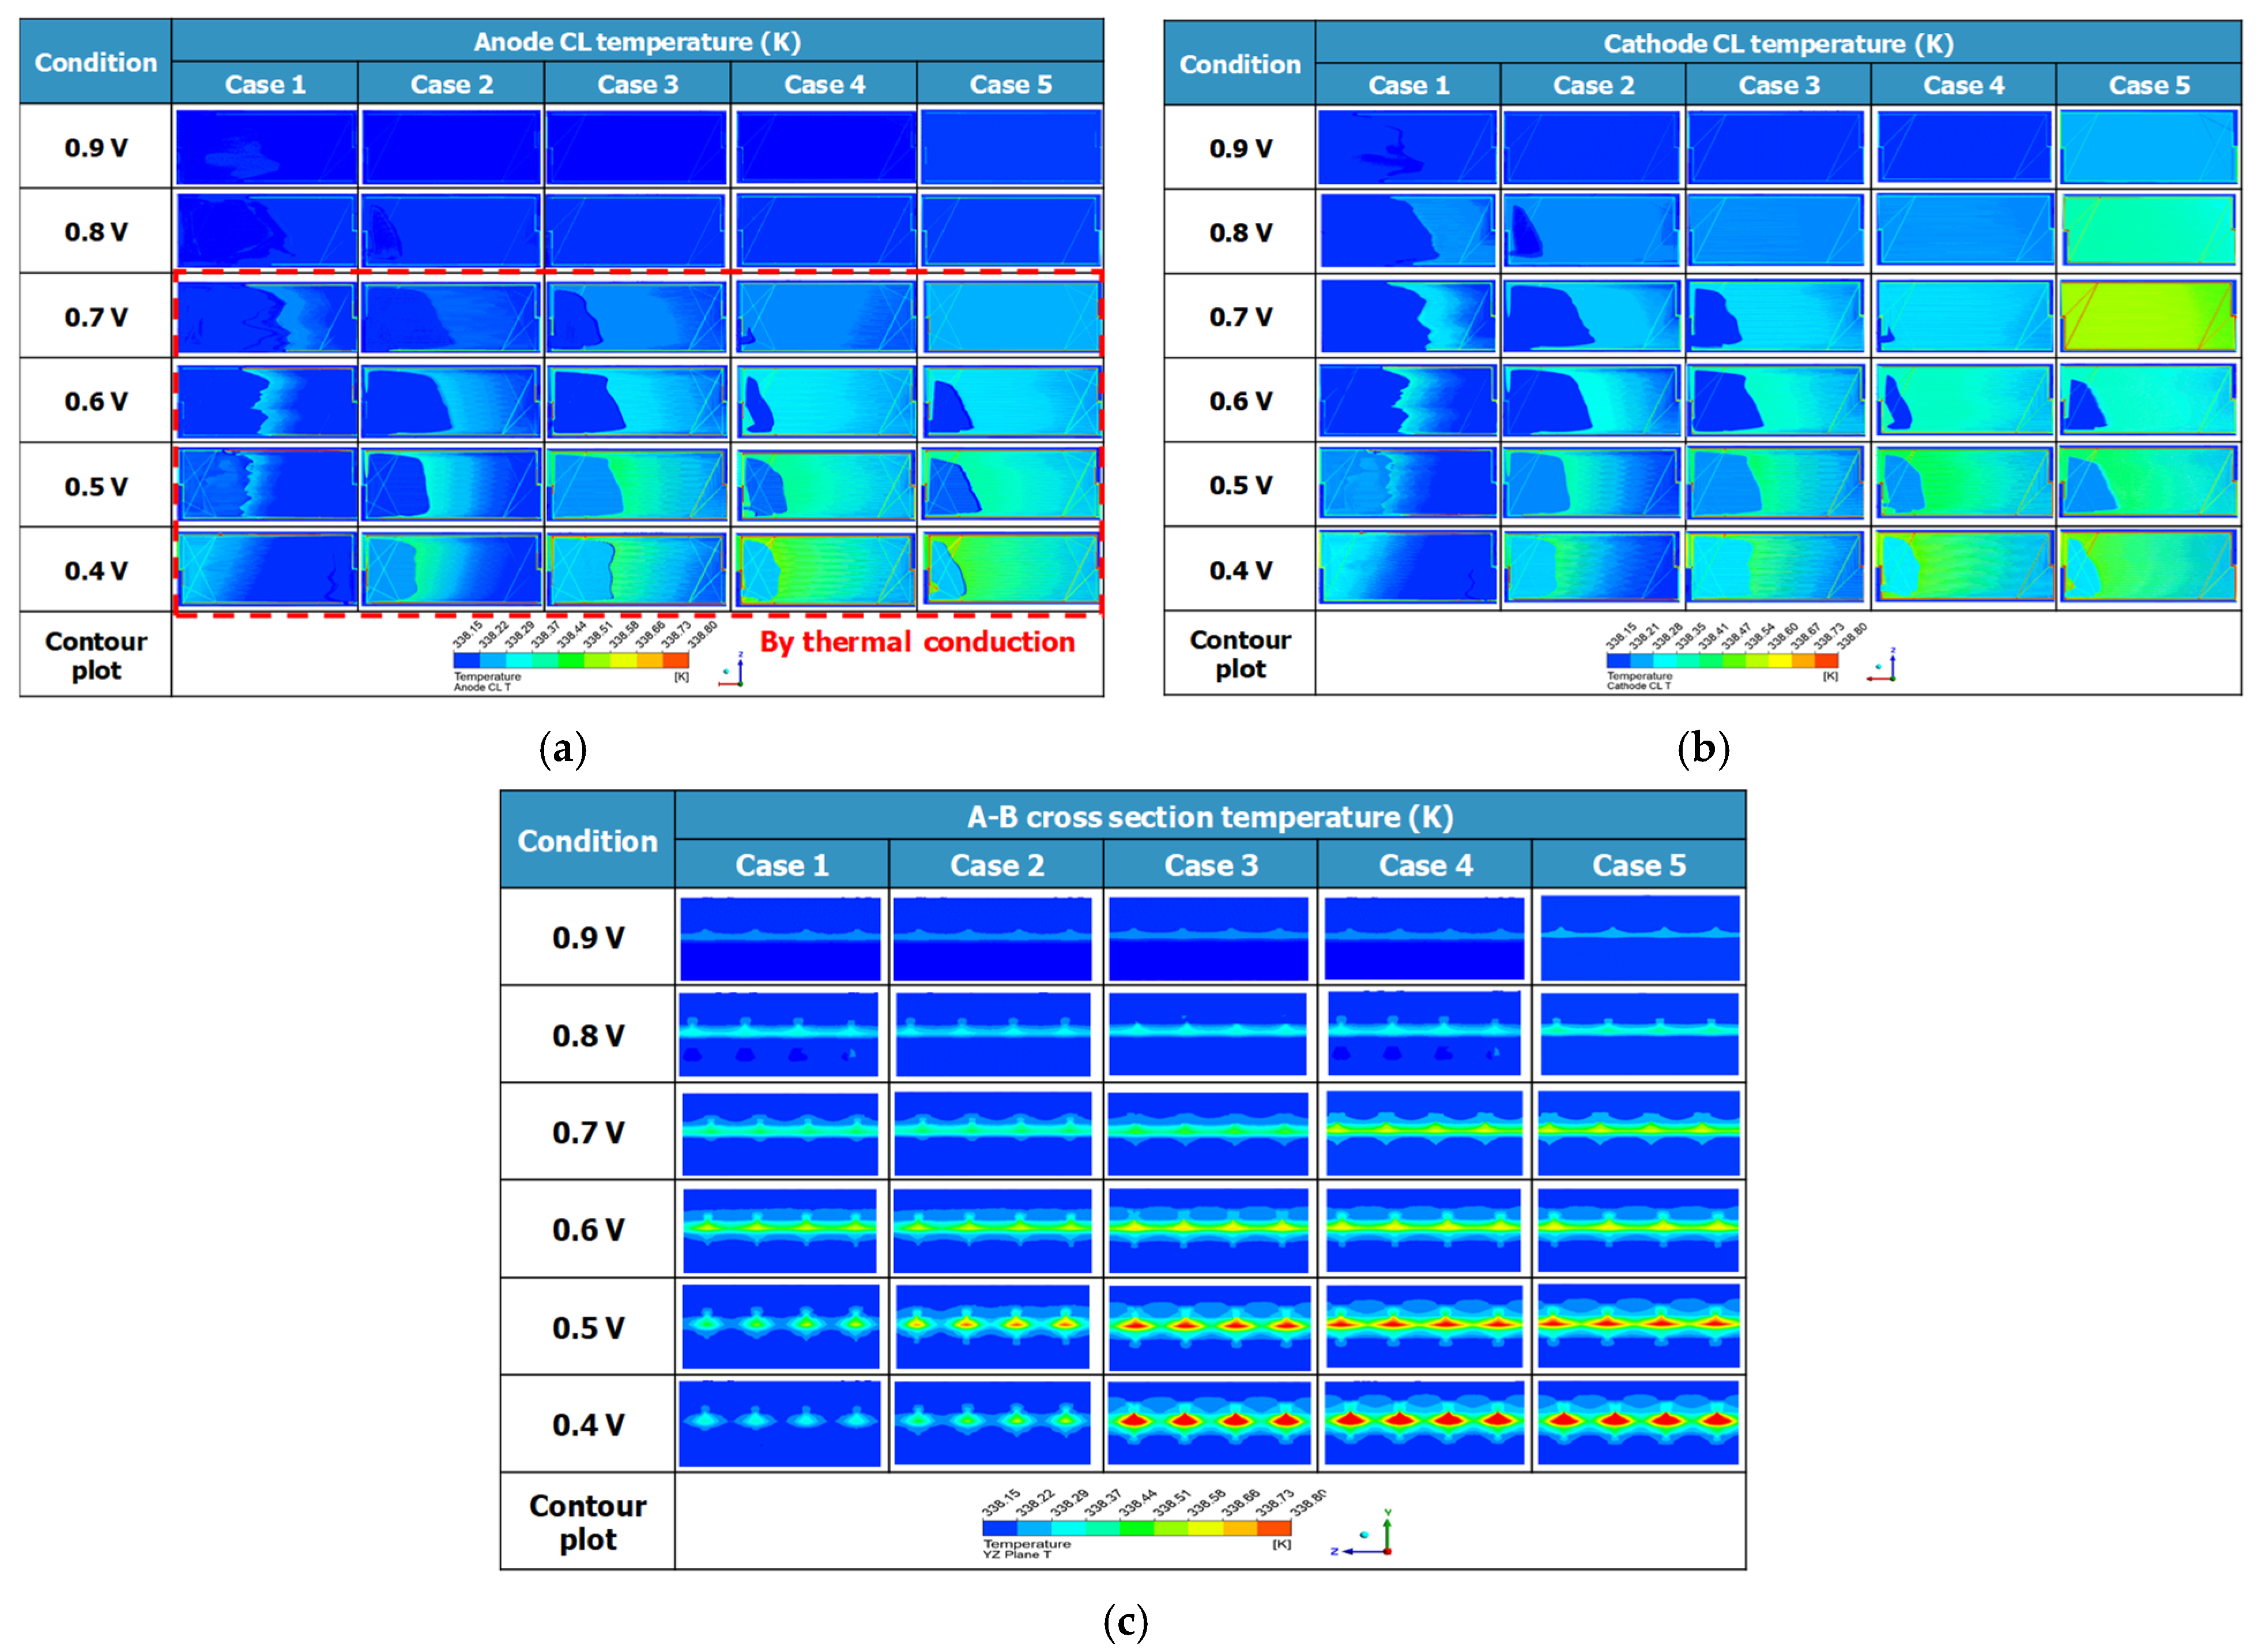
Figure 12a illustrates the temperature distribution in the anode CL. The anode CL did not exhibit temperature variation because it separated hydrogen into protons and electrons through oxidation reactions without generating heat. However, as flow rates increased from Case 1 to 5 and the operating voltage decreased from 0.9 V to 0.4 V, temperature variations intensified. This was attributed to heat generated by reduction reactions at the cathode, which conducted through MEA. Additionally, higher current loads and sufficient reactant supply correlated with increased temperature variations.
Figure 12b illustrates the temperature distribution in the cathode CL. In the cathode CL, heat was generated during the reduction reaction, where oxygen, hydrogen ions, and electrons combined to form water. As the operating voltage decreased, the current load increased proportionally with the electrochemical reactions, resulting in elevated temperature variations. This trend was confirmed by the higher temperature distribution, indicating elevated inlet temperatures as the voltage dropped from 0.9 V to 0.4 V. Additionally, increased inlet flow rates promoted chemical reactions, and the improved reactant distribution area led to more uniform heat distribution.
Figure 12c presents the temperature variation distribution across the A-B cross-section under different inlet flow rates and operating voltages. As the operating voltage decreased from 0.9 V to 0.4 V, temperature changes became more pronounced in the PEM and CL due to increased heat generation. Notably, localized temperature rises were observed at the interface adjacent to GC, where reactant diffusion occurred.
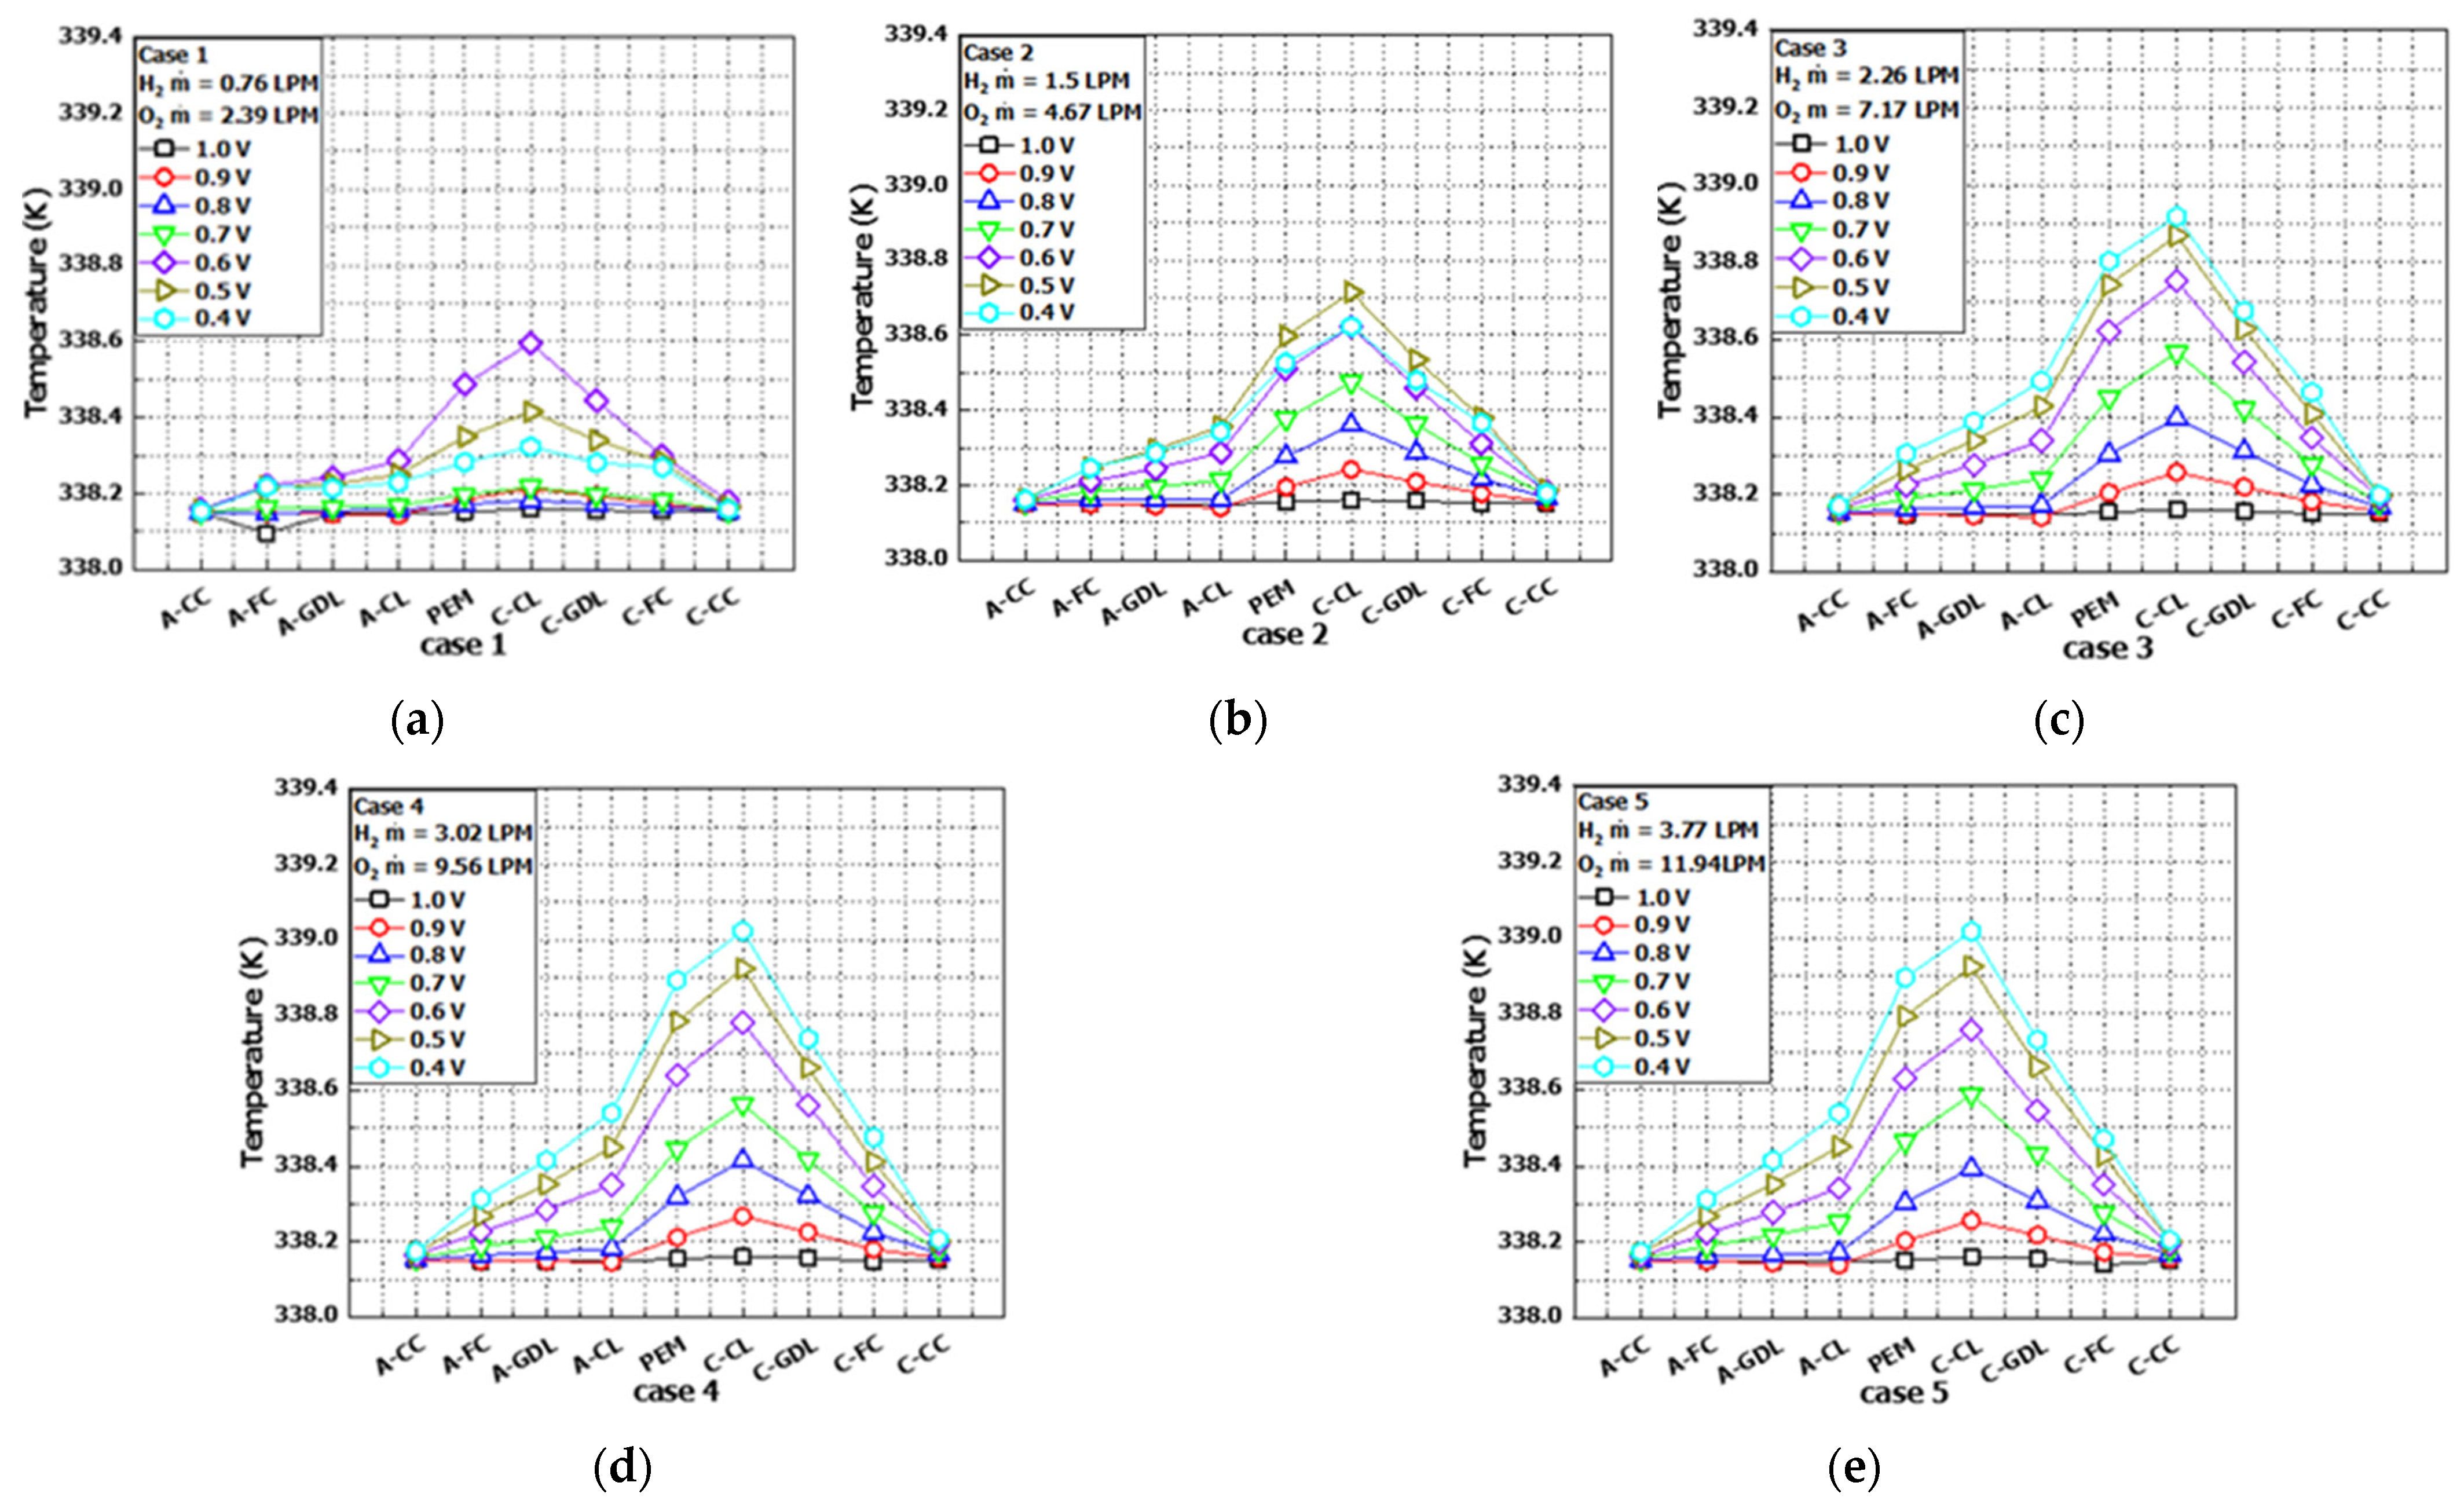
Figure 13 shows the temperature distributions from
Figure 12 according to each case condition. In all cases, the region with the highest temperature was the CL of the cathode, and the PEM, which was in contact due to heat conduction, exhibited the next highest temperature.
Figure 13a,b corresponds to Case 1 and Case 2, respectively. In Case 1, at an operating voltage of 0.6 V, the maximum temperature increased by 0.13% compared to the inlet temperature, while in Case 2, at an operating voltage of 0.5 V, the maximum temperature increased by 0.16% compared to the inlet temperature. In both cases, due to insufficient reactant flow, a continuous temperature rise up to 0.4 V was not observed. However,
Figure 13c–e, which corresponds to Case 3, Case 4, and Case 5, respectively, showed that increasing the inlet flow rate led to the maximum temperature change due to electrochemical reactions up to an operating voltage of 0.4 V.
Notably,
Figure 13e presents the results for Case 5, which had the maximum inlet flow rates of hydrogen at 3.77 LPM and oxygen at 11.94 LPM. Compared to the inlet temperature of 338.15 K, Case 5 exhibited a 0.25% temperature rise. However, its maximum temperature remained identical to Case 4 at 339.02 K. This temperature consistency was attributed to unreacted reactants in the increased flow rates acting as a coolant by absorbing heat generated during the exhaust process, thereby stabilizing the cell temperature.
The maximum temperature variation of 1 K observed in the numerical analysis may seem negligible. However, in practical fuel cell systems where hundreds to thousands of cells are arranged in parallel, even minor temperature changes in a single cell can accumulate across multiple cells. This cumulative effect could lead to significant thermal degradation, causing dry-out of the electrolyte membrane, reduced ionic conductivity, and a shortened lifespan of MEA. Additionally, hydrogen exposed to the external environment poses combustion risks. Therefore, temperature control through flow rate regulation is critical to minimize energy consumption in external cooling systems and enhance the stability and durability of fuel cells.
3.3. Reaction Species Distribution and Crossover Effect
In a PEMFC system, oxidation-reduction reactions can produce diverse outcomes depending on the operating conditions. Concentration gradients may result in non-uniform reactant distribution and inefficient water management, potentially leading to flooding. Therefore, to analyze these phenomena, mass fraction distribution diagrams at GC cross-sections of each electrode were presented.
Figure 14a displays the mass fraction distribution of hydrogen, the primary fuel in the PEMFC. From Case 1 to Case 5, the hydrogen flow rate increased. In Case 1, as the voltage decreased from 0.9 V to 0.4 V, the hydrogen flow rate required for the reaction increased, leading to pronounced fuel deficiency. In contrast, Case 2 showed no deficiency at 0.9 V due to higher flow rates, with improved deficiency zones across other voltage conditions. As flow rates further increased in Cases 3, 4, and 5, the hydrogen concentration rose proportionally, and deficiency zones gradually diminished. Ultimately, uniform hydrogen distribution was achieved across the entire reaction flow channel GC. These results suggested that increased flow rates mitigated hydrogen starvation-induced inhomogeneity and enhanced system reaction efficiency.
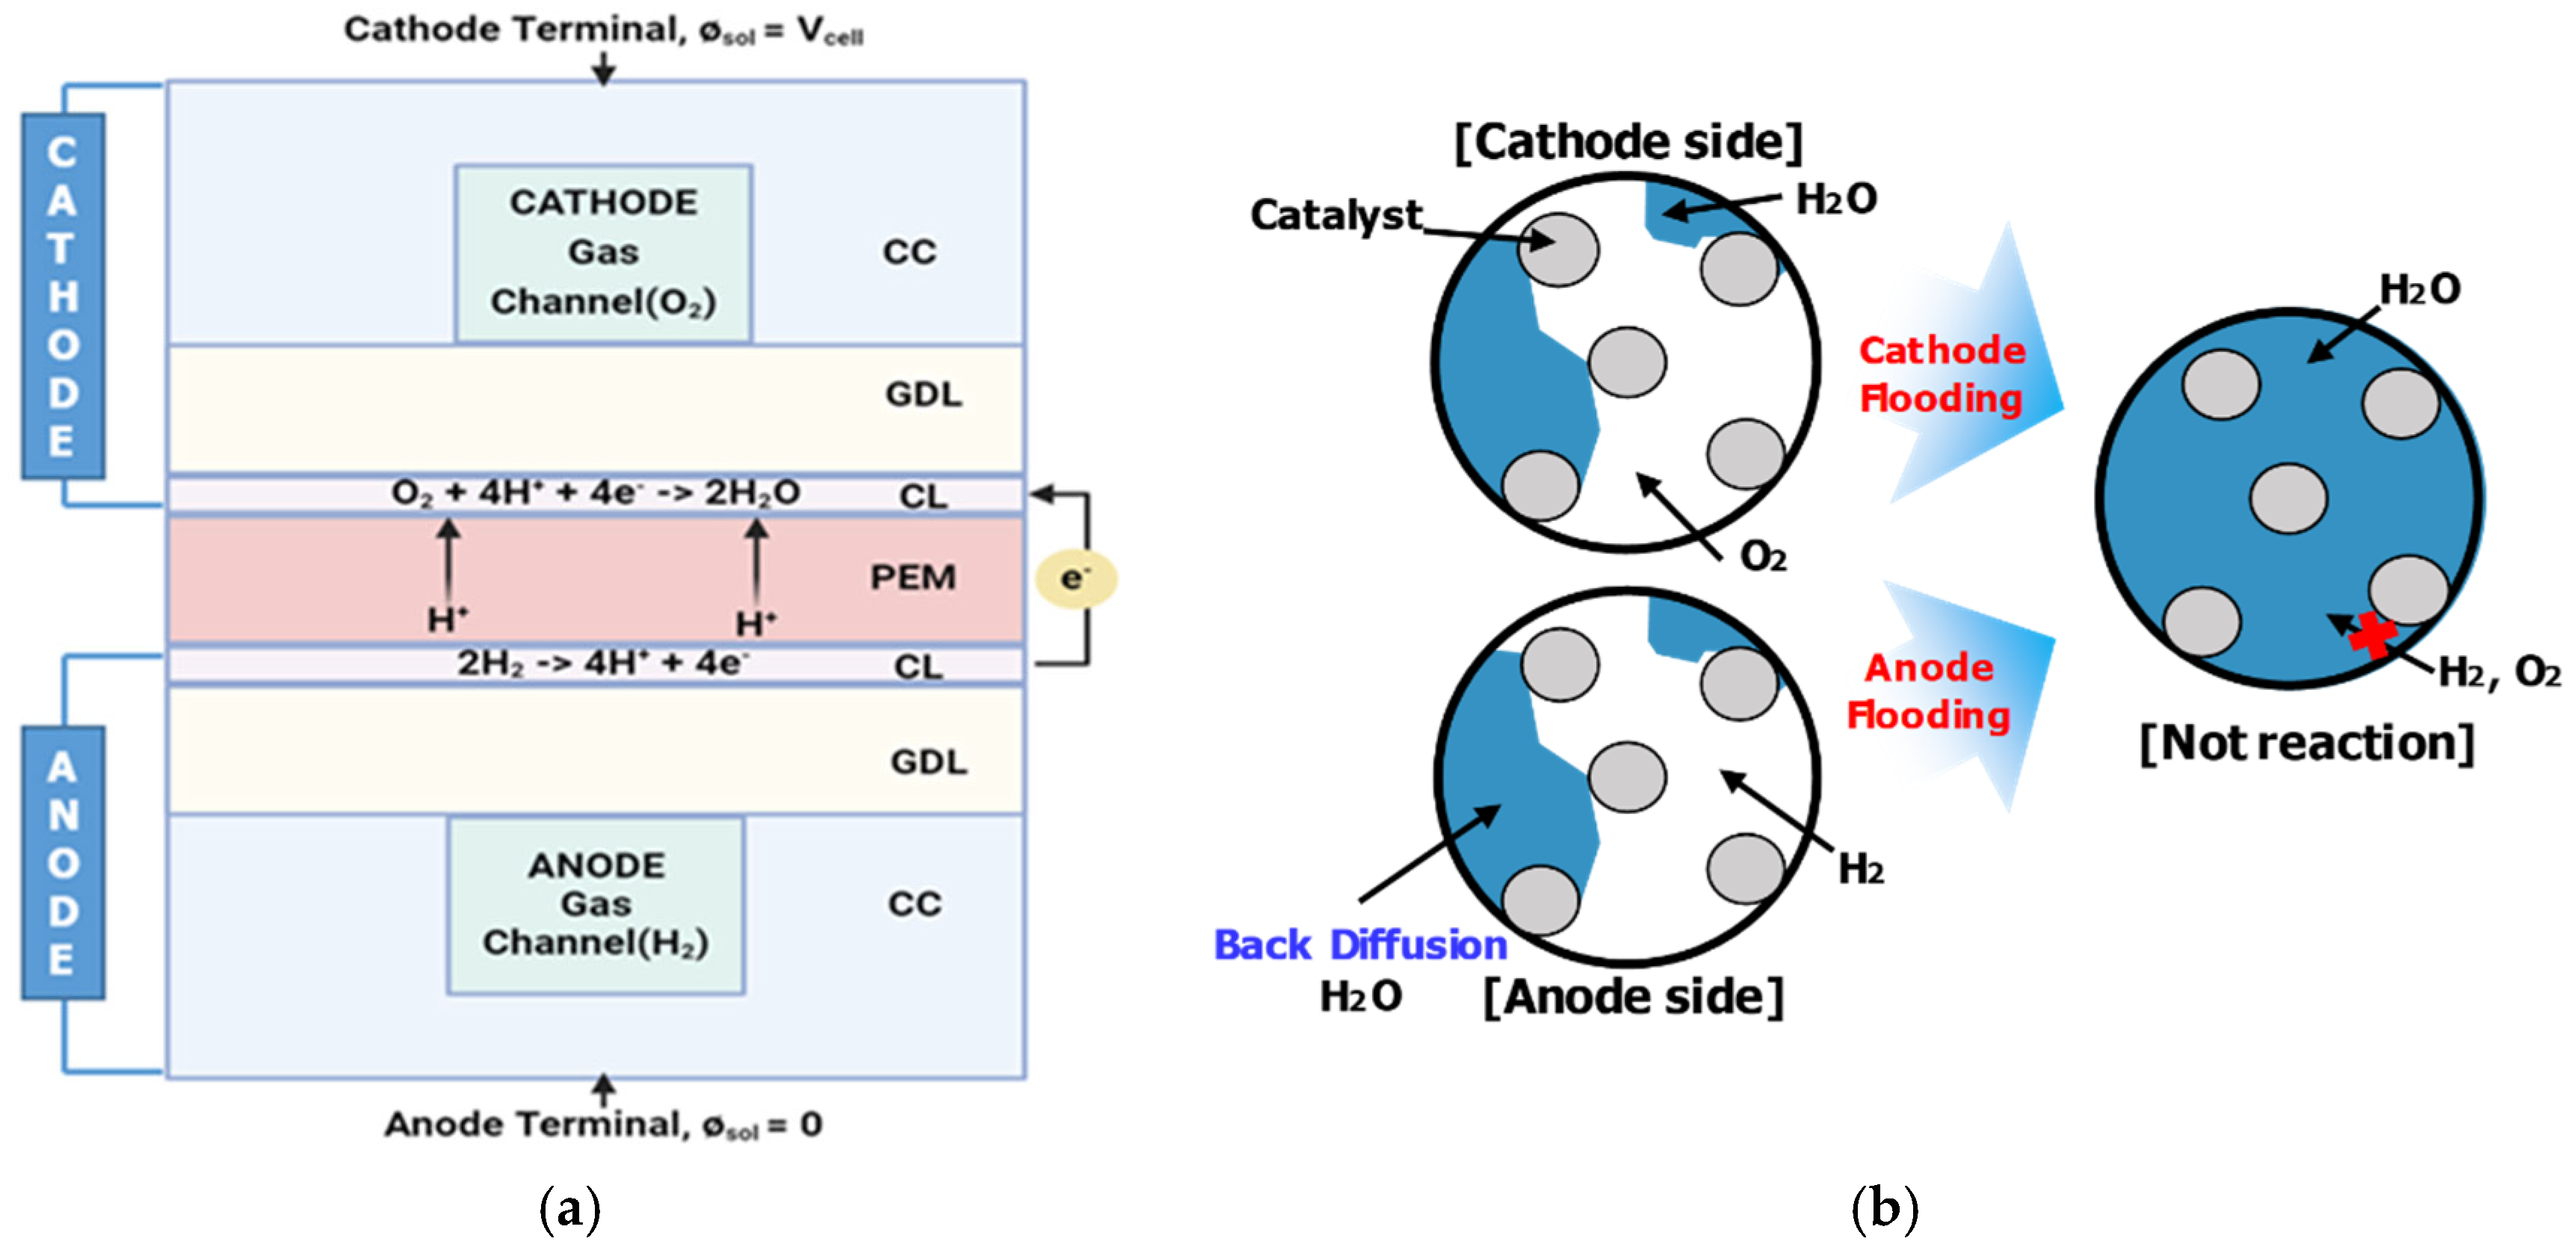
Figure 14b shows the water vapor mass fraction distribution in the humidified fuel. In the anode, water vapor primarily enhanced ionic conductivity by humidifying PEM and facilitating hydrogen ion transport, rather than participating in oxidation reactions. Consequently, water vapor flow rates increased alongside hydrogen, exhibiting deficiency zones under low-voltage conditions similar to hydrogen. However, in Cases 1, 2, and 3 under specific voltage conditions, water vapor and liquid water were regenerated. This regeneration was attributed to back-diffusion of oxygen and water moving from the cathode to the anode as a result of concentration gradients. According to Wilberforce et al. [
24], the primary driving mechanisms for water molecule transport are electro-osmotic drag, in which water is transported from the anode to the cathode due to potential differences between the electrodes, and back-diffusion, where water moves from the cathode to the anode because of concentration gradients. In this study, the irregular and non-steady mixing of hydrogen, oxygen, and water through the membrane during these processes was identified as the crossover effect.
Crossover negatively impacted PEMFC systems. First, when crossover oxygen reacted with hydrogen in the anode CL, electrons generated in the CL did not travel through external circuits, leading to power loss. Second, crossover caused non-uniform distribution in GC of both electrodes, inducing localized chemical reactions that reduced the durability and lifespan of the electrolyte membrane. Therefore, optimizing the inlet flow rate to prevent crossover is essential.
Figure 15a presents the mass fractions of hydrogen and water in the anode GC. As the operating voltage decreased, the mass fraction of hydrogen in the GC declined because the amount of hydrogen consumed in chemical reactions increased. However, from Case 1 to Case 5, the reduction in hydrogen mass fraction was mitigated due to the sufficient hydrogen concentration in the flow channel as the flow rate increased.
According to the water transport mechanisms described earlier, in the sulfonic acid groups (SO
3−H
+) of the Nafion PEM within the PEMFC, protons (H
+) combined with water to form hydronium ions (H
3O
+). As hydrogen decreased, this led to a hydration phenomenon where water was also reduced [
25,
26]. Therefore, hydrogen and water should exhibit identical trends in their mass fraction graphs. However, under low-flow, high-voltage conditions in
Figure 15a, discrepancies in the mass fraction trends of hydrogen and water were observed. This was attributed to crossover, where water generated at the cathode underwent back-diffusion due to concentration gradients, causing an increase in the water mass fraction.
To determine whether crossover-induced flooding occurred in the anode,
Figure 15b and
Table 5 numerically quantify the crossover phenomenon. Mass fractions can be converted to the same unit by multiplying the molar concentration of each chemical species by the mass flow rate. Thus, the difference between the mass fractions of hydrogen and water was defined as the crossover rate. The crossover rate was set to a baseline of ‘0’. A zero difference between hydrogen and water indicates no flooding caused by crossover, signifying that water was solely utilized for proton transport through the electrolyte membrane.
A crossover index exceeding ‘0’, a positive value, indicates a higher mass fraction of water compared to hydrogen, numerically confirming that water back-diffused from the cathode to the anode. Based on this, Cases 1 and 2 across all voltage conditions, Case 3 at 1.0 V, 0.9 V, and 0.8 V, and Case 4 at 0.9 V were identified as regions where crossover-induced flooding occurred.
Notably, under the 0.9 V condition of Case 1 in
Table 5, the current density was 0.14 A/cm
2, which was lower than that of other conditions, and the crossover index reached its maximum value of 0.41. This result indicates that water back-diffused by crossover caused flooding in the anode GC, which hindered the oxidation reaction of hydrogen in the catalyst layer, leading to a lower current density.
A negative crossover index indicated a higher mass fraction of hydrogen compared to water. This was observed in Cases 3, 4, and 5 within the voltage range of 0.7 V to 0.4 V. Furthermore, as the inlet flow rate increased from Case 3 to Case 5, the crossover index tended to approach ‘0’ or negative values. This trend was interpreted as a result of relatively reduced reactant concentration gradients within the fuel cell due to increased flow rates. Therefore, these findings suggest that increasing the flow rate alone can prevent unnecessary water accumulation and enable efficient water management by balancing hydrogen and oxygen reactions.
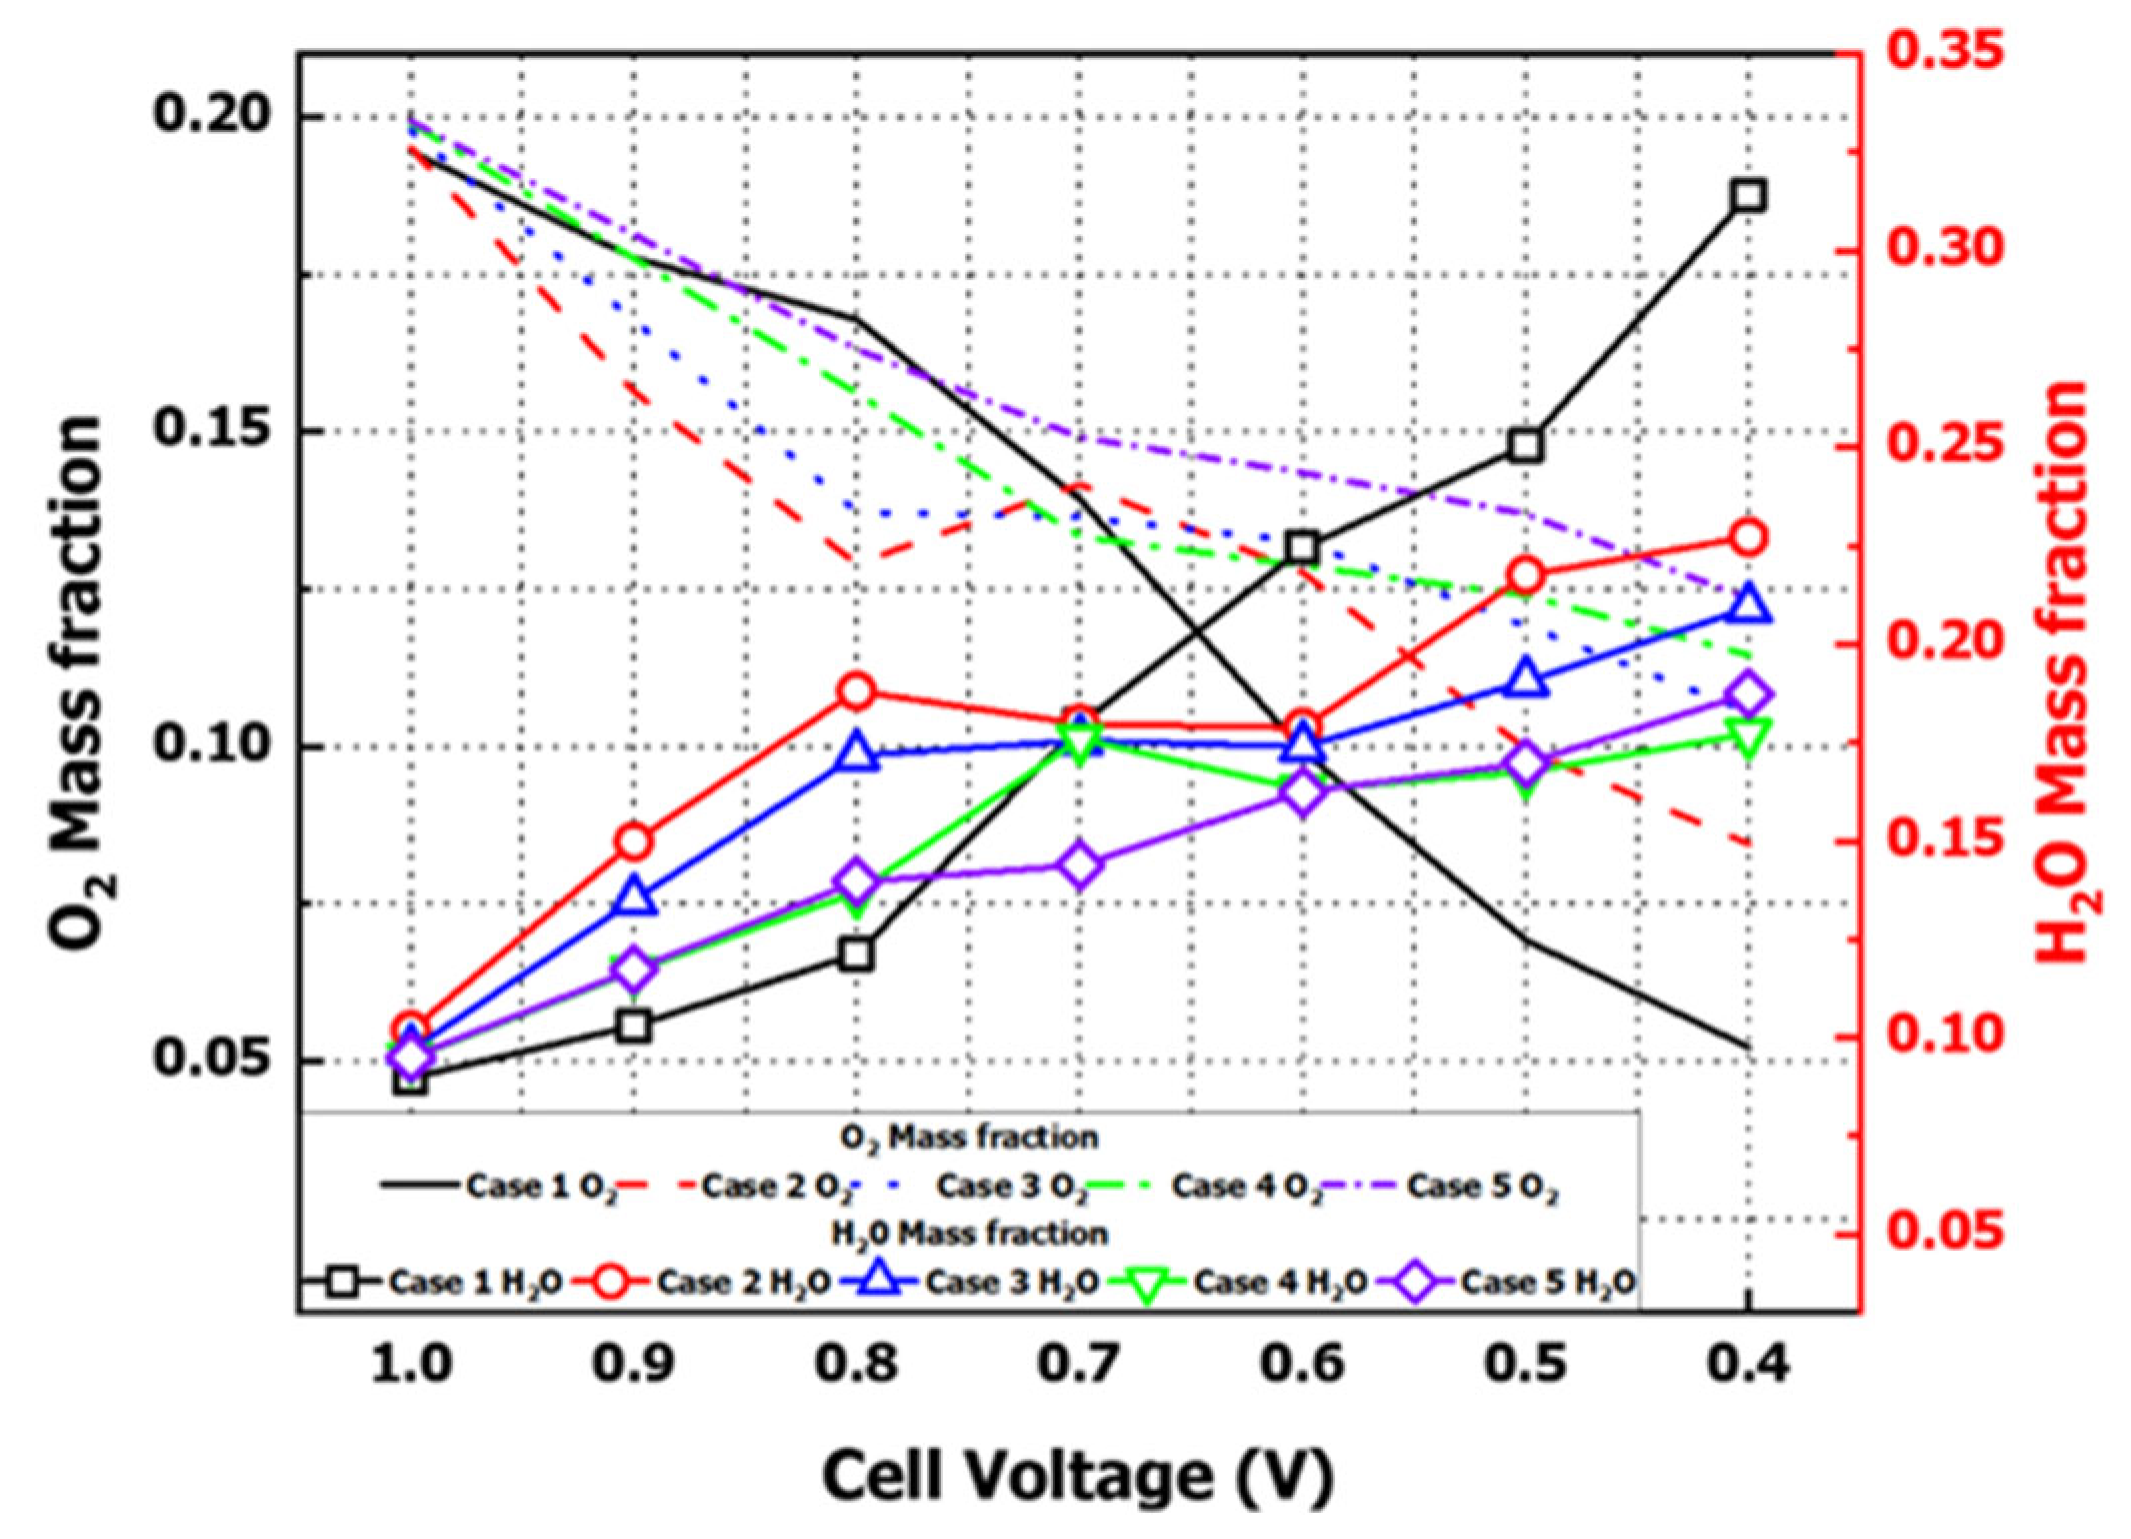
Figure 16a displays the mass fraction distribution of oxygen, the oxidizing agent used in the PEMFC, across the cathode GC cross-section, while
Figure 16b illustrates the mass fraction distribution of water produced by reduction reactions and water vapor included for humidification in the same cross-section. As the voltage decreased, oxygen exhibited a decreasing distribution, whereas water increased. This occurred because oxygen was consumed in chemical reactions at the cathode CL, and water was produced through the reaction of hydrogen cations and electrons with oxygen.
Figure 17 numerically illustrates the mass fraction distributions of oxygen and water from
Figure 16 as functions of voltage. As previously described, a decrease in oxygen correlated with an increase in water, confirming the inverse relationship. These results demonstrate a trade-off between oxygen and water at the cathode due to reduction reactions.
Contrary to the expectation that oxygen levels would increase proportionally with chemical reactions as flow rates rose, increasing the flow rate from Case 1 to Case 5 resulted in reduced water production at lower voltages. This was attributed to insufficient contact and diffusion times with the electrodes due to higher flow velocity at elevated inlet flow rates. Therefore,
Figure 16 and
Figure 17 demonstrate that flooding did not occur in the cathode.
3.4. Relationship Between Comprehensive System Efficiency and Mass Flow Rate
The quantitative evaluation of fuel cell performance can be discussed in terms of system efficiency. According to O’Hayre et al. [
27], the theoretical maximum efficiency of a typical fuel cell can be defined by Equation (20). Here,
represents the Gibbs free energy, defined as the product of the number of electrons involved in the reaction, the Faraday constant, and the Nernst potential. Then,
denotes the reaction enthalpy, which is the difference in formation enthalpy between reactants and products, accounting for phase changes. The generated water can be expressed as the higher heating value (HHV) if it exists in liquid form, or the lower heating value (LHV) if in gaseous form. The PEMFC used in this study corresponded to a low-temperature fuel cell operating at 338.15 K, so the HHV was selected as the reference [
28]. Consequently, with Gibbs free energy at 237.36 kJ/mol and reaction enthalpy at 285.83 kJ/mol, the theoretical maximum efficiency was determined to be 83%:
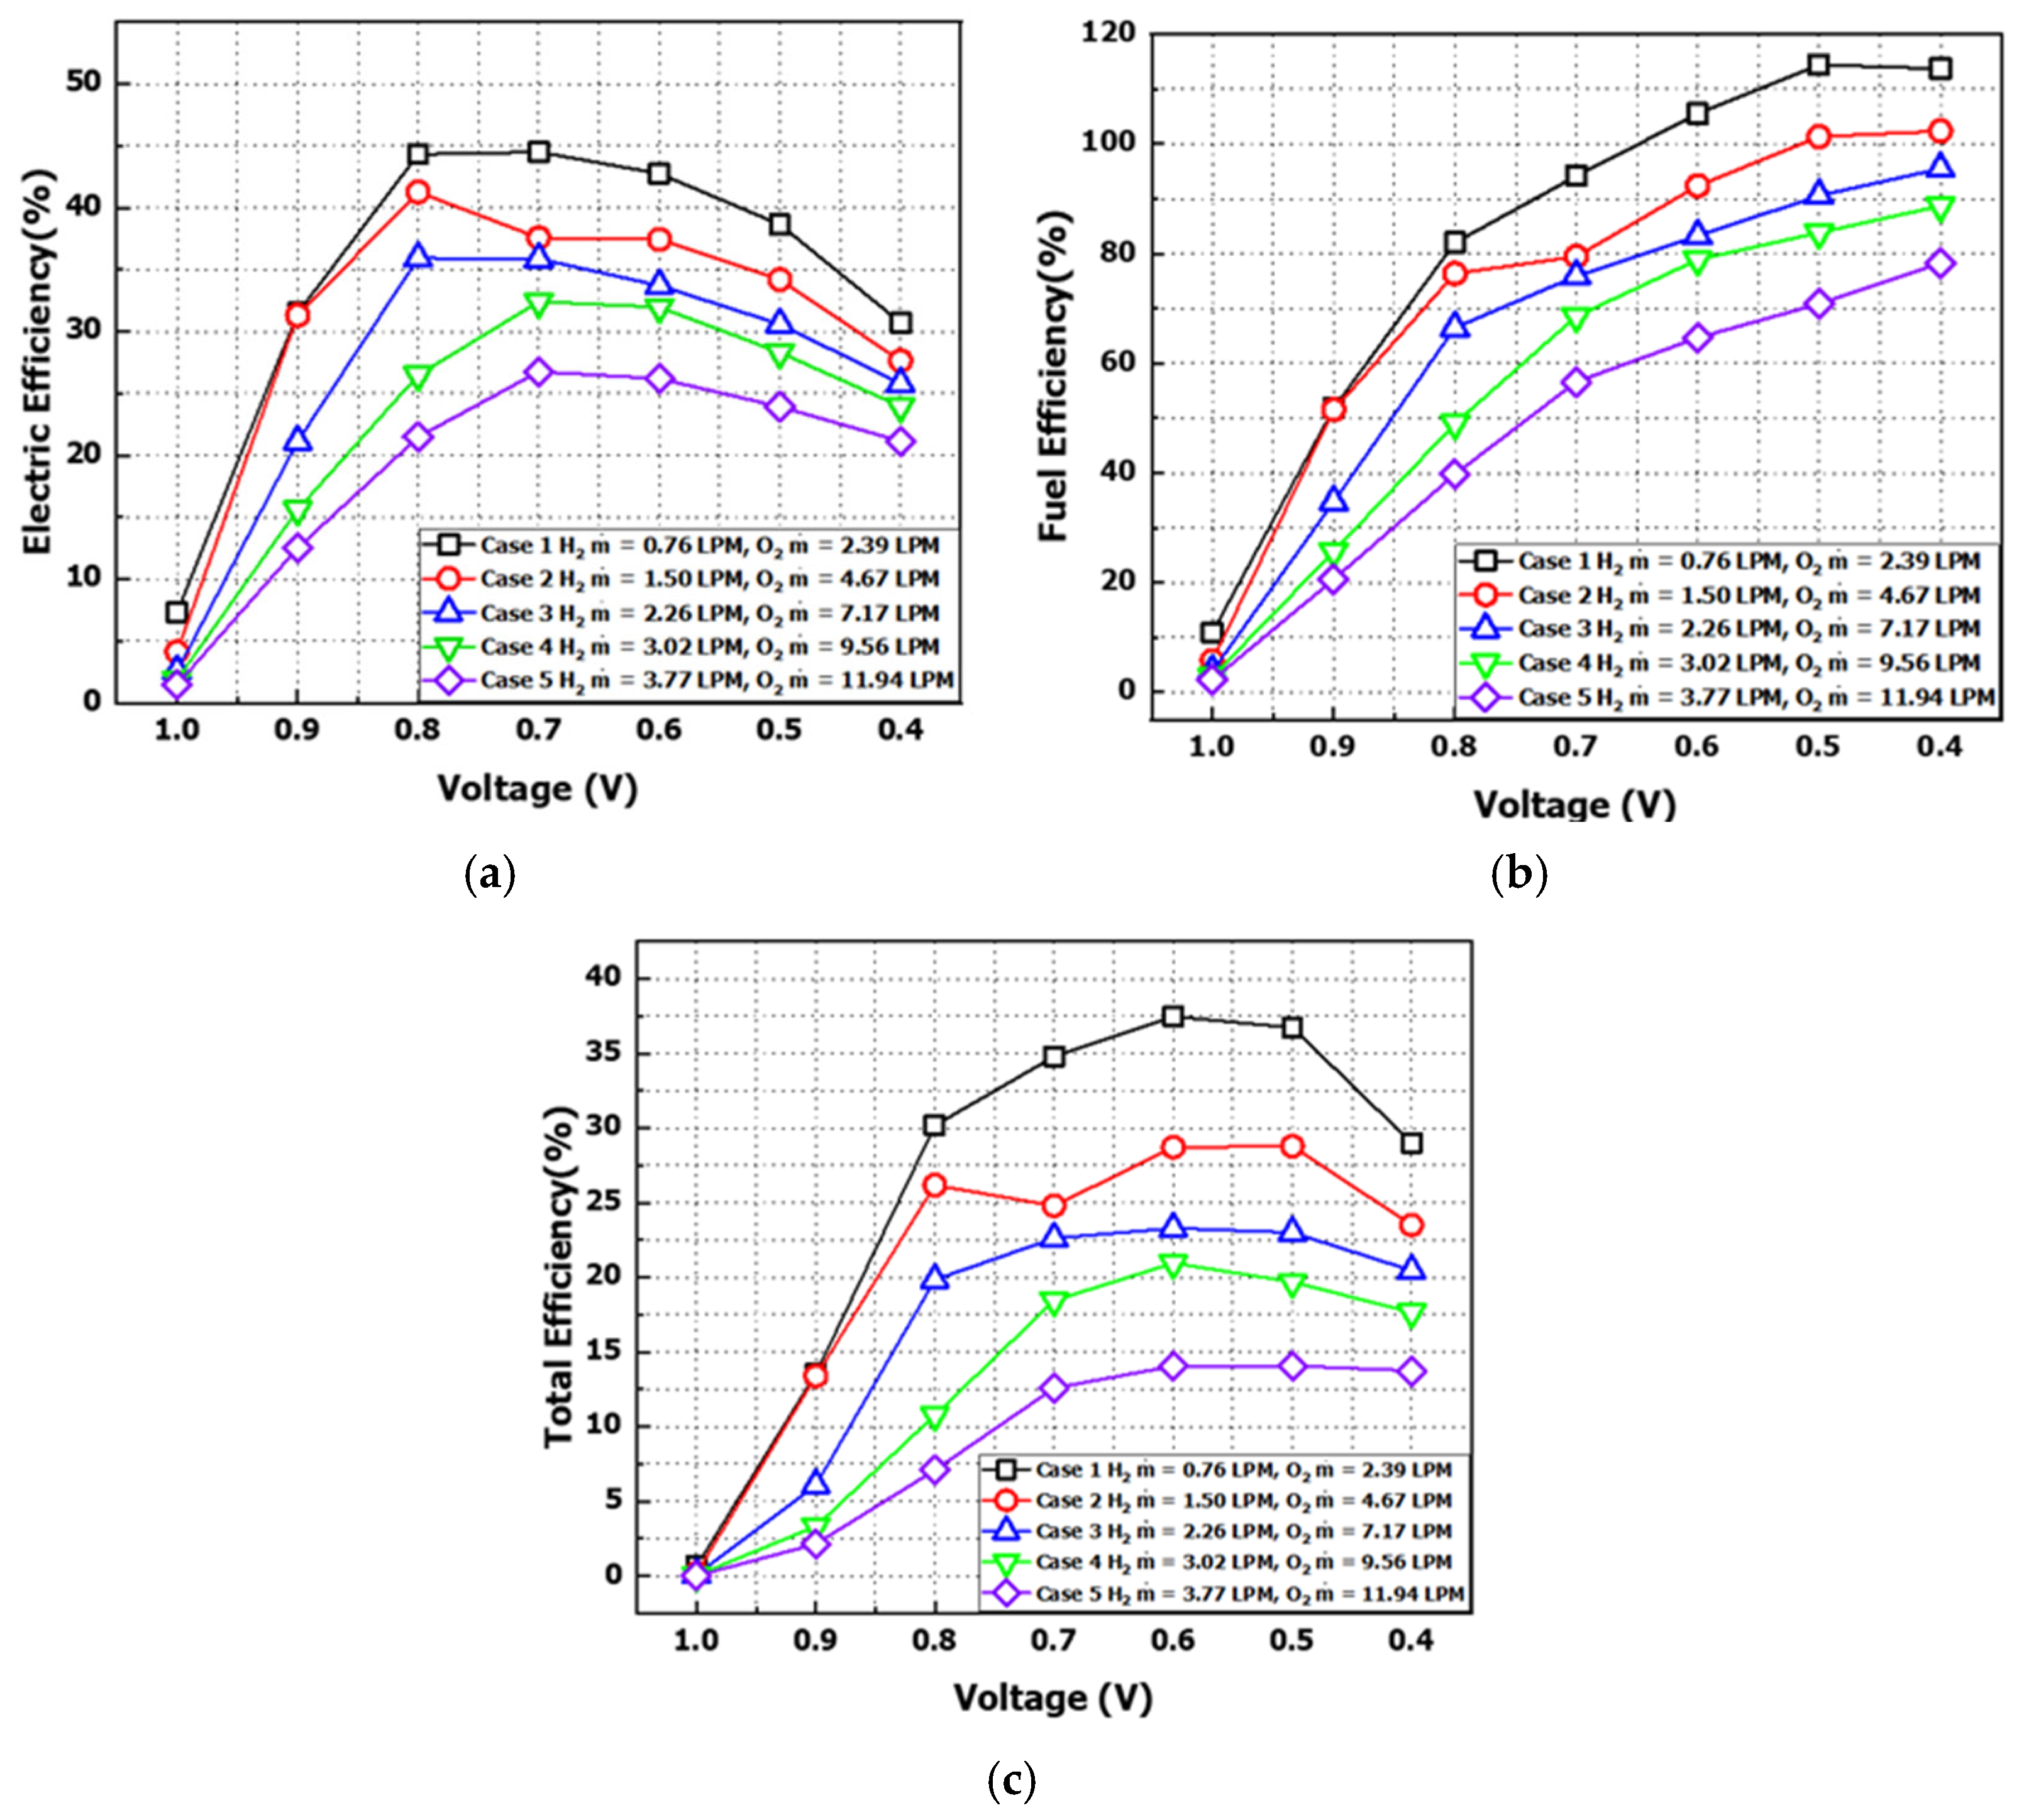
The electrical efficiency of low-temperature fuel cells, such as PEMFCs, was defined as the ratio of the net electrical output to the total energy input from hydrogen fuel to each electrode, as expressed in Equation (21) [
29]. Here,
represents net power, and
, defined as the product of the inlet flow rate and higher heating value (HHV), corresponds to the electrochemical reaction energy. The power efficiency at each cell voltage is presented in
Figure 18a. Across all flow rate conditions, maximum efficiency points were observed at 0.7 V and 0.8 V. Case 1 exhibited a maximum power efficiency of 45%, while Case 5 yielded a minimum efficiency of 21%. Additionally, lower flow rates correlated with higher efficiency, attributed to higher power output relative to fuel input. However, efficiency sharply decreased under high current loads at low voltages.
As another efficiency metric for PEMFCs, fuel utilization efficiency was cited as defined in Equation (22). It is defined as the ratio of the flow rate consumed in the reaction to the flow rate supplied at the anode inlet, where 100% efficiency indicates that all hydrogen supplied was consumed in the reaction [
26,
27,
28,
29]:
Figure 18b illustrates the fuel efficiency by voltage under varying inlet flow rates. As the voltage decreased, the required fuel amount increased, leading to proportional improvements in fuel utilization efficiency. In Cases 1 and 2, efficiency exceeded 100% in certain regions, attributed to the crossover effects described in
Figure 15b, where back-diffused water in the anode outlet region increased the total flow rate beyond the inlet supply.
Figure 18c and
Table 6 present the total efficiency of the PEMFC system, illustrating the combined effects of theoretical efficiency, power efficiency, and fuel efficiency using Equation (23):
According to the results, all conditions reached maximum efficiency at 0.6 V, after which the overall system efficiency gradually decreased as the supply flow rates of hydrogen and oxygen increased. Case 1, with the lowest inlet flow rate, exhibited the highest system efficiency. This was analyzed to result from higher fuel utilization under low-flow conditions and the absence of unreacted fuel discharge due to insufficient flow rates. However, from Case 1 to Case 3, under specific voltage conditions, increasing current loads led to voltage drops caused by reactant deficiency and crossover-induced flooding. In the I−P curve, this resulted in power outputs lower than required for practical operation, rendering these conditions difficult to utilize despite their high efficiency. Therefore, selecting optimal flow rates to balance efficiency, current, and power is critical in PEMFC system operation.
To analyze the optimal inlet flow rate conditions,
Figure 19 presents the total system efficiency alongside the I−V curve. In Cases 1 and 2, efficiency sharply declined beyond the maximum point as voltage decreased and current density increased. This trend was attributed to flooding caused by crossover and dominant concentration losses, rendering these conditions unsuitable for practical operation.
In Case 3, as an intermediate flow rate condition, current density and efficiency increased compared to Cases 1 and 2 due to improved inlet flow rates. However, flooding—a key issue identified in this PEMFC study—occurred, and the maximum current density of 1.02 A/cm2 was not achieved. Thus, this condition was deemed insufficient for optimal flow rate selection.
Case 5 exhibited the highest current density but was deemed unsuitable as the optimal flow rate condition due to its lower overall efficiency of 14% compared to Case 4. Additionally, the increase in current diminished progressively despite higher flow rates. This suggests the necessity of optimizing inlet flow rates to prevent unnecessary fuel consumption and achieve a mass flow rate that balances performance enhancement.
For a quantitative comparison of the results in
Figure 19,
Table 7 presents the hydrogen flow rate increase ratio, current density increase ratio, and power density increase ratio across all conditions. Notably, when comparing Cases 3 and 4, a 33.63% increase in the hydrogen inlet flow rate resulted in 24.40% and 19.05% increases in current and power density, respectively. Between Cases 4 and 5, the hydrogen flow rate increased by 24.83%, but current and power density showed only 10.20% and 4.00% increases, indicating diminishing returns in current and power gains despite higher flow rates.
Consequently, Case 4, with hydrogen at 3.02 LPM and oxygen at 9.56 LPM, was identified as the optimal inlet condition for the PEMFC used in this study, as it achieved higher efficiency with less fuel.


