Article

Prospective Assessment of Life Cycle, Quality, and Cost for Electric Product Improvement: Supporting Prototyping and Conceptualization by Employing CQ-LCA

Faculty of Mechanical Engineering and Aeronautics, Rzeszow University of Technology, 35-959 Rzeszow, Poland
*
Author to whom correspondence should be addressed.
Energies 2025, 18(12), 3038; https://doi.org/10.3390/en18123038
Submission received: 25 April 2025 / Revised: 27 May 2025 / Accepted: 6 June 2025 / Published: 8 June 2025

Abstract

The process of conceptualisation and prototyping of electric energy products is demanding due to the need for a multifaceted approach to product design. This task becomes even more complex during sustainable development, within which supporting techniques are sought. Energy conversion products such as electric motorcycles require special attention due to their impact on energy efficiency, environmental emissions, and operating and production costs. The research gap refers to the lack of a model to aggregate these aspects simultaneously. The objective of the research was to develop a CQ-LCA model (Cost–Quality–Life Cycle Assessment) supporting the creation of alternative product solutions and their evaluation in terms of the following: (i) environmental impact in the life cycle (LCA), (ii) quality, and (iii) production and/or purchase costs. The model was developed in seven main stages and tested for electric motorcycles and their ten prototypes, which are examples of modern products that convert electrical energy into mechanical energy. Using the EDAS method, the quality of electric motorcycle prototypes was calculated. Then, by the LCA method according to ISO 14040, the CO2 emissions were estimated and modelled adequately to quality change. Next, by the parametric model based on the static method and the cost value function, including the nominal least squares method, the cost was estimated adequately to quality and environmental change. The model provided a qualitative and quantitative interpretation of electric motorcycle prototypes (CQ-LCA), allowing for the consideration of product characteristics, such as engine power, charging time, and battery capacity, but also environmental impacts and costs. The originality is the provision of a multi-aspect morphological analysis, after which different scenarios of product solutions. The model can be useful for various commonly used energy-converting products.

1. Introduction

Electrification or electronic mobility is a key strategy aimed at mitigating the negative impact of the transport sector on the environment and health [1]. Electromobility is promoted as a future alternative to the means of transport that will bring noticeable environmental and economic benefits, thus encouraging actions towards sustainable urban transport [2]. Therefore, in developing countries, it is important to increase the share of electricity. This is possible, for example, by promoting it in various types of vehicles [1,3]. This means that energy savings, including emission reduction, can be achieved by promoting electric vehicles, especially in the subsectors of passenger cars, light trucks, buses, and motorcycles [4].
In addition, during the decarbonisation of the transport sector, it is important to implement low-emission alternative fuels. Various alternatives have been created, e.g., hydrogen or dimethyl ether/methanol, which is synthesised using carbon dioxide (CO2), constituting a raw material for fuel production. Research in this area was conducted, for example, by the authors of the article [5], who examined the relative economic and environmental efficiency of hydrogen and carbon dioxide. Hydrogen was produced during the reforming of steam methane and was produced by electrolysis using renewable energy. It was shown that a more favourable combination of costs and environmental efficiency is in the case of hydrogen, where it is recommended that CO2 comes from fossil sources, to make it becomes profitable in the long term [5].
Environmental and economic benefits were also sought for the use of an electric battery or a hybrid engine, comparing them to a combustion engine. This is due to the fact that electric vehicles are perceived as environmentally friendly and due to the fact that they do not emit emissions from the exhaust pipe. Despite this, battery production accounts for 50% of the total environmental impact of production [6]. Therefore, this is a hotspot in the development activities carried out in the context of electric vehicles. An example of an analysis in this area was presented by the authors of the study [7], who used a life cycle assessment “from the cradle to the grave”, including comparing these engines in various scenarios of solutions in the energy mix. In this analysis, the vehicle with an electric engine turned out to be the most advantageous. Similarly, in the work [6], an assessment of the simulation of energy needed for battery cell production was made. A scenario analysis was carried out that ensured the identification of factors and circumstances that influence demand.
There were also studies on the development of diesel oil, gasoline, or electric batteries, for example [8], which consisted of their analysis during real driving cycles. Another area of research was environmental indicators based on the life cycle assessment method, which were integrated with costs in various alternative vehicle production solutions, as in [9]. It was pointed out that during extraction and production, there are increasing concerns about metal depletion, including toxicity to humans, which is mainly generated by technologies such as photovoltaic panels or electric vehicles. Actions were also taken to ensure a comprehensive assessment of the sustainable development of passenger vehicles, e.g., with an internal combustion engine, powered by synthetic biofuel, fossil petrol, and an electric battery, as in [10], where these vehicles were assessed using environmental, economic, and social indicators. The assessments were supported by multi-criteria decision support methods.
A review of studies on the integration of LCA with other aspects, such as costs or product quality, was also conducted. For example, in [11], as part of making design and development decisions, a combination of LCA with product cost analyses and scenario-based economic risk modelling was proposed. Decisions on environmental analyses of products were also supported by other tools, as reported in [12], including environmental cost accounting, reporting, and the identification and analysis of environmental aspects. The aforementioned material flow cost accounting was also integrated with LCA in [13], where techniques supporting product improvement were sought. In turn, the authors of [14] proposed integrating LCA with quality aspects in the form of quality function deployment (QFD). This consisted of analysing customers’ quality requirements for products and, at the same time, environmental impact criteria. The cost aspect was also taken into account in the form of a model of production costs and environmental costs. The authors of [15] also addressed the issue of designing new products or improving products currently available on the market. They proposed taking into account environmental and cost aspects through the integration of LCA and LCC (Life Cycle Costing). The use of LCC was aimed at taking into account hidden and potential external costs throughout the product life cycle. There were also studies, such as [16], which were based on the development of a model for creating positive value for the customer in the form of integration of environmental and cost assessment and taking into account customer requirements. A similar model was presented by the authors of [17], in which they included ecological costs in the entire product cost. Ecological costs are understood as the costs (direct and indirect) of environmental impact in the life cycle. The model creates product alternatives that become profitable in terms of environmental impact, but also total costs for so-called green products. This is a mathematical model that supports the analysis of the relationships between the aforementioned aspects.
The summary of the conducted review of the literature on the subject is presented in Table 1.
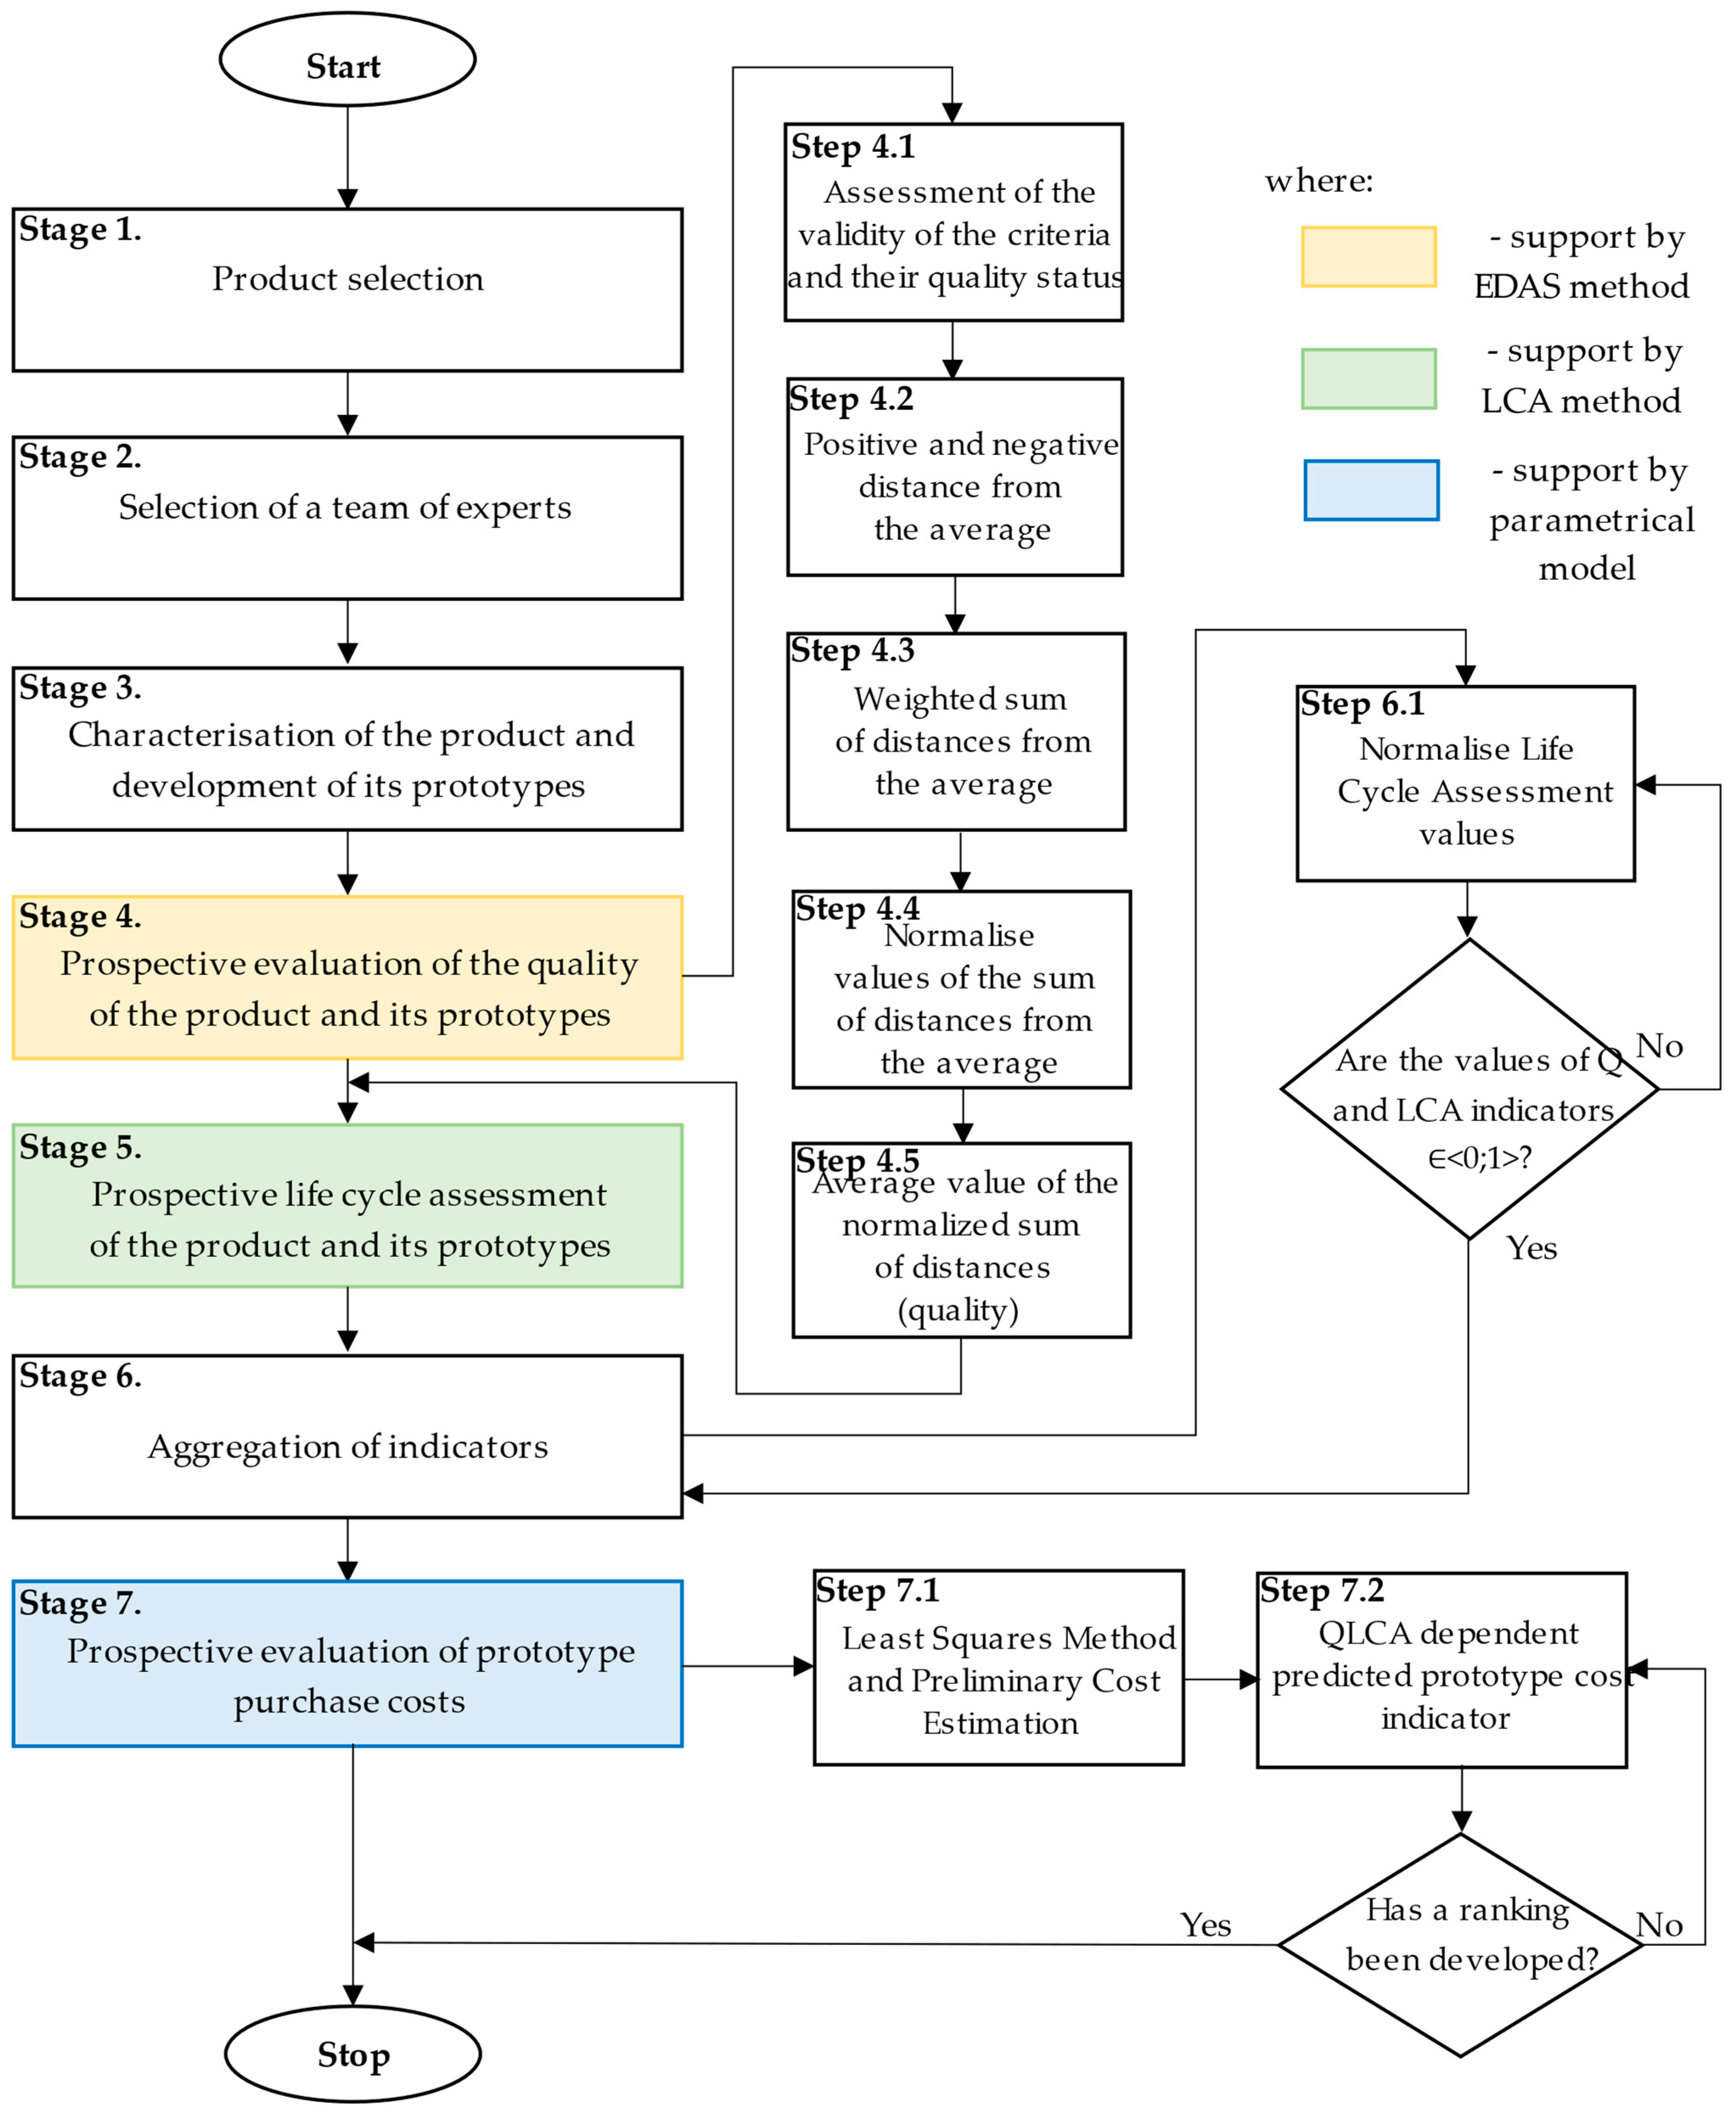
Research was shown to be undertaken within the framework of improving products from the transport sector, mainly in the direction of searching for more environmentally friendly solutions, e.g., electric vehicles. However, there was no research that would take into account other aspects, such as cost or quality. The integration of these aspects for other products has been found, but most of them focused on the environmental and cost aspects, mainly through extensive LCA and LCC analyses. In the case of the quality aspect, research was conducted on creating design solutions in QFD. Despite this, no solutions were developed to support the aggregation of alternative design solutions (prototypes) that would provide the modelling of product quality and environmental impact in the life cycle with an uncomplicated estimation of costs dependent on the quality and environmental solutions of the product. Therefore, the objective was to develop a CQ-LCA model that supports the creation of alternative product solutions and their assessment in terms of the following: (i) environmental impact in the life cycle, (ii) quality (customer satisfaction with use), and (iii) production and/or purchase costs. The novelty is the developed methodology, which provides a qualitative and quantitative interpretation of the results, including verbally on a relative state scale and indicatively (CQ-LCA). The originality lies in providing a multi-aspect morphological analysis, after which different scenarios of product solutions are determined depending on quality, LCA, and costs. The model was developed in a general way so it could be applied to various products.
Therefore, Section 2 is a presentation and characterisation of the model, including the general approach and scheme of the procedure and assumptions. However, its test is shown in the example of electric motorcycles. In turn, Section 3 is a test of the model on electric motorcycles.

2. Model Illustration and Description

2.1. General Approach

A CQ-LCA model was developed that supports the improvement in the product at the stage of their conceptualisation and prototyping. This concerns the early stage of product development, where key development decisions are made based on which it is considered reasonable to accept the project for production [18]. The process of conceptualisation and design (including prototyping) is demanding, mainly due to the need for a multi-aspect approach to product design [19]. This is particularly important in the case of sustainable product development, which forces a transition from traditional product prototyping focussing on quality aspects to multi-aspect prototyping, which also takes into account environmental or cost aspects [20,21]. Therefore, it was considered reasonable to propose a model for the prospective evaluation of product prototypes in terms of their quality, environmental impact, and costs. In the case of this form of analysis, quality is considered to be the fulfilment of customer satisfaction with the use of the product [22,23,24]. The quality aspect was presented by quality criteria, e.g., colour, efficiency, and functionality. On the other hand, it was assumed that the aspects of environmental impact would be analysed in the form of a life cycle assessment of prototypes against one selected criterion of environmental burden [25]. It was considered to be one of the most reliable methods of environmental assessment. In turn, the cost aspect was considered as the expected cost of production and/or purchase of a finished prototype [26,27], taking into account the parameters of quality and environmental aspects modelled for it. The general concept is presented in Figure 1.
The CQ-LCA model was created using selected decision support techniques (MCDM) and environmental and cost assessment techniques. In the case of quality assessment, the EDAS method (Evaluation Based on Distance from Average Solution) [28] was used, which is used to solve multi-criteria decision problems. EDAS is effective in solving stochastic problems, including searching for the most advantageous solutions between different alternatives [29]. Therefore, it was considered reasonable to use it in the case of comparing product prototypes. However, the assessment of the environmental impact of the prototypes was made on the basis of the traditional approach according to the LCA method according to ISO 14040 [30]. A traditional “cradle-to-grave” approach was used, where the environmental impacts during material acquisition and extraction, production, use and end of life are considered [31]. As part of the prospective evaluation of the costs necessary to be incurred during the production and/or purchase of products, a parametric model was used based on the static method and the cost value function, including the nominal least squares method [27].
After the main stages of the model, where the prototypes are assessed in terms of quality, environment, and cost, a decision indicator was obtained. These indicators were normalised so that they reached a value in the range of 0 to 1, where the more the better [32]. Aggregation occurred in the case of the quality indicator and the environmental indicator (QLCA). Then, it was an input element to the cost analysis, in which the production and/or purchase cost is predicted in relation to the offered prototypes demonstrating the modelled quality and at the same time the impact on the environment in the life cycle. On its basis, a ranking of prototypes was created and subsequent product development decisions were made. They were of a sustainable product development nature because they included prospective assessments of customer requirements and environmental impact in LCA, including costs.

2.2. Model Assumptions

The main assumptions for the model were developed. The purpose of the assumptions was to adapt the possibilities of using the model in different cases of analysis (in particular, for different types of products, where product variables may be different). Therefore, the assumptions of the model are as follows:
  • The product for testing can be any, where it is recommended to choose a popular (commonly used) product;
  • The product is characterised by about 10 quality criteria, which ensure the assessment of the product in terms of customer satisfaction with the use of the product;
  • Product quality assessment is carried out by assessing the states of product criteria expressed as current states (product on sale) and modified states (hypothetical product);
  • The assessment of the environmental impact of the product and its prototypes is carried out in terms of the entire life cycle according to the “from cradle to grave” approach, where the LCA method is used for the current product, while for prototypes, expert modelling of the results in relation to the offered modifications is performed;
  • Cost assessment (production and/or purchase) is carried out according to the principles of parametric modelling, where costs are dependent simultaneously on the quality and environmental level, and the cost estimation is carried out according to the method of least normal squares;
  • The prototype can be selected separately considering the quality, environmental, and cost aspects, or based on the aggregation of the quality and environmental aspects, including quality, environmental, and cost.
The model assumptions are explained in a broader context in the next section of the paper, where the model stages are presented.

2.3. Model Description

The CQ-LCA model was developed in seven main steps. Its characteristics are presented in a comprehensive and general way within the framework of its adaptation to any product. Figure 2 shows the flow chart of the model procedure.
The characteristics of the model are presented step by step in a synthetic manner, as shown in the next part of the study.
  • Stage 1. Product selection
A product is selected for testing. The selection is arbitrary and depends on the needs of the entity performing the analysis using the proposed model. Since this product will be assessed multidimensionally (in terms of quality, environmental impact in the life cycle, and costs), it is possible to select a product, for example, based on marketing data or the product development phase. The product selected for testing is called a reference product, which means it is a generalisation of products of a given type [33].
  • Stage 2. Selection of a team of experts
It is proposed that the model be supported by experts who are selected to implement its individual stages. The process of selecting a team of experts can be carried out according to dedicated methods, for example, those presented in [34,35].
Initially, the entity using the model selects experts who have knowledge, experience, and competence in assessing the quality of products and assessing the environmental impact of products in their life cycle. It would be beneficial to include experts in the budget analysis. It is assumed that each of the n experts specifies the same number of experts, where the minimum number of experts is calculated from Formula (1). However, providing the same number of experts conditions so that the total number of all the experts in the team can be estimated according to Formula (2) [34]:
N > n · z · n 1 n · z i = 1 n μ i + 1
N = n 2 n 1 n 2 i = 1 n μ i + 1
where N—expected number of experts; z—competent experts selected by n experts; and μ—number of unique experts selected by i-th experts from n expert group.
It is also possible to estimate the expert competence factor using the competence coefficient (3) [34]:
K k = k z + k a 2
where Kk—competence index; kz—expert knowledge index; ka—argumentation factor; and kz and ka    0 ; 1 .
The assessment of the problem knowledge and argumentation index is selected based on [34,35]. The team leader evaluates the experts’ knowledge. They may take into account the opinions of experts, taking into account their knowledge and competencies. A scale from 0 to 10 is used for this purpose (0—no competence; 10—full competence). The leader may use inter-rater reliability metrics or cross-validation with empirical data for expert evaluation, using, for example, the guidelines of the Suzuki method [36]. In the case of the argumentation index, the structure of arguments is taken into account, and the assessments given are estimated according to Formula (4) [34,35]:
k z = p · 0.1 ,   where   k z 0 ; 1 k a = a 1 + a 2 + a 3 ,   where   k a 0 ; 1
where p—ratings awarded by the i-th expert and a—arguments for assessment.
Then, high experience for the ka coefficient confirms its higher practical experience than theoretical. This is, e.g., ka = 1 (high), ka = 0.75 (medium), and ka = 0.5 (low), for all sources of argumentation for the expert opinion. It is assumed that the threshold value of the competence coefficient should not be lower than 0.6. Otherwise, experts for whom this coefficient is lower are omitted, as in Formula (5) [34,35]:
T = N N k k < 0.6
where N—required number of experts and Kk—expert competence factor.
As a result, the obtained number of experts T is the number of competent experts who can create a team supporting the analysis process. In accordance with the principles of teamwork, it is often crucial to select a process leader who will supervise the team’s work and check the correctness of the performed stages of the model.
  • Stage 3. Characterisation of the product and development of its prototypes
The product selected for analysis is characterised in terms of quality criteria that have a direct impact on customer satisfaction. Quality criteria concern the usability of the product. They are selected by a team of experts using, for example, the product catalogue, including the principles of teamwork, e.g., brainstorming (BM). During selecting the type of criteria, it is possible to be based on rules proposed by Garvin, as in [22,37], and other studies, for example [38]. According to the authors of [39], the maximum number of criteria is approximately 10. However, their number may be greater if the product is complex. Therefore, it is recommended to limit oneself to key criteria, i.e., those that have the greatest impact on the quality of the product [22,40]. These criteria should be characterised according to their current parameters, e.g., value, value range, and description. They can be obtained from the product catalogue. Subsequently, modifications to the quality criteria are proposed in the form of alternative design solutions. For this purpose, the team of experts modifies the current parameters of the criteria by proposing other, new parameters, e.g., values above and below the current state. In the case of criteria with quantitative parameters, the Pareto principle can be applied [39].
  • Stage 4. Prospective evaluation of the quality of the product and its prototypes
The quality of the reference (current) product and its alternative product solutions (prototypes) is assessed. EDAS (Evaluation Based on Distance from Average Solution) is used for this purpose [41]. This method is used to solve multi-criteria decision problems, where in this case it concerns various modifications of the product quality criteria [42,43]. For this purpose, a team of experts assesses the importance of quality criteria and assesses the quality of criteria and their alternative product solutions (prototypes). The ratings are awarded by distributing the weight values on a scale from 0 to 1, where 0 is unimportant and 1—most important, so that the sum of the weights for all criteria is 1. Then the average solution (AVj) is calculated as follows (6) [44]:
AV j = i = 1 n x ij n
where x—value (rating) of the j-th qualitative criterion in relation to the i-th alternative and n—number of alternatives of the criterion, i, j = 1, 2, …, n.
According to Formula (7), the positive distance from the mean (PDA) is calculated, which depends on the favourable criteria (the more the better) and the unfavourable criteria (the worse) [28]:
PDA ij = max 0 , x ij AV j AV j if j th   criterion   is   beneficial PDA ij = max 0 , AV j x ij AV j if j th   criterion   is   non-beneficial
where x—value (rating) of the j-th qualitative criterion in relation to the i-th alternative; n—number of alternatives of the criterion; and AV—value of the average solution for the j-th criterion i, j = 1, 2, …, n.
Then, Formula (8) is used to calculate the negative distance from the mean (NDA) [42]:
NDA ij = max 0 , AV j x ij AV j if j th   criterion   is   beneficial NDA ij = max 0 , x ij AV j AV j if j th   criterion   is   non-beneficial
where x—value (rating) of the j-th qualitative criterion in relation to the i-th alternative; n—number of alternatives of the criterion; and AV—value of the average solution for the j-th criterion i, j = 1, 2, …, n.
Based on them, the weighted sum of the positive distance from the mean (SP) (9) and the sum of the negative distance from the mean (SN) (10) are calculated [42,44]:
SP i = j = 1 m w j PDA ij
SN i = j = 1 m w j NDA ij
where w—weight of the j-th quality criterion; PDA—positive distance from the mean; NDA—negative distance from the mean, i, j = 1, 2, …, n.
Then, the normalised values of the sum of positive and negative distances from the average are calculated (11) and (12) [28]:
NSP i = SP i max i SP i
NSN i = 1 SN i max i SN i
where SP—sum of positive distances from the mean; SN—sum of negative distances from the mean; i = 1, 2, …, n.
Finally, the average value of the normalised sum of positive and negative distances is calculated, which in this case is identified with the quality of the product and its prototypes (13) [41,42]:
Q i = 1 2 NSP i + NSN i
where NSP—normalised value of the sum of the positive distance from the mean and NSN—normalised value of the sum of the negative distance from the mean.
According to the Q index, a ranking of products is developed. The higher the Q value, the more beneficial the product is for the customer in terms of quality.
  • Stage 5. Prospective life cycle assessment of the product and its prototypes
A life cycle assessment of the product is carried out according to the ISO 14040 standard [30]. It is recommended to carry out the assessment according to the LCA method, where the main environmental burdens in the product life cycle are calculated, e.g., according to the “cradle to grave” approach [31]. Then, the basic phases are taken into account, i.e., the acquisition and extraction of materials, production, use, and end of life [45]. For this purpose, it is necessary to define, e.g., a functional unit, which ensures the normalisation of data for further analysis. This is a quantitative description of the product function, applicable to all the analyses carried out as part of the assessment of environmental burdens [46]. In the case of a product, the function may refer to the characteristics of the tested product [47]. The system boundaries are also defined, e.g., spatial and temporal, which refer to the area and time of data obtained for analysis, at the same time referring to the phases according to which the life cycle assessment is carried out. The use of computer programs, e.g., GREET v1.3.0.13991, is helpful in the life cycle assessment. It is assumed that the product life cycle assessment is carried out in terms of one environmental burden criterion. The choice of the burden criterion depends on the needs of the analysis.
Due to the fact that the proposed approach involves a prospective assessment of the life cycle of the prototype product, it was assumed that it would be carried out using conventional modelling of the indicator of change in the environmental impact of the reference product in the life cycle (calculated for the reference product) [48,49,50]. This modelling was assumed to depend on the main quality criteria, which are directly related to the potential environmental burden of the product. Significant changes in the parameters of these criteria are expected to have a significant impact on the environment. Therefore, the average value of the parameters of these criteria is estimated for the current product and its prototypes. Then, a change in the value of the environmental impact of CO2 emissions for the prototypes is made [51]. This involves modelling the value of the environmental impact of the current product due to the average value of the parameters of the significant quality criteria [52]. As a result, the environmental impact indicator in the life cycle of the product and its prototypes (EI) is determined depending on the selected environmental burden criterion.
  • Stage 6. Aggregation of indicators
As part of the standardised analysis of the model results, it is necessary to aggregate (integrate) them. In the previous stages of the model, the quality index (Q) of the product and its prototypes and the index of their environmental impact on the life cycle (EI) were obtained. Due to the fact that the Q index is in the numerical range of 0 to 1, and the EI values can be much greater than 1, the indicators are initially reduced to one numerical range. Therefore, EI values are normalised according to Formula (14) [32,53]:
LCA i = max EI i EI i max EI i min EI i
where EI—value of the environmental impact of the product or prototype in the life cycle and i—product or prototype; i = 1, 2, …, n.
The normalisation method is based on the principle that the higher the value of the environmental burden, the worse. Therefore, after normalisation, the value of the environmental impact indicator in the life cycle (LCA) reaches values on a scale from 0 to 1, where the higher the better (lower impact on the environment).
This is consistent with the values of the quality indicator Q, where the higher the value, the more beneficial the quality for the customer. Therefore, it was assumed to aggregate the indicators into one quality–environmental indicator (QLCA) (15) [54]:
QLCA i = Q i + LCA i 2
where Q—quality indicator; LCA—life cycle environmental impact indicator; and i—product or prototype; i = 1, 2, …, n.
The higher the QLCA value, the more beneficial the prototype is. At the same time, taking into account quality (customer satisfaction with use) and environmental friendliness in the life cycle.
  • Stage 7. Prospective evaluation of prototype purchase costs
Sustainable product development and product development decision-making often depend on the cost aspect. In this case, it concerns the cost of purchasing the product by the customer, including, for example, the cost of producing a prototype in the company. Having data on the quality of prototypes and their impact on the environment in the life cycle (QLCA), it is assumed that the cost of purchasing prototypes is modelled taking into account QLCA. It is assumed for this purpose to use a parametric model, which is based on a statistical method and a cost value function. It was considered reasonable to use the parametric modelling technique due to the variables available, such as the prototype quality index (Q) and the environmental impact index (LCA). Parametric models are useful in the early stages of design, as reported, e.g., in [27].
Following the authors of the article [27], it is necessary to select a parameter that describes the level of costs. In the developed model, it is the QLCA indicator. The relationship between the QLCA indicator and the prototype cost is then analysed. The least-normal squares method is used, which consists of identifying the value of the parameter that will estimate the structural model. Then, the sum of squares of deviations of the empirical values for the explanatory variable of the theoretical value from the created model is as small as possible (16) [27]:
C i = a · QLCA i + b
where C—prototype cost; QLCA—quality and environmental index; a, b—constants; and i—prototypes; i = 1, 2, …, n.
Similarly to the authors of [27], the least normal squares was used to calculate the constants a and b. The condition is presented as follows (17):
i = 1 n e i 2 min e i = C i b a · QLCA
where et—deviation of actual values from theoretical values, i.e., the rest of the model.
Then, it is possible to determine partial derivatives with respect to constants a and b, and then to equate them to zero. Finally, as stated by the authors of [27], the following formula (18) is obtained:
a = i = 1 n C i C ¯ QLCA i QLCA ¯ i = 1 n QLCA i QLCA ¯ 2 b = C ¯ a · QLCA ¯
where C ¯ —average value of costs of all analysed prototypes; QLCA ¯ —average value of quality and environmental indicators of all analysed prototypes; and i—prototype; i = 1,2, …, n.
The expected cost (C) can be normalised according to Formula (14). Then, it will be an indicator of the expected cost presented in the range of values from 0 to 1. Then, the value 1 means the most favourable cost (the lowest), and 0 the least favourable cost (the highest).
Following the function authors [23,25], the obtained change in the prototype cost value in relation to the quality–environmental index (QLCA) can be presented per 1000 units for the range of values from 0 to 100 (%) (19):
f C = 1000 QLCA
where QLCA—quality–environmental index (%) and fc—function of cost change in relation to the change in the quality–environmental index.
The cost change function of the prototypes in the proposed approach can be presented conventionally as in Figure 3.
This shows that the more favourable the product quality indicator, the more favourable (friendly) the product’s impact on the environment can be. This is consistent with the general assumption of product improvement, which should not only refer to improving the quality of the product in order to meet customer satisfaction, but also at the same time reduce their negative impact on the environment.
Based on the prospective cost indicator, which depends on the prospective quality–environmental indicator, a decision is made to select the most advantageous prototype. In this case, it is the prototype with the first position in the ranking according to the prospective cost indicator. Then, it has the lowest cost, including relatively high quality and environmentally friendly impact in the life cycle. The final decision to select the prototype depends on the entity that uses the model.

3. Results

The test and illustrations of the model were carried out on the example of electric motorcycles. Their selection was determined by their growing popularity among customers, where according to data from BusinessWire, they are expected to reach USD 892.4 million by 2025. At the same time, they are a more environmentally friendly alternative to traditional combustion motorcycles. The electric motorcycles selected, for example, are motorcycles for general use, so they are considered a reference product (generalisation of electric motorcycles of this type). Following the authors of the work [55], it is assumed that motorcycles are used for everyday use in normal conditions, for example, on city roads.
Following the proposed model, a team of experts was selected to support the further stages of the analysis. Initially, the authors of the article selected two more experts, consisting of customers who own electric scooters or plan to buy them in the near future. Then, using Formulas (1) and (2), it was estimated that the minimum number of experts in the team should be at least four experts. Then, each of the experts in the team estimated their coefficient of competence according to Formulas (3) and (4). One of the experts estimated his skills in the analysis of the considered issue below the assumed threshold value of 0.6. Therefore, using Formula (5), the team of experts included five experts, who were the authors of the article and three customers.
The reference electric motorcycle was then characterised and its hypothetical prototypes were developed. As assumed in the third stage of the model, the electric motorcycle is characterised by the quality criteria that affect customer satisfaction with the motorcycle’s usability. The quality criteria were selected based on publicly available catalogues of these products and according to a review of the literature, e.g., [56]. These criteria are as follows:
  • Maximum engine power (W);
  • Maximum speed (km/h);
  • Battery capacity (Ah);
  • Maximum range (km);
  • Battery voltage (V);
  • Charging time (h);
  • Permissible load (kg);
  • Length (m);
  • Width (m);
  • Height (m);
  • Colour.
Finally, 11 main criteria of the electric motorcycle were chosen, based on the adopted assumptions about the number of criteria, as in [57]. Subsequently, the criteria were described according to the current catalogue of these products, and then their possible modifications were proposed in the form of alternative design solutions. The result is presented in Table 2.
Hence, one electric motorcycle as a reference product expressed by the criteria in its current state (P0) and nine prototypes in a modified state (P1–P9) were further analysed.
Following the adopted model, the team of experts assessed the quality of the electric motorcycle and its prototypes. The EDAS method was used for this purpose. Therefore, initially, the importance of quality criteria was given. In the case analysed, the most important criterion was the maximum engine power (0.15), then the maximum range (0.13) and then the battery capacity (0.11). The following criteria turned out to be less important: maximum speed, charging time, height (0.09), and then battery voltage, permissible load, and colour (0.07). The least important were length and width (0.06). Each of these criteria was additionally classified into advantage criteria (the more, the better) and disadvantage criteria (the more, the worse). Based on the real parameters of these criteria, including the use of Formula (6), the average solution for these criteria was calculated in relation to the analysed prototypes (AV). The results are presented in Table 3.
Using Formulas (8) and (9), the positive distance from the mean (PDA) and the negative distance from the mean (NDA) were calculated. On their basis, the weighted sum of the positive distance from the mean (SP) and the sum of the negative distance from the mean (SN) (10–11) were calculated. Subsequently, according to Formulas (12) and (13), the normalised values of the sum of the positive and negative distances from the mean were calculated. Based on it, according to Formula (14), the value of the normalised sum of the positive and negative distance from the mean was estimated, i.e., the quality of the electric motorcycle prototypes (Q). The results are presented in Table 4.
According to the Q indicator (as in Table 4), a ranking of prototypes was created. The results are shown in Figure 4.
It was observed that prototype 7 was the most advantageous in terms of quality. It ranked first in the ranking and was characterised by the highest quality indicator among those analysed. Prototype 5 turned out to be the least advantageous. However, within the proposed modelling process, the environmental aspect of these prototypes was taken into account.
Therefore, a prospective life cycle assessment of the electric motorcycle and its prototypes was carried out. It was based on the ISO 14040 standard in this “from cradle to grave” approach, which takes into account the acquisition and extraction of materials, production, use, and end of life. Hence, the system boundaries were the aforementioned LCA phases, including the assumption of conducting LCA with respect to one criterion of environmental burden, which is carbon dioxide (CO2) emission kg equivalent. The choice of this criterion resulted from its direct connection with electric motorcycles, as reported, e.g., in [26]. Furthermore, the system boundaries included the main components of the electric scooter, which were selected based on [58], that is, accessories, battery, brakes and wheels, electrical and electronic components, frame, mechanical and mechatronic components, electric motor, steering system and gearbox, suspension, tyres and inner tubes, and packaging. Following the authors of other works, for example, [55], the functional unit was defined as 80,000 km travelled by the motorcycle in the life cycle. This corresponds to the distances also given by [26], and also meets the conditions of the assumptions about the BEV battery adopted by the authors of the work [55].
To estimate carbon dioxide emissions in the extraction and processing of materials used for the production of electric motorcycles, following the authors of the work [59], the following formula (20) was adopted:
C M = x C x , f + C x , e C x , f = m x n E x , n k ω x , n , k α k C x , e = m x n E x , n ω x , n , e 3600
where C x , f —carbon dioxide emission from fuel consumption during material production; C x , e —carbon dioxide emission from electricity consumption during material production; x—material; m—mass (kg); n—production process; E x , n —energy consumption per unit of material in its production process (kJ/kg); k—fuel; ω x , n , k —share of fuel consumption in E x , n ; ω x , n , e —share of electricity consumption in E x , n ; and α k —carbon emission factor in fuel CO 2 kg / kJ .
Therefore, it was necessary to estimate the materials used for the production of electric motorcycles. It was based on selected data from the GREET v1.3.0.13991 programme [60], including a review of the literature, e.g., [55,58]. Additionally, following the authors of the works [61,62,63,64,65,66], the CO2 emission factor was estimated in the production of materials (kg/kg) for selected materials, and the results obtained results are presented in Table 5.
Then, based on the literature review, for example [61], the energy consumption coefficient for material production and the carbon dioxide emission coefficient were estimated, excluding the motorcycle battery. This is presented in Table 6.
Inventory data may differ, e.g., due to different processes of material extraction and processing. However, for the reference electric motorcycle, including the assumptions indicated, these data were sufficient for a preliminary estimate of CO2 emissions for the acquisition and extraction of materials. Formula (20) was used for this purpose, and the results are presented in Table 7.
Finally, it was shown that the total CO2 emission during the extraction and processing phase of the materials used in the electric motorcycle is 0.27 MJ.
Then, an analysis of CO2 emissions was carried out in the production of the components of this vehicle. Emissions are often taken into account during the processing of the main components, including their assembly, welding, or painting [67]. Formula (21) is used to estimate CO2 emissions during the production of the vehicle and its components [59]:
C VA = x C y , f + C y , e + E VA 3600 C y , f = q E y , q k ω y , q , k α k C y , e , = q E y , q ω y , q , e 3600
where C y , f —carbon dioxide emission from fuel consumption during component production; C y , e —carbon dioxide emission from electricity consumption during component production; y—vehicle component (part); E VA —electricity consumption during vehicle assembly; q—production process; E y , q —energy consumption by the component in the production process (kJ); ω y , q , k —share of fuel consumption in E y , q ; ω y , q , e —share of electricity in E y , q ; and α k —carbon emission factor in fuel CO 2 kg / kJ .
The reference electric motorcycle was assumed to weigh 230 kg. Therefore, CO2 emissions and electricity consumption in the production phase were estimated based on data from the GREET model and data from a review of the literature [59,68,69,70,71]. The results are presented in Table 8.
In the production phase of the electric motorcycle life cycle, it is also necessary to determine the type of battery. According to the authors of the works [72,73,74], it was assumed that a lithium-ion battery was installed in the analysed electric motorcycle. Since the CQ-LCA model is based on an in-depth analysis of the quality of the criteria, their impact on the environment in the life cycle, and costs, the analysis was not extended to the criteria for the lithium-ion battery. As part of the model test, available data from the literature were used. Its detailed analysis in light vehicles is presented, for example, in [75,76]. Following the authors of the article [59], the energy consumption used to install the battery in a light passenger vehicle (e.g., an electric motorcycle) is 2.67 MJ/kg. Then, according to Formula (21), the total value of carbon dioxide consumption of the reference electric motorcycle in the production phase is about 7505 MJ.
The phase of use of the reference electric motorcycle was then analysed [67]. For an electric vehicle, Formula (22) is used [59]:
C VU = dP E 100 C E
where PE—electricity consumption per 100 km by the electric vehicle (kWh/km); CE—charging efficiency; and d—total driving distance of the vehicle (km).
Therefore, considering the reference electric motorcycle, it was assumed that the average electric energy consumption of an electric motorcycle is 0.126 MJ/h [56]. In turn, the charging efficiency is approximately 94% (for lithium-ion batteries) [75,76,77]. According to the functional unit, the electric motorcycle will cover a distance of 80,000 km in its lifetime [55]. Using Formula (22), it was estimated that the carbon dioxide emissions during the use of this vehicle are 10,723 MJ.
The carbon dioxide emissions during recycling from selected components of electric motorcycles were then analysed. In the recycling phase, for example, materials are separated, cleaned, and others. It is often possible to observe the division of the recycling phase into components, omitting the battery and then including the battery. It is also possible to consider recycling and reuse in this phase [67]. Carbon dioxide emissions in light vehicle recycling are estimated using Formula (23) [59]:
C RE = C re , f + C re , e C re , f = x m x E re , x k ω re , x , k α k C re , e = E vd 3600 + x m x E re , x ω re , x , e 3600
where C re , f —carbon dioxide emission from fuel consumption in vehicle recycling; C re , e —carbon dioxide emission from electricity consumption in vehicle recycling; E re , x —energy consumption per unit of material x in the recycling phase (kJ/kg); x—recycled material; ω re , x , k —share of fuel consumption in E re , x ; ω re , x , k —share of electricity consumption in E re , x ; m—mass (kg); and E vd —energy consumption during vehicle dismantling.
According to previous assumptions, using Formula (23), CO2 emissions that occur in the recycling process of selected components of an electric motorcycle (taking into account battery recycling using hydrometallurgical technology) were estimated. Data were based on the GREET model and a review of the literature and reports [78,79,80,81], including previous studies, e.g., [76]. Finally, CO2 emissions (taking into account battery recycling) were estimated at about C R E = 1760 MJ. As confirmed by the authors of other works, e.g., [78,81,82], it was shown to emit a significant amount of CO2 in the last phase of LCA.
Finally, calculations were possible to determine the carbon dioxide emission factor throughout the entire life cycle of electric motorcycles (24) [59]:
E = C M + C VA + C VU + C RE
where LCA—total life cycle carbon dioxide emissions of the vehicle; C M —carbon dioxide emissions from material extraction and processing; CVA—carbon dioxide emissions from vehicle and component production; CVU—carbon dioxide emissions from vehicle use; and CRE—carbon dioxide emissions from vehicle recycling, i-ith vehicle alternative, reference vehicle.
Ultimately, the total environmental impact of CO2 emissions from the electric motorcycle under consideration was estimated at 19,988 MJ throughout the life cycle “from cradle to grave”. The highest CO2 emissions were observed during the use phase.
Due to the fact that the proposed approach performs a prospective life cycle assessment of product prototypes, it was assumed that it would be carried out by means of conventional modelling of the change in the environmental impact indicator of the reference product in the life cycle (calculated for the reference product). This modelling included making the value of environmental impact in the life cycle dependent on the main quality criteria, which are directly related to the potential environmental burden of the product. The quality criteria, which were made dependent on the modelling of LCA results, were battery capacity, charging time, length, width, and height. Significant changes in the parameters of these criteria may have a significant impact on the environment. Therefore, the average value of the parameters of these criteria was estimated for the current reference motorcycle and its prototypes. Then, the change in the value of the environmental impact of CO2 emissions for the electric motorcycle was estimated. For this purpose, the value of the environmental impact of the current electric motorcycle was modelled in terms of the average value of the parameters of the important quality criteria (Table 9).
As a result, the environmental impact index (EI) of the electric motorcycle and its prototypes in the life cycle was modelled. Using Formula (14), the EI values were normalised, which was called the LCA indicator, as shown in Figure 5.
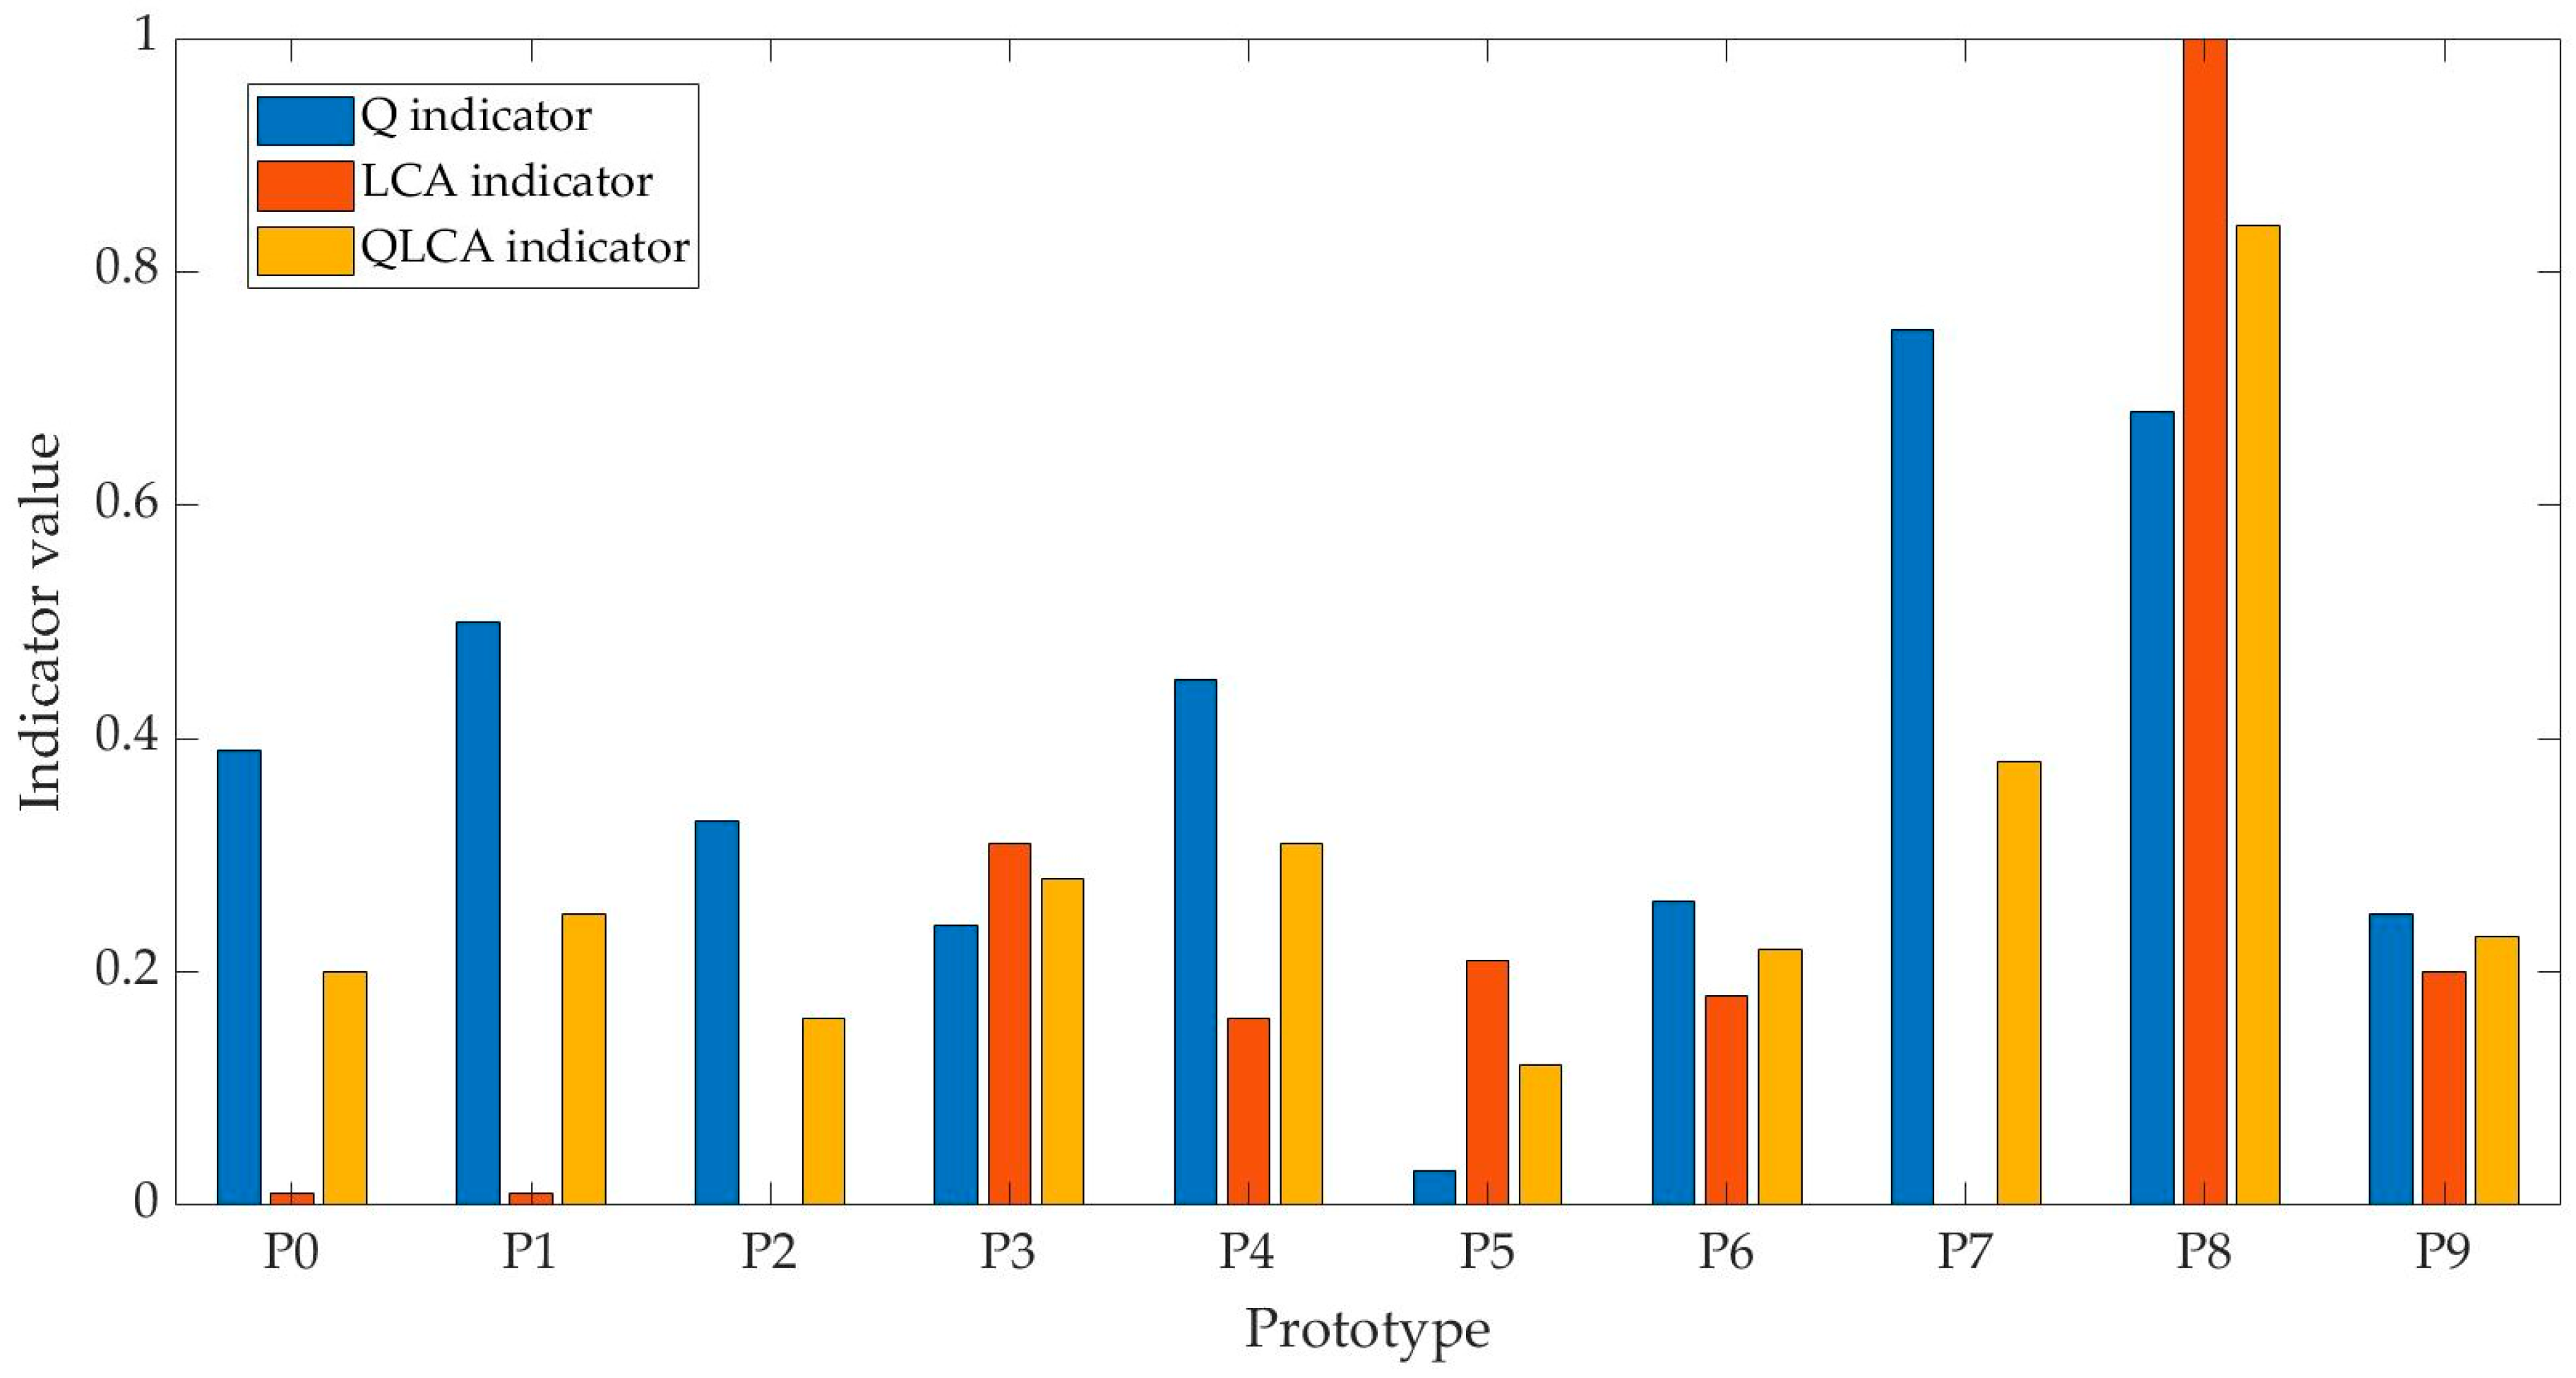
It was shown that the most advantageous is prototype 8, which took the first position in the ranking and had the lowest environmental burden index in the life cycle in the case of carbon dioxide emissions. As part of the standardised analysis of the model results, it was necessary to aggregate (integrate) them. According to Formula (15), an aggregated quality and environmental index (QLCA) was created, according to which a ranking of electric motorcycle prototypes was developed. The result is presented in Figure 6.
As shown in Figure 6, taking into account both quality and environmental aspects, prototype 8 was shown to be the most advantageous. In this case, it has the second position for the quality aspect and the first position for the environmental aspect. The next one is prototype 7, which has the first position for the quality aspect and the last position for the environmental aspect. In the case under consideration, this indicates the advantage of the share of the quality aspect in relation to the environmental aspect in the overall QLCA indicator.
Due to the fact that sustainable product development and product development decision-making often depend on the cost aspect, an analysis was carried out using a parametric model. As assumed, the method of the least normal squares was used, as in Formula (17), which consists of identifying the parameter value. In the case analysed, the costs were estimated depending on the quality–environmental indicator (QLCA). Then, it was possible to determine partial derivatives with respect to constants a and b and then equate them to zero. Later, using Formula (18), the constants with values a and b were estimated. The average value of the prototype QLCA index for the analysis was 0.30. In the case of estimated prototype costs, it was PLN 5684.90. Subsequently, according to Formula (18), constants with values a = 3296.48 and b = 5684.60 were estimated. According to them, a structural model was developed, as in Formula (16), where in this case it is C i = 3296.48 · QLCA i + 5684.60 . The results of the calculations for the analysed prototypes and their ranking are presented in Table 10.
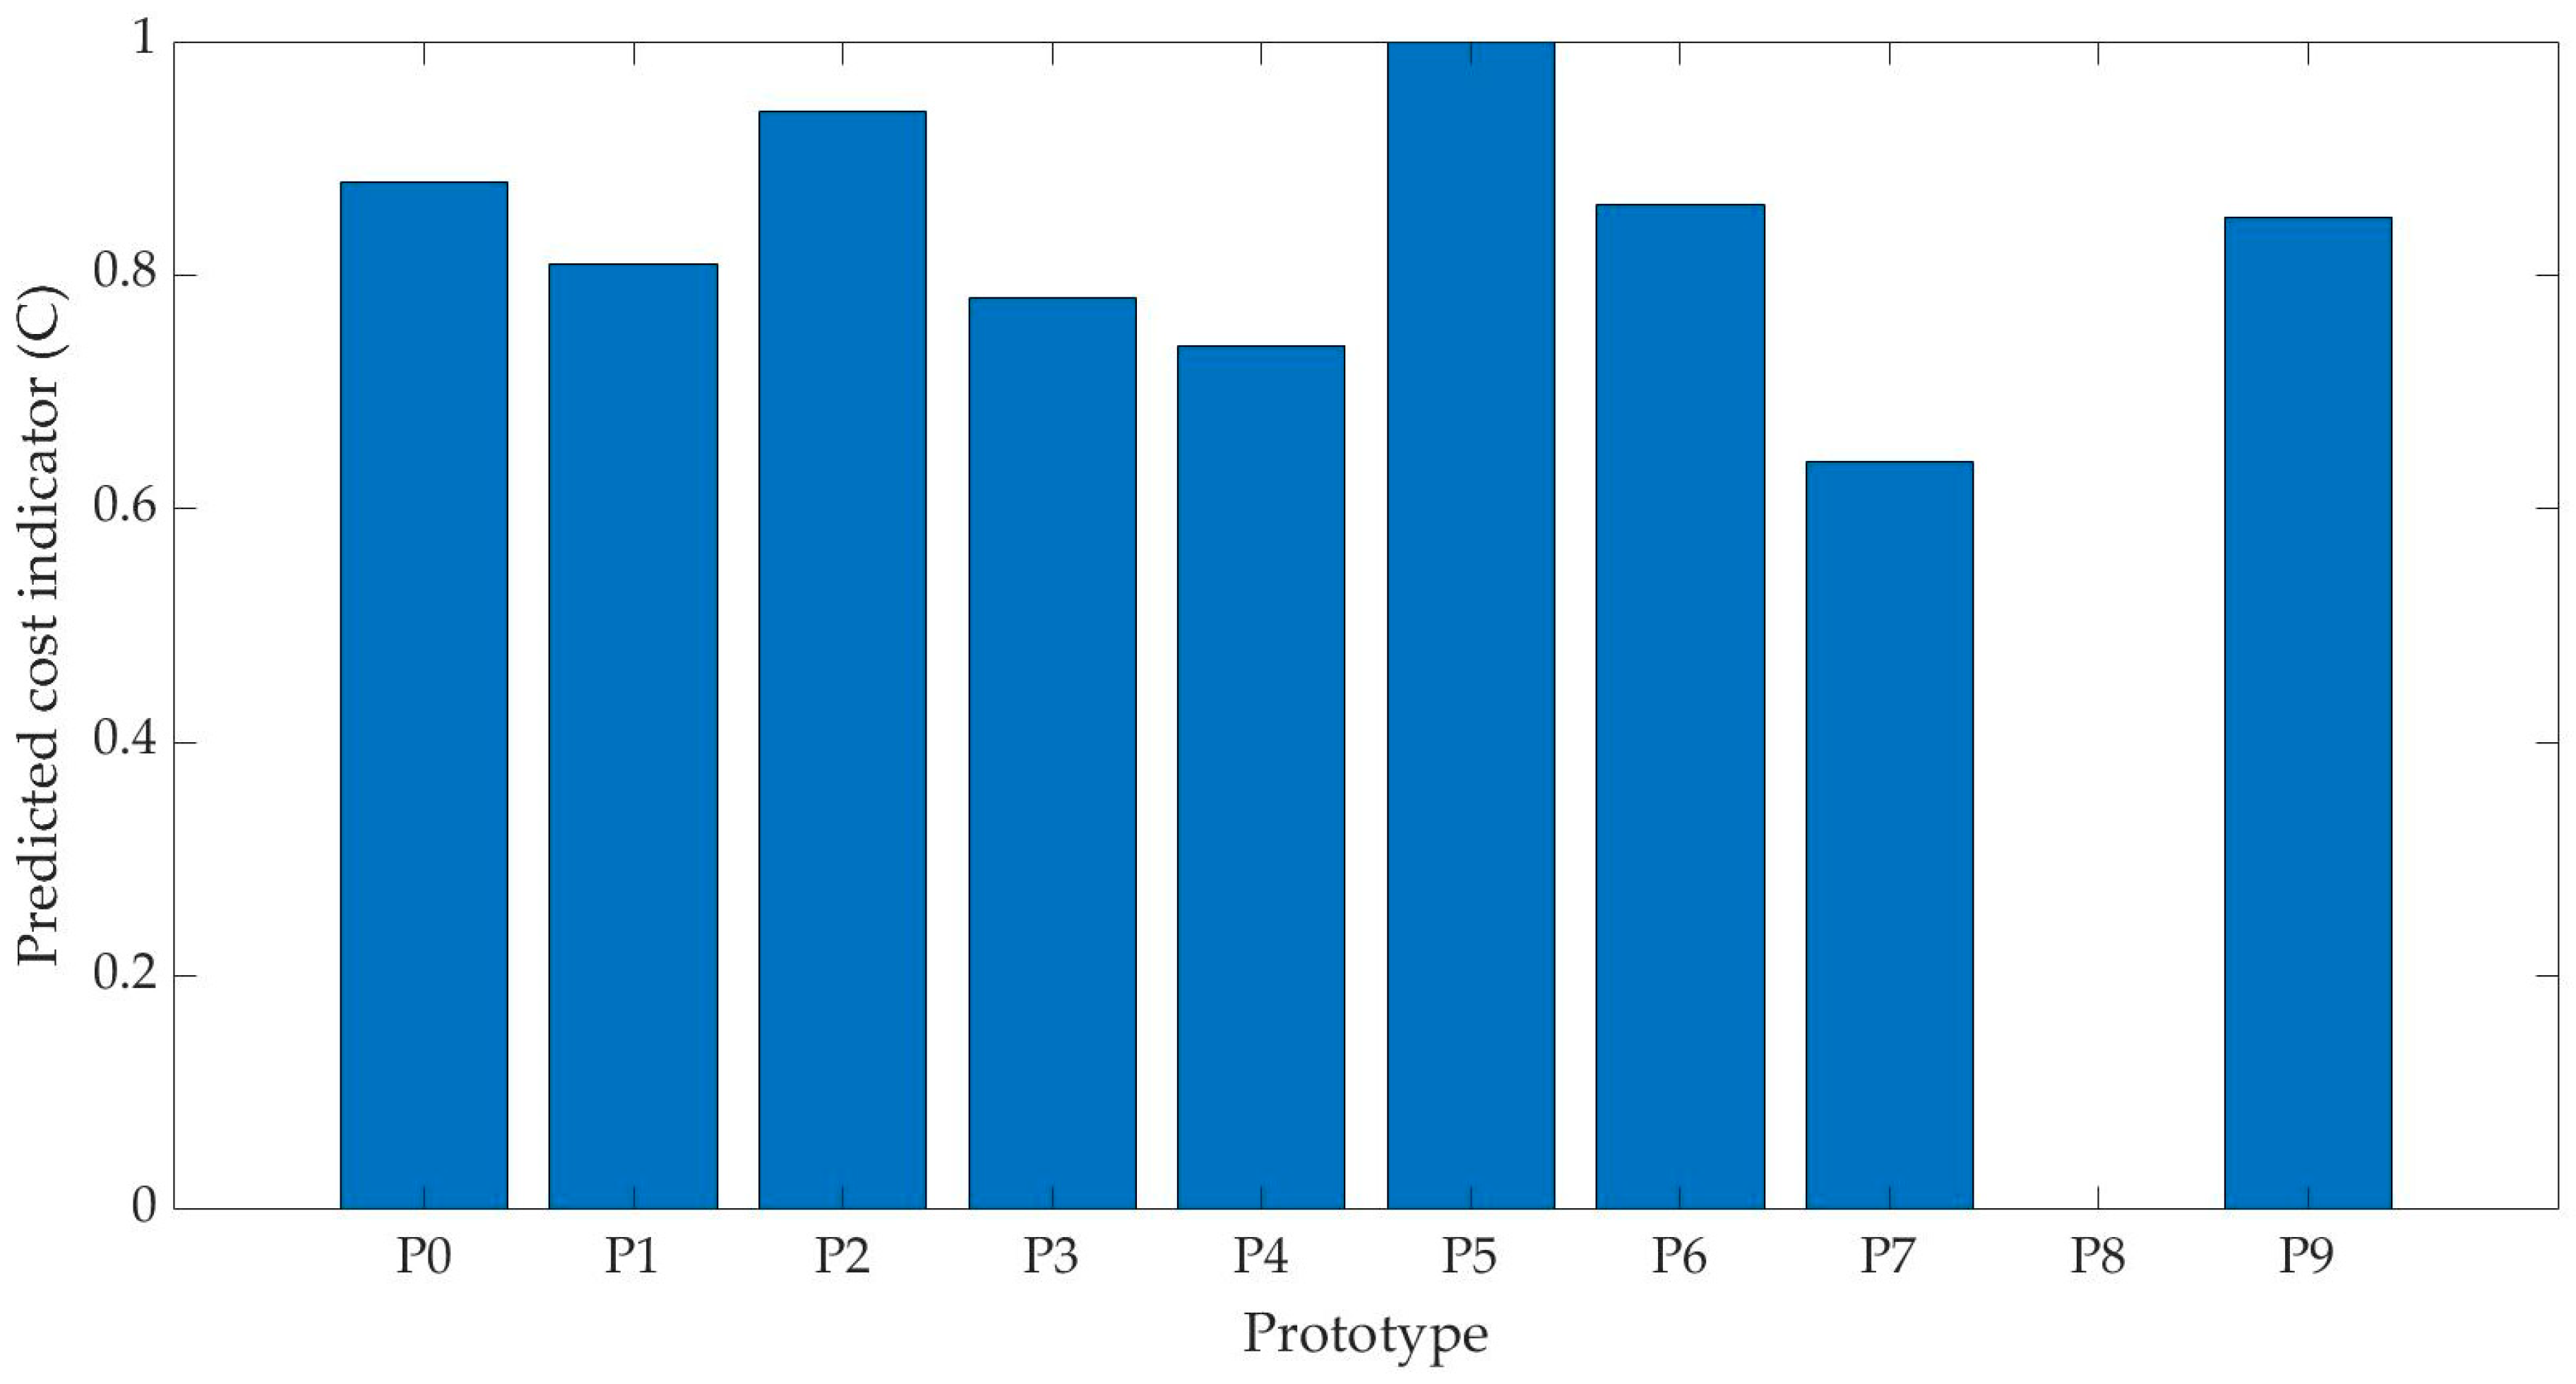
Based on the analysis results, the predicted cost values were normalised using Formula (14). Finally, a comparison of electric motorcycle prototypes was developed in relation to the normalised cost index (C) dependent on the quality–environmental index (QLCA), as shown in Figure 7.
From the analysed results presented in Figure 7, it was observed that the most advantageous prototype turned out to be the P5 prototype. It is characterised by a relatively low cost, good quality, and at the same time does not have a very negative impact on the natural environment in the life cycle compared to the other prototypes. Therefore, it is proposed to consider this prototype as the most advantageous with the assumptions adopted. However, the final decision depends on the entity using the model. In the case of, for example, a lack of resources or difficult access to technology, it is possible to decide on the next prototype, e.g., P2. The least advantageous in the simultaneous qualitative-environmental-cost approach is the prototype P8.
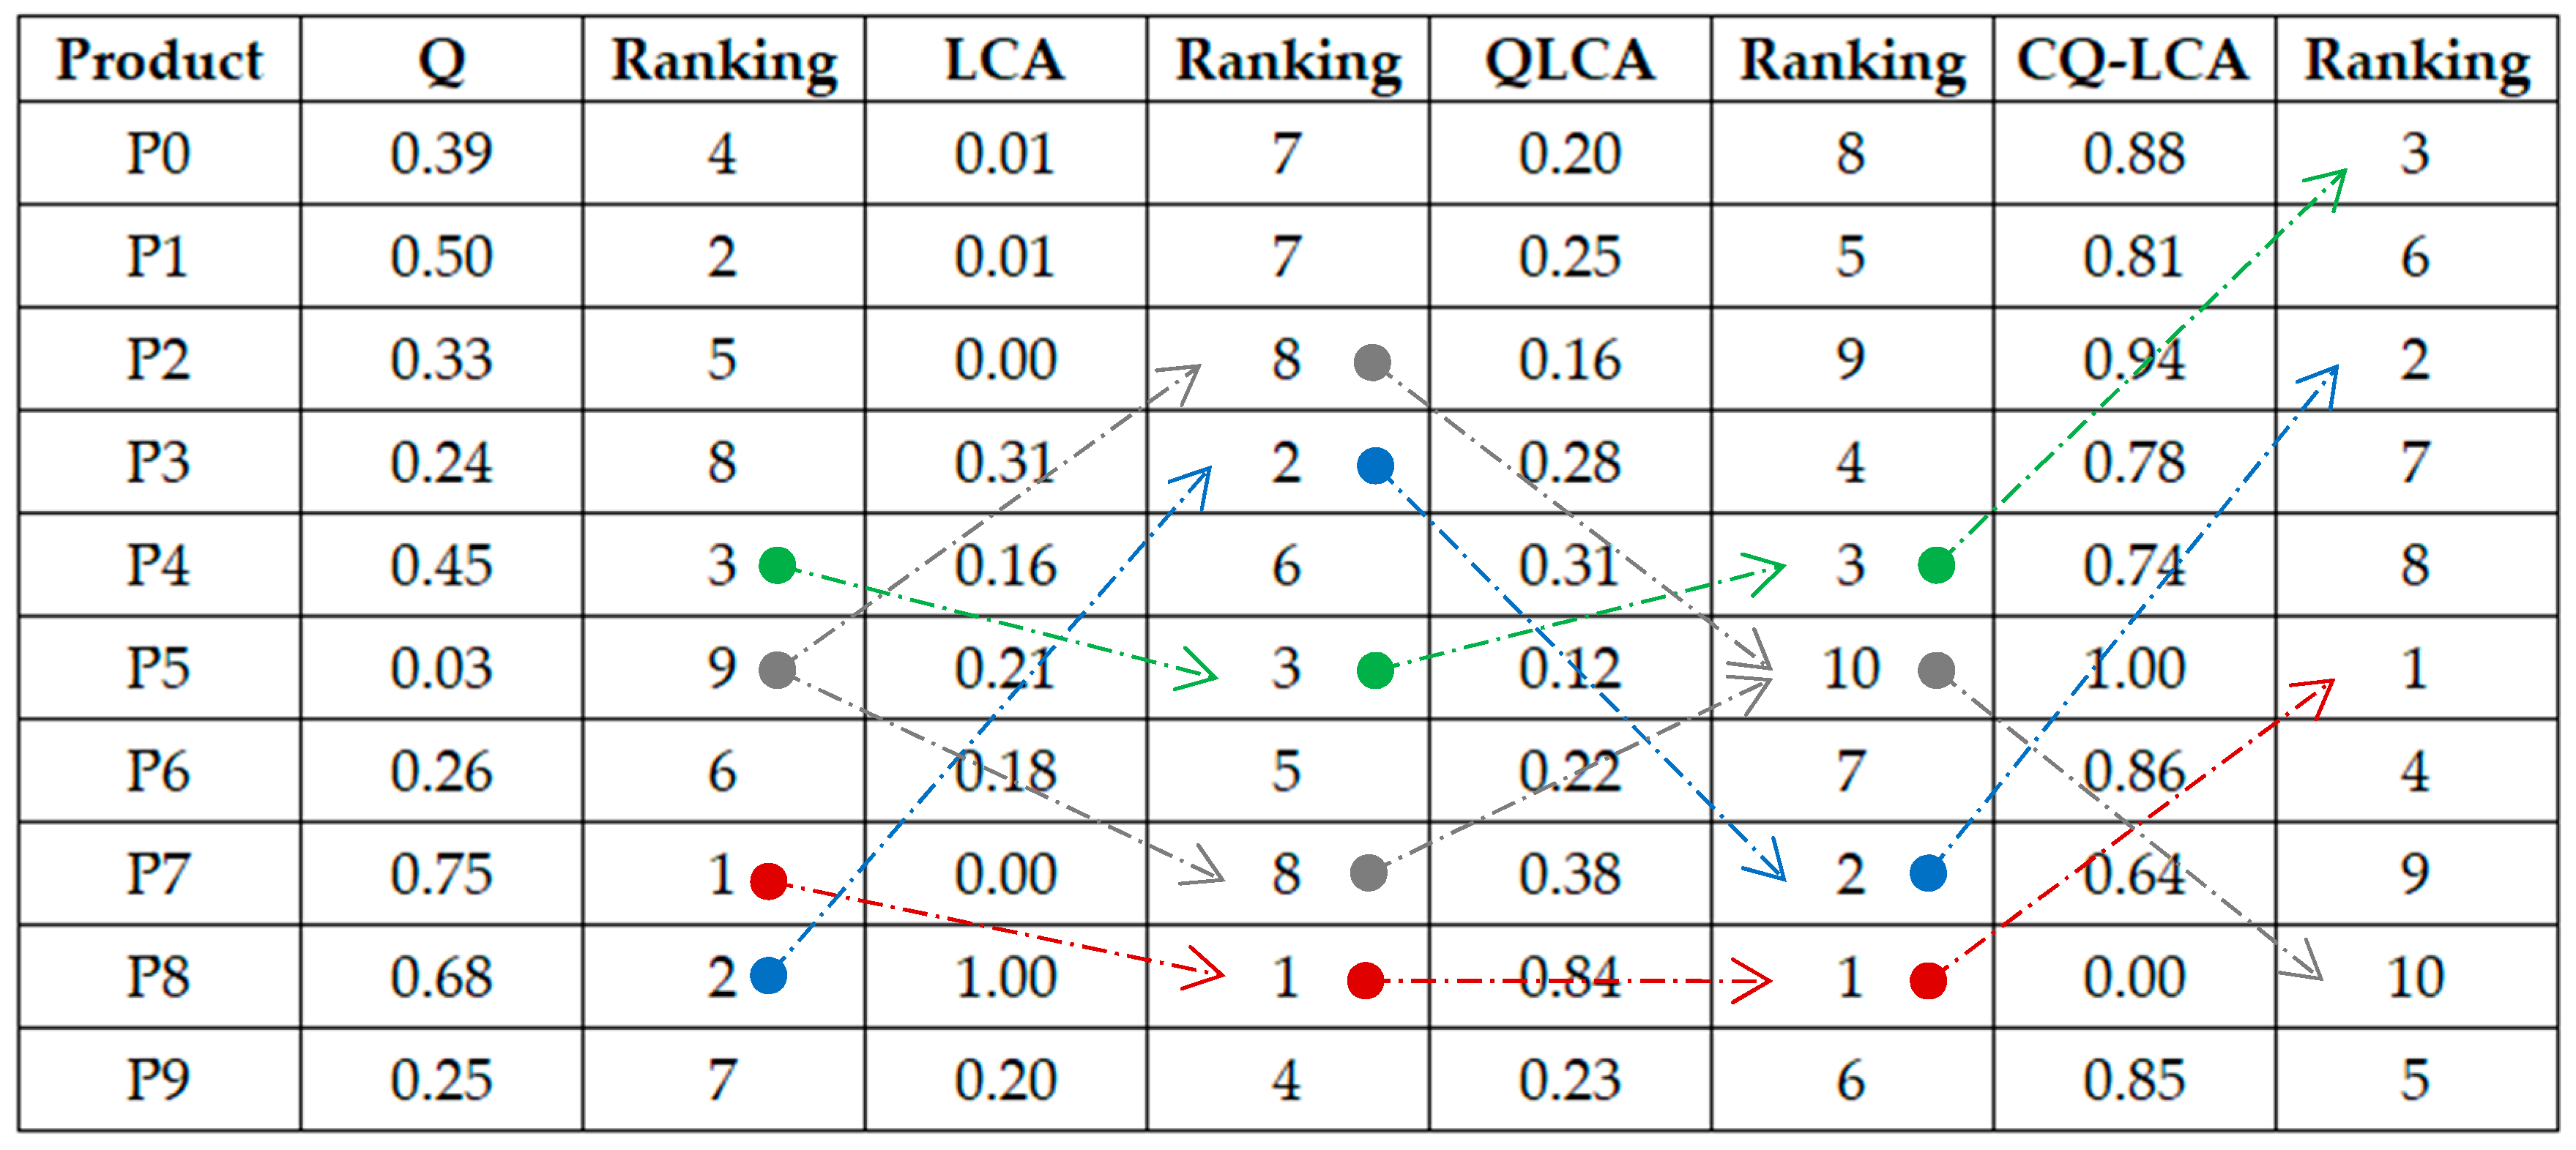
To supplement the research, the main results of the model were subjected to a morphological analysis, as shown in Figure 8.
Based on morphological analysis, it was shown that considering the positioning of prototypes in the rankings, e.g., for position 1, P7 (Q), P8 (LCA), P8 (QLCA), and P5 (CQ-LCA) are observed, respectively. In the case of position 2, P8 (Q), P3 (LCA), P7 (QLCA), and P2 (CQ-LCA) are observed, respectively. Therefore, it is concluded that the model is sensitive to changes in indicators and their aggregation, which can be observed through changes in the prototypes in the rankings. Another example is the prototype analysis, where the P7 is assumed to be the first in the ranking in the case of the qualitative aspect. This prototype took the eighth position in terms of the impact on the environment in the life cycle. In turn, by aggregating quality aspects with the environment, it reached the second position in the ranking. It was shown that in this analysis, the share of the qualitative indicator exceeded the environmental indicator. However, considering the prospective cost of the prototypes taking into account the quality–environmental indicator, it was observed that the P7 prototype finally achieved the ninth (penultimate) position in the ranking. This may be due to the fact that the higher the quality, the higher the cost.

4. Discussion

Supporting the conceptualisation and prototyping of products is an essential activity for developing companies [83]. More and more often, it is required to consider in detail not only the possibilities of improving the usability of the product but also the impact on the environment in the life cycle. In addition, it is important for the company to consider what costs the offered product generates as well as what costs the customer will have to bear when purchasing it. The three indicated aspects should be considered in an integrated manner, which is in line with the idea of their sustainable development. In this approach, techniques are sought to support the process of creating new products or improving existing ones. Therefore, the aim of the research was to develop a CQ-LCA model supporting the creation of alternative product solutions and their assessment in terms of: (i) the impact on the LCA environment, (ii) quality, and (iii) production and/or purchase costs. The model was developed in seven main stages and then tested for electric motorcycles.
The proposed approach is a new solution compared to other works, where the subject of the research is an electric motorcycle. For example, the authors of the article [84] compared the results of the life cycle assessment of popular combustion motorcycles with electric motorcycles. They showed that the electric motorcycle achieves a lower global warming index, including shortages of fossil resources. The situation is different in the case of the eutrophication of main waters and the shortages of mineral resources, where the combustion motorcycle turned out to be more beneficial in terms of the environment. In turn, in the study [1] the impact on the environment, the demand for primary energy, and the costs of owning an electric motorcycle in the life cycle were analysed. They showed, among other things, that the greatest demand for primary energy occurs in the use phase, while this phase is characterised by lower operating and maintenance costs. Another example is [85], which compared motorcycles and minibuses in terms of their impact on the environment in the life cycle or costs in the life cycle. It has been shown, among other things, that vehicles with a smaller capacity in the informal transport system are characterised by better environmental efficiency. Similarly, in the case of the cost of living, where it was shown that motorcycles are more profitable. Similar analyses were conducted, for example, by [86], in which they compared motorcycles with passenger cars, also in the case of combustion and electric engines. Another example is the article in which life cycle assessment and life cycle cost assessment were modelled in the form of hybrid modelling. The tests were carried out for electric motorcycles and gasoline-powered motorcycles. Similarly to the previously indicated authors, the largest amount of energy in the life cycle was consumed at the stage of use. Other examples of analyses of this type are presented, for example, in [87,88].
In the context of modelling taking into account selected aspects (quality, environment, and costs), it was observed that the proposed CQ-LCA model stands out from other decision models. Compared to the model offered in [11], we extend the approach to product design and improvement based on LCA and cost analysis [12] by creating alternative design solutions additionally taking into account the quality aspect. Similarly, in the research presented in [13], only the costs of materials were considered, integrating them with LCA. In CQ-LCA, it is a comprehensive analysis of the costs not only of materials but also of final products, where these costs are combined with the quality of these products and their impact on the environment. In turn, considering the integrated aspects of CQ-LCA in relation to the proposal in [14], it is performed within the framework of QFD, which is modified for the needs of analysing customer expectations and environmental impact. However, this study does not provide a prediction of different prototypes while taking into account the actual cost of the product, its impact on the environment in the life cycle and product quality. Other examples of studies are, e.g., [15,16,17], which are based on LCA, LCC methods or extensive cost analyses. However, they do not provide coherent models that aggregate quality, cost and environmental aspects in a simple methodology adapted to the search for alternative product solutions. In contrast, the developed CQ-LCA model fills this gap and fits into the scope of research carried out by other authors.
Furthermore, when considering the efficiency of the model, it was compared to the traditional conceptualisation and prototyping, as shown in Table 11.
Therefore, the main benefits of adopting the QC-LCA model to the process of conceptualisation and prototyping of products include the following:
  • The ability to create product prototypes in a hypothetical (model) manner, which helps reduce resource waste by focussing only on the most beneficial product solutions;
  • Supporting the process of assessing quality aspects (satisfaction with use), environmental aspects (LCA), and cost aspects (production and/or purchase) of the current product and its prototypes;
  • Improving the method for predicting various design solutions by modelling data according to the principles of sustainable product development;
  • Supporting the decision-making process (e.g., designers) through quantitative indicators regarding quality, environmental, and cost aspects, enabling the creation of prototype rankings and the selection of the most beneficial one;
  • Providing multi-aspect and multi-criteria analysis, the results of which can be used to select the most beneficial prototype in relation to selected aspects, while also taking into account all of them (quality, environment, and costs).
However, some limitations of the QC-LCA model include the limitation of the hypothetical creation of prototypes, the sample forms of which are not produced. This means that the production stage of selected prototypes is not considered in this model, which does not concern its further improvement. Additionally, a limitation is the need to engage an interdisciplinary team of experts who will have knowledge of the analysed product, as well as the aspects under consideration. This team should have basic skills that allow for reliable use of the QC-LCA model in practice, e.g., knowledge of product LCA, or the method of modelling data in accordance with the mathematical models offered. Access to current data necessary for modelling the level of quality and also the environmental impact in the life cycle, or the relationship between these data and the costs of prototypes may prove to be a problem.
Therefore, future research will involve conducting further tests of the model on other products. It is planned to generalise the model assumptions, including testing other combinations of techniques supporting it. It seems important to build a database dedicated to quality, environmental, and cost analyses, which will be useful for specific products. In addition, it is important to take into account other aspects of sustainable development, such as society.

5. Conclusions

The aim of the research was to develop a CQ-LCA model supporting the creation of alternative product solutions and their assessment in terms of the following: (i) impact on the LCA environment, (ii) quality, and (iii) production and/or purchase costs. The model was developed in seven main stages, i.e., (1) product selection, (2) selection of a team of experts, (3) product characteristics and development of its prototypes, (4) prospective assessment of the quality of the product and its prototypes, (5) prospective assessment of the life cycle of the product and its prototypes, (6) aggregation of indicators, and (7) prospective assessment of the purchase costs of prototypes.
Using the example of electric motorcycles, it was shown that the offered model can be used in the early stages of product development (conceptualisation and prototyping). Ten prototypes were developed that were characterised by eleven quality criteria. These criteria were maximum engine power, maximum speed, battery capacity, maximum range, battery voltage, charging time, permissible load, length, width, height, and colour. The prototypes were evaluated using the EDAS method. The seventh prototype was the most advantageous in terms of quality. Then, an assessment of the environmental impact of electric motorcycles in their life cycle was carried out. The LCA method according to ISO 14040 was used for this purpose. At that time, the eighth prototype turned out to be the most advantageous. Then, the results of the qualitative and environmental assessment (QLCA) were aggregated, which were linked to the estimated cost in structural modelling with the method of least normal squares. At that time, taking into account the aspects of quality, environment, and costs at the same time, the fifth prototype turned out to be the most advantageous. Finally, it is suggested that this prototype determine the direction of improvement activities for the analysed electric motorcycle.
The proposed model can be used to search for advantageous solutions for any products that fall within the scope of the model’s applicability. The model can contribute to supporting expert decisions at the conceptualisation and prototyping stages, where the prototype with the highest level of quality, the lowest negative impact on the environment, and the cost of production and/or purchase will be selected. This fits the current challenges of sustainable product development.

Author Contributions

Conceptualisation, D.S. and A.P.; methodology, D.S. and A.P.; software, D.S. and A.P.; validation, D.S. and A.P.; formal analysis, D.S. and A.P.; investigation, D.S. and A.P.; resources, D.S. and A.P.; data curation, D.S. and A.P.; writing—original draft preparation, D.S. and A.P.; writing—review and editing, D.S. and A.P.; visualisation, D.S. and A.P.; supervision, D.S. and A.P.; project administration, D.S. and A.P.; funding acquisition, D.S. and A.P. All authors have read and agreed to the published version of the manuscript.

Funding

This research received no external funding.

Data Availability Statement

Dataset available upon request from the authors.

Conflicts of Interest

The authors declare no conflicts of interest.

References

  1. La Fleur, L.; Lindkvist, E.; Trångteg, R.; Winter, S.; Thollander, P. Riding the Future: Environmental, Primary Energy and Economic Analysis of an Electric Motorcycle—A Kenyan Case Study. Energy Sustain. Dev. 2024, 83, 101573. [Google Scholar] [CrossRef]
  2. Petrauskienė, K.; Galinis, A.; Kliaugaitė, D.; Dvarionienė, J. Comparative Environmental Life Cycle and Cost Assessment of Electric, Hybrid, and Conventional Vehicles in Lithuania. Sustainability 2021, 13, 957. [Google Scholar] [CrossRef]
  3. Rapa, M.; Gobbi, L.; Ruggieri, R. Environmental and Economic Sustainability of Electric Vehicles: Life Cycle Assessment and Life Cycle Costing Evaluation of Electricity Sources. Energies 2020, 13, 6292. [Google Scholar] [CrossRef]
  4. He, L.-Y.; Chen, Y. Thou Shalt Drive Electric and Hybrid Vehicles: Scenario Analysis on Energy Saving and Emission Mitigation for Road Transportation Sector in China. Transp. Policy 2013, 25, 30–40. [Google Scholar] [CrossRef]
  5. Fernández-Dacosta, C.; Shen, L.; Schakel, W.; Ramirez, A.; Kramer, G.J. Potential and Challenges of Low-Carbon Energy Options: Comparative Assessment of Alternative Fuels for the Transport Sector. Appl. Energy 2019, 236, 590–606. [Google Scholar] [CrossRef]
  6. Thomitzek, M.; von Drachenfels, N.; Cerdas, F.; Herrmann, C.; Thiede, S. Simulation-Based Assessment of the Energy Demand in Battery Cell Manufacturing. Procedia CIRP 2019, 80, 126–131. [Google Scholar] [CrossRef]
  7. Siwiec, D.; Dwornicka, R.; Pacana, A. Improving the Process of Achieving Required Microstructure and Mechanical Properties of 38mnvs6 Steel. In Proceedings of the METAL 2020—29th International Conference on Metallurgy and Materials, Brno, Czech Republic, 20–22 May 2020. [Google Scholar] [CrossRef]
  8. Desreveaux, A.; Bouscayrol, A.; Trigui, R.; Hittinger, E.; Castex, E.; Sirbu, G.M. Accurate Energy Consumption for Comparison of Climate Change Impact of Thermal and Electric Vehicles. Energy 2023, 268, 126637. [Google Scholar] [CrossRef]
  9. Vandepaer, L.; Panos, E.; Bauer, C.; Amor, B. Energy System Pathways with Low Environmental Impacts and Limited Costs: Minimizing Climate Change Impacts Produces Environmental Cobenefits and Challenges in Toxicity and Metal Depletion Categories. Environ. Sci. Technol. 2020, 54, 5081–5092. [Google Scholar] [CrossRef]
  10. Haase, M.; Wulf, C.; Baumann, M.; Ersoy, H.; Koj, J.C.; Harzendorf, F.; Mesa Estrada, L.S. Multi-Criteria Decision Analysis for Prospective Sustainability Assessment of Alternative Technologies and Fuels for Individual Motorized Transport. Clean. Technol. Environ. Policy 2022, 24, 3171–3197. [Google Scholar] [CrossRef]
  11. Norris, G.A. Integrating Life Cycle Cost Analysis and LCA. Int. J. Life Cycle Assess. 2001, 6, 118–120. [Google Scholar] [CrossRef]
  12. Shapiro, K.G. Incorporating Costs in LCA. Int. J. Life Cycle Assess. 2001, 6, 121–123. [Google Scholar] [CrossRef]
  13. Nakano, K.; Hirao, M. Collaborative Activity with Business Partners for Improvement of Product Environmental Performance Using LCA. J. Clean. Prod. 2011, 19, 1189–1197. [Google Scholar] [CrossRef]
  14. Rathod, G.; Vinodh, S.; Madhyasta, U.R. Integration of ECQFD and LCA for Enabling Sustainable Product Design in an Electric Vehicle Manufacturing Organisation. Int. J. Sustain. Eng. 2011, 4, 202–214. [Google Scholar] [CrossRef]
  15. Klöpffer, W. Life-Cycle Based Methods for Sustainable Product Development. Int. J. Life Cycle Assess. 2003, 8, 157. [Google Scholar] [CrossRef]
  16. Bovea, M.D.; Vidal, R. Increasing Product Value by Integrating Environmental Impact, Costs and Customer Valuation. Resour. Conserv. Recycl. 2004, 41, 133–145. [Google Scholar] [CrossRef]
  17. Durairaj, S.K.; Ong, S.K.; Tan, R.B.H.; Nee, A.Y. Tool to Incorporate Environmental Costs into Life-Cycle Assessment; Gupta, S.M., Ed.; SPIE: Bellingham, WA, USA, 2001; pp. 124–134. [Google Scholar]
  18. Wang, J.; Ranscombe, C.; Eisenbart, B. Prototyping in Smart Product Design: Investigating Prototyping Tools to Support Communication in the Early Stage Smart Product Development. Int. J. Des. Creat. Innov. 2023, 11, 159–184. [Google Scholar] [CrossRef]
  19. Elverum, C.W.; Welo, T.; Tronvoll, S. Prototyping in New Product Development: Strategy Considerations. Procedia CIRP 2016, 50, 117–122. [Google Scholar] [CrossRef]
  20. Sierra-Pérez, J.; Vallés, M.A.; López-Forniés, I. Conceptualization in the Circular Economy: Analysing the Influence of Thinking Profiles in Creative Groups. J. Clean. Prod. 2021, 316, 128287. [Google Scholar] [CrossRef]
  21. Taylor, M.; Taylor, A. The Technology Life Cycle: Conceptualization and Managerial Implications. Int. J. Prod. Econ. 2012, 140, 541–553. [Google Scholar] [CrossRef]
  22. Garvin, D.A. What Does “product Quality” Really Mean? Sloan Manag. Rev. 1984, 25, 25–43. [Google Scholar]
  23. Kolman, R. Quality Engineering; PWE: Warsaw, Poland, 1992. (In Polish) [Google Scholar]
  24. Siwiec, D.; Gajdzik, B.; Gawlik, R.; Wolniak, R.; Pacana, A. Open Eco-Innovations in Sustainable Product Development: Model Framework of Design Thinking in Quality Life Cycle Assessment (DT-QLCA). J. Open Innov. Technol. Mark. Complex. 2025, 11, 100480. [Google Scholar] [CrossRef]
  25. Gajdzik, B.; Siwiec, D.; Wolniak, R.; Pacana, A. Approaching Open Innovation in Customization Frameworks for Product Prototypes with Emphasis on Quality and Life Cycle Assessment (QLCA). J. Open Innov. Technol. Mark. Complex. 2024, 10, 100268. [Google Scholar] [CrossRef]
  26. Cox, B.L.; Mutel, C.L. The Environmental and Cost Performance of Current and Future Motorcycles. Appl. Energy 2018, 212, 1013–1024. [Google Scholar] [CrossRef]
  27. Chwastyk, P.; Kołosowski, M. Estimating the Cost of the New Product in Development Process. Procedia Eng. 2014, 69, 351–360. [Google Scholar] [CrossRef]
  28. Zindani, D.; Maity, S.R.; Bhowmik, S. Fuzzy-EDAS (Evaluation Based on Distance from Average Solution) for Material Selection Problems. In Advances in Computational Methods in Manufacturing; Springer: Singapore, 2019; pp. 755–771. [Google Scholar]
  29. Karuppiah, K.; Sankaranarayanan, B.; Ali, S.M. Evaluating the Challenges to Life Cycle Assessment Using Best-Worst Method and Decision-Making Trial and Evaluation Laboratory. Environ. Prog. Sustain. Energy 2023, 42, e13991. [Google Scholar] [CrossRef]
  30. Finkbeiner, M.; Inaba, A.; Tan, R.; Christiansen, K.; Klüppel, H.-J. The New International Standards for Life Cycle Assessment: ISO 14040 and ISO 14044. Int. J. Life Cycle Assess. 2006, 11, 80–85. [Google Scholar] [CrossRef]
  31. Proske, M.; Finkbeiner, M. Obsolescence in LCA–Methodological Challenges and Solution Approaches. Int. J. Life Cycle Assess. 2020, 25, 495–507. [Google Scholar] [CrossRef]
  32. Hélias, A.; Servien, R. Normalization in LCA: How to Ensure Consistency? Int. J. Life Cycle Assess. 2021, 26, 1117–1122. [Google Scholar] [CrossRef]
  33. Pacana, A.; Siwiec, D. Method of Fuzzy Analysis of Qualitative-Environmental Threat in Improving Products and Processes (Fuzzy QE-FMEA). Materials 2023, 16, 1651. [Google Scholar] [CrossRef]
  34. Kupraszewicz, W.; Zółtowski, B. Dobór Zespołu Ekspertów Do Diagnozowania Stanu Maszyn [The Selection of the Experts Team to Diagnose the Condition of the Machines]. Diagnostyka 2002, 26, 94–100. [Google Scholar]
  35. Pacana, A.; Siwiec, D. Universal Model to Support the Quality Improvement of Industrial Products. Materials 2021, 14, 7872. [Google Scholar] [CrossRef] [PubMed]
  36. SZCZĘŚNIAK, B. A Spreadsheet to Support the Suzuki ABCD Method. Sci. Pap. Silesian Univ. Technol. Organ. Manag. Ser. 2020, 2020, 205–216. [Google Scholar] [CrossRef]
  37. Garvin, D.A. Product Quality: An Important Strategic Weapon. Bus. Horiz. 1984, 27, 40–43. [Google Scholar] [CrossRef]
  38. Stylidis, K.; Wickman, C.; Söderberg, R. Perceived Quality of Products: A Framework and Attributes Ranking Method. J. Eng. Des. 2020, 31, 37–67. [Google Scholar] [CrossRef]
  39. Mu, E.; Pereyra-Rojas, M. Practical Decision Making, 1st ed.; Springer International Publishing: Cham, Switzerland, 2017; Volume 1, ISBN 978-3-319-33860-6. [Google Scholar]
  40. Ulewicz, R.; Siwiec, D.; Pacana, A. Sustainable Vehicle Design Considering Quality Level and Life Cycle Environmental Assessment (LCA). Energies 2023, 16, 8122. [Google Scholar] [CrossRef]
  41. Abdel-Basset, M.; Gamal, A.; Elhoseny, M.; Hossain, M.A. Assessing the Sustainable Aspects of Location Selection for Offshore Wind Power Plant. In Multi-Criteria Decision-Making for Renewable Energy; Elsevier: Amsterdam, The Netherlands, 2024; pp. 87–109. [Google Scholar]
  42. Zhang, S.; Gao, H.; Wei, G.; Wei, Y.; Wei, C. Evaluation Based on Distance from Average Solution Method for Multiple Criteria Group Decision Making under Picture 2-Tuple Linguistic Environment. Mathematics 2019, 7, 243. [Google Scholar] [CrossRef]
  43. Pacana, A.; Siwiec, D. Analysis of the Possibility of Used of the Quality Management Techniques with Non-Destructive Testing. Teh. Vjesn.—Tech. Gaz. 2021, 28, 45–51. [Google Scholar] [CrossRef]
  44. Keshavarz Ghorabaee, M.; Zavadskas, E.K.; Olfat, L.; Turskis, Z. Multi-Criteria Inventory Classification Using a New Method of Evaluation Based on Distance from Average Solution (EDAS). Informatica 2015, 26, 435–451. [Google Scholar] [CrossRef]
  45. Del Borghi, A. LCA and Communication: Environmental Product Declaration. Int. J. Life Cycle Assess. 2013, 18, 293–295. [Google Scholar] [CrossRef]
  46. Gasia, J.; Fabiani, C.; Chàfer, M.; Pisello, A.L.; Manni, A.; Ascani, M.; Cabeza, L.F. Life Cycle Assessment and Life Cycle Costing of an Innovative Component for Refrigeration Units. J. Clean. Prod. 2021, 295, 126442. [Google Scholar] [CrossRef]
  47. Arzoumanidis, I.; D’Eusanio, M.; Raggi, A.; Petti, L. Functional Unit Definition Criteria in Life Cycle Assessment and Social Life Cycle Assessment: A Discussion. In Perspectives on Social LCA; Springer: Cham, Switzerland, 2020; pp. 1–10. [Google Scholar]
  48. Chaplin-Kramer, R.; Sim, S.; Hamel, P.; Bryant, B.; Noe, R.; Mueller, C.; Rigarlsford, G.; Kulak, M.; Kowal, V.; Sharp, R.; et al. Life Cycle Assessment Needs Predictive Spatial Modelling for Biodiversity and Ecosystem Services. Nat. Commun. 2017, 8, 15065. [Google Scholar] [CrossRef] [PubMed]
  49. Ekvall, T.; Gottfridsson, M.; Nellström, M.; Nilsson, J.; Rydberg, M.; Rydberg, T. Modelling Incineration for More Accurate Comparisons to Recycling in PEF and LCA. Waste Manag. 2021, 136, 153–161. [Google Scholar] [CrossRef] [PubMed]
  50. Arvesen, A.; Luderer, G.; Pehl, M.; Bodirsky, B.L.; Hertwich, E.G. Deriving Life Cycle Assessment Coefficients for Application in Integrated Assessment Modelling. Environ. Model. Softw. 2018, 99, 111–125. [Google Scholar] [CrossRef]
  51. Caro, D. Carbon Footprint. In Encyclopedia of Ecology; Elsevier: Amsterdam, The Netherlands, 2019; pp. 252–257. [Google Scholar]
  52. Siwiec, D.; Pacana, A.; Gazda, A. A New QFD-CE Method for Considering the Concept of Sustainable Development and Circular Economy. Energies 2023, 16, 2474. [Google Scholar] [CrossRef]
  53. Vafaei, N.; Ribeiro, R.A.; Camarinha-Matos, L.M. Assessing Normalization Techniques for Simple Additive Weighting Method. Procedia Comput. Sci. 2022, 199, 1229–1236. [Google Scholar] [CrossRef]
  54. Pacana, A.; Siwiec, D.; Bednárová, L.; Petrovský, J. Improving the Process of Product Design in a Phase of Life Cycle Assessment (LCA). Processes 2023, 11, 2579. [Google Scholar] [CrossRef]
  55. Carranza, G.; Do Nascimiento, M.; Fanals, J.; Febrer, J.; Valderrama, C. Life Cycle Assessment and Economic Analysis of the Electric Motorcycle in the City of Barcelona and the Impact on Air Pollution. Sci. Total Environ. 2022, 821, 153419. [Google Scholar] [CrossRef]
  56. Łebkowski, A. Badania Eksploatacyjne Elektrycznego Układu Napędowego Motocykla. Napędy I Sterow. 2017, 5, 70–76. [Google Scholar]
  57. Raman, R.; Basavaraj, Y. Quality Improvement of Capacitors Through Fishbone and Pareto Techniques. Int. J. Recent Technol. Eng. 2019, 8, 2248–2252. [Google Scholar] [CrossRef]
  58. Englert, S. Life Cycle Assessment of Lightweight Electric Motorbikes. Available online: https://kth.diva-portal.org/smash/get/diva2:1813902/fulltext01.pdf (accessed on 31 May 2025).
  59. Tang, B.; Xu, Y.; Wang, M. Life Cycle Assessment of Battery Electric and Internal Combustion Engine Vehicles Considering the Impact of Electricity Generation Mix: A Case Study in China. Atmosphere 2022, 13, 252. [Google Scholar] [CrossRef]
  60. Wong, E.Y.C.; Ho, D.C.K.; So, S.; Tsang, C.-W.; Chan, E.M.H. Life Cycle Assessment of Electric Vehicles and Hydrogen Fuel Cell Vehicles Using the GREET Model—A Comparative Study. Sustainability 2021, 13, 4872. [Google Scholar] [CrossRef]
  61. Yang, L.; Yu, B.; Yang, B.; Chen, H.; Malima, G.; Wei, Y.-M. Life Cycle Environmental Assessment of Electric and Internal Combustion Engine Vehicles in China. J. Clean. Prod. 2021, 285, 124899. [Google Scholar] [CrossRef]
  62. Bauer, C.; Hofer, J.; Althaus, H.-J.; Del Duce, A.; Simons, A. The Environmental Performance of Current and Future Passenger Vehicles: Life Cycle Assessment Based on a Novel Scenario Analysis Framework. Appl. Energy 2015, 157, 871–883. [Google Scholar] [CrossRef]
  63. Mrozik, M.; Merkisz-Guranowska, A. Environmental Assessment of the Vehicle Operation Process. Energies 2020, 14, 76. [Google Scholar] [CrossRef]
  64. Sævarsdottir, G.; Kvande, H.; Magnusson, T. Greenhouse Gas Emissions from Silicon Production -Development of Carbon Footprint with Changing Energy Systems. In Proceedings of the 16th International Ferro-Alloys Congress (INFACON XVI) 2021, Virtual, 27–29 September 2021. [Google Scholar] [CrossRef]
  65. Zhang, X.; Gerada, D.; Xu, Z.; Zhang, F.; Gerada, C. A Review of Carbon Emissions from Electrical Machine Materials. Electronics 2024, 13, 1714. [Google Scholar] [CrossRef]
  66. Yan, Y.; Wang, C.; Ding, D.; Zhang, Y.; Wu, G.; Wang, L.; Liu, X.; Du, C.; Zhang, Y.; Zhao, C. Industrial Carbon Footprint of Several Typical Chinese Textile Fabrics. Acta Ecol. Sin. 2016, 36, 119–125. [Google Scholar] [CrossRef]
  67. Pacana, A.; Siwiec, D.; Bednarova, L.; Sofranko, M.; Vegsoova, O.; Cvoliga, M. Influence of Natural Aggregate Crushing Process on Crushing Strength Index. Sustainability 2021, 13, 8353. [Google Scholar] [CrossRef]
  68. Chen, W.; Zuo, W. Component Sensitivity Analysis of Conceptual Vehicle Body for Lightweight Design under Static and Dynamic Stiffness Demands. Int. J. Veh. Des. 2014, 66, 107. [Google Scholar] [CrossRef]
  69. Tang, G.; Zhang, M.; Bu, F. Vehicle Environmental Efficiency Evaluation in Different Regions in China: A Combination of the Life Cycle Analysis (LCA) and Two-Stage Data Envelopment Analysis (DEA) Methods. Sustainability 2023, 15, 11984. [Google Scholar] [CrossRef]
  70. Smit, R.; Kennedy, D.W. Greenhouse Gas Emissions Performance of Electric and Fossil-Fueled Passenger Vehicles with Uncertainty Estimates Using a Probabilistic Life-Cycle Assessment. Sustainability 2022, 14, 3444. [Google Scholar] [CrossRef]
  71. Sullivan, J.; Burnham, A.; Wang, M. Energy-Consumption and Carbon-Emission Analysis of Vehicle and Component Manufacturing; Argonne National Lab (ANL): Argonne, IL, USA, 2010. [Google Scholar]
  72. Mera, Z.; Pastaz, M.; Camuendo, O.; Rosero, R.; Tapia, F.; Rosero, F.; Arellano, O. Life-Cycle Assessment of the Batteries Used in Electric Motorcycles in Ecuador. In Proceedings of the 2021 Congreso Colombiano y Conferencia Internacional de Calidad de Aire y Salud Pública (CASAP), Bogota, Colombia, 3–5 November 2021; IEEE: Piscataway, NJ, USA, 2021; pp. 1–4. [Google Scholar]
  73. Hu, X.-H.; Yu, L.; Chen, Z.; Yu, B.; Ma, C.-H.; Hou, Y.-S.; Hu, Y.-G.; Zhao, P.-L.; Zheng, J.-F.; Zhao, X.-C.; et al. A Novel Causative Factor of Injury: Severe Burns Related to Fires and Explosions of Lithium-Ion Batteries of Electric Motorcycles. Injury 2024, 55, 111724. [Google Scholar] [CrossRef] [PubMed]
  74. Goussian, A.; LeBel, F.-A.; Trovão, J.P.; Boulon, L. Passive Hybrid Energy Storage System Based on Lithium-Ion Capacitor for an Electric Motorcycle. J. Energy Storage 2019, 25, 100884. [Google Scholar] [CrossRef]
  75. Koroma, M.S.; Costa, D.; Philippot, M.; Cardellini, G.; Hosen, M.S.; Coosemans, T.; Messagie, M. Life Cycle Assessment of Battery Electric Vehicles: Implications of Future Electricity Mix and Different Battery End-of-Life Management. Sci. Total Environ. 2022, 831, 154859. [Google Scholar] [CrossRef] [PubMed]
  76. Siwiec, D.; Pacana, A. Predicting Design Solutions with Scenarios Considering the Quality of Materials and Products Based on a Life Cycle Assessment (LCA). Materials 2024, 17, 951. [Google Scholar] [CrossRef]
  77. Nitta, N.; Wu, F.; Lee, J.T.; Yushin, G. Li-Ion Battery Materials: Present and Future. Mater. Today 2015, 18, 252–264. [Google Scholar] [CrossRef]
  78. Harper, G.; Sommerville, R.; Kendrick, E.; Driscoll, L.; Slater, P.; Stolkin, R.; Walton, A.; Christensen, P.; Heidrich, O.; Lambert, S.; et al. Recycling Lithium-Ion Batteries from Electric Vehicles. Nature 2019, 575, 75–86. [Google Scholar] [CrossRef]
  79. Pacini, A.; Lupi, F.; Rossi, A.; Seggiani, M.; Lanzetta, M. Direct Recycling of WC-Co Grinding Chip. Materials 2023, 16, 1347. [Google Scholar] [CrossRef]
  80. Silvestri, L.; Forcina, A.; Arcese, G.; Bella, G. Recycling Technologies of Nickel–Metal Hydride Batteries: An LCA Based Analysis. J. Clean. Prod. 2020, 273, 123083. [Google Scholar] [CrossRef]
  81. Beaudet, A.; Larouche, F.; Amouzegar, K.; Bouchard, P.; Zaghib, K. Key Challenges and Opportunities for Recycling Electric Vehicle Battery Materials. Sustainability 2020, 12, 5837. [Google Scholar] [CrossRef]
  82. Raugei, M.; Winfield, P. Prospective LCA of the Production and EoL Recycling of a Novel Type of Li-Ion Battery for Electric Vehicles. J. Clean. Prod. 2019, 213, 926–932. [Google Scholar] [CrossRef]
  83. Gajdzik, B. Frameworks of the Maturity Model for Industry 4.0 with Assessment of Maturity Levels on the Example of the Segment of Steel Enterprises in Poland. J. Open Innov. Technol. Mark. Complex. 2022, 8, 77. [Google Scholar] [CrossRef]
  84. Schneider, F.; Castillo Castro, D.S.; Weng, K.-C.; Shei, C.-H.; Lin, H.-T. Comparative Life Cycle Assessment (LCA) on Battery Electric and Combustion Engine Motorcycles in Taiwan. J. Clean. Prod. 2023, 406, 137060. [Google Scholar] [CrossRef]
  85. Kalifa, M.; Özdemir, A.; Banar, M. Life Cycle Comparison of the Environmental and Economic Performance of an Informal Low-Capacity Passenger Transport System. Transp. Res. Rec. J. Transp. Res. Board. 2024, 2678, 1–17. [Google Scholar] [CrossRef]
  86. Champeecharoensuk, T.; Saisirirat, P.; Chollacoop, N.; Vithean, K.; Thapmanee, K.; Silva, K.; Champeecharoensuk, A. Global Warming Potential and Environmental Impacts of Electric Vehicles and Batteries in Association of Southeast Asian Nations (ASEAN). Energy Sustain. Dev. 2025, 86, 101723. [Google Scholar] [CrossRef]
  87. Kosai, S.; Zakaria, S.; Che, H.S.; Hasanuzzaman, M.; Rahim, N.A.; Tan, C.; Ahmad, R.D.R.; Abbas, A.R.; Nakano, K.; Yamasue, E.; et al. Estimation of Greenhouse Gas Emissions of Petrol, Biodiesel and Battery Electric Vehicles in Malaysia Based on Life Cycle Approach. Sustainability 2022, 14, 5783. [Google Scholar] [CrossRef]
  88. Echeverría-Su, M.; Huamanraime-Maquin, E.; Cabrera, F.I.; Vázquez-Rowe, I. Transitioning to Sustainable Mobility in Lima, Peru. Are e-Scooter Sharing Initiatives Part of the Problem or the Solution? Sci. Total Environ. 2023, 866, 161130. [Google Scholar] [CrossRef]
  89. Chen, S.; Venkatesh, A. An Investigation of How Design-Oriented Organisations Implement Design Thinking. J. Mark. Manag. 2013, 29, 1680–1700. [Google Scholar] [CrossRef]
  90. Sakao, T. A QFD-Centred Design Methodology for Environmentally Conscious Product Design. Int. J. Prod. Res. 2007, 45, 4143–4162. [Google Scholar] [CrossRef]
  91. Wolniak, R. The Use of QFD Method Advantages and Limitation. Prod. Eng. Arch. 2018, 18, 14–17. [Google Scholar] [CrossRef]
  92. Hashim, A.M.; Dawal, S.Z.M. Kano Model and QFD Integration Approach for Ergonomic Design Improvement. Procedia Soc. Behav. Sci. 2012, 57, 22–32. [Google Scholar] [CrossRef]
  93. Micheli, P.; Wilner, S.J.S.; Bhatti, S.H.; Mura, M.; Beverland, M.B. Doing Design Thinking: Conceptual Review, Synthesis, and Research Agenda. J. Prod. Innov. Manag. 2019, 36, 124–148. [Google Scholar] [CrossRef]
Figure 1. The concept of prospective prototype evaluation as part of sustainable development.
Energies 18 03038 g001
Figure 2. Model of prospective assessment of life cycle, quality, and cost for product improvement: supporting prototyping and conceptualisation by employing CQ-LCA.
Energies 18 03038 g002
Figure 3. The function of the change in the prototype cost index in relation to the change in the prototype quality–environmental index. Own study based on [23].
Energies 18 03038 g003
Figure 4. Ranking of prototypes based on the Q indicator.
Energies 18 03038 g004
Figure 5. Ranking of prototypes based on the LCA indicator.
Energies 18 03038 g005
Figure 6. Ranking of prototypes based on the QLCA indicator with a comparison of the main component indicators.
Energies 18 03038 g006
Figure 7. Ranking of electric motorcycle prototypes by estimated cost.
Energies 18 03038 g007
Figure 8. Morphological analysis of the change in the prototype position relative to the modelled model indicator.
Energies 18 03038 g008
Table 1. Summary of literature review.
StudyResearch ScopeTechniques
[5,6,7,8,10]Electric Vehicle AnalysisLCA and Cost Analysis
[11]Product design and improvementLCA, Product Cost Analysis, and Economic Risk Model
[12]Product Environmental Impact AnalysisEnvironmental cost accounting, reporting, identification and analysis of environmental aspects
[13]Life Cycle Environmental Impact AnalysisLCA, and cost accounting
[14]Product development considering customer requirements, environmental impact, and costsDecision model considering QFD, LCA, and cost analysis
[16]Model that takes into account environmental, cost, and customer requirement aspects
[15]Environmental Impact and Life Cycle Cost AssessmentLCA and LCC
[17]Ecological costs and life cycle assessment
Table 2. Quality criteria of an electric motorcycle and its prototypes.
CriteriaP0P1P2P3P4P5P6P7P8P9
C13000330032002800345029502875380035002900
C245555038604039706540
C330303028352828373728
C480858578907778909080
C560626258636858646462
C63.53.53.5343.53.5443.5
C7150160155130170140135180175150
C81889189018951755190017701775189918901760
C9702703705606600650680700675690
C1010561058105910009991040103310491301020
C11greyblackwhitegreygreenrednavywhiteyellowblack
where P0—reference electric motorcycle (current); P1–P9—prototypes; C1—maximum engine power (W); C2—maximum speed (km/h); C3—battery capacity (Ah); C4—maximum range (km); C5—battery voltage (V); C6—charging time (h); C7—permissible load (kg); C8—length (m); C9—width (m); C10—height (m); C11—colour.
Table 3. Average ratings for electric motorcycle quality criteria solutions.
CriteriaC1C2C3C4C5C6C7C8C9C10C11
TypeBBBBNBNBNNB
Weight0.150.090.110.130.070.090.070.060.060.090.07
AVj3177.5050.2031.1083.3062.103.60154.501842.30671.10944.406.40
where C1–C11—as in Table 1.
Table 4. Positive and negative weighted sums of distance from the mean and their normalised counterparts.
ProductSNSPNSPNSNQ Indicator
P00.040.020.040.020.39
P10.010.040.010.040.50
P20.050.080.050.080.33
P30.070.050.070.050.24
P40.010.100.010.100.45
P50.030.070.030.070.03
P60.130.030.130.030.26
P70.170.060.170.060.75
P80.020.060.020.060.68
P90.040.040.040.040.25
Table 5. Main materials of electric motorcycles and their emission coefficient.
MaterialMass of Material (kg)CO2 Emission Factor
for Material (kg/kg)
Composite Components302.00
Aluminium278.54
Packaging191.00
Steel102.00
Rubber73.62
Plastic43.05
Electrical and Electronics34.00
Fabric0.25.34
Silicone0.25.00
Glass0.21.62
Table 6. Estimated carbon dioxide emissions from the production of selected materials of an electric motorcycle (MJ/kg).
MaterialCoalNatural GasCokeCrude OilGasolineElectricity
CO2 emission rate0.100.060.110.080.090.19
Composite Components2.130.831.210.030.000.20
Aluminium9.821.370.000.000.003.00
Packaging4.780.570.000.000.001.47
Steel0.321.610.000.030.000.10
Rubber0.041.980.000.360.010.15
Plastic0.002.160.181.770.000.08
Electrical and Electronics0.320.210.040.070.000.10
Fabric0.320.210.040.070.000.10
Silicone0.320.210.040.070.000.10
Glass0.320.210.040.070.000.10
Table 7. Carbon dioxide emissions during extraction and processing of electric motorcycle materials (MJ/kg).
Material C x , f C x , e C M
Composite Components7.950.007.95
Aluminium246.160.19246.35
Packaging0.070.000.07
Steel2.060.002.06
Rubber7.760.007.76
Plastic3.320.003.32
Electrical and Electronics1.060.001.06
Fabric0.740.000.74
Silicone0.160.000.16
Glass0.150.000.15
Table 8. Estimated energy consumption and CO2 emissions from the production process of a reference vehicle such as an electric motorcycle (excluding battery).
ProcessEnergy Consumption [MJ/kg]CO2 Emission
[kg/kg]
Material transformation4039.69222.45
Machining205.1211.70
Vehicle painting870.3955.98
HVAC and ligting696.6147.00
Heating649.6140.73
Material handling144.139.61
Welding192.1712.95
Compressed air288.2519.43
Table 9. Modelled environmental impact indicator in the life cycle of electric motorcycle prototypes with respect to selected quality criteria parameters.
CriteriaP0P1P2P3P4P5P6P7P8P9
C330002−522−7−72
C63.5000.5−0.500−0.5−0.50
C81889−1−6134−11119114−10−1129
C9702−1−396102522222712
C101056−2−356571623792636
Difference−4−12288.5142.5189161−8.5944.5179
EI19,988.0019,99220,00019,699.519,845.519,79919,82719,996.519,043.519,809
LCA0.010.010.000.310.160.210.180.001.000.20
Rank78102635914
where P0—reference electric motorcycle (current); P1–P9—prototypes; C3—battery capacity (Ah); C6—charging time (h); C8—length (m); C9—width (m); C10—height (m); E—life cycle environmental impact.
Table 10. Least normal squares structural modelling results showing the projected cost of the electric motorcycle prototypes.
ProductQLCAEstimated Cost C C ¯ Q L C A Q L C A ¯ Q L C A Q L C A ¯ 2 Predicted
Cost
Ranking
P00.395250−434.90−0.100.016352.453
P10.5070501365.10−0.050.006517.966
P20.334500−1184.90−0.130.026225.422
P30.2471001415.10−0.020.006597.437
P40.455850165.100.010.006697.068
P50.033999−1685.90−0.180.036074.301
P60.264300−1384.90−0.080.016404.444
P70.7579002215.100.080.016924.939
P80.686500815.100.540.298455.0610
P90.254400−1284.90−0.070.016426.655
Table 11. Comparison of the main phases of conceptualisation and prototyping process of the traditional approach and with the QC-LCA model.
The Main Phase
of Process
Conceptualisation and Prototyping Process
TraditionalSupporting by QC-LCA
EmphatyAcquisition of customer requirements, market research, existing documentation, and analysis of the product quality improvement process.Acquisition of customer requirements, market research, previous documentation, and analysis of the product improvement process, as well as cost analyses and pro-environmental analyses regarding minimising negative impact on the environment.
DefineThe aim is to determine the direction of product development mainly within the framework of meeting customer satisfaction. This is performed over the course of previous product changes, market research, etc. It concerns achieving product quality that will meet customer expectations.The aim is to determine the direction of product development both within the framework of meeting customer satisfaction, but also taking into account the environmental aspect, i.e., the impact on the environment in LCA, as well as production and/or purchase costs. This is performed over the course of previous product changes, market research, etc., but also taking into account the offered product changes in the form of modelling with environmental and cost data; this concerns achieving product quality that will meet customer expectations, while reducing the negative impact on the environment in the life cycle and achieving low production and/or purchase costs.
IdeateCreating technical drawings, visual models, etc.Creating hypothetical product solutions based on the current states of product quality criteria in the form of modified states of these criteria.
PrototypeDevelopment of physically existing or virtual prototypes.Development of virtual prototypes.
TestEvaluation of prototypes by experts and potential customers, mainly in terms of fulfilling the functionality and usability of the product.Evaluation of prototypes by experts and potential customers, as part of meeting the functionality and usability of the product, limiting the negative impact on the environment in LCA and reducing production and purchasing costs.
Source: own elaboration based on literature review [89,90,91,92,93].
Disclaimer/Publisher’s Note: The statements, opinions and data contained in all publications are solely those of the individual author(s) and contributor(s) and not of MDPI and/or the editor(s). MDPI and/or the editor(s) disclaim responsibility for any injury to people or property resulting from any ideas, methods, instructions or products referred to in the content.

