Abstract
The integration of high proportions of renewable energy into power systems to replace traditional synchronous generators has led to continuous weakening of the system inertia support and primary frequency regulation resources. Spatiotemporal dispersion of the system’s frequency response has become increasingly prominent. Historical data from numerous frequency disturbance events show that the unified system’s frequency can no longer accurately represent the variations in the frequency response at each node in the system. To address this issue, a method for frequency measurement point selection and system partitioning in a high-renewable-energy-penetration power system is proposed. Firstly, the frequency regulation influence (FRI) index is defined to quantify the comprehensive ability of nodes to dynamically regulate the spatiotemporal dynamics of the power system’s frequency, identifying key frequency regulation nodes as the regional frequency measurement points. Secondly, a hierarchical clustering method is employed to partition the remaining nodes around the frequency measurement points, and the optimal partitioning result is evaluated using modularity indicators. Finally, the effectiveness of the proposed method is verified using a modified standard 39-node system. The simulation results reveal that the proposed frequency measurement point selection and system partitioning method can effectively enhance the accuracy of regional frequency response measurements, as well as the evaluation accuracy of inertia and primary frequency regulation.
1. Introduction
The number of installed renewable energy resources, primarily interfaced through power electronics, has continuously increased, resulting in the gradual emergence of low-inertia characteristics in power systems [1,2]. Following disturbances, spatiotemporal dispersion of the system’s frequency is increasingly exhibited, leading to an increasing risk of power outages [3]. For example, on 19 September 2015, a blocking fault in the Jin-Su HVDC caused the frequency of the East China power grid to drop to 49.56 Hz [4]. The UK “8·9” blackout was triggered when the penetration of renewable energy was approximately 50%. The instantaneous power loss caused the Rate of Change of Frequency (RoCoF) to exceed the protection setting of 0.125 Hz/s. Low-frequency load shedding was initiated, resulting in a large-scale power outage [5]. On 15 February 2021, the extreme weather in Texas, USA, caused gas power units to shut down and wind turbine blades to freeze, resulting in a blackout [6]. Therefore, for power systems with a high penetration of renewable energy, local frequency fluctuations can lead to widespread frequency disturbances [7]. The power system should be partitioned into regions with high similarity in their frequency responses. Unified monitoring and control of the node frequencies within these regions should be implemented. This approach can effectively ensure frequency stability within each region, reducing the impact of frequency inconsistency across the entire grid [8]. Reasonable system partitioning can enhance the efficiency of safe and stable system operations, producing positive economic and social effects [9].
Currently, node power and frequency measurement data are mainly obtained through Phasor Measurement Units (PMUs) in the power system. PMU devices are primarily installed at key nodes in the grid. Therefore, in practice, key nodes in the grid are generally selected as frequency measurement points. In Reference [10], data from local micro PMUs are used to identify key nodes, and PMUs are deployed at these nodes. In Reference [11], the electrical characteristics of the grid are used to weight the network measurement values, and the K-shell algorithm is improved using these weighted network measurements to identify key nodes in the grid. In Reference [12], the hierarchical relationship analysis method and the coefficient of variation method are employed to comprehensively evaluate nodes in active distribution networks under different operating conditions, allowing for the effective identification of key nodes. In Reference [13], an improved LeaderRank algorithm is proposed, based on the scheduling function of the information network and the power grid flow, to identify key nodes in a power system. In Reference [14], an improved PageRank algorithm is proposed to identify key nodes in a power system by integrating network topology information and node types. The above methods have not fully considered renewable energy penetration, and high data accuracy requirements have been imposed. The role of key nodes in the system’s frequency response has not been accounted for, and the identification of key frequency regulation nodes in the system is lacking.
The frequency measurement point within a region can reflect the variation in the frequency response of that region. Accurately partitioning the power system into several regions with similar frequency responses and monitoring the variation in the frequency response of each region based on frequency measurement points can improve the efficiency of dispatching personnel. In Reference [15], the sparse array weighted K-means clustering method is proposed, and the frequency matrix is clustered and partitioned based on this method. In Reference [16], the voltage extreme similarity index is combined with the K-means clustering algorithm to partition active distribution networks into several regions, and the entropy weight method is used to identify key nodes within each region. In Reference [17], a power system partitioning method based on spectral clustering is proposed, and the optimal frequency measurement nodes in the region are used to represent regional frequency changes. In Reference [18], power system partitioning is performed based on the Affinity Propagation clustering algorithm. In Reference [19], the connection between the frequency response and network topology was established, and the power grid was regionally divided using spectral graph theory. The abovementioned method failed to closely link the regional division and the selection of the frequency measurement points. Most of the regional frequencies are based on the inertia center frequency. The inertia center is not a fixed frequency measurement point. Its calculation requires the known busbar frequency and inertia of each generator, with a large data demand, making it difficult to reduce the impact of frequency response dispersion on the system.
In summary, the existing literature on frequency measurement point selection methods lacks consideration of renewable energy penetration and is unable to accurately select the optimal frequency measurement points in high-renewable-energy-penetration power systems. Furthermore, the connection between the frequency measurement point selection and system partitioning is weak, making it difficult to accurately divide the power system into regions with high similarity in their frequency responses. Therefore, a method for frequency measurement point selection and system partitioning in high-renewable-energy-penetration power systems is proposed in this paper. The main contributions of this paper are as follows:
- (1)
- The FRI index is defined to quantify the comprehensive ability of nodes to dynamically regulate the spatiotemporal dynamics of the power system’s frequency, thereby identifying key frequency regulation nodes in the system, which are then selected as frequency measurement points.
- (2)
- The hierarchical clustering method is used to treat the frequency measurement points as regional cores, progressively merging adjacent nodes with the highest electrical proximity. The modularity indicator is calculated for different partition numbers, ultimately forming a partitioning scheme with strong electrical coupling and frequency synchronization.
2. The Frequency Measurement Point Selection Method
The Node FRI Index
The analysis of historical system data from numerous frequency disturbance events in this paper reveals that accurately calculating the influence of nodes on frequency regulation requires comprehensive consideration of both the linear impact of node power disturbances on the system frequency and the nonlinear regulation capability for node frequency oscillations. This is necessary to identify the key frequency regulation nodes in the power system.
- (1)
- The Linear Impact of Node Power Disturbances Based on a Sensitivity Analysis
The linear impact of power disturbances at each node on the system frequency can be reflected through the active power–frequency dynamic process. Under the influence of unbalanced power, the rotor motion Equation (1) can describe this process:
where ω represents the generator power angle, t represents time, Δf represents the system’s frequency deviation, E represents the system’s equivalent inertia constant, Pm represents the mechanical power, Pe represents the electromagnetic power, and D represents the damping coefficient.
With the integration of large-scale renewable energy units, a modern power system exhibits low-inertia characteristics. Considering the frequency requirements for stable system operation, virtual inertia control is required for wind turbines, photovoltaic units, and other renewable energy sources connected to the grid via power electronic devices [20]. At this point, the system’s equivalent inertia consists of three components—the rotational inertia of traditional synchronous generators, the load inertia, and the virtual inertia provided by renewable energy units—as shown in Equation (2).
where ER, EW, and ED represent the rotational inertia of traditional synchronous generators, the virtual inertia provided by renewable energy units, and the load inertia, respectively; Ei represents the equivalent inertia of the i-th generator; SNi represents the rated capacity of the i-th generator; and NG represents the number of synchronous generators.
By linearizing the dynamic system frequency equation for the renewable energy power system, the following relationship can be obtained:
where E represents the system inertia matrix, and E = diag(2Ei); D represents the system damping matrix, and D = diag(Di); ΔP represents the node power disturbance vector; and L represents the imaginary part of the system network admittance matrix.
After a period of time following a disturbance, the system’s state tends towards a steady state. At this point, the relationship between the system’s frequency deviation and power disturbance can be obtained as
When extended to the nodes in the system, the impact of node i on the system frequency after being subjected to power disturbances can be measured by defining the frequency regulation sensitivity Si of node i:
where N represents the number of nodes in the power system.
- (2)
- The Nonlinear Regulation Capability of Node Oscillation Modes Based on a Modal Analysis
Nodes in a power system may not only be affected by disturbances but may also experience oscillations. The modal analysis method can be used to quantify the nonlinear regulation capability of nodes under different oscillation modes. The state J matrix of the power system is subjected to eigenvalue decomposition, resulting in the following:
where Λ represents the eigenvalue matrix, and Λ = diag(λ1, …, λk, …, λn); O and R represent the left and right eigenvectors, and they are inverses of each other.
Each eigenvector λ corresponds to an oscillation mode. The k-th oscillation mode λk can be expressed as
where αk represents the damping size in the k-th oscillation mode, and βk represents the oscillation frequency size in the k-th oscillation mode.
For the k-th oscillation mode, the participation factor W for node i can be expressed as
Since nodes are more likely to cause sustained oscillations under weak damping modes, nodes with higher modal participation have stronger regulation capabilities for the system’s oscillation modes and can suppress system frequency oscillations. The nonlinear regulation capability of node i can be reflected by the damping-ratio-weighted analysis, and the nonlinear regulation capability Mi of node i is
Finally, considering both the linear impact of node power disturbances on the system frequency and the nonlinear regulation capability of the dominant oscillation mode, the FRIi index for node i can be defined as
The normalized FRI value is used as the evaluation standard for the importance of each node. Nodes with higher FRI values possess stronger global linear regulation capabilities and local oscillation suppression abilities. Nodes ranked higher based on their FRI values are selected as the frequency measurement points, and PMU devices are installed at these points. By monitoring the frequency response information from these frequency measurement points, the variations in the frequency response of surrounding nodes can be reflected.
3. The System Partitioning Method Based on Hierarchical Clustering
The closer the electrical connection between nodes in a power system, the higher the similarity in their frequency responses. Arbitrarily partitioning the nodes in the power system into different regions can result in significant errors. Therefore, it is necessary to match the regions of each node around the frequency measurement points and rely on the frequency response of these points to reflect the overall dynamic frequency response of the region. Compared to other clustering methods, hierarchical clustering is a method based on the similarity or distance between data objects. Hierarchical clustering can treat system frequency measurement points as partitioning cores [21], progressively merging adjacent nodes with the highest electrical proximity around the frequency measurement points, ultimately forming regions with strong electrical coupling and frequency synchronization.
Spearman’s correlation coefficient is used to define a frequency similarity index to measure the similarity in the frequency responses between nodes. This index is used as the partitioning criterion for hierarchical clustering. The frequency similarity index wij is defined as follows [17]:
where fi(n) and fj(n) represent the n-th values of the frequency response sequences of node i and node j, respectively; and represent the average values of the frequency response sequences for node i and node j; and N is the number of frequency response samples, typically taken from 0 to 2 s after the disturbance.
The specific system partitioning process is shown in Figure 1.
- (1)
- The FRI values of the nodes in the system are calculated and sorted in descending order. Nodes with higher rankings are selected as the system’s frequency measurement points and initially form their own regions.
- (2)
- The nodes directly connected to the frequency measurement points are first divided into the area to which the frequency measurement points belong.
- (3)
- We calculate the size of the frequency similarity index between the remaining nodes and the frequency measurement points, respectively, and divide the remaining nodes into the area where the frequency measurement point with the largest index is located to complete the initial partitioning.
- (4)
- The modularity index is an important criterion for measuring the quality of network partitioning. The larger the modularity index, the more reasonable the partitioning method [22]. By progressively increasing the number of frequency measurement points and recalculating the modularity K for each partitioning scheme, the optimal partitioning scheme can be determined. The modularity index K is defined as follows:
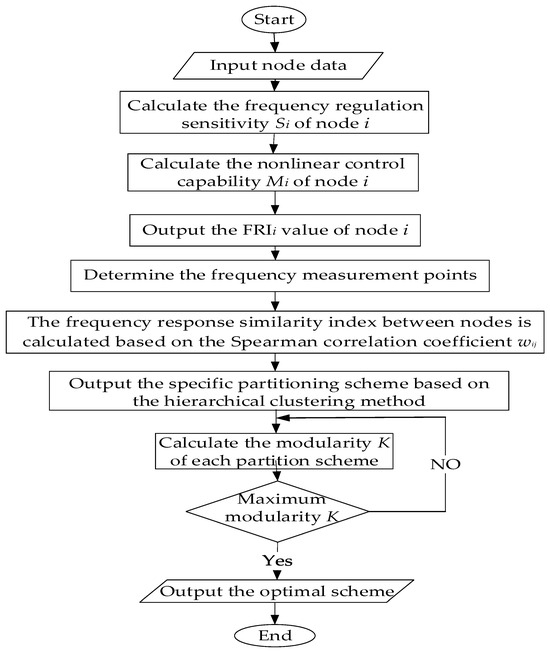
Figure 1.
The system partitioning process.
4. The Simulation Case Analysis
To verify the effectiveness of the proposed method, the PSD-BPA simulation system is used to simulate the modified IEEE 39-node system, with a diagram of the system structure shown in Figure 2. Additionally, to simulate the integration of renewable energy clusters, the G5, G6, and G9 generators in the system are replaced with 71, 91, and 116 units of Doubly Fed Induction Generators (DFAG_GE_3.6), respectively, while the G10 generator is replaced by 138 photovoltaic arrays with an output power of 1.05 MW, simulating a 34.57% rate of renewable energy penetration into the power system.
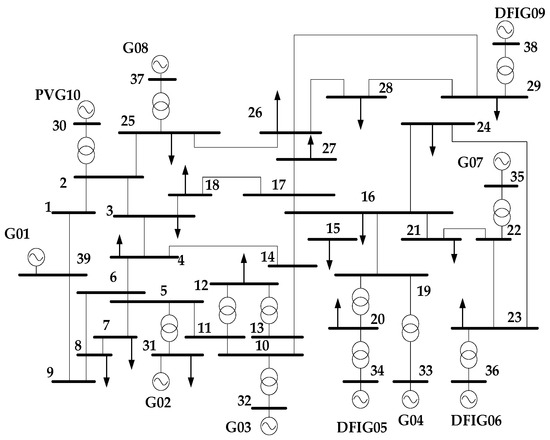
Figure 2.
The IEEE 10-machine 39-node system.
4.1. Frequency Measurement Point Selection and System Partitioning
The normalized FRI values for each node in the modified IEEE 39-node system are calculated based on Equations (1)–(11) in Section 2, as shown in Figure 3.
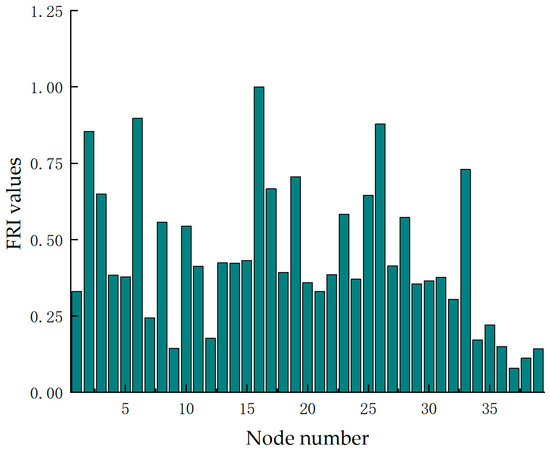
Figure 3.
FRI values for each node.
As shown in Figure 3, in the modified system, nodes 16, 6, 26, 2, 19, 33, 17, 3, 25, and 23 have FRI values higher than those of the other nodes. These nodes are sequentially selected as the frequency measurement points, and the modularity index K corresponding to different partitioning schemes is calculated for each partition number. The results are shown in Figure 4.
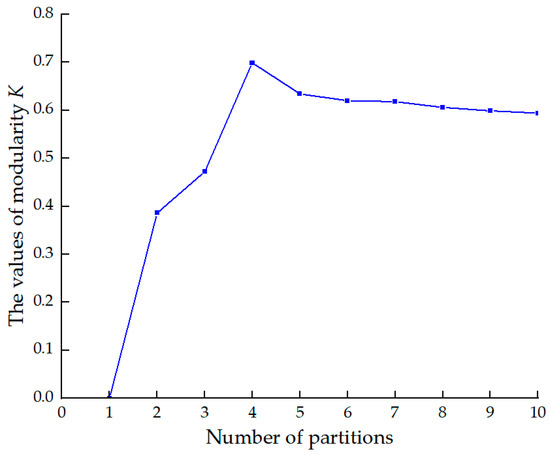
Figure 4.
The values of modularity K corresponding to different numbers of partitions.
As shown in Figure 4, when the number of system partitions is four, the electrical modularity index value reaches its maximum, which is 0.699. Therefore, the optimal number of partitions is four, and the corresponding frequency measurement points are nodes 2, 6, 16, and 26. Finally, the frequency measurement point selection and the corresponding optimal partitioning scheme proposed in this paper are shown in Figure 5 and Table 1, with the frequency measurement points highlighted by red circles in the figure.
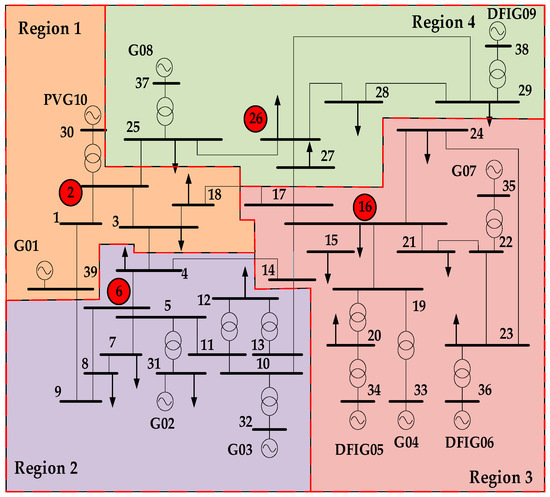
Figure 5.
The partitioning situation for the IEEE 10-machine 39-node system.

Table 1.
The partitioning situation for the IEEE 10-machine 39-node system.
4.2. The Verification Method for the Validity of the System Partitioning and Frequency Measurement Points
In studies of power systems, the frequency after disturbances and the generator output are typically used to assess the generator’s primary frequency regulation resources [23]. The assessment indicators for primary frequency regulation mainly include the generator’s primary frequency regulation energy contribution index and the generator’s rate of speed variation. These specific indicators are as follows:
- (1)
- The Primary Frequency Regulation Energy Contribution Index Q%
The primary frequency regulation energy contribution index Q% measures the generator’s participation in primary frequency regulation after a disturbance. It is calculated by dividing the actual primary frequency regulation energy contribution ΔQS by the theoretical primary frequency regulation energy contribution ΔQE. The actual primary frequency regulation energy contribution ΔQS reflects the generator’s actual output after a disturbance and is an important indicator for evaluating the generator’s primary frequency regulation capability. The calculation formula for ΔQS is given by Equation (14):
In this equation, A0 represents the start time of the primary frequency regulation, B0 represents the end time of the primary frequency regulation, P0 represents the generator’s actual average output during the frequency regulation process, and Ps(t) represents the actual output of the generator at time t during the regulation period.
To comprehensively evaluate the generator’s primary frequency regulation energy contribution, the theoretical energy contribution ΔQE is also needed to accurately assess the generator’s frequency regulation resources after a system disturbance. Considering the generator’s actual load limits, the theoretical compensation energy ΔQE is calculated using Equations (15) and (16):
where PN represents the generator’s rated active power output; δN represents the generator’s speed deviation, generally set at 5%; Δf(t) represents the system’s frequency deviation beyond the deadband; and fN represents the rated frequency.
Finally, the primary frequency regulation energy contribution index Q% is calculated as
- (2)
- The Rate of Speed Variation in Unit γ
The rate of the speed variation in unit γ reflects a unit’s response to disturbances. When the grid’s frequency changes, the load variation is inversely proportional to the rate of the change in speed of the unit. The greater the rate of the speed change, the lower the load variation assigned to the unit, and vice versa. The formula for γ is shown in Equation (18).
where Pa represents the average active power output from the start to the end point of the frequency extreme during the disturbance. Pb represents the average active power output 2 s before the frequency deviation exceeds the dead zone. fa represents the average frequency from the start to the end point of the frequency extreme during the major disturbance.
From Equations (14) and (18), it can be seen that the generator’s primary frequency regulation energy contribution index and the speed variation rate are closely related to the frequency of the frequency measurement point in the region where the generator is located. If the frequency measurement point in the region can accurately represent the changes in the frequency response of that region, calculating the generator’s primary frequency regulation energy contribution index and speed variation rate based on the frequency this that measurement point will more closely reflect the generator’s actual performance. In summary, by utilizing the generator’s primary frequency regulation energy contribution index and the speed variation rate in the region, the effectiveness of the system partitioning and frequency measurement point selection methods can be validated.
4.3. Verification of the Validity of the System Partitioning and Frequency Measurement Points
To verify that the selected frequency measurement points effectively reduce the impact of dispersions in the frequency response of the system, a disturbance analysis is performed in the modified IEEE 39-node system. The fault settings are as follows:
- (1)
- Scheme 1: A fault is set at the Bus17-Bus18 tie-line, which opens at the 100th cycle;
- (2)
- Scheme 2: The load suddenly increases by 300 MW, which opens at the 300th cycle.
The validity of the selected frequency measurement points and the system partitioning method was investigated, respectively, and compared with the literature. The results are compared with those from Reference [17].
- (1)
- Under the conditions of Scheme 1
The system parameters after the disturbance are used to calculate the speed variation rate for each generator in the respective regions, with the system frequency fsys, the frequency at the frequency measurement point fkey, the frequency of the optimal frequency measurement point from Reference [17] fopt, and the generator’s terminal frequency fGi as the reference. The results are shown in Table 2, and the errors in the speed variation rate are depicted in Figure 6.

Table 2.
Speed variation rates for generators under different frequencies as a benchmark.
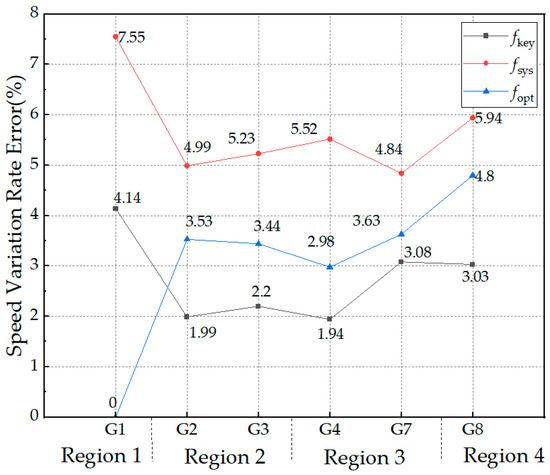
Figure 6.
Speed variation rate of generators under different frequencies as a benchmark.
From Figure 6, it can be concluded that when the system frequency is used as the reference, the average error is calculated to be 5.69%, which proves that the spatiotemporal inconsistency in the frequency responses in high-renewable-energy-penetration power systems is significant. When the frequency of the comparison frequency measurement point from the literature is used as a reference, with the exception of Region 1, where generator G1 itself is used as the frequency measurement point and no error exists, the average error for the remaining generators is 3.68%. When the frequency of the frequency measurement points selected in this paper is used as the reference, the error in the generator’s speed variation rate is only 2.75%, which proves the effectiveness of the proposed partitioning method and the selection of the optimal frequency measurement points.
The system parameters after the disturbance are used to calculate the primary frequency regulation energy contribution index for each generator in the respective regions, with the system frequency fsys, the frequency at the frequency measurement point fkey, the frequency of the optimal frequency measurement point from Reference [17] fopt, and the generator’s terminal frequency fGi as the reference. The results are shown in Table 3, and the errors in the speed variation rate are depicted in Figure 7.

Table 3.
The primary frequency regulation power contribution index under different frequencies as a benchmark.
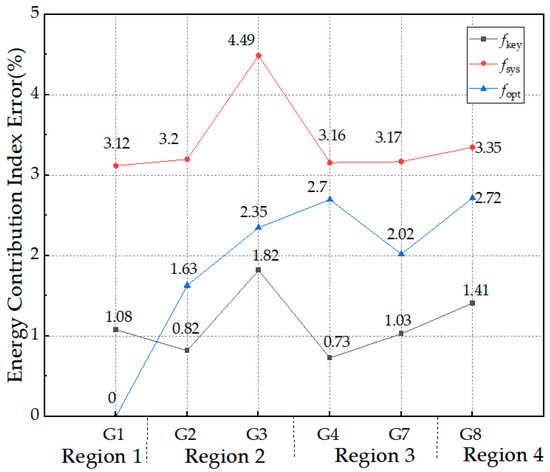
Figure 7.
Errors in the primary frequency regulation power contribution index of generators under different frequencies as a benchmark.
From Figure 7, it can be concluded that when the system frequency is used as the reference, the average error is calculated to be 3.42%. When the frequency of the comparison frequency measurement point from the literature is used as the reference, with the exception of Region 1, where generator G1 itself is used as the frequency measurement point and no error exists, the average error for the remaining generators is 2.28%. When the frequency of the frequency measurement points selected in this paper is used as the reference, the error in the generator’s speed variation rate is only 1.15%, which proves the effectiveness of the proposed partitioning method and the selection of the optimal frequency measurement points.
- (2)
- Under the conditions of Scheme 2
The system parameters after the disturbance are used to calculate the speed variation rate for each generator in the respective regions, with the system frequency fsys, the frequency at the frequency measurement point fkey, the frequency of the optimal frequency measurement point from Reference [17] fopt, and the generator’s terminal frequency fGi as the reference. The results are shown in Table 4, and the errors in the speed variation rate are depicted in Figure 8.

Table 4.
Speed variation rates for generators under different frequencies as a benchmark.
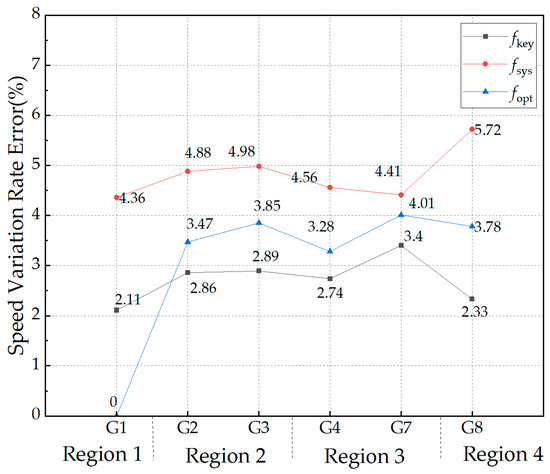
Figure 8.
Speed variation rate of generators under different frequencies as a benchmark.
From Figure 8, it can be concluded that when the system frequency is used as the reference, the average error is calculated to be 4.82%. When the comparison frequency from the literature [17] is used as the reference, the average error for the remaining generators is 3.89%. When the frequency of the frequency measurement points selected in this paper is used as the reference, the error in the generator’s speed variation rate is only 2.73%.
The system parameters after the disturbance are used to calculate the primary frequency regulation energy contribution index for each generator in the respective regions, with the system frequency fsys, the frequency at the frequency measurement point fkey, the frequency of the optimal frequency measurement point from Reference [17] fkey, and the generator’s terminal frequency fGi as the reference. The results are shown in Table 5, and the errors in the speed variation rate are depicted in Figure 9.

Table 5.
The primary frequency regulation power contribution index under different frequencies as a benchmark.
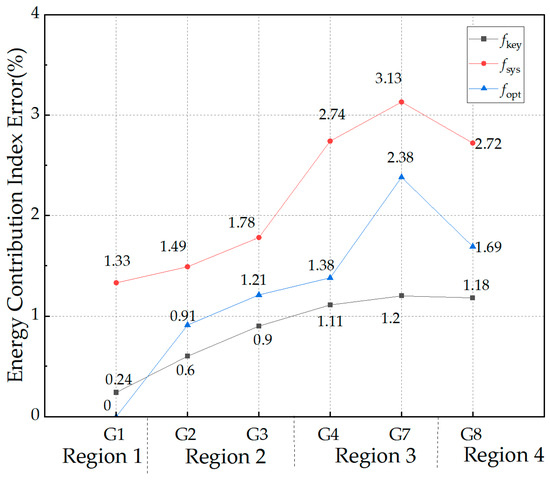
Figure 9.
Errors in the primary frequency regulation power contribution index of generators under different frequencies as a benchmark.
From Figure 9, it can be concluded that when the system frequency is used as the reference, the average error is calculated to be 2.22%. When the comparison frequency from the literature [17] is used as the reference, the average error for the remaining generators is 1.52%. When the frequency of the frequency measurement points selected in this paper is used as the reference, the error in the generator’s speed variation rate is only 0.88%. According to the above simulation results, it is seen that the frequency measurement points identified in this paper can effectively represent the regional changes in frequency in different disturbance scenarios and reduce the influence of frequency response dispersion.
4.4. Validation of the Validity of System Partitioning and Frequency Measurement Points in Extreme Scenarios
The rate of penetration of renewable energy into the power system will continue to increase. In the future, the rate of penetration of renewable energy into the power system will exceed 50%. Therefore, the accuracy of the assessment of the primary frequency regulation capacity of units in extreme scenarios is verified in this paper. The renewable energy penetration rate in Scheme 1 of Section 4.3 is increased to 51.72%, and the primary frequency regulation capacity of the units is estimated under this condition. The results for the primary frequency regulation power contribution index in each unit’s location area with the system frequency fsys, the frequency measurement point frequency fkey, and the unit port frequency fGi as a reference are shown in Table 6, and the errors in the primary frequency regulation power contribution index are shown in Figure 10.

Table 6.
The primary frequency regulation power contribution index under different frequencies as a benchmark.
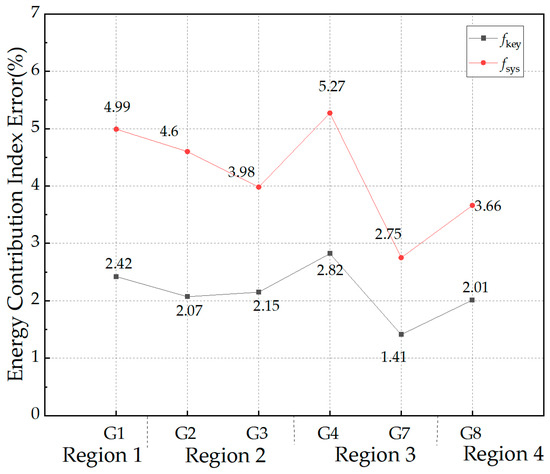
Figure 10.
Errors in the primary frequency regulation power contribution index of generators under different frequencies as a benchmark.
The rate of variation in the unit speed in the region based on different frequency conditions is shown in Table 7, and the evaluation error is shown in Figure 11.

Table 7.
The primary frequency regulation power contribution index under different frequencies as a benchmark.
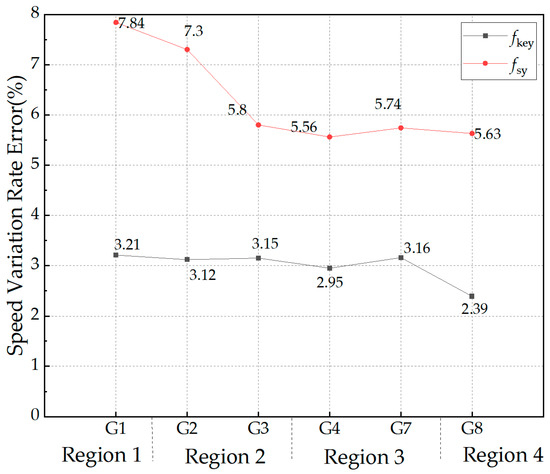
Figure 11.
Errors in the primary frequency regulation power contribution index of generators under different frequencies as a benchmark.
By comparing Figure 7 and Figure 10, as well as Figure 6 and Figure 11, respectively, it can be concluded that with an increase in the rate of penetration of renewable energy into the power system, the errors in the primary frequency regulation electricity contribution index and the velocity variation rates of the generating units increase. For a region, the primary frequency regulation capability of a unit is assessed based on the frequency of the frequency measurement point. The result is closer to the frequency regulation action of the unit itself, and the assessment result is more accurate. It can be concluded that the frequency measurement points selected in this paper also have strong accuracy and robustness in extreme scenarios.
5. Conclusions
To address the issue of spatiotemporal inconsistency in the frequency response of high-renewable-energy-penetration power systems, a method for frequency measurement point selection and system partitioning is proposed in this paper. This method has been validated for accurately selecting frequency measurement points that represent the variations in the frequency response in the region best. Based on these frequency measurement points, which can accurately reflect the changes in the frequency responses in their respective regions, the accuracy of regional frequency response measurements, as well as the accuracy of evaluating the inertia and primary frequency regulation, can be effectively improved. The main conclusions are as follows:
- (1)
- High penetration of renewable energy exacerbates the spatiotemporal inconsistency in the system’s frequency response, and the unified average frequency of the system can no longer accurately characterize the frequency response variations at each node in the system. For example, using the assessment indicators for the generator’s primary frequency regulation capability, the regional frequency calculation error can reach as high as 7.55%.
- (2)
- Using the frequency of the frequency measurement point as the reference to assess the frequency regulation capability of each generator within the region, the error in the generator’s local speed variation rate is reduced by 2.96%, and the error in the primary frequency regulation energy contribution is reduced by 2.27%. Accurate system partitioning and selection of the regional frequency measurement points can effectively reduce the impact of frequency dispersion.
The frequency measurement point selection and system partitioning method proposed in this paper can effectively reduce the impact of frequency dispersion, providing theoretical support for analyses of systems’ frequency stability in the context of large-scale renewable energy integration.
Author Contributions
Conceptualization: D.L. and Z.Y.; methodology: D.L.; software: Z.Y.; validation: D.L., Z.Y. and Y.Y.; formal analysis: B.X.; investigation: D.L. and Y.Y.; writing—original draft preparation: D.L., Y.Y., B.X. and F.Y.; writing—review and editing: D.L. and Y.Y.; supervision: Z.Y., Y.Y. and F.Y. All authors have read and agreed to the published version of the manuscript.
Funding
This research was funded by the National Natural Science Foundation of China under Grant 52377111.
Data Availability Statement
The data that support the findings of this study can be made available by the corresponding author upon reasonable request.
Conflicts of Interest
The authors declare no conflicts of interest.
References
- Zhang, W.; Wen, Y.; Chung, C.Y. Inertia Security Evaluation and Application in Low-Inertia Power Systems. IEEE Trans. Power Syst. 2025, 40, 1725–1737. [Google Scholar] [CrossRef]
- Kerdphol, T.; Rahman, F.S.; Watanabe, M.; Mitani, Y. Robust Virtual Inertia Control of a Low Inertia Microgrid Considering Frequency Measurement Effects. IEEE Access 2019, 7, 57550–57560. [Google Scholar] [CrossRef]
- You, C.; Zhao, Y.; Hou, S.; Zhang, Y.; Lv, Y. Research on Centre of Inertia Based Frequency Sampling and System Frequency Distribution Characteristics. IEEE Access 2024, 12, 8. [Google Scholar] [CrossRef]
- Li, Z.; Wu, X.; Zhuang, K.; Wang, L.; Miao, Y.; Li, B. Analysis and Reflection on Frequency Characteristics of East China Grid After Bipolar Locking of “9·19” Jinping-Sunan DC Transmission Line. Autom. Electr. Power Syst. 2017, 41, 149–155. [Google Scholar]
- Sun, H.; Xu, T.; Guo, Q.; Li, Y.; Lin, W.; Yi, J.; Li, W. Analysis on Blackout in Great Britain Power Grid on August 9th, 2019 and Its Enlightenment to Power Grid in China. Proc. CSEE 2019, 39, 6183–6191. [Google Scholar]
- Chen, N.; Qian, Z.; Nabney, I.T.; Meng, X. Wind Power Forecasts Using Gaussian Processes and Numerical Weather Prediction. IEEE Trans. Power Syst. 2014, 29, 656–665. [Google Scholar] [CrossRef]
- Palmer, M.D.; Uehara, T.; Shigenobu, R.; Matayoshi, H.; Senjyu, T.; Datta, M. Suppression of power system voltage and frequency fluctuations by decentralized controllable loads. J. Renew. Sustain. Energy 2016, 8, 417–423. [Google Scholar] [CrossRef]
- Wang, Y.; Lebovitz, L.; Zheng, K.; Zhou, Y. Consensus Clustering for Bi-objective Power Network Partition. CSEE J. Power Energy Syst. 2022, 8, 973–982. [Google Scholar]
- Yang, Y.; Sun, Y.; Wang, Q.; Liu, F.; Zhu, L. Fast Power Grid Partition for Voltage Control With Balanced-Depth-Based Community Detection Algorithm. IEEE Trans. Power Syst. 2022, 37, 1612–1622. [Google Scholar] [CrossRef]
- Kumar, D.S.; Savier, J.S.; Biju, S.S. Micro-synchrophasor based special protection scheme for distribution system automation in a smart city. Prot. Control Mod. Power Syst. 2020, 5, 1–14. [Google Scholar] [CrossRef]
- Zhang, D.; Kang, Y.; Ji, L.; Shi, R.; Jia, L. An algorithm based on improved k_shell key node identification of the power grid integrated with renewable energy. Electronics 2022, 12, 85. [Google Scholar] [CrossRef]
- Liu, Z.; Sheng, W.; Su, J.; Du, S.; Xia, Y.; Wang, J. Dynamic identification of key nodes in active distribution network for operation optimisation requirements. IET Gener. Transm. Distrib. 2023, 17, 1081–1096. [Google Scholar] [CrossRef]
- Su, Q.; Chen, C.; Li, J. TrendRank method for evaluating the importance of power grid nodes considering information network. IET Gener. Transm. Distrib. 2023, 17, 539–550. [Google Scholar] [CrossRef]
- Zhu, D.; Wang, H.; Wang, R.; Duan, J.; Bai, J. Identification of key nodes in a power grid based on modified PageRank algorithm. Energies 2022, 15, 797. [Google Scholar] [CrossRef]
- Zhao, J.; Huang, J.; Cui, Y.; Zhang, N.; Wang, Y.; Wang, Z. Subarray partition based on sparse array weighted K-means clustering. Electron. Lett. 2024, 60, e70042. [Google Scholar] [CrossRef]
- Chai, Y.; Yu, H.; Dong, Y.; Wen, Y.; Lv, C. Key node identification and network simplification modelling method for optimal power flow analysis of active distribution network. Electr. Power Syst. Res. 2025, 238, 111066. [Google Scholar] [CrossRef]
- Li, D.; Dong, N.; Yao, Y.; Xu, B.; Gao, D.W. Area inertia estimation of power system containing wind power considering dispersion of frequency response basedon measured area frequency. IET Gener. Transm. Distrib. 2022, 16, 4640–4651. [Google Scholar] [CrossRef]
- Eddin, M.E.; Massaoudi, M.; Abu-Rub, H.; Shadmand, M.; Abdallah, M. Optimum Partition of Power Networks Using Singular Value Decomposition and Affinity Propagation. IEEE Trans. Power Syst. 2024, 39, 13. [Google Scholar] [CrossRef]
- Farmer, W.J.; Rix, A.J. Evaluating power system network inertia using spectral clustering to define local area stability. Int. J. Electr. Power Energy Syst. 2021, 134, 107404. [Google Scholar] [CrossRef]
- Faragalla, A.; Abdel-Rahim, O.; Orabi, M.; Abdelhameed, E.H. Enhanced Virtual Inertia Control for Microgrids with High-Penetration Renewables Based on Whale Optimization. Energies 2022, 15, 9254. [Google Scholar] [CrossRef]
- Li, W.; Wang, Z.; Sun, W.; Bahrami, S. An ensemble clustering framework based on hierarchical clustering ensemble selection and clusters clustering. Cybern. Syst. 2023, 54, 741–766. [Google Scholar] [CrossRef]
- Li, J.; Zhao, Y.; Jinghua, C.; Junwei, Q.; Yao, Y.; Junyue, R.; Li, Z. Research on distributed photovoltaic cluster partition and dynamic adjustment strategy based on AGA. Electr. Eng. 2025, 107, 639–651. [Google Scholar] [CrossRef]
- Li, S.; Cao, Z.; Hu, K.; Chen, D. Performance Assessment for Primary Frequency Regulation of Variable-Speed Pumped Storage Plant in Isolated Power Systems. Energies 2023, 16, 1238. [Google Scholar] [CrossRef]
Disclaimer/Publisher’s Note: The statements, opinions and data contained in all publications are solely those of the individual author(s) and contributor(s) and not of MDPI and/or the editor(s). MDPI and/or the editor(s) disclaim responsibility for any injury to people or property resulting from any ideas, methods, instructions or products referred to in the content. |
© 2025 by the authors. Licensee MDPI, Basel, Switzerland. This article is an open access article distributed under the terms and conditions of the Creative Commons Attribution (CC BY) license (https://creativecommons.org/licenses/by/4.0/).