1. Introduction
Understanding and managing the environmental impacts of urban transportation systems has become increasingly crucial in the face of growing mobility demands and climate change concerns. In this context, the present study focuses on Budapest, a major urban center in Central Europe, to explore how future energy consumption and policy choices could shape sustainable mobility pathways. This research aims to fill existing knowledge gaps by providing long-term projections and policy-oriented insights.
1.1. Background
Transportation is a fundamental component of urban development, influencing economic growth, environmental sustainability, and public well-being. As cities expand and mobility demands increase, managing transport energy consumption and emissions becomes a critical challenge [
1,
2]. Budapest, Hungary’s capital and largest city, is inhabited by 20% of the population and serves as a key hub in European transportation networks. The city’s extensive transport system includes various modes, such as private cars, light commercial vehicles (LCVs), heavy-duty vehicles (HDVs), coaches, and mopeds. However, Budapest’s heavy reliance on road transport has led to significant environmental concerns, particularly regarding air quality and greenhouse gas (GHG) emissions [
3,
4,
5].
Despite the decline in the national population, Budapest’s transport demand has continued to rise, intensifying congestion and environmental concerns. The Budapest Climate Strategy and the Sustainable Energy and Climate Action Plan emphasise the need to transition toward cleaner transport solutions, reducing the dominance of private car usage while promoting sustainable modes such as public transport, cycling, and walking. However, the city’s ageing vehicle fleet, with an average age of 16 years, poses additional challenges for emission reduction efforts [
6]. Urban planning initiatives, such as the Budapest Mobility Plan, aim to modernise the city’s transport infrastructure and improve air quality by 2030. Still, the effectiveness of these measures requires rigorous assessment and long-term forecasting.
This study contributes to understanding the future of transport energy consumption and its economic implications in Budapest. It provides forecasts for energy consumption trends by 2030 and 2050 under various policy and technological scenarios, aiding policymakers in preparing for future energy needs. This research also examines how changes in fleet composition, including the adoption of electric and hybrid vehicles, will impact emissions reductions. Additionally, this study assesses the effects of policy interventions, such as stricter emission regulations and public transport investments, on energy demand and economic outcomes. Finally, it projects the costs associated with future energy consumption, considering fuel price fluctuations, and it explores their impact on financial sustainability. These contributions offer valuable insights for effective, future-focused urban transport policy development.
1.2. Research Questions and Objectives
The primary objective of this study is to assess the future energy consumption and economic implications of transport policies in Budapest by analysing different policy scenarios for 2020, 2030, and 2050. This research focuses on the interplay between transport demand, fleet composition, energy efficiency, and environmental impact. The key research questions guiding this study are:
How will transport energy consumption in Budapest evolve under different policy and technological scenarios for 2030 and 2050?
What are the expected changes in the vehicle fleet composition, including adopting electric and hybrid vehicles, and how will these changes impact emissions?
How do different policy interventions, such as stricter emissions regulations, investments in public transport, and congestion mitigation strategies, influence energy demand and economic outcomes?
What are the projected costs associated with future energy consumption in the transport sector, and how do fuel price fluctuations affect economic sustainability?
This study integrates traffic simulation, emission modelling, and statistical forecasting to address these research questions. The methodological framework incorporates the Budapest Transport Model (EFM) for traffic demand analysis, Handbook Emission Factors for Road Transport (HBEFA) and Computer Programme to Calculate Emissions from Road Transport (COPERT) for emission estimation, and ARIMA for fuel price forecasting. By leveraging these tools, this study aims to provide actionable insights for policymakers, urban planners, and transportation authorities in shaping sustainable mobility strategies for Budapest’s future.
This study is structured as follows:
Section 2 reviews existing research on road transport mean delay and emissions, focusing on the role of emission models, policy impacts, and technological advancements in urban air quality management.
Section 3 describes the study area of Budapest and outlines the methodology, including the transport network, vehicle composition, regulatory context, and the emission models and scenarios (2020, 2030, and 2050) used in the analysis. This methodology integrates the HBEFA version 4.2 and COPERT models within the PTV VISUM 2025 (Expert thesis 2025 (SP1-1) [286791]) simulation framework to project emissions under different vehicle technology and demand scenarios and the ARIMA model approach.
Section 4 presents the results, highlighting projected fuel consumption and emissions of greenhouse gases and CO
2-equivalent emissions, then forecasting fuel prices and monetary values based on time scenarios.
Section 5 discusses the findings in the context of EU climate goals and explores Policy Implications and Future Directions.
Section 6 summaries this study’s contributions;
Section 7 illustrates the acknowledged limitations and suggests future research directions to advance urban emission modelling and sustainable transport strategies.
2. Literature Review
Road transport is one of the most significant contributors to energy consumption and greenhouse gas (GHG) emissions in the European Union (EU), accounting for nearly 74% of total transport-related emissions [
7]. The reliance on fossil fuels, particularly diesel and gasoline, has led to significant environmental concerns, including air pollution and climate change. Studies indicate that the growing number of vehicle kilometres travelled (VKT) in urban areas exacerbates these issues, making emission mitigation a priority [
8].
Several technological and policy-driven solutions have been proposed to address fuel consumption and emissions. Research by Schäfer et al. (2020) [
9] highlights that adopting electric vehicles (EVs), improving fuel efficiency, and using alternative fuels such as hydrogen and biofuels are essential for reducing emissions. However, the success of these solutions depends on infrastructure investments, energy grid capacity, and consumer willingness to transition to low-emission technologies [
9].
2.1. Transport Energy Consumption and Emissions in the EU
Transport energy consumption in the EU has steadily increased over recent decades, driven by economic growth, urbanisation, and rising mobility demand. According to the European Environmental Agency, transport is responsible for approximately 36.2% of the EU’s total final energy consumption, with road transport accounting for the largest share [
10]. Fossil fuel dependency remains a significant challenge, as nearly 93.5% of transport energy consumption is derived from oil-based fuels in 2022 [
11].
Dumitrescu (2024) highlights that fossil fuel reliance in transportation across EU member states, including Hungary, continues to drive emissions, exacerbating environmental concerns [
12]. A decomposition analysis by Chovancová et al. (2024) further supports this, showing disparities in energy consumption between wealthier and less affluent EU countries, underlining the need for targeted policy interventions [
13].
Efforts to transition towards renewable energy sources in transport have been challenged. Despite the EU’s ambitious climate policies, such as the Renewable Energy Directive (RED II), adopting alternative fuels, including biofuels, hydrogen, and electricity, has been slow. Simionescu et al. (2020) emphasise that renewable energy usage in transport remains limited due to economic barriers and infrastructural constraints [
14]. Furthermore, Davidson et al. (2021) note that while renewable energy positively influences economic growth, its penetration into the transport sector has lagged due to technological and financial hurdles [
15].
In Hungary and Budapest, transport energy consumption trends closely follow broader EU patterns discusses Hungary’s heavy reliance on fossil fuel imports, which has constrained the development of greener transport alternatives [
16]. They further highlight the economic barriers to transitioning to low-carbon transport solutions, particularly among lower-income groups, who are more sensitive to fluctuations in fuel prices [
17].
Looking ahead, the EU has set ambitious targets for reducing emissions and increasing energy efficiency in transport. The European Green Deal aims for a 90% reduction in transport-related GHG emissions by 2050 [
18]. However, achieving these goals will require substantial investments in clean energy infrastructure, more vigorous policy enforcement, and behavioural changes in transport usage across the region.
2.2. EU Policies and Their Impact on Urban Transport Energy Consumption
EU policies play a pivotal role in shaping the energy consumption patterns of urban transport systems across member states. The Renewable Energy Directive (RED II) mandates that at least 14% of transport energy comes from renewable sources by 2030 [
19]. These directives and other regulatory frameworks, such as the European Green Deal and the Sustainable and Smart Mobility Strategy, aim to decarbonise urban transport while improving energy efficiency.
Several studies have assessed the impact of these policies on urban transport. Szép & Kashour (2023) found that integrating renewable energy policies into urban transport systems enhances environmental sustainability and economic growth [
17]. The study highlights the necessity of participatory governance, improved communication infrastructure, and enhanced public transport systems to ensure the effectiveness of these policies. Vasile Dinu (2023) discusses the implications of the REPower EU plan, which aims to accelerate the deployment of renewable energy, reduce dependency on fossil fuel imports, and improve energy security within the EU [
20]. The plan also underscores the importance of electrification and hydrogen-based transport solutions, particularly for urban mobility [
21].
Moreover, the EU’s Sustainable and Smart Mobility Strategy emphasises the role of digitalisation in reducing urban transport emissions. Digital technologies such as Mobility-as-a-Service (MaaS), intelligent traffic management, and real-time data analytics have been identified as key enablers in optimising urban transport systems and reducing energy consumption. Noussan and Tagliapietra (2020) highlight how digital solutions can contribute to sustainability or, if mismanaged, lead to increased energy consumption due to rebound effects [
22].
Despite these policies, challenges remain. Many EU cities face financial and infrastructural constraints when implementing large-scale transport electrification projects. Additionally, disparities in policy implementation across different member states lead to uneven progress in transport decarbonisation. Research by Domagała et al. (2023) highlights how economic disparities influence the adoption of green transport policies, with wealthier EU nations advancing more rapidly than others [
23].
The EU has also focused on promoting the adoption of electric vehicles (EVs) as part of its broader climate goals. The European Green Deal sets the ambitious target of reducing GHG emissions by at least 55% by 2030 compared to 1990, with a critical role for the transport sector. To achieve this, the EU has implemented various measures to accelerate the uptake of EVs, including subsidies for EV purchases, investments in charging infrastructure, and stringent CO
2 emission targets for new cars and vans [
24]. The impact of these policies is evident in the growing adoption of EVs across the EU. In 2023, EVs accounted for nearly 23.6% of new car registrations in the EU, with 15.5% being fully EVs [
22]. However, the overall environmental benefits of EVs depend on the energy mix used to generate electricity. In regions where coal or other fossil fuels dominate electricity generation, the lifecycle emissions of EVs may not be significantly lower than those of efficient internal combustion engine vehicles (ICEVs) [
25].
In addition to addressing vehicle emissions, the EU has introduced policies to lower overall transport demand and foster sustainable mobility solutions. The Urban Mobility Package, introduced in 2013, advocates for creating Sustainable Urban Mobility Plans (SUMPs), which emphasise enhancing public transport systems, cycling infrastructure, and pedestrian-friendly environments over-reliance on private vehicles [
26]. Cities such as Copenhagen, Amsterdam, and Vienna have effectively adopted Sustainable Urban Mobility Plans (SUMPs), leading to a substantial decrease in urban transport emissions and noticeable improvements in air quality [
27].
As Hungary’s capital, Budapest faces unique urban transport challenges shaped by its economic structure, infrastructure limitations, and growing population. The city’s reliance on fossil fuel-powered vehicles continues to contribute significantly to air pollution and energy consumption. Public transport in Budapest, although well-developed, still struggles with issues related to ageing infrastructure, limited electrification, and underfunding.
Policy measures in Budapest have included expanding metro and tram networks, introducing low-emission zones, and offering incentives for EV adoption. However, further investments in infrastructure modernisation, financial incentives for clean transport, and enhanced policy coordination are needed to align Budapest’s transport sector with EU climate goals.
2.3. Scenario-Based Analysis of Transport Policies
Scenario-based analysis is a critical tool in understanding the potential long-term impacts of transport policies. By modelling different policy interventions and external factors, such analyses help policymakers anticipate energy consumption patterns, emissions reductions, and economic consequences. Several key scenarios have been explored in recent studies, providing valuable insights into the future of transport energy use in EU countries.
One of the most widely referenced scenario studies is the European Commission’s Strategic Transport Research and Innovation Agenda (STRIA), which outlines pathways for decarbonising transport by 2050. The scenarios examine various policy combinations, including higher carbon taxes, stricter vehicle emission standards, and accelerated EV adoption. Findings suggest that an aggressive policy approach—combining subsidies for EVs, investment in public transit, and congestion pricing—can lead to a 90% reduction in transport-related emissions by 2050 [
18].
The role of biofuels in future transport scenarios has also been extensively studied. Chiaramonti et al. (2021) present projections for biofuel market penetration by 2050, highlighting the potential for advanced biofuels to replace conventional fossil fuels [
28]. However, economic viability and the availability of feedstocks remain significant barriers to large-scale adoption.
Additionally, the impact of carbon pricing policies has been explored in multiple scenarios. Studies indicate that while carbon taxes can effectively reduce emissions, they must be paired with social policies to avoid disproportionate economic burdens on lower-income populations. In Budapest, implementing congestion pricing or low-emission zones could significantly cut urban emissions but may require additional subsidies for low-income residents to ensure equitable access to transport alternatives.
In conclusion, scenario-based analyses highlight the complexity of future transport policies and the importance of integrating multiple strategies to achieve sustainability goals. For the EU and Budapest, policies must be flexible, allowing for adjustments based on technological advancements, economic conditions, and public adoption rates.
2.4. Economic Implications of Future Transport Policies
The economic implications of future transport policies in the EU and Budapest will profoundly influence investments, employment, and consumer behaviour. The transition towards sustainable transport requires significant financial commitments from governments, businesses, and individuals.
One of the primary economic considerations is the cost of infrastructure development. The EU’s push for electric vehicle adoption necessitates substantial investments in charging infrastructure, grid modernisation, and battery production. According to the European Investment Bank (2023), achieving transport decarbonisation targets by 2050 will require an estimated EUR 1.5 trillion in transport-related investments [
29]. While these expenditures create economic opportunities, such as new jobs in the renewable energy and electric vehicle sectors, they also present financial challenges, particularly for lower-income regions struggling to meet infrastructure demands.
The shift towards electrification and alternative fuels will also impact employment dynamics. Davidson et al. (2021) suggest that while the transition to electric mobility will generate new jobs in battery manufacturing, software development, and renewable energy sectors, it will also result in job losses in industries reliant on fossil fuel-based transportation, such as internal combustion engine manufacturing and fuel refining [
15]. Policymakers must ensure workforce retraining programs and social safety nets to mitigate potential disruptions.
For Budapest, the economic implications of future transport policies are particularly significant due to the city’s reliance on fossil fuels and the high cost of transitioning to greener alternatives. Karácsony and Garibli (2023) highlight that high EV purchase costs, limited government subsidies, and economic inequalities hinder the widespread adoption of clean mobility solutions [
16]. Additional policies, such as tax incentives for EV purchases and subsidies for public transport development, will be essential in making sustainable mobility accessible to a broader population.
Another key economic factor is the introduction of congestion pricing and low-emission zones. While these measures can significantly reduce urban emissions and traffic congestion, they also present challenges for businesses and low-income residents who rely on private vehicles for commuting and trade. Studies indicate that congestion pricing schemes must be accompanied by targeted financial support to prevent economic disparities from widening [
30].
2.5. Comparative Case Studies Using Emission Models and Economic Analysis
Table 1 presents a critical comparison of scenario-based analyses assessing transport policies’ energy and economic impacts through 2030 and 2050 to contextualise this study’s contribution. These case studies span different countries and use tools like COPERT, HBEFA, and TIMES to simulate outcomes based on diverse datasets. The table summarises each study’s methodology, results, and limitations, highlighting key challenges such as data sensitivity, model calibration, and financial feasibility. This comparison underscores the need for localised, integrative approaches—such as the one adopted in this paper—to inform effective and equitable transport policy.
2.6. Research Gaps
Although extensive research has been conducted on transport energy consumption, emissions, and policy impacts, several gaps remain. First, more localised studies are needed to assess the effects of EU policies on cities like Budapest, where socio-economic and infrastructural conditions differ from wealthier EU regions.
Second, the long-term impact of digitalisation on transport efficiency and emissions is unclear. Technologies such as smart traffic management, Mobility-as-a-Service (MaaS), and autonomous vehicles could reshape transport patterns, yet further empirical research is needed to evaluate their effectiveness.
Third, while electric vehicles are central to EU transport policies, concerns remain about battery production sustainability, raw material sourcing, and recycling processes. Further research should focus on advancing battery technologies and minimising the environmental footprint of large-scale EV adoption.
Lastly, economic feasibility studies on transport decarbonisation are crucial, especially for regions with limited financial resources. Future research should explore cost-effective funding mechanisms, policy incentives, and equitable transition strategies to ensure sustainable transport solutions are accessible to all populations.
By addressing these gaps, policymakers can design more effective, inclusive, and sustainable transport policies that align with EU-wide environmental targets and local urban challenges.
3. Study Area and Transport Network
This section presents Budapest’s geographical scope and transport network structure, which form the basis for this study’s simulation and emissions analysis.
3.1. Study Area Overview
This study centres on Budapest, the capital and largest city of Hungary. As a key hub for the nation’s transportation network, Budapest features a densely populated urban landscape, an extensive and varied road system, and a heavy dependence on road transport. The city is home to over 1.7 million residents, with its metropolitan area housing a population surpassing 3 million [
33]. Despite a declining national population, Budapest faces increasing transportation challenges as traffic demand grows [
34]. Budapest features a diverse blend of urban and suburban zones, with central districts experiencing the heaviest road traffic. The city is served by major thoroughfares, including the M0 Ring Road that encircles the metropolitan area and primary routes linking Budapest to regional and international highways [
35]. The road network in Budapest is divided into urban and rural zones to capture the variation in emission intensities between densely populated city regions and the less populated suburban or rural areas, as shown in
Figure 1. The urban zone is designated as “Budapest,” while the rural zone is called “the Surrounding Areas of Budapest”.
According to The Budapest Climate Strategy and Sustainable Energy and Climate Action Plan, Budapest faces rising vehicle numbers, with private cars exceeding 50% of traffic, increasing congestion, and reducing eco-friendly transport use [
36]. The COVID-19 pandemic further decreased public transit usage, while Hungary’s ageing vehicle fleet (16 years on average) exacerbates emissions. As a key hub in European transport corridors, Budapest’s traffic challenges strain infrastructure and amplify environmental impacts [
32,
33]. Efforts like the Budapest Mobility Plan aim to modernise transport, reduce emissions, and promote sustainable modes by 2030, but road transport remains the primary source of local pollutants and GHG emissions [
37].
3.2. Transport Network Configuration
Budapest boasts a comprehensive and well-structured transport network. The city is strategically positioned at the crossroads of several key European transport corridors, making it a critical hub for local and international traffic. The transport network in Budapest is highly multimodal, integrating roads, railways, air, and waterways, with roads being the dominant mode of transport, with a radial structure centred on the city.
EFM Model of Budapest
The Budapest Transport Model (EFM), developed by BKK using PTV VISUM, is a macroscopic simulation tool designed to analyse traffic patterns in Budapest and its surrounding areas [
38,
39]. Based on the four-step transport modelling approach, it integrates demographic, economic, and real-time traffic data to simulate and forecast transport demand for 2030 and 2050. The model encompasses over 30,000 links, 15,000 nodes, and 1200 zones, accounting for various modes of transport, including private vehicles, public transport, freight, and active travel “non-motorised modes such as walking and cycling”. With detailed calibration using 240 cross-sections and the GEH function, the EFM ensures accurate traffic predictions, aiding planners in reducing congestion, optimising infrastructure, and promoting sustainable transport solutions [
40]. Budapest’s future traffic demand and fleet projections account for increasing travel activity and evolving fleet characteristics. The BKK employs direct and synthetic matrices to forecast shifts in travel demand, projecting daily trips to rise from 2.16 million in 2020 to 2.23 million by 2030 and further to 2.31 million by 2050. These forecasts incorporate expected demographic changes, economic growth, and urban development trends, using a sigmoid Equation (1) to model motorisation saturation. The projections also consider changes in travel behaviour as more households transition from non-car ownership to car ownership, leading to a higher preference for car usage. This shift is reflected in demand matrices, which are incrementally adjusted to capture the tendencies of new vehicle owners while aligning with existing behavioural patterns. The demand model applies this differentiated approach across 164 zones, grouped based on socio-economic characteristics, to accurately predict variations in regional traffic patterns.
Ct is the motorisation level in the specific year, S is the motorisation saturation level, C0 is the motorisation level of the base year, g0 is the growth factor, and t is the number of years concerning the base year.
COPERT projections for 2030 and 2050 predict a shift toward cleaner technologies, such as electric and hybrid vehicles, aligned with EU and Hungarian targets. Incorporating these forecasts into the emissions model enables the estimation of future emissions, accounting for fleet composition changes and urban demand growth. This integrated approach offers policymakers a detailed outlook on road transport emissions and urban air quality in Budapest.
3.3. Integration and Customisation of Emission Models
This research integrates HBEFA version 4.2 and COPERT models to create a customised emissions analysis for Budapest. Although HBEFA, combined with PTV VISUM, is well-suited for large-scale traffic emissions assessments, its emission factors are confined to six European nations, omitting Hungary. To bridge this gap, COPERT was employed to determine the composition of Hungary’s vehicle fleet for the years 2020, 2030, and 2050 [
38]. The detailed vehicle and fuel-related data from COPERT were manually incorporated into HBEFA within VISUM, ensuring that emission factors accurately reflect Budapest’s existing and anticipated fleet characteristics. A framework aligned with Hungarian conditions was developed using COPERT’s region-specific information alongside HBEFA’s traffic modelling capabilities.
For estimating warm emissions, the study applied emission factors from HBEFA Version 4.2, specifically designed to calculate “hot” emissions for vehicles operating under normal temperature conditions, omitting cold start impacts. Built upon the Passenger Car and Heavy-duty Emission Model (PHEM), HBEFA simulates emissions across different driving patterns, generating pollutant factors for various traffic environments. These factors were then implemented within PTV VISUM, combining HBEFA outputs with locally measured vehicle kilometres travelled (VKT) to deliver an in-depth analysis of urban emissions in Budapest [
41].
HBEFA’s precision stems from its segmentation of vehicles by category (e.g., private cars, light commercial vehicles), Euro standards (e.g., Euro 4–6), and fuel types (e.g., diesel, petrol, hybrid). Traffic conditions, including speed variations and service levels, are similarly segmented, ensuring emission factors reflect real-world conditions. Each vehicle group is modelled with specific driving patterns, fuel efficiency, and after-treatment technologies like SCR and DPF systems, influencing warm emission rates.
3.4. Vehicle Categories and Pollutants Considered
This study examines energy consumption and GHGs from vehicles within Budapest’s transportation system, focusing on emissions produced by passenger cars, light commercial vehicles (LCVs), mopeds, and coaches. However, heavy-duty vehicles (HDVs) are not included in this assessment due to their unique operational patterns, as they primarily travel along peripheral routes and dedicated freight corridors. Accurately modelling HDV emissions requires specific parameters, including freight movement data, load distribution, and specialised emission factors, which extend beyond the scope of this research and the available dataset.
According to the Hungarian Statistical Office [
35], in 2020, the vehicle composition in Budapest was largely dominated by passenger cars, which comprised 84.52% of the city’s total fleet. LCVs constituted 11.44%, while mopeds and coaches accounted for 3.5% and 0.54%, respectively. Given their overwhelming presence and frequent use within the city’s road network, this distribution highlights the importance of concentrating on private and light vehicles in emissions modelling.
This study considers a wide range of pollutants to develop a detailed emissions profile. Greenhouse gases such as carbon dioxide (CO
2), methane (CH
4), and nitrous oxide (N
2O) are assessed due to their substantial role in climate change. Additionally, other pollutants, including carbon monoxide (CO), ammonia (NH
3), and nitrogen oxides (NO
x)—with nitrogen dioxide (NO
2) being a key contributor to urban air pollution—are analysed for their environmental and health implications. This study also examines non-methane hydrocarbons (NMHCs), volatile organic compounds like benzene, and exhaust and non-exhaust particulate matter (PM10, PM2.5) to ensure a comprehensive evaluation of emissions from urban transportation. Furthermore, black carbon (BC) is included in the analysis due to its high global warming potential and significant health risks, particularly in densely populated areas [
42,
43].
3.5. ARIMA Forecasting Model (For Fuel CO2 Prices)
To project future prices of diesel, gasoline, electricity, and CO2 emissions, we used the Auto Regressive Integrated Moving Average (ARIMA) model.
Figure 2 Illustrates the methodology process for this study from the study area to modelling and forecasting.
4. Results
This section presents the findings of the scenario-based analysis of Budapest’s transport energy consumption, emissions, and economic implications for 2020, 2030, and 2050. The results highlight trends in fuel consumption, vehicle kilometres travelled (VKT), and CO2 emissions, alongside the projected financial impacts of energy use and carbon pricing. Through a combination of transport modelling and economic forecasting, this analysis provides insights into the effectiveness of future transport policies and fleet transitions. The subsections below detail the evolution of fuel consumption, the monetary valuation of energy use, and the accuracy of price forecasting models.
4.1. Fuel Consumption
This section presents the findings of the scenario-based analysis for Budapest’s transport energy consumption and emissions for the years 2020, 2030, and 2050. The results focus on fuel consumption trends (diesel, gasoline, and electric), CO2 emissions, and vehicle kilometres travelled (VKT), demonstrating the impact of transport policies and fleet composition shifts over time.
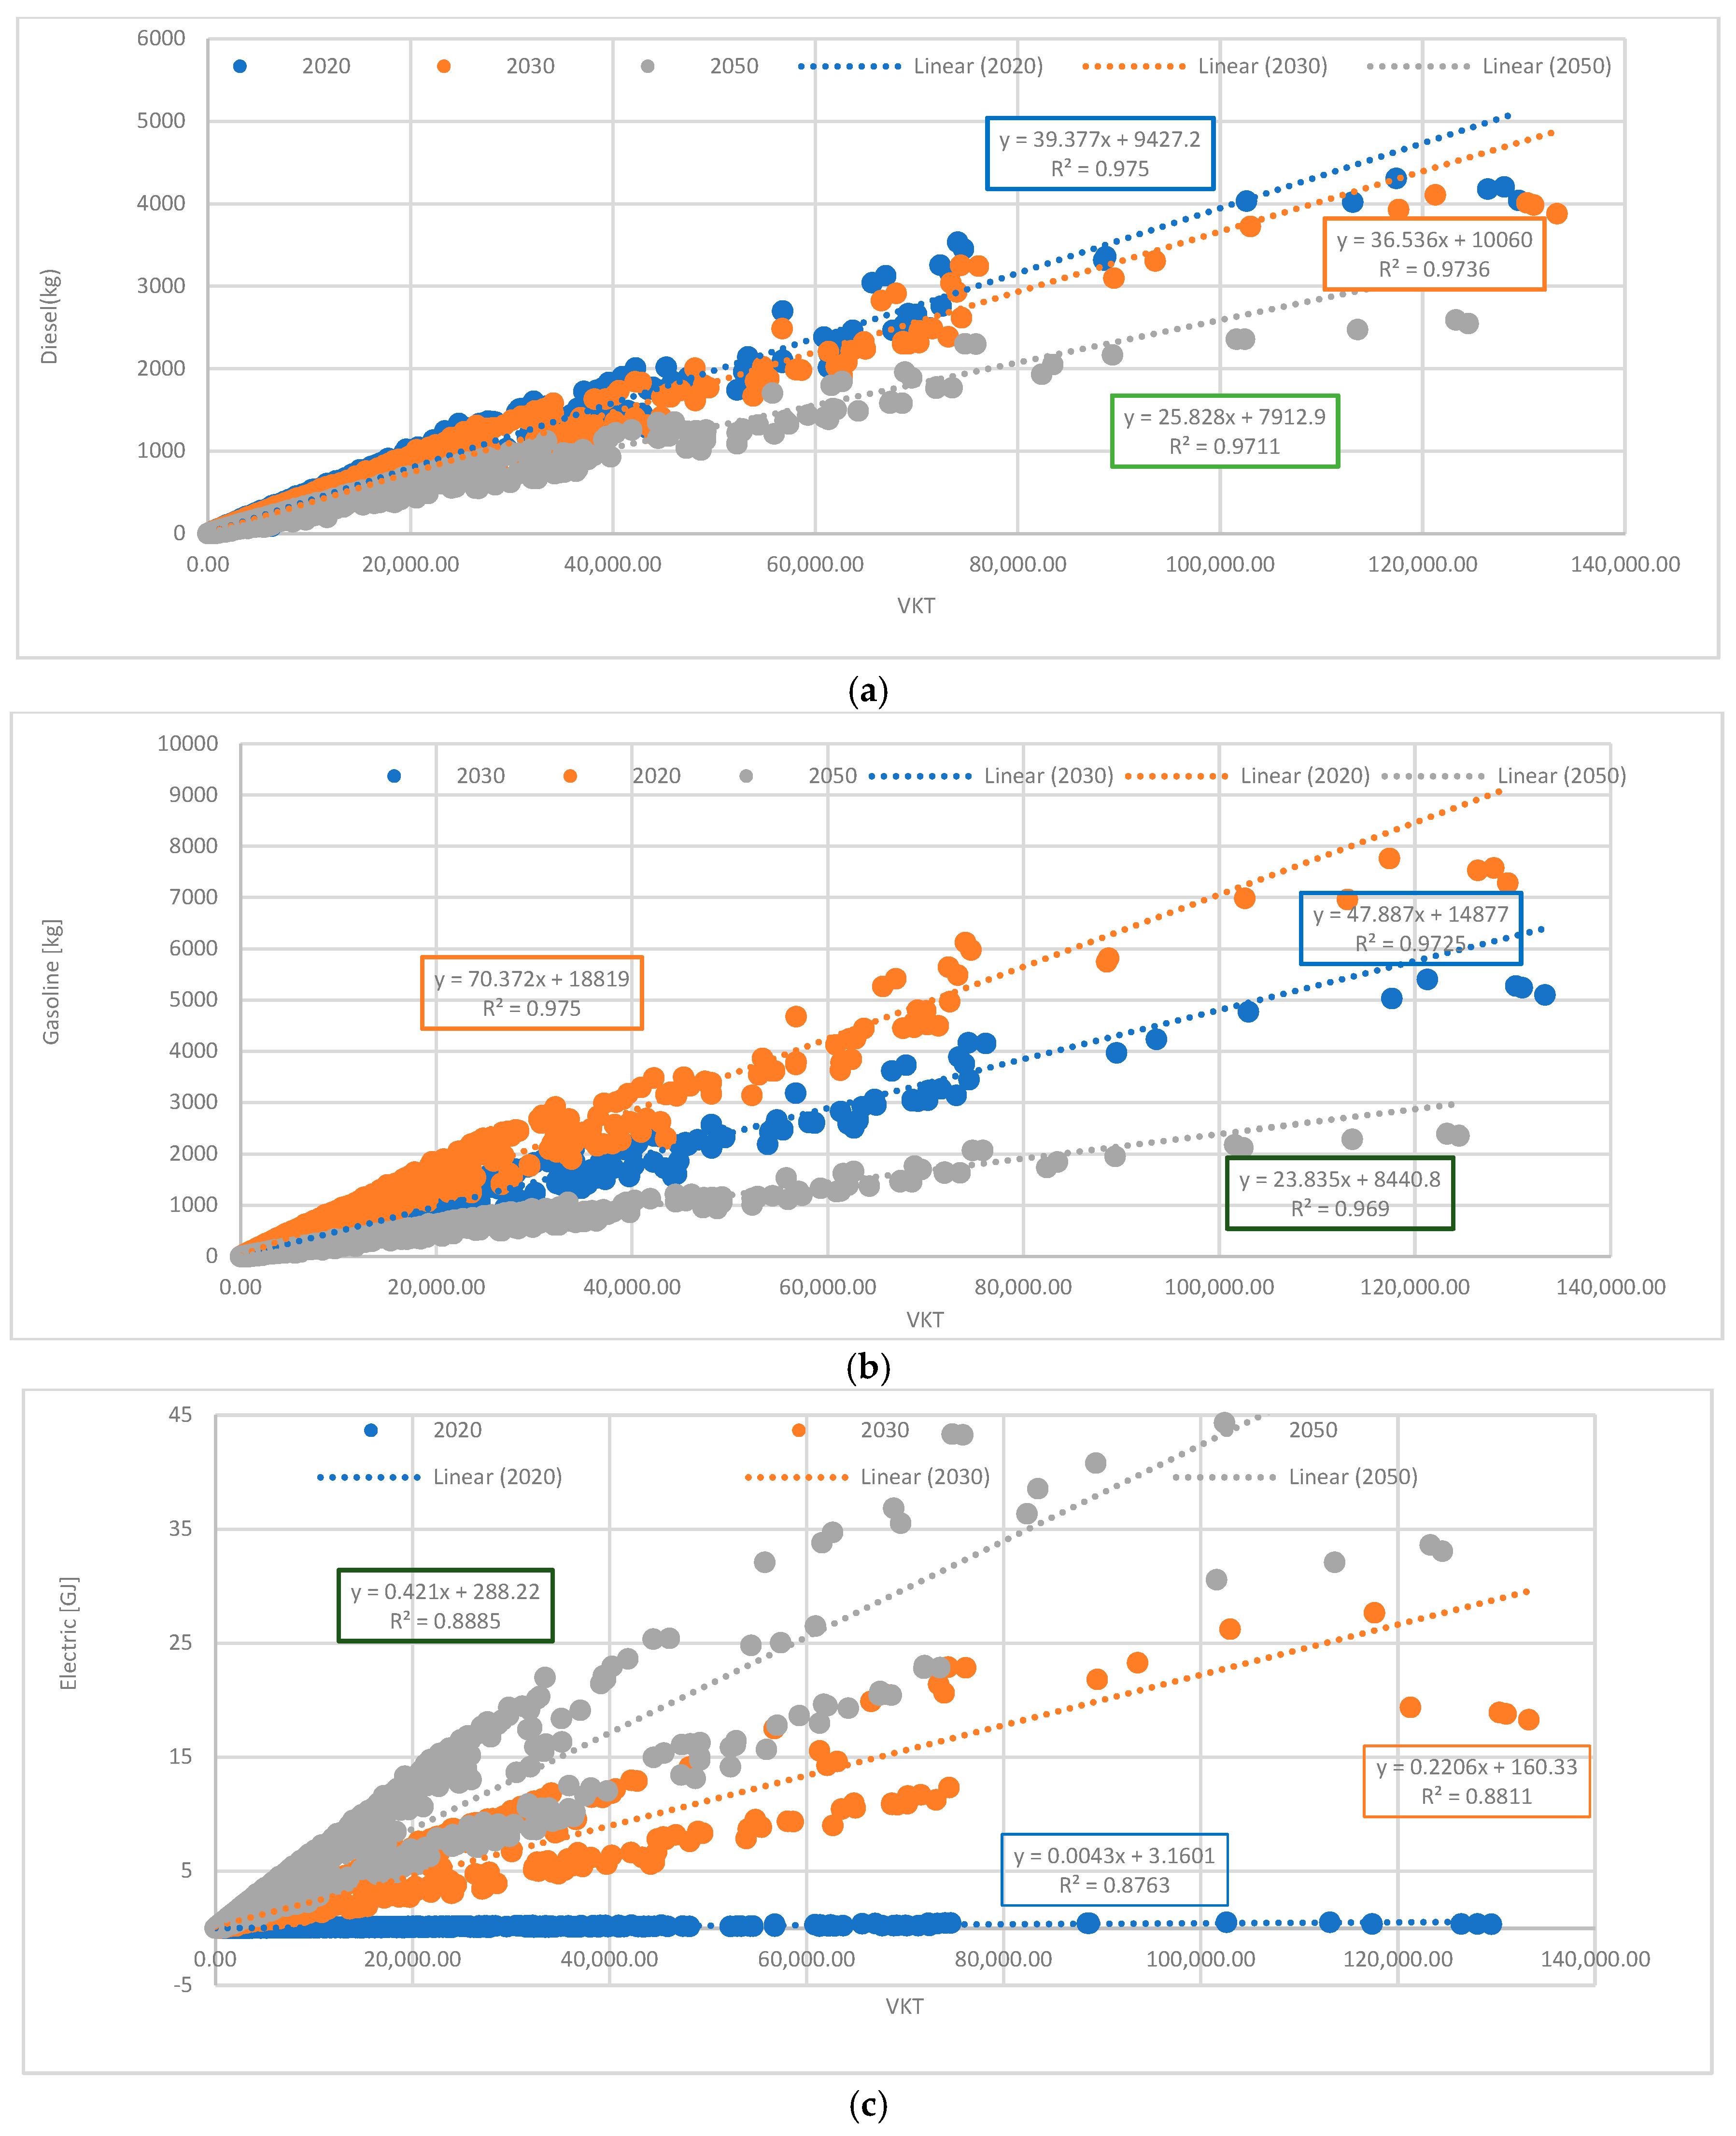
As shown in
Figure 3 and
Table 2, the analysis reveals a significant decline in diesel fuel consumption over the study period, even as VKT gradually increases. In 2020, diesel consumption was recorded at 2.66 million litres, while VKT stood at 52.49 million kilometres. Despite a 1.7% increase in VKT in 2030 to 53.39 million kilometres, diesel use declined by 5.1% to 2.52 million litres, suggesting improved fuel efficiency and fleet transition effects.
By 2050, diesel consumption is projected to be 1.81 million litres, a 32.8% reduction compared to 2020, even as VKT reaches 53.73 million kilometres. The regression analysis from
Figure 1 supports this trend, indicating that improvements in fuel efficiency, emissions regulations, and alternative powertrain adoption have contributed to reducing diesel dependency despite growing travel demand.
Similarly, gasoline fuel consumption follows a two-phase trend, initially declining moderately by 2030 and experiencing a sharper drop by 2050. In 2020, gasoline consumption stood at 5.29 million litres, with a corresponding VKT of 52.49 million kilometres. By 2030, gasoline use dropped to 3.70 million litres (a 30.2% decrease from 2020), even as VKT increased to 53.39 million kilometres. The most notable decline occurs post-2030, with gasoline consumption falling to 1.87 million litres in 2050, a 64.7% reduction from 2020 levels, despite VKT reaching 53.73 million kilometres.
Figure 2 illustrates this shift, confirming that gasoline-powered vehicles will continue playing a role in 2030, but a significant transition toward hybrid and electric alternatives will occur by 2050, dramatically reducing gasoline consumption.
In contrast, electric energy consumption experiences exponential growth, highlighting the accelerated transition to electrified mobility. The total electricity consumption for transport in 2020 was just 78,329 kWh, with VKT at 52.49 million kilometres. However, by 2030, electricity consumption surged to 4.03 million kWh, an astonishing 51-fold increase, despite only a 1.7% increase in VKT. This growth will be further accelerated by 2050, when electricity consumption reaches 7.63 million kWh, a 97-fold increase from 2020, while VKT grows to 53.73 million kilometres.
Figure 3 confirms this trend, showing a steeper slope in the 2050 scenario, signalling that a substantial portion of urban transport will rely on electric power by that time.
A progressive reduction in CO2 emissions accompanies the shift in fuel consumption patterns. In 2020, transport-related CO2 emissions were 19,161.85 metric tons, with VKT at 52.49 million kilometres. Despite VKT increasing to 53.39 million kilometres in 2030, CO2 emissions declined by 19% to 15,504.59 metric tons, largely due to fleet electrification and improved fuel efficiency. By 2050, CO2 emissions are projected to fall to 9923.62 metric tons, a 48% decrease compared to 2020, even though VKT reaches 53.73 million kilometres. The steepest reduction occurs post-2030, coinciding with rapid EV adoption, stricter fuel efficiency standards, and declining fossil fuel use. This suggests that fleet modernisation, targeted policy interventions, and efficiency advancements are critical in cutting transport-related emissions in Budapest.
4.2. Monetary Value of Energy Consumption
This section presents the monetary implications of fuel consumption in Budapest’s transport sector across 2020, 2030, and 2050 based on forecasted fuel prices using the ARIMA model. The analysis incorporates diesel, gasoline, and electricity consumption trends, associated costs, and CO2 emission pricing to assess the economic impact of the ongoing energy transition.
4.2.1. Forecasting Fuel Prices and Model Accuracy
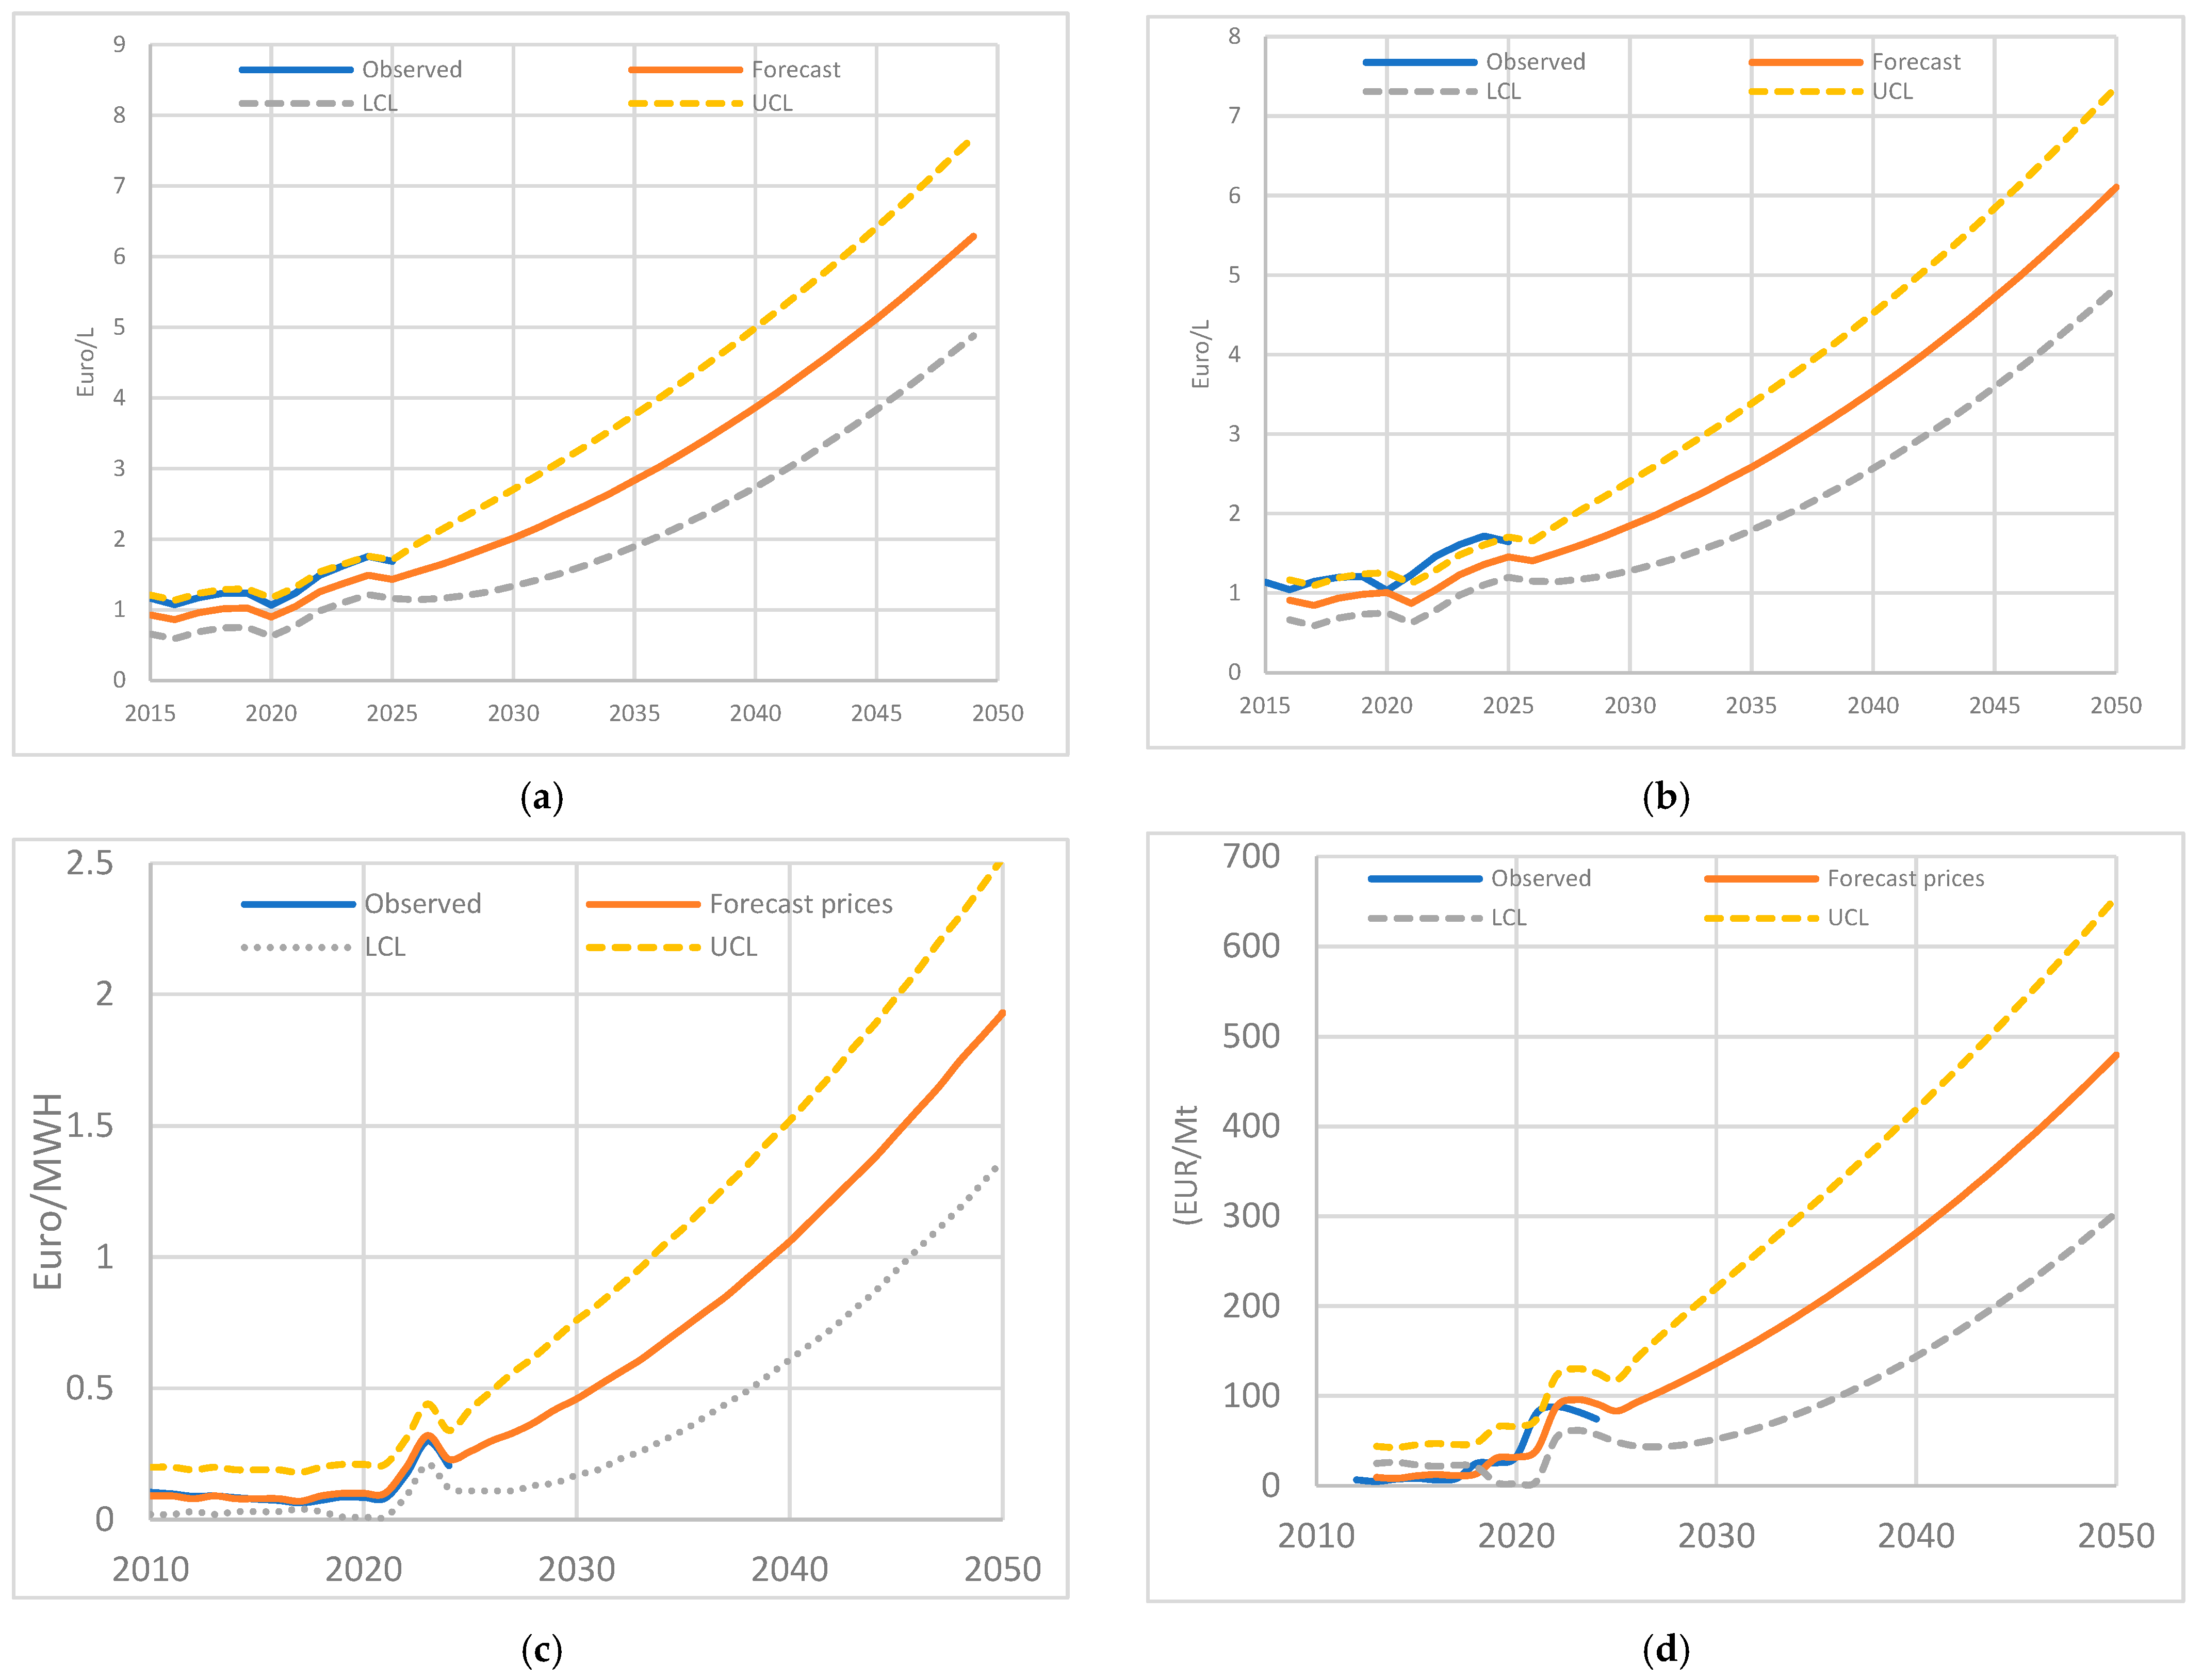
The ARIMA model projections for diesel, gasoline, and electricity prices demonstrate an increasing trend over time (
Figure 4).
Figure 3 illustrates the expected fuel price evolution, with a gradual rise until 2030 and a more substantial increase through 2050. The forecasting confidence intervals (LCL: Lower Confidence Limit, UCL: Upper Confidence Limit) indicate uncertainty in pricing but confirm the overall upward trajectory of fuel costs.
Table 3 shows that the R
2 values for forecasted prices indicate high model accuracy, particularly for diesel (0.82), gasoline (0.82), and electricity (0.98), ensuring strong reliability in the estimated monetary values. However, the CO
2 equivalent price forecast has a slightly lower R
2 of 0.90, reflecting greater volatility in carbon pricing projections, while the Correlation Coefficient (CC) was calculated to be around 0.9 for diesel, gasoline, and CO
2 equivalent and 0.98 for electricity, as shown in
Table 3.
While ARIMA models provide reliable short- to medium-term forecasts, their predictive accuracy diminishes over extended horizons due to compounding uncertainties in underlying assumptions and market dynamics. This study’s long-term forecasts presented for 2050 should be interpreted within a scenario-based framework, serving as indicative trends rather than precise predictions. Confidence intervals were included to address this, and forecasting accuracy was validated using high R2 values to support the model’s reliability within this context.
4.2.2. Monetary Impact of Fuel Consumption
The monetary cost of energy consumption is summarised in
Table 4, which outlines the forecasted diesel, gasoline, and electricity expenditures across the three scenarios.
Diesel fuel costs are expected to rise substantially, from EUR 2.84 million in 2020 to EUR 4.76 million in 2030 and EUR 11.36 million in 2050, reflecting both price increases and reduced consumption due to fleet electrification.
Gasoline expenditures follow a similar pattern, increasing from EUR 5.47 million in 2020 to EUR 6.83 million in 2030 and EUR 11.43 million in 2050, indicating a continued but declining reliance on gasoline-powered vehicles.
Electricity consumption costs surge, reaching EUR 1.69 million in 2030 and EUR 14.03 million in 2050, signifying the transition toward electric mobility. The increase is driven by higher energy consumption despite electricity remaining relatively cheaper per unit than fossil fuels.
CO2 emission pricing also rises significantly, with costs increasing from EUR 0.63 million in 2020 to EUR 4.76 million in 2050, aligning with the expected tightening of carbon pricing policies.
These results highlight a significant economic shift in Budapest’s transport sector, with fossil fuel expenditures decreasing while electricity costs rise, reflecting the electrification of mobility. The increase of CO2-related expenses further underscores the financial incentives for transitioning toward low-emission transport solutions.
The findings suggest that future transport policies must account for rising energy costs and the economic feasibility of alternative fuel adoption to ensure affordability and sustainability in Budapest’s evolving transport landscape.
5. Discussion and Policy Implications
This section interprets the study’s key findings, exploring their implications for environmental sustainability, energy consumption trends, and economic impacts. It also outlines strategic policy recommendations to support Budapest’s sustainable and equitable transport transition.
5.1. Discussion
The findings of this study reveal a fundamental shift in Budapest’s transport sector, characterised by a substantial decline in fossil fuel consumption, rapid electrification, and a significant reduction in CO2 emissions. Although a steady increase in vehicle kilometres travelled (VKT) is predicted across 2020, 2030, and 2050, this study demonstrates a progressive decoupling of fuel consumption from travel demand, indicating improvements in energy efficiency, fleet modernisation, and policy-driven transitions. These trends align with broader findings in the literature, reinforcing the effectiveness of sustainable transport strategies in mitigating environmental impacts while maintaining mobility.
This study’s decline in diesel and gasoline consumption supports prior research indicating a global shift toward alternative powertrains and emission reduction policies [
44]. By 2050, diesel consumption is expected to decrease by 32.8%, while gasoline consumption will drop by 64.7% despite a modest increase in VKT. These findings align with projections from the European Commission’s Sustainable and Smart Mobility Strategy, which aims for a 90% reduction in transport emissions by mid-century [
18]. The exponential increase in electric energy consumption (97-fold by 2050) underscores the accelerating transition to electric mobility, a trend widely documented in recent studies [
45,
46]. The surge in electricity demand suggests fleet electrification will dominate urban transport by mid-century, requiring grid capacity expansion and investments in renewable energy integration. This result aligns with the findings of [
47], who emphasise that large-scale EV adoption will necessitate dynamic load management strategies to prevent grid congestion and ensure energy security.
A key outcome of this study is the 48% reduction in CO
2 emissions by 2050, achieved through fleet electrification, improved fuel efficiency, and declining fossil fuel reliance. This finding corresponds with prior research [
48] projecting that full decarbonisation of urban transport can lead to 40–60% emission reductions by mid-century if accompanied by stringent policy interventions and clean energy investments. Additionally, the observed emissions decline aligns with ref. [
49], emphasising that CO
2 reduction potential depends on vehicle fleet turnover rates, public transport improvements, and EV market penetration. However, while emission reductions are significant, this study highlights that policy-driven electrification alone is insufficient to meet net-zero targets. Complementary strategies, including public transport expansion, congestion pricing, and urban design improvements, are necessary to further lower emissions. This perspective is consistent with ref. [
50], which stresses that high-density urban centres must integrate multimodal transport solutions to maximise sustainability benefits.
One of the most critical findings of this study is the substantial increase in energy costs across all fuel types, driven by rising demand, carbon pricing policies, and supply chain uncertainties. The ARIMA-based forecasting of fuel prices suggests that diesel and gasoline prices will more than double by 2050, reinforcing the financial unsustainability of internal combustion engine (ICE) vehicles in the long term. This aligns with the findings in ref. [
51]. Those who emphasise fossil fuel price volatility and carbon taxation are the primary drivers of transport electrification.
Electricity costs, while initially lower, increase substantially as EV adoption grows, creating new challenges for energy affordability and infrastructure resilience. These results mirror findings from [
52], highlighting that tariff regulations and renewable energy investments must accompany widespread EV deployment to ensure cost stability.
Furthermore, this study confirms the growing financial burden of CO
2 pricing, with emissions costs projected to increase more than sevenfold from 2020 to 2050. This aligns with prior research [
53,
54] arguing that carbon taxation policies must be carefully designed to avoid disproportionately affecting low-income populations while incentivising emission reductions.
5.2. Policy Implications
A successful and economically viable transition toward sustainable urban transport in Budapest requires a comprehensive policy framework that integrates environmental, economic, and social dimensions. Based on the results of this study, several key policy areas are proposed to guide future action.
First, accelerating the adoption of electric vehicles (EVs) and expanding the supporting infrastructure is essential. Policymakers should introduce robust financial incentives, such as subsidies, tax exemptions, and reduced registration fees, to encourage EV purchases across all income groups. Expanding the public EV charging network through public–private partnerships is critical to accommodate the rising electricity demand. Electrification efforts should also target public and corporate fleets, supported by preferential financing schemes and tax benefits, to create a broader impact across the vehicle market.
Second, managing the economic burden of rising energy costs must be a policy priority. As energy prices increase due to demand, carbon taxation, and supply uncertainties, government action is needed to ensure affordability. This can be achieved through regulated electricity pricing, long-term investments in renewable energy sources to stabilise electricity generation costs, and the development of smart grid technologies. Demand-responsive charging strategies should also be promoted to enhance energy efficiency and prevent grid overload during peak hours.
Third, carbon pricing and fiscal mechanisms should be designed to encourage emission reductions while ensuring economic fairness. Progressive carbon taxes can incentivise shifts to cleaner transport modes, but the revenues must be reinvested strategically. Priority areas for reinvestment include improving public transportation, expanding EV infrastructure, and funding sustainable transport research. At the same time, low-income households and small businesses must provide targeted financial support to ensure they can transition to low-emission transport options.
Fourth, strengthening public transportation and promoting alternative mobility solutions is crucial for reducing car dependency and urban emissions. Policymakers should increase investment in the expansion and modernisation of metro, tram, and bus systems to offer reliable, accessible alternatives. Integrating shared mobility services and Mobility-as-a-Service (MaaS) platforms can also provide flexible travel options. At the same time, cycling and pedestrian infrastructure development can support low-carbon, healthy mobility alternatives in urban areas.
Fifth, shifting toward public transport and active modes influences our calculated indicators. Specifically, we clarify that:
Increased public transport use (supported by projected investments and policies) reduces the share of private vehicle kilometres in the 2030 and 2050 scenarios.
This shift leads to lower overall energy demand and CO2 emissions, as public transport (especially electrified modes) has a lower per-passenger energy intensity.
These changes are reflected in the EFM model’s forecast matrices and are embedded in the resulting fuel consumption and emission outputs, especially under the “policy” and “green” scenarios.
A gradual shift toward electric freight vehicles and logistics optimisation (e.g., urban consolidation) is assumed, contributing to the reduction in diesel consumption and a moderate rise in electricity demand.
Finally, ensuring equitable access to sustainable transport options is vital for an inclusive transition. This includes subsidising disadvantaged groups to access affordable EVs and public transit. Congestion pricing and low-emission zones should be implemented in a socially equitable manner, with generated revenues reinvested into sustainable transport projects. Furthermore, as the shift from fossil fuels affects the labour market, workforce transition programs should be established to support reskilling and employment opportunities in green mobility sectors.
6. Conclusions
This study provides a comprehensive scenario-based analysis of Budapest’s transport energy consumption, fuel costs, and emissions trends for 2020, 2030, and 2050. The results highlight a clear transition toward sustainable transport, driven by decreasing diesel and gasoline consumption, increasing adoption of electric mobility, and significant reductions in CO2 emissions. Although there is a steady increase in vehicle kilometres travelled (VKT), we find that fuel consumption per kilometre declines substantially, reflecting efficiency improvements and fleet electrification.
The findings indicate that by 2050, Budapest’s transport sector will experience:
A 32.8% reduction in diesel consumption and a 64.7% decline in gasoline usage despite an increase in VKT.
An exponential increase in electricity consumption (97-fold growth compared to 2020), demonstrating the shift toward electric mobility.
A 48% reduction in CO2 emissions, confirming the effectiveness of transport policies, emission regulations, and fleet electrification efforts.
Rising fuel prices, particularly for diesel and gasoline, make internal combustion engine (ICE) vehicles financially unsustainable in the long term.
Increasing electricity costs as demand for EV charging grows, requiring investment in grid expansion and renewable energy sources.
While these trends signal a positive shift toward sustainability, they pose economic and infrastructural challenges, particularly regarding energy affordability, charging infrastructure expansion, and equitable access to clean mobility options. This study emphasises the importance of proactive policymaking, including financial incentives for EV adoption, carbon pricing mechanisms, and public transport investments, to ensure a just and financially sustainable transition.
7. Study Limitations and Future Work
While this study presents a robust scenario-based analysis of Budapest transport energy consumption and emissions, several limitations should be acknowledged to contextualise the findings and guide future research.
One key limitation is the uncertainty surrounding future policy developments and technological advancements. This study assumes a continuation of current trends, including gradual improvements in electric vehicle (EV) technology and the sustained implementation of climate and transport policies. However, unforeseen breakthroughs in battery efficiency, the adoption of hydrogen fuel technologies, or the emergence of new mobility solutions could significantly alter projected energy use and emission patterns.
Another limitation lies in the volatility of fuel prices and the complexities of global energy markets. Although the ARIMA-based forecasting model has strong predictive capability based on historical data, real-world fuel prices are subject to geopolitical events, economic disruptions, and policy shifts that are difficult to anticipate. Such factors could lead to significant deviations from forecasted values, especially over the long term.
The analysis also does not fully incorporate the challenges of integrating large EVs into the electricity grid. High levels of EV adoption may place considerable stress on grid infrastructure, particularly in load balancing, peak demand fluctuations, and the need for energy storage solutions. Future research should include energy infrastructure modelling to evaluate the interaction between transport electrification and grid resilience, especially in the context of renewable energy integration.
Furthermore, societal and behavioural factors, which play a critical role in shaping mobility transitions, are only partially addressed in this study. The success of EV adoption depends not only on policy and technology but also on consumer preferences, affordability, and access. Socio-economic disparities may limit the ability of specific populations to transition toward sustainable mobility, potentially reinforcing existing inequalities.
This study also focuses on private vehicle emissions, leaving out the broader implications of public transport and active mobility. While private transport is a significant source of emissions, urban sustainability will depend on expanding public transportation systems, promoting cycling and walking, and enhancing shared mobility services. These modes are essential for reducing car dependency and achieving long-term emission goals.
To address these limitations, several directions for future research are proposed. First, energy system modelling should be integrated with transport forecasts to explore the effects of increased electricity demand on grid capacity and renewable energy utilisation. This would provide a more complete understanding of the infrastructural requirements of a low-carbon transport future.
Second, future studies should conduct in-depth economic and social impact assessments. Evaluating the distributional effects of rising fuel and electricity costs, particularly on low-income groups, is essential for designing fair and effective policies. This includes analysing affordability, subsidy mechanisms, and targeted fiscal measures to support vulnerable populations in the transition.
Third, research should broaden its focus to include alternative fuel scenarios beyond electricity. Hydrogen, biofuels, and synthetic fuels could complement EVs in a diversified strategy for reducing transport-related emissions. Their potential role should be analysed through technical feasibility and policy readiness lenses.
Fourth, modelling the impact of public transport expansion and active mobility infrastructure is critical. Investments in the metro, tram, bus networks, cycling paths, and pedestrian-friendly urban designs can significantly reduce reliance on private vehicles, especially in dense urban environments like Budapest.
Lastly, behavioural modelling should be a central focus of future work. Understanding the factors influencing individual mobility choices, including EV adoption, public transport use, and engagement with Mobility-as-a-Service (MaaS) platforms will be vital for designing user-oriented and effective transport policies. The intersection of infrastructure development and behavioural adaptation should be explored to build a truly sustainable and inclusive urban mobility system.


