Article

Understanding Reference-Dependent Behaviors in Determining Electricity Consumption of Korean Households: Empirical Evidence and Policy Implications

1
The Korea Energy Economics Institute, 405-11 Jongga-ro, Jung-gu, Ulsan 44543, Republic of Korea
2
Department of International Commerce, Faculty of Economics and Commerce, College of Social Science, Keimyung University, Daegu 42601, Republic of Korea
*
Author to whom correspondence should be addressed.
Energies 2025, 18(11), 2686; https://doi.org/10.3390/en18112686
Submission received: 20 March 2025 / Revised: 5 May 2025 / Accepted: 19 May 2025 / Published: 22 May 2025
(This article belongs to the Special Issue New Challenges in Economic Development and Energy Policy)

Abstract

:
This paper examines whether reference-dependent preferences play a role in determining household electricity consumption in the Korean context. To do so, we first establish six variables of reference costs based on monthly electricity billing information of the 1040 Korean household survey dataset and then test whether these reference costs affect the electricity consumption in the subsequent months using a probit regression analysis. The empirical results show that the residential electricity consumption for the current month is determined by the reference cost in comparison to the actual costs of the previous months. The significant role of reference costs in determining electricity consumption implies that the behaviors of the Korean residential electricity consumers can be explained by the prospect theory. Furthermore, as a policy implication, these results suggest non-price interventions for residential electricity conservation in Korea.

1. Introduction

Many societies and governments in the world have been attempting to reduce residential energy consumption because the residential sector is regarded as a major contributor to climate change, accounting for a quarter of global energy consumption and a fifth of greenhouse gas emissions in 2019 [1]. In line with global efforts, Korea has also been making efforts to reduce residential energy consumption, which has grown at a significant rate of about 1.7% from 2013 to 2022 [2]. Recently, the Korean government focused on residential electricity conservation measures because the share of electricity in total residential energy consumption is the second largest. According to the IEA Data Service [3], the second largest share of the electricity has remained firmly at the level of 30% from 2013 to 2022, following natural gas (47%) and significantly higher than other sources, such as coal (1%), oil products (10%), geothermal (1%), heat (10%), biofuel, and others (1%).
The key policy measure for encouraging residential electricity conservation in Korea, among others, is a block pricing system, known as a tiered pricing system, which charges residential consumers higher rates for electricity as the amount consumed, set by a block (tier), increases. Although the block pricing system in Korea was reformed in 2017 (6 levels and 11.7 times before 2017; 3 levels and 3 times after 2017), the pricing system has been typically used by policymakers for residential electricity conservation. The underlying belief of policymakers regarding the pricing system for a long time in Korea is that the Korean households are assumed to be “homo economicus”, who make perfectly rational decisions about their economic choices, as neoclassical economics also assumes. In other words, it is strongly assumed that electricity consumption is determined by economic factors, since they are perfectly rational to achieve optimal utility maximization. However, recent studies highlight that residential electricity consumers are not sufficiently rational; their consumption is influenced by various cognitive anomalies, such as loss aversion ([4,5]), limited attention ([6,7]), social preference ([8,9]), and so on ([10]). Therefore, to properly manage residential electricity consumption with the existing block pricing system, it is essential to understand whether the consumers’ cognitive anomalies play a significant role in determining their electricity consumption in Korea.
Accordingly, this paper considers the reference costs of Korean electricity consumers and tests a hypothesis that electricity consumption for a current period is determined by the consumer’s reference costs, compared to the actual costs of previous months. In the field of behavioral economics, the reference cost is referred to a baseline cost used to evaluate potential outcomes, classifying them as gains or losses ([11]). We hypothesize that the reference cost of residential electricity consumers is a key influence in their decisions on their electricity consumption rather than its absolute costs. To identify the reference cost of each household, we construct six kinds of reference costs, which are based on the actual electricity expenditure information under the assumptions of loss aversion and limited attention. The empirical results from a probit model analysis using a unique dataset on 1040 Korean households’ energy survey show that the consumers reduced electricity consumption in the current months as the actual costs of electricity consumption had been higher than their reference costs in previous months.
The primary implications and contributions of the empirical results are as follows: First, this paper fills the gap in existing literature on residential electricity consumption patterns. Little is known about the cognitive decision-making regarding residential electricity consumption in existing research. Our results establish the first stepping stone toward recognizing that reference-dependent preferences prevail in the energy domain. Second, our results enable a better understanding of the pattern of Korean residential electricity consumption from the perspective of prospect theory ([11]). This better understanding highlights the need to supplement most of the existing research perspectives based on the assumption of neoclassical economics that economic decision-makers are perfectly rational. Third, for residential electricity conservation, the results encourage the policymakers to design non-price interventions, which have been relatively fewer than price interventions, such as tariffs, subsidies, etc. Since it is found that the electricity consumption is affected by the reference costs, a social campaign that can affect the reference costs is recommended as an effective non-price intervention for achieving the national goal of energy conservation.
The remainder of this paper is organized as follows. Section 2 briefly reviews the existing literature to highlight the differences and needs of this paper. Section 3 explains the theoretical background, empirical modeling, and the data to demonstrate the adequacy of our methodology. Section 4 presents the empirical results. Section 5 summarizes the conclusions and suggests key implications.

2. Literature Review

Vast strands of literature on residential electricity consumption patterns and their determinants have been addressed by standard economics. These are based on the neoclassical assumption that consumers are rational decision-makers, and the determinants of their electricity consumption are socioeconomic factors (income level, family size, education level, etc.), dwelling physical factors (age of building, energy-efficient systems, etc.), climate factors (cooling and heating degrees), and external shocks (COVID-19, financial crisis, etc.) [12,13,14,15]. The effect of these standard factors on electricity consumption has been proved to support the conventional economics theory.
Yet, only a few of the studies have dealt with the consumer’s cognitive features in the domain of energy consumption. Allcott and Mullainathan [16] pointed out the limited attention of the energy consumers, which played a significant role in determining consumption conservation. The difficulty of accurately calculating the unit price of energy usage (or quantity consumed) causes the energy consumers to pay limited attention to the costs reported in the billing statements. Ito [17] also noted the cognitive bias of energy consumers by revealing that US residential electricity consumers considered average cost instead of marginal cost for determining their individual consumption because the cost structure is so complex that consumers hardly calculate accurate costs, which is in contrast with the rational choice economics theory. As another consumer’s behavioral feature, several studies highlighted the social preference consumption [8,9,18]. These studies found that individual electricity consumption is determined by the information on his/her neighbor’s consumption, which is different from the conventional economics theory that states individual consumption is determined by individual preference.
Basically, the studies on cognitive features of energy consumers stem from the behavioral economics research on reference-dependent preferences of the prospect theory. Prospect theory states that the carriers of a utility are determined by gains and losses, which are measured relative to reference points [11]. This theory explains loss aversion, as an asymmetric value function based on the reference point results in losses’ looming larger than gains. Therefore, when considering the prospect theory in an individual energy consumer’s utility, it is necessary to examine a hypothesis that the utility is separated into an energy consumption utility part and gain-loss utility part, and how the gain-loss part functions. No one has ever attempted to study this hypothesis, and this paper fills the gap in the existing research.
One important question in the existing literature on reference-dependent preference arises from how reference points are formulated and measured [19]. Growing research on this question suggests that various reference points, such as status quo, norms, social comparisons, aspirations, goals, expectations, and past consumption can alter the amount of current consumption [20,21,22]. These various points can be generally categorized into two types: endogenous reference points and exogenous reference points.
The limited attention mentioned above, in fact, was developed from the field of psychological research. A long series of psychological studies has indicated that the limited attention of human is related to heuristics and perceived biases in numerical cognition. For example, the left-digit anchoring effect is well known to explain how judgments of numerical differences are centered on the leftmost digits, and the precision effect is widely cited to explain the influence of the representativeness of digit patterns on magnitude judgments. Thomas and Morwitz [23] also stated that larger magnitudes are usually rounded and thus have many zeroes, whereas smaller magnitudes are usually expressed as precise numbers. In economics literature, these rules of thumb are captured by introducing the role of attention in decision-making to propose a simple model of inattention with price-value functions [24]. Later, subsequent economics studies used the simple model of inattention to provide empirical evidence [25].
Overall, our literature review finds a lack in existing literature on residential electricity consumption patterns and their determinants. First, few studies have addressed cognitive features, such as reference-dependent preferences and loss aversion attitudes. Since these features, based on the prospect theory in the field of Behavioral Economics, have not been applied to electricity consumption research, our approach in applying the theoretical concept to explain the residential electricity consumption behavior patterns is novel. Second, because no one has ever tested measuring reference points in residential electricity consumption, we attempt to suggest six types of reference points that can explain the consumption pattern, as the prospect theory argues. Lastly, there has been no empirical evidence on the reference dependence and loss aversion in residential electricity consumption in the case of Korea. Our empirical result contributes to filling the gap by suggesting relevant policy implications, specifically on the non-price interventions.

3. Method: Theoretical Background, Data, and Statistical Model

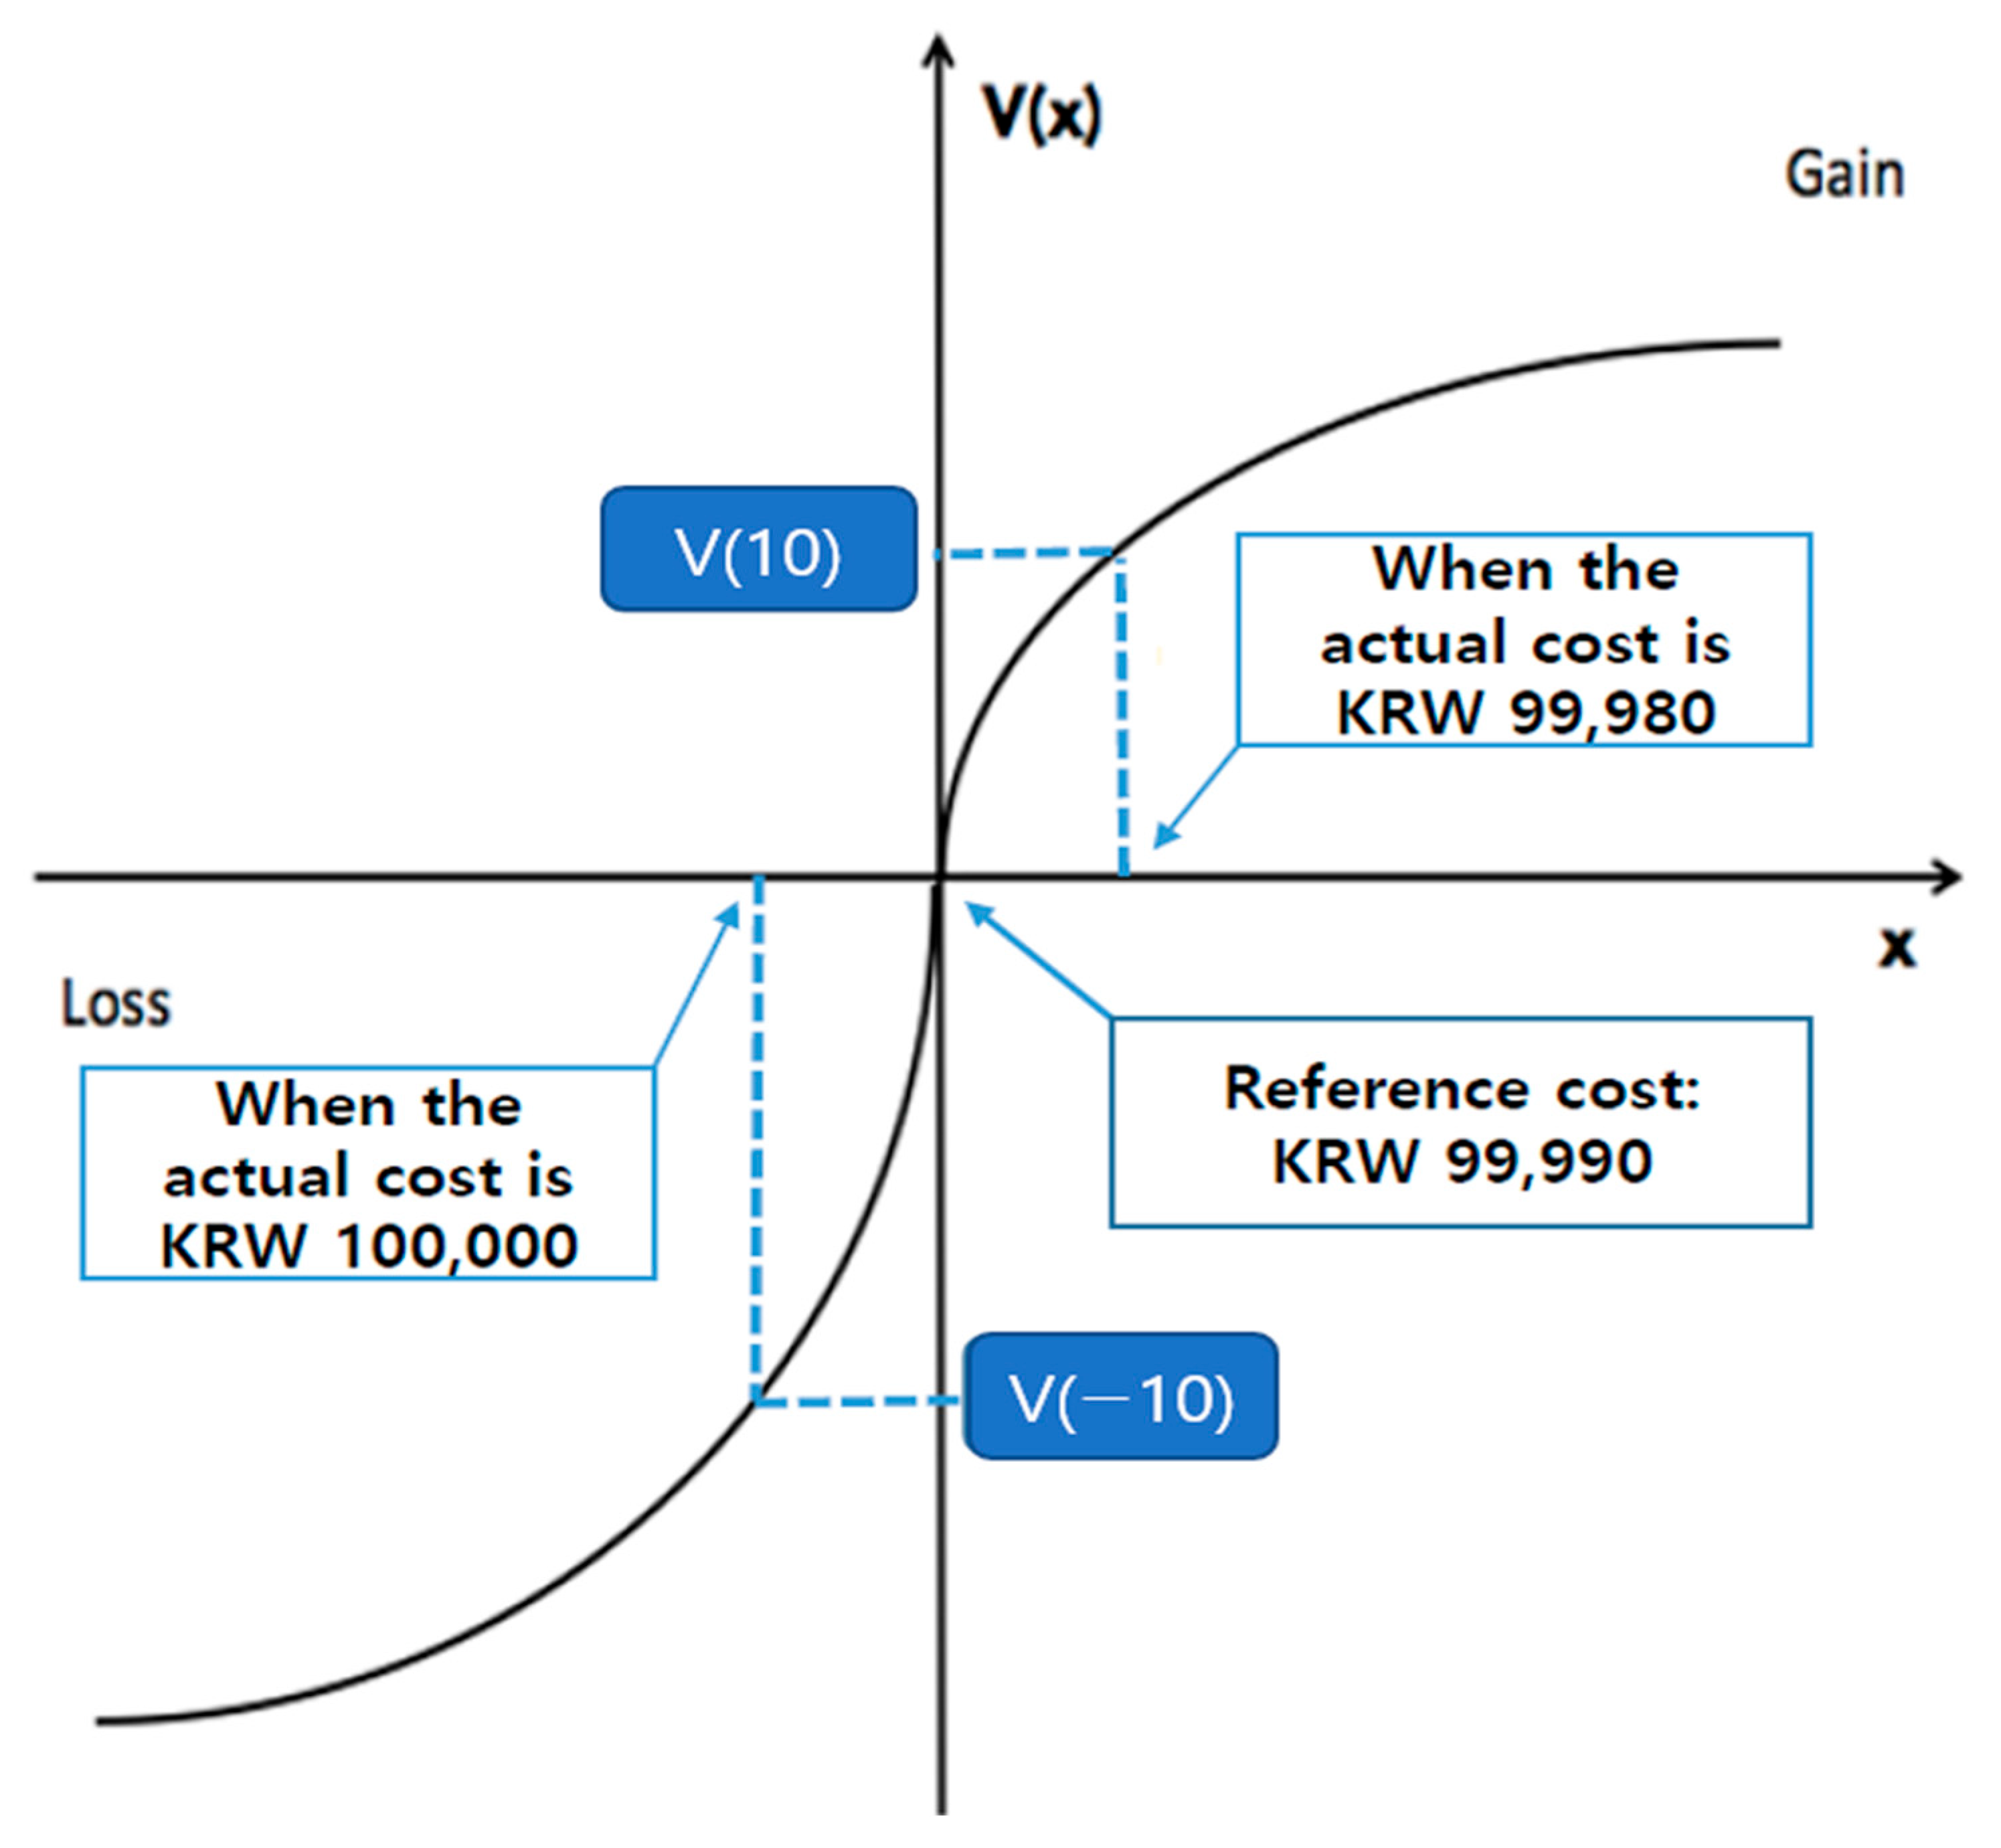
3.1. Theoretical Concept and Framework

Reference-dependent preference stems from the prospect theory, stating that the total utility of an individual for a unit of consumption can be divided into two parts: standard consumption utility and gain-loss utility [11]. The gain and loss are measured by their asymmetric value function with the reference points, which are also referred to as reference costs. By applying the theoretical concept to the residential electricity consumers, as prior studies suggested [21,26], we set up the total utility of a residential electricity consumer with respect to reference-dependent preference as follows:
U K W ,   C o s t K W r ,   C o s t r = ( u 1 K W + u 2 C O S T c o n s u m p t i o n   u t i l i t y ) + η R K W ,   C o s t K R r ,   C o s t r g a i n l o s s   u t i l i t y
The gain-loss utility in the Equation (1) is explained as the following Equation (2). K W r and C o s t r denote the reference points for energy usage and energy costs, respectively. λ 1   and λ 2 represent the degree of loss aversion in each dimension. η is a weight between consumption utility and gain-loss utility. I is an indicator function to show whether actual energy costs are less than the reference point. More details on the indicator, such as how to identify it, are provided in the following Section 3.3.
R K W ,   C o s t K W r ,   C o s t r = I K W K W R < 0 λ 1 v 1 K W v 1 K W R + I K W K W R 0 v 1 K W v 1 K W R + I C o s t C o s t R < 0 λ 2 v 2 C o s t v c o s t R   + I C o s t C o s t R 0 ( v 2 C o s t v 1 c o s t R )
One important question arises in how reference points are formulated and determined. We discuss this question and suggest possible ways to measure it in the following Section 3.3.
The other remaining question is to discuss the theoretical background of why the consumers have limited attention in the decision-making process. A large body of psychological and economic research suggests heuristic bias in numerical cognition as a primary reason. In this paper, we discuss two specific effects of numerical cognition biases: the left-digit effect and the precision effect. These two effects of using partial numbers in place of full information result in the round number bias, the ignoring of small numbers, and left-digit bias (see Figure A1 in the Appendix A). These are attributed mainly to inattention during the encoding process resulting from an intention to minimize their cognitive effort when processing numbers from left to right, or during the memorization of numbers using cognitive reference points, or when placing the highest priority on the leftmost digit, followed by the second leftmost digit. More details on quantifying these effects are suggested in Section 3.3.

3.2. Data

We use unique household-level electricity consumption data, obtained from the Korea Energy Economics Institute (KEEI) under a confidentiality agreement. KEEI is the government-sponsored research institute under the Prime Minister’s Office of the Republic of Korea. The dataset consists of household-level monthly electricity usage (or quantity consumed) and cost information from 2010 to 2014, along with demographic information gathered from surveys. Since the billing data from the Korea Electric Power Corporation (KEPCO) do not include billing costs or demographic information, KEEI hired interviewers to visit households and collect each household’s responses to the survey questions.
The survey questions included (1) 13 questions on “Basic Information on Housing”, such as house type, area of livable space, number of windows, and direction of living room windows; (2) 7 questions on “Family Information”, such as number of family members, annual household income, and number of cars; (3) 9 questions on “Ways for Heating, Cooling, and Cooking”, such as the primary method used for cooling and heating, supplemental methods for cooling and heating, and primary energy source for cooking; (4) 36 questions on “Energy Appliances”, such as number of air conditioners and number of TVs and computers; (5) 20 questions on “Energy Consumption”, such as electricity, gas, coal, and petroleum; (6) 52 questions on “Motors and Vehicles Driving Information”, such as main driver’s demographic information, displacement, and mileage. In particular, the 20 questions on “Energy Consumption” include “Write down the electricity consumed for each month”. To answer this question, the households were required to check their monthly electricity billing statements again. When they did not have the statements, they were required to allow the KEEI to retrieve their consumption records from the KEPCO instead. The retrieved consumption data were confirmed by the households. The process of surveying the monthly consumption enables the assumption that the households were sufficiently aware of the historical patterns of monthly electricity consumption and costs during the surveying years.
We convert each household consumption record into a cost by matching it with the pricing tables used in KEPCO from 2010–2014, as shown in Table 1. In South Korea’s block pricing system for residential electricity consumption, the “base rate” refers to the fixed, recurring cost for having an electricity connection, while the “running rate” is the variable cost per kilowatt hour (kWh) of electricity consumed. The block pricing system in Korea means the price per kwh charged is based on the quantity consumed, with different rates for different consumption blocks. For example, if a household consumed 500 KWh, the billing amount was 90,570 Korean Won (KRW) because the total charge was calculated as the sum of the base rate (=6060) and all the running charges for each block (84,510 = [57.6 × 100] + [98.9 × 100] + [147.3 × 100] + [215.6 × 100] + [325.7 × 100]). The running rates in block 6 were almost 10 times higher than those in block 1. No other countries in the world were found to be employing the 6-stage block-increasing system, which even shows a tenfold difference between the minimum and maximum stage. During the same time period, Japan implemented a 3-stage system with a 1.4 times increase, China employed a 3 stage system with a 1.5 times increase, and India also used a 3-stage system but with a 1.7 times increase. Compared to other countries, Korea had a very complex pricing system for residential electricity consumption. Such an escalating block-tariff system in Korea shows that Korea ever used price interventions as the key policy tool for managing residential electricity consumption, in contrast to neighboring countries, such as China and Japan.
As a ready for analysis dataset, we subsequently built a monthly dataset for 1040 households from 2011 to 2014, covering electricity consumption, electricity billing costs, and energy-related personal variables such as income and household size, as well as temperature variables such as Heating Degree Days (HDDs) and Cooling Degree Days (CDDs).

3.3. Empirical Modelling: Relevant Variables and a Probit Model

This section considers substantial heterogeneity in reference costs among households concerning their allocated attention to energy costs. If heterogeneous reference costs exist, each reference cost may or may not yield reference-dependent energy consumption. Thus, the identification of underlying energy consumption behavior starts from figuring out possible reference costs and their effects on energy consumption separately.
It is necessary to suggest further explanations about the reference cost of individual households. First, it is basically assumed that the reference cost of each individual household was constructed by a variety of psychological anomalies, such as loss aversion, heuristics, status quo, social preference, and so on, as a long strand of behavioral economics research argues. According to this assumption, we consider that the heterogeneous reference costs existed in the utility function of each household, as Equations (1) and (2) displayed above. In addition, the process of surveying the monthly electricity consumption for our dataset improved the energy literacy of the households during the surveying period, which was expected to contribute to shaping more precisely the reference costs of the sample households during the sample period, 2010–2014. The important point is that the process of surveying electricity consumption was not the major factor in constructing their reference costs but played a role as a more favorable situation in reminding their reference cost compared with other household-level datasets that do not have the confirmed process of surveying. Second, our next mission on the reference cost was how to measure the heterogeneous reference cost underlying the individual household electricity consumption utility. To quantify the reference costs of individual households, we selected limited attention anomalies, such as the left-digit effect and the precision effect, among various psychological anomalies. Specifically, electricity consumers who have the reference cost with the limited attention on the leftmost digit of their previous costs would reduce electricity consumption when the cost increased from KRW 19,000 to KRW 20,000 but would not reduce it when the cost increased from KRW 20,000 to KRW 21,000, even though the same cost change, KRW 1000, occurred; thus, we regard these people as the consumers with a reference cost reflecting the left-digit effect. In the case of electricity consumers with a reference cost reflecting the precision effect (i.e., ignoring 3 digits from the rightmost digit), it is assumed that their consumption would not respond to the cost changes from KRW 20,000 to 20,999 because they do not regard any changes in the costs from KRW 0 to 999. Therefore, according to the assumptions for constructing the reference costs reflecting their attention levels on previous costs, it is presumable that the reference costs are heuristic rather than perfectly rational entities, as we use two psychological anomalies to measure heterogeneous reference costs for each household in our dataset.
Therefore, to determine these two rules (left-digit effect and precision effect) by which reference costs are formulated and updated, we suggest five simple methods for measuring the reference costs ( c o s t R ) based on their previous cost information as the follows: (1) leftmost digit, represented as c o s t L 1 R (for example, c o s t L 1 R becomes 300,000.0 when the actual costs are between 300,000.0 and 399,999.9); (2) first and second left digit, represented as   c o s t L 2 R (for example, c o s t L 2 R becomes 350,000.0 when the actual costs were between 350,000.0 and 359,999.9), (3) first, second and third left digits, represented as c o s t L 3 R (for example, c o s t L 3 R becomes 355,500.0 when the actual costs are between 355,000.0 and 355,999.9), (4) rounding up in the fourth digit from the leftmost digit represented as c o s t L 4 R (for example, c o s t L 4 R becomes 355,000.0 when the actual costs are between 354,500.0 and 354,999.9); (5) ignoring 3 digits from the right-most digit, represented as C o s t N 3 R R (for example, c o s t N 3 R R becomes 355,500.0 when the actual costs are between 355,500.0 and 355,599.9). In addition, we consider full digit costs as the exact information, which is represented as c o s t F R . The full digit reference costs are expected to check whether the exact information on their past costs functioned as a reference in deciding current electricity consumption to avoid loss. To capture the basics of accumulation on previous billing information to update their reference costs, we tested the reference costs generated by averaging different durations of previous months: (1) two months, (2) three months, and (3) six months. For example, the average c o s t R for the previous two months is calculated by c o s t t R = ( c o s t t 1 R + c o s t t 2 R ) ¯ . Accordingly, the reference costs for previous three months are calculated from t−1 to t−3, and for previous six months are from t−1 to t−6. Although all the types of the reference costs used for our analysis are quite simple, but we expect these variables to generate intuitive results that people tend to change current electricity consumption as their reference costs formulated by their previous experiences and behaviors while considering of heuristic anomalies (the left-digit and the precision effect) differ from the actual current costs. When assuming that the difference between the actual current cost and the reference cost is loss, all six types of reference costs are useful for testing a hypothesis that loss aversion in households affects electricity consumption.
In addition to the reference cost variables, we consider the socioeconomic variables as well as the climate variables, which are widely accepted as the standard variables of a household’s electricity consumption model. Table 2 shows a summary of statistical description for each variable. The total observations for all the variables are 49,920 (=1040 households × 12 months × 4 years) for each variable, and the mean value of electricity consumption indicates 275.8 KWh, which is close to about 300 KWh (the average of residential electricity usage for a 3-member family size in 2017 [9]). All statistical values of these variables are near the national average, although there are several households that reported no electricity consumption, as these households may have left their dwellings empty for an entire month to travel.
Consequently, to address how each reference cost generates a reference effect, we use a probit model to measure the probability of decreasing energy consumption by comparing energy usage (KWs) in the current month, t , to KWs in the previous month, t 1 , as shown in the following Equation (3). A latent variable y i t   indicates the probability of a decrease in energy consumption. If each consumer, i , at month t decreases his or her energy consumption compared to the previous month t 1 , then we assign y i t   = 1 in the probit regression Equation (3). Two indicator functions,   I c o s t and I k w , represent the effects on reference levels of energy cost and energy consumption, respectively:
Pr y i t = 1 = Φ [ β 1 I c o s t c o s t i t > c o s t R + β 2 I k w k w i t > k w t R ] + X i t β + ε i t
In the Equation (3), Φ   is the standard normal cumulative distribution function. Specifically, the latent variable y i t =1 i f   c o s t i t c o s t i t 1 < 0 , a decrease in energy consumption relative to the previous month, while y i t = 0   i f   c o s t i t c o s t i t 1 > 0 . I c o s t c o s t i t > c o s t R is an indicator function when it is equal to one when the current energy cost is greater than the reference level of energy cost, while I k w [ k w i t > k w t R ] captures the reference effect on energy consumption. X i t is a vector of the variables to control both socioeconomic effects and climate effects on the consumption, as shown in Table 2. Lastly, k w t R is a reference consumption level is measured as k w t R =   ( k w t 1 + k w t 2 + k w t 3 ) ¯ ; however, we did not make significant consideration of its variation because the consumption reference points are not of primary interest in this paper.

4. Results

The estimated results of Equation (3) for comparing reference costs’ effects on the probability of decreasing energy consumption are shown in Table 3, Table 4 and Table 5. The first column shows the selected key explanatory variables of the Equation (3) with the dependent variable of a possibility of decreasing consumption of electricity. The first row displays all the created reference costs, which are, in turn, represented as C o s t R in the explanatory variable. Standard errors are provided in parentheses. According to our hypothesis, the sign of the variables (Actual Cost > the Reference Costs) is expected to be positive, meaning that households are likely to reduce electricity consumption (=the dependent variable is likely to be equal to 1) when they experience that the actual cost exceeds their reference costs. We exclude other variables in the tables, such as number of households, area of house, etc., because these have endogeneity with the income.
Signs of all the estimated coefficients in Table 2 support our hypothesis. The two reference effects of energy cost and energy usage are positive and significant at the 1% level. Previous experience on the reference effect on energy cost (loss aversion) is positive and significant at the 1% level. These positive coefficients indicate that the probability of decreasing energy consumption is relevant with reference-dependent preferences from the prospect theory [11]. The climate variables are consistent with the conventional expectation. All the signs of Cooling Degree Days and Heating Degree Days are statistically significantly estimated to be negative, meaning that households increase electricity consumption (=the dependent variable is likely to be equal to 0) as the number of these days increases. Additionally, Cooling Degree Days are slightly more sensitive than Heating Degree Days because residential cooling energy depends more on electricity than heating in Korea.
We also examine the impact of the length of months on the accumulation of reference costs in Table 4 and Table 5, using average reference costs from three and six months. Table 4 and Table 5 exhibit the estimated results from all candidates for reference energy costs, which are identical to those in Table 3. The results are identical to the previous estimation. Both the reference effect and prior reference effect on reference costs are positive and significant at the 1% level. However, the explanatory power becomes stronger when consumers retain a few digits from the leftmost digit as the reference costs, relative to the results in Table 3, considering the Akaike Information Criterion (AIC) and McFadden’s Pseudo in Table 4 and Table 5, respectively.

5. Conclusions

This paper provides empirical evidence on reference-dependent behavior of residential electricity consumers through a probit model with a unique Korean survey dataset. The evidence indicates the existence of loss aversion concerning all six types of the reference costs generated by their various attention levels. First, three reference costs reflecting the left-digit effect, c o s t L 1 R , c o s t L 2 R , and c o s t L 3 , R significantly affected the current electricity consumption, implying that the reference cost formulated by limited attention on the left digits of the previous costs played a role in deciding electricity consumption. Second, two reference costs reflecting the precision effect, c o s t L 4 R and C o s t N 3 R R also significantly affected the current electricity consumption, implying that the reference cost formulated by inattention to the small numbers of the previous costs plays a role in deciding electricity consumption. Third, it was found that the full digit reference cost, c o s t F R , affected the electricity consumption, which showed that people used their past experience or behavioral pattern for deciding their current electricity consumption. Overall, we identified their reference-dependent preferences in energy consumption regardless of how they are formulated and updated, which supports the prospect theory [11].
This paper contributes to the recent research on energy economics and behavioral economics. Behavioral theories such as loss aversion, reference-dependent preferences, and consumer attention in energy consumption may not be considered normative policy decisions. In particular, our results provide novel insights. First, we showed that residential energy consumption was heavily related to reference-dependent preferences while taking into consideration diverse reference points obtained from various levels of attention. Second, it is expected that learning or experience could alter a focus of attention between energy costs and usage (quantity consumed) because the relationship between different levels of loss aversion based on experience could shift in the allocation of attention. So, switching attention could result in differential attention, creating a “rebounded effect” relative to reference costs and usage (quantity consumed).
Our analysis provides significant implications for policy dependent on being able to predict a consumer’s demand response. First, understanding a consumer’s behavior in energy consumption due to his or her reference-dependent energy consumption is sufficient in place of knowing a consumer’s true demand response. Demand responsiveness may be a necessary criterion for the efficient operation of electricity and the adaptation of new programs. In particular, many consumers still fail to take noticeable steps toward energy efficiency and conservation in various intrinsic and extrinsic motivations such as moral suasion and monetary incentives [27]. Second, non-price interventions can be effective measures for residential electricity conservation. For example, a conservation goal-setting campaign in a small society, which enables the consumers to experience loss aversion, can be a start to national energy conservation. Third, it is necessary to frame dynamic pricing as avoidable losses for residential electricity consumers in South Korea. In fact, KEPCO has developed the home energy system “Advanced Metering Infrastructure (AMI)” and is encouraging households to install the system. The household that installed the AMI can check his/her real-time electricity consumption and costs, which enables responding immediately to the information. Considering that Korean electricity consumers have loss aversion preference, the system needs to send the message emphasizing loss-avoiding instead of loss increasing. For instance, Korean electricity consumers are more likely to reduce consumption immediately when they receive the message “You can avoid extra changes by shifting your use to off-peak hours” instead of “You will pay more costs while you are using during this peak-hours”. Further, since our empirical results show that the Korean consumers compare the actual dynamic costs with a reference cost, it is necessary to inform deviations from individual reference points at losses or gains through the system, which enables households to manage their own consumption. Overall, our investigation accounts for the complex interaction of internal (psychological behavior and bounded rationality) and external (energy policy and program) factors in energy consumption and guides the improvement of residential energy conservation policy.
Despite the meaningful empirical results and implications, there still exist some limitations in our study and needs for further study. First, since the purpose of our analysis is to estimate whether the consumption itself is reduced or not when the reference cost is lower than the actual cost, not to estimate an elasticity or responsiveness. So, our results show that reference-dependent behavior significantly exists, instead of showing a change rate of the behavior. To estimate an elasticity or responsiveness of the consumption, a further study is needed by developing a new empirical model that better fits with the raw consumption data based on a unit of kilometers. Elasticity estimation results can be displayed by plotting the demand curve, which helps responsive patterns of residential electricity consumption to their reference costs. Second, our analysis sheds light on the role of energy literacy of residential energy consumers in explaining different attention on energy costs. By developing more rigorous methodology, a further study is needed to uncover that energy literacy leads to more attention on energy costs, resulting in more loss aversion in energy consumption, as the positive relationship between energy literacy and energy conservation has been found [28]. Third, the survey questionnaire needs to be developed for constructing a variety of variables. Our empirical results showed that the income level did not significantly explain the reference costs. However, we have a suspicion that alternative income variables, such as a budget constraint on energy costs, could significantly explain it. To construct alternative variables, the survey questionnaire needs to include a variety of questions. Fourth, it is widely accepted that using home energy-efficient appliances significantly reduces residential electricity consumption and costs [29]. Due to data limitations on energy-efficient appliances during the surveying years 2010–2014, we will examine as a further study how energy-efficient appliances affect reference-dependent behaviors for the later years 2018–2022, when the survey questionnaire systematically generated the data. Fifth, from the perspective of econometrics, it is important to study whether any technical differences exist among several econometric models, such as the probit model, logit model, nonparametric panel regression model, etc. Future research is needed to address several issues regarding advanced empirical methodology, such as more precise reference costs, autocorrelation-controlled panel-data models, appropriate proxies for the left-digit bias, and closer-to-home surveys by Korean government organizations.

Author Contributions

Conceptualization, J.P. and S.C.; methodology, J.P.; validation, J.P.; formal analysis, J.P.; resources, S.C.; data curation, S.C. and J.P.; writing—original draft preparation, J.P. and S.C.; writing—review and editing, S.C. and J.P.; project administration, S.C. and J.P.; funding acquisition, S.C. All authors have read and agreed to the published version of the manuscript.

Funding

This work was supported by the Ministry of Education of the Republic of Korea and the National Research Foundation of Korea (NRF-2024S1A5A2A01029162).

Data Availability Statement

The data presented in this study are available on request from the corresponding author due to privacy and legal and ethical reasons.

Acknowledgments

The authors appreciate the Korea Energy Economics Institute for not only allowing the data used for this analysis but also developing the open-data platform at the KESIS website (https://www.kesis.net/main/main.jsp (accessed on 1 May 2025)).

Conflicts of Interest

The authors declare no conflicts of interest.

Appendix A

Figure A1. Loss aversion and inattention bias (left-digit effect or the precision effect): According to the value function [11], the loss generated by the actual cost at KRW 100,000 is greater than the gain generated by the actual cost at KRW 99,980 although two actual costs have the identical difference, 10, from the reference cost at KRW 99,990. The left-digit effect argues that people with the reference cost at KRW 99,990 are highly like to reduce the consumption when the first digit of the actual cost changes from 9 to 10.
Energies 18 02686 g0a1

References

  1. Gozales-Torres, M.; Perez-Lambard, L.; Coronel, J.F.; Maestre, I.R.; Pablo, B. Activity and Efficiency Trends for the Residential Sector across Countries. Energy Build. 2022, 273, 112428. [Google Scholar] [CrossRef]
  2. Statistics of Korea. Available online: https://www.index.go.kr/unity/potal/main/EachDtlPageDetail.do?idx_cd=2781 (accessed on 25 February 2025).
  3. IEA Data Services. Available online: https://www.iea.org/countries/korea/efficiency-demand (accessed on 25 February 2025).
  4. Spurlock, A.C. Loss-Aversion and Time-Differentiated Electricity Pricing. Lawrence Berkeley National Laboratory, Contract No. DE-AC02-05CH11231 with the U.S. Department of Energy. 2015. Available online: https://www.osti.gov/servlets/purl/1248927 (accessed on 3 March 2025).
  5. Ghesla, C.; Grieder, M.; Schmitz, J.; Stadelmann, M. Pro-Environmental Incentives and Loss-Aversion: A Field Experiment on Electricity Saving Behavior. Energy Policy 2020, 137, 111131. [Google Scholar] [CrossRef]
  6. Keefer, Q.; Rustamov, G. Limited Attention in Residential Energy Markets: A Regression Discontinuity Approach. Empir. Econ. 2018, 55, 993–1017. [Google Scholar] [CrossRef]
  7. Curley, C.; Rustamov, G.; Harrison, N.; Venable, M. Susceptibility to Inattention: Unpacking Who is Susceptible to Inattention in Energy-Based Electronic Billing. Rev. Policy Res. 2020, 37, 744–764. [Google Scholar] [CrossRef]
  8. Allcott, H. Social norm and energy conservation. J. Public Econ. 2011, 99, 1082–1095. [Google Scholar] [CrossRef]
  9. Choi, S.; Denzau, A.; Hwang, S. Do Households Conserve Electricity When They Receive Signals of Greater Consumption than Neighbours? The Korean case. Energy 2021, 225, 120292. [Google Scholar] [CrossRef]
  10. Mutumbi, U.; Thondhlana, G.; Ruwanza, S. The Status of Household Electricity Use Behaviour Research in South Africa between 2000 and 2022. Energies 2022, 15, 9018. [Google Scholar] [CrossRef]
  11. Kahneman, D.; Tversky, A. Prospect Theory: An Analysis of Decision under Risk. Econometrica 1979, 47, 263–291. [Google Scholar] [CrossRef]
  12. Zhang, Y.; Ma, W.; Du, P.; Li, S.; Gao, K.; Wang, Y.; Liu, Y.; Zhan, B.; Yu, D.; Zhang, J.; et al. Powering the Future: Unraveling Residential Building Characteristics for Accurate Prediction of Total Electricity Consumption during Summer Heat. Appl. Energy 2024, 376, 124146. [Google Scholar] [CrossRef]
  13. Karatasou, S.; Santamouris, M. Socio-economic Status and Residential Energy Consumption: A Latent Variable Approach. Energy Build. 2019, 198, 100–105. [Google Scholar] [CrossRef]
  14. Zhang, S.; Guo, Q.; Smyth, R.; Yao, Y. Extreme Temperatures and Residential Electricity Consumption: Evidence from Chinese Households. Energy Econ. 2022, 107, 105890. [Google Scholar] [CrossRef]
  15. Soava, G.; Mehedintu, A.; Sterpu, M.; Grecu, E. The Impact of the COVID-19 Pandemic on Electricity Consumption and Economic Growth in Romania. Energies 2021, 14, 2394. [Google Scholar] [CrossRef]
  16. Allcott, H.; Mullainathan, S. Behavioral Science and Energy Policy. Science 2010, 327, 1204–1205. [Google Scholar] [CrossRef]
  17. Ito, K. Do Consumers Respond to Marginal or Average Price? Evidence from Nonlinear Electricity Pricing. Am. Econ. Rev. 2014, 104, 537–563. [Google Scholar] [CrossRef]
  18. Jachimowicz, J.M.; Hauser, O.; O’Brien, J.; Sherman, E.; Galinsky, A.D. People Use Less Energy When They Think Their Neighbour’s Care About the Environment. Harvard Business Review. 2019. Available online: https://hbr.org/2019/01/research-people-use-less-energy-when-they-think-their-neighbors-care-about-the-environment (accessed on 25 February 2025).
  19. Gill, D.; Prowse, V. A Structural Analysis of Disappointment Aversion in a Real Effort Competition. Am. Econ. Rev. 2012, 102, 469–503. [Google Scholar] [CrossRef]
  20. Heath, C.; Larrick, R.P.; Wu, G. Goals as Reference Points. Cogn. Psychol. 1999, 38, 79–109. [Google Scholar] [CrossRef]
  21. Kőszegi, B.; Rabin, M. A Model of Reference-Dependent Preferences. Q. J. Econ. 2006, 121, 1133–1165. [Google Scholar]
  22. Chetty, R.; Szeidl, A. Consumption Commitments: A Foundation for Reference-Dependent Preferences and Habit Formation. Econometrica 2016, 84, 855–890. [Google Scholar] [CrossRef]
  23. Thomas, M.; Morwitz, V. Penny Wise and Pound Foolish: The Left-Digit Effect in Price Cognition. J. Consum. Res. 2005, 32, 54–64. [Google Scholar] [CrossRef]
  24. DellaVigna, S. Psychology and Economics: Evidence from the Field. J. Econ. Lit. 2009, 47, 315–372. [Google Scholar] [CrossRef]
  25. Lacetera, N.; Pope, D.G.; Sydnor, J.R. Heuristic Thinking and Limited Attention in the Car Market. Am. Econ. Rev. 2012, 102, 2206–2236. [Google Scholar] [CrossRef]
  26. Crawford, V.P.; Meng, J. New York City Cab Drivers’ Labor Supply Revisited: Reference-Dependent Preferences with Rational-Expectations Targets for Hours and Income. Am. Econ. Rev. 2011, 101, 1912–1932. [Google Scholar] [CrossRef]
  27. Ito, K.; Ida, T.; Tanaka, M. Moral Suasion and Economic Incentives: Field Experimental Evidence from Energy Demand. Am. Econ. J. Econ. Policy 2018, 10, 240–267. [Google Scholar] [CrossRef]
  28. Appiah, K.M.; Gyening, K.E.; Teye, K.P.; Frimpong, C.; Nsowa, A. The Implications of Energy Literacy on energy Savings Behavior: A Model of Contingent Effects of Energy Value and Attitude. Energy Rep. 2023, 10, 72–85. [Google Scholar] [CrossRef]
  29. Mizobuchi, K.; Takeuchi, K. Replacement or Additional Purchase: The Impact of Energy-Efficient Appliances on Household Electricity Saving under Public Pressures. Energy Policy 2016, 93, 137–148. [Google Scholar] [CrossRef]
Table 1. The base and running rates per block in Korea during 2010–2014.
Block123456
Quantity Consumed
(KWh)
≤100101–200201–300301–400401–500Over 500
Base
Rate
(KRW)
41073012603170606010,760
Running Rate
(KRW)
57.698.9147.3215.6325.70574.6
Source: Korea Electric Power Company (https://online.kepco.co.kr/PRM025D00 (accessed on 1 May 2025).
Table 2. Summary of statistical description for selected key variables.
VariablesObs.MeanStd.Min.Max.
Electricity Consumption49,920275.80106.5002122
Electricity Cost49,92037,929.332,239.101,164,269.7
Area of House (Dwelling) 149,92019.1911.70155
Number of Households49,9202.991.2518
Income 249,9203.031.4519
Heating Degree Days49,920234.3248.70780.7
Cooling Degree Days49,92069.2594.870300.6
1 The Korean measurement unit for the area of a house, which is called “Pyung” in Korean and is equivalent to 35.583 square feet. 2 The level of income.
Table 3. The effect of possible reference costs from the accumulation of the previous two months.
Explanatory Variables When   C o s t R is Represented as One of the Followings,
C o s t F R C o s t L 1 R C o s t L 2 R C o s t L 3 R C o s t L 4 R R C o s t N 3 R R
Actual Cost > C o s t R 1.978 **1.465 **1.858 **1.985 **1.956 **1.929 **
(0.024)(0.023)(0.022)(0.023)(0.023)(0.022)
Actual KW > k w t R 1.260 **1.390 **1.238 **1.157 **1.171 **1.181 **
(0.029)(0.016)(0.025)(0.027)(0.027)(0.026)
Cooling Degree Days−0.002 **−0.003 **−0.002 **−0.002 **−0.002 **−0.002 **
(0.000)(0.000)(0.000)(0.000)(0.000)(0.000)
Heating Degree Days−0.001 **−0.001 **−0.001 **−0.001 **−0.001 **−0.001 **
(0.000)(0.000)(0.000)(0.000)(0.000)(0.000)
Annual Income−0.009−0.01 *−0.007−0.006−0.0060.005
(0.006)(0.005)(0.006)(0.006)(0.006)(0.006)
Constant−2.378 **−1.669 **−2.111 **−2.274 **−2.163 **−2.166 **
(0.051)(0.043)(0.048)(0.050)(0.049)(0.049)
Observations49,92049,92049,92049,92049,92049,920
Pseudo R20.4830.3630.4690.4770.4760.472
LR Chi233,368.525,098.632,411.832,934.732,897.032,622.1
AIC0.7160.8820.7350.7250.7260.731
BIC−504,183.2−495,913.3−503,226.4−503,749.4−503,711.7−503,436.7
* and ** means statistical significance at 95% and 99%, respectively.
Table 4. The effect of possible reference costs from the accumulation of the previous three months.
Explanatory Variables When   C o s t R is Represented as One of the Followings,
C o s t F R C o s t L 1 R C o s t L 2 R C o s t L 3 R C o s t L 4 R R C o s t N 3 R R
Actual Cost > C o s t R 1.327 **1.003 **1.308 **1.870 **1.352 **1.338 **
(0.030)(0.020)(0.026)(0.034)(0.028)(0.026)
Actual KW > k w t R 0.911 **1.334 **0.961 **0.549 **0.902 **0.949 **
(0.028)(0.017)(0.025)(0.031)(0.026)(0.025)
Cooling Degree Days−0.002 **−0.002 **−0.002 **−0.002 **−0.002 **−0.002 **
(0.000)(0.000)(0.000)(0.000)(0.000)(0.000)
Heating Degree Days−0.001 **−0.001 **−0.001 **−0.001 **−0.001 **−0.001 **
(0.000)(0.000)(0.000)(0.000)(0.000)(0.000)
Annual Income−0.003−0.008 *−0.007−0.002−0.0020.001
(0.005)(0.005)(0.005)(0.005)(0.005)(0.005)
Constant−1.562 **−1.629 **−1.580 **−1.653 **−1.560 **−1.578 **
(0.042)(0.042)(0.042)(0.043)(0.042)(0.042)
Observations49,92049,92049,92049,92049,92049,920
Pseudo R20.350.3240.3500.3770.3500.351
LR Chi224,198.522,419.724,240.326,122.724,175.924,316.8
AIC0.9000.9360.8990.8610.9000.898
BIC−49,5013.2−493,234.3−495,055.0−496,937.3−494,990.6−495,131.5
* and ** means statistical significance at 95% and 99%, respectively.
Table 5. The effect of possible reference costs from the accumulation of the previous six months.
Explanatory Variables When   C o s t R is Represented as One of the Followings,
C o s t F R C o s t L 1 R C o s t L 2 R C o s t L 3 R C o s t L 4 R R C o s t N 3 R R
Actual Cost > C o s t R 1.484 **1.602 **1.453 **1.163 **1.480 **1.470 **
(0.027)(0.017)(0.027)(0.023)(0.027)(0.027)
Actual KW > k w t R 1.192 **1.276 **1.184 **1.188 **1.181 **1.184 **
(0.017)(0.016)(0.017)(0.016)(0.017)(0.017)
Cooling Degree Days−0.003 **−0.003 **−0.003 **−0.002 **−0.003 **−0.003 **
(0.000)(0.000)(0.000)(0.000)(0.000)(0.000)
Heating Degree Days−0.001 **−0.001 **−0.001 **−0.001 **−0.001 **−0.001 **
(0.000)(0.000)(0.000)(0.000)(0.000)(0.000)
Annual Income−0.013 *−0.006 *−0.012 *−0.010−0.012 *0.011 *
(0.005)(0.005)(0.005)(0.005)(0.005)(0.005)
Constant−2.060 **−1.498 **−2.018 **−1.744 **−2.045 **−2.045 **
(0.050)(0.040)(0.045)(0.042)(0.045)(0.045)
Observations49,92049,92049,92049,92049,92049,920
Pseudo R20.3580.2890.3550.3320.3560.355
LR Chi224,780.819,999.324,585.722,997.624,634.824,568.1
AIC0.8880.9840.8920.9240.8910.893
BIC−495,595.4−490,814.0−495,400.4−493,811.3−495,449.4−495,382.8
* and ** means statistical significance at 95% and 99%, respectively.
Disclaimer/Publisher’s Note: The statements, opinions and data contained in all publications are solely those of the individual author(s) and contributor(s) and not of MDPI and/or the editor(s). MDPI and/or the editor(s) disclaim responsibility for any injury to people or property resulting from any ideas, methods, instructions or products referred to in the content.

