Article

Integrated Production and Multi-Market Optimization of Biomethane in Germany: A Two-Step Linear Programming Approach

1
Department of System Analysis and Renewable Energy (SEE), Institute of Energy Economics and Rational Energy Use (IER), University of Stuttgart, Heßbrühlstr. 49a, 70565 Stuttgart, Germany
2
Stadtwerke Stuttgart GmbH, 70327 Stuttgart, Germany
*
Author to whom correspondence should be addressed.
Energies 2025, 18(11), 2991; https://doi.org/10.3390/en18112991
Submission received: 28 April 2025 / Revised: 30 May 2025 / Accepted: 31 May 2025 / Published: 5 June 2025
(This article belongs to the Section A4: Bio-Energy)

Abstract

:
From the perspective of biogas plant (BGP) operators, it is highly challenging to make a profitable decision on optimal biomethane production and allocation across interconnected markets. The aim of this study is to analyze the dynamics of biomethane markets, develop the gas allocation portfolio (GAP) for BGPs, investigate the impact of GHG quota price on the market dynamics and substrate mix consumption, and evaluate the profitability of the biomethane market system under various demand-based scenarios. A two-step optimization approach based on linear programming is adopted. Firstly, the optimized substrate mix and corresponding GAP are determined for all BGPs. Secondly, by leveraging the options flexibility created by the interconnected nature of biomethane markets, the BGPs’ GAP is further developed. Through an in-depth sensitivity analysis, the effects of GHG quota price variations on the market dynamics are assessed. The results indicate that integrated production, obtained by implementing the improved GAP across all BGPs, maximizes the profitability of the system. At higher quota prices, the consumption of manure, residuals, and grass is encouraged, while the use of energy crops declines. Furthermore, higher quota prices lead to a substantial increase in biomethane price in the EEG market, highlighting the need for further governmental support for biomethane CHP units. The anticipated competition between hydrogen and biomethane to achieve a greater share in the heating sector could pose risks to long-term investments in biomethane. The system achieves its highest profitability, a total contribution margin of EUR 2254.8 million, under the Transport Biofuels Expansion scenario. Generally, policies and regulations that raise the quota price (e.g., the 36. BImSchV) or promote biomethane demand in the heating sector (e.g., the GEG) can provide both economic and ecological benefits to the system.

1. Introduction

Worldwide demand for biogases, encompassing both biogas and biomethane, is predicted to grow by approximately 30% between 2024 and 2030, reaching around 2270 PJ annually by 2030. Policy instruments and incentives related to demand differ considerably across countries. In several European countries, including Germany, France, Italy, Denmark, and the Netherlands, sustained policy support and industrial development have led to mature markets. In contrast, countries such as Spain and Austria are actively working to scale up their biogas production, in line with their targets of ensuring energy security, fulfilling emission reduction commitments, and accelerating the decarbonization of their energy sectors [1].

1.1. Biomethane Production and Markets in Germany

1.1.1. Status Quo

Among the clean gaseous fuels, biomethane currently makes the largest contribution to energy supply and security, and facilitates the decarbonization of industrial processes and the transport sector. In 2021, biogas and biomethane contributed 13.4% (31.3 TWh_el) to Germany’s total renewable electricity production, while also generating an additional 17.4 TWh_th of thermal energy [2]. In almost 236 of more than 9000 BGPs, biomethane is produced, reaching an aggregate volume of nearly 9.932 TWhHHV in 2023. This represented approximately 1% of the total natural gas consumption in Germany for that year. The electricity sector under the EEG requirements absorbed the majority, 72.5%, of the total biomethane volume. The transport and heating sectors and export made up 14.1%, 10.9%, and 2.5%, respectively [3].
Biomethane is currently traded in several markets in Germany. It is consumed by biomethane-CHP units operating under the EEG requirements, which impose several constraints on the biomethane production process. These include a mandatory GHG reduction target relative to a fossil reference, a cap on the share of maize in the substrate mix, and a minimum hydraulic retention time [4]. In the transport (fuel) sector, biomethane is utilized in two variants, normal and advanced fuels, which have distinct regulations concerning the production process. The difference between these two variants is that advanced biomethane is produced without the use of energy crops and grass, which can thus be counted twice towards the GHG quota in Germany in accordance with 38. BImSchV [5,6]. The heat sector is being decarbonized through consuming biomethane as a substitute for natural gas. Also, biomethane is internationally traded. Table 1 shows the biomethane markets and the respective regulatory framework under which it is traded [4].

1.1.2. Post-EEG Transition

After 20 years of operation under the EEG requirement, older BGPs are facing the end of guaranteed feed-in tariffs, leading to a potential phase-out of support for a significant portion of operational BGPs [7,8]. Even so, these plants have a technical lifespan beyond 20 years, suggesting potential for extended operation with profitable follow-up strategies, influenced by plant-specific, regional, and economic conditions. Güsewell et al. [9] evaluated four follow-up concepts for 2508 BGPs across different scenarios and concluded that the concept of “Seasonal Flexibilization”, which aims at seasonal gas production aligned with the heat demand profile, was the most favored. However, the concept of “Biomethane Upgrading”, which involves replacing on-site CHP production with biomethane upgrading and grid injection, is the only profitable option, driven by high GHG quota prices in Germany’s fuel sector. In another study, Schröer et al. [10] surveyed 183 German biogas plant operators in order to explore their preferences between similar repowering options and found that the investment willingness was high for both options (71% for flexibilization and 82% for biomethane upgrading). As for biomethane upgrading, operators show a preference for privately owning their biomethane upgrading facilities rather than collaborating on a shared central upgrading unit.

1.1.3. Future Contribution of Biomethane to the Gas Supply in Germany

Dependency on energy crops (constituting 75% of the energy input of biogas in Germany), infrastructure constraints, such as limited access to the natural gas grid, and an uncertain regulatory framework are significant challenges in the development pathway of biomethane production. Even so, an additional volume of 15–20 TWh of the current biogas production is predicted to be upgraded to biomethane by 2030 due to favorable economic traits [11]. These traits include adequate capacity, opportunities for pooling, and proximity to the gas grid, underscoring the economic viability for biomethane production.
Generally, there are some reasons driving biomethane demand in Germany. First, decarbonization via the electrification of high-temperature industrial heating processes and the transport sector, including heavy-duty vehicles, aviation, and shipping, are particularly difficult [12] and thus there is a need for green fuels in those areas. Second, potential geopolitical challenges, for example, Russia’s invasion of Ukraine and the subsequent natural gas supply disruption, encourage the demand for economically competitive fuels in order to secure the gas supply in Germany [13]. Third, in line with the German Renewable Heating Act (GEG), a shift towards environmentally friendly heating systems is mandated, requiring new systems to utilize a minimum of 65% renewable energy (e.g., green gases like biomethane and hydrogen) by mid-2028. This initiative is a strategic move towards achieving climate neutrality by 2045 and reducing reliance on fossil fuels, which currently power about three-quarters of heating systems [14]. In addition, the “Power Plant Strategy 2026”, announced in summer 2023 with the target of establishing up to 25 GW of controllable power plant capacity by 2030 [15], may significantly influence biomethane demand in the near future. Given biomethane’s renewable nature, its demand could presumably surge, particularly as a source for hydrogen production or a transitional fuel in hydrogen-ready gas-fired power plants.
From a macro perspective, higher CO2 prices enhance the appeal of biomethane and other renewable gases, such as green hydrogen [12,14,15]. This results in a competitive market for biomethane, given its readiness and resource availability, positioning it favorably among green gas options and leading to an increase in its demand and market share.
The international biomethane market has remained strong for the last three years, driven by favorable political frameworks in many European countries. The REPowerEU target of 35 billion cubic meters of biomethane by 2030 has led to ambitious support schemes in some nations. Additionally, international trade remains in high demand, with upcoming regulatory improvements, such as the Union database, expected to simplify certification processes and enhance cross-border trades. These developments indicate a growing and increasingly integrated European biomethane market, creating new opportunities for market participants [3].

1.2. The German GHG Quota Market

To meet the Paris Agreement’s ambitious goals, Germany has implemented various measures, including the Greenhouse Gas (GHG) Mitigation Quota within its Emission Protection Act [16,17]. This quota mandates fossil fuel distributors to reduce GHG emissions by a specified percentage, either by selling low-emission fuels or paying other entities for the replacement of fossil fuels with low-emission fuels (purchasing quota certificates). The required reduction will rise from 8% in 2023 to 25% by 2030, in accordance with 36. BImSchV [17,18]. The quota price has experienced a great deal of volatility in recent years. Between October 2021 and January 2023, the GHG quota price fluctuated between approximately 350 and 500 EUR/t CO2-eq [19]. The price fluctuation is concerned with how difficult and costly it is for companies to reduce their emissions. If emission reductions are challenging or expensive, demand for quotas increases, pushing the prices up. Conversely, if it is easier or cheaper to reduce emissions, the demand for quotas may decrease, leading to lower prices. For example, in the EU biodiesel market, considered as a green alternative to fossil fuels with an annual worth of EUR 31 billion, there was an 80% rise in biodiesel imports from China in early 2023 compared to the same period in 2022. This caused a dramatic fall in biodiesel prices within the European market. Consequently, the fuel suppliers in Germany used biodiesel to meet their GHG quotas, reducing the overall demand for GHG quota certificates [5,20]. It is expected that the quota price could significantly affect the interplay between biomethane markets.

1.3. Dynamics of Interconnected Markets in the Context of Biomethane

Due to the heterogeneity of biomethane markets in terms of regulatory requirements and acceptance, various biomethane products with different feed-in substrate mixes and production costs are produced by BGPs. The designed heterogenous regulatory requirements in the biomethane markets have widespread implications, posing dependencies and interconnections between the markets. Even though each biomethane product is meant to be sold in its own market, it is possible for it to be sold in the other markets as well. In principle, when the produced products could comply with the regulations of other markets, BGPs could sell them there, depending on the market prices and revenues they could make. According to Table 2, the regulatory distinction between the markets is mainly associated with the constraint of the GHG emission reduction target (GRT) with respect to the fossil reference value. Compared to other markets, markets two and four have stricter targets of 80% reduction. Also, market two asks for the minimum hydraulic retention time (HRT) value of 150 days and a limitation cap on maize usage (maximum 36% of the substrate mix). In contrast, market three is devoid of regulatory requirements. Concerning the substrate-related requirements, market five has more stringent conditions; utilizing energy crops (EC) and grass are not allowed. By comparing the markets’ regulations, it is possible to allocate each product across various markets, within the levels of regulatory restrictions.

1.4. Research Gaps and Questions

From plant operators’ perspective, making a profitable decision on optimal biomethane production and allocation between different markets is quite challenging. In this regard, we previously explored the optimum trade-off between the revenues generated from various potential biomethane markets and complying with the non-uniform regulatory requirements across these markets while also considering technical process restrictions and substrate costs [4]. We used a linear programming (LP) model for the substrate mix optimization, which is a functional method in increasing profitability while applied in evaluating alternative crops [21] or in assessing the impact of various process constraints [4]. The LP model is a component of the “BGP-RepoMod” framework, designed for evaluating biogas post-EEG repowering. The model framework was first described in [7] and developed in [4,9,22]. In our analysis, we integrated the five biomethane markets (listed in Table 1) into the optimization model, which led to an increase in contribution margins of up to 10–25%. However, only a few BGPs were highly benefited by considering all markets at the same time. Also, we argued that the advanced fuel market (M5-Adv.GHG-Q) is the leading market to which the highest share of biomethane volume is allocated. This encourages the use of GHG quota-incentivized substrates like manure. It was generally deduced that prioritizing GHG emissions reduction and generating more revenues from the GHG quota market is more profitable than merely increasing gas production. In our study, though, the market prices were normatively assumed and considered as fixed inputs for the model. The substrate mix optimization LP model was applied individually to each BGP. In the GAP, calculated based on the optimized substrate mixture, the volume shares of product one and five held dominant positions due to their higher revenue potential in the respective markets. Nevertheless, implementing the calculated portfolios for all BGPs caused supply shortages in markets not connected to the transport sector, and the resulting market volume shares are not in line with reality. Therefore, the substrate mix optimization model needs further development to achieve a more diversified gas allocation portfolio for BGPs and resolve the supply shortages. Moreover, the connectivity between markets, which could provide greater flexibility in options, was not addressed in the previous study.
In this study, we aim to accomplish the following:
  • Address the stated issue of supply shortages in non-transport biomethane markets by proposing a two-step optimization approach that enables all BGPs to simultaneously meet the demand across all biomethane markets. This approach improves the GAP from the BGP operator’s perspective and maximizes the overall profitability of the biomethane market system.
  • Conduct a sensitivity analysis to examine how variations in GHG quota prices influence the market dynamics, including changes in market-clearing prices and substrate mix consumption.
  • Perform a scenario analysis to evaluate the impact of shifting market demand shares on the profitability of the biomethane market system.
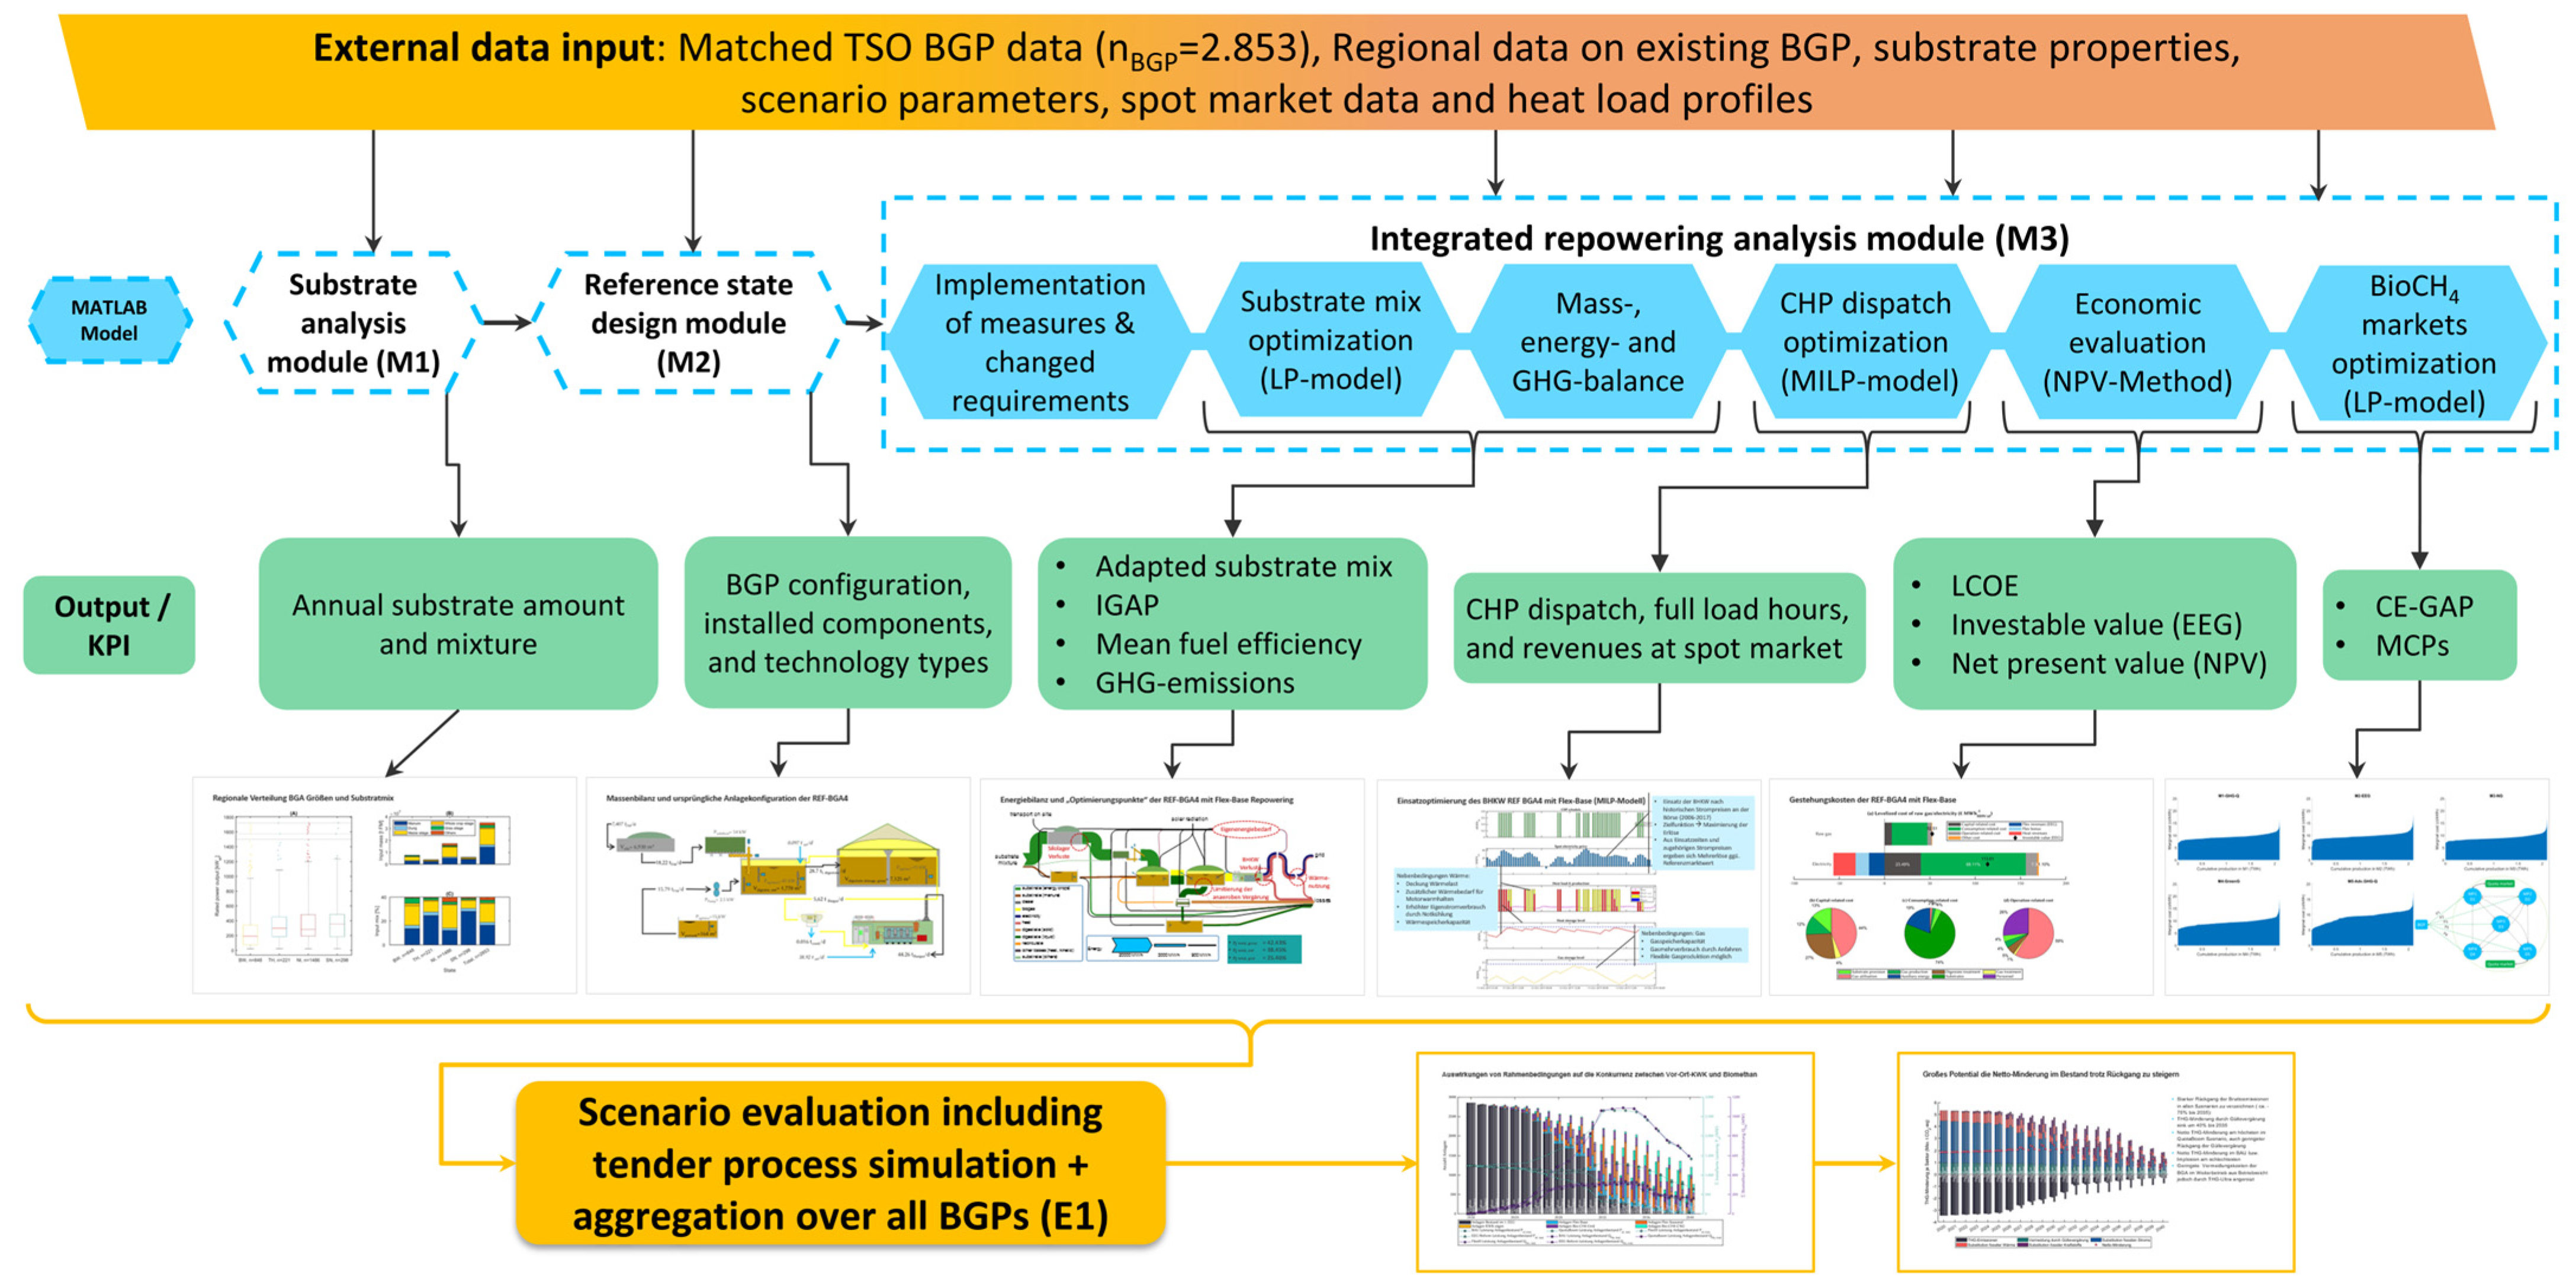
The remainder of the paper is organized as follows: Section 2 describes the methodological approach and elaborates the optimization models adopted. Section 3 presents the results, including a sensitivity analysis. Section 4 addresses the study’s limitations and topics for future research. Section 5 discusses the results and draws conclusions.

2. Methodology

2.1. Overview

Figure 1 provides an overview of the existing model framework “BGP-RepoMod”, developed using MATLAB version R2024b for the assessment of biogas repowering [9]. The methodology consists of two primary stages. In the first stage, 2853 BGPs in our dataset are filtered based on the assumed target year for the analysis. If the assumed target year falls within a BGP’s 20-year EEG period, the plant is excluded from the calculations, ensuring that only BGPs in their post-EEG period are considered. In this study, the target year of 2030 was used as the basis for the analysis and assumptions. The data from the selected 1366 BGPs is then imported to the substrate mix optimization LP model (the submodule of M3) to determine the initial gas allocation portfolio (IGAP) for each BGP. Moreover, the specific production cost and GHG reduction (GHGR) of products generated by the BGPs are calculated.
In the next stage, the calculated data are imported into the BioCH4 markets optimization LP model created as a new submodule of M3, by which the cost- and emission-adjusted gas allocation portfolio (CE-GAP) of BGPs as well as the MCP in each market are determined. Moreover, the sensitivity of the market dynamics to the exogenous parameter of GHG quota price is investigated. Finally, the impact of various demand-based scenarios on the biomethane market system is evaluated.

2.2. Development of Substrate Mix Optimization Model

BGPs benefit from five distinct markets only if the produced biomethane complies with the regulations of each market. In other words, BGPs can produce five distinct products and generate revenue from the corresponding markets [4].
The substrate mix optimization LP model enables cost minimization in biomethane production while ensuring regulatory compliance across the markets. To resolve the stated issue of supply shortages and clear all five markets, the model was developed in a way in which additional market-clearing restrictions were incorporated into the model. This ensures that all selected BGPs contribute to meeting each market demand, allowing the model to simultaneously determine solutions (IGAP) for all BGPs.

2.2.1. Objective Function

Equation (1) explains the structure of the expanded optimization target function, enabling the simultaneous contribution of all BGPs.
M i n i = 1 l j = 1 m k = 1 n ( C k ( G H G e f o s s i l , r e f G H G e k ) × Q P j 1000 × S M Y e , k ) × x i j k i = i n d i v i d u a l   B G P ,     j = m a r k e t   t y p e ,     k = s u b s t r a t e   t y p e , C k = v a r i a b l e   c o s t t o n   F M ,   a n d   Q P j = m a r k e t   s p e c i f i c   q u o t a   p r i c e   t C O 2 e q
The decision variables of the target function represent the yearly mass of each substrate in each market (ton/year) for each BGP. These variables are multiplied by the difference between the potential substrate-specific GHG quota revenue and the variable cost of each substrate (Ck). In this study, 17 types of substrates were used. Each substrate is characterized by specific properties, including total solids (TSk), volatile solids (VSk), standard methane yields (SMYk), greenhouse gas emission factors (GHGek), substrate group categories (e.g., energy crops), and fugate factors (ffug,k). The properties are used to define the objective function and various constraints. For instance, the TS and VS values are considered in formulating technical process constraints, while the GHGe factors are used to define a regulatory constraint and also contribute to the objective function. Detailed descriptions and property data for each substrate are available in the supplementary material (Supplementary Materials File S1); see [4,7] for further details on the input data.

2.2.2. Constraints

Several types of constraints involving plant-specific, regulatory, technical process, normative, and newly added market equilibrium constraints were considered. The constraints of the optimization problem are presented in Table 2 and mathematically formulated as follows:
i = 1 l k = 1 n S M Y k × x i j k = d j
j = 1 m k = 1 n S M Y k × x j k M e t h a n e   P r o d u c t i o n m a x
j = 1 m k = 1 n ( f f u g , k × D S C m i n 365 × ρ a v e r a g e ) × x j k V d i g e s t a t e   s t o r a g e   t a n k
j = 1 m k = 1 n ( T S k T S m a x ) × x j k 0
j = 1 m k = 1 n ( T S O u t , k T S O u t , m a x ) × x j k 0
j = 1 m k = 1 n V S k 365 × V d i g e s t e r × x j k O L R m a x
j = 1 m k = 1 n 1 365 × ρ k × V d i g e s t e r × x j k 1 H R T d i g e s t e r , m i n
k = 1 n ( G H G e k G R T × S M Y k × L H V C H 4 ) × x k 0
k M a i z e   c a p   s u b s t r a t e s 1 M a i z e   c a p m a x × x k + k O t h e r s   M a i z e   c a p m a x   ×   x k 0
Equation (2) represents the market-specific equilibrium constraints, ensuring that the supply is sufficient to meet the demand in all markets. Equation (3) defines the methane production limit for each BGP based on its production capacity. The limitation concerning the minimum value of DSC is presented in Equation (4). The limitations on the maximum TS content in the input mixture and the digester outflow are defined by Equations (5) and (6), respectively. The constraints on the OLR and HRT are expressed by Equations (7) and (8), respectively. The limitation regarding HRTmin in the gastight system is defined in the same way as in Equation (8), while considering the volume of the gastight system. The constraint for GRT relative to the fossil reference is given by Equation (9). The GRT is calculated based on the relative target presented in Table 2 and the market-specific fossil reference values: 338 kg CO2-eq/MWh for the fuel market, 256.9 kg CO2-eq/MWh for electricity, and 288 kg CO2-eq/MWh for heat, in accordance with REDII [23]. The integration of constraints such as the maize cap and the minimum or maximum relative share of other substrate mixes are conducted using Equation (10). More detailed information about the constraints is available in [4].
Through running the model, the optimized substrate mixture for all selected BGPs is achieved (xijk), and considering the energetic value of each substrate, the BGPs’ IGAP is determined. In other words, for each BGP, the volume of each product and the respective substrate mixture amount are obtained (Figure 2). Subsequently, a general mass, energy, and GHG emissions balance is performed. As a result, for each BGP, the total OPEX and operational GHG emissions are calculated and allocated by volume across the five products. Finally, the specific production cost and GHGR for each product are calculated.

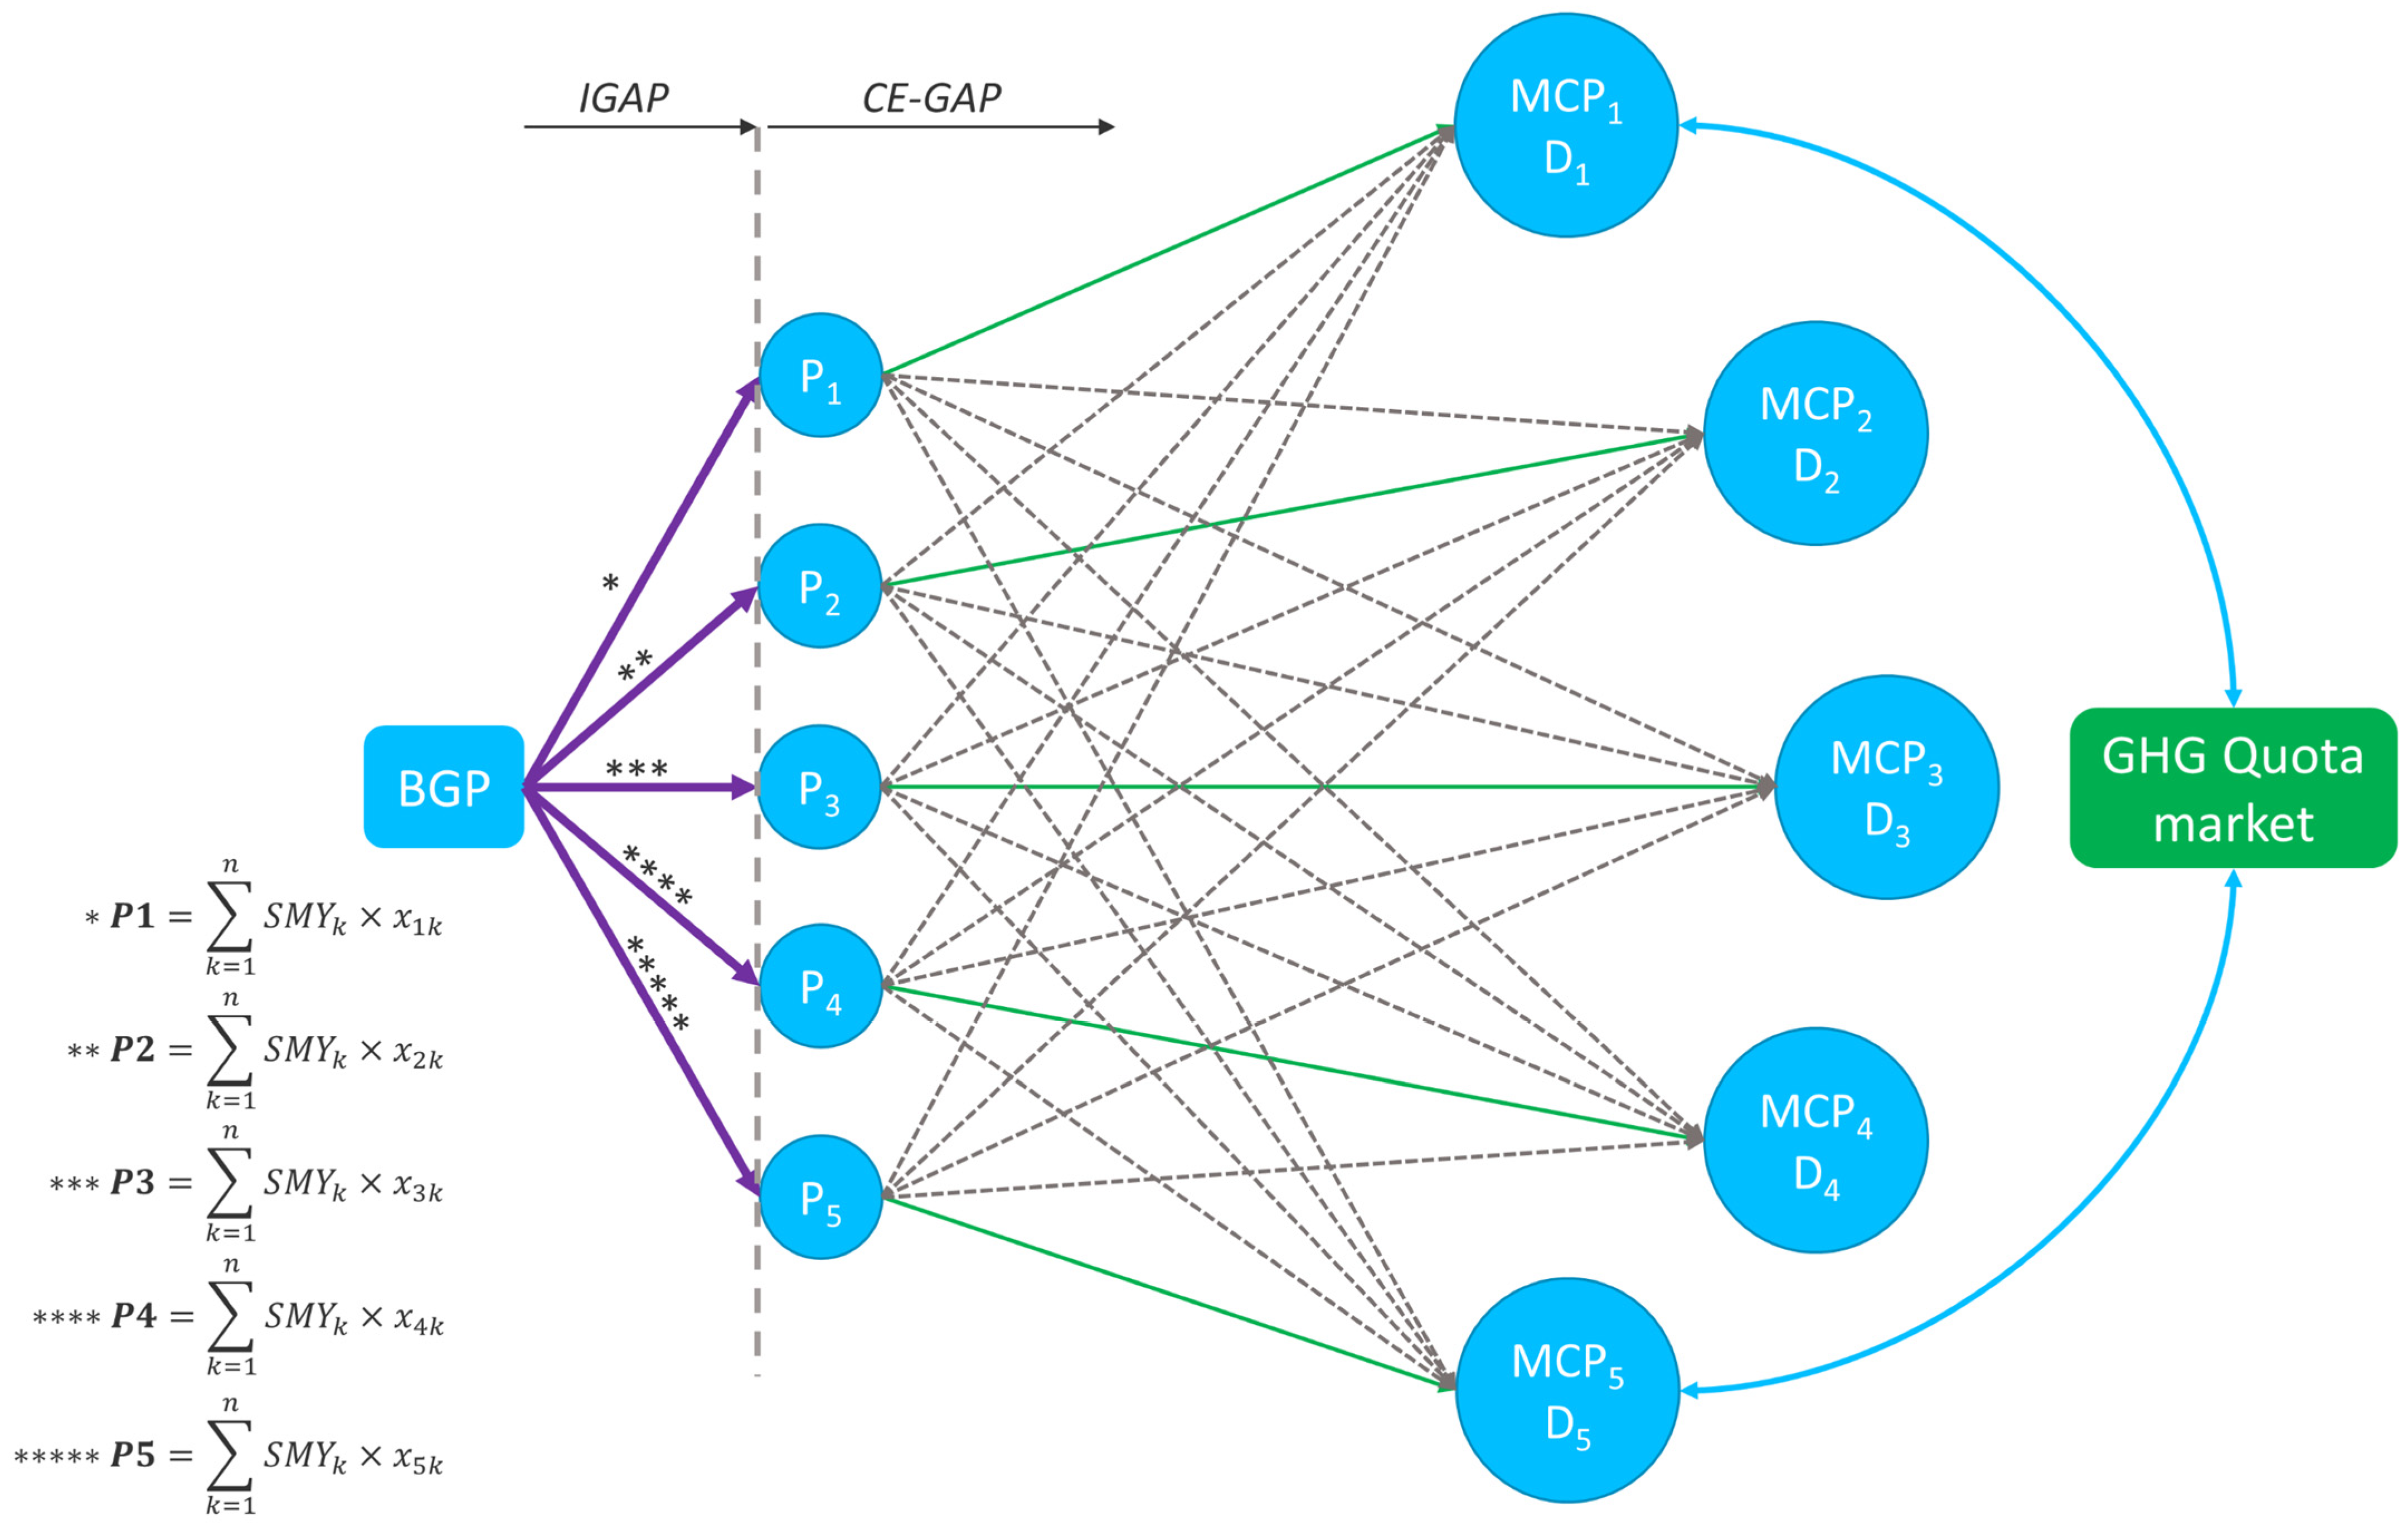
2.3. Biomethane Markets Optimization and Price Formation Utilizing the Merit-Order Approach

The substrate mix optimization model considers only the variable cost and GHG emissions of substrates. Therefore, the BGPs’ IGAP must be further developed to incorporate the effects of total OPEX and operational GHG emissions, while leveraging the stated flexibility in options provided by the markets’ connectivity. This would maximize the profitability of the biomethane market system. Table 3 visualizes this options flexibility, the potential reallocation of each product across all markets, within the levels of regulatory restrictions. As shown, green checkmarks indicate the share of each biomethane product allocated to its original market, while gray checkmarks show the share allocations to non-original markets.
To achieve a more developed GAP accounting for the options flexibility, an additional optimization step is required. Thus, a new submodule, “BioCH4 markets optimization (LP model)”, was developed within the “BGP-RepoMod” to fulfill this purpose. Figure 2 illustrates the progression of BGPs’ GAP from IGAP to CE-GAP, taking into account the options flexibility. The biomethane markets are distinguished by their MCPs and demand (D). Each gray arrow represents the allocation of a product share to a non-original market. Only markets one and five, relevant to the transport sector, are connected to the GHG quota market. This implies that selling the allowable products in markets one and five creates an opportunity to generate the second revenue coming from the GHG quota market.

2.3.1. Objective Function

Considering an integrated system including all biomethane markets, a new optimization problem is formulated: To maximize the system profitability, how should the volume of each product from each BGP be allocated across the five markets, while complying with the plant-specific options flexibility and clearing all five markets?
Equation (11) presents the structure of the LP optimization target function, describing the trade-off in the system between the biomethane production cost and the revenue generated by the GHG quota market.
M i n i = 1 I p = 1 P m = 1 M ( C i P G H G R i p . Q P m ) G i p m i = i n d i v i d u a l   B G P ,     p = p r o d u c t   t y p e ,     m = m a r k e t   t y p e , C i P = s p e c i f i c   c o s t   o f   e a c h   p r o d u c t   f o r   e a c h   B G P k W h , G H G R i p = g r e e n h o u s e   g a s   s p e c i f i c   r e d u c t i o n   f o r   e a c h   p r o d u c t   f o r   e a c h   B G P   t C O 2 e q k W h , Q P m = m a r k e t - s p e c i f i c   q u o t a   p r i c e   t C O 2 e q , Q P m = 0   m = 2 , 3 , 4 , Q P 5 = 2 Q P 1 ,   a n d   G i p m 0
The decision variable Gipm (kWh/year) determines the optimized reallocation of each product between the five markets for each BGP. Setting the quota price in markets 2–4 to zero implies the fact that only markets one and five are connected with the quota market.

2.3.2. Constraints

The production capacity constraints in Equation (12) ensure that the reallocation of each product across the markets does not exceed its total volume specified in IGAP.
m = 1 M G i p m G i p i , p
The market-specific equilibrium constraints presented in Equation (13) ensure that all five markets are cleared; the demand in each market is fulfilled by various products of the BGPs.
i = 1 I p = 1 P G i p m = d m
Due to the heterogeneity of BGPs, the options flexibility is different for individual BGPs. In fact, the regulatory-based accessibility of individual products to different markets differs among the BGPs. Therefore, for each BGP, the accessibility of each product across the markets must be analyzed separately. A large binary matrix (Iipm) representing the plant-specific product-market accessibility is constructed and incorporated into the upper bound of the optimization model, as shown in Equation (14).
U b = I i p m ×
Using the output of the optimization problem (Gipm), the supply stack (merit-order curve) in each market is determined. Subsequently, the intersection of supply and demand curves in each market forms the MCP.

2.4. Study Setup

To investigate the impact of varying market demand distributions on system dynamics, several scenarios with corresponding market-specific demand shares were defined (Table 4) and used as inputs for the optimization models. The narratives and key drivers of each scenario are outlined in Table 5. The BAU scenario was used as a baseline to compare the implementation of IGAP and CE-GAP, as well as for conducting the sensitivity analysis. Additionally, the BGPs’ CE-GAP was applied in both the sensitivity and scenario analyses.

3. Results

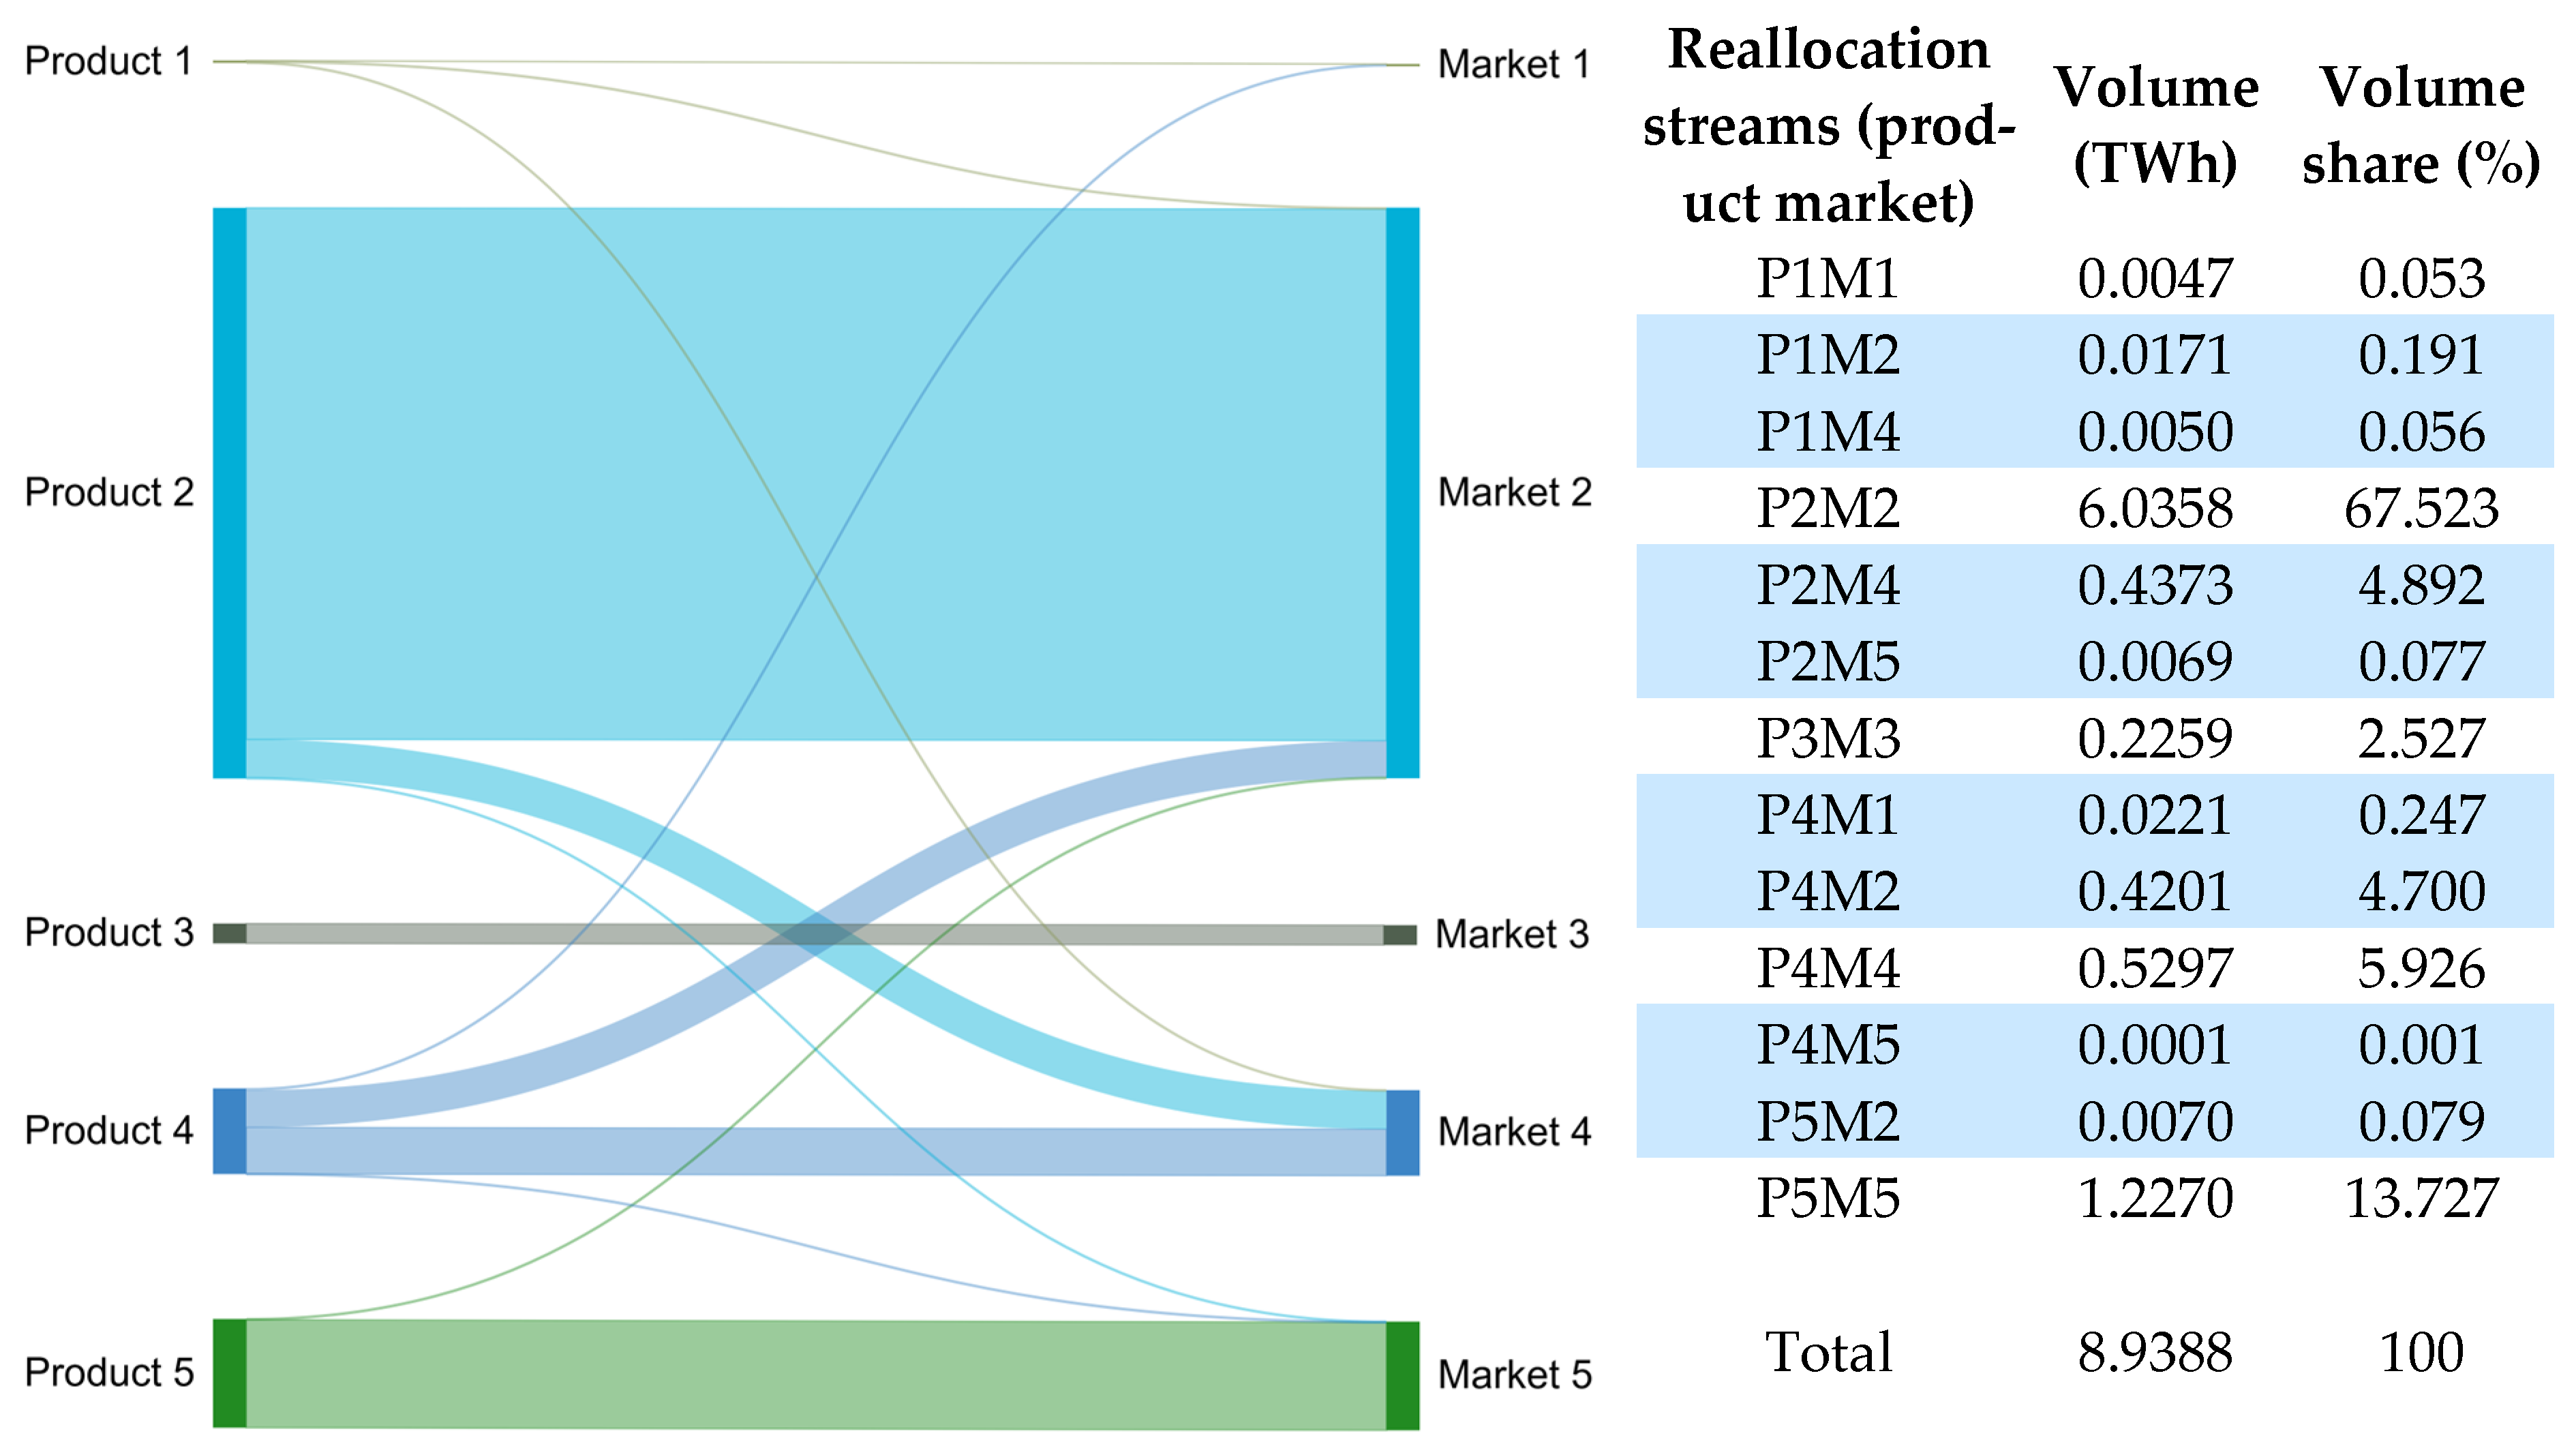
3.1. Comparison of CE-GAP with IGAP

The implementation of the “BioCH4 markets optimization (LP model)” provides the CE-GAP for the studied BGPs. Figure 3 shows the optimized reallocation of aggregate biomethane products of all studied BGPs, adopting CE-GAP, across different markets. As shown, the total volume of reallocation streams targeting non-original markets (highlighted in blue), such as P1M2, P1M4, P2M4, etc., is almost 0.916 TWh, accounting for 10.24% of the total biomethane demand in the system.
From a system perspective, clearing biomethane markets while adopting BGPs’ CE-GAP instead of IGAP improves market efficiency and generates higher contribution margin within the overall system of biomethane markets. Figure 4 illustrates the merit-order curve (MOC) and specific GHGR curve in individual markets for both market-clearing schemes: applying BGPs’ CE-GAP and IGAP. Additionally, Table 6 quantitively compares these schemes by presenting the calculated key parameters, including an individual market’s production cost share and GHGR share within the total system, total revenue, and total contribution margin (TCM). The total system production cost is EUR 804.8 million, and the GHGR is 2.7 million tons of CO2 (Mt CO2-eq). These values are the same for both market-clearing schemes. In other words, the BioCH4 markets optimization model aims to reallocate the calculated volumes of biomethane products, derived from the substrate mix optimization model, more efficiently across the markets based on their respective specific costs and specific GHGR values. As a result, while the production cost and GHGR shares of individual markets vary between the market-clearing schemes, the total system production cost and GHGR remain constant.
As shown qualitatively in Figure 4 and quantitatively in Table 6, adopting BGPs’ CE-GAP reduces the production cost in markets one and two by almost 0.04% and 1.62%, respectively, while increasing the production cost in markets four and five by 1.64% and 0.03%, respectively. This change in individual market production cost share, driven by the optimized reallocation of products across the markets, results in raising the total GHGR in markets one and five, relevant to the transport sector, as well as in market two. This demonstrates that BGPs’ CE-GAP more effectively reflects the GHG quota incentive. In other words, the BioCH4 markets optimization model efficiently tries to maximize revenues from the GHG quota market by allocating biomethane products with higher specific GHGR to the transport-related markets. This reallocation leads to a lower GHGR share in market four, and market three experiences no changes in production cost and GHGR shares. Furthermore, Table 6 presents the total revenue calculated for each market, including income from both the GHG quota market and biomethane sales at the market-specific MCP. The results indicate that adopting BGPs’ CE-GAP makes the total system revenue and contribution margin increase by approximately 1.64% and 2.56%, respectively, equivalent to EUR 36.78 million. Overall, using the BGPs’ CE-GAP to clear the biomethane markets results in a more efficient costs and emissions allocation across the markets.

3.2. Sensitivity Analysis

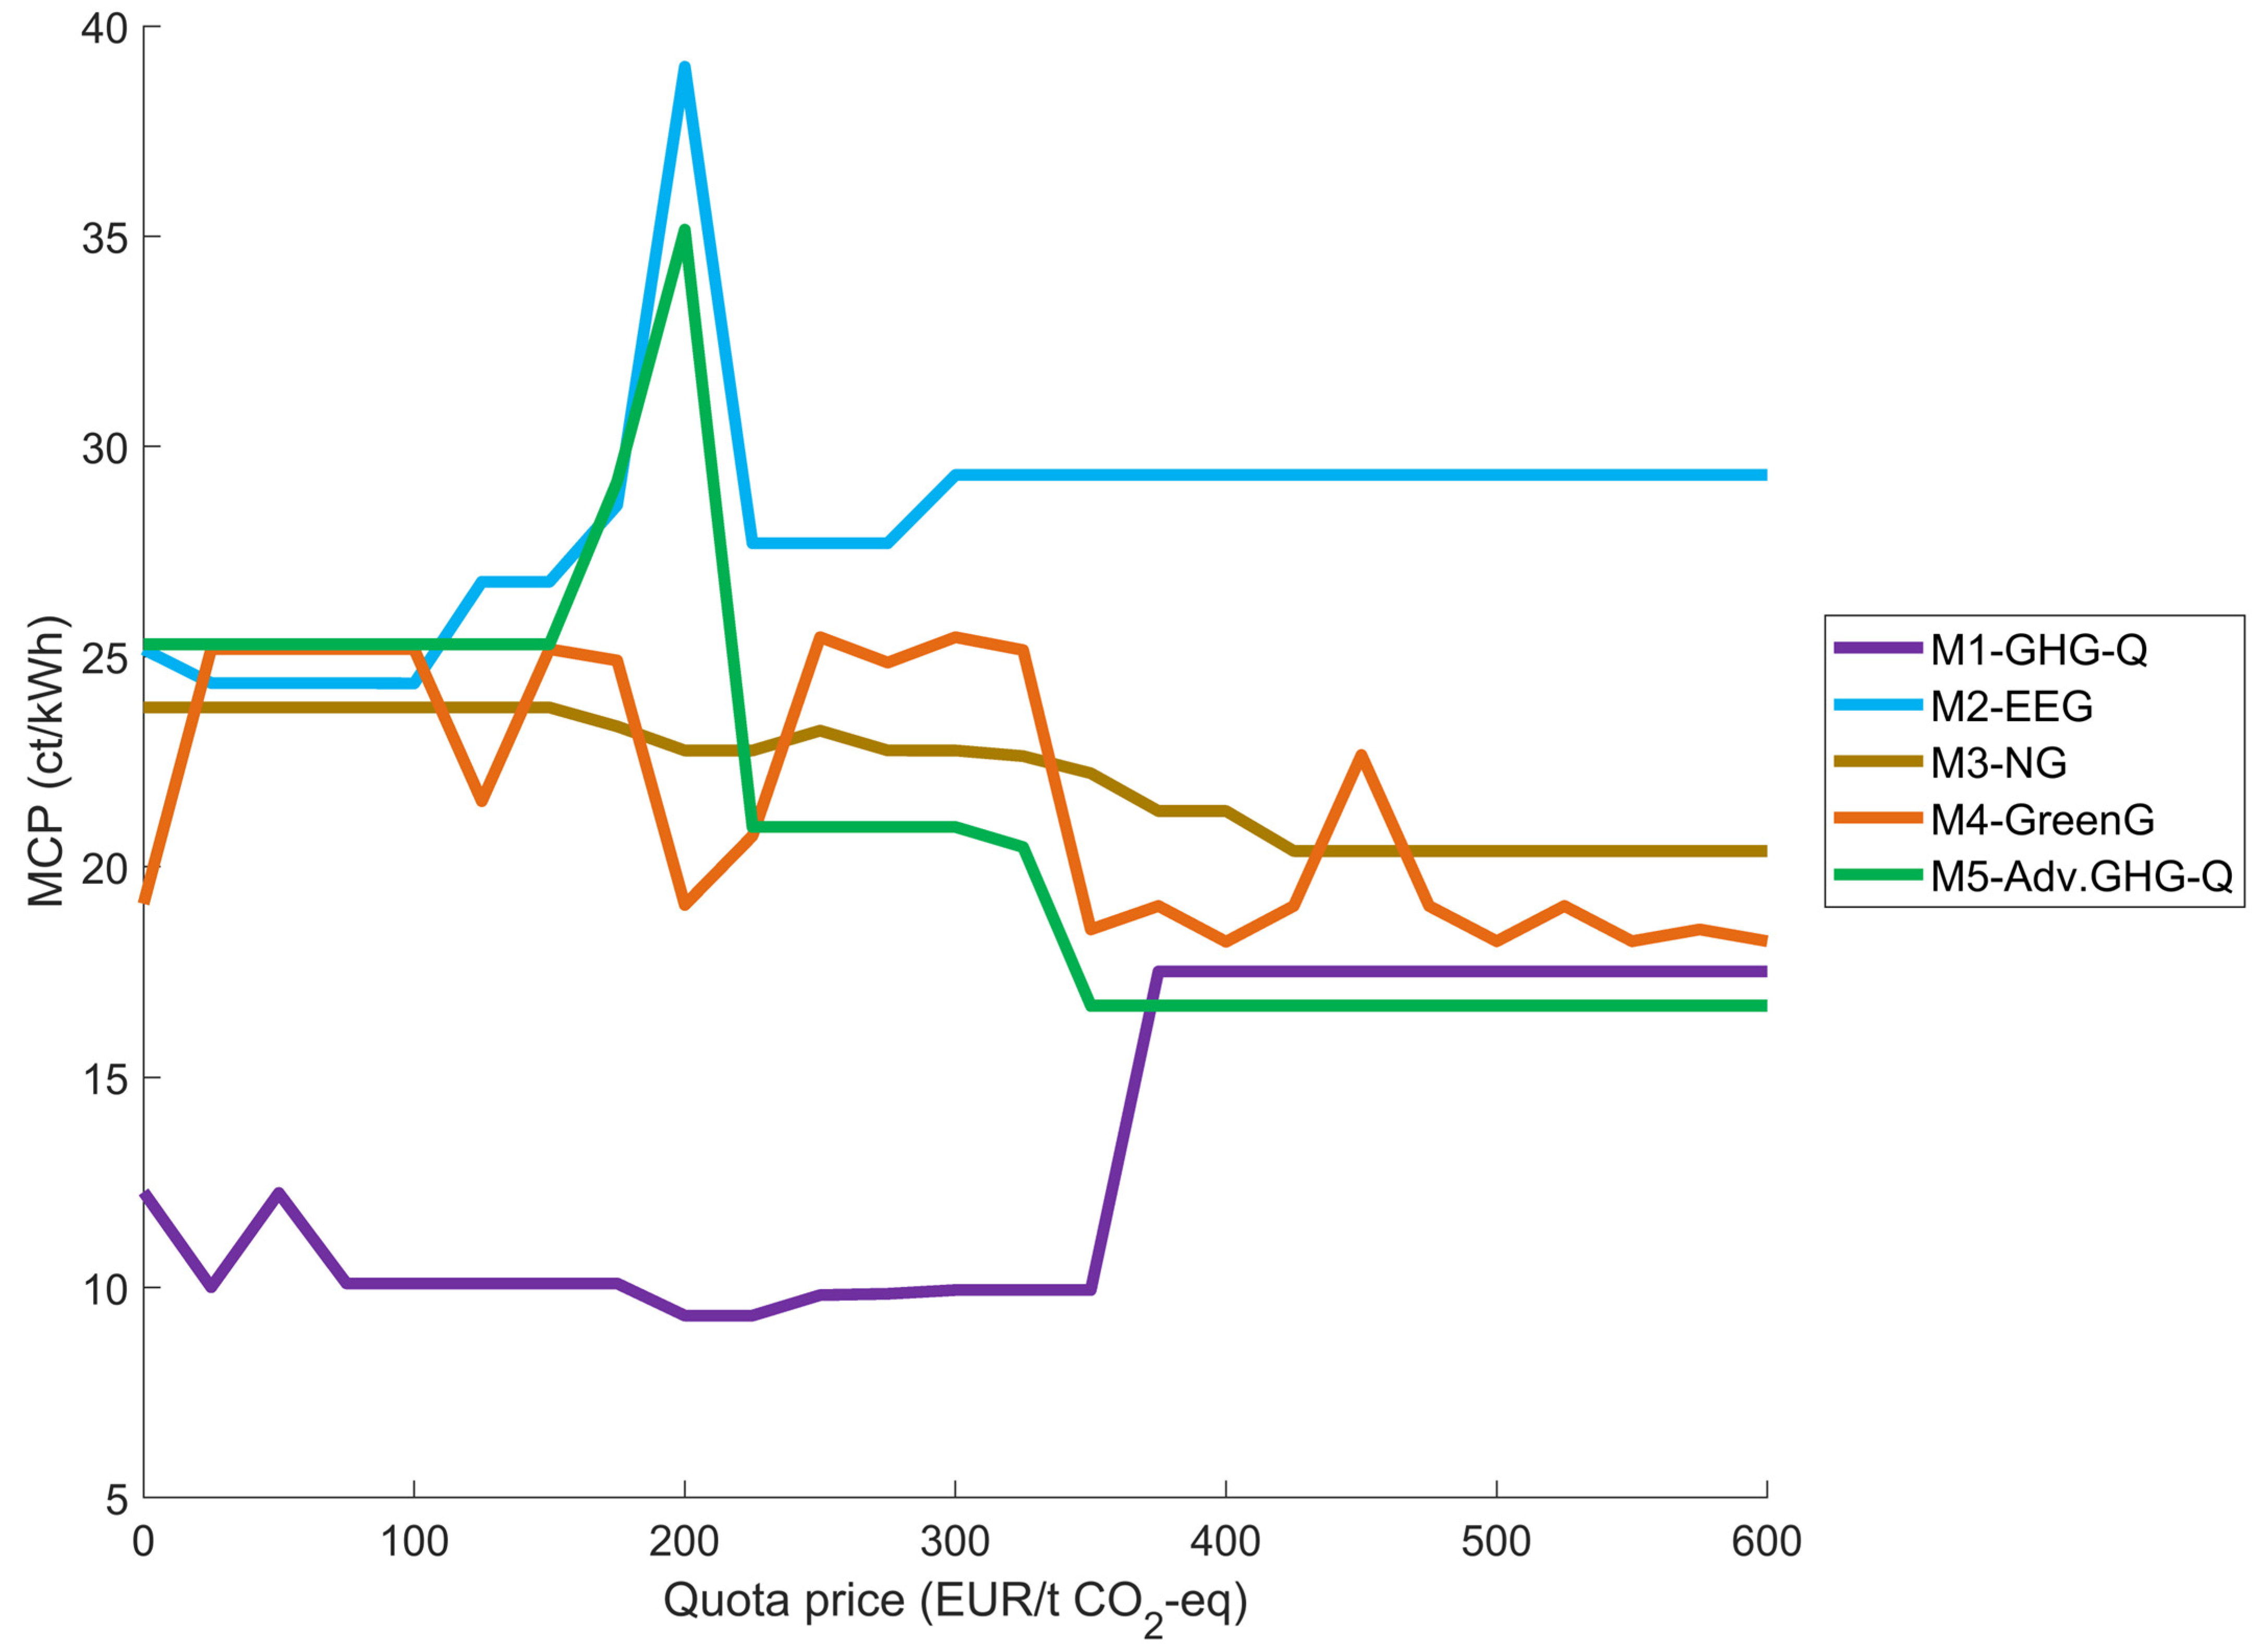
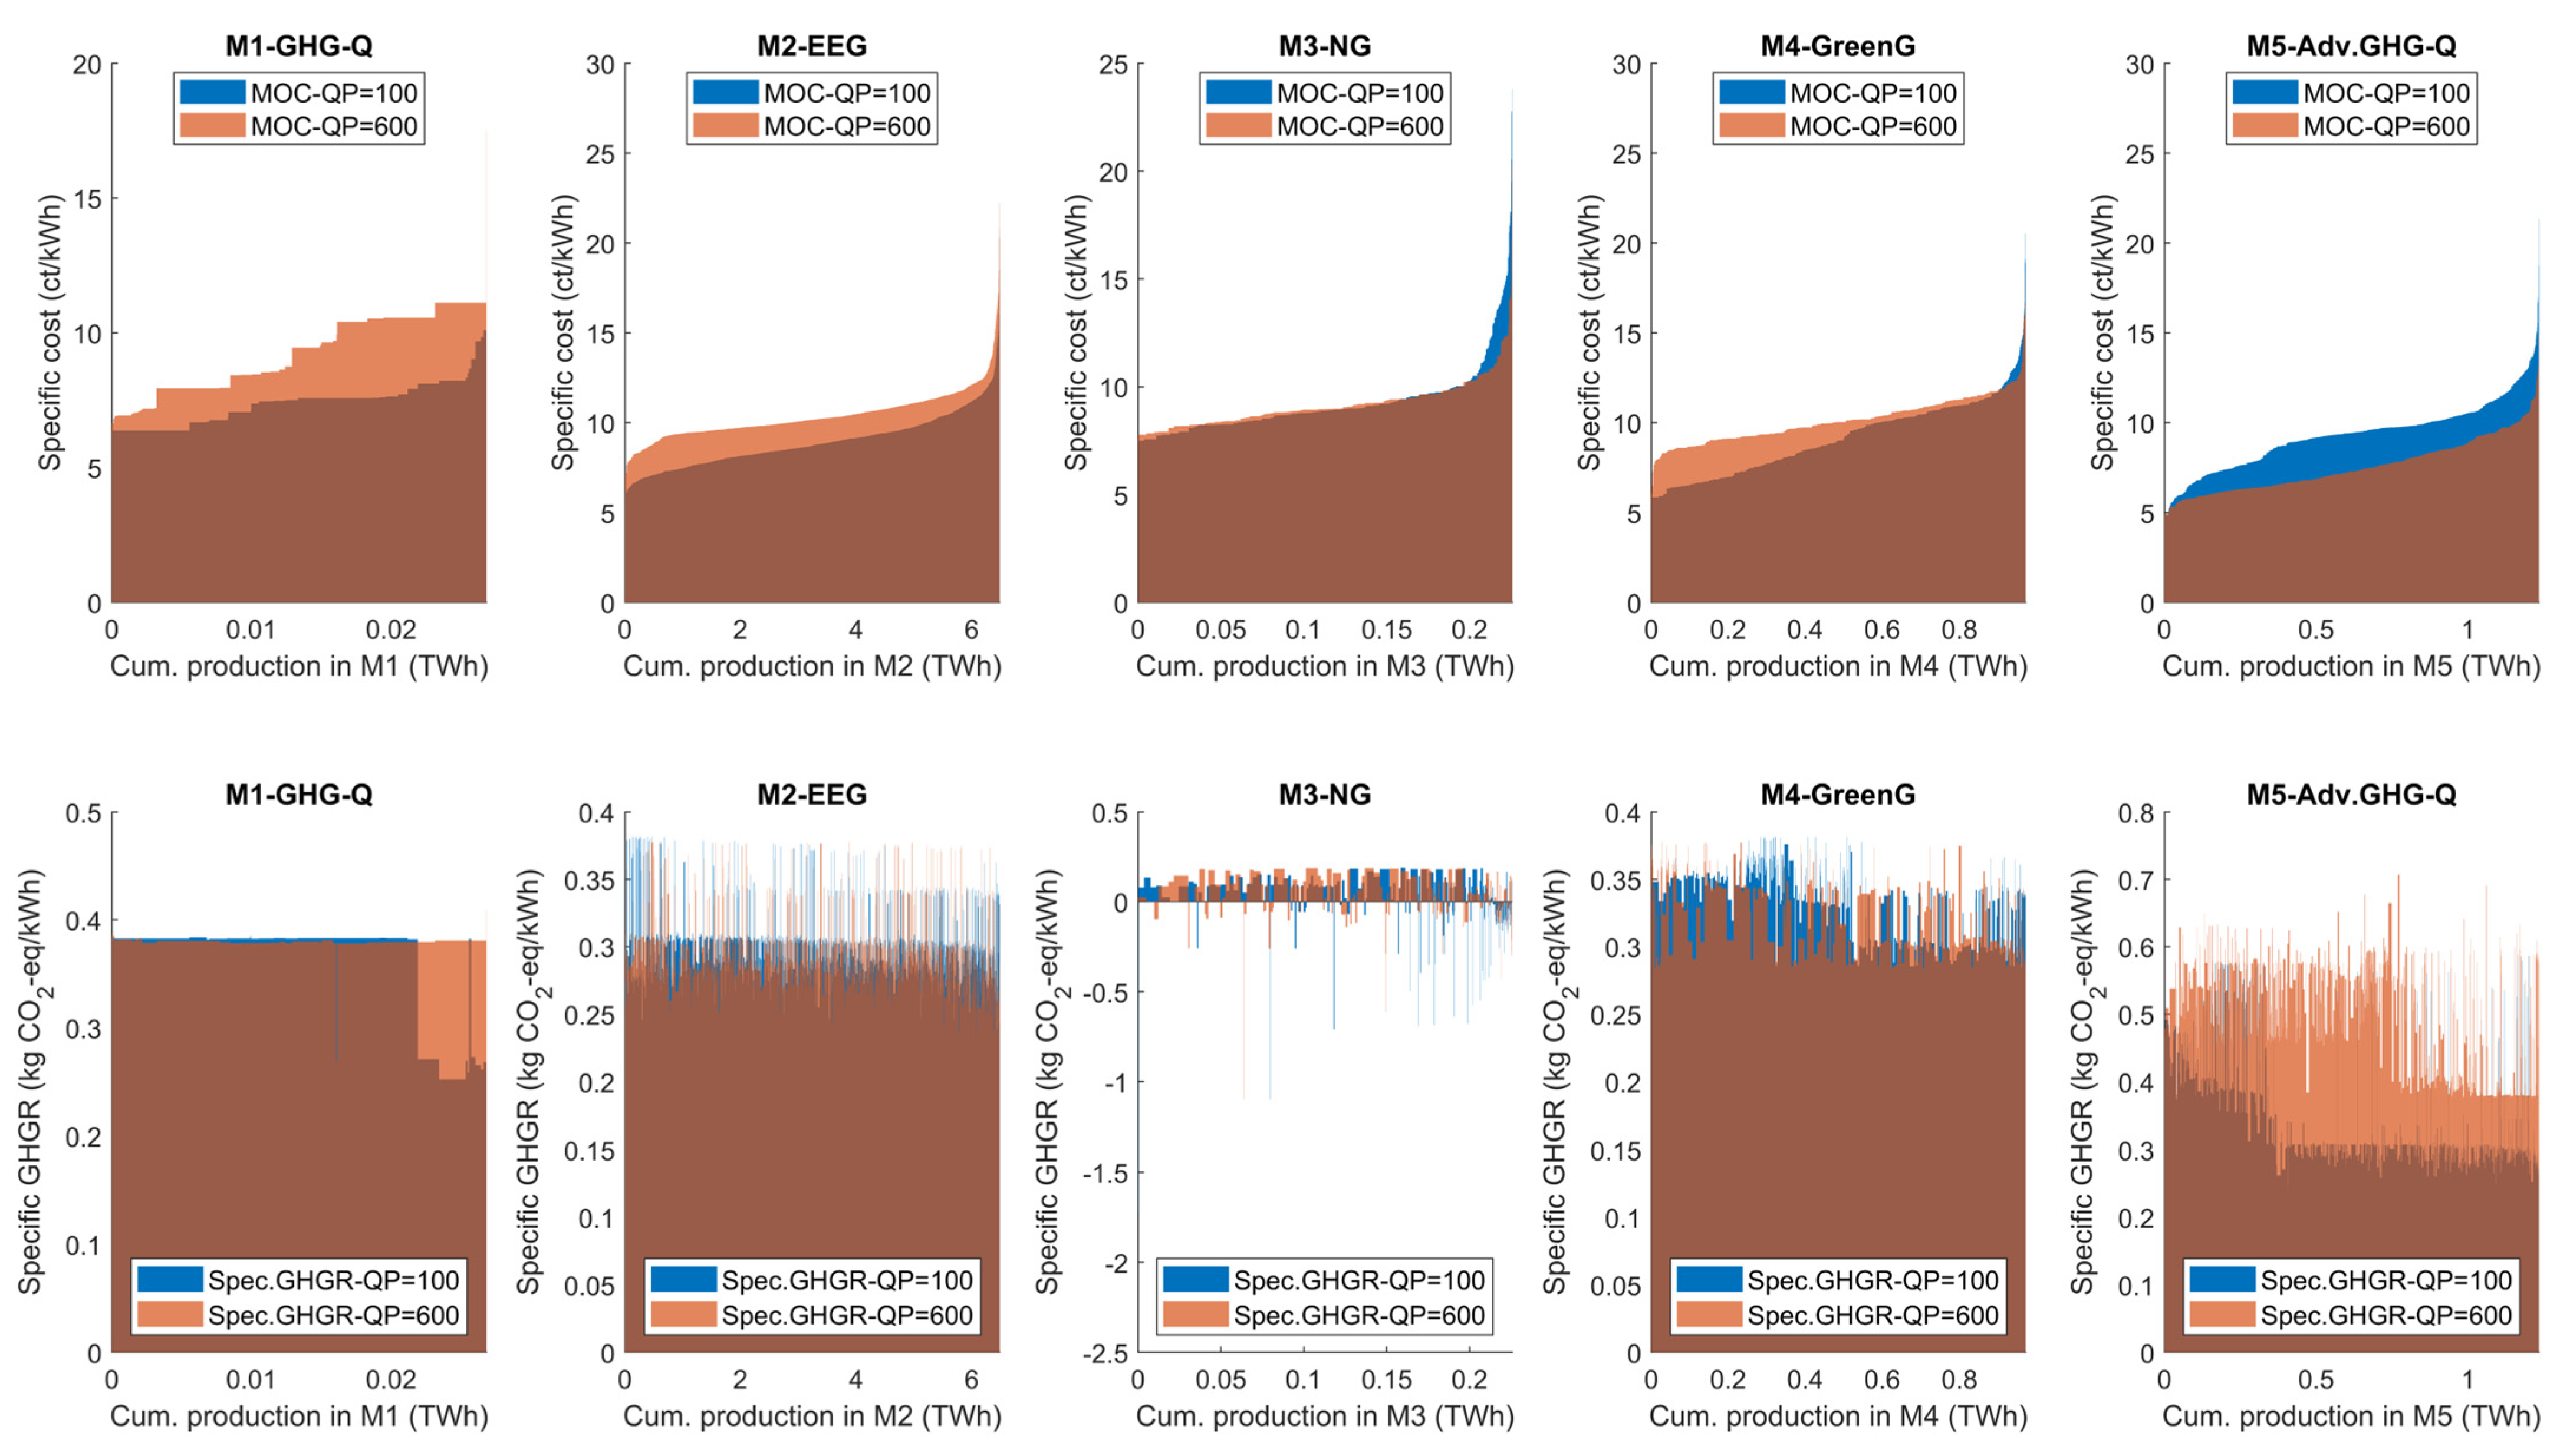
3.2.1. MCP Development vs. GHG Quota Price

In this section, the sensitivity of biomethane market dynamics to GHG quota price is investigated. The effects of quota price variations on the individual MCPs are shown in Figure 5. As shown, the GHG quota price ranges from 0 to 600 EUR/t CO2-eq, and the quota price increase step was set to 25 EUR/t CO2-eq. It is observed that the MCPs in all markets, expect for market four, relatively stabilize at quota prices above 375 EUR/t CO2-eq, despite experiencing intermittent volatility. The stabilized clearing price in markets one and five (transport markets) are 17.5 and 16.7 ct/kWh, respectively. Raising the quota price to 200 EUR/t CO2-eq leads to a sharp spike in MCP2 and MCP5, reaching 39 and 35.2 ct/kWh, respectively. This suggests a threshold for the quota price, to which the EEG market (M2) and the transport-related market (M5) are highly sensitive. Additionally, MCP2 maintains the highest value across most of the quota price range. MCP1, however, remains at the lowest value of nearly 10 ct/kWh at quota prices below 350 EUR/t CO2-eq, showing limited sensitivity to quota price variations at the stated range. The clearing price in market four experiences notable fluctuations between 18.2 and 25.5 ct/kWh, indicating high sensitivity to quota price changes.

3.2.2. Impact of GHG Quota Price on Optimized Markets Clearing

Figure 6 visualizes the MOC and specific GHGR curve in individual markets for two quota prices: 100 and 600 EUR/t CO2-eq. Elevating the quota price increases the total system cost by 10.2% (82.2 m EUR); nevertheless, the total system GHGR rises by 7.2% (0.2 Mt CO2-eq). As shown qualitatively in Figure 6, raising the quota price leads to an upward shift in the supply curves of markets one, two, and four, while market five clears at a lower level of production costs. Following the optimized market-clearing scheme, the transport markets experience a higher level of GHGR, resulting in a significant growth of 49.5% in the system TCM, equivalent to EUR 728 million. This implies that the optimization models efficiently adapt to higher GHG quota prices by, first, incentivizing BGPs to produce biomethane products with higher GHGR and, second, prioritizing the products with higher GHGR when forming the MOC in transport markets despite increasing production cost level.

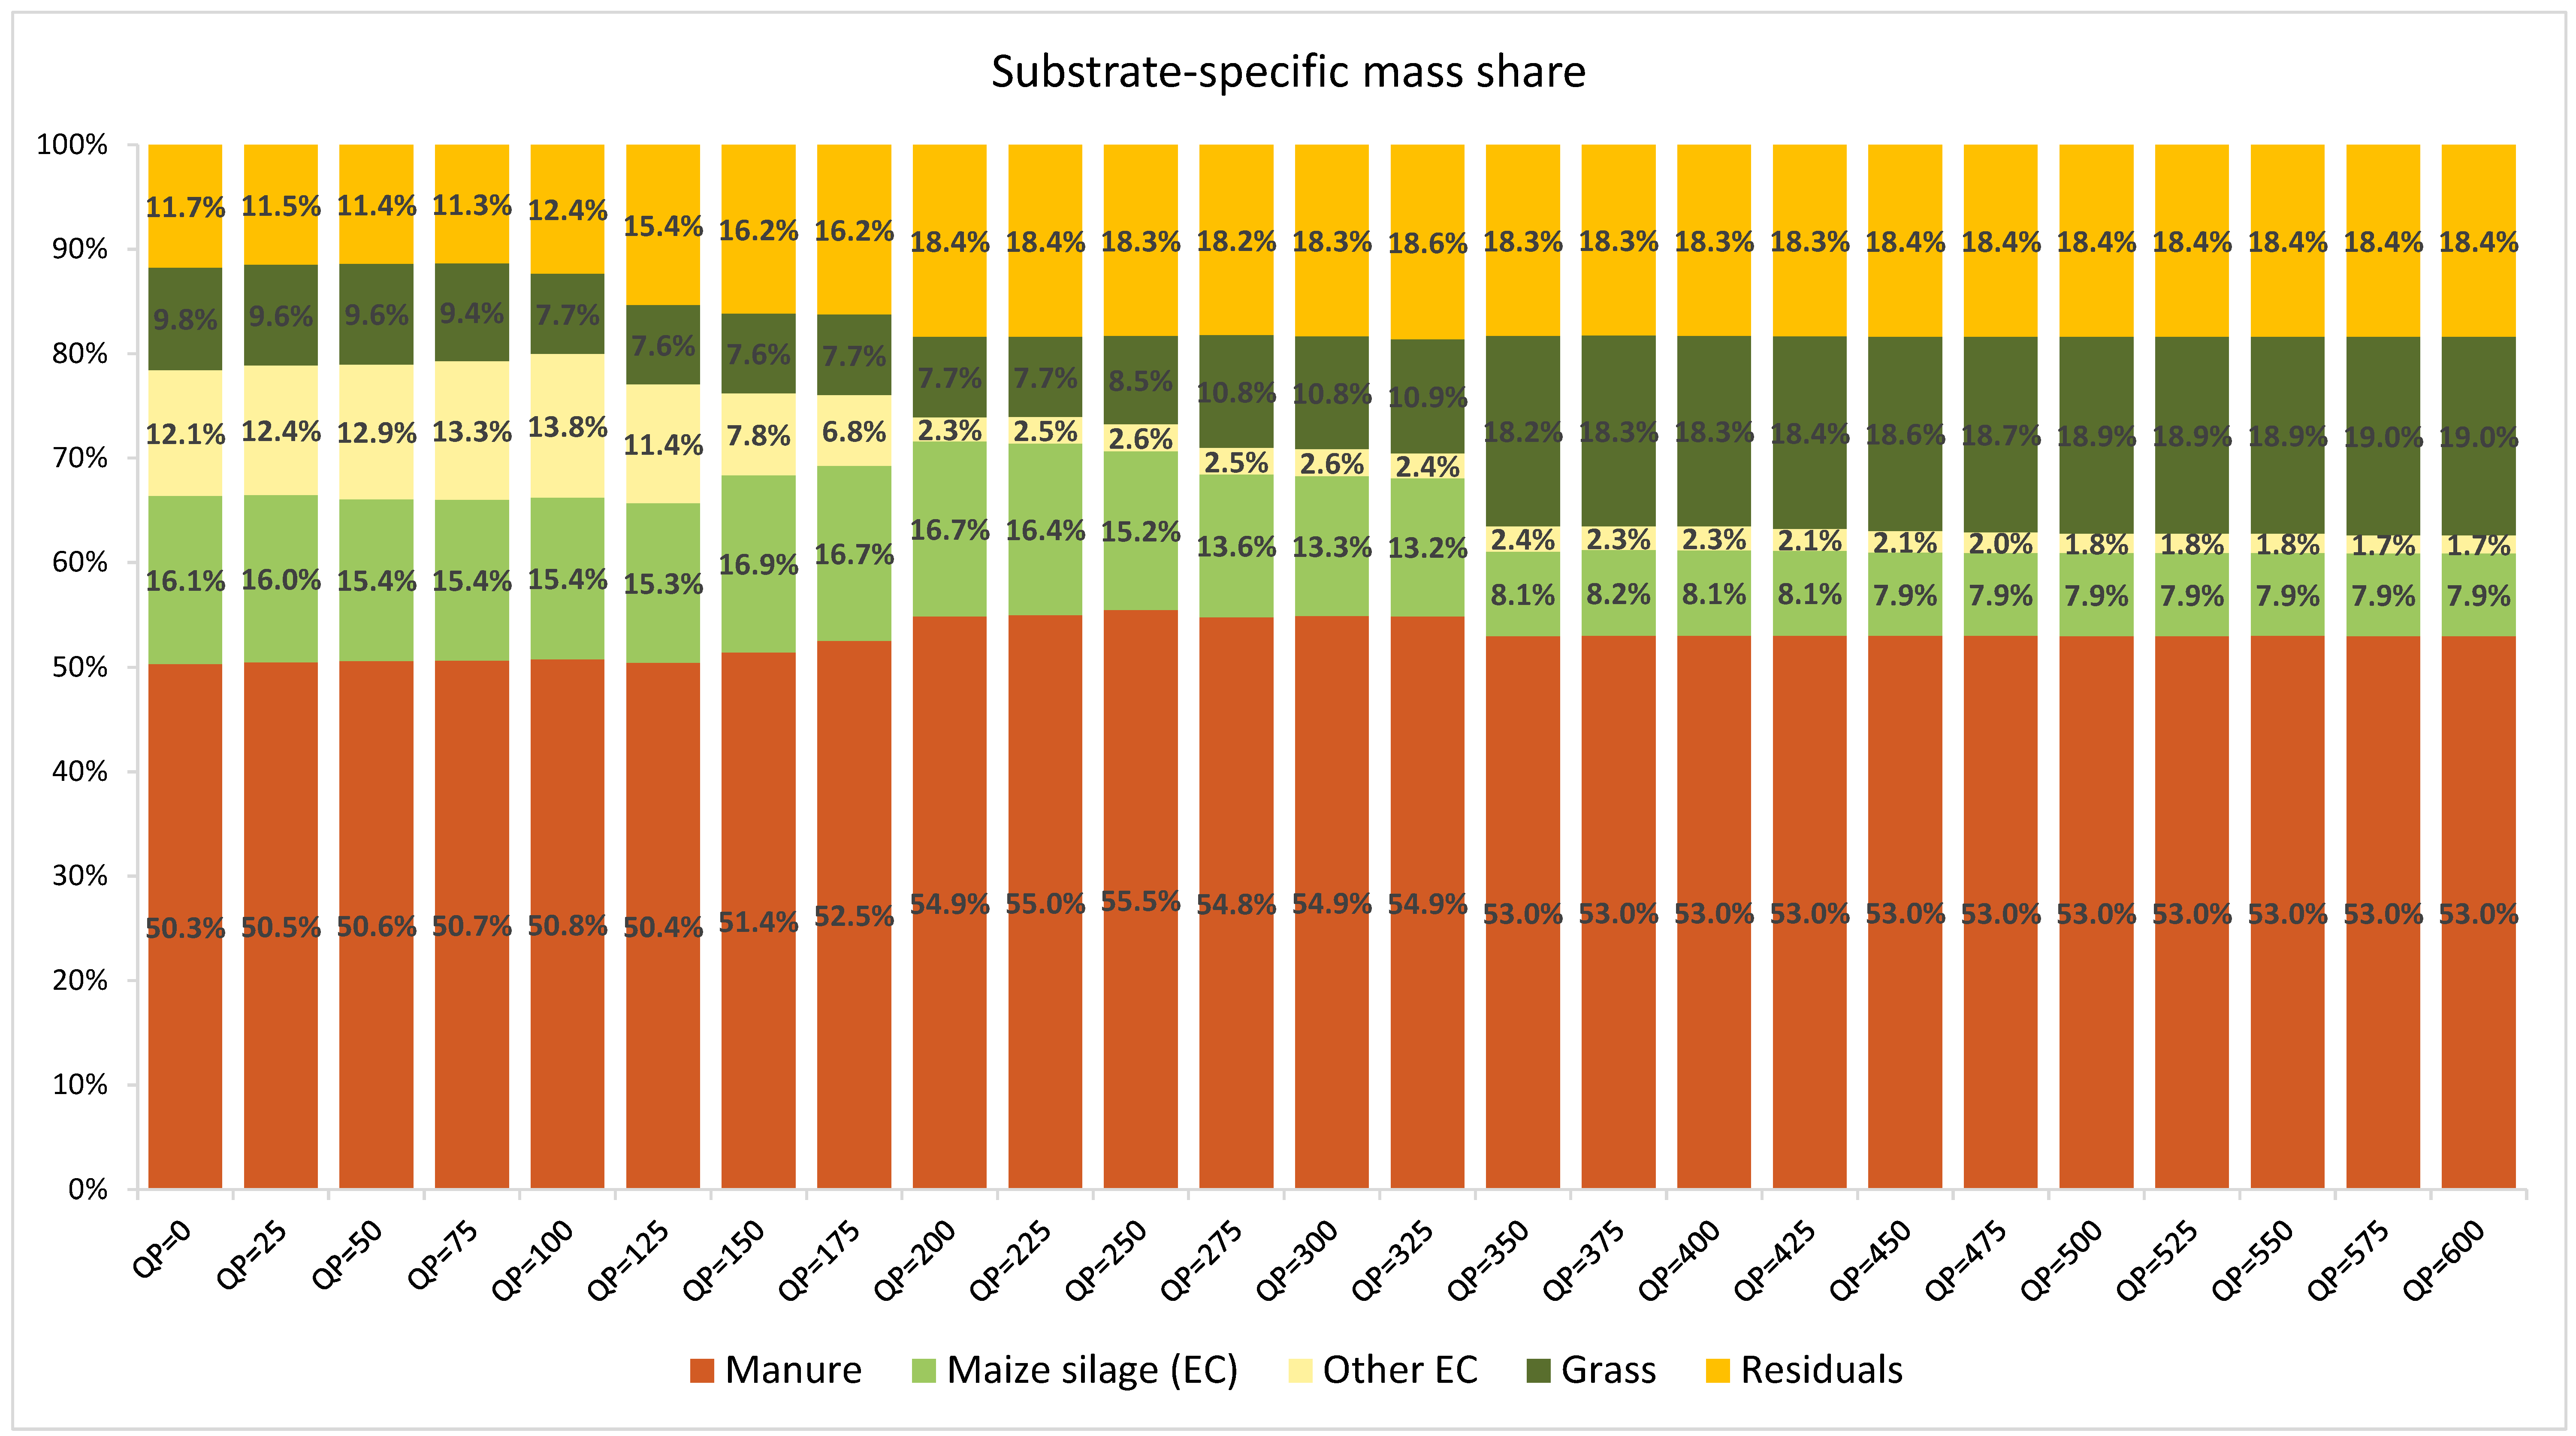
3.2.3. Impact of GHG Quota Price on Substrate Mix Consumption

Figure 7 illustrates the development of substrate-specific aggregate mass share with respect to the quota price. In each bar chart, the aggregate mass share of four substrate classes, manure, EC, grass, and residuals, is presented. Maize silage, classified as EC, is shown separately. The total mass consumption in the system is approximately 16 million tons and remains relatively constant across the quota price range. It is observed that manure holds the dominant share, exceeding 50% at all quota price levels. Increasing the quota price to 600 EUR/t CO2-eq substantially raises the shares of residuals and grass to 18.4% and 19%, respectively, while the shares of maize silage and other EC drop significantly to 7.9% and 1.7%, respectively. This indicates that higher quota prices create a great financial incentive to increase the use of manure and residuals while reducing EC consumption. Compared to EC, grass is a cheaper option and has lower GHG emissions. Thus, in addition to manure and residuals, grass usage is also encouraged.

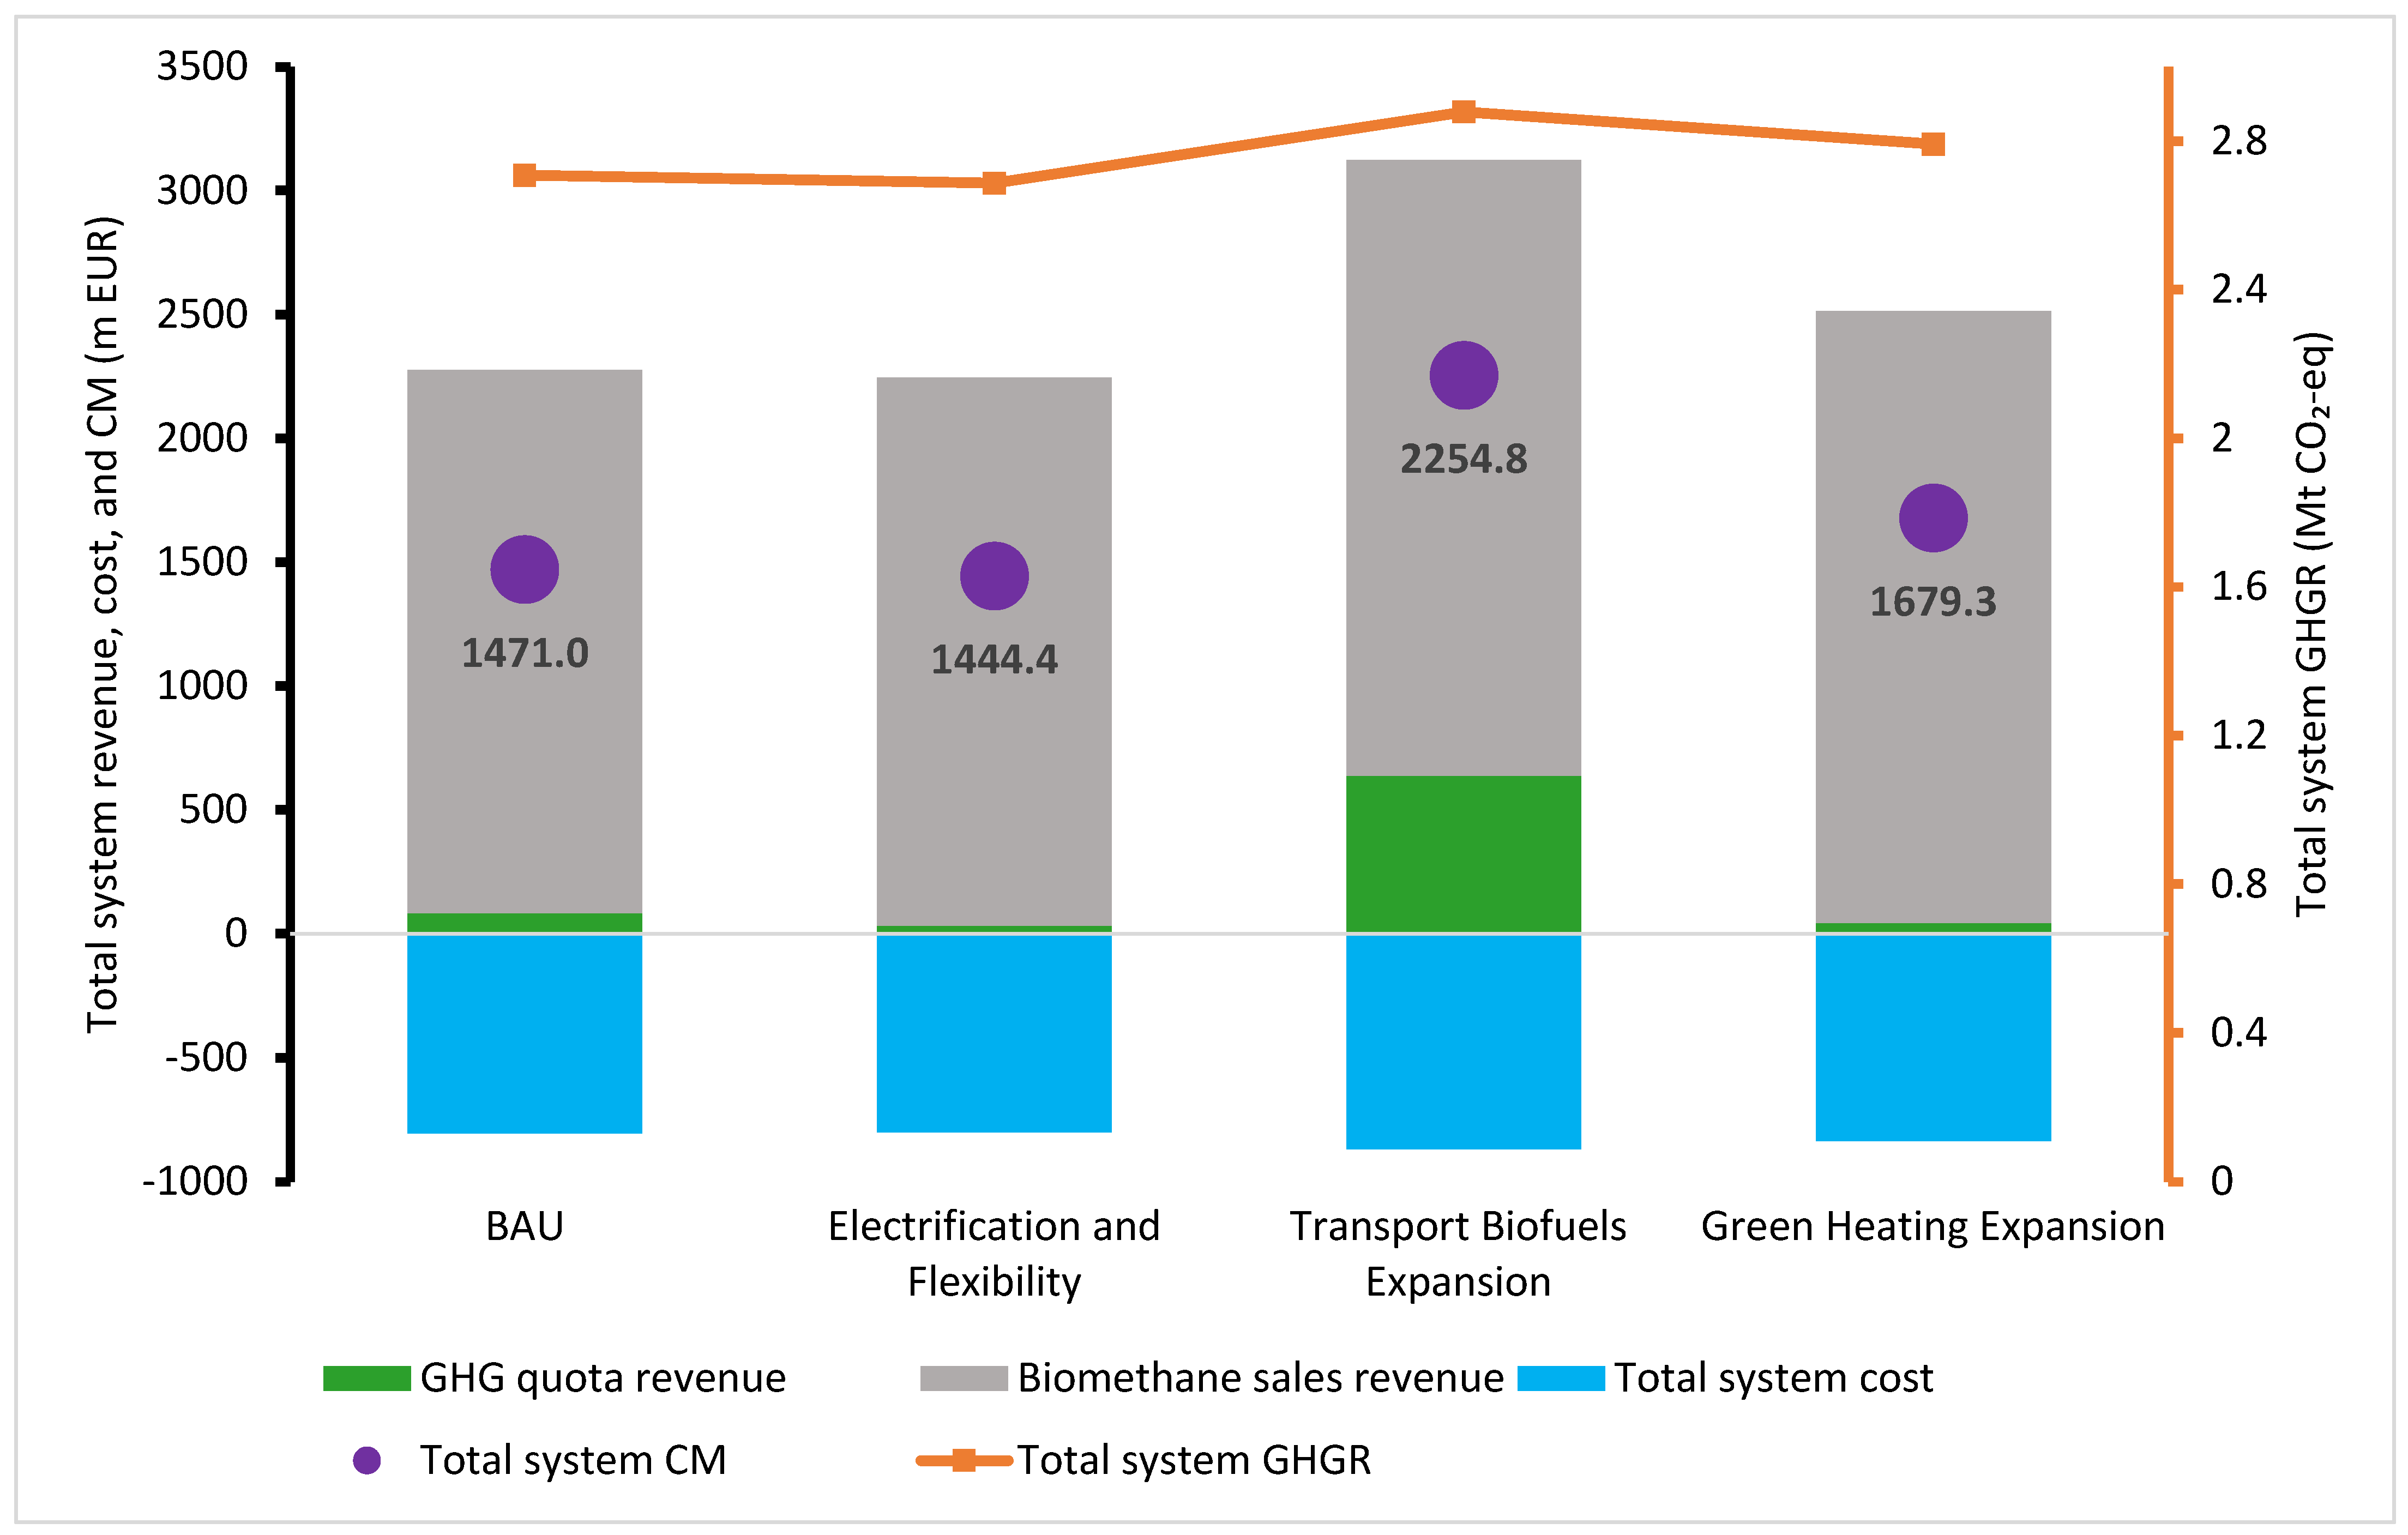
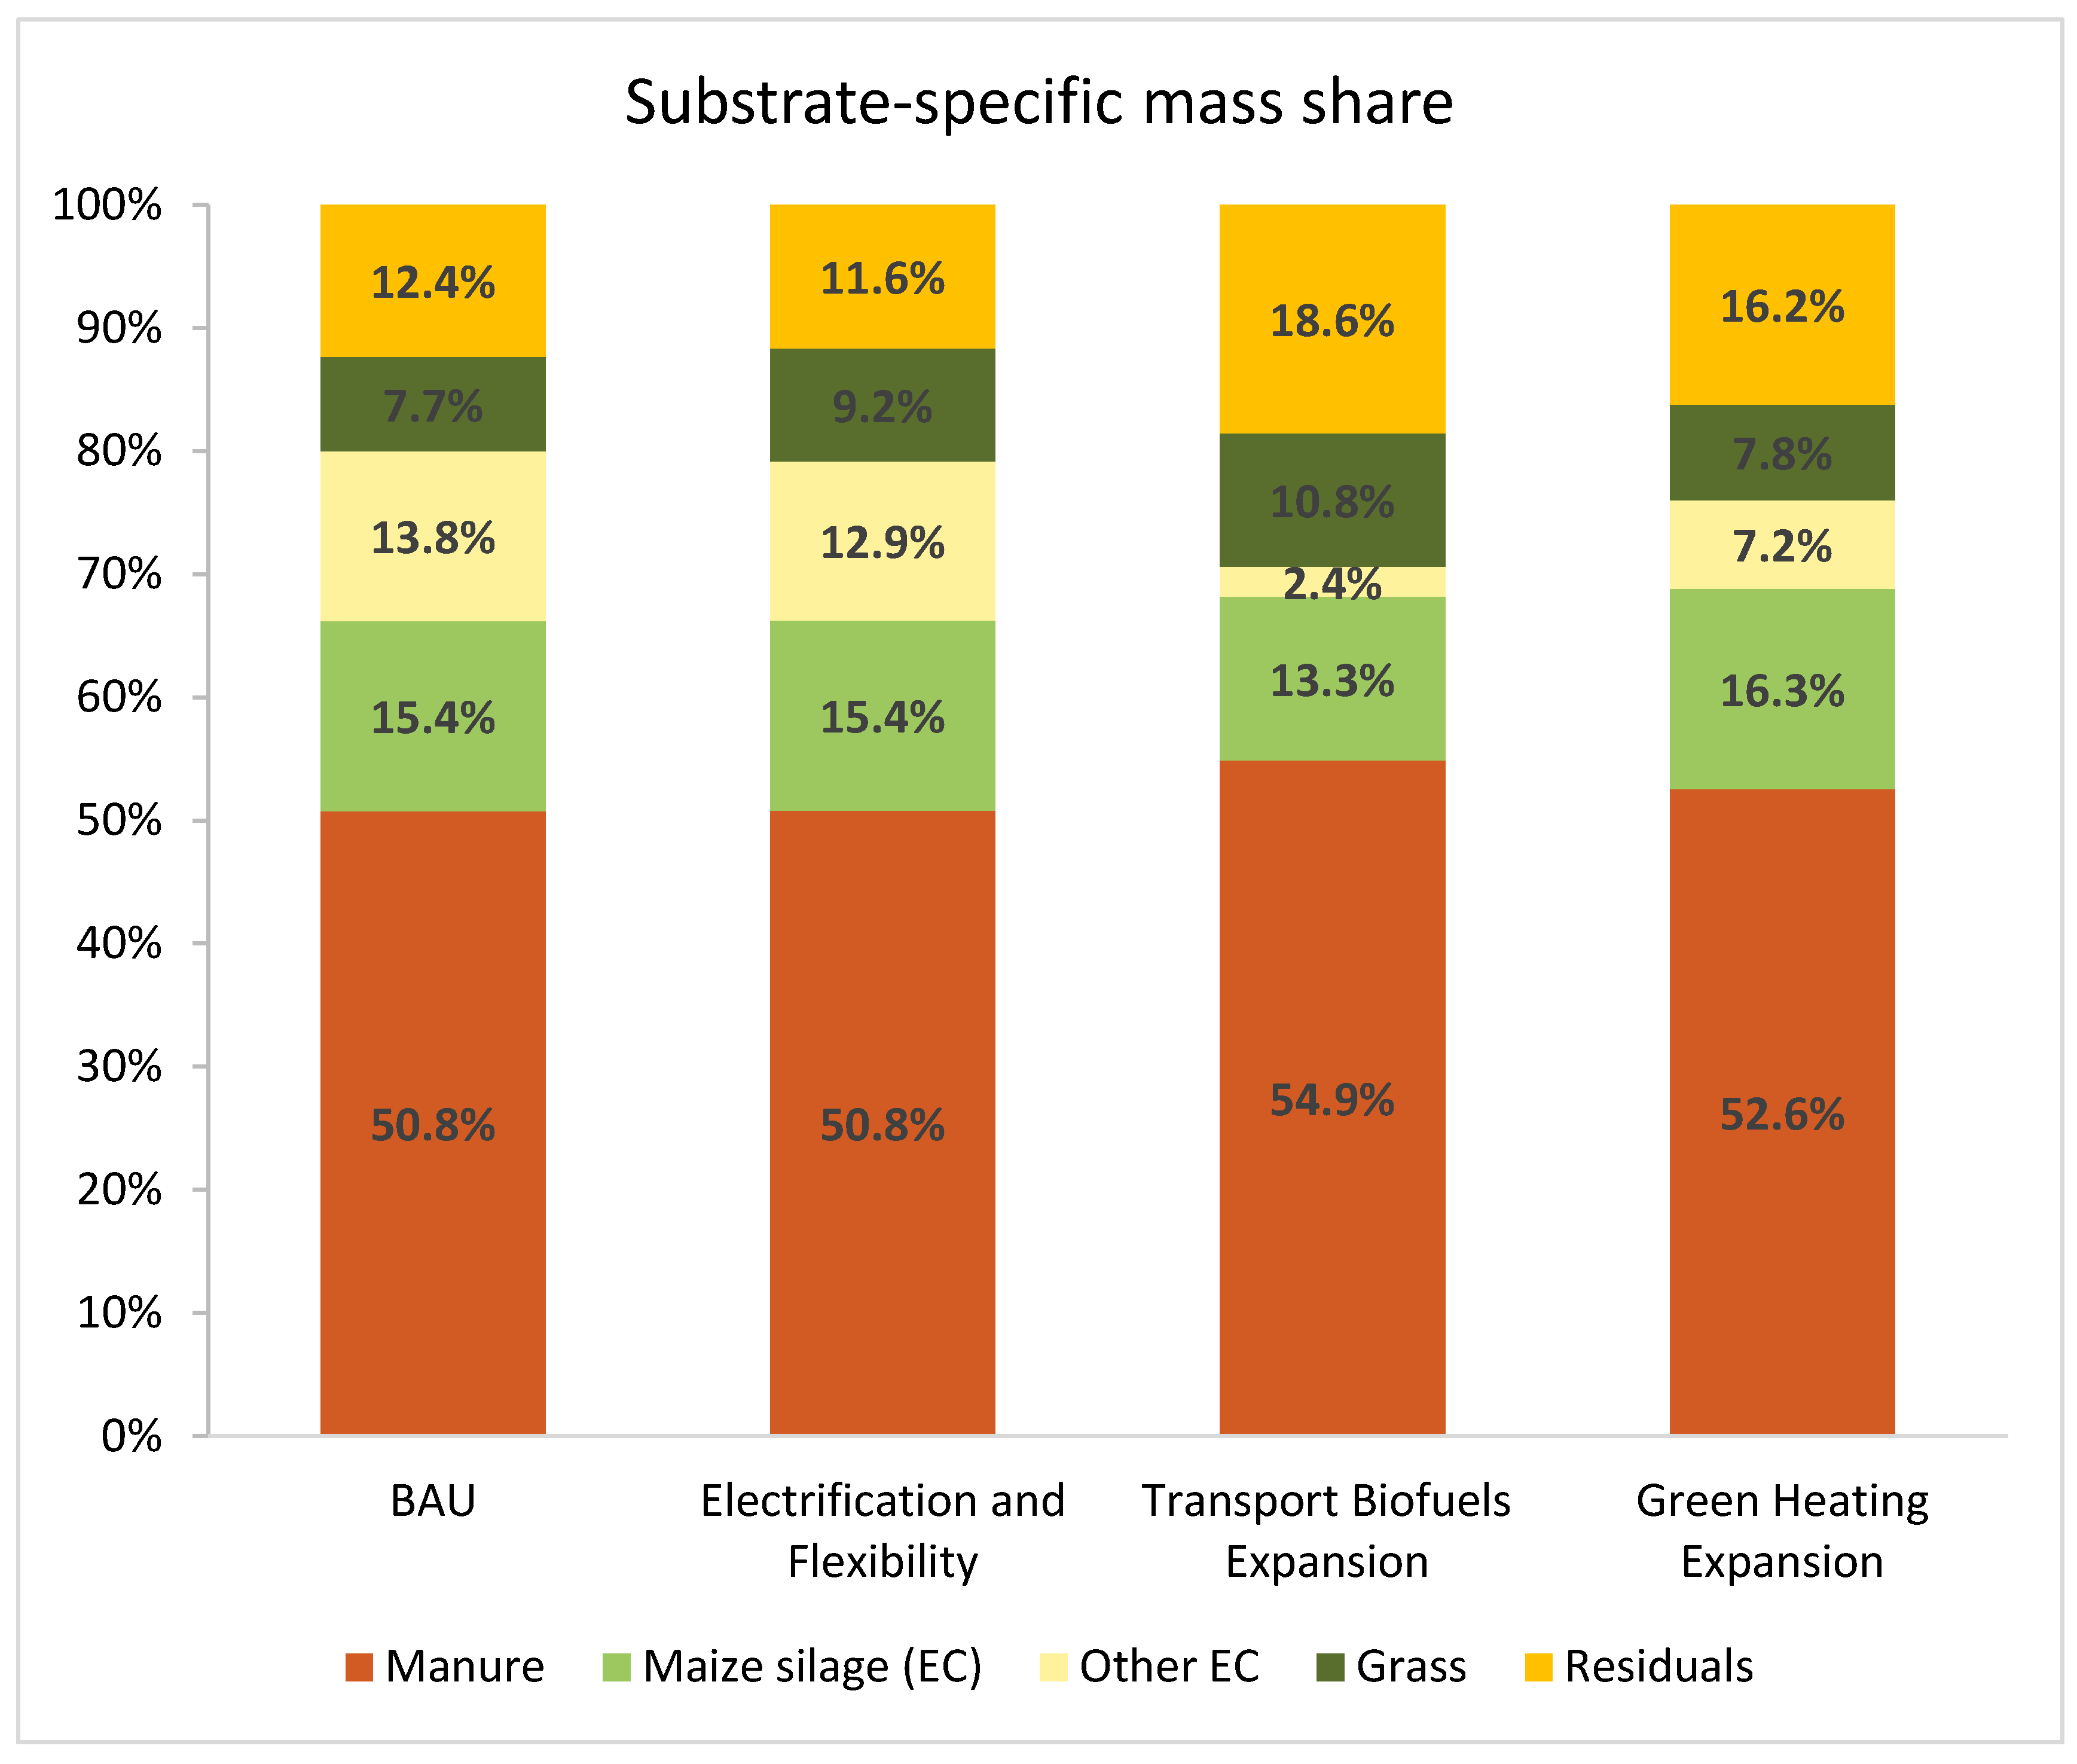
3.3. Scenario Analysis

The biomethane market system was economically investigated under different demand-based scenarios. Figure 8 compares the system economic indicators across these scenarios. As shown, the Transport Biofuels Expansion scenario creates the highest contribution margin (CM) of EUR 2254.8 million in the system. This scenario, with the highest GHG quota price of 300 EUR /t CO2-eq and a demand share of 30.3% in the transport-related markets, incentivizes BGPs to enhance the GHGR of their biomethane products and increase their revenues from the GHG quota market. Under the Transport Biofuels Expansion scenario, the system experiences the highest level of GHGR, almost 2.88 Mt CO2-eq, and the highest amount of revenue from the GHG quota market, amounting to approximately EUR 636.4 million. The Green Heating Expansion scenario ranks second in economic profitability. As shown, the BGPs significantly benefit from a high biomethane sales revenue, EUR 2471 million. However, the low GHG quota price of 100 EUR/t CO2-eq and the limited transport-sector demand share of 7.47% lead to a limited GHG quota revenue of EUR 42.6 million, which is lower than the amount generated under the BAU scenario. The Electrification scenario results in the lowest level of CM and GHGR, EUR 1444.4 million, and 2.69 Mt CO2-eq, respectively, in the system, despite an increased EEG market share of 80%. The reason for its low profitability lies in the lowest potential for high GHG quota revenues in the system. This indicates that the economic condition of the system relies substantially on the GHG quota price and the biomethane demand in the transport-related markets. Therefore, the biomethane market system could significantly benefit from the policy implemented under the BImSchG, which mandates an annual increase in the GHG quota for fossil fuel distributors until 2030, resulting in higher quota demand and, consequently, higher prices.
Figure 9 illustrates the total mass share of various substrate classes within the system under different scenarios. The total mass of the substrate mixture consumed in the system is approximately 16 million tons, which is almost constant across the scenarios. It is obvious that, in all scenarios, manure comprises more than half of the total substrate mass within the system. Under the Transport Biofuels Expansion scenario, the system experiences the highest share of manure and residuals usage, at 54.9% and 18.6%, respectively, while showing the lowest share of maize silage and other EC usage, at 13.3% and 2.4%, respectively. This demonstrates that the strong financial incentive provided by the GHG quota market encourages the reduction in GHG-intensive substrate usage while promoting the use of GHG quota-incentivized substrates, such as manure and residuals. Under the BAU and Electrification scenarios, the system exhibits relatively similar substrate usage patterns. The low GHG quota incentive in the Electrification scenario does not increase manure and residuals usage, and the system with the highest EEG market demand share is balanced by consuming marginally lower EC and residuals and higher grass, compared to the BAU scenario. Despite a higher transport demand share in the BAU scenario, the system shows a relatively higher consumption of manure and residuals and considerably lower EC usage (7.2%) in the Green Heating Expansion scenario. This suggests that, compared to the BAU and Electrification scenarios, shifting the demand to the heating sector benefits the system both economically and ecologically. As a result, in alignment with the national policy of decarbonizing the heating sector, the GEG regulation—mandating the use of at least 65% renewable energy in newly installed building heating systems—could significantly benefit the biomethane market system, as it would lead to increased demand for biomethane in the heating sector.

4. Discussion

The results reveal that the two-step optimization approach can be adopted to address the issue of supply shortages in non-transport biomethane markets, as identified in [4]. Through maximizing the revenue generated from the GHG quota market and leveraging the flexibility of options arising from the interconnected nature of biomethane markets, an improved GAP for BGPs is obtained, maximizing the profitability of the biomethane market system.
The insights provided by the analysis can benefit both market actors and policy makers. From the BGP operators’ perspective, they can use the analysis to make their investment strategies and operations more efficient. For example, they can determine their positions across the biomethane markets and predict their potential revenues based on the forecasted MCPs. From the energy traders’ perspective, they could utilize the generated MOCs and MCPs in individual markets to make profitable investment decisions under different demand-based scenarios. For example, the recent insolvency of the BMP Greengas company [26,27], one of the largest biomethane traders in Europe, highlights the significance of recognizing the impact of GHG quota price on the biomethane markets. The war in Ukraine and the resultant disruption in agricultural production and trade significantly affected the availability and cost of raw materials needed for biogas production. Moreover, the disruption of natural gas supplies from Russia caused a sharp rise in natural gas prices. At the same time, enforcing the GHG quota regulation in the transport sector and the quota price of higher than 400 EUR/t CO2-eq revealed a major biomethane demand shift to the transport markets. However, many of BMP Greengas’s supply contracts with biomethane CHP units were fixed at lower prices and the procurement of biomethane for those customers was only possible at higher prices. Consequently, the company faced severe challenges in supplying their customers with the agreed prices. As another application of the designed optimization models, policy makers and regulators can assess how different policies regarding the GHG quota or biomethane demand shares across different sectors could affect the profitability of the biomethane market system. For instance, policies affecting biofuel imports and regulations that expand or limit the quota fulfillment options for fossil fuel distributors could substantially impact the GHG quota price and tend to cause substantial shifts in the biomethane markets, which need to be carefully investigated in advance of enforcement.
Considering the potential growth in cross-border trades within the international biomethane market, driven by the REPowerEU goal of achieving 35 billion cubic meters of biomethane by 2030, this study makes a foundational step towards developing the potential concept of biomethane market coupling, which is a similar concept to market coupling in the electricity sector [28] and aimed at improving efficiency and facilitating cross-border trading. This concept could be implemented through extending the system boundaries of the optimization models to include the BGPs located in connected regions, along with the integration of new regulatory and technical constraints.
A yearly increase in the GHG quota to 25% by 2030 and thus stronger financial incentive for BGPs in the transport sector without having a similar incentive across other sectors, such as EEG and heat, would create an unbalanced market situation which is more prone to experience significant shifts. The sensitivity analysis reveals that increasing the GHG quota price leads to higher prices in the biomethane market of M2-EEG. This could negatively affect the operational cost of the biomethane CHP units and possibly diminish the demand share of biomethane in this sector. Therefore, more governmental support in this sector is necessary. The short-term outlook of biomethane contribution to the heating sector seems positive under the implementation of the GEG regulation. Nevertheless, the competition among hydrogen and biomethane to gain a larger share in this sector needs to be considered. Hydrogen was underscored by the German government [29] to be established as a decarbonization option contributing to the national goal of being GHG-neutral by 2045. It is expected that various subsidies and import options would make this energy carrier more cost competitive and thus create risks for long-term investments in biomethane in the heating sector.
Germany’s policy shift toward replacing EC with agricultural residues in the substrate mix has posed a significant challenge for the biogas production sector [1]. Considering the profound impact of manure and residual consumption on the profitability of the biomethane market system, the development of a more efficient feedstock collection and distribution infrastructure across BGPs is essential. Policy mandates and targeted incentives could encourage farmers and livestock producers to participate actively in the aggregation of these substrates. Integrating such regulatory frameworks with smart logistics, such as digital monitoring and optimized routing, could significantly reduce feedstock procurement costs and upstream GHG emissions, thereby supporting the regional circular economy.
There is significant uncertainty surrounding future grid access and connection conditions. On one hand, Germany plans to transition much of its gas network from natural gas to hydrogen; therefore, some parts of the gas grid might be dismantled or converted to hydrogen-only. On the other hand, the European Court of Justice (ECJ) ruled that Germany must ensure the Federal Network Agency (Bundesnetzagentur) operates with greater independence from government influence. It is expected that a revised version of the GasNZV (Gas Network Access Ordinance) will be announced by the Federal Network Agency by 01.01.2026 [3]. In the current study, these potential regulatory changes concerning grid connection were not assessed. It was assumed that the BGPs would pursue “biomethane upgrading” as their post-EEG repowering option. However, a proportion of BGPs might choose the “seasonal flexibilization” concept and continue operating their CHP units in the EEG power market. The GHG quota price, despite its high risks, was treated as risk-neutral; thus, no risk metrics such as value-at-risk (VaR) or conditional value-at-risk (CVaR) were incorporated into the optimization objective function. Due to the large-scale modeling context, involving the simultaneous optimization of 1366 BGPs with decision variables defined on a yearly basis, an LP approach was adopted. This method offers simplicity in mathematical formulation and ensures fast computational resolution, making it suitable for large-scale economic analysis. However, for daily or monthly optimization of a single BGP, especially when the focus is on technical gas production dynamics, the substrate-specific degradation time becomes a critical factor. In such cases, the simplifications of LP are insufficient, and a non-linear programming (NLP) approach is required to accurately model digestion kinetics and time-dependent gas yields [30].
For future research, the optimization model could be further generalized, and the system boundaries could be extended to include biomethane markets in neighboring countries to Germany. This requires accounting for additional factors, such as transportation costs, limited pipeline capacities, and regional regulatory constraints. This way, biomethane markets in different regions could be coupled where interconnections exist. Appropriate risk metrics, such as CVaR, could be integrated into the optimization model, allowing the consideration of GHG quota price risks. The business model related to the “biomethane upgrading” repowering option could be further developed; incorporating carbon capture and storage (CCS) as an add-on to biomethane production, producing CO2 as a secondary product alongside biomethane, could strengthen the business model for BGPs. The sensitivity of the market dynamics to other input parameters such as substrate data and market-specific regulatory factors could be evaluated.

5. Conclusions

This study shows that the profitability of the biomethane market system can be maximized by implementing CE-GAP, an improved GAP, for all BGPs. The developed optimization models efficiently respond to higher GHG quota prices by encouraging BGPs to produce biomethane products with lower emission levels and by prioritizing them in transport markets. Higher GHG quota prices lead to a greater consumption of manure and residuals, while discouraging the use of EC. Additionally, the consumption of grass, a cheaper option compared to EC, is enhanced. Moreover, according to the sensitivity analysis, higher GHG quota prices result in a significant increase in the MCP in M2-EEG. This highlights the need for increased governmental support for biomethane CHP units. The expected competition between hydrogen and biomethane to gain a higher share in the heating sector could cause risks to long-term investments in biomethane.
Among all demand-based scenarios, the Transport Biofuels Expansion scenario results in the highest CM of EUR 2254.8 million in the system. The profitability of the system depends considerably on the GHG quota price and the demand share of transport markets. Nevertheless, compared to the BAU and Electrification scenarios, shifting the demand to the heating sector under the Green Heating Expansion scenario considerably increases the system profitability and provides positive ecological effects by lowering the EC consumption. Overall, policies and regulations that drive up the GHG quota price (e.g., the 36. BImSchV) or encourage biomethane demand in the heating sector (e.g., the GEG) can generate both economic and ecological benefits within the system.
The significance of this study lies in introducing a novel two-step optimization approach through which an optimized GAP for BGPs is calculated. Integrated production, achieved by adopting the CE-GAP across all BGPs, enables the clearing of all biomethane markets at minimum generation cost. Taking into account the risks assigned to the GHG quota price, however, could further improve the GAP of BGPs. Furthermore, considering cross-border biomethane trades and the integration of interconnected regional biomethane markets into the optimization models could expand the BGPs’ GAP and develop the potential concept of biomethane market coupling.

Supplementary Materials

The following supporting information can be downloaded at: https://www.mdpi.com/article/10.3390/en18112991/s1.

Author Contributions

Conceptualization, M.R. and J.G.; Data curation, M.R.; Formal analysis, M.R.; Methodology, M.R. and J.G.; Software, M.R.; Validation, M.R.; Visualization, M.R.; Writing—original draft, M.R.; Funding acquisition, L.E.; Writing—review and editing, J.G. and L.E.; Supervision, L.E.; Project administration, L.E. All authors have read and agreed to the published version of the manuscript.

Funding

This contribution is based on work carried out in the research project “The Triple-A-Process (AmbientAminAbsorption)—Optimized gas scrubbing for a scalable expansion of biomethane production adapted to the raw gas infrastructure” (FKZ: 2220NR161A) and was funded by the German Federal Ministry of Food and Agriculture via the German Agency for Renewable Resources (FNR).

Data Availability Statement

The original contributions presented in this study are included in the supplementary material. Further inquiries can be directed to the corresponding author.

Conflicts of Interest

During the development of the current study, Joshua Güsewell was employed by the Stadtwerke Stuttgart GmbH. The authors declare that the research was conducted in the absence of any commercial or financial relationships that could be construed as a potential conflict of interest.

Abbreviations

The following abbreviations are used in this manuscript:
BGPBiogas Plant
MCPMarket-clearing Price
EEGRenewable Energy Sources Act
REDIIRenewable Energy Directive II
BImschVFederal Emission Control Ordinance
BEHGFuel Emissions Trading Act
GEGBuilding Energy Act
CHPCombined Heat and Power
FMFresh Mass
DSCDigestate Storage Capacity
OLROrganic Loading Rate
GHGGreenhouse Gas
LHVLower Heating Value
SNGSubstitute Natural Gas
BAUBusiness As Usual
FAMEFatty Acid Methyl Ester

References

  1. IEA. Renewables 2024; International Energy Agency (IEA): Paris, France, 2024. [Google Scholar]
  2. Geschäftsstelle der Arbeitsgruppe Erneuerbare Energien-Statistik (AGEE-Stat) am Umweltbundesamt. Erneuerbare Energien in Deutschland Daten zur Entwicklung im Jahr 2021; Umweltbundesamt: Dessau-Roßlau, Germany, 2022; p. 28. [Google Scholar]
  3. Deutsche Energie-Agentur GmbH (dena). ANALYSE Branchenbarometer Biomethan 2024; Deutsche Energie-Agentur GmbH (dena): Berlin, Germany, 2024. [Google Scholar]
  4. Güsewell, J.; Rousta, M.; Eltrop, L. Trade-Offs in Biomethane Production by Substrate Mixture Optimization under German Market Conditions. Energy Sustain. Soc. 2024, 14, 42. [Google Scholar] [CrossRef]
  5. dos Santos, N.P. German GHG Compliance Costs Drop to 2023 Level. 2024. Available online: https://www.argusmedia.com/en/news-and-insights/latest-market-news/2532952-german-ghg-compliance-costs-drop-to-2023-level (accessed on 30 January 2024).
  6. Achtunddreißigste Verordnung zur Durchführung des Bundes-Immissionsschutzgesetzes1,2 (Verordnung zur Festlegung weiterer Bestimmungen zur Treibhausgasminderung bei Kraftstoffen—38. BImSchV). Available online: https://www.gesetze-im-internet.de/bimschv_38_2017/BJNR389200017.html (accessed on 25 November 2024).
  7. Güsewell, J.; Härdtlein, M.; Eltrop, L. A Plant-specific Model Approach to Assess Effects of Repowering Measures on Existing Biogas Plants: The Case of Baden-Wuerttemberg. GCB Bioenergy 2019, 11, 85–106. [Google Scholar] [CrossRef]
  8. Lauer, M.; Thrän, D. Biogas Plants and Surplus Generation: Cost Driver or Reducer in the Future German Electricity System? Energy Policy 2017, 109, 324–336. [Google Scholar] [CrossRef]
  9. Güsewell, J.; Scherzinger, K.; Holstenkamp, L.; Vincent, L.; Eltrop, L. Extending the Operation of Existing Biogas Plants: Which Follow-Up Concepts and Plants Will Prevail? Front. Energy Res. 2021, 9, 719697. [Google Scholar] [CrossRef]
  10. Schröer, D.; Latacz-Lohmann, U. Flexibilization or Biomethane Upgrading? Investment Preference of German Biogas Plant Operators for the Follow-up of Guaranteed Feed-in Tariffs. GCB Bioenergy 2024, 16, e13111. [Google Scholar] [CrossRef]
  11. Matschoss, P.; Steubing, M.; Pertagnol, J.; Zheng, Y.; Wern, B.; Dotzauer, M.; Thrän, D. A Consolidated Potential Analysis of Bio-Methane and e-Methane Using Two Different Methods for a Medium-Term Renewable Gas Supply in Germany. Energy Sustain. Soc. 2020, 10, 41. [Google Scholar] [CrossRef]
  12. Ladislaw, S.; Naimoli, S.J. Climate Solutions Series: Decarbonizing Heavy Industry; Center for Strategic & International Studies: Washington, DC, USA, 2020. [Google Scholar]
  13. Sulewski, P.; Ignaciuk, W.; Szymańska, M.; Wąs, A. Development of the Biomethane Market in Europe. Energies 2023, 16, 2001. [Google Scholar] [CrossRef]
  14. Bundesregierung. Für Mehr Klimafreundliche Heizungen; Germany. 2024. Available online: https://www.bundesregierung.de/breg-de/aktuelles/neues-gebaeudeenergiegesetz-2184942 (accessed on 27 August 2024).
  15. Schnaars, P.; Willers, P.; Nalbach, H.; Diers, H.; Kienscherf, P.A. Die Kraftwerksstrategie 2026: Ziele und Herausforderungen. 2023. Available online: https://www.ewi.uni-koeln.de/de/publikationen/kraftwerksstrategie-2026-ziele-und-herausforderungen/ (accessed on 27 April 2025).
  16. Bundesregierung. § 37h—Bundes-Immissionsschutzgesetz (BImSchG); Germany. 2013. Available online: https://www.buzer.de/37h_BImSchG.htm (accessed on 24 September 2021).
  17. Liepold, C.; Fabianek, P.; Madlener, R. A Critical Evaluation of the 2022 Greenhouse Gas Mitigation Quota in Germany from an Environmental Economics and Policy Perspective. SSRN J. 2023, 191. [Google Scholar] [CrossRef]
  18. Sechsunddreißigste Verordnung zur Durchführung des Bundes-Immissionsschutzgesetzes (Verordnung zur Durchführung der Regelungen der Biokraftstoffquote) (36. BImSchV) § 11 Anpassung der Treibhausgasminderungs-Quote. Available online: https://www.gesetze-im-internet.de/bimschv_36/BJNR006010007.html (accessed on 4 June 2024).
  19. THG-Experten. Die Höhe Der THG Quote 2023 Sinkt; Grünwald, Germany. 2023. Available online: https://thg-experten.de/blog/posts/die-hohe-der-thg-quote-2023 (accessed on 1 February 2023).
  20. The Brussels Times. EU Biodiesel Sector Applauds Anti-Dumping Probe into Chinese Imports. 2024. Available online: https://www.brusselstimes.com/875541/eu-launches-anti-dumping-investigation-into-chinese-biodiesel-imports (accessed on 13 January 2024).
  21. Auburger, S.; Jacobs, A.; Märländer, B.; Bahrs, E. Economic Optimization of Feedstock Mix for Energy Production with Biogas Technology in Germany with a Special Focus on Sugar Beets—Effects on Greenhouse Gas Emissions and Energy Balances. Renew. Energy 2016, 89, 1–11. [Google Scholar] [CrossRef]
  22. Güsewell, J.; Bahret, C.; Eltrop, L. AuRaSa–BIOGAS Auswirkungen von Veränderten Energie-und Umweltrelevanten Rahmenbedingungen und Technologiefortschritt auf die Entwicklung Sächsischer Biogasanlagen; Sächsisches Landesamt für Umwelt, Landwirtschaft und Geologie (LfULG): Dresden, Germany, 2020. [Google Scholar]
  23. European Union. Richtlinie des Europäischen Parlaments und des Rates zur Förderung der Nutzung von Energie Aus Erneuerbaren Quellen (Neufassung): RED II. 2018. Available online: https://eur-lex.europa.eu/eli/dir/2018/2001/oj?locale=de (accessed on 11 December 2018).
  24. Gesetz zur Einsparung von Energie und zur Nutzung Erneuerbarer Energien zur Wärme- und Kälteerzeugung in Gebäuden* (Gebäudeenergiegesetz—GEG) § 71 Anforderungen an Eine Heizungsanlage. Available online: https://www.gesetze-im-internet.de/geg/BJNR172810020.html (accessed on 16 October 2023).
  25. Federal Ministry for Economic Affairs and Climate Action (BMWK). Directive on the Funding of Climate-Neutral Production Processes in Industry Through Carbon Contracts for Difference; Germany. 2024. Available online: https://www.klimaschutzvertraege.info/lw_resource/datapool/systemfiles/elements/files/214a25cf-6ea3-11ef-80a9-a0369fe1b6c9/live/document/240601_EN_F%C3%B6rderrichtlinie_Klimaschutzvertr%C3%A4ge.pdf?utm_source=chatgpt.com (accessed on 11 March 2024).
  26. Bioenergy Insight Woodcote Media Ltd. Bmp Greengas Insolvency to Cause “at Least” €150 Million in Losses; Morden, England. 2023. Available online: https://www.bioenergy-news.com/news/bmp-greengas-insolvency-to-cause-at-least-e150-million-in-losses/ (accessed on 7 August 2023).
  27. Der Spiegel. Pleite von BMP Greengas Besorgt Deutsche Stadtwerke; Hamburg, Germany. 2023. Available online: https://www.spiegel.de/wirtschaft/enbw-tochter-pleite-von-bmp-greengas-besorgt-deutsche-stadtwerke-a-4b35d74e-15f5-4180-bc90-91141686b2b8 (accessed on 3 August 2023).
  28. Kristiansen, T. The Flow Based Market Coupling Arrangement in Europe: Implications for Traders. Energy Strategy Rev. 2020, 27, 100444. [Google Scholar] [CrossRef]
  29. Federal Ministry for Economic Affairs and Energy, Public Relations Division. The National Hydrogen Strategy; Federal Ministry for Economic Affairs and Energy, Public Relations Division: Berlin, Germany, 2020.
  30. Willeghems, G.; Buysse, J. Changing Old Habits: The Case of Feeding Patterns in Anaerobic Digesters. Renew. Energy 2016, 92, 212–221. [Google Scholar] [CrossRef]
Figure 1. Overview of the model framework BGP-RepoMod, updated by including the BioCH4 markets optimization LP model and by developing the substrate mix optimization LP model.
Energies 18 02991 g001
Figure 2. Development of BGPs’ GAP from IGAP to CE-GAP, considering the potential reallocation of each product across the five biomethane markets.
Energies 18 02991 g002
Figure 3. Optimized reallocation of aggregate biomethane products of all studied BGPs across different markets.
Energies 18 02991 g003
Figure 4. MOC and specific GHGR curves in individual biomethane markets for both market-clearing schemes: applying BGPs’ CE-GAP and IGAP.
Energies 18 02991 g004
Figure 5. Development of MCPs for individual biomethane markets with respect to the GHG quota price.
Energies 18 02991 g005
Figure 6. MOC and specific GHGR curves in individual biomethane markets for two GHG quota prices: 100 and 600 EUR/t CO2-eq.
Energies 18 02991 g006
Figure 7. Development of substrate-specific aggregate mass share with respect to the GHG quota price. (Note: Percentages were rounded to one decimal place; totals may deviate from 100%).
Energies 18 02991 g007
Figure 8. System economic conditions under various scenarios.
Energies 18 02991 g008
Figure 9. Total mass share of various substrate classes within the system under different scenarios. (Note: Percentages were rounded to one decimal place; totals may deviate from 100%).
Energies 18 02991 g009
Table 1. Biomethane markets [4].
Market Type (Abbreviation)DescriptionRegulatory Framework
Market 1 (M1-GHG-Q)Fuel in the transport sector (linked to GHG quota market) REDII, BImschV, BEHG
Market 2 (M2-EEG)Fuel for biomethane CHP plants working under the EEG requirementsEEG
Market 3 (M3-NG)Regulatory-free SNG buyers
Market 4 (M4-GreenG)Green gas market for heating processesGEG, BEHG
Market 5 (M5-Adv.GHG-Q)Advanced fuel in the transport sector (linked to GHG quota market) REDII, BImschV, BEHG
Table 2. Constraints of the substrate mix optimization problem.
TypeConstraintsClassUnitBoundary Conditions for Each Market
M1-GHG-QM2-EEGM3-NGM4-GreenGM5-Adv.GHG-Q
Market-specific equilibriumGas supplyEqualitykWhMarket-specific demand
Plant-specificMethane productionMaxNm3Plant-specific REF values (production capacity)
Digestate storage capacity (DSC)MindPlant-specific REF values
RegulatoryHRTgastight systemMin d0150000
GRT vs. fossil reference *Max *%−78−800−80−78
Maize capMax% of the mix036000
Upper bounds for substrate groupsMax% of mix EC: 0%, grass: 0%, residuals: 20%, manure: 100%
ProcessTSIn, digesterMax%36
TSOut, digesterMax%15
OLRMaxkg VS/m3 d6
HRTdigesterMindPlant-specific REF values
NormativeUpper bounds for substrate groupsMax% of mixEC: 80%, grass: 50%, residues: 20%, manure: 100%
Upper substrate-specific boundsMax% of mixSee substrate property data in the Supplementary Materials File S1
Lower/upper bounds manureMax/Mint FM/a0% of the REF input/130% of the REF input
* The model sets upper limits for GHG emissions in kg CO2-eq/MWh.
Table 3. Market share allocations of various products (Pj), within the levels of regulatory restrictions.
ProductsP1P2P3P4P5
Markets
Fuel in the transport sector (M1-GHG-Q)
Biomethane CHP units (M2-EEG)
Regulatory-free SNG buyers (M3-NG)
Industrial heating processes (M4-GreenG)
Advanced fuel in the transport sector (M5-Adv.GHG-Q)
Table 4. Scenarios with corresponding market-specific demand shares.
ScenariosBAU [3]Electrification and FlexibilityTransport Biofuels ExpansionGreen Heating Expansion
Market Type
M1-GHG-Q0.30%0.01%0.30%0.01%
M2-EEG72.49%80.00%60.00%60.00%
M3-NG2.53%2.53%2.53%2.53%
M4-GreenG10.87%10.87%7.17%30.00%
M5-Adv.GHG-Q13.81%6.59%30.00%7.46%
Total volume (TWhLHV) [3]8.9388
GHG quota price (EUR/t CO2-eq)10080300100
Table 5. Scenario specifications.
ScenariosNarratives and Key Drivers
BAU [3]
  • Biomethane market demand shares remain unchanged.
  • Conventional biofuels, such as biodiesel (FAME), bioethanol, and hydrotreated vegetable oil (HVO), continue to dominate biofuel consumption in the transport sector.
Electrification and Flexibility (Peak-Load Balancing)
  • The expansion of electric vehicles and electrified heating technologies (e.g., heat pumps, power-to-heat, electric boilers) increases electricity demand.
  • Increasing the share of intermittent wind and solar power creates a greater need for flexible backup capacity to ensure grid stability.
  • Flexible biomethane CHP plants are incentivized to provide dispatchable backup power instead of baseload generation, supported by the EEG through improved tender conditions (e.g., higher bid limits).
  • A comprehensive biomass support package, building on the upcoming National Biomass Strategy (NABIS), is expected to promote the targeted use of biomass for flexible power and heat generation [3].
Transport Biofuels Expansion (GHG Quota Growth)
  • The EU target of a minimum 14% renewable energy share in transport (RED II), along with Germany’s national 25% GHG quota for fossil fuel distributors by 2030 (BImSchG), drive increasing demand for biofuels in the transport sector.
  • The required minimum 2.6% share of advanced biofuels in the energy portfolios of fossil fuel distributors by 2030 (RED II) leads to higher demand for advanced biofuels.
  • Due to a high quota price range of 300 to 450, considered necessary for new project investments [3], the biomethane share in the transport sector is expanded.
  • The removal of UER (upstream emission reduction) from the GHG quota fulfillment options starting in 2026 [3] encourages greater use of biofuels in the energy portfolio of GHG quota-mandated companies in Germany.
Green Heating Expansion
  • Mandating at least 65% renewable energy sources for newly installed heating systems in buildings (GEG) drives demand for green fuels such as biomethane and hydrogen in the heating sector in Germany [24].
  • Heat-intensive industries, such as steel and cement, are subsidized through climate protection contracts such as Carbon Contracts for Difference (CCfD), which cover the additional costs of adopting climate-friendly technologies and thus support their transition to green fuels [25].
Table 6. Quantitative comparison between two market-clearing schemes: applying BGPs’ CE-GAP and IGAP.
Total Prod. Cost Share (%)Change
(%)
Total GHGR Share (%)Change (%)Total Revenue (m EUR)Change (%)TCM (m EUR)Change (%)
IGAP_M10.288−0.0420.273+0.0854.37−15.902.06−17.39
CE-GAP_M10.2460.3583.681.70
IGAP_M273.490−1.62271.043+0.8731639.00−3.681047.50−4.52
CE-GAP_M271.86871.9161578.601000.20
IGAP_M32.5960.0000.6110.00053.740.0032.840.00
CE-GAP_M32.5960.61153.7432.84
IGAP_M49.389+1.63512.791−0.984158.42+54.4782.86+88.26
CE-GAP_M411.02411.807244.70155.99
IGAP_M514.237+0.02915.282+0.026383.50+3.01268.93+4.20
CE-GAP_M514.26615.308395.04280.23
Net Change (system)0.0000.0001.64% ≈ 36.78 m EUR2.56% ≈ 36.78 m EUR
Disclaimer/Publisher’s Note: The statements, opinions and data contained in all publications are solely those of the individual author(s) and contributor(s) and not of MDPI and/or the editor(s). MDPI and/or the editor(s) disclaim responsibility for any injury to people or property resulting from any ideas, methods, instructions or products referred to in the content.

