4. Analysis of Results
The single-objective optimization of the problem in optimal reactive power dispatch planning in electrical power systems, minimizing the nodal voltage deviation (ORPD-MNVD), was performed in GAMS software version 27.3.0 to verify the results obtained using a BIOSTAR Intel(R) Core (TM) i3-3240 @ CPU 3.40 GHz computer. The computer is 3.40 GHz with 12.00 GB of RAM and a Windows 10 64-bit operating system. The solver used for optimization was BONMIN in GAMS, which provided the solution to the NLP optimization problem.
The ORPD-MNVD was tested with the IEEE 30-bus test system. The first scenario analyzes the power flow under the conventional system to achieve the voltage at each bus. We then analyze the reduction in active power losses in the transmission lines to introduce an additional proposed method, which reduces the voltage deviation at the nodes. All of the above is performed using the traditional OPF-AC method.
Figure 4 models the voltage profiles, where it can be seen that, in each case, the values obtained in GAMS differ greatly and it is verified that the proposed method solves the problem of voltage loss at each node.
Figure 4, for the OPF-AC case, illustrates a voltage with a magnitude of 1.1 p.u. on bus 11, which is the maximum limit defined in the voltage constraints, if there were a voltage increase on this bus. In turn,
Figure 4, for the same case, also shows voltages below 1 p.u., with the most highlighted being the voltages of bars 19, 23, 24, 25, 26, 29, and 30 with values of 0.99, 0.99, 0.98, 0.99, 0.97, 0.98, and 0.96 p.u., proportionally. In the case where we minimized losses, the voltage profile for all bars increased compared to the OPF-AC case, with the most representative value in bar 13, which had a value of 1.09 p.u.
By minimizing power losses, their voltage profiles increase compared to the others, since active power losses are minimized and compensation elements not considered in the case of the OPF-AC are included, due to the very fact of compensation performed by the capacitor banks connected to busbars 10 and 24. Finally, by applying the proposed method, the voltage profiles decrease considerably and remain within range compared to the OPF-AC, and the minimization of losses in the system. According to the results analyzed in
Figure 4, it can be observed that in case 1, by not improving or optimizing any technical variables or considering capacitor banks, the voltage profiles show very pronounced variations compared to the other cases, where technical parameters such as the reduction in active power losses are improved, as well as the inclusion of capacitor banks that help improve the SEP voltage profiles.
Table 1 shows the results of the active power dispatch of the generators, and
Table 2 shows the reactive power of the generators and capacitive compensators located at nodes 10 and 24.
Analyzing the total power for case 3 in
Table 2, the result obtained is much more favorable than in case 1, since there is a difference of 4.12 MW less than the power generated in case 1.
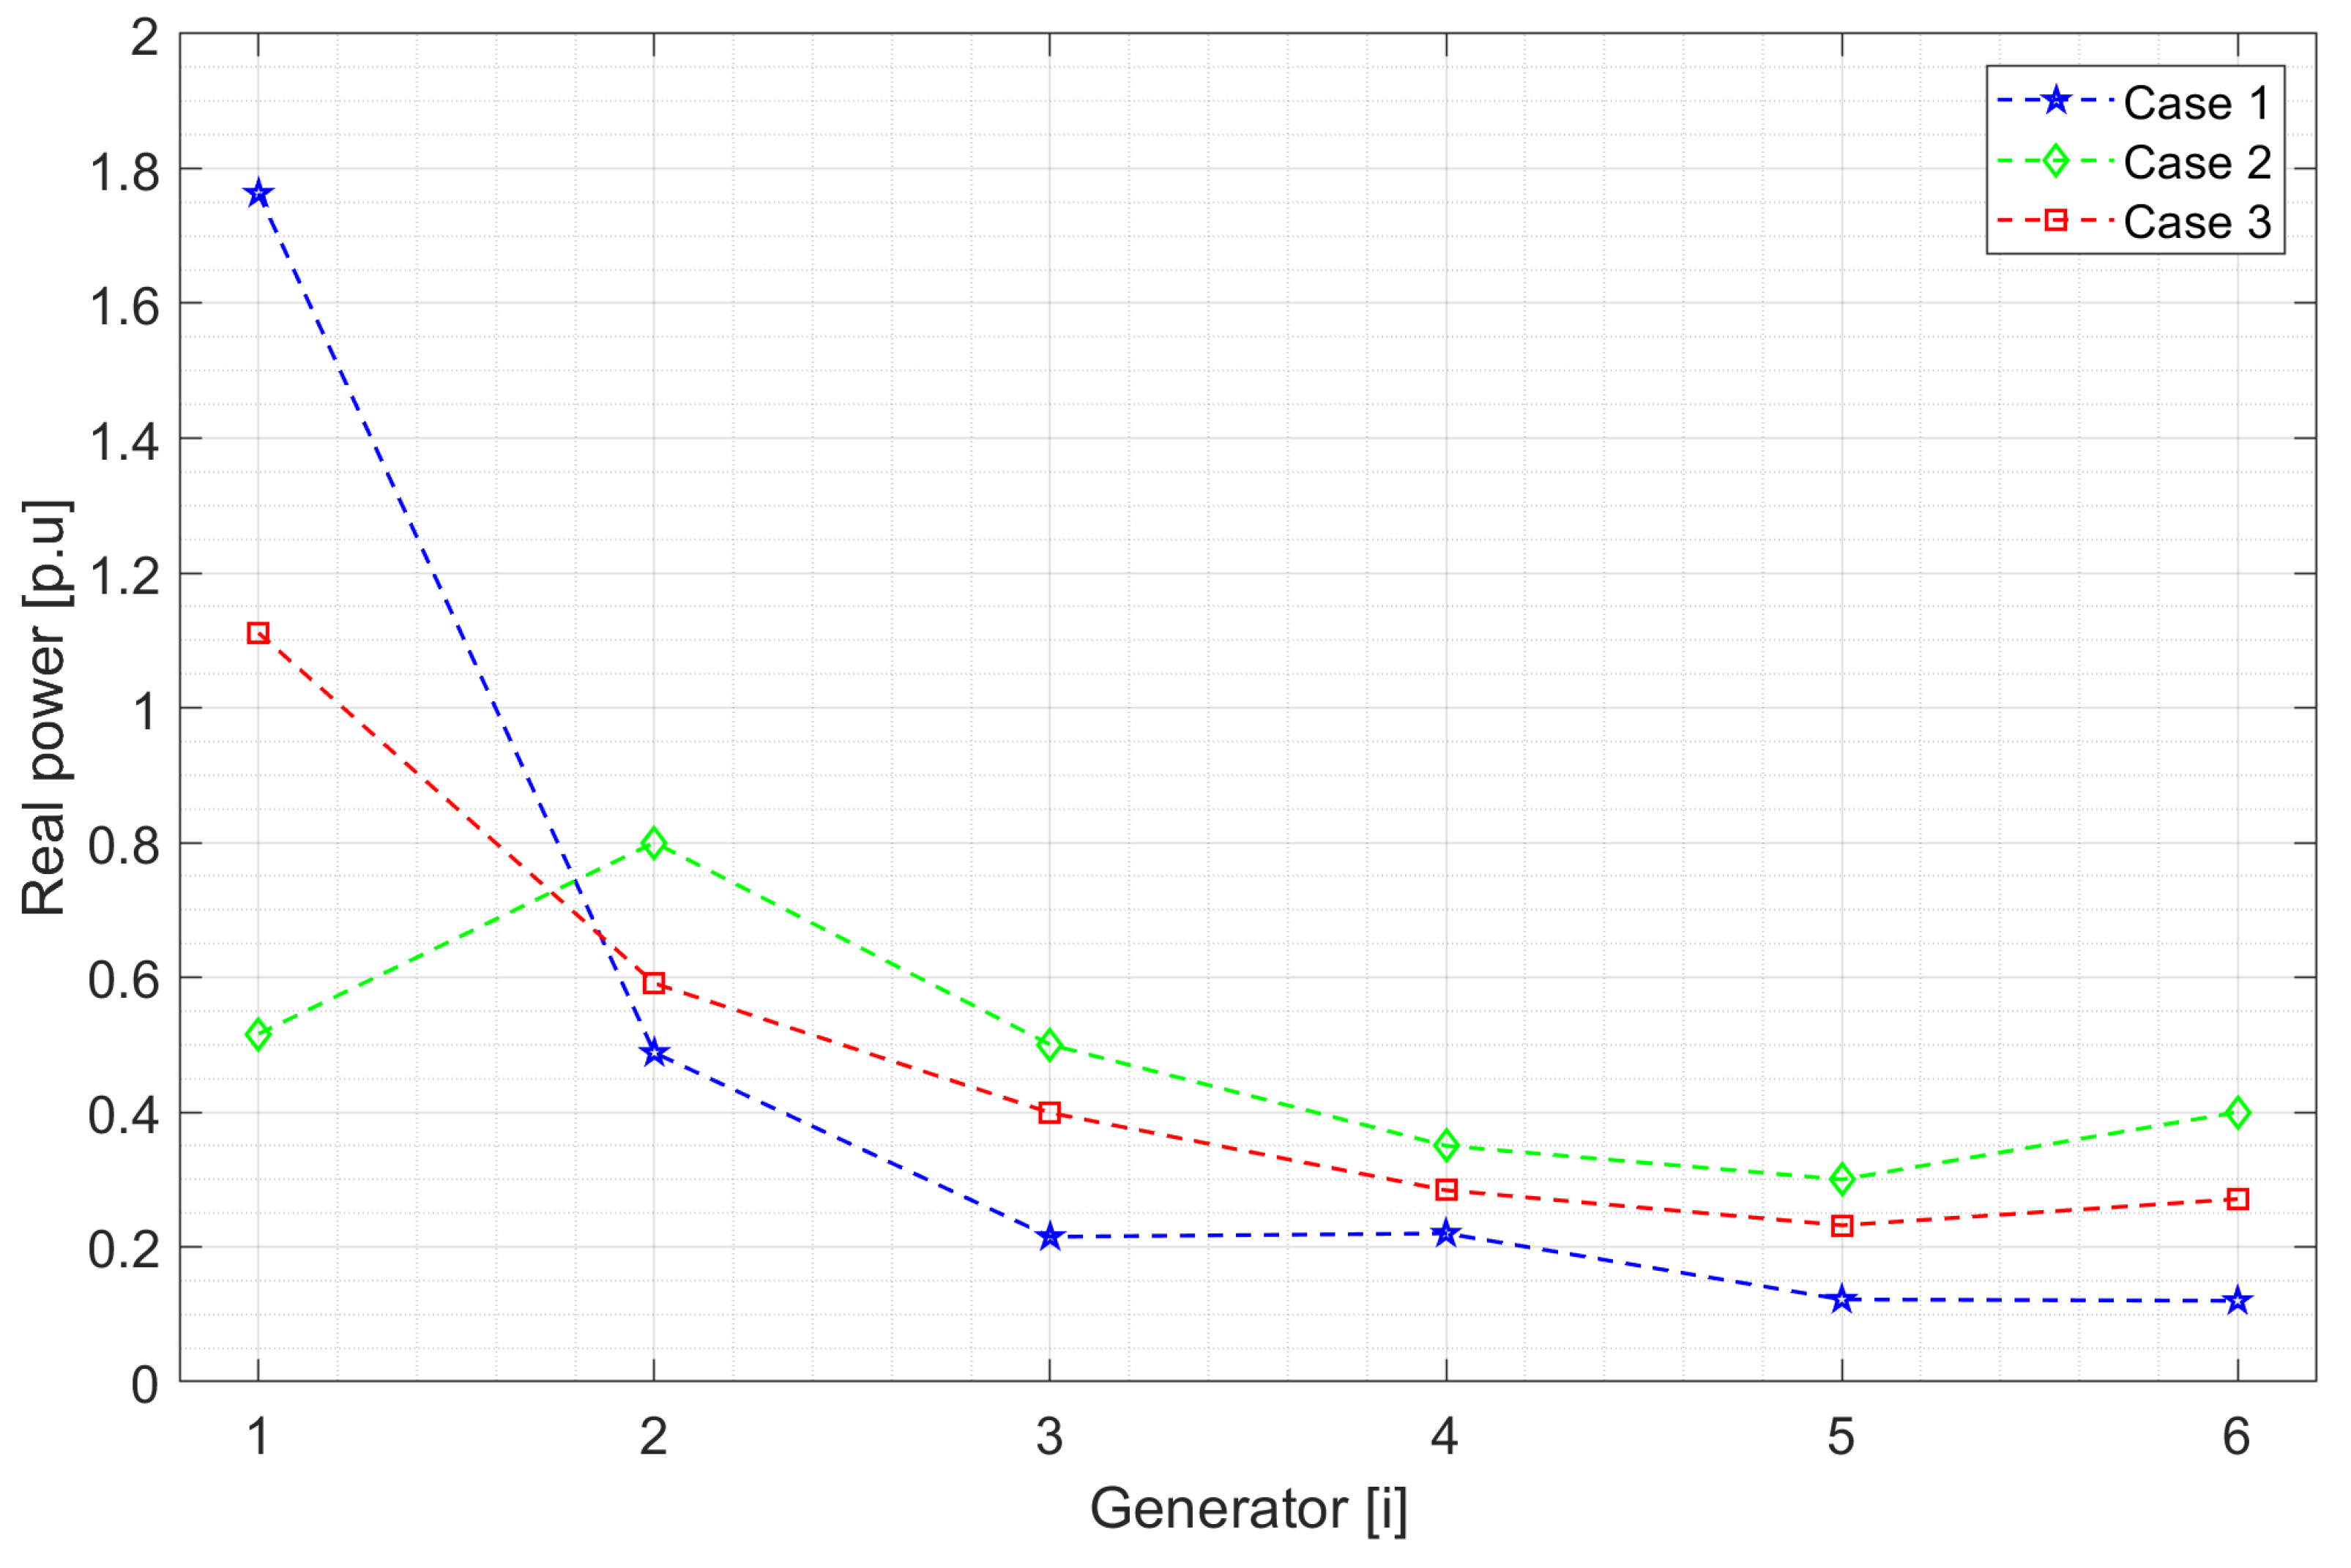
Figure 5 shows the active energy dispatches, presenting the same energy generation for cases 1 and 3, with generator 1 supplying more active power to the system. However, when losses are minimized in case 2, generator 2 provides the most active power. In case 3, generator 1 again provides the most energy; however, generation is lower than in cases 1 and 3, so the other generators generate more power, allowing us to balance losses.
When comparing the results obtained using the different methodologies, shown in
Table 1 and
Table 2, it can be seen that in case 3, which focuses on minimizing and deviating the voltage at the nodes in
Table 1, 4 MW less active power is dispatched than AC-OPF, which is represented by case 1. However, in
Table 2, the reactive power values in case 3 are different from those of the AC-OPF in case 1, by 4.12 MW.
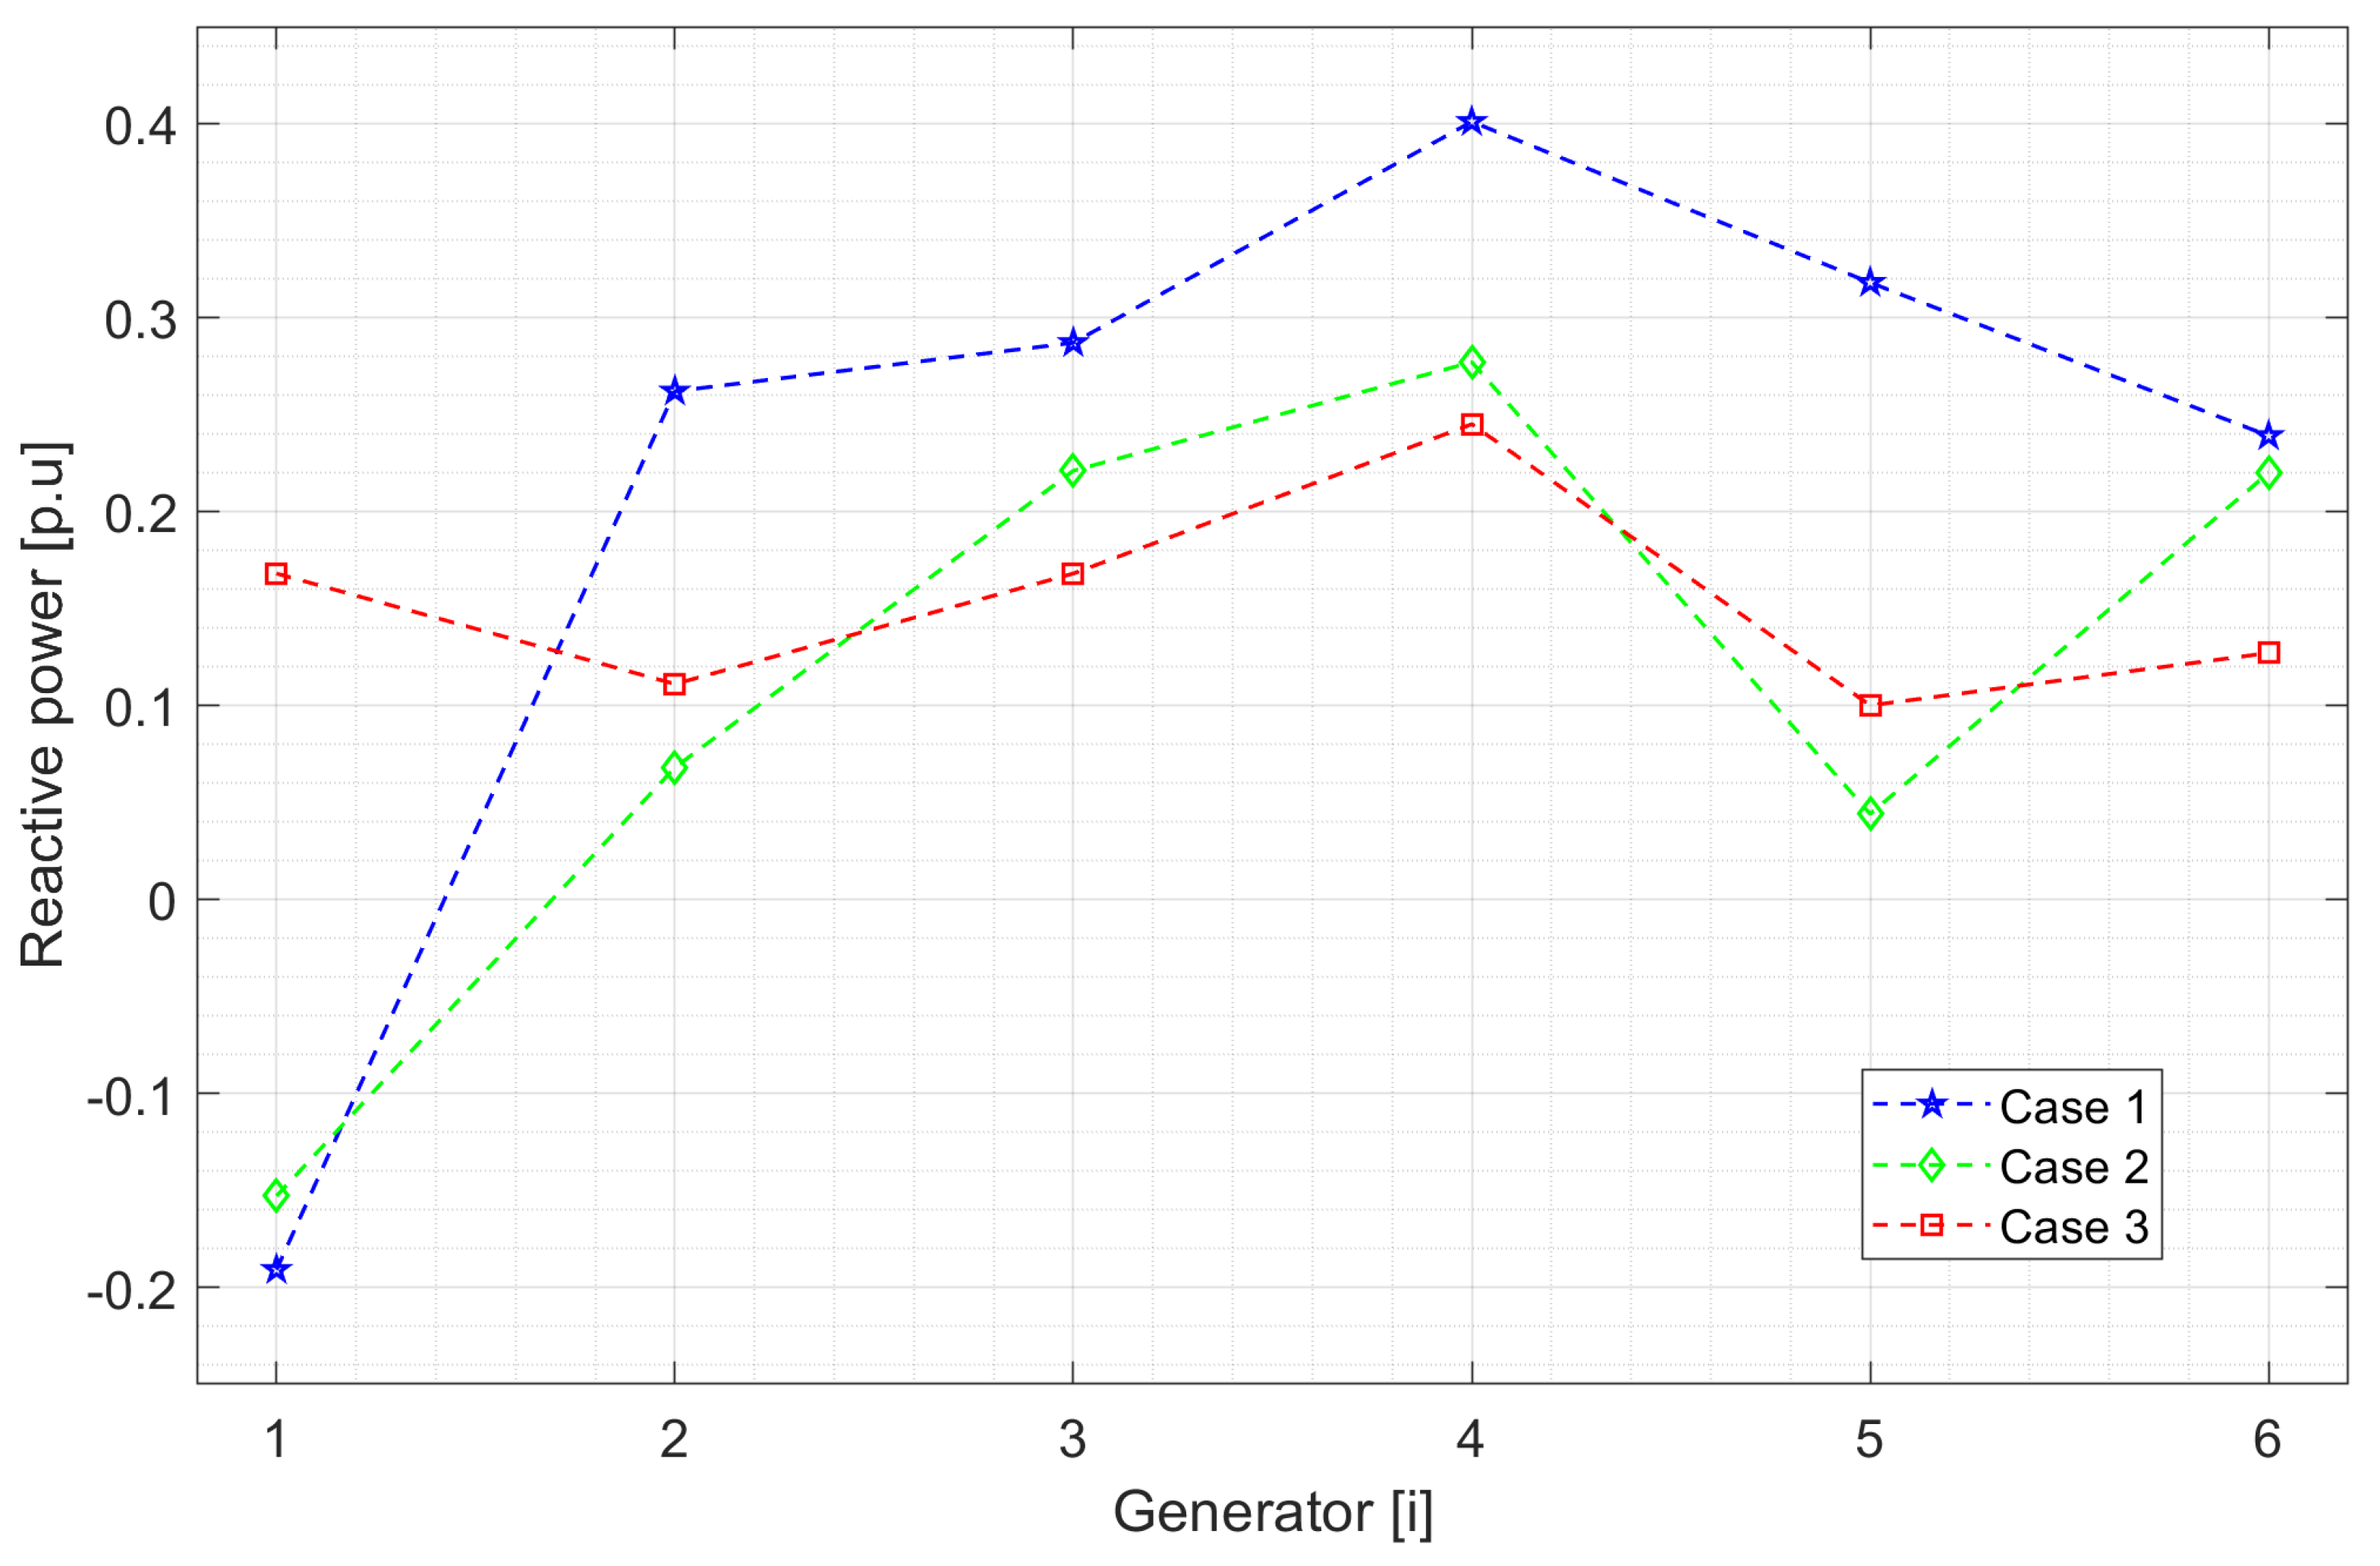
Comparing the reactive power results of each generator in
Figure 6 for cases 2 and 3, which consider capacitor banks, it was found that by minimizing active power losses in case 2, the reactive power generated is lower than in case 3, where losses are not minimized, indicating that reducing losses optimizes reactive power dispatch.
Table 3 shows the results of the total system losses, where a notable reduction can be observed thanks to the implementation of the proposed method. When analyzing the layout of the lines at the different nodes, it can be seen that the third case optimizes the system to a greater extent than the first and second cases. This is because reducing voltage variation at the nodes also reduces losses in the system, which is the main objective in power dispatch planning in the SEP.
Table 3 illustrates a segment of the system connections, with more than 70 links combining lines, transformers, generators, and compensation devices, among others. For this reason, the links where the losses were most significant are highlighted, and thanks to the proposal, these indices were improved, resulting in an optimized and efficient system.
Figure 6 shows that in case 1, the generators increase their reactive power in most cases without reactive power compensation elements. Regarding the reactive power compensation considered in cases 2 and 3 according to
Table 2, capacitor bank one connected to busbar 10 compensates more reactive power when losses are minimized and less reactive power when voltages are minimized, while in case 3, the compensation is in the range of case 1. There is a pronounced variation for capacitor bank two connected to busbar 24. Controlling the reactive power dispatch of the capacitive compensators at nodes 10 and 24 in case 3 compared to case 1, the reactive power produced through the generators can be reduced, as shown in
Figure 6.
Continuing with the analysis of case 3, it can be seen that voltage minimization is achieved in 15 buses by applying the proposed method. In contrast, in case 1, the OPF-AC shows voltages greater than 1 p.u. in most of the system’s bars. When minimizing generation losses, the voltages in the bars increase even more, as observed in case 2. Therefore, when implementing the proposed method, bars 14, 15, 17, 18, 19, 20, 21, 22, 23, 24, 25, 26, 27, 29, and 30 have a decrease in their voltages with values of 0.99, 0.99, 0. 99, 0.98, 0.98, 0.98, 0.99, 0.99, 0.98, 0.99, 0.98, 0.96, 0.99, 0.97, and 0.95 p.u., respectively, showing an absolute improvement compared to case 1 and case 2. With these findings, we can affirm that the proposed method optimizes voltage levels and system losses, offering a new option for improving power dispatch planning.
The proposed methodology efficiently improves system conditions. This achieves further optimization, ensuring that voltages at system points are ideal, refining voltage profiles, and readjusting losses and power flow. This is achieved by applying an innovative approach to reactive power dispatch planning with optimal voltages in the system, which reduces power losses and results in a more efficient and balanced system.
When examining the results obtained in GAMS for cases 1 and 3, it was found that the discrepancy between the two is 0.009 p.u., which suggests that, by minimizing the voltages, the system is optimized to operate under optimal conditions by adjusting the voltages at the different nodes. Likewise, the voltages in cases 2 and 3 are, in fact, lower than in case 1, which complies with the voltage reduction proposed in the objective function.
Figure 7 presents a comparative visualization of the differences between the results of cases 1, 2, and 3, which is the approach suggested and applied in GAMS. When analyzing the reduction in losses in the transmission lines, which is detailed in
Table 3, it can be seen that optimizing the voltage variation at the nodes improves the power losses in the system and also the voltage levels, which is the main contribution of this research, as illustrated in
Figure 7.
5. Conclusions
Planning the operation of electrical systems usually focuses on power generation, ignoring the various fluctuations in the electrical system’s voltage; however, this is not the only way to plan power distribution. In the scientific field, several experts are interested in the effectiveness of systems and suggest measures to minimize energy losses. This research considered both options, i.e., a procedure was developed to reduce losses in the electrical system and voltage at the nodes. The results were compared with those obtained using the traditional OPF-AC method, focusing on reducing active and reactive power losses.
By examining the varied results of the cases analyzed, it can be seen that reducing active energy losses achieves a notable increase in node voltages within the system simultaneously with the execution of an OFP-AC, where voltages remain in a beneficial range, resulting in a voltage reduction of at least 0.01 p.u. to 0. 03 p.u. volts.
When analyzing cases one and two, it was concluded that the voltage reduction was beneficial since the voltage at the nodes increased significantly, with an increase of 0.064 p.u. for an electrical system that considers power losses. This situation occurs because priority is not given to the buses’ voltages but to the transmission lines, which are responsible for losses in the electrical system.
Progress was made by improving voltage variation at the nodes in the voltage profiles within the electrical power systems without significantly increasing the loss of active and reactive power generation.
The results obtained using the algorithm developed in GAMS show that it is effective and reliable. It can also be noted that there is currently no efficient approach to reduce voltage without increasing energy losses in the system. With the suggested methodology implemented in GAMS, this can be achieved, and this is the main contribution of this study.


