Article

Thermodynamic and Process Modeling of CO2 Chemical Absorption Process Using Aqueous Monoethanolamine and Enzymatic Potassium Carbonate Solvents: Validation and Comparative Analysis

by
Anthoula Plakia
*,
Christina Papaioannou
and
Panagiotis Grammelis
*
Chemical Process and Energy Resources Institute, Centre for Research and Technology Hellas, Egialias 52, 15125 Athens, Greece
*
Authors to whom correspondence should be addressed.
Energies 2025, 18(11), 2981; https://doi.org/10.3390/en18112981
Submission received: 7 May 2025 / Revised: 27 May 2025 / Accepted: 30 May 2025 / Published: 5 June 2025
(This article belongs to the Section B: Energy and Environment)

Abstract

Carbon dioxide is a major contributor to global warming, with chemical absorption using aqueous monoethanolamine (MEA) being the most widespread technology for CO2 capture. However, due to the limitations of MEA, alternative solvents should be examined. In this work, CO2 capture using potassium carbonate promoted by the enzyme carbonic anhydrase is compared to the conventional aqueous MEA solvent. For that purpose, models for both solvents are developed, focusing on accurate thermodynamic modeling of the mixtures and simulation of the processes. As a first step, the thermodynamic modeling of CO2-H2O-MEA and CO2-H2O-K2CO3 mixtures is examined. Parameters of the electrolyte non-random two-liquid (eNRTL) model in Aspen Plus V11 are updated through regression against binary and ternary solubility and heat capacity experimental data. The regression results are satisfactory. Afterwards, the updated eNRTL is applied to the development of rate-based process models, which are validated against experimental results from pilot plants presented in the literature to ensure their accuracy. Finally, the two solvents are compared, with enzymatic potassium carbonate emerging as a promising alternative to MEA for CO2 capture. At optimized conditions and an 85% capture efficiency, the reboiler duties are 3.5 MJ/kg for enzymatic potassium carbonate and 4.2 MJ/kg CO2 for MEA.

1. Introduction

Global warming has been recognized as a priority in the Paris Agreement [1]. The unrestrained increase of greenhouse gases due to human activities has driven climate change, resulting in the global surface temperature reaching 1.1 °C above the 1850–1900 average by 2020 [2]. Among greenhouse gases, carbon dioxide is the greatest contributor to global warming. In 2020, CO2 concentration in the atmosphere was 48% above its pre-industrial level [3]. Even though fossil fuels are still considered as the largest source of global energy, burning fossil fuels results in 33–40% of the total global CO2 emissions [4]. This fact has led to a number of activities to mitigate its atmospheric concentration, with carbon capture and storage being a promising solution to control global warming [5].
The technologies mainly used to reduce CO2 emissions can be divided into three categories: pre-combustion capture, oxy-fuel combustion, and post-combustion capture. The latter includes different processes such as physical or chemical absorption, hybrid process, solid-bed adsorption, membrane separation, and cryogenic fractionation [6,7]. Chemical absorption is a widespread process, and has been used in industry for more than sixty years [8], as it is suitable for large volumes of flue gases and is cost-effective [9]. This method includes mainly two columns, an absorber and a stripper. CO2 is chemically absorbed in a liquid solvent in the absorption column, where the flow is countercurrent. In the stripping column, the solvent is regenerated at the bottom and then recycled back to the absorption column, whereas the product exiting the top is a highly pure carbon dioxide, suitable for utilization or storage.
Amines, which can be primary, secondary, or tertiary, are common solvents for this process. Monoethanolamine is a primary amine that is widely used, due to its high speed of reaction, low solvent cost, thermal stability, and high absorptive capacity [10]. The great disadvantages of using monoethanolamine in CO2 capture are the solvent losses due to volatility and the high energy needed for solvent regeneration [11]. Thus, despite its widespread use, alternative solutions should also be examined. Alkali salt-based solvents are a great potential alternative because they are less toxic, nonvolatile, and have low heat of CO2 absorption. However, their main drawback is the slow CO2 absorption rate, a fact that results in poor performance. Therefore, the use of high temperature or a promoter, such as carbonic anhydrase, which is an efficient and eco-friendly biocatalyst, is necessary, and it is proven to boost the CO2 absorption rate in the K2CO3-KHCO3 solvent [12]. In terms of economic evaluation, MEA and K2CO3 have currently similar prices, but this varies by region and market (0.87–1.16 €/kg compared to 0.68–1.31 €/kg for the two solvents, respectively [13]). However, K2CO3 cannot compete with MEA without a promoter. Since the cost of carbonic anhydrase is high, the enzymatic K2CO3 process remains quite expensive. Further research on techno-economic evaluation is necessary to assess the economic viability of this process. Furthermore, process models would reveal the most effective candidate for CO2 capture.
In terms of process modeling, there are only a few works in the literature that compare the CO2 absorption process in aqueous monoethanolamine with the one in aqueous potassium carbonate and most of them include hot potassium carbonate. Ghiat et al. [14] presented a model for CO2 capture in a biomass-based gasification combined cycle, and they compared the use of monoethanolamine and hot potassium carbonate solvents. They used the electrolyte non-random two-liquid (eNRTL) model with the Redlich–Kwong equation of state and they performed rate-based calculations in Aspen Plus. The two solvents were compared in terms of reboiler duties for an 80% CO2 removal, and it was concluded that potassium carbonate had a lower reboiler duty by 29% than MEA. In another work, Kothandaraman et al. [15] presented a comparison of the two solvents in CO2 capture from natural gas and coal-fired power plants, using a rate-based model with eNRTL. They checked the effect of different design parameters, such as packing material, absorber height, and process parameters, such as solvent temperature, desorber pressure, etc., on reboiler duties, and they concluded that hot potassium carbonate requires less energy on the reboiler than MEA (3.2 and 4.2 MJ/kg CO2, respectively). Modeling work that compares monoethanolamine with potassium carbonate boosted by carbonic anhydrase is very limited. Salmon et al. [16] developed a model in Aspen Plus in order to simulate their bench-scale results of CO2 absorption into 24% aqueous potassium carbonate and for comparison purposes, they conducted an experimental and modeling run with 30% MEA. They concluded that monoethanolamine needed a slightly lower reboiler duty for solvent recovery than enzymatic potassium carbonate. Zhang et al. [17] performed experiments in order to compare the absorption rates and mass transfer residence of 20% aqueous enzymatic potassium carbonate and 5 M aqueous MEA, and they developed models to reveal the effective packing volume of the absorber. They concluded that in the presence of 10 g/L of carbonic anhydrase in potassium carbonate, the packing volume was only a bit larger (10 m diameter and 14 m packing height) than the one with MEA (9.8 m diameter and 12.8 m packing height) for 90% CO2 absorption. Moreover, they found that in CA concentrations greater than 2 g/L, the packing height did not change significantly.
The results of the modeling works of CO2 capture with aqueous potassium carbonate in comparison to aqueous MEA are promising, but the limited literature about this issue in conjunction with the lack of validated models makes further investigation of this subject imperative. Accurate thermodynamic models for CO2 absorption in solvents are essential for reliable simulations. In fact, several studies [18,19,20] addressed that the gas loading and the partial pressure have a critical effect on solvent recirculation rate and consequently on regeneration energy; thus, the correct representation of these properties by thermodynamic models is essential for reliable simulation results. Among thermodynamic models, semiempirical approaches are commonly used, despite the fact that they do not have an accurate theoretical concept. Activity coefficient models are also applied. They are precise at low pressures but need different equations to describe the non-ideality of the vapor and liquid phases. Equations of state are also widely used for the description of CO2 solubility in such mixtures, and they offer the advantage of using the same equation for the description of vapor and liquid phases. In the case of MEA, the Kent–Eisenberg [21] model has been used since it is very simple, assuming that all activity and fugacity coefficients are equal to one. The most widely used activity coefficient models for the description of CO2 solubility in aqueous MEA are eNRTL [22,23,24] and extended UNIQUAC [25,26]. Among equations of state, SAFT EoS [27], PC-SAFT [28], and the Cubic-Two-State equation [29] have been investigated in the literature. In some cases, the thermodynamic investigation was followed by process simulation as well [19,30,31,32]. In these studies, a common practice was to collect data such as vapor–liquid equilibrium (VLE), heat capacities, and others from the literature or from in-house experiments, compare the modeling results with the experimental data, and, when necessary, regress the parameters of the thermodynamic model to better fit these data. A similar approach was also followed for potassium carbonate. Specifically, the Pitzer equation [33,34] was used for the calculation of activity coefficients in liquid phase for promoted and unpromoted solutions, whereas eNRTL [35,36,37,38] and extended UNIQUAC [39] were also checked for their accuracy in thermodynamic properties, and the results are in great agreement with the experimental data. In some cases, thermodynamic modeling was also followed by process simulation [40].
Validation of the process models is also essential for obtaining accurate results from the model. Concerning MEA, rate-based simulation models, presented in the literature, were developed and validated against pilot plant data. Neveaux et al. [41] presented a rate-based model for absorption and stripping columns for CO2 capture in amine solvents. They compared the simulated results of 30 wt % monoethanolamine with the experimental results from an industrial plant and a laboratory pilot plant, and they validated both the absorption and the stripping column. Zhang et al. [42] presented their rate-based absorption/desorption model for CO2 absorption in aqueous MEA and they validated their model with experimental data. They compared the rate-based model with an equilibrium model and concluded that the results in the first case are more reliable. Garcia et al. [43] develop an Aspen Plus simulation model for the desorption model of the CO2 captured in 30% MEA. Chemical desorption is not studied as extensively as absorption, and thus validated models for the desorption are needed. They validated their model using data from four experimental pilot campaigns, and they concluded that there is good agreement between the simulated and the experimental results. Regarding potassium carbonate, there are also validated process models presented in the literature. Indicatively, Smith et al. [44] conducted experimental runs in a laboratory-scale pilot plant to examine the absorption performance of a precipitating potassium carbonate promoted by glycine. They developed a rate-based model, validated against the pilot plant data, and their simulation had deviated only by 5% from the experimental data. Borhani et al. [32] developed a rate-based model for the CO2 capture in aqueous potassium carbonate promoted by diethanolamine (DEA) and they validated their model against the data of two industrial complexes. The results of CO2 absorption were in great agreement with the experimental data with deviations lower than 1% in CO2 absorption. They have also tested the performance of other amine promoters, with diglycolamine (DGA) emerging as the most promising one. Quyn et al. [45] presented pilot plant trials with 20–30% w/w unpromoted potassium carbonate. They used the holdup, solvent loading, and absorber temperature to validate an Aspen Plus rate-based model. Mumford et al. [46] developed a model, which was validated against plant data, in which 20–30% w/w unpromoted potassium carbonate was used and 20–25% of CO2 was removed.
It is evident that rate-based models are widely used in the literature on CO2 capture, whereas from a thermodynamic perspective, eNRTL is commonly applied in such mixtures. Even though validated models for both solvents exist in the literature [32,41,42,43,44,45,46], there are not many studies that use them to compare potassium carbonate with MEA. Therefore, it is critical to use accurate and validated models for the comparison of the two solvents in order to decide if potassium carbonate is a great alternative of monoethanolamine. For that reason, in this work validated models are developed to compare promoted aqueous potassium carbonate with carbonic anhydrase and monoethanolamine solvents in CO2 capture, in terms of reboiler duty. In order to do so, the thermodynamic framework of eNRTL in Aspen Plus V11 [47] in each case is examined and some parameters are refitted to the experimental data. Furthermore, rate-based process models are developed and validated against pilot plant data, presented in the literature. Finally, the validated models are used to compare the two solvents and sensitivity analysis is performed on the key parameters affecting the process.

2. Method

In this section, the thermodynamic framework for CO2-K2CO3-H2O and CO2-MEA-H2O mixtures, as well as its integration into the development of process simulations for CO2 capture, is described.

2.1. Thermodynamic Framework

In the case of aqueous potassium carbonate and MEA solvents, the CO2 absorption occurs in two steps. Firstly, the gaseous species are dissolved in the liquid phase; subsequently, they react with the solvent, so phase and chemical equilibria are needed to describe CO2 solubility in these solvents. It should be noted that potassium carbonate is considered to dissociate completely in the liquid phase [48].

2.1.1. Chemical Equilibrium

Regarding the CO2-K2CO3-H2O mixture, the following chemical reactions take place in the aqueous phase [49]:
K 2 C O 3 2 K + + C O 3 2
K H C O 3 K + + H C O 3
2 H 2 O O H + H 3 O +
C O 2 + 2 H 2 O H 3 O + + H C O 3
H C O 3 + H 2 O H 3 O + + C O 3 2
Regarding the CO2-MEA-H2O mixture, the following chemical reactions take place in the aqueous phase [19]:
M E A H + + H 2 O M E A + H 3 O +
C O 2 + 2 H 2 O H 3 O + + H C O 3
H C O 3 + H 2 O C O 3 2 + H 3 O +
M E A C O O + H 2 O M E A + H C O 3
2 H 2 O O H + H 3 O +
Chemical equilibrium constants were calculated from the reference state Gibbs free energies of the involved components.

2.1.2. Vapor–Liquid Equilibrium

For the vapor–liquid equilibrium description, the activity coefficient approach is followed, and the following equation is used to describe the equality of fugacities:
y i φ ^ i P = x i γ i f i o
where P is the system pressure, yi is the vapor-phase mole fraction of component i, γi is the liquid-phase activity coefficient, φ ^ i is the vapor-phase fugacity coefficient, and f i o is the standard-state fugacity of component i.
The vapor-phase properties are calculated by the Redlich–Kwong equation of state [50].
The liquid-phase activity coefficient is calculated by eNRTL, proposed by Chen et al. [51], which is based on the following equation:
G E R T = G E , L C R T + G E , L R R T
where G E denotes the excess Gibbs free energy of the mixture, whereas G E , L C accounts for the local interactions and G E , L R for the long-range interactions. The contribution to the excess Gibbs free energy of the local interactions is calculated by the non-random two-liquid theory, whereas that of the long-range interactions is calculated by adding the Pitzer–Debye–Hueckel term and the Born term.
Molecule–molecule and electrolyte–molecule binary interaction parameters are included in the local interactions term. The temperature dependence of molecule–molecule binary interaction parameters is described by the following equation:
τ A A = A A A + B A A T + F A A ln T + G A A T
The temperature dependence of electrolyte–molecule parameters is described by the following equation:
τ I A = C I A + D I A T + E I A T r e f T T + ln T T r e f
where T r e f = 298.15 K.
The activity coefficient of each species is expressed in terms of excess Gibbs free energy by the following equation:
l n γ i = 1 R T G E n i T , P , n j i
Some of the eNRTL parameters were calculated in this work through regression and are presented in the Supplementary Materials. NTRL/1 corresponds to A A A , while NTRL/2 corresponds to B A A . GMELCC corresponds to C I A , while GMELCD corresponds to D I A . The rest of the eNRTL parameters are taken from the Aspen Plus V11 [47] databank.
The heat of vaporization is calculated by the following DIPPR equation:
Δ v a p H i * = C 1 i 1 T T c i C 2 i + C 3 i T T c i + C 4 i T T c i 2 + C 5 i T T c i 3 ,   for   C 6 i T C 7 i
where Tci is the critical temperature of component i. C 1 i , C 2 i , C 3 i , C 4 i , and C 5 i have been updated in this work and they are presented in the Supplementary Materials, named as DHVLDP/1,2,3,4,5, respectively, which is in agreement with their name in Aspen Plus.
The ideal gas heat capacity is calculated by the following DIPPR equation:
C p * , i g = C 1 i + C 2 i T + C 3 i T 2 + C 4 i T 3 + C 5 i T 4 + C 6 i T 5 ,   for   C 7 i T C 8 i
CPIGDP/1,2,3,4,5 correspond to C 1 i , C 2 i , C 3 i , C 4 i , and C 5 i of Equation (17), and their updated values are presented in the Supplementary Materials.
The aqueous infinite dilution heat capacities are calculated from the following heat capacity polynomial:
C p , a q = C 1 i + C 2 i T + C 3 i T 2 + C 4 i T + C 5 i T 2 + C 6 i T ,   for   C 7 i T C 8 i
CPAQ0/1,2,3,4,5,6 correspond to C 1 i , C 2 i , C 3 i , C 4 i , and C 5 i of Equation (18), and their updated values are presented in the Supplementary Materials.

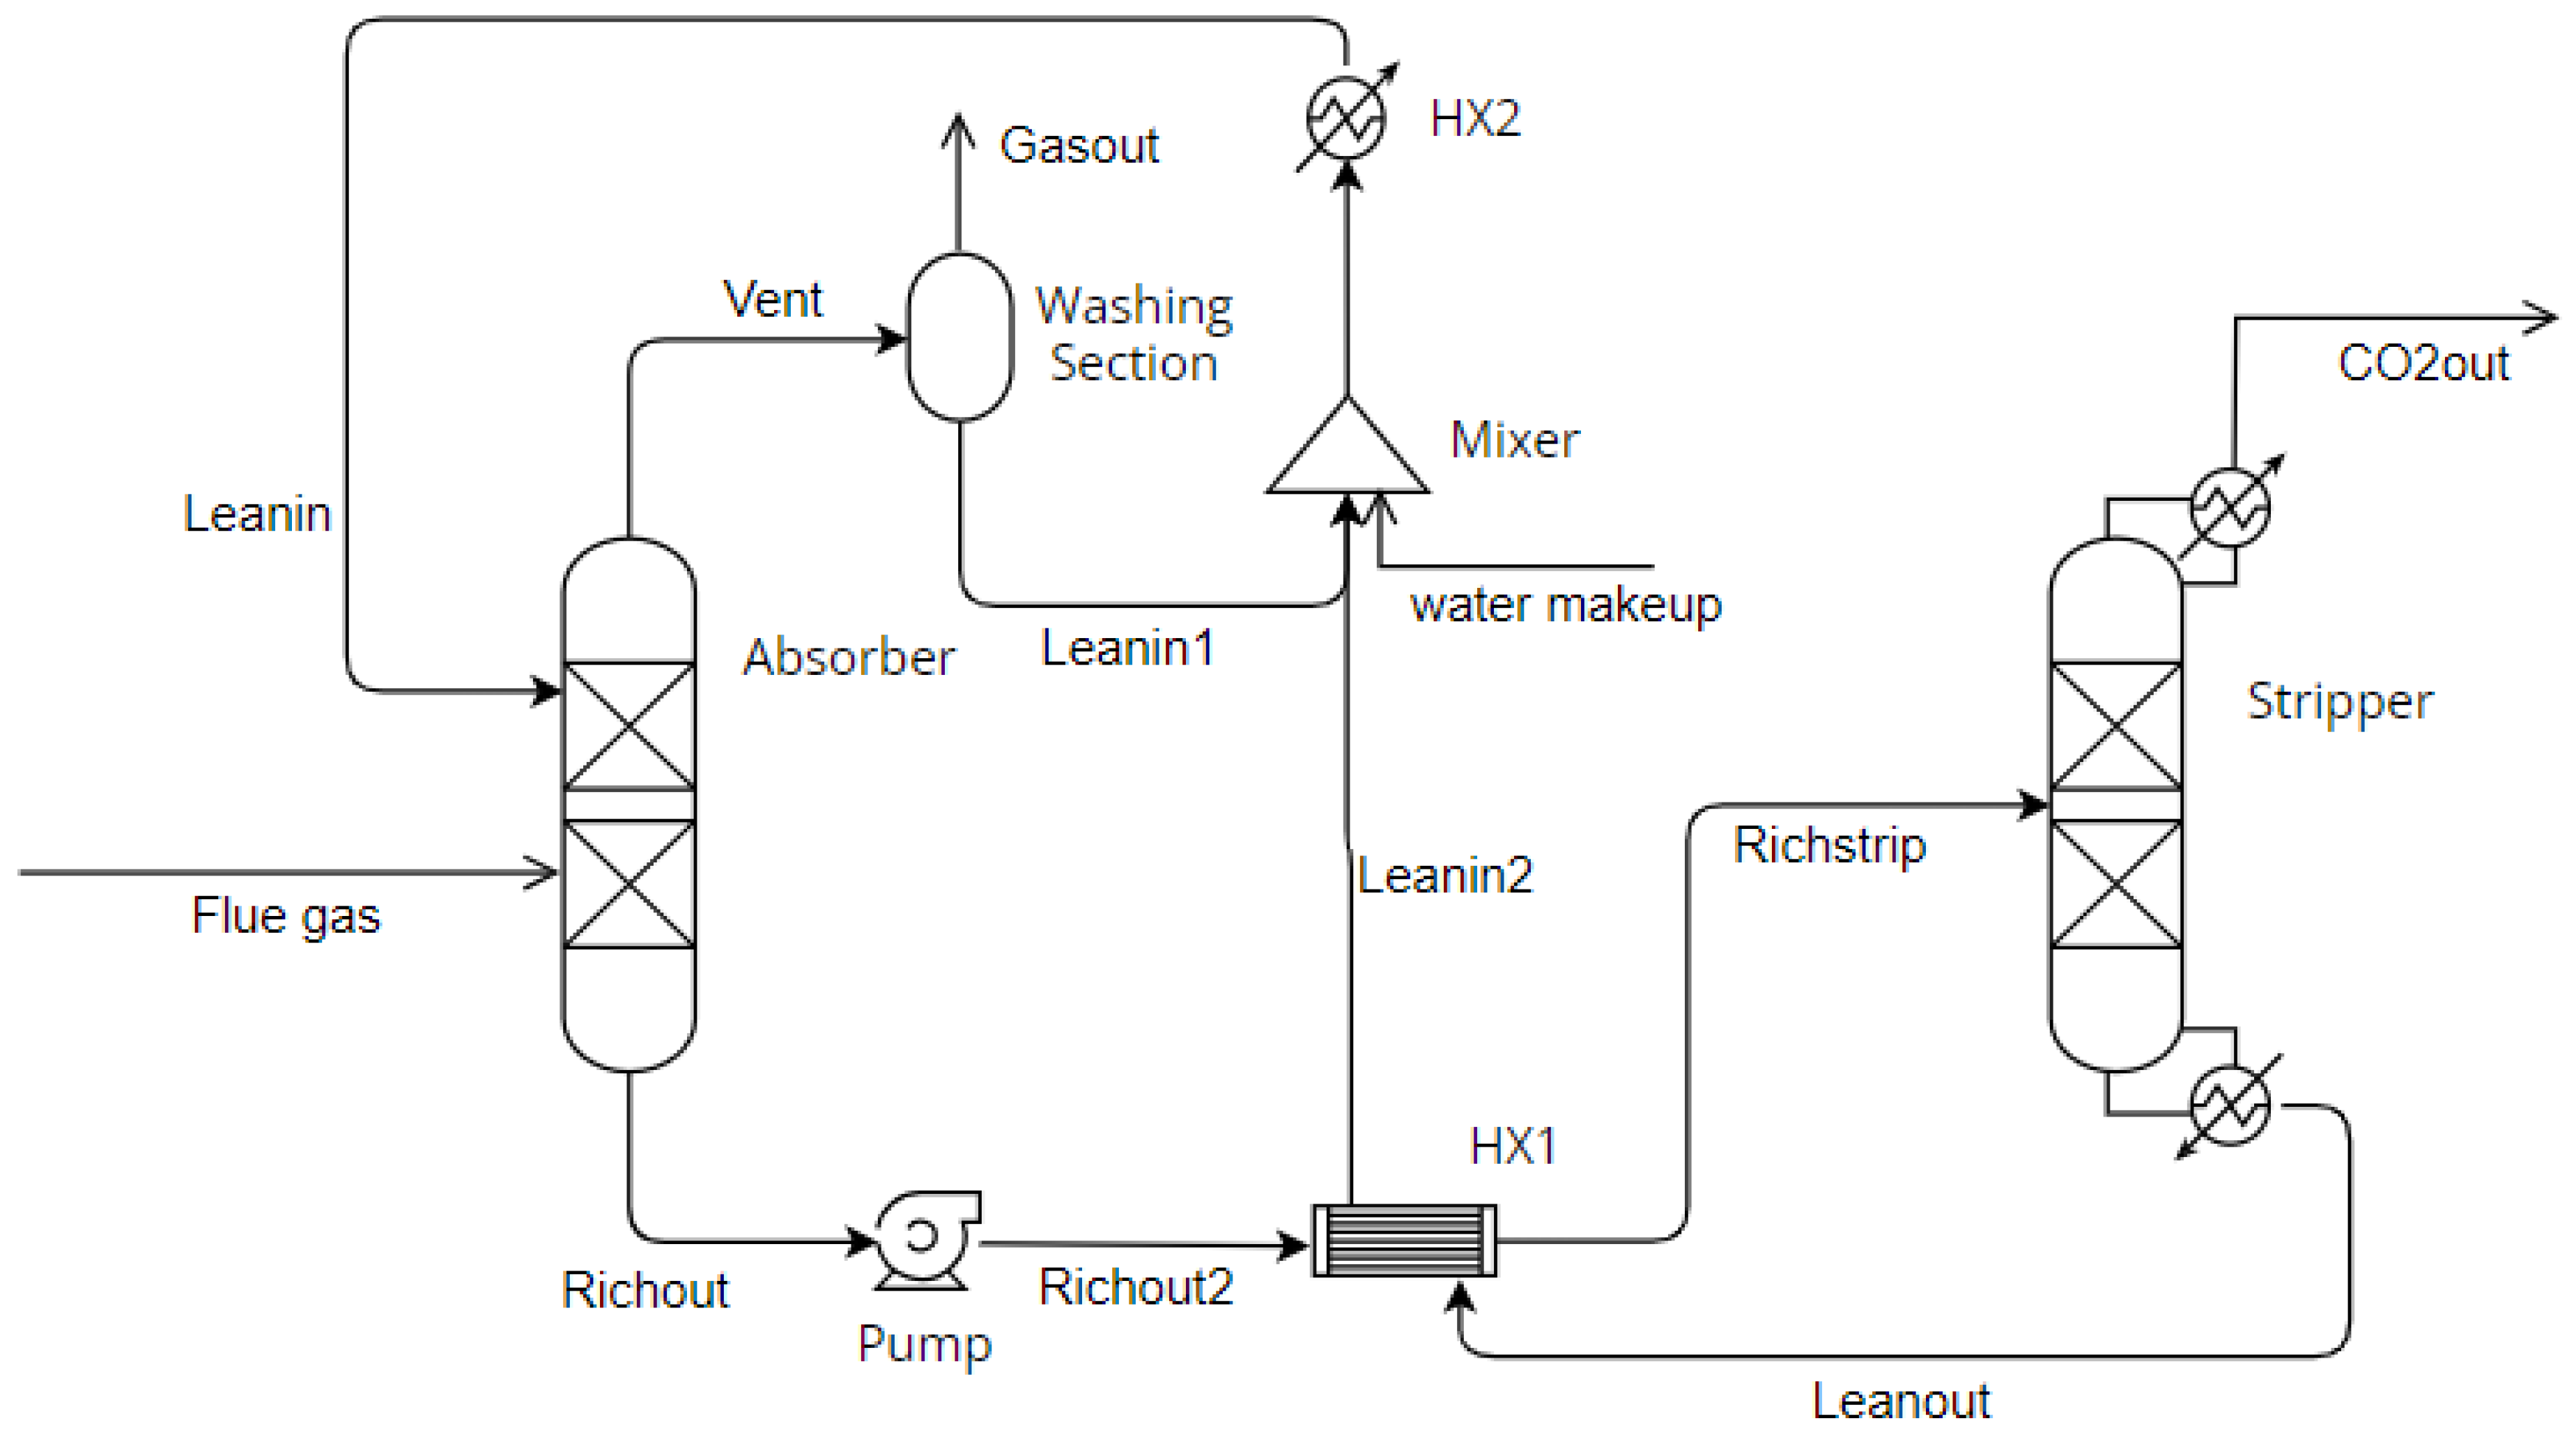
2.2. Process Simulation

The schematic representation of the process model is presented in Figure 1 [52]. The flue gas enters the bottom of the absorption column, while the solvent enters the top. Vent gas exiting the top of the absorption column is inserted into a flash drum in order to regenerate the solvent, which is then mixed with a water makeup stream and is recirculated back to the absorption column. This is needed only for the monoethanolamine solution, due to its volatility. The rich solvent leaving the bottom of the absorption column enters a plate heat exchanger, where it contacts the hot lean solvent leaving the bottom of the stripper. The lean solvent is getting colder in the heat exchanger, and then it enters a second heat exchanger, before the absorption column, while the CO2-rich stream leaves the top of the stripping column. It should be noted that this process applies when the stripper operates at a higher pressure than the absorber does. If the stripper operates at a lower pressure, a pump is instead installed before the lean solvent enters the plate heat exchanger.
There are two possible ways to solve the absorption and stripping columns in Aspen Plus, either by using the equilibrium stage model or the rate-based model. In the first approach, it is assumed that there is plenty of time in order for the liquid and gas phases to be in equilibrium at each stage. However, in practice, the equilibrium exists only at the interfaces separating the liquid and vapor phases. Unlike equilibrium-based columns, which assume ideal phase behavior and rely on equilibrium assumptions, rate-based columns provide a more accurate representation of the column’s behavior by considering non-idealities and dynamic effects. The rate-based model is a fundamental approach that accounts for the mass and heat transfer rate processes [47]. It also considers the effects of non-idealities, such as vapor–liquid disequilibrium, entrainment, and flooding, which are crucial for accurately predicting column performance. The geometry and size of the equipment are necessary for these calculations. It is assumed that the reactions take place only in the liquid phase. The rate-based model is used both for the absorber and the stripper, but regarding the stripper, it is assumed that CO2 desorption is not limited by the reaction rates, because the high temperatures drive all reactions to chemical equilibrium [53], and thus only reactions 1–5 and 6–10 for K2CO3 and the MEA solvent, respectively, were taken into account.
In order to simulate the rate-based processes, kinetic characterization of some of the reactions is necessary. In the case of the absorber with potassium carbonate, in alkaline conditions the rate is controlled by the following reactions:
C O 2 + O H H C O 3
H C O 3 C O 2 + O H
Carbonic anhydrase (CA) is a zinc metalloprotein and serves as a catalyst for K2CO3 solvent, in order to accelerate the hydration of CO2 to bicarbonate. CA facilitates the conversion of CO2 and bicarbonate, while it is not consumed. The mechanism of the reaction is well described in the literature [16], while the Michaelis–Menten equation is usually used to describe the hydration rate of the dissolved CO2 to bicarbonate. Catalytic rate constants are measured and presented in the literature [54]. Since no Michaelis–Menten equation is available in Aspen Plus and reactions 19–20 control the rate in alkaline conditions, their kinetics based on the Arrhenius equation are usually adjusted to match experimental CO2 absorption data. In this work, the kinetic expressions of these reactions are taken from the literature [16,55] and include different carbonic anhydrase concentrations. They are presented in Table 1.
In the case of monoethanolamine, two reactions need a kinetic characterization. These reactions describe the two possible ways that CO2 reacts directly with the solvent mixture:
C O 2 + M E A + H 2 O M E A C O O + H 3 O +
M E A C O O + H 3 O + C O 2 + M E A + H 2 O
C O 2 + O H H C O 3
H C O 3 C O 2 + O H
The kinetic expressions of these reactions are presented in Table 2 and they are taken from the literature [56,57]:

3. Results and Discussion

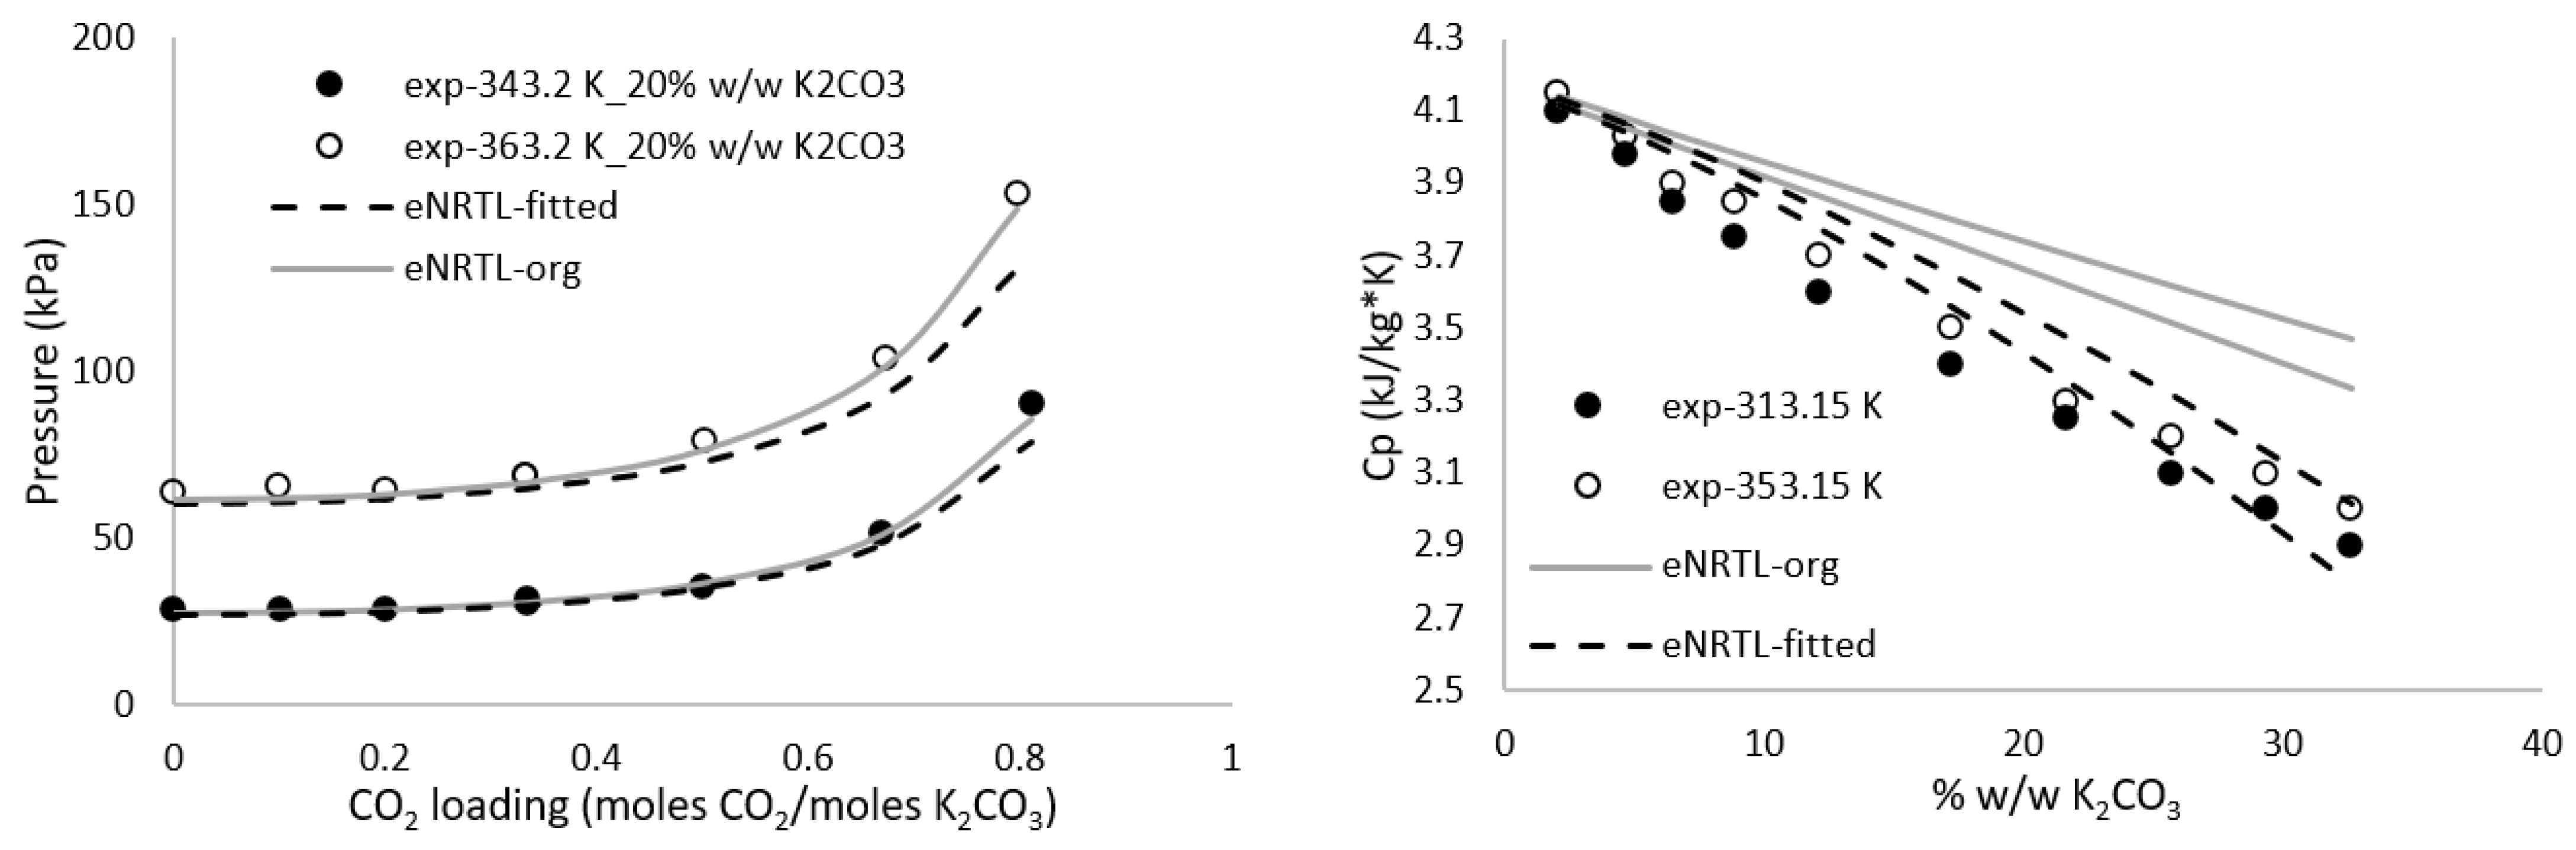
3.1. Thermodynamic Data Regression

In order to validate the eNRTL model of Aspen Plus, it was necessary to have an appropriate database of experimental data. VLE data, heat capacities, and heat of vaporization were selected for binary K2CO3-H2O and MEA-H2O and ternary CO2-K2CO3-H2O and CO2-MEA-H2O mixtures, and they were evaluated in an empirical way, by examining trends with respect to solvent concentration and temperature, or comparing data presented by different authors in the same conditions, to find possible outliers. Regarding the CO2-K2CO3-H2O mixture, the VLE data from Bohloul et al. [34] at 20% w/w K2CO3 differ significantly from those reported by Kamps et al. [58]. In addition, the temperature trend of data from Kamps et al. [58] with respect to CO2 loading is in agreement with the results of Tosh et al. [59]. For that reason, the data of Bohloul et al. [34] were excluded from the database. Regarding CO2-MEA-H2O, VLE data from Lee et al. [60] were excluded from the database, since they show higher CO2 partial pressures than other data at the same conditions [61]. The data that were finally selected are presented in Table 3 and Table 4.
The eNRTL model of Aspen Plus provides accurate results regarding the VLE of ternary CO2-K2CO3-H2O and CO2-MEA-H2O, based on Figure 2 and Figure 3, but it was observed that there is deviation between the calculated heat capacities of binary and ternary mixtures and experimental data, which have a great effect on reboiler duty calculations. Therefore, it was decided to update eNRTL parameters in order to better fit heat capacity data and accurately describe VLE data. For that purpose, the data regression system (DRS) provided by Aspen Plus is used in order to fit the user-specified data by changing the adjustable parameters. First, parameters affecting the specific heat capacity and vapor–liquid equilibrium data of the binary mixtures were regressed, and afterwards the same properties of the ternary mixtures were fitted. The parameters related to the specific heat capacity and VLE data were regressed simultaneously.
Regarding potassium carbonate, the regressed parameters are presented in Table S1 of the Supplementary Materials. Enthalpies of formation and Gibbs free energies were taken from Kaur et al. [35]. The data used in the regression cover the temperature range of the absorber and stripper, when using carbonic anhydrase, and they are restricted up to 383.15 K, because carbonic anhydrase is found to be thermostable until this temperature [62]. Furthermore, the range of K2CO3 concentration assures the complete dissociation of potassium carbonate and potassium bicarbonate in an aqueous solution [48]. The data used in the regression and the results of the updated eNRTL for the binary and ternary mixtures are presented in Table 3, whereas some indicative CO2 solubility results of the updated model are presented and compared to the experimental data and original eNRTL in Figure 2. The results indicate the overall satisfactory performance of the updated eNRTL in binary and ternary mixtures, both in heat capacity and in solubility data, a fact which renders the reliability of the model, in order to be used in simulations.
Table 3. Experimental data used in the regression and updated eNRTL results for aqueous K2CO3 solvent.
H2O-K2CO3
ReferenceData TypeTemperature (K)Concentration
(% w/w)
Average Absolute
Deviation %
Roy et al. [63]Osmotic coefficient298.150–304.2
Mean ionic activity coefficient298.150–3010.2
Hilliard et al. [37]Heat capacity313.15–353.150–302.7
H2O-KHCO3
Roy et al. [63]Osmotic coefficient298.150–306.3
Mean ionic activity coefficient298.150–3031.2
Aseyev et al. [64]Heat capacity283.15–378.150–3013.9
CO2-H2O-K2CO3
Kamps et al. [58]TPxy313.2–353.15–2021.6
Tosh et al. [59]TPxy343.15–383.1520–3010.5
Jo et al. [65]TPxy373.23033.6
Shen et al. [66]TPxy3133015.6
Endo et al. [67]TPxy323.15–343.153030.7
Park et al. [68]TPxy298.2–323.25–1033.3
Regarding monoethanolamine, the regressed parameters are presented in Tables S2 and S3 of the Supplementary Materials. In this case too, the data used in the regression cover the temperature, pressure, and concentration ranges of the absorber and stripper. The monoethanolamine concentration is up to 30% w/w, as this is commonly used in practice. The data used in the regression and the results of the updated eNRTL are presented in Table 4, whereas some indicative VLE and heat capacity model results are presented and compared to the experimental data and original eNRTL results in Figure 3. The results confirm the overall satisfactory performance of the updated eNRTL in binary and ternary mixtures, both in heat capacity and in solubility data.
Table 4. Experimental data used in the regression and updated eNRTL results for aqueous MEA solvent.
MEA
ReferenceData TypeTemperature (K)Concentration
(% w/w)
Average Absolute
Deviation %
Kapteina et al. [69]Heat of vaporization279–303.2 0.36
H2O-MEA
Kim et al. [70]TPxy313.15–373.150–78.90.95
Hilliard et al. [37]Heat capacity298.15–353.152.96–1002.05
CO2-H2O-MEA
Jou et al. [61]TPxy313.15–393.153042.54
Aronu et al. [25]TPxy313.15–393.1515–3037.3
Nakagaki et al. [24]Heat capacity298.15–348.15302.13
It is worth mentioning that the original model yields more accurate VLE results at high pressures. However, the updated eNRTL provides greater accuracy and reliability under the specific conditions of the process. In general, it can be considered a reliable model for a wide variety of temperatures, pressures, and CO2 loadings for both VLE and heat capacities predictions.

3.2. Process Model Validation

In order to validate the process model, experimental data from pilot plants, presented in the literature, were selected. In the case of potassium carbonate, the experimental data were taken from Quyn et al. [45] and Salmon et al. [16], and they referred to no use of carbonic anhydrase and the use of 1 g/L and 4 g/L, respectively. The varying process parameters among these experiments included the flue gas and solvent flow rates and compositions, the carbonic anhydrase concentration, and solvent temperature.
To conduct the rate-based modeling of the pilot plant, the absorber and the stripper were assumed to be RadFrac columns consisting of six theoretical stages, with the reaction occurring exclusively in the liquid phase. The flow model was considered to be mixed, while the reaction condition factor was set at 0.5, and a geometric film discretization option with a ratio of two was employed. The tuning factors of interfacial area, heat transfer, and mass transfer were specified as equal to one, with the liquid-phase film discretized into five points and ignoring the film resistance in the vapor phase. The Chilton and Colburn [71] analogy was used to calculate the heat transfer coefficient, while the mass transfer coefficient and the interfacial area were determined by using the Onda-68 [72] correlation. The holdup was calculated by using the Stichlmair89 [73] correlation. The packing material depends on the pilot and it was metal Pall rings in the case of the pilot of Quyn et al. [45], whereas it was ceramic Raschig rings in the case of the pilot of Salmon et al. [16].
The results of the validation are presented in Table 5 and it is concluded that the developed model is reliable in a wide range of liquid-to-gas (L/G) ratios (4–15.8 kg/kg) and carbonic anhydrase concentrations (0–4 g/L). The model accurately describes CO2 absorption (%) with an average absolute deviation of 11.8%, well within the 20% deviation typically accepted for small pilot plants [74], and gives satisfactory results in the case of reboiler duty, with an average absolute deviation equal to 19.9%, compared to the experimental data of the two pilots.
Salmon et al. [16] presented an experimental run using aqueous monoethanolamine solution. This experiment was used to validate the developed model, and the results are presented in Table 6. The rate-based parameters used were the ones presented previously. Another pilot plant was also used for the validation of the monoethanolamine model. The experimental data were taken from Mangalapally et al. [52] and they consisted of varying process parameters, such as different flue gas and solvent flow rates and compositions, details of which can be found in Mangalapally et al. [52]. In each case, a solvent consisting of 30 wt % MEA with different lean CO2 loadings was used.
To conduct the rate-based modeling of the pilot plant, it was assumed that the absorber is a RadFrac column consisting of 10 theoretical stages, with the reaction occurring exclusively in the liquid phase. The reaction condition factor was set at 0.9 [75], and a geometric film discretization option with a ratio of five was employed [75]. The interfacial area tuning factor is specified as equal to 0.6, with the liquid-phase film discretized into five points and film consideration in the vapor phase [76]. The Brf-85 [77] method was utilized in order to calculate the mass transfer coefficient and interfacial area, while the heat transfer coefficient was determined using the Chilton and Colburn [71] method [75].
The desorber, also a RadFrac column, was equipped with a partial-vapor condenser and a kettle reboiler, operating at 2 bar. The reaction condition factor for the desorber was set at 0.5, maintaining a geometric film discretization option with a ratio of five. The tuning parameters and other specifications of the column are identical to those used for the absorber [75]. In both columns, Sulzer BX packing material was used.
The validation results are presented in Table 6. It is concluded that the developed model accurately describes CO2 absorption (AADP = 3.1%) and reboiler duties (AADP = 13.1%) in a wide range of liquid-to-gas (L/G) ratios (1.3–7.8 kg/kg) and lean solvent loadings (0.2–0.3 mol CO2/mol MEA). These deviations are within the acceptable range, as outlined in the literature [78], for both CO2 absorption and reboiler duty.

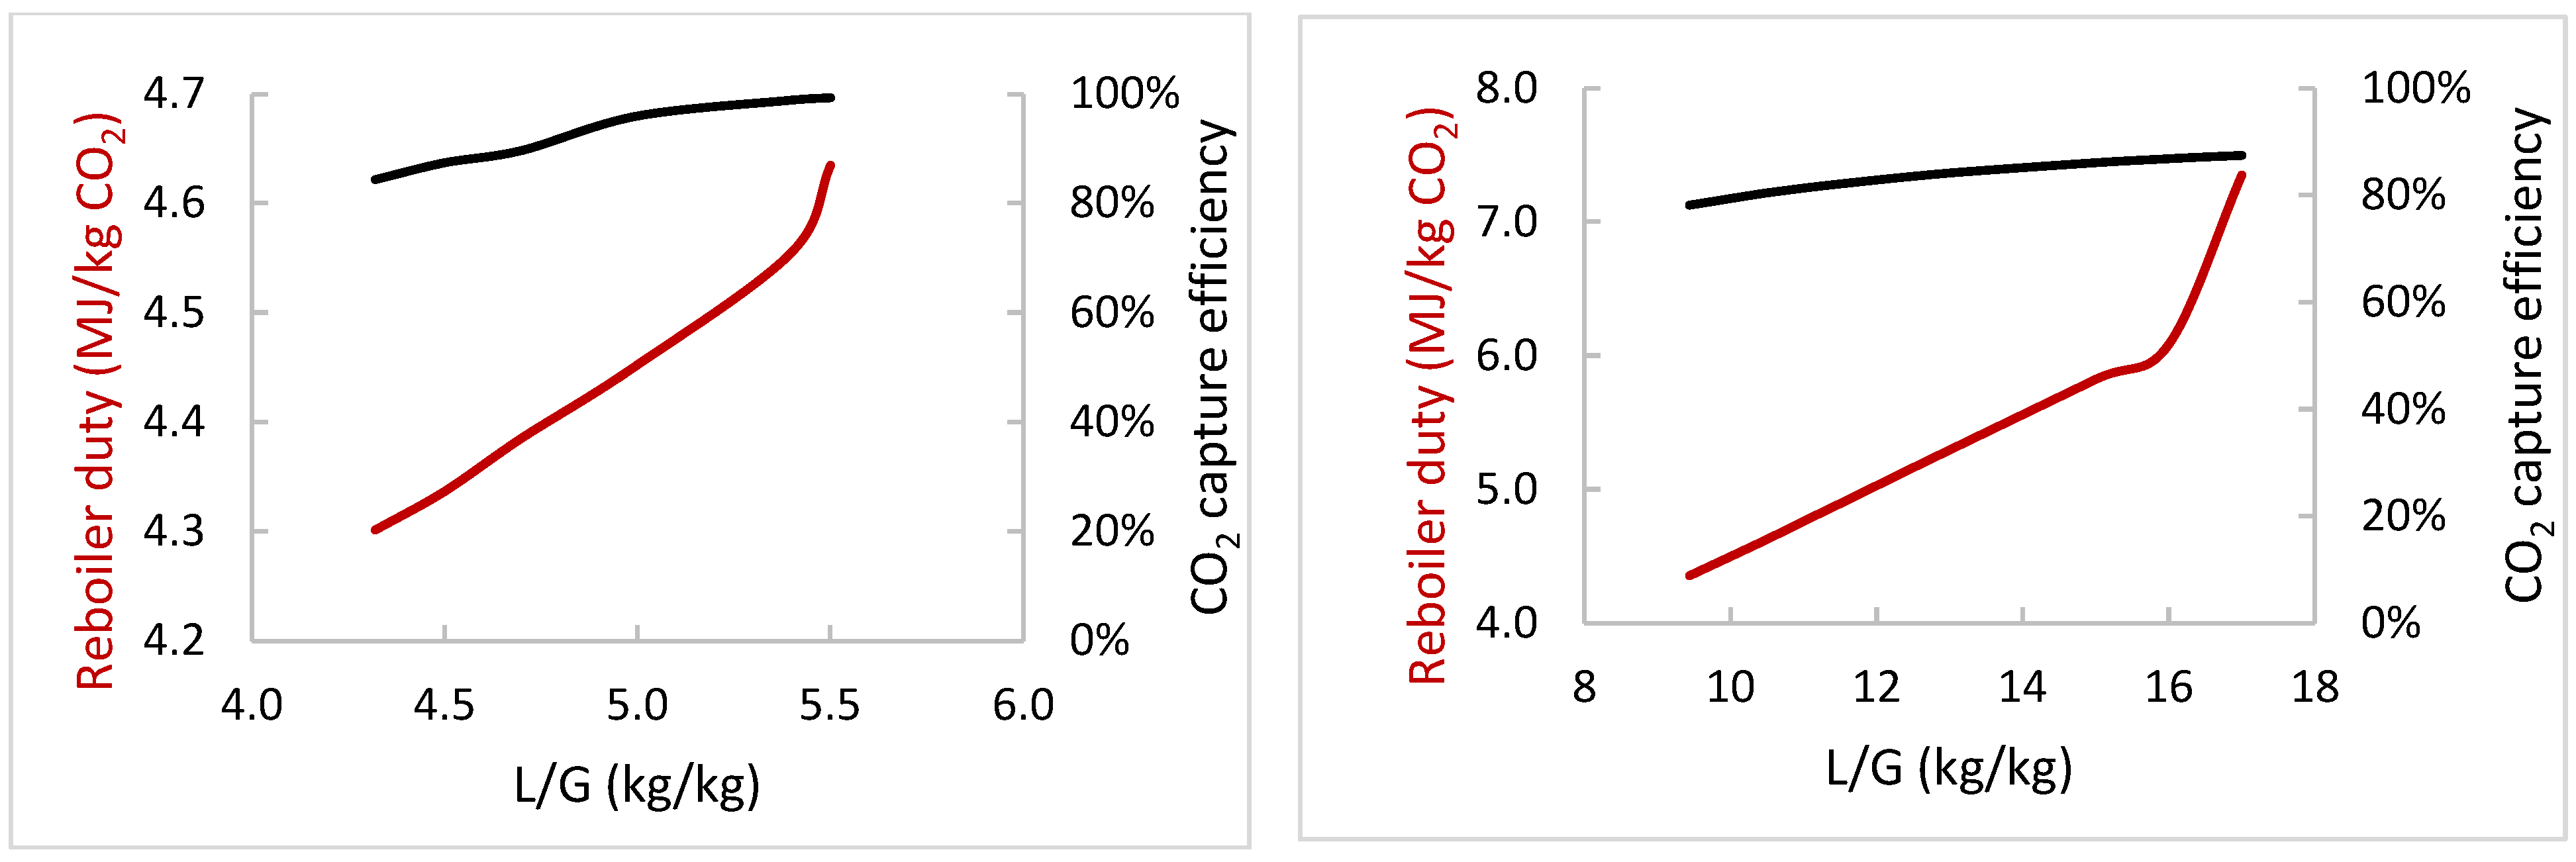
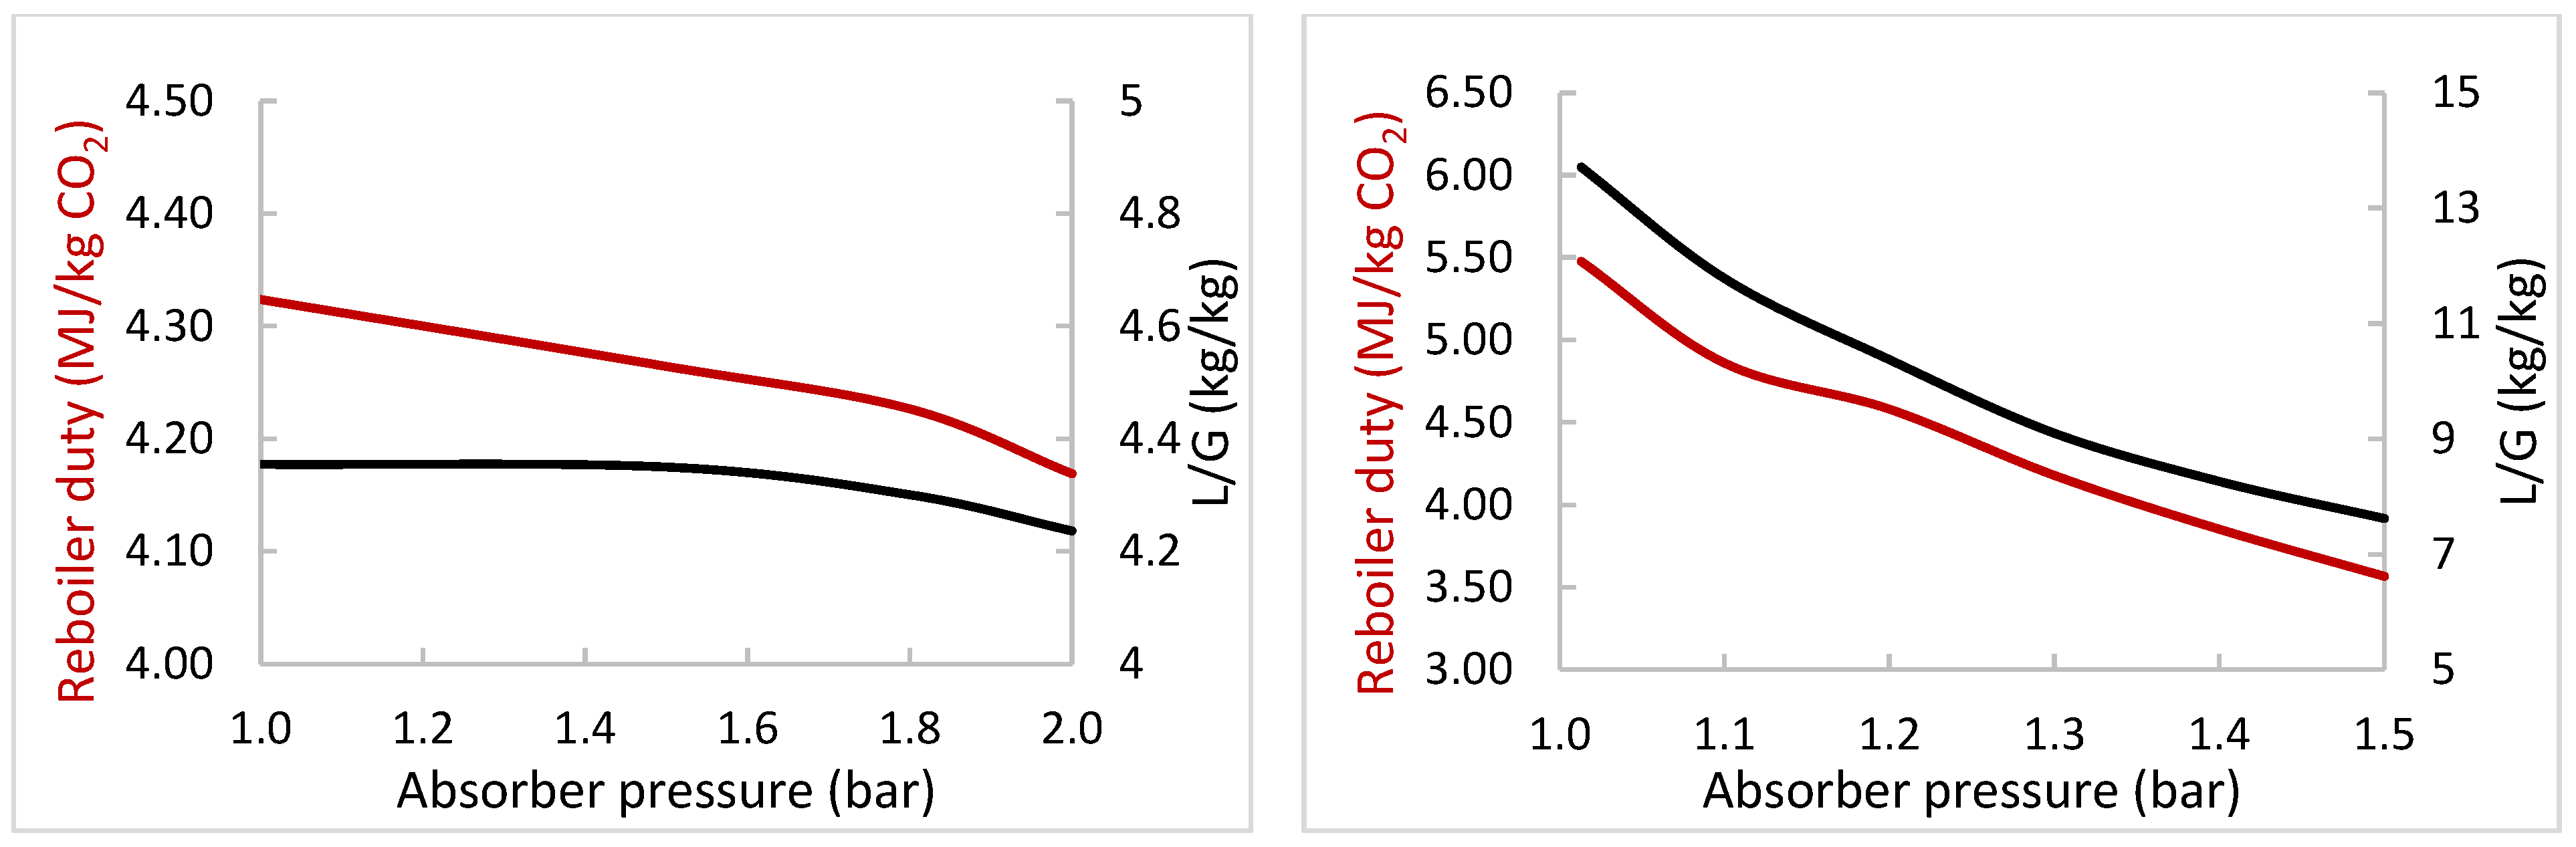
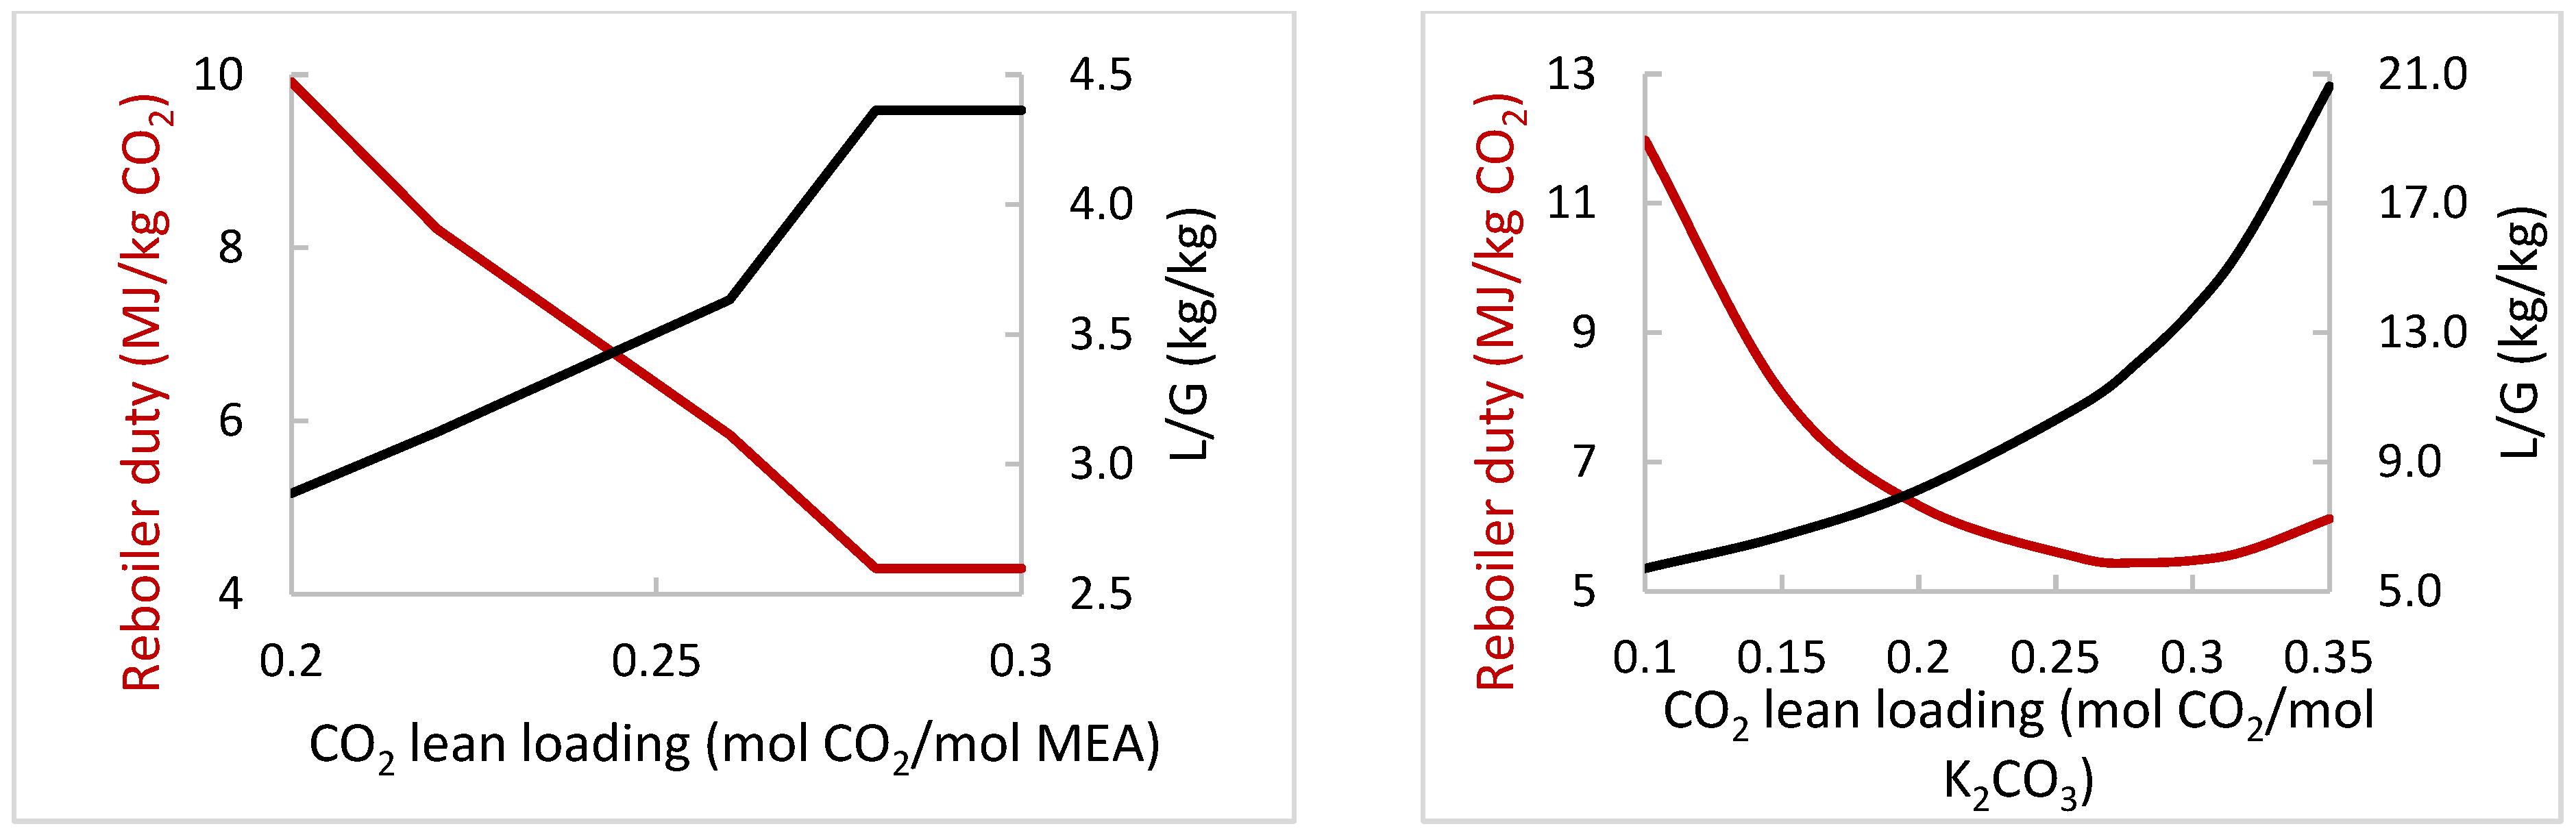
3.3. Comparison of Aqueous MEA and Enzymatic K2CO3 Solvents

Following the validation of the simulation model for both solvents, a comparative analysis was conducted using the pilot plant from Quyn et al. [45]. The inlet streams composition and column conditions are presented in Table 7. Regarding the lean/rich solvent heat exchanger, no pressure drop was considered, while ΔT was set equal to 6 and 9 °C for MEA and K2CO3, respectively. The rich solvent enters the stripper at a temperature close to that of the specific stage where it is introduced: approximately 100 and 65 °C for MEA and K2CO3. Regarding the stripper, design specifications have been considered, ensuring that the whole amount of CO2 entering the column exits at the top, while the solvent is fully regenerated. The simulator calculated the reboiler heat duty that was necessary to meet these specifications.
Subsequently, a series of parametric simulations were performed for each solvent to observe the effects of varying certain parameters on performance indicators such as CO2 capture percentage and reboiler duty (Qreb). The specific process parameter variations examined are presented in detail in Table 8.
Based on the analysis of study A, depicted in Figure 4, it was observed that increasing the liquid flow rate, and thus the L/G ratio, resulted in higher CO2 capture percentages and reboiler duties for both solvents. The improved CO2 capture percentages are due to the expansion of the liquid–gas interfacial area, as more solvent is available for CO2 absorption with a higher L/G ratio. The increased reboiler duty is attributed to the increased amount of the solution, which is needed to be regenerated [79].
Although both solvents exhibit similar trends in the sensitivity analysis of the L/G ratio, a comparison reveals that each solvent requires a distinct L/G ratio range to achieve CO2 capture efficiencies above 80%. For the validated pilot plant analyzed above, the MEA solvent model achieves higher CO2 capture efficiencies (84–99%) compared to the K2CO3 solvent with 4 g/L CA (78–87%). However, the L/G ratio ranges differ significantly, from −4.3–5.5 kg/kg for MEA versus 9.4–17 kg/kg for enzymatic K2CO3. This discrepancy is attributed to the difference in reactivity between the two solvents. MEA, with higher reactivity, absorbs CO2 more quickly and efficiently, resulting in high capture efficiencies at lower solvent flow rates. In contrast, K2CO3, which has lower reactivity, requires higher solvent flow rates to achieve similar capture efficiencies. Furthermore, the K2CO3 solvent model experiences larger variations in reboiler duty, due to the more significant impact of L/G ratio variations, ranging from 4.2 to 7 MJ/kg CO2 captured, compared to the MEA system, which maintains a more consistent reboiler duty range of 4.3 to 4.6 MJ/kg CO2 captured.
To evaluate the results of studies B–D, a constant CO2 absorption of 85% was selected. Under the base case conditions specified in Table 7, this absorption was achieved with an L/G ratio of 4.3 kg/kg, resulting in a reboiler duty of 4.3 MJ/kg CO2 captured when using the MEA solvent. This reboiler duty is consistent with the typical values reported in the literature for MEA-based systems [15]. For the K2CO3 solvent, enhanced with 4 g/L of carbonic anhydrase, achieving the same 85% CO2 capture efficiency required a significantly higher L/G ratio of 13.7 kg/kg and a reboiler duty of 5.5 MJ/kg CO2 captured. The reboiler duty for K2CO3 solvent is also in close agreement with values reported in the literature for similar systems [12]. Heat losses were not part of our study, while pumping requirements were calculated to be equal to 0.0018 and 0.016 MJ/kg CO2 for the MEA and K2CO3 base case. Moreover, cooling duties were equal to 4 and 3.5 MJ/kg CO2 for MEA and K2CO3, respectively.
The sensitivity analysis of absorber pressure (study B) on the liquid flow rate required achieving the desired CO2 capture efficiency, as well as its impact on reboiler duty for both solvents, which indicates a clear trend: increasing absorber pressure reduced the required liquid flow rate, and thereby the L/G ratio. This, in turn, led to a decrease in the reboiler duty, as depicted in Figure 5. The decrease in L/G ratio with higher absorber pressure is attributed to the enhanced solubility of CO2 in the solvent, allowing the same CO2 capture with a smaller solvent volume. The steeper reduction observed with the K2CO3 solvent compared to the MEA solvent arises from its relatively smaller increase in solubility—and thereby higher variation in L/G ratio—with variations in absorber pressure.
Alternatively, increasing the stripper pressure (study C) had distinct effects on the reboiler duty for each solvent. For the MEA solvent, higher stripper pressures resulted in a reduction in reboiler duty. This reduction occurs because elevated pressures cause increased temperatures, which renders the CO2 transfer to the gas face easier. In contrast, for the K2CO3 solvent, increasing stripper pressure led to a higher energy requirement. This is due to the ratio of heat of absorption of K2CO3 to the heat of vaporization of water, which is less than one. Therefore, as the pressure increases, a greater amount of vapor water leaves along with CO2 at the top of the column [80]. The results of both cases are depicted in Figure 6.
Finally, the effect of CO2 lean loading on the liquid flow rate needed to achieve the desired efficiency, as well as its impact on the reboiler duty, was examined in study D. For both solvents, an increased CO2 content in the lean stream necessitated a higher liquid flow rate to achieve 85% CO2 absorption. This is due to the decreased capacity of the solvent to absorb additional CO2. Consequently, a higher CO2 content in the solvent resulted in a reduced energy demand for the reboiler, as less energy is required for the regeneration of a solvent with a higher CO2 content. The results are presented in Figure 7.
The comparison between K2CO3 solvent with enhanced 4 g/L CA and MEA for CO2 capture reveals a complex trade-off between energy efficiency and system stability. In the base case, K2CO3 requires more energy than MEA to achieve 85% CO2 capture efficiency, with a higher solvent flow rate. However, sensitivity analysis suggests that under optimized conditions, K2CO3 can outperform MEA. For instance, at an absorber pressure of 1.5 bar, K2CO3 achieves a reboiler duty of 3.5 MJ/kg CO2 captured—lower than MEA’s 4.2 MJ/kg CO2. Additionally, under vacuum stripper conditions (0.25 bar), K2CO3’s reboiler duty can decrease to 3 MJ/kg CO2 captured. Even though the higher sensitivity of K2CO3 solvent to operational changes allows for greater optimization, it also introduces a drawback. Different to MEA, which exhibits more stable performance, K2CO3’s efficiency can fluctuate significantly based on system conditions.

4. Conclusions

The need for alternative solvents for CO2 capture has arisen due to the drawbacks of the widely used MEA, such as high vapor pressure, energy requirements, and degradation issues. Potassium carbonate is an alternative solvent, but the slow reaction rates have to be boosted. In this work, the performance of potassium carbonate catalyzed by 4 g/L carbonic anhydrase is compared to that of aqueous MEA. For that purpose, validated models for both solvents have been developed through the thermodynamic and process simulation investigation. An extensive database of VLE, heat capacity, and heat of vaporization data in the temperature, pressure, and concentration range of the CO2 capture process has been created in order to check the performance of eNRTL. Refitting of some parameters was decided in order to obtain accurate results, especially in the case of heat capacities. The updated eNRTL model described the aforementioned properties accurately, whereas in heat capacities specifically, the average absolute deviation is up to 14% in the case of potassium carbonate and 3% in the case of monoethanolamine. The updated eNRTL has been incorporated in process simulations for both solvents, and the developed process models have been tested against pilot plant data retrieved from the literature. The average absolute deviation in CO2 absorption is 11.8% for experiments in which 0, 1, and 4 g/L carbonic anhydrase have been used and 3.1% in the case of MEA. Regarding the reboiler duties, the AADP was equal to 19.9% and 13.1% for K2CO3 and MEA, respectively. The process models have been used for the comparison of the two solvents, whereas sensitivity analyses have also been performed. K2CO3 solvent with enhanced CA shows the potential for greater energy savings than MEA in optimized conditions, but its sensitivity to operating conditions necessitates careful management, making it both a promising yet more demanding alternative. Moreover, carbonic anhydrase is still quite expensive; therefore, further research in that field, in conjunction with techno-economic studies, may enhance its practical applicability.

Supplementary Materials

The following supporting information can be downloaded at https://www.mdpi.com/article/10.3390/en18112981/s1: Table S1: Modified parameters in the binary K2CO3-H2O; Table S2: Modified parameters in the binary MEA-H2O; Table S3: Modified parameters in the ternary CO2-MEA-H2O.

Author Contributions

Conceptualization, A.P.; methodology, A.P.; validation, A.P. and C.P.; formal analysis, A.P. and C.P.; investigation, A.P. and C.P.; resources, P.G.; data curation, A.P. and C.P; writing—original draft preparation, A.P. and C.P.; writing—review and editing, A.P. and C.P.; visualization, A.P. and C.P.; supervision, P.G.; project administration, P.G.; funding acquisition, P.G. All authors have read and agreed to the published version of the manuscript.

Funding

This research was funded by the Operational Program “Competitiveness, Entrepreneurship, and Innovation” (EPAnEK) under grant number [T2EΔK-02899/MIS5134532], CoCCUS (Cost-effective CO2 Capture and Utilization from magnesite/lime industry using enzyme-boosted K2CO3 Solvents).

Data Availability Statement

The original contributions presented in this study are included in the article/Supplementary Materials. Further inquiries can be directed to the corresponding authors.

Acknowledgments

We acknowledge support of this work by the project “CoCCUS” (https://co2coccus.gr/en/, accessed on 7 May 2025), which is co-financed by the European Regional Development Fund of the European Union and Greek national funds through the Operational Program “Competitiveness, Entrepreneurship, and Innovation”, under the call RESEARCH—CREATE—INNOVATE (project code: T2E∆K-02899/MIS5134532).

Conflicts of Interest

The authors declare no conflicts of interest. The funders had no role in the design of the study; in the collection, analyses, or interpretation of data; in the writing of the manuscript; or in the decision to publish the results.

Abbreviations

The following abbreviations are used in this manuscript:
AAD (%) average   absolute   deviation   x e x p x c a l c x e x p × 100
CAcarbonic anhydrase
f o liquid phase fugacity
G E excess Gibbs energy
L/Gliquid to gas ratio (kg of solvent/kg of flue gas)
Ppressure
Ttemperature
yvapor phase mole fraction
xliquid phase mole fraction
eNRTLelectrolyte Non-Random Two Liquid coefficient model
γ activity coefficient
φ ^ vapor phase fugacity coefficient

References

  1. United Nations Climate Change. The Paris Agreement. Available online: https://unfccc.int/process-and-meetings/the-paris-agreement (accessed on 2 April 2025).
  2. IPCC. Climate Change 2023: Synthesis Report. Contribution of Working Groups I, II and III to the Sixth Assessment Report of the Intergovernmental Panel on Climate Change; IPCC: Geneva, Switzerland, 2023; pp. 35–115. [Google Scholar]
  3. European Commision. Energy Climate change, Environment, Causes of climate change. Available online: https://climate.ec.europa.eu/climate-change/causes-climate-change_en (accessed on 2 April 2025).
  4. Liu, H.; Lu, H.; Hu, H. CO2 capture and mineral storage: State of the art and future challenges. Renew. Sustain. Energy Rev. 2024, 189, 113908. [Google Scholar] [CrossRef]
  5. Li, B.-H.; Zhang, N.; Smith, R. Simulation and analysis of CO2 capture process with aqueous monoethanolamine solution. Appl. Energy 2016, 161, 707–717. [Google Scholar] [CrossRef]
  6. Mokhatab, S.; Poe, W.A.; Speight, J.G. Handbook of Natural Gas Transmission and Processing; Gulf Professional Publishing: Oxford, UK, 2012. [Google Scholar]
  7. Sadegh, N. Acid Gas Removal from Natural Gas with Alkanolamines: A Modeling and Experimental Study. Ph.D. Thesis, Technical University of Denmark, Lyngby, Denmark, 2013. [Google Scholar]
  8. Yang, H.; Xu, Z.; Fan, M.; Gupta, R.; Slimane, R.B.; Bland, A.E.; Wright, I. Progress in carbon dioxide separation and capture: A review. J. Environ. Sci. 2008, 20, 14–27. [Google Scholar] [CrossRef] [PubMed]
  9. Nwaoha, C.; Saiwan, C.; Supap, T.; Idem, R.; Tontiwachwuthikul, P.; Rongwong, W.; Al-Marri, M.J.; Benamor, A. Carbon dioxide (CO2) capture performance of aqueous tri-solvent blends containing 2-amino-2-methyl-1-propanol (AMP) and methyldiethanolamine (MDEA) promoted by diethylenetriamine (DETA). Int. J. Greenh. Gas Control 2016, 53, 292–304. [Google Scholar] [CrossRef]
  10. Najafloo, A.; Zarei, S. Modeling solubility of CO2 in aqueous monoethanolamine (MEA) solution using SAFT-HR equation of state. Fluid Phase Equilib. 2018, 456, 25–32. [Google Scholar] [CrossRef]
  11. Gabrielsen, J.; Michelsen, M.L.; Stenby, E.H.; Kontogeorgis, G.M. Modeling of CO2 absorber using an AMP solution. AIChE J. 2006, 52, 3443–3451. [Google Scholar] [CrossRef]
  12. Qi, G.; Liu, K.; Frimpong, R.A.; House, A.; Salmon, S.; Liu, K. Integrated bench-scale parametric study on CO2 capture using a carbonic anhydrase promoted K2CO3 solvent with low temperature vacuum stripping. Ind. Eng. Chem. Res. 2016, 55, 12452–12459. [Google Scholar] [CrossRef]
  13. Business Analytiq. Price Trend Data & Tools to Create Benchmarks and Leading Indicators. Available online: https://businessanalytiq.com/ (accessed on 25 May 2025).
  14. Ghiat, I.; AlNouss, A.; Mckay, G.; Al-Ansari, T. Modelling and simulation of a biomass-based integrated gasification combined cycle with carbon capture: Comparison between monoethanolamine and potassium carbonate. In Proceedings of the IOP Conference Series: Earth and Environmental Science, Bangkok, Thailand, 11–14 December 2019; p. 012019. [Google Scholar]
  15. Kothandaraman, A.; Nord, L.; Bolland, O.; Herzog, H.J.; McRae, G.J. Comparison of solvents for post-combustion capture of CO2 by chemical absorption. Energy Procedia 2009, 1, 1373–1380. [Google Scholar] [CrossRef]
  16. Salmon, S.; House, A.; Liu, K.; Frimpong, R.; Liu, K.; Freeman, C.; Whyatt, G.; Slater, J.; Fitzgerald, D. Low-Energy Solvents for Carbon Dioxide Capture Enabled by a Combination of Enzymes and Vacuum Regeneration; Novozymes North America, Inc.: Franklinton, NC, USA, 2015. [Google Scholar]
  17. Zhang, S.; Lu, Y. Kinetic performance of CO2 absorption into a potassium carbonate solution promoted with the enzyme carbonic anhydrase: Comparison with a monoethanolamine solution. Chem. Eng. J. 2015, 279, 335–343. [Google Scholar] [CrossRef]
  18. Gabrielsen, J.; Michelsen, M.L.; Stenby, E.H.; Kontogeorgis, G.M. A Model for Estimating CO2 Solubility in Aqueous Alkanolamines. Ind. Eng. Chem. Res. 2005, 44, 3348–3354. [Google Scholar] [CrossRef]
  19. Kalatjari, H.R.; Haghtalab, A.; Nasr, M.R.J.; Heydarinasab, A. Experimental, simulation and thermodynamic modeling of an acid gas removal pilot plant for CO2 capturing by mono-ethanol amine solution. J. Nat. Gas Sci. Eng. 2019, 72, 103001. [Google Scholar] [CrossRef]
  20. Luo, X.; Wang, M. Improving Prediction Accuracy of a Rate-Based Model of an MEA-Based Carbon Capture Process for Large-Scale Commercial Deployment. Engineering 2017, 3, 232–243. [Google Scholar] [CrossRef]
  21. Zhu, K.; Yue, C.; Wei, Z.; Huang, J.; Hu, M.; Ji, Y.; Liu, H.; Zhu, H.; Guo, W.; Zhou, F. Experimental and thermodynamic investigation on CO2 absorption in aqueous MEA solutions. Adv. Mater. Sci. Eng. 2022, 2022, 6278342. [Google Scholar] [CrossRef]
  22. Austgen, D.M.; Rochelle, G.T.; Peng, X.; Chen, C.C. Model of vapor-liquid equilibria for aqueous acid gas-alkanolamine systems using the electrolyte-NRTL equation. Ind. Eng. Chem. Res. 1989, 28, 1060–1073. [Google Scholar] [CrossRef]
  23. Zhang, Y.; Que, H.; Chen, C.-C. Thermodynamic modeling for CO2 absorption in aqueous MEA solution with electrolyte NRTL model. Fluid Phase Equilib. 2011, 311, 67–75. [Google Scholar] [CrossRef]
  24. Nakagaki, T.; Isogai, H.; Sato, H.; Arakawa, J. Updated e-NRTL model for high-concentration MEA aqueous solution by regressing thermodynamic experimental data at high temperatures. Int. J. Greenh. Gas Control 2019, 82, 117–126. [Google Scholar] [CrossRef]
  25. Aronu, U.E.; Gondal, S.; Hessen, E.T.; Haug-Warberg, T.; Hartono, A.; Hoff, K.A.; Svendsen, H.F. Solubility of CO2 in 15, 30, 45 and 60 mass% MEA from 40 to 120 °C and model representation using the extended UNIQUAC framework. Chem. Eng. Sci. 2011, 66, 6393–6406. [Google Scholar] [CrossRef]
  26. Darde, V.; Van Well, W.J.; Fosboel, P.L.; Stenby, E.H.; Thomsen, K. Experimental measurement and modeling of the rate of absorption of carbon dioxide by aqueous ammonia. Int. J. Greenh. Gas Control 2011, 5, 1149–1162. [Google Scholar] [CrossRef]
  27. Button, J.; Gubbins, K. SAFT prediction of vapour-liquid equilibria of mixtures containing carbon dioxide and aqueous monoethanolamine or diethanolamine. Fluid Phase Equilib. 1999, 158, 175–181. [Google Scholar] [CrossRef]
  28. Nasrifar, K.; Tafazzol, A. Vapor−Liquid Equilibria of Acid Gas−Aqueous Ethanolamine Solutions Using the PC-SAFT Equation of State. Ind. Eng. Chem. Res. 2010, 49, 7620–7630. [Google Scholar] [CrossRef]
  29. Téllez-Arredondo, P.; Medeiros, M. Modeling CO2 and H2S solubilities in aqueous alkanolamine solutions via an extension of the Cubic-Two-State equation of state. Fluid Phase Equilib. 2013, 344, 45–58. [Google Scholar] [CrossRef]
  30. Putta, K.R.; Svendsen, H.F.; Knuutila, H.K. CO2 absorption into loaded aqueous MEA solutions: Impact of different model parameter correlations and thermodynamic models on the absorption rate model predictions. Chem. Eng. J. 2017, 327, 868–880. [Google Scholar] [CrossRef]
  31. Moioli, S.; Nagy, T.; Langé, S.; Pellegrini, L.A.; Mizsey, P. Simulation model evaluation of CO2 capture by aqueous MEA scrubbing for heat requirement analyses. Energy Procedia 2017, 114, 1558–1566. [Google Scholar] [CrossRef]
  32. Borhani, T.N.G.; Akbari, V.; Hamid, M.K.A.; Manan, Z.A. Rate-based simulation and comparison of various promoters for CO2 capture in industrial DEA-promoted potassium carbonate absorption unit. J. Ind. Eng. Chem. 2015, 22, 306–316. [Google Scholar] [CrossRef]
  33. Imle, M.; Kumelan, J.; Speyer, D.; McCann, N.; Maurer, G.; Hasse, H. Solubility of carbon dioxide in activated potash solutions in the low and high gas loading regions. Ind. Eng. Chem. Res. 2013, 52, 13477–13489. [Google Scholar] [CrossRef]
  34. Bohloul, M.; Sadeghabadi, M.A.; Peyghambarzadeh, S.; Dehghani, M. CO2 absorption using aqueous solution of potassium carbonate: Experimental measurement and thermodynamic modeling. Fluid Phase Equilib. 2017, 447, 132–141. [Google Scholar] [CrossRef]
  35. Kaur, H.; Chen, C.-C. Thermodynamic modeling of CO2 absorption in aqueous potassium carbonate solution with electrolyte NRTL model. Fluid Phase Equilib. 2020, 505, 112339. [Google Scholar] [CrossRef]
  36. Lee, A.; Mumford, K.A.; Wu, Y.; Nicholas, N.; Stevens, G.W. Understanding the vapour–liquid equilibrium of CO2 in mixed solutions of potassium carbonate and potassium glycinate. Int. J. Greenh. Gas Control 2016, 47, 303–309. [Google Scholar] [CrossRef]
  37. Hilliard, M.D. A Predictive Thermodynamic Model for an Aqueous Blend of Potassium Carbonate, Piperazine, and Monoethanolamine for Carbon Dioxide Capture from Flue Gas. Ph.D. Thesis, The University of Texas at Austin, Austin, TX, USA, 2008. [Google Scholar]
  38. Cullinane, J.T.; Rochelle, G.T. Thermodynamics of aqueous potassium carbonate, piperazine, and carbon dioxide. Fluid Phase Equilib. 2005, 227, 197–213. [Google Scholar] [CrossRef]
  39. Fosbøl, P.L.; Maribo-Mogensen, B.; Thomsen, K. Solids modelling and capture simulation of piperazine in potassium solvents. Energy Procedia 2013, 37, 844–859. [Google Scholar] [CrossRef]
  40. Rochelle, G.T.; Chen, E.; Oyenekan, B.; Sexton, A.; Davis, J.; Hilliard, M.; Veawab, A. CO2 Capture by Absorption with Potassium Carbonate; The University of Texas at Austin: Austin, TX, USA, 2003. [Google Scholar]
  41. Neveux, T.; Le Moullec, Y.; Corriou, J.-P.; Favre, E. Modeling CO2 capture in amine solvents: Prediction of performance and insights on limiting phenomena. Ind. Eng. Chem. Res. 2013, 52, 4266–4279. [Google Scholar] [CrossRef]
  42. Zhang, Y.; Chen, C.-C. Modeling CO2 absorption and desorption by aqueous monoethanolamine solution with Aspen rate-based model. Energy Procedia 2013, 37, 1584–1596. [Google Scholar] [CrossRef]
  43. Garcia, M.; Knuutila, H.K.; Gu, S. ASPEN PLUS simulation model for CO2 removal with MEA: Validation of desorption model with experimental data. J. Environ. Chem. Eng. 2017, 5, 4693–4701. [Google Scholar] [CrossRef]
  44. Smith, K.; Lee, A.; Mumford, K.; Li, S.; Thanumurthy, N.; Temple, N.; Anderson, C.; Hooper, B.; Kentish, S.; Stevens, G. Pilot plant results for a precipitating potassium carbonate solvent absorption process promoted with glycine for enhanced CO2 capture. Fuel Process. Technol. 2015, 135, 60–65. [Google Scholar] [CrossRef]
  45. Quyn, D.; Rayer, A.V.; Gouw, J.; Indrawan, I.; Mumford, K.A.; Anderson, C.J.; Hooper, B.; Stevens, G.W. Results from a pilot plant using un-promoted potassium carbonate for carbon capture. Energy Procedia 2013, 37, 448–454. [Google Scholar] [CrossRef]
  46. Mumford, K.A.; Smith, K.H.; Anderson, C.J.; Shen, S.; Tao, W.; Suryaputradinata, Y.A.; Qader, A.; Hooper, B.; Innocenzi, R.A.; Kentish, S.E. Post-combustion capture of CO2: Results from the solvent absorption capture plant at Hazelwood power station using potassium carbonate solvent. Energy Fuels 2012, 26, 138–146. [Google Scholar] [CrossRef]
  47. Aspen Technology Inc. Aspen Plus V11; Aspen Technology Inc.: Cambridge, MA, USA, 2020. [Google Scholar]
  48. Hilliard, M.D.; Rochelle, G.T. Thermodynamics of aqueous piperazine/potassium carbonate/carbon dioxide chare cterized by the electrolyte non-random two-liquid model in aspen plus. In Greenhouse Gas Control Technologies 7; Elsevier: Amsterdam, The Netherlands, 2005; pp. 1975–1978. [Google Scholar]
  49. Arshad, M.; Wukovits, W.; Friedl, A. Simulation of CO2 absorption using the system K2CO3-piperazine. Chem. Eng. 2014, 39, 577–582. [Google Scholar]
  50. Redlich, O.; Kwong, J.N. On the thermodynamics of solutions. V. An equation of state. Fugacities of gaseous solutions. Chem. Rev. 1949, 44, 233–244. [Google Scholar] [CrossRef]
  51. Chen, C.C.; Evans, L.B. A local composition model for the excess Gibbs energy of aqueous electrolyte systems. AIChE J. 1986, 32, 444–454. [Google Scholar] [CrossRef]
  52. Mangalapally, H.P.; Hasse, H. Pilot plant study of post-combustion carbon dioxide capture by reactive absorption: Methodology, comparison of different structured packings, and comprehensive results for monoethanolamine. Chem. Eng. Res. Des. 2011, 89, 1216–1228. [Google Scholar] [CrossRef]
  53. Frailie, P.T.; Rochelle, G.T. Kinetics of Aqueous Methyldiethanolamine/Piperazine for CO2 Capture. In Process Systems and Materials for CO2 Capture: Modelling, Design, Control and Integration; John Wiley & Sons: Hoboken, NJ, USA, 2017; pp. 137–152. [Google Scholar]
  54. Ye, X.; Lu, Y. CO2 absorption into catalyzed potassium carbonate–bicarbonate solutions: Kinetics and stability of the enzyme carbonic anhydrase as a biocatalyst. Chem. Eng. Sci. 2014, 116, 567–575. [Google Scholar] [CrossRef]
  55. Zaks, A.; Reardon, J. Advanced Low Energy Enzyme Catalyzed Solvent for CO2 Capture; Akermin Inc.: St. Louis, MO, USA, 2013. [Google Scholar]
  56. Hikita, H.; Asai, S.; Ishikawa, H.; Honda, M. The kinetics of reactions of carbon dioxide with monoethanolamine, diethanolamine and triethanolamine by a rapid mixing method. Chem. Eng. J. 1977, 13, 7–12. [Google Scholar] [CrossRef]
  57. Pinsent, B.; Pearson, L.; Roughton, F. The kinetics of combination of carbon dioxide with hydroxide ions. Trans. Faraday Society 1956, 52, 1512–1520. [Google Scholar] [CrossRef]
  58. Pérez-Salado Kamps, Á.; Meyer, E.; Rumpf, B.; Maurer, G. Solubility of CO2 in aqueous solutions of KCl and in aqueous solutions of K2CO3. J. Chem. Eng. Data 2007, 52, 817–832. [Google Scholar] [CrossRef]
  59. Tosh, J.S.; Field, J.H.; Benson, H.E.; Anderson, R.B. Equilibrium Pressures of Hydrogen Sulfide and Carbon Dioxide over Solutions of Potassium Carbonate; US Department of the Interior, Bureau of Mines: Washington, DC, USA, 1960; Volume 5622.
  60. Lee, J.I.; Otto, F.D.; Mather, A.E. Equilibrium between carbon dioxide and aqueous monoethanolamine solutions. J. Appl. Chem. Biotechnol. 1976, 26, 541–549. [Google Scholar] [CrossRef]
  61. Jou, F.Y.; Mather, A.E.; Otto, F.D. The solubility of CO2 in a 30 mass percent monoethanolamine solution. Can. J. Chem. Eng. 1995, 73, 140–147. [Google Scholar] [CrossRef]
  62. de Oliveira Maciel, A.; Christakopoulos, P.; Rova, U.; Antonopoulou, I. Carbonic anhydrase to boost CO2 sequestration: Improving carbon capture utilization and storage (CCUS). Chemosphere 2022, 299, 134419. [Google Scholar] [CrossRef]
  63. Roy, R.N.; Gibbons, J.J.; Williams, R.; Godwin, L.; Baker, G.; Simonson, J.M.; Pitzer, K.S. The thermodynamics of aqueous carbonate solutions II. Mixtures of potassium carbonate, bicarbonate, and chloride. J. Chem. Thermodyn. 1984, 16, 303–315. [Google Scholar] [CrossRef]
  64. Aseyev, G. Electrolytes: Equilibria in Solutions and Phase Equilibria; Begell House: Danbury, CT, USA, 1999. [Google Scholar]
  65. Jo, H.; Lee, M.-g.; Kim, B.; Song, H.-J.; Gil, H.; Park, J. Density and solubility of CO2 in aqueous solutions of (potassium carbonate + sarcosine) and (potassium carbonate + pipecolic acid). J. Chem. Eng. Data 2012, 57, 3624–3627. [Google Scholar] [CrossRef]
  66. Shen, S.; Yang, Y.-n.; Wang, Y.; Ren, S.; Han, J.; Chen, A. CO2 absorption into aqueous potassium salts of lysine and proline: Density, viscosity and solubility of CO2. Fluid Phase Equilib. 2015, 399, 40–49. [Google Scholar] [CrossRef]
  67. Endo, K.; Nguyen, Q.S.; Kentish, S.E.; Stevens, G.W. The effect of boric acid on the vapour liquid equilibrium of aqueous potassium carbonate. Fluid Phase Equilib. 2011, 309, 109–113. [Google Scholar] [CrossRef]
  68. Park, S.-B.; Shim, C.-S.; Lee, H.; Lee, K.-H. Solubilities of carbon dioxide in the aqueous potassium carbonate and potassium carbonate poly (ethylene glycol) solutions. Fluid Phase Equilib. 1997, 134, 141–149. [Google Scholar] [CrossRef]
  69. Kapteina, S.; Slowik, K.; Verevkin, S.P.; Heintz, A. Vapor pressures and vaporization enthalpies of a series of ethanolamines. J. Chem. Eng. Data 2005, 50, 398–402. [Google Scholar] [CrossRef]
  70. Kim, I.; Svendsen, H.F.; Børresen, E. Ebulliometric determination of vapor− liquid equilibria for pure water, monoethanolamine, n-methyldiethanolamine, 3-(methylamino)-propylamine, and their binary and ternary solutions. J. Chem. Eng. Data 2008, 53, 2521–2531. [Google Scholar] [CrossRef]
  71. Taylor, R.; Krishna, R. Multicomponent Mass Transfer; John Wiley & Sons: Hoboken, NJ, USA, 1993; Volume 2. [Google Scholar]
  72. Onda, K.; Takeuchi, H.; Okumoto, Y. Mass transfer coefficients between gas and liquid phases in packed columns. J. Chem. Eng. Japan 1968, 1, 56–62. [Google Scholar] [CrossRef]
  73. Stichlmair, J.; Bravo, J.; Fair, J. General model for prediction of pressure drop and capacity of countercurrent gas/liquid packed columns. Gas Sep. Purif. 1989, 3, 19–28. [Google Scholar] [CrossRef]
  74. Pinto, D.; Monteiro, J.; Skylogianni, E.; Moser, P.; Wiechers, G. Validation of process simulator with new plant data for MEA and CESAR1. In Proceedings of the 16th Greenhouse Gas Control Technologies Conference (GHGT-16), Lyon, France, 23–27 October 2022; pp. 23–24. [Google Scholar]
  75. Plus, A. Rate Based Model of the CO2 Capture Process by MEA Using Aspen Plus; Aspen Technology Inc.: Cambridge, MA, USA, 2008. [Google Scholar]
  76. Zhang, Y.; Chen, H.; Chen, C.-C.; Plaza, J.M.; Dugas, R.; Rochelle, G.T. Rate-based process modeling study of CO2 capture with aqueous monoethanolamine solution. Ind. Eng. Chem. Res. 2009, 48, 9233–9246. [Google Scholar] [CrossRef]
  77. Bravo, J.e.L.; Rocha, J.A.; Fair, J.R. Mass transfer in gauze packings. Hydrocarbon Process. 1985, 64, 91–95. [Google Scholar]
  78. Flø, N.E.; Knuutila, H.; Kvamsdal, H.M.; Hillestad, M. Dynamic model validation of the post-combustion CO2 absorption process. Int. J. Greenh. Gas Control 2015, 41, 127–141. [Google Scholar]
  79. Chuenphan, T.; Yurata, T.; Sema, T.; Chalermsinsuwan, B. Techno-economic sensitivity analysis for optimization of carbon dioxide capture process by potassium carbonate solution. Energy 2022, 254, 124290. [Google Scholar] [CrossRef]
  80. Kothandaraman, A. Carbon Dioxide Capture by Chemical Absorption: A Solvent Comparison Study. Ph.D. Thesis, Massachusetts Institute of Technology, Cambridge, MA, USA, 2010. [Google Scholar]
Figure 1. Process flow scheme for CO2 absorption.
Energies 18 02981 g001
Figure 2. eNRTL model results in comparison with experimental data for CO2-K2CO3-H2O and K2CO3-H2O mixtures ((left): experimental data of Tosh et al. [59], (right): experimental data of Hilliard et al. [37]).
Energies 18 02981 g002
Figure 3. eNRTL model results in comparison with experimental data for CO2-MEA-H2O mixture ((left): experimental data of Jou et al. [61], (right): experimental data of Nakagaki et al. [24]).
Energies 18 02981 g003
Figure 4. Effect of L/G ratio on reboiler duty and CO2 capture efficiency ((left): MEA solvent, (right): K2CO3 solvent).
Energies 18 02981 g004
Figure 5. Effect of absorber pressure on reboiler duty ((left): MEA solvent, (right): K2CO3 solvent).
Energies 18 02981 g005
Figure 6. Effect of stripper pressure on reboiler duty ((left): MEA solvent, (right): K2CO3 solvent).
Energies 18 02981 g006
Figure 7. Effect of lean loading on L/G ratio and reboiler duty ((left): MEA solvent, (right): K2CO3 solvent).
Energies 18 02981 g007
Table 1. Reaction kinetics based on Arrhenius equation (K = kTne−E/RT).
ReactionknE (cal/mol)CA (g/L)
194.32 × 10130132490
202.38 × 10170294510
194.23 × 1013087371
202.1744 × 1093.0638249371
194.32 × 1013079504
203.57 × 10180264734
Table 2. Reaction kinetics based on Arrhenius equation (K = kTe−E/RT).
ReactionkE (cal/mol)
219.77 × 10109855.8
223.23 × 101915655
234.32 × 101313249
242.38 × 101729451
Table 5. Validation results of Aspen Plus model for CO2 absorption in aqueous K2CO3 solvent.
ExpRef.CA (g/L)Lean Loading (mol CO2/mol K2CO3)L/G (kg/kg)Exp_CO2
Absorption (%)
Exp_Reboiler Duty (MJ/kg)AAD_CO2 Absorption (%)AAD_Reboiler Duty (%)
1[45]00.08410.9-25.1
2[45]00.09614.1-3.1
3[45]00.08411.4-35.4
4[45]00.10411.0-13.1
5[45]00.14412.7-7.5
6[16]10.329.469.06.810.528.3
7[16]10.3215.872.07.30.812.1
8[16]40.309.484.06.26.831.0
9[16]40.3015.783.06.54.48.3
Average 11.819.9
Table 6. Validation results of Aspen Plus model for CO2 absorption in aqueous MEA solvent.
ExpRef.Lean Loading
(mol_CO2/mol MEA)
L/G (kg/kg)Exp_CO2
Absorption (%)
Exp Reboiler
Duty (MJ/kg)
AAD_CO2
Absorption (%)
AAD_Reboiler
Duty (%)
1[16]0.3007.7993.65.96.417.0
2[52]0.2051.3190.54.70.421.0
3[52]0.2591.9790.55.10.45.1
4[52]0.252.6489.75.72.713.0
5[52]0.2762.6189.95.61.03.8
6[52]0.233.4987.95.06.424.4
7[52]0.232.4693.04.40.214.4
8[52]0.2082.4990.74.45.23.6
9[52]0.2221.3087.95.15.616.1
10[52]0.2041.3091.44.73.012.5
Average 3.113.1
Table 7. Base-case operating conditions used in modeling for solvent comparison.
ParameterValue
Flue gas flow rate (kg/h)2.31
CO2 flue gas (vol%)14.8
Flue gas temperature (°C)41.3
Solvent temperature (°C)39.4
MEA Solvent
MEA wt% in solvent30
Lean loading (mol CO2/kg MEA)0.005
Absorber pressure (bar)1
Stripper pressure (bar)1.22
Stripper temperature (°C)100
K2CO3 Solvent
K2CO3 wt% in solvent23.5
Lean loading (mol CO2/kg K2CO3)0.002
Absorber pressure (bar)1
Stripper pressure (bar)0.35
Stripper temperature (°C)65
Table 8. Overview of process parameter variation studies discussed in the paper.
Variation StudyVaried Operating
Parameter
Range of Variation for the Two SolventsKey Performance
Indicators
Most Important Constant
Parameters
AL/G (kg/kg)MEA: 4.3–5.5,
K2CO3: 9.4–17
% CO2 capture, QrebFlue gas flow and composition,
flue gas and lean solvent temperature,
CO2 lean loading, Pabs/strip
BPabs (bar)MEA: 1–2,
K2CO3: 1–1.5
Qreb% CO2 capture,
flue gas flow and composition,
flue gas and lean solvent temperature,
CO2 lean loading, Pstrip
CPstrip (bar)MEA: 1–1.5,
K2CO3: 0.25–0.5
Qreb% CO2 capture,
flue gas flow and composition,
flue gas and lean solvent temperature,
CO2 lean loading, Pabs
DLean loading (mol CO2/mol Solvent)MEA: 0.2–0.3,
K2CO3: 0.1–0.35
Qreb% CO2 capture,
flue gas flow and composition,
flue gas and lean solvent temperature,
Pabs/strip
Disclaimer/Publisher’s Note: The statements, opinions and data contained in all publications are solely those of the individual author(s) and contributor(s) and not of MDPI and/or the editor(s). MDPI and/or the editor(s) disclaim responsibility for any injury to people or property resulting from any ideas, methods, instructions or products referred to in the content.

