Article

High-Precision Experimental Data for Thermal Model Validation of Flat-Plate Hybrid Water PV/T Collectors

1
Université Le Havre Normandie, GREAH, F-76600 Le Havre, France
2
Université de Lorraine, INRAE, LERMAB, F-54400 Longwy, France
3
LEMA, Energy and Applied Mechanics Laboratory, Faculty of Sciences and Techniques, University of Comoros, Moroni B.P. 2585, Comoros
4
IREMIS Institute, CUFR, University of Mayotte, 97660 Dembeni, France
*
Authors to whom correspondence should be addressed.
Energies 2025, 18(11), 2972; https://doi.org/10.3390/en18112972
Submission received: 4 April 2025 / Revised: 16 May 2025 / Accepted: 31 May 2025 / Published: 4 June 2025
(This article belongs to the Section A2: Solar Energy and Photovoltaic Systems)

Abstract

:
An experimental setup was developed, incorporating a monitored DualSun® photovoltaic–thermal (PV/T) panel and a weather station to continuously record real-time climatic conditions. This setup enables an hour-by-hour comparison between the actual performance observed under real-world conditions and the predictions generated by the thermal model. The generated dataset was used to evaluate a thermal model derived from the literature, comparing its predictions with measured data. The model adopts a quasi-steady-state, one-dimensional approach based on heat balance equations applied to both the photovoltaic cells and the heat transfer fluid. Conducted during the summer of 2022, the experiment provides valuable insights into the accuracy of the literature-based thermal model under summer meteorological conditions. The results show a good correlation between the experimental data and the model’s predictions. The average deviation observed for the outlet fluid temperature is 0.1 °C during the day and 1.3 °C at night. Consequently, the findings underscore the model’s effectiveness for evaluating daytime performance, while also pointing out its limitations for nighttime predictions, especially when hybrid PV/T collectors are used for applications such as nighttime free cooling.

1. Introduction

Over the past years, the use of photovoltaic–thermal (PV/T) systems has seen a notable increase due to the increasing demand for electrical and thermal energy. Much research has focused on the performance of these systems [1]. PV/T systems produce both electrical and thermal energy, which can be used in various applications such as home heating and preheating. The first PV/T module design was introduced by Kern and Russell in 1978 [2]. The solar module is attached to an absorbent plate in which a fluid circulates, allowing a simultaneous production of electricity and hot water or air. The overall efficiency of such a module may be higher than that of a conventional PV module. Since the early 1990s, Garg and his collaborators have conducted extensive research into hybrid air–liquid PV/T heating systems [3,4]. They proved that there is an optimal flow rate maximizing collector efficiency. The average cell efficiency remains nearly independent of the solar cell area, simplifying energy calculations. Prakash has designed a provisional model to compare the performance of PV/T collectors operating with air or water [5]. The results show that the thermal efficiency of the air collector is lower than that of the water collector.
More recently, the maximum power produced by a photovoltaic (PV) model or a photovoltaic–thermal (PV/T) module can be evaluated by knowing the incident solar irradiance and the temperature of the module. Several mathematical models have been proposed to evaluate the thermal functioning of these collectors. O. Rejeb et al. [6] examined a dynamic model of the PV/T water collector that included energy balance equations for six key components: the transparent cover, the PV module, the plate absorber, the tube, the water-filled tube, and the insulation. They found that by increasing the number of glass layers, thermal efficiency improves, while electrical efficiency deteriorates. The results also indicate that electrical efficiency increases by increasing the compaction factor and heat conduction coefficient between the photovoltaic cell and the absorbent plate but decreases with increasing solar radiation and water inlet temperature. Nevertheless, thermal efficiency improves with increasing solar radiation and the heat conduction coefficient between the photovoltaic cell and the absorbent plate, while it degrades with increasing compaction factor and water inlet temperature. For their part, Al-Shamani et al. [7] used computational fluid dynamics to determine the temperature of a PV/T-NF (SiO2) module using a water-based nano-fluid (NF) for heat removal, and they found it more performant in terms of payback and profit gain.
Altharwanee et al. [8] evaluated the performance of a hybrid system combining a photovoltaic–thermal (PV/T) module with a flat-plate solar thermal (ST) collector connected in a series. Their test results, observed over four sunny days, showed that the hybrid system could raise the water temperature from 25 °C to over 60 °C under real conditions—about 10–15 °C higher than the ST-only setup—and that it could achieve an overall thermal efficiency above 50%, while generating electricity at around 12% efficiency. Fang et al. [9] experimentally investigated a hybrid solar energy system that connects a photovoltaic–thermal (PV/T) module in series with a flat-plate solar collector (FPSC) to enhance both thermal and electrical performance. They found that the system could achieve maximum efficiencies of 51.91% for thermal output and 13.52% for electrical generation. Optimal performance was observed with a water volume between 160 and 180 L, which also minimized reverse heat transfer in the PV/T module. These findings suggest that the PV/T–FPSC hybrid system is a cost-effective and environmentally friendly solution for solar energy applications.
In Africa, Saeed Abdul-Ganiyu et al. [10] investigated the influence of water flow rates on the performance of a commercial flat-plate photovoltaic–thermal (PV/T) system under tropical conditions in Ghana. Electrical, thermal, and exergy efficiencies were assessed across varying irradiance levels and mass flow rates. The results revealed that increasing the flow rate enhanced cooling and improves overall efficiency, up to a threshold of approximately 0.082 kg/s. In a subsequent study [11], the authors conducted a techno-economic comparison between flat-plate PV/T and conventional photovoltaic (PV) systems in the same context. Using analytical models over a 25-year horizon and incorporating exergy analysis, they demonstrated that while the PV/T system entailed higher initial investment, it offered superior performance—particularly when integrated with battery storage. Maoulida et al. [12] studied the operational performance of a PV/T system using TRNSYS. The PV/T system in the Koua region satisfied 70% of annual hot water demand and 80% of electricity demand, demonstrating a maximum efficiency of 40%. A photovoltaic–thermal (PV/T) module allows the active evacuation of heat at the back of a PV module through an air–liquid system. Yue et al. [13] presented a distributed solar system suitable for urban buildings. They showed that increasing the PV/T surface area maximized profitability, as limited by the available roof area. Also, they defended the effect that increasing the capacity of the low temperature heat pump beyond 68 kW could improve efficiency and reduce payback time.
Brottier et al., who developed the model we aim to validate under real climatic conditions in this study, also conducted a study to evaluate the thermal performance of 28 PV/T solar domestic hot water systems in Western Europe, compiling a dedicated performance database [14]. The PV production results align closely with PVGis predictions, showing only a 1% deviation. Stagnation temperatures remain within safe limits, preventing overheating and preserving PV efficiency. In Lyon, the systems met 60% of hot water demand annually and achieved full coverage during four summer months. Overall, the PV/T systems generated twice as much energy as the conventional PV setups of the same module surface.
A. Nedjar et al. [15] presented a performance study of a thermal system with this PV/T collector coupled with an adsorption cooling unit using a silica gel/water pair, designed for preserving perishable foods in Mediterranean climates. The hybrid PV/T collector simultaneously generates electricity and thermal energy to power the cooling cycle, optimizing solar energy use. Numerical simulations were performed to assess the system performance, focusing on cold production efficiency and temperature control. Results show the system’s suitability for regions with high solar irradiance, offering an effective alternative to conventional refrigeration. Overall, the study highlights a promising solar-powered solution for food preservation in sun-rich areas. V. Delachaux et al. [16] performed CFD modeling for the design of a these types of PV/T collectors in order to optimize them for heat pump systems. Using ANSYS Fluent 20.1, the authors developed a Computational Fluid Dynamics (CFD) model to analyze the thermal behavior of PV/T panels under non-irradiated conditions, achieving predictions within 15% of experimental data.
Few experimental studies have precisely monitored the performance of hybrid solar collectors in operation. One such study analyzed the energetic and exergetic performance of a PV/T solar system under Tunisian climatic conditions [17]. This research assessed the potential of PV/T collectors in North Africa, revealing maximum thermal and electrical efficiencies of 50% and 15%, respectively. Similarly, the highest thermal and electrical exergy efficiencies were recorded at 50% and 14.8%. The findings also showed expected annual gains of 14.60% in thermal performance and 5.33% in electrical output. Additionally, the PV/T system was comparable to a high-quality commercial solar collector and a conventional PV panel, demonstrating its strong performance in real-world conditions.
The primary objective of this article is to provide a reliable and accurate experimental dataset that can support the validation of future thermal modeling approaches, particularly those based on innovative concepts. As a first application of this dataset, the study conducts a comparative analysis using the thermal model proposed by Brottier et al. [18], evaluating its predictive performance against experimental data collected under real climatic conditions specifically for the DualSun® hybrid PV/T collector. Unlike most collectors commonly investigated in the literature—which typically feature aligned or serpentine tube configurations—this collector utilizes a distinct design, where the heat transfer fluid flows in a laminar regime between two flat metal plates. These insights will be beneficial for designers in optimizing this type of collector, which remains relatively unexplored in the literature. By combining experimental data with numerical modeling, the research provides a robust framework for understanding and improving the thermal response of this innovative PV/T system, ultimately enhancing its efficiency and integration into real-world applications.

2. Modeling and Experimental Methods

2.1. Experimental Hybrid PV/T with Monitoring System

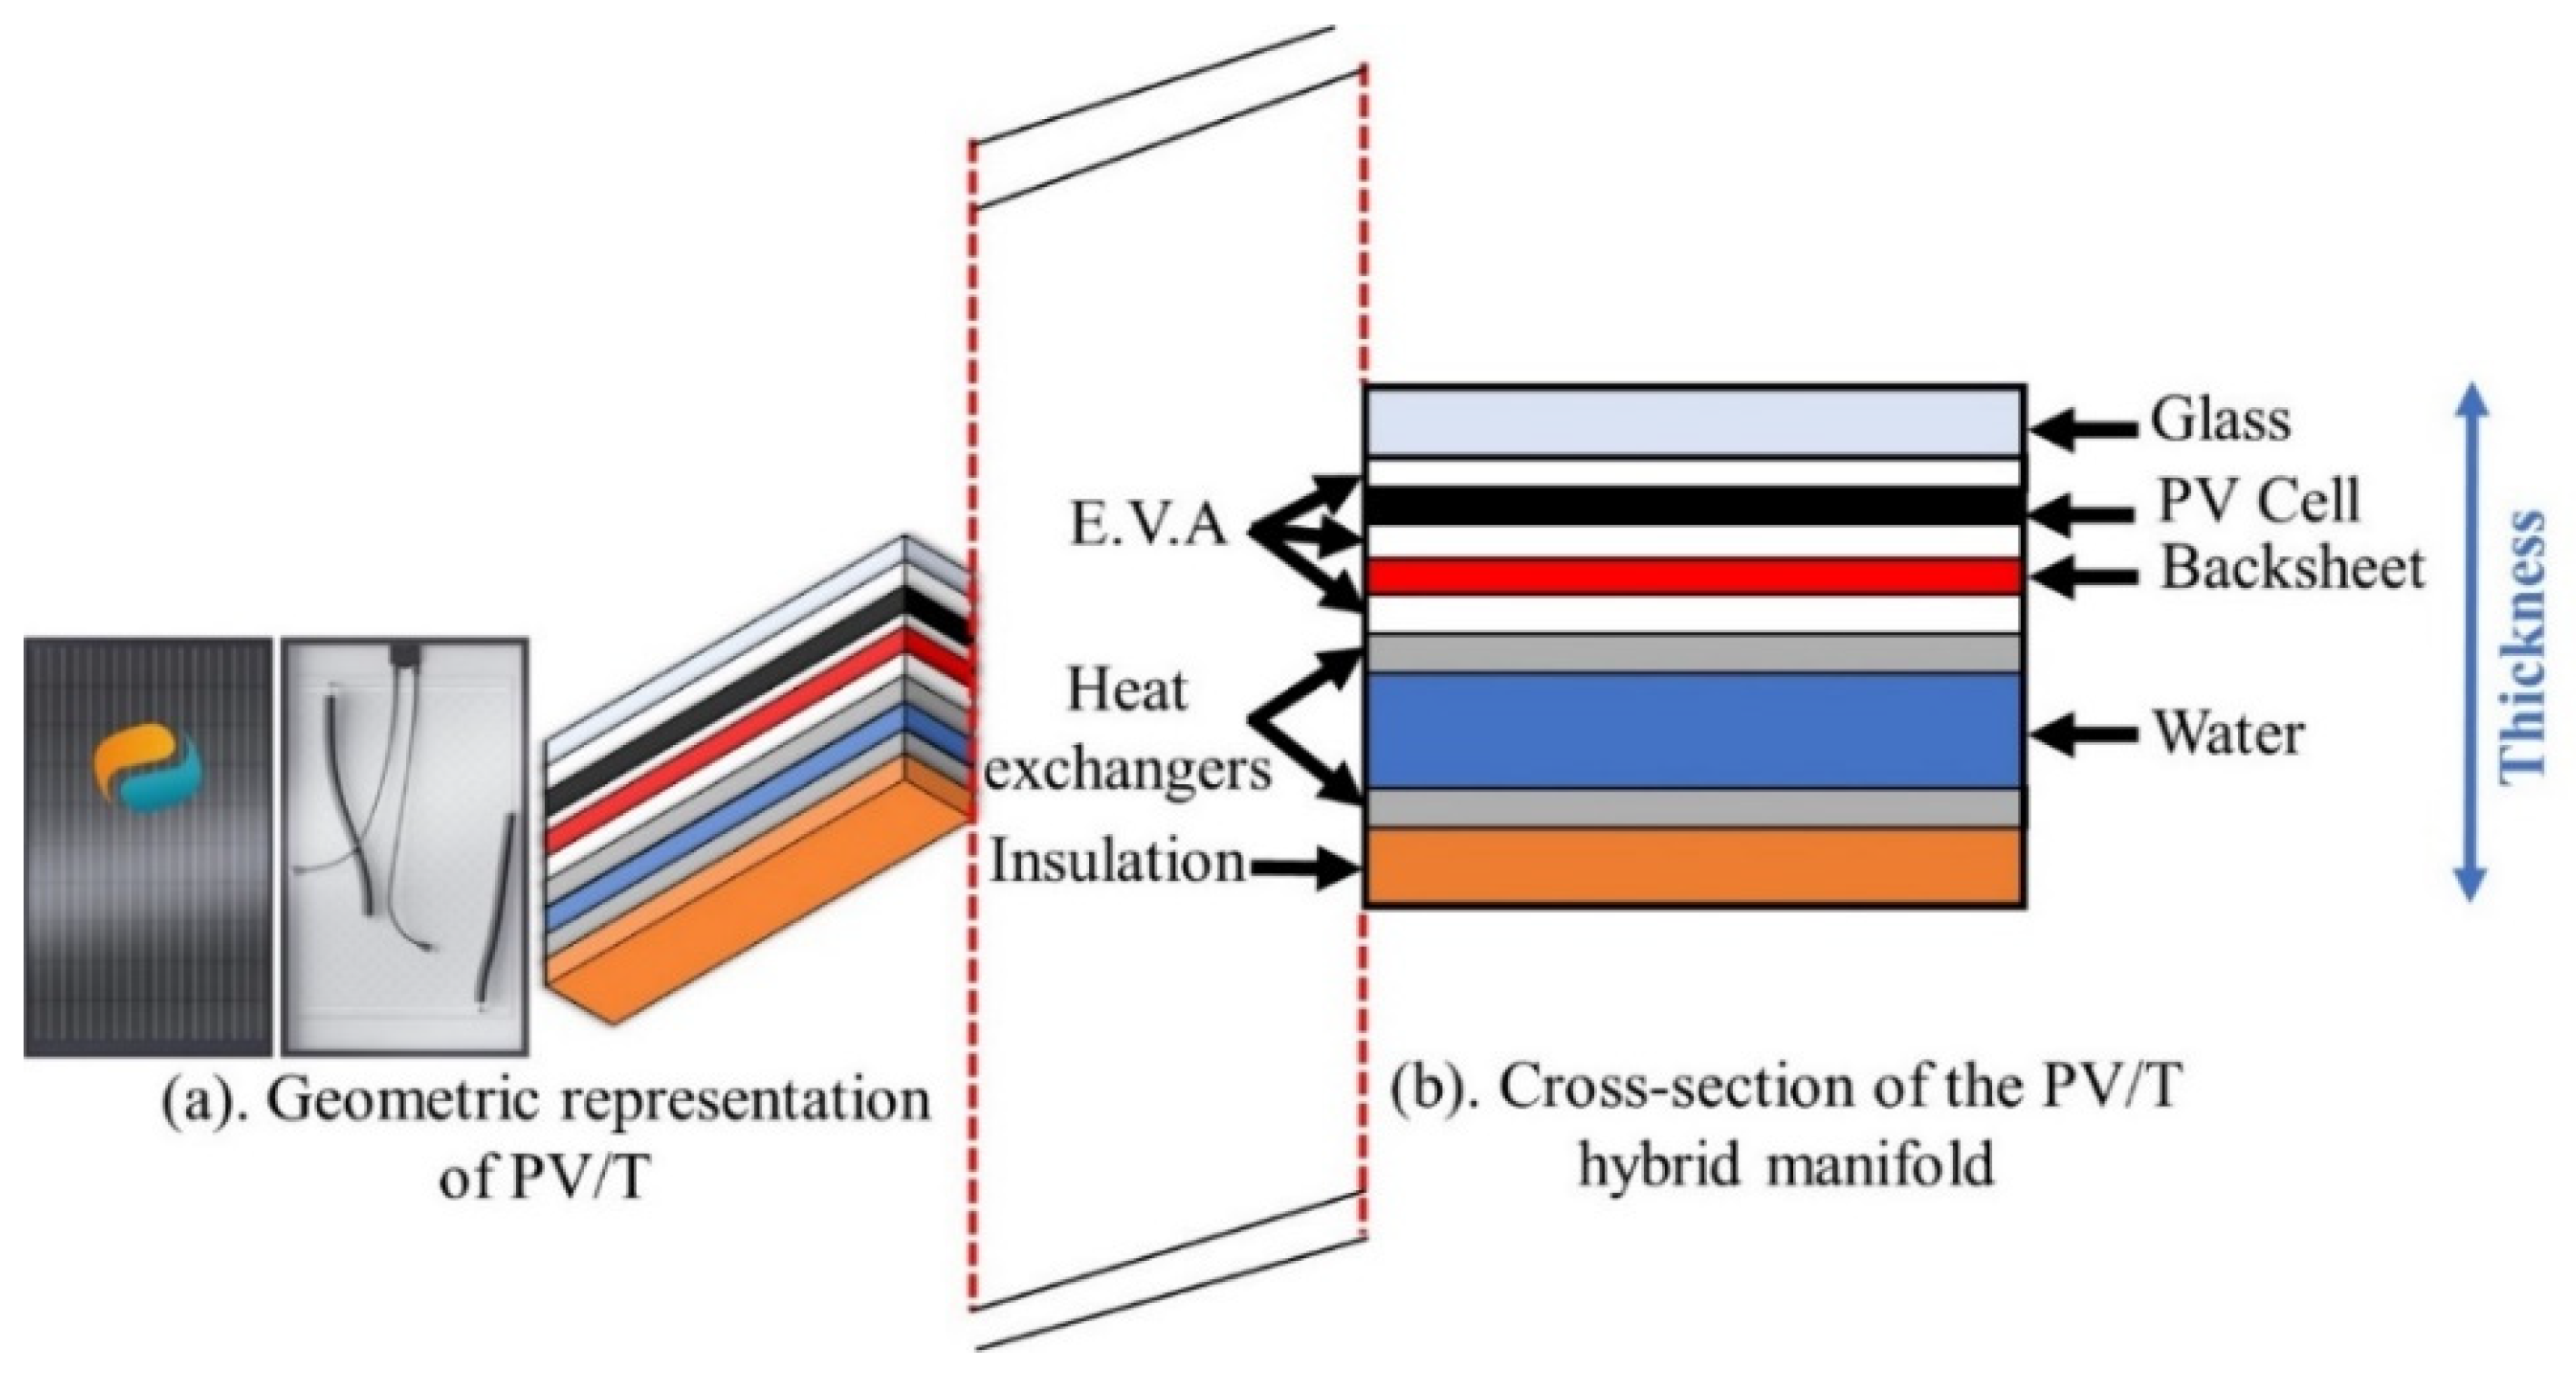
2.1.1. Technological Description of the Used PV/T Collector

The experimental setup was mounted at the IUT of Longwy using a DualSun® PV/T collector. Table 1 provides detailed information about this collector which is L = 1.64 m long and W = 0.97 m wide. The given table lists the arrangement of the different material layers. These components include monocrystalline silicon cells, an E.V.A. (Ethylene Vinyl Acetate) film, and stainless steel (Figure 1). This collector does not have aligned or serpentine tubes; instead, the heat transfer fluid flows in a laminar regime between two metal plates separated by a 5 mm gap. Additionally, it incorporates a 30 mm thick insulation layer with low thermal conductivity (0.04 W/(m·K)) to enhance system efficiency [18]. This combination of materials is designed to optimize the model’s performance and durability (corrosion resistance) while ensuring effective thermal management, which is essential for the stability and efficiency of the solar cells.
The composition characteristics noted above can be translated into a thermal/electrical analogy where heat fluxes pass through equivalent resistances, which can be expressed as follows [16]:
R S u p = e g l a s s λ g l a s s + e E V A λ E V A
R I n f = e S S λ S S + e I N S λ I N S
R I n t e r = e C E L L λ C E L L + e E V A λ E V A + e B A C K S H E E T λ B A C K S H E E T + e E V A λ E V A + e S S λ S S
R P = R I n t e r + 1 h F l u i d ,   R T = R S u p + 1 h T o p ,   R B = R I n f + 1 h F l u i d + 1 h B a c k

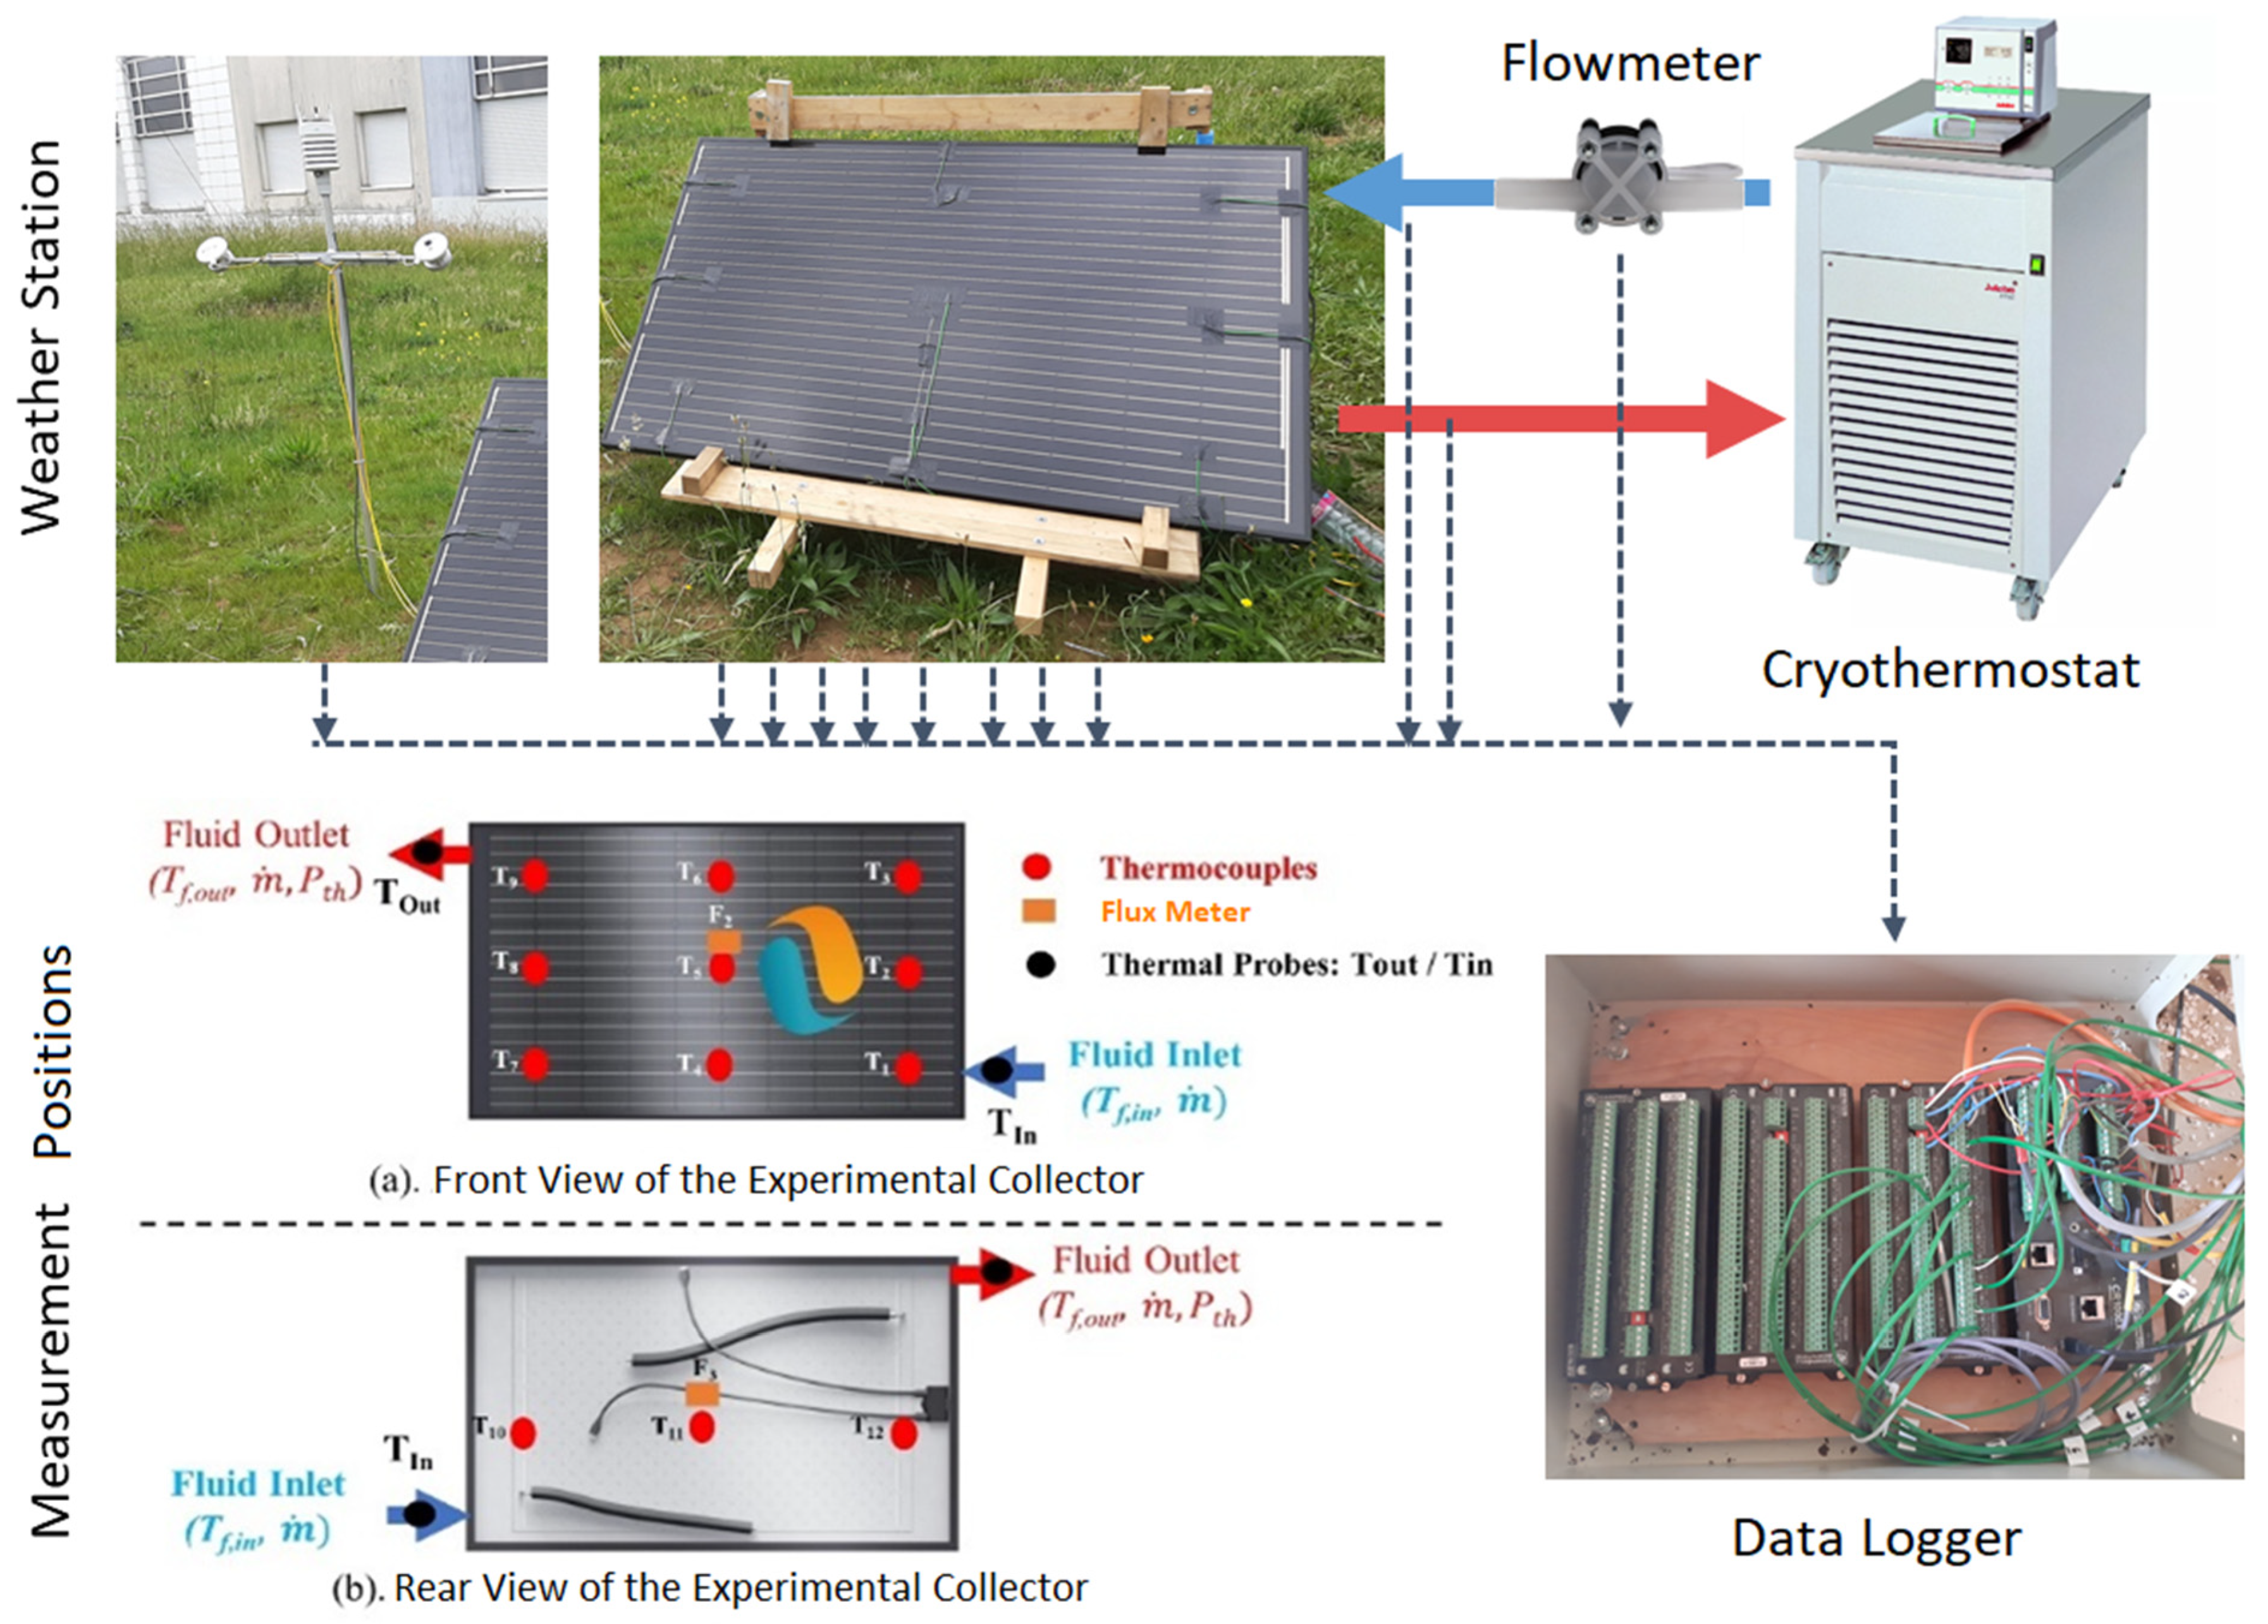
2.1.2. Experimental Setup and Monitoring System

The experimental study was conducted at the IUT of Longwy, located in northern Lorraine (49°31′38.0932″ N, 5°45′6.741″ E). Due to its geographical position in northeastern France, Longwy’s climate is classified as continental temperate. Summers are generally mild to warm, with daytime average temperatures ranging from 20 °C to 25 °C. Heatwaves can occasionally raise temperatures above 30 °C, while nights remain cool. Winters are cold, with daytime temperatures averaging between 0 °C and 5 °C, sometimes dropping below freezing with occasional snowfall.
The purpose of the monitoring system is to evaluate the thermal behavior of the DualSun® PV/T panel under real weather conditions. This evaluation enables the establishment of an instantaneous thermal balance, performance assessment, and validation of the mathematical thermal model. It is important to note that only thermal measurements were performed during this campaign, as the PV/T panel was not electrically connected. Therefore, no electrical power was generated during the testing period. For future thermo-electrical simulations, the manufacturer’s electrical efficiency information and its variations with temperature and solar radiation will be utilized.
During the experiment, the PV/T panel was oriented south and tilted at an angle of 50° to optimize its performance. A Julabo F25-MC circulating cryothermostat was employed to circulate 30% glycol water through the panel. Besides fluid circulation, the cryothermostat’s role was to dissipate the heat energy collected by the panel in order to maintain a fixed temperature at the collector’s inlet.
The experimental setup includes a weather station that records all climatic data affecting the PV/T panel, including temperature (°C), relative humidity (%), wind speed (m/s) and wind direction (°), precipitation (mm), atmospheric pressure (Pa), and total solar irradiance received by the collector (W/m2). The sky temperature is also measured using a pyrgeometer. Both the pyrgeometer and the pyranometer, which measure infrared sky radiation and solar irradiance, respectively, are mounted with the same orientation as the PV/T solar collector to directly measure the radiative balance per square meter of the inclined solar collector. The weather station is positioned near the monitored panel to avoid microclimatic disturbances that could introduce discrepancies in temperature, radiation, or ventilation measurements.
Figure 2 illustrates the operational setup of the experimental system. It highlights the circulation of the heat transfer fluid through the DualSun® PV/T collector, maintained by a Julabo F25-MC cryothermostat. This device tries to maintain a stable inlet temperature, although its limited cooling capacity prevents full compensation for temperature increases during the day.
Figure 2 shows the arrangement of temperature and heat flux sensors on the monitored DualSun® panel. Nine thermocouples (T1 to T9) are evenly distributed across a grid on the upper surface of the panel. At the center, a heat flux sensor (F2) is affixed to the upper surface and covered with black adhesive tape to minimize variations in solar radiation absorption. On the back side of the panel, three additional thermocouples (T10 to T12) are aligned along the central axis. A second heat flux sensor complements the surface monitoring.
At the panel’s inlet and outlet, two PT100 thermal probes, labeled Tin and Tout, are installed within 3 mm copper sleeves. This configuration ensures accurate and rapid measurement of the fluid’s temperature evolution as it enters and exits the solar panel.
The thermocouples used in this study are type K (chromel–alumel) with an accuracy of about 0.3 °C. The weather station includes a pyranometer (Kipp & Zonen CMP3, Delft, The Netherlands, spectrum waveband 310–2800 nm, field of view 180°) and a pyrgeometer (Kipp & Zonen CGR3, spectrum waveband 4500–42,000 nm, field of view 150 °C). The used heat flux sensors consist of plates with a thickness of 0.45 mm and a copper surface of 5 × 5 cm2. They are covered and bonded to the collector with a black adhesive tape to give them fairly the same solar reflectance as the solar collector. The Vaisala WXT520 weather station provides high-accuracy measurements for key meteorological parameters. Wind speed is measured with an accuracy of ±0.3 m/s or ±3% (whichever is greater) for speeds up to 35 m/s, and ±5% for speeds between 36 and 60 m/s, with a resolution of 0.1 m/s. Wind direction is measured with an accuracy of ±3° and a resolution of 1°. Air temperature is measured with an accuracy of ±0.3 °C at 20 °C and a resolution of 0.1 °C, within a measurement range of −52 to +60 °C. The flowmeter has a measurement accuracy of ±2.5%. These specifications ensure reliable environmental data under varying weather conditions. All the sensors were connected to a data logger (CR1000X by Campbell Scientific, Garbutt, QLD, Australia), which records all the measurements in less than half a second at 10-min time intervals.

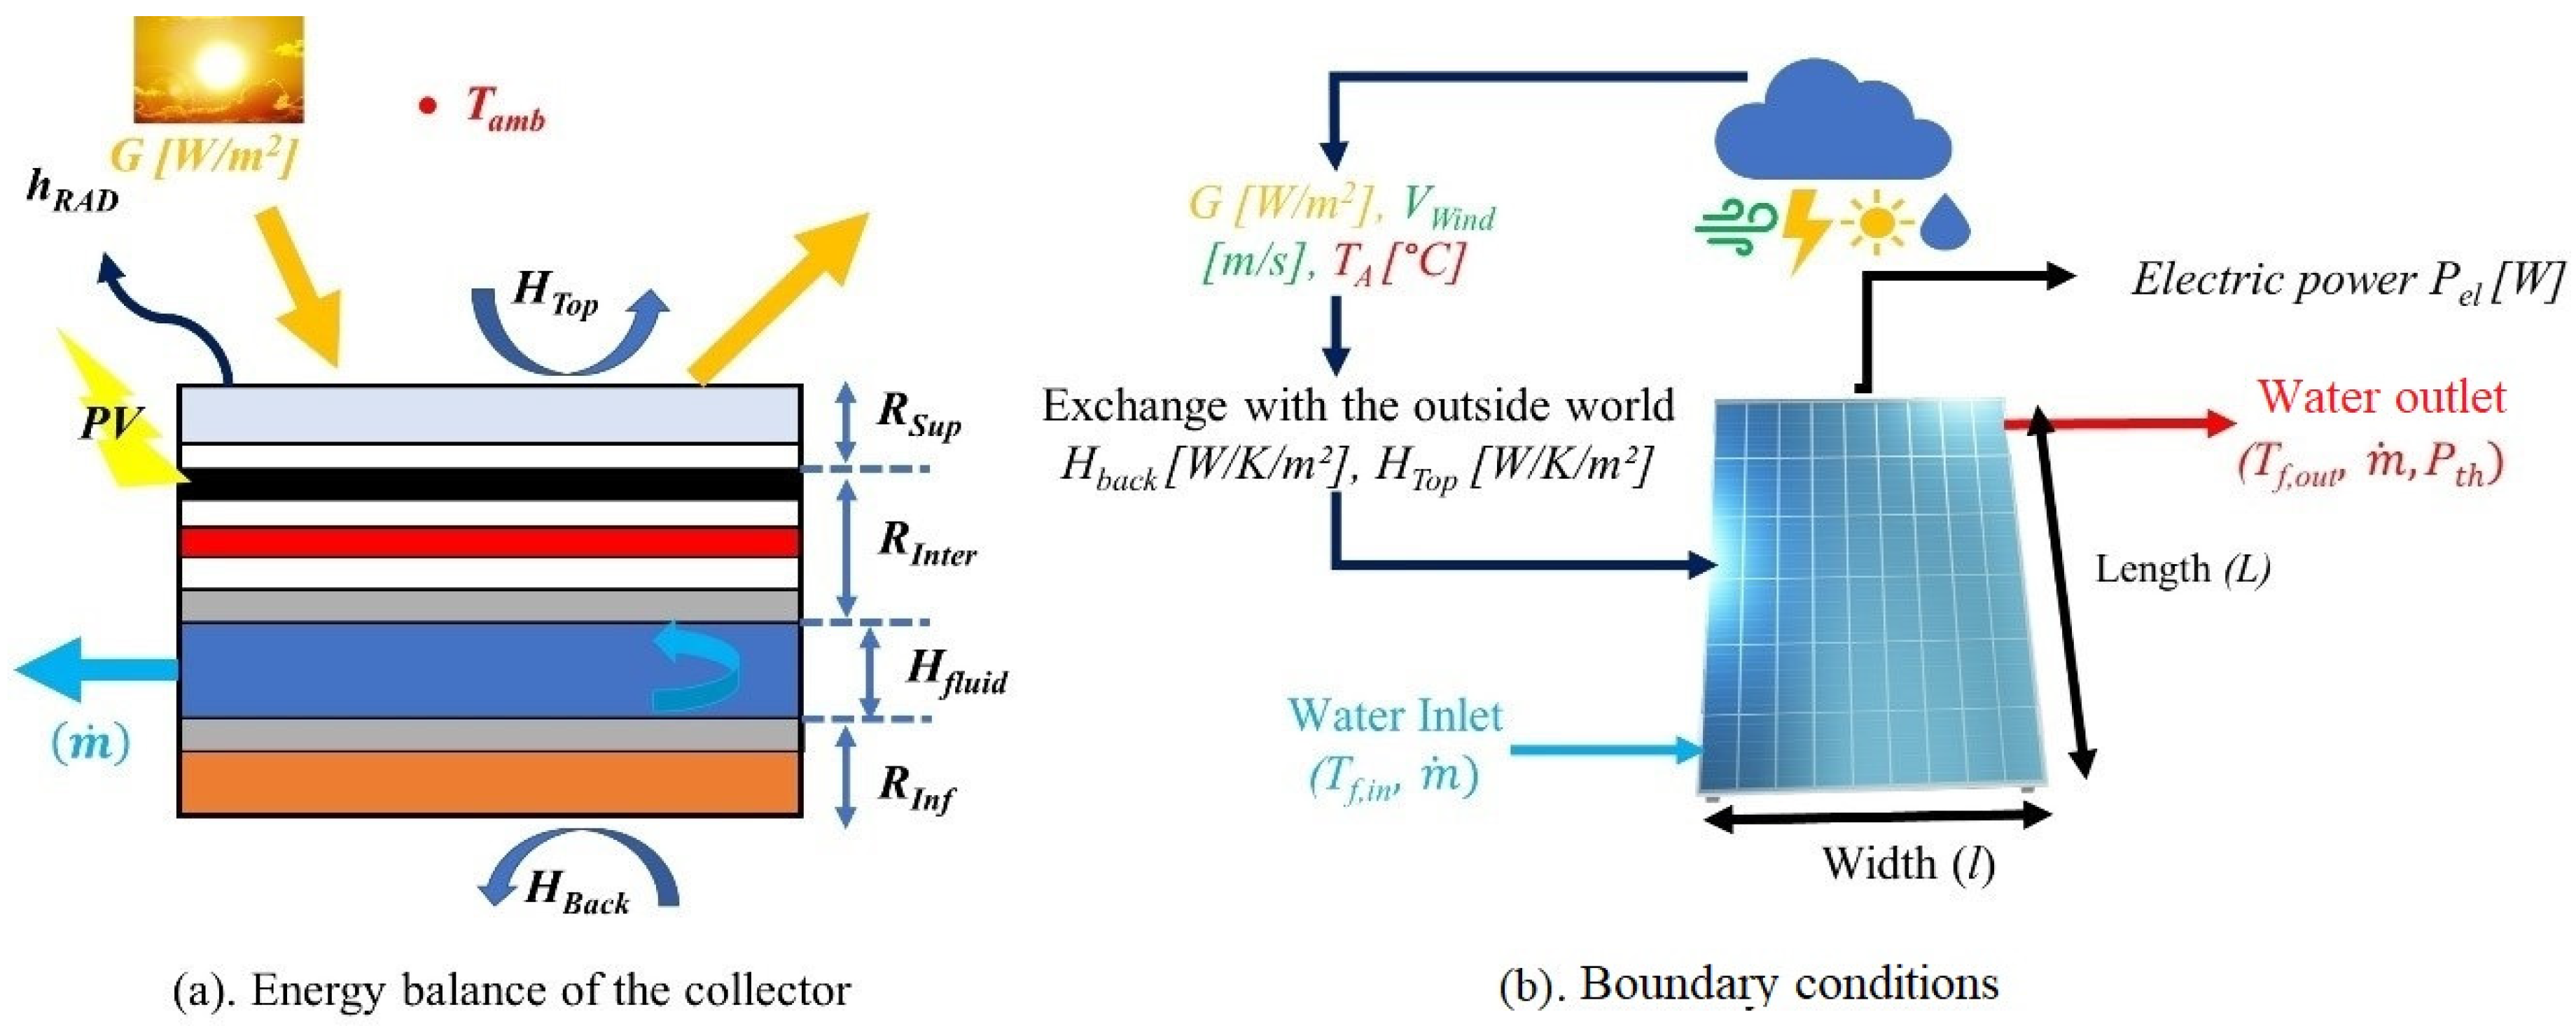
2.2. Literature-Based Mathematical Modeling of the Hybrid PV/T Collector

The literature-based modeling approach employs a quasi-steady-state method, relying on a quasi-one-dimensional (quasi-1D) technique developed by Brottier et al. (2019) [16]. In addition to the dimensions and physical properties of the materials composing the collector, this thermal model uses various meteorological variables as input data, such as ambient temperature (TA), solar irradiance (G), wind speed (VWIND), and sky temperature (Tsky), as well as the mass flow rate () and the fluid inlet temperature (TF,IN). It is based on several assumptions: (i) The sky is considered a black body, and its equivalent temperature is calculated; (ii) the ground temperature is assumed to be equal to the ambient temperature; and (iii) the wind is considered to blow parallel to the system’s surfaces (Figure 3).

2.2.1. Thermal Balance of Photovoltaic Cells

The absorbed solar energy not converted into electricity causes an increase in the PV cell temperature and dissipates through conduction across the upper (glass) and lower layers. Part of this heat is lost through convection and long-wave radiation from the upper surface of the collector (losses), while another part is conducted to the heat exchange surfaces with the circulating fluid (recovery). The bottom side of the collector is insulated to minimize heat losses from the lower face.
With these modeling approach and assumptions, the thermal balance equation for photovoltaic cells can be expressed as follows:
τ α · G · 1 η P V G , T P V = h R a d · T P V T S k y + T P V T A m b R T + T P V T F l u i d R P
where
(τα) is the transmission/absorption coefficient, G (W/m2) represents the solar irradiance, TPV is the temperature of the photovoltaic cells, TAmb denotes the ambient air temperature, Tfluid corresponds to the local temperature of the heat transfer fluid flowing through the exchanger, Tsky is the fictive sky temperature, and hrad represents the equivalent thermal radiation transfer coefficient.
In this equation, the calculation of long-wave thermal flux follows the Stefan–Boltzmann law:
ε . σ . T P V 4 T S k y 4 = h R a d . T P V T S k y
h R a d = ε . σ . T P V 2 + T S k y 2 . T P V + T S k y
The calculation of photovoltaic efficiency depends on both cell temperature and solar irradiance. It is modeled by introducing corrective coefficients (XT and XG), along with a correction parameter XCORR, relative to the nominal efficiency under standard conditions:
η e l = η P V = η r e f . 1 + X T . T P V T r e f . 1 + X G . G T G r e f . X C O R R
By assuming a uniform TPV along the collector, (Equation (5)) can be rewritten in terms of the average heat transfer fluid temperature:
T P V = A . T F ,   M e a n + B
With:
A = 1 h R a d + 1 R T . R P + 1
B = τ α . G . 1 η P V + h R a d . T S k y + T A R T h R a d + 1 R T + 1 R P
It is important to note that both hRad and ηPV depend on the PV cell temperature TPV, which also affects the parameters A and B.

2.2.2. Thermal Balance of the Heat Transfer Fluid

The thermal balance of the heat transfer fluid allows us to express the mean fluid temperature TF,Mean. This balance accounts for the heat fluxes exchanged by convection at the metal plates through which the fluid flows, thus calculating the thermodynamic evolution of the fluid from the inlet to the outlet of the hybrid collector [18]:
T P V T F l u i d R P = T F l u i d T B a c k R B + m ˙ . C p l . d T F l u i d d x
Combining Equations (9) and (12) gives the following differential equations:
d T F l u i d d x + D . T F l u i d x C . D = 0
The integration of this differential equation by variable separation along the collector leads to the following formula for the mean fluid temperature TF,Moyen:
T F ,   M e a n = T I n C L . D . 1 e D . L + C
Where:
C = B R P + T B a c k R B 1 A R P + 1 R B             a n d                       D = 1 A R P + 1 R B m ˙ . C p . l
The equations established by this modeling are implicit, as several parameters depend on the PV cell temperature TPV, which itself is an unknown in the model. Iterative calculations require a convergence criterion. In our numerical resolution, this criterion is based on the difference between two successive iterations of the PV cell temperature, TPVn and TPVn+1:
T P V n + 1 T P V n < 10 3 K

3. Comparative Analysis: Results and Discussion

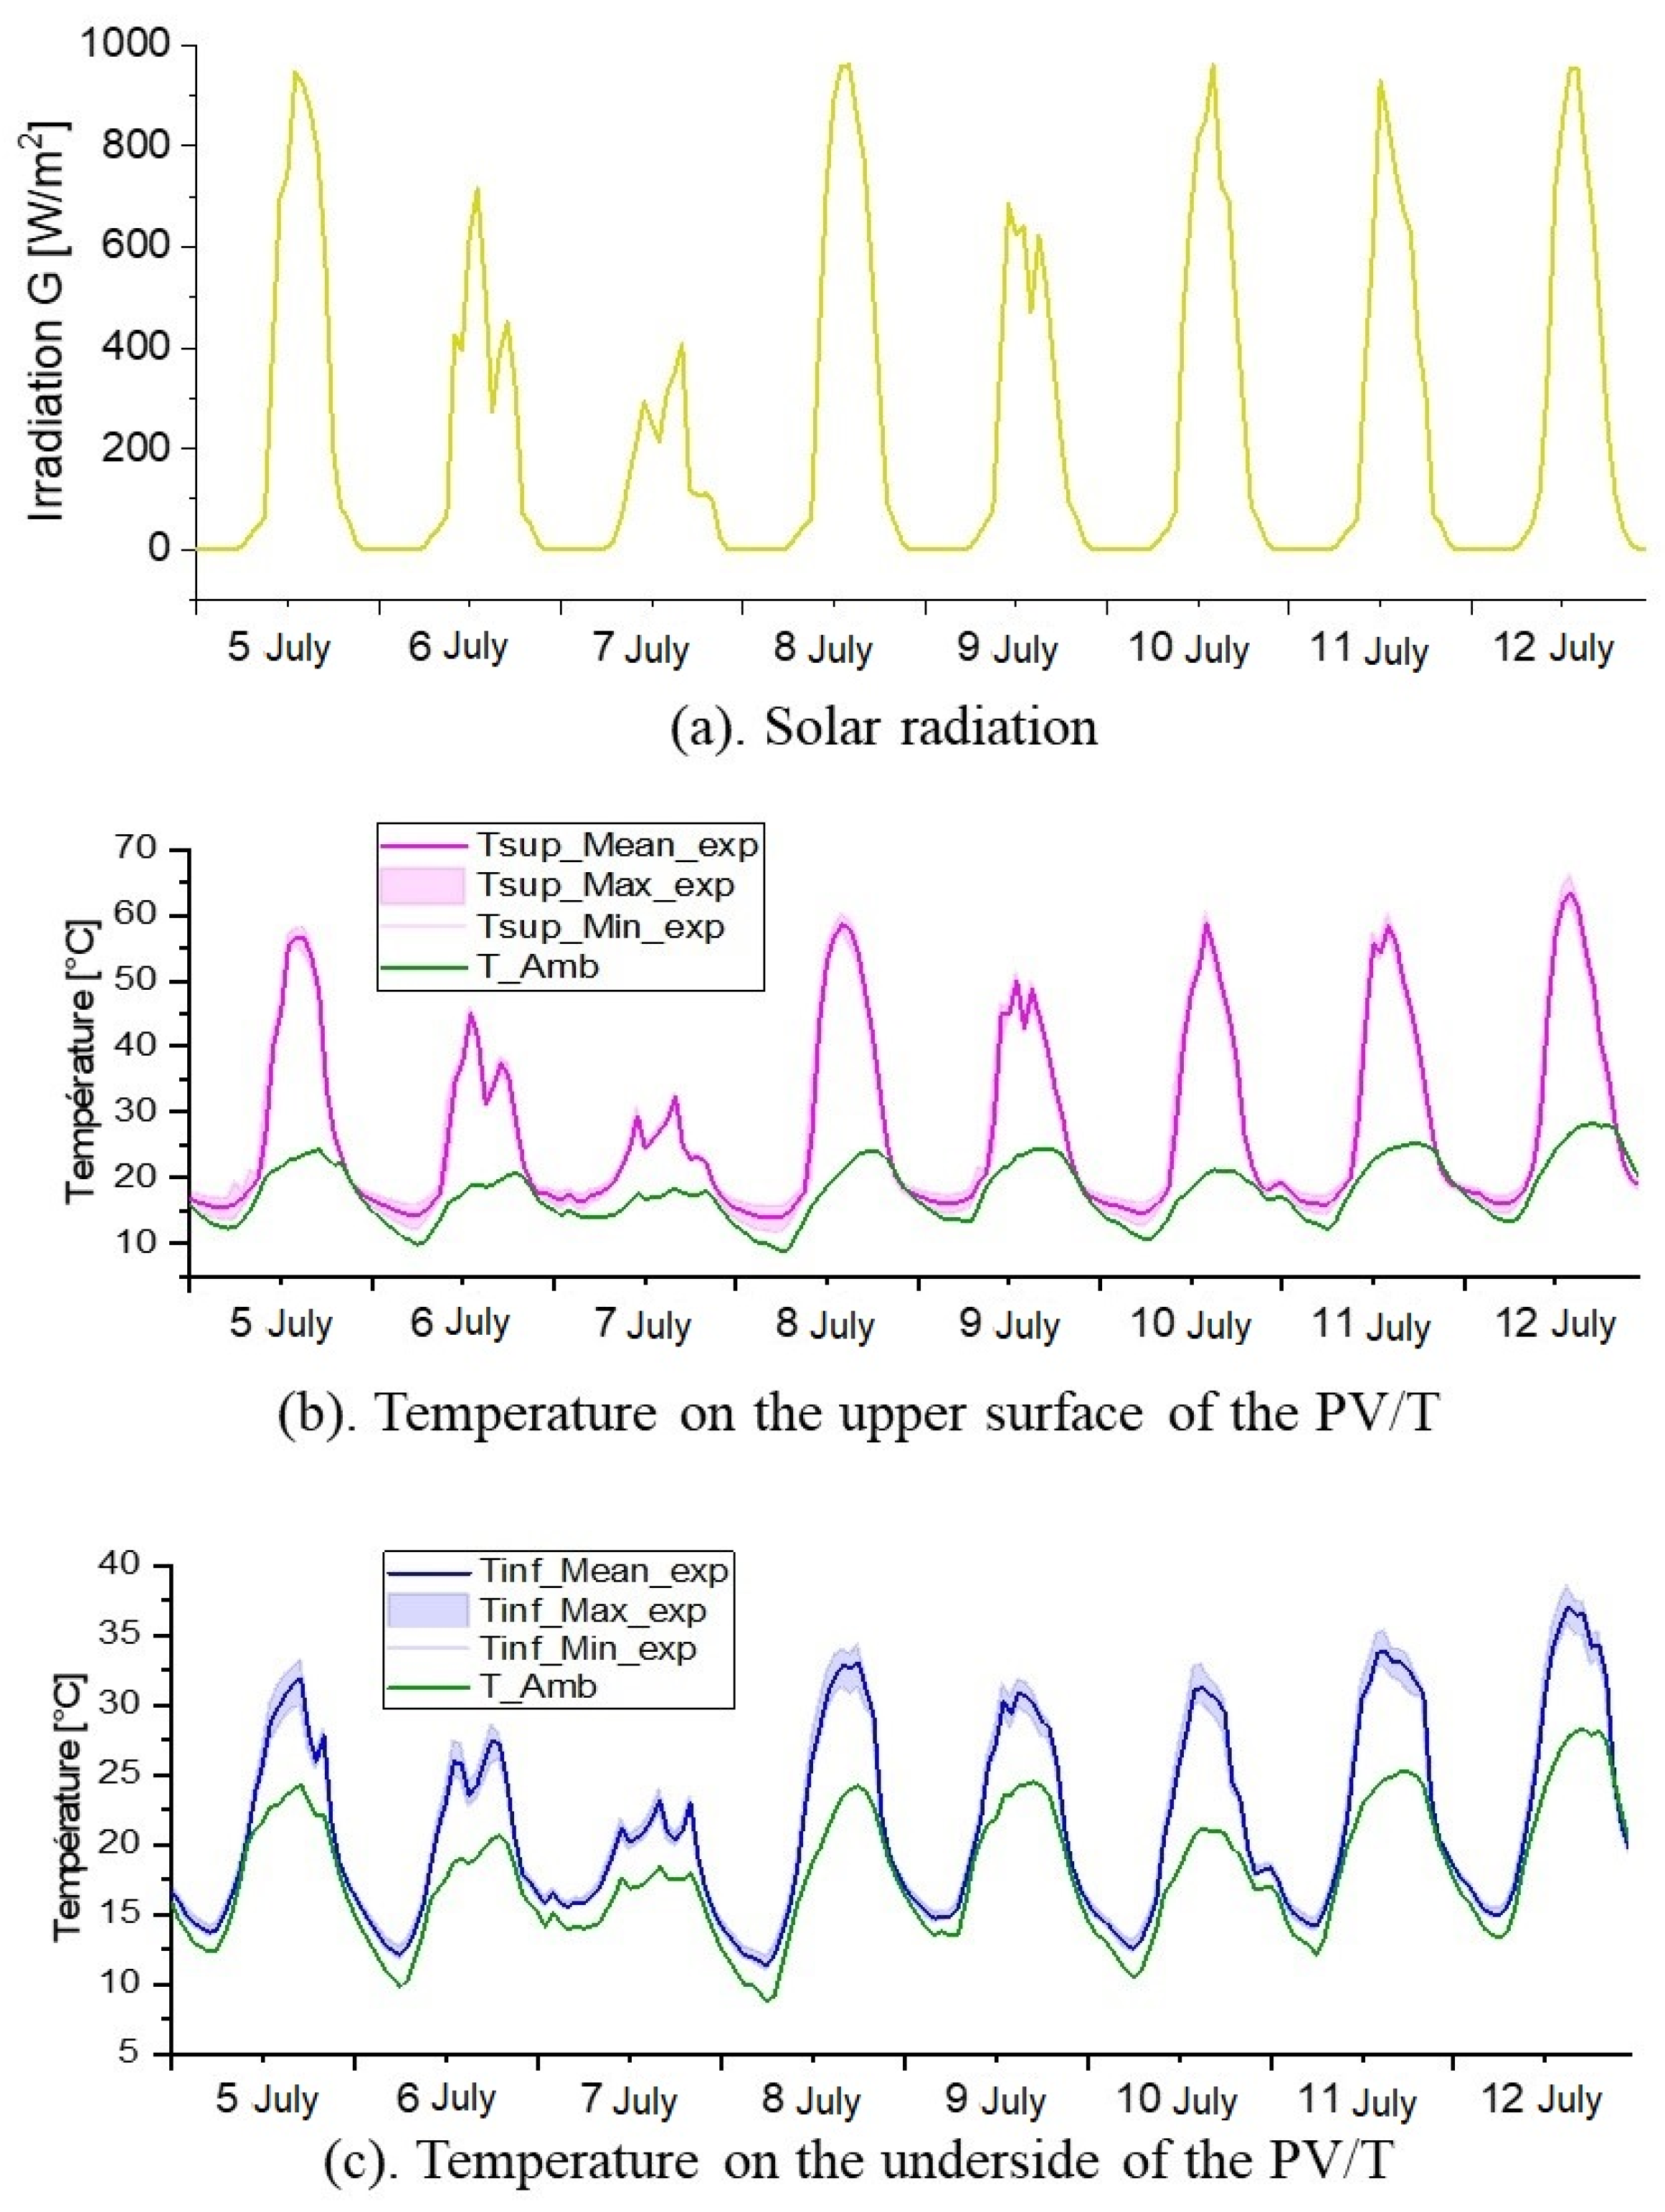
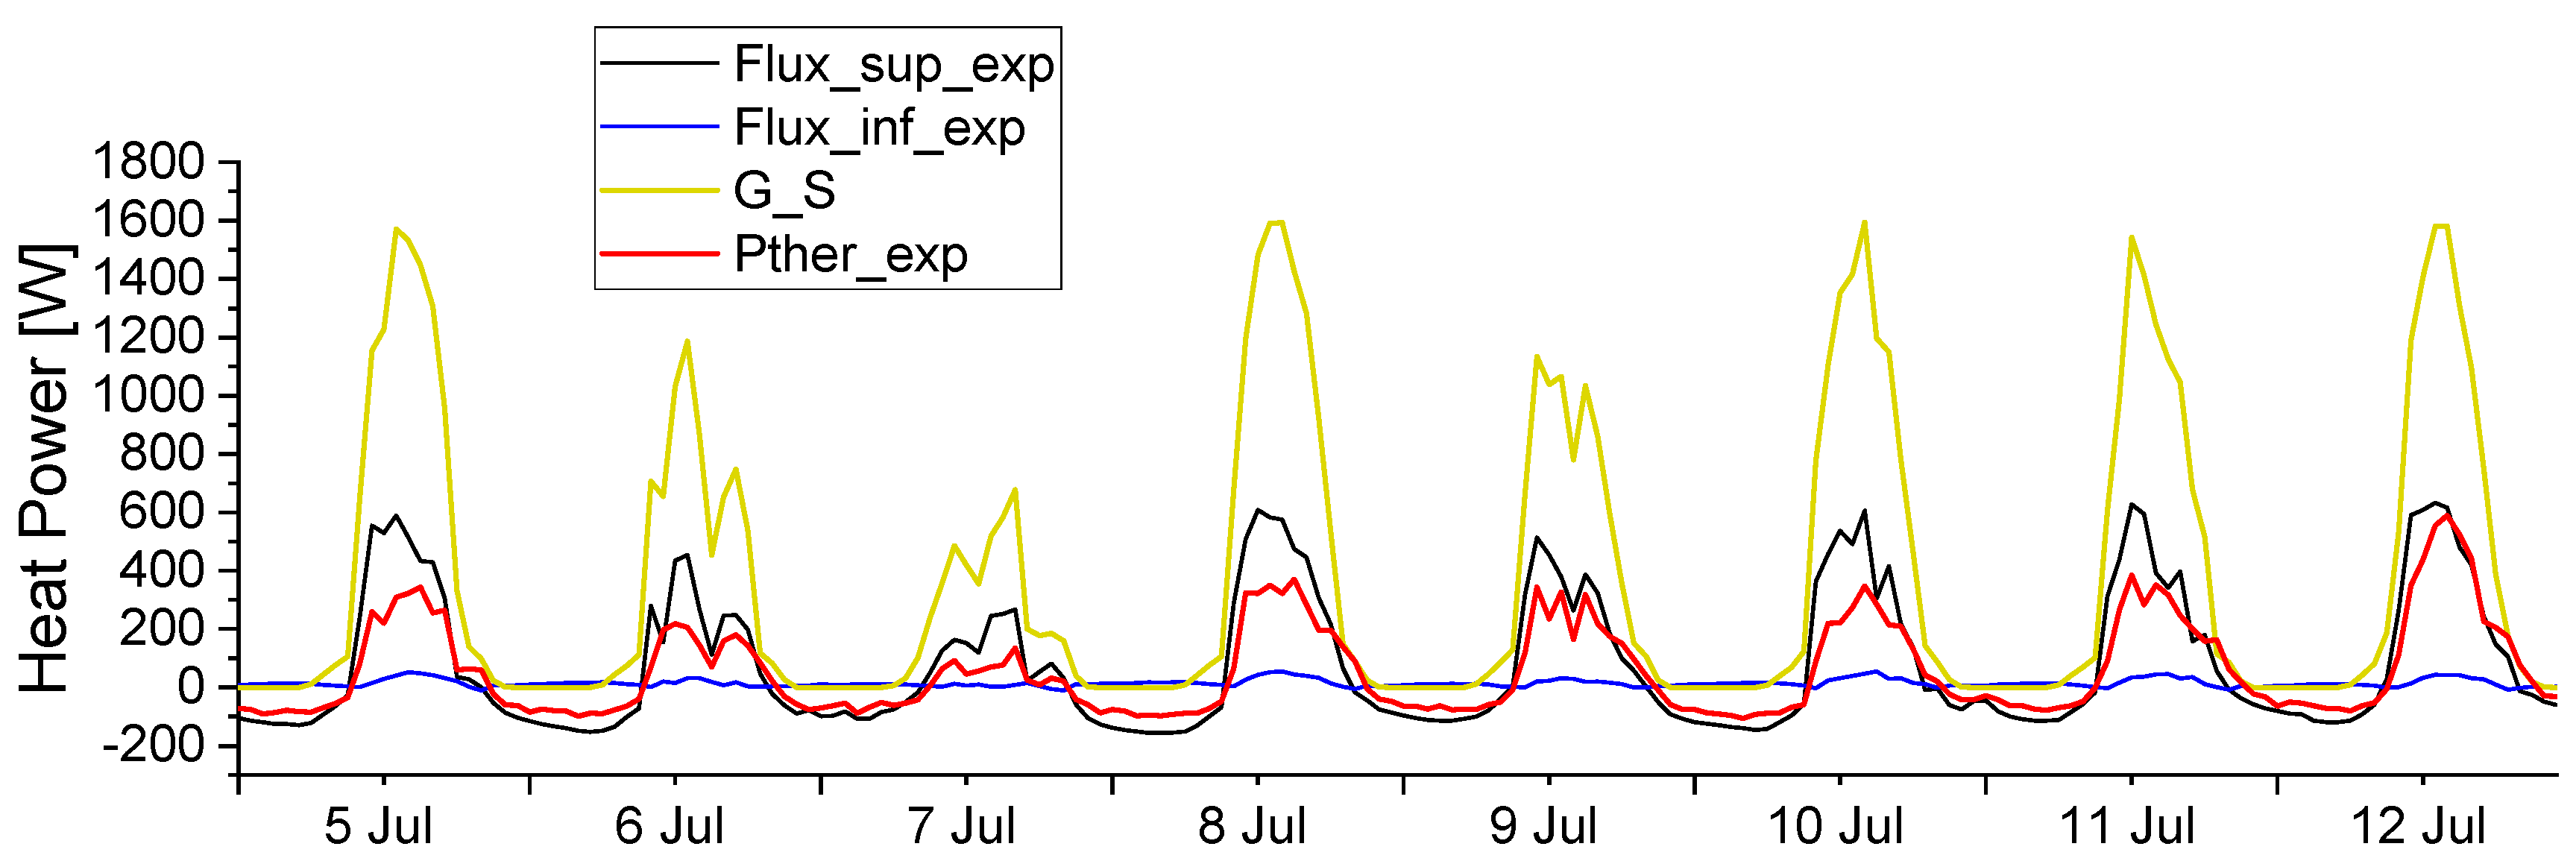
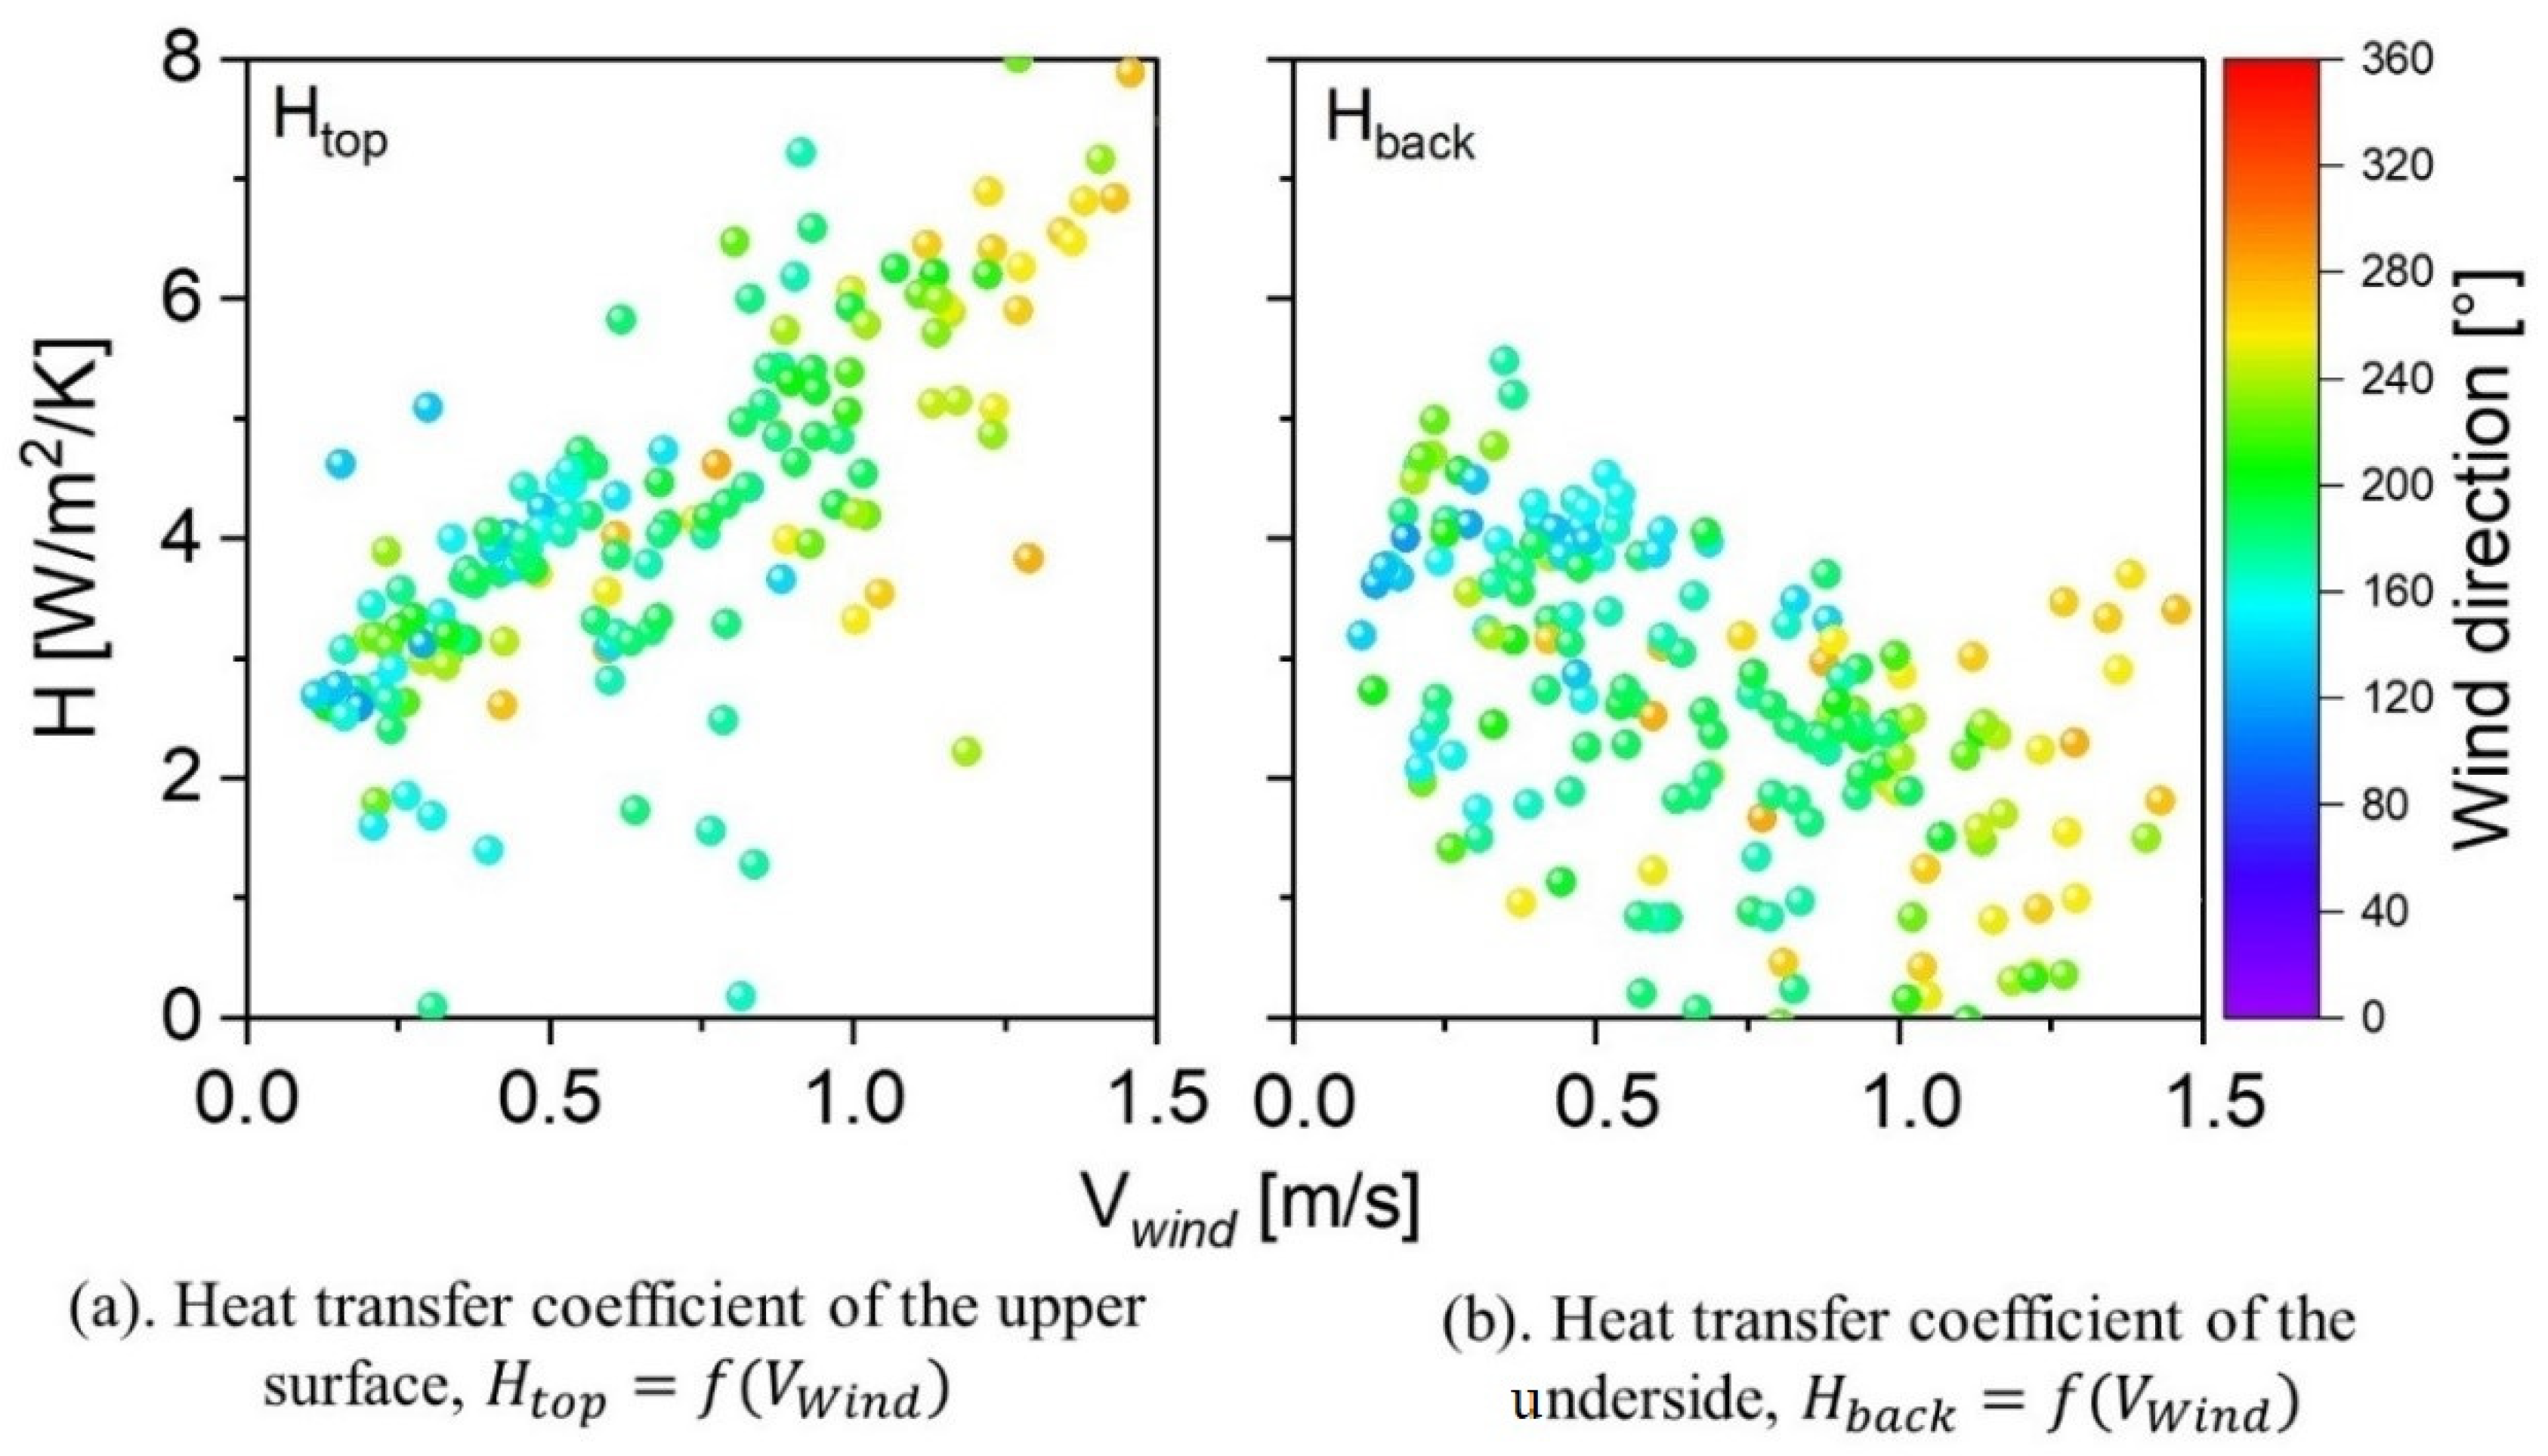
3.1. Analysis of Thermal Measurements

The experimentation was conducted during the summer of 2022. Figure 4 presents the meteorological data collected between 5 July and 12 July 2022 by the weather station installed in close proximity to the experimental setup. The analysis of the meteorological data reveals that the solar irradiance, measured according to the panel’s orientation and tilt, reached a peak of 961 W/m2 with an average value of 226.4 W/m2. This indicates significant solar irradiation during daytime hours. The ambient temperature exhibited a wide range of variation, fluctuating between 8.7 °C and 28.3 °C, with an average of 17.8 °C. The sky’s equivalent temperature varied between −0.7 °C and 18.8 °C, with an average of 9.6 °C. Since the sky temperature remained lower than the ambient air temperature, it contributed to the thermal balance through long-wave radiative exchanges.
Regarding wind direction, a predominance of westhward winds (270°) was observed, which contrasts sharply with regional data. This anomaly can be attributed to the local microclimate, characterized by the presence of surrounding buildings and trees. Thus, the test week we selected corresponds to a period with some meteorological variability, which allows for a better assessment of the model’s ability to reflect variable and dynamic environmental conditions.
Temperature variations for the same week are illustrated in Figure 5. This figure highlights the fluctuations in solar irradiance and ambient temperature, along with the range of temperature variations measured on the upper and lower surfaces of the PV/T panel. The average curves are plotted and enveloped by the interval of maximum instantaneous differences recorded by all thermocouples placed on a given surface.
Overall, the temperature variation on the surface and underside of the panel closely followed the evolution of solar radiation, exhibiting a sawtooth pattern with a very slight delay. This delay suggests that the panel has low thermal inertia. The ambient temperature also tracked the solar radiation, albeit with a delay. Additionally, the ambient temperature amplified the temperature variations of both the surface and underside, as it reduced the temperature difference between the ambient air and the panel. This, in turn, decreased thermal losses through convection. On the upper surface, the maximum average temperature exhibited significant variations. It ranged between 17 °C and 57 °C on July 5 and then gradually decreased to approximately 45 °C on July 6 and 7. On July 8, the temperature rose again to around 59 °C, followed by a decrease to 50 °C on July 9. Subsequently, the temperature increased once more, stabilizing at 59 °C on July 10 and 11 and finally reaching approximately 63.5 °C on July 12. The upper surface temperature of the collector thus exhibited fluctuations between 5 °C and 20 °C during this period, with maximum differences of less than 5 °C among the nine thermocouples. These peak differences occurred during the times of day when solar irradiance was at its highest.
On the underside surface, the maximum average temperature varied from 17 °C to 32 °C on July 5 and then gradually decreased to around 22 °C on July 6 and 7. On July 8, it rose to approximately 33 °C, followed by a decrease to 31 °C on July 9. Subsequently, the temperature increased again, stabilizing at 32 °C on July 10 and 11 and finally reaching around 37 °C on July 12. The temperature variations on the collector’s lower surface thus ranged from 2 °C to 10 °C during this period. These temperature fluctuations closely mirrored the variations in solar radiation throughout the week of July 5 to 12.
As a result, the temperature difference between the lower surface and the ambient air reached approximately 10 °C, despite the presence of thermal insulation on this lower side. This temperature gradient lead to heat losses, consequently reducing the thermal efficiency of the solar collector.
The thermal power balance can be evaluated through measurements of both direct and indirect heat fluxes passing through the solar collector. The direct measurements are provided by flux sensors attached to the upper and lower surfaces. The indirect measurement concerns the thermal power carried by the fluid, calculated based on the mass flow rate of the fluid and its temperatures at the inlet and outlet of the collector. Figure 6 illustrates the variations of these directly and indirectly measured power outputs, comparing them with solar irradiance as the primary energy source. For instance, on July 5, the initial values were 590 W for the upper surface flux, 49 W for the lower surface flux, and 344 W for the thermal power transported by the fluid, corresponding to approximately 1570 W of solar radiation captured by the 1.5 m2 panel. This resulted in an initial thermal efficiency estimate of 21% and lower surface losses limited to around 3%.
At first glance, this efficiency might seem low, but it can be attributed to the relatively high inlet temperature in the collector due to the limited cooling capacity of the cryothermostat—which led to an increase in panel temperature, reaching nearly 60 °C (as will be shown later), thereby causing significant convective and radiative losses on the upper surface, estimated at 38%. Under real operating conditions, with the presence of a buffer tank, the temperature of a solar collector would remain significantly lower, naturally reducing heat losses on both surfaces and improving the overall thermal efficiency. It is important to emphasize that the primary objective here is to generate a dataset enabling the experimental validation of the previously mentioned thermal model.

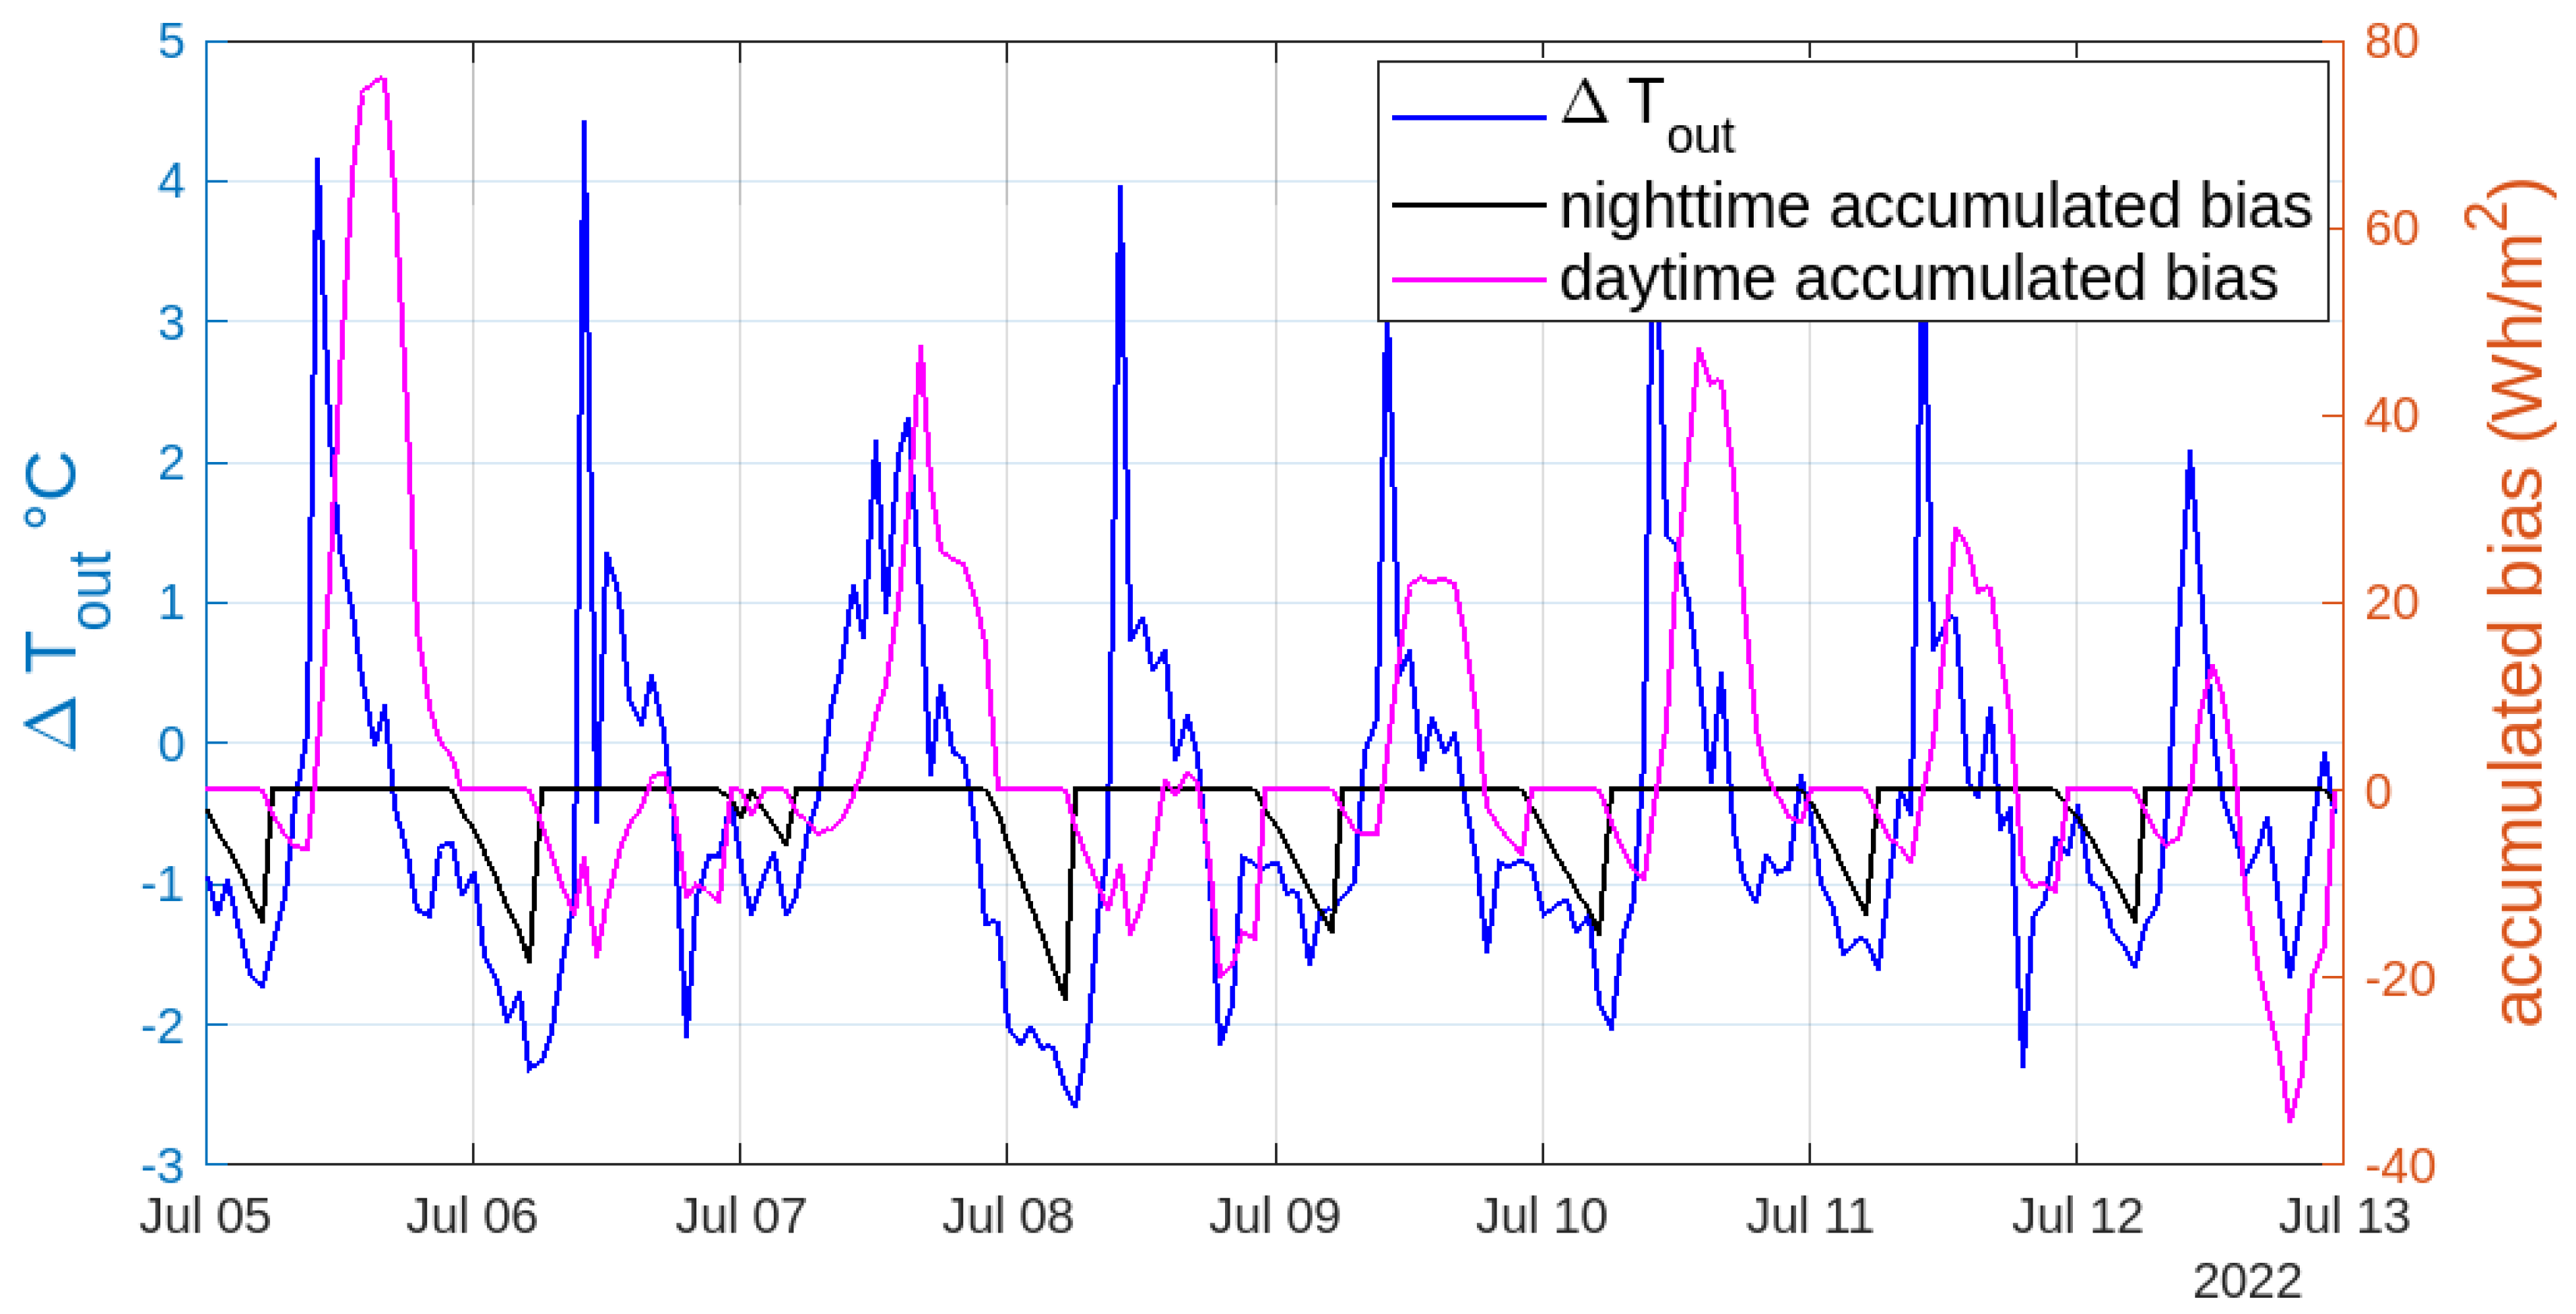
3.2. Comparison and Validation of Computational Results with Experimental Data

In this section, we undertake a comparison between the measurements obtained from the experimental setup and the predictions generated by the thermal model presented earlier. The objective is to assess the model’s accuracy in reliably predicting the performance of the DualSun® PV/T panel. The validation process primarily involves comparing the variations in the outlet temperature of the collector, denoted as Tout, and the temperature of the photovoltaic cells, denoted as TPV. This comparison allows for an evaluation of how closely the thermal model aligns with the actual experimental observations.
To enable the comparison, the model’s input data consist of the following measured parameters: the collector’s inlet temperature (Tin), the fluid flow rate (qm), and the measured meteorological conditions, including ambient temperature, wind speed and direction, solar irradiance, and the sky’s equivalent temperature. It is important to note that the electrical efficiency of the photovoltaic cells is set to zero for this comparison, considering only the thermal aspect of the energy balance described by (Equation (5)), as the collector is not electrically connected.
Wind speed and direction directly influence convective heat exchange on the upper and lower surfaces of the panel. To closely match the experimental conditions, we first aim to establish correlations between the measured wind characteristics and the convective heat transfer coefficients at these surfaces. This approach allows us to supply the simulation model with convective exchange coefficients that accurately represent the experimental conditions, which are significantly influenced by the surrounding environment, as previously detailed.
To establish these correlations, we rely on the surface energy balances calculated for both the upper and lower surfaces, as follows:
1 ρ G F s u p = H t o p T 5 T A m b + ε σ ( T 5 4 T C i e l 4 )
H b a c k = F i n f T 11 T A m b
where ρ ≈ 0.85 represents the solar reflectance of the panel, ε ≈ 0.9 is the emissivity of the glass, and σ is the Stefan–Boltzmann constant. Fsup and Finf correspond to the thermal fluxes passing through the upper and lower surfaces of the collector, respectively. T5 and T11 are the temperatures measured at the center of the panel on both surfaces, while Htop and Hback represent the convective heat transfer coefficients for the upper and lower surfaces, respectively.
Figure 7 shows two scatter plots illustrating the variation of heat transfer coefficients as a function of wind speed and direction. On the upper surface, the heat transfer coefficient appears to vary linearly with wind speed, regardless of wind direction.
On the lower surface, the convective heat transfer coefficient exhibits a much less pronounced variation, remaining below 4 W/(m2K) and more dependent on wind direction. Since the thermal flux involved on the lower surface is ten times weaker than on the upper surface, we set Hback to 3 W/(m2K).
Therefore, we use the following heat transfer coefficients in the simulation to compare with the experimental measurements:
H t o p 2 + 4 . V W i n d
H b a c k = 3   W / ( m 2 K )
Figure 8 and Figure 9 compare the numerical simulation results with the experimental data in terms of variations in the outlet fluid temperature (Tout) and the temperature of the photovoltaic cells (with the T5 temperature measured on the glass surface covering the PV cells). Figure 8 shows that during the day, under strong solar irradiance, the solar collector temperature reaches nearly 60 °C, which is too high to accurately assess its real performance. With this elevated collector temperature, the fluid reaches a peak outlet temperature of 52.3 °C during the day. At night, the collector is cooled by the ambient air, which drops below 9 °C, and by long-wave radiative exchanges with the sky, where the fictive sky temperature falls below 0 °C.
When comparing the two curves representing the experimental and simulation data, it is clear that the established model accurately reproduces the trend of the collector’s outlet temperature variations. During the daytime, the maximum deviation observed between the two curves represents about 9% the total Tout variation amplitude of 35 °C (Table 2). The discrepancies between the experimental data and the simulation results become less pronounced at night, with a maximum temperature difference of 2.5 °C.
The deviation observed during the night can be partially explained by the different emissivity of the glass covering the photovoltaic cells and the adhesive tape covering the sensors attached to the solar collector. The slight deviations are likely attributed to model parameters related to thermal behavior via conduction and convection. The conductivity and convection parameters in the simulation model are probably more accurate at the higher temperatures that the panel predominantly operates at during the day. Additionally, the radiation parameters are validated with the daytime results, which consequently enhances the thermal exchanges, reducing the observed deviations during the night.
A comparison of the simulated PV cell temperatures and the measured temperatures on the upper surface of the collector is provided in Figure 9. This figure shows that both curves follow the same trend, with very small discrepancies during the night and different peak temperatures during sunny days. Specifically, on the sunny day of July 5, a peak temperature difference of 7 °C was observed, whereas on the less sunny day of July 7, the difference was only 1.2 °C. The average difference between calculated PV cell temperature and the average of the surface temperatures measured on the collector was 2.7 °C by daytime and 0.4 °C by night; these temperature differences represent respectively 5.5% and 0.8% of the total temperature variation amplitude. This variation can be attributed to the higher solar absorption at the T5 thermocouple, which is attached to the surface and covered with black adhesive tape. Thus, it is somewhat challenging to accurately capture the PV cell temperature variations using a surface-mounted thermocouple, especially when the cells are covered by a glass layer.
The difference between the measured and the simulated outlet temperatures of the collector, along with the day-by-day comparison of cumulative energy output differences during daytime and nighttime periods are shown in Figure 10. In this figure, the blue curve represents the bias between the calculated temperature and the measured temperature at the collector outlet. The black and magenta curves represent the cumulative bias in terms of thermal production of hot water (by daytime, solar irradiation G > 0) or cooled water (by nighttime, G = 0), day by day. In this figure, night periods (G = 0) correspond to periods when the cumulative bias over the course of the night is zero.
This figure illustrates that, regarding hot water production, the bias between simulation and measurement is largely balanced out during daytime hours. Specifically, the simulation tends to overestimate production around midday (resulting in a mostly positive bias) while underestimating it in the early morning and late afternoon (mostly negative bias). Consequently, the cumulative bias in hot water production, expressed in Wh/m2, approaches zero by the end of the day. In contrast, the thermal model consistently overestimates nighttime cooling, leading to an uncompensated cumulative bias of approximately −20 Wh/m2 per night. These results suggest that, despite local over- and under-estimations throughout the day, the model is overall reliable for estimating daily hot water production, as the midday excess is offset by the morning and evening deficits. However, the model proves less accurate when it comes to simulating thermal behavior during nighttime conditions.

4. Conclusions

This study presents a robust experimental investigation that delivers a high-quality dataset intended to support the validation and development of advanced thermal models. As a first application, a literature-based thermal model using a quasi-steady, one-dimensional energy balance approach was evaluated on a DualSun® hybrid PV/T collector. The model demonstrated quite good agreement with experimental data during daytime operation, with maximum deviations limited to 0.6 °C for fluid outlet temperature during the day and 2.6 °C at night. By accounting for conductive, convective, and radiative heat transfers across the collector’s layers, the model refinement provides better predictions. These findings confirm its ability to capture the overall system’s dynamic thermal response during hot water production with self-correction of simulation bias by daytime, making it a possible tool for performance assessment and optimization. The study also shows that the simulation bias for nighttime water cooling is greater, while the cumulative bias remains substantial.
Beyond validating the model, the experimental setup also highlights the critical influence of accurate boundary conditions—such as wind speed, ambient temperature, fictive sky temperature, and solar irradiance—on predictive performance. This work lays the foundation for further model refinements aimed at broader application. Future developments could focus on improving forecasting models, particularly at night, based on this database before integrating the model into a dynamic simulation software to evaluate PV/T performance under diverse operating conditions and climates. Ultimately, this could support the deployment of PV/T systems in underserved rural areas, enhancing access to sustainable energy solutions.

Author Contributions

Conceptualization, R.D. and F.M.; methodology, R.D. and F.M.; software, R.D. and F.M.; validation, R.D. and F.M.; formal analysis, R.D. and F.M.; investigation, R.D. and F.M.; data curation, F.M. and R.D.; writing—original draft preparation, F.M. and R.D.; writing—review and editing, R.D., F.M. and M.R.; visualization, F.M. and R.D.; supervision, R.D., M.A.K. and M.E.G.; project administration, M.E.G. and R.D.; funding acquisition, M.A.K., M.E.G., R.D. and M.R.. All authors have read and agreed to the published version of the manuscript.

Funding

This research received no external funding.

Data Availability Statement

The data from this study are available upon request from rabah.djedjig@univ-lorraine.fr.

Acknowledgments

The authors gratefully acknowledge the financial support provided by the EMPP Scientific Research Cluster at the University of Lorraine through its Young Researchers Support Program.

Conflicts of Interest

The authors declare no conflict of interest.

Nomenclature and Abbreviations

TTemperature [°C]
ηEfficiency [%]
ηPV/TOverall efficiency of PV/T hybrid collector [%]
kThermal conductivity [W/mK]
δThickness [m]
AreaCollector area [m2]
m ˙ Mass flow rate [kg/s]
αAbsorptivity [-]
HHeat transfer coefficient [W/(m2K)]
hPenalty factor [-]
TskyTemperature of the sky [°C]
GSolar irradiance [W/m2]
TFluid and TF,MeanCalculated fluid and mean fluid temperatures [°C]
Tout and TinMeasured fluid outlet and inlet temperature [°C]
TPVPhotovoltaic panel temperature [°C]
ταTransmittance-absorption product of solar collector [-]
IAMIncidence angle modifier [-]
STCStandard test conditions
DHWDomestic hot water (English)
ECSDomestic hot water (French)
TMYTypical meteorological year
PV/TPhotovoltaic–thermal
PVPhotovoltaic

References

  1. Tiwari, A.K.; Chatterjee, K.; Agrawal, S.; Singh, G.K. A comprehensive review of photovoltaic-thermal (PVT) technology: Performance evaluation and contemporary development. Energy Rep. 2023, 10, 2655–2679. [Google Scholar] [CrossRef]
  2. Kern, J.; Russell, M.C. Combined Photovoltaic and Thermal Hybrid Collector Systems, Massachusetts Inst. of Tech., Lexington (USA). Lincoln Lab. 1978. Available online: https://www.osti.gov/biblio/6352146 (accessed on 17 April 2025).
  3. Garg, H.; Agarwal, R. Some aspects of a PV/T collector/forced circulation flat plate solar water heater with solar cells. Energy Convers. Manag. 1995, 36, 87–99. [Google Scholar] [CrossRef]
  4. Garg, H.; Agarwal, R.; Joshi, J. Experimental study on a hybrid photovoltaic-thermal solar water heater and its performance predictions. Energy Convers. Manag. 1994, 35, 621–633. [Google Scholar] [CrossRef]
  5. Prakash, J. Transient analysis of a photovoltaic-thermal solar collector for co-generation of electricity and hot air/water. Energy Convers. Manag. 1994, 35, 967–972. [Google Scholar] [CrossRef]
  6. Rejeb, O.; Dhaou, H.; Jemni, A. A numerical investigation of a photovoltaic thermal (PV/T) collector. Renew. Energy 2015, 77, 43–50. [Google Scholar] [CrossRef]
  7. Al-Shamani, A.N.; Alghoul, M.; Elbreki, A.; Ammar, A.; Abed, A.M.; Sopian, K. Mathematical and experimental evaluation of thermal and electrical efficiency of PV/T collector using different water based nano-fluids. Energy 2018, 145, 770–792. [Google Scholar] [CrossRef]
  8. Altharwanee, H.; Jurado, F.; Vera, D. Experimental study on the performance of the photovoltaic thermal (PVT) connected in series with flat plate solar collector (ST). Sol. Energy 2024, 283, 113010. [Google Scholar] [CrossRef]
  9. Fang, H.; Zhang, N.; Cai, G.; Chen, H.; Ma, J.; Wu, D.; Du, T.; Wang, Y. Operation strategy optimization and heat transfer characteristic analysis of photovoltaic/thermal module series connected with flat plate solar collector: System experimental study. Renew. Energy 2024, 229, 120770. [Google Scholar] [CrossRef]
  10. Abdul-Ganiyu, S.; Quansah, D.A.; Ramde, E.W.; Seidu, R.; Adaramola, M.S. Study effect of flow rate on flat-plate water-based photovoltaic-thermal (PVT) system performance by analytical technique. J. Clean. Prod. 2021, 321, 128985. [Google Scholar] [CrossRef]
  11. Abdul-Ganiyu, S.; Quansah, D.A.; Ramde, E.W.; Seidu, R.; Adaramola, M.S. Techno-economic analysis of solar photovoltaic (PV) and solar photovoltaic thermal (PVT) systems using exergy analysis. Sustain. Energy Technol. Assess. 2021, 47, 101520. [Google Scholar] [CrossRef]
  12. Maoulida, F.; Djedjig, R.; Kassim, M.A.; El Ganaoui, M. Numerical Study for the Evaluation of the Effectiveness and Benefits of Using Photovoltaic-Thermal (PV/T) System for Hot Water and Electricity Production under a Tropical African Climate: Case of Comoros. Energies 2022, 16, 240. [Google Scholar] [CrossRef]
  13. Yue, H.; Xu, Z.; Chu, S.; Cheng, C.; Zhang, H.; Chen, H.; Ai, D. Study on the Performance of Photovoltaic/Thermal Collector–Heat Pump–Absorption Chiller Tri-Generation Supply System. Energies 2023, 16, 3034. [Google Scholar] [CrossRef]
  14. Brottier, L.; Bennacer, R. Thermal performance analysis of 28 PVT solar domestic hot water installations in Western Europe. Renew. Energy 2020, 160, 196–210. [Google Scholar] [CrossRef]
  15. Nedjar, A.; Chaker, A.; Absi, R.; Lahmer, Y.; Bennacer, R. Performance Study of Photovoltaic/Thermal Collector System for Cold Production by Adsorption in a Mediterranean Climate: Foodstuffs Preservation. J. Therm. Sci. Eng. Appl. 2023, 15, 101011. [Google Scholar] [CrossRef]
  16. Delachaux, V.; Daix, S.; Bennacer, R.; Brottier, L. CFD Modelling for the Design of a Photovoltaic-Thermal Solar Panel Dedicated to Solar-Assisted Heat Pump. In Advances in Computational Heat and Mass Transfer, Icchmt 2023; Benim, A.C., Bennacer, R., Mohamad, A.A., Oclon, P., Suh, S.H., Taler, J., Eds.; Springer International Publishing Ag: Cham, Switzerland, 2024; Volume 2, pp. 469–480. [Google Scholar] [CrossRef]
  17. Hazami, M.; Riahi, A.; Mehdaoui, F.; Nouicer, O.; Farhat, A. Energetic and exergetic performances analysis of a PV/T (photovoltaic thermal) solar system tested and simulated under to Tunisian (North Africa) climatic conditions. Energy 2016, 107, 78–94. [Google Scholar] [CrossRef]
  18. Brottier, L. Optimisation Biénergie d’un Panneau Solaire Multifonctionnel: Du Capteur aux Installations In Situ, Phdthesis, Université Paris-Saclay. 2019. Available online: https://tel.archives-ouvertes.fr/tel-02133891 (accessed on 12 March 2021).
Figure 1. Multi-layer construction of the DualSun PV/T hybrid module [18].
Energies 18 02972 g001
Figure 2. Experimental monitoring setup operation and sensor location.
Energies 18 02972 g002
Figure 3. Energy balance and boundaries of the hybrid PV/T collector.
Energies 18 02972 g003
Figure 4. Recorded meteorological data from 5 July to 12 July 2022.
Energies 18 02972 g004
Figure 5. Thermal response of the PV/T collector under summer conditions.
Energies 18 02972 g005
Figure 6. Variations in heat flux and power within the collector.
Energies 18 02972 g006
Figure 7. Heat transfer on the surfaces of the PV/T hybrid collector.
Energies 18 02972 g007
Figure 8. Comparison between simulation and experimental results of collector Tout.
Energies 18 02972 g008
Figure 9. Simulation vs. experimental comparison of solar cell temperature.
Energies 18 02972 g009
Figure 10. Difference between measured and simulated outlet temperatures of the collector, along with the day-by-day comparison of cumulative energy output differences during daytime and nighttime periods.
Energies 18 02972 g010
Table 1. Composition characteristics of the PV/T collector (Brottier [18]).
LayerThickness (mm)Thermal Conductivity (W/(m·K))
Glass2~1
E.V.A. (encapsulant)0.60.23
Silicon cells0.6130
E.V.A.0.60.23
Backsheet0.140.2
E.V.A.0.60.23
Stainless steel (SS) plate 1 (exchanger 1)0.625
Heat transfer fluid20.6
Stainless steel (SS) plate 2 (exchanger 2)0.625
Insulation (INS)300.04
Table 2. Maximum, minimum, and average deviations between the calculated and measured collector outlet temperatures, as well as between the calculated PV cell temperature and the average of the surface temperatures measured on the collector.
Tout deviation
DayNight
MAX2.6 °C5.2%MAX2.5 °C5.0%
MIN−4.4 °C−8.9%MIN0.4 °C0.8%
MEAN0.1 °C0.3%MEAN1.3 °C2.7%
Tpv deviation
DayNight
MAX0.8 °C1.7%MAX0.9 °C1.8%
MIN−8.7 °C−17.5%MIN−0.2 °C−0.5%
MEAN−2.7 °C−5.5%MEAN0.4 °C0.8%
Disclaimer/Publisher’s Note: The statements, opinions and data contained in all publications are solely those of the individual author(s) and contributor(s) and not of MDPI and/or the editor(s). MDPI and/or the editor(s) disclaim responsibility for any injury to people or property resulting from any ideas, methods, instructions or products referred to in the content.

