Article

Two-Stage Collaborative Power Optimization for Off-Grid Wind–Solar Hydrogen Production Systems Considering Reserved Energy of Storage

by
Yiwen Geng
*,
Qi Liu
,
Hao Zheng
and
Shitong Yan
School of Electrical Engineering, China University of Mining and Technology, Xuzhou 221116, China
*
Author to whom correspondence should be addressed.
Energies 2025, 18(11), 2970; https://doi.org/10.3390/en18112970
Submission received: 8 May 2025 / Revised: 28 May 2025 / Accepted: 31 May 2025 / Published: 4 June 2025

Abstract

:
Off-grid renewable energy hydrogen production is a crucial approach to enhancing renewable energy utilization and improving power system stability. However, the strong stochastic fluctuations of wind and solar power pose significant challenges to electrolyzer reliability. While hybrid energy storage systems (HESS) can mitigate power fluctuations, traditional power allocation rules based solely on electrolyzer power limits and HESS state of charge (SOC) boundaries result in insufficient energy supply capacity and unstable electrolyzer operation. To address this, this paper proposes a two-stage power optimization method integrating rule-based allocation with algorithmic optimization for wind–solar hydrogen production systems, considering reserved energy storage. In Stage I, hydrogen production power and HESS initial allocation are determined through the deep coupling of real-time electrolyzer operating conditions with reserved energy. Stage II employs an improved multi-objective particle swarm optimization (IMOPSO) algorithm to optimize HESS power allocation, minimizing unit hydrogen production cost and reducing average battery charge–discharge depth. The proposed method enhances hydrogen production stability and HESS supply capacity while reducing renewable curtailment rates and average production costs. Case studies demonstrate its superiority over three conventional rule-based power allocation methods.

1. Introduction

Over the years, the utilization of fossil fuels such as coal, petroleum, and natural gas has driven tremendous global development, with numerous industries including transportation, power generation, and manufacturing remaining heavily dependent on these energy sources. However, the extensive consumption of fossil fuels has precipitated imminent environmental pollution and energy scarcity issues in recent years, making the search for renewable energy alternatives to replace fossil fuels a fundamental solution to contemporary energy challenges. Against the backdrop of increasingly prominent energy concerns, China proposed in 2020 its dual carbon targets: achieving a “carbon peak” by 2030 and “carbon neutrality” by 2060. Since this declaration, the country’s new energy power generation sector has experienced rapid development [1,2,3]. Among these, wind and photovoltaic (PV) power generation have experienced the most significant growth, with China maintaining its position as the global leader in installed wind-PV capacity. However, due to the inherent volatility of wind and solar power [4], the electricity generated from these sources struggles to meet the stability requirements for large-scale grid integration, with a grid integration rate limited to approximately 30%. The real-time generation and consumption nature of electricity exacerbates widespread wind and solar curtailment, resulting in severe waste of human and material resources [5,6]. Consequently, to enhance the utilization of highly volatile and stochastic electricity from wind and solar power and absorb the otherwise wasted energy, it is imperative to explore novel approaches [7].
Hydrogen energy, as a clean secondary energy source, boasts high energy density and enables large-capacity, long-term storage and transportation, making it widely applicable in transportation, industry, chemical production, and other fields [8,9]. Simultaneously, hydrogen energy has emerged as the “ultimate energy solution” that is most likely to address energy challenges in the 21st century, owing to its role as a versatile energy conversion hub and its pollution-free utilization. Currently, primary hydrogen production methods include fossil fuel-based hydrogen production, high-temperature decomposition of hydrogen-containing compounds, biomass-derived hydrogen, and water electrolysis. Steam methane reforming (SMR), a widely adopted fossil fuel-based method, offers mature technology and low costs but generates substantial CO emissions during production, exacerbating environmental pollution and undermining energy sustainability. Reference [10] proposes a novel high-temperature decomposition method for hydrogen-containing compounds, pyrolyzing plastic waste to produce hydrogen and carbon nanotubes, achieving waste utilization while minimizing carbon emissions at relatively low costs. However, as most plastics contain carbon elements, this method cannot entirely avoid carbon emissions during hydrogen production, rendering it suboptimal for resolving energy challenges. Biomass-derived hydrogen utilizes renewable biomass as feedstock, absorbing CO2 during fermentation without generating carbon emissions, offering environmental friendliness and strong sustainability. Nevertheless, this process requires substantial water as a reaction medium, posing challenges for water-scarce regions, coupled with immature technology, scalability limitations, and high costs that hinder short-term commercialization [11]. In contrast, renewable energy-powered water electrolysis produces hydrogen and oxygen through electrolyzers, effectively utilizing otherwise wasted wind and solar power while maintaining full-process cleanliness and zero pollution [12]. Common electrolyzer types include alkaline electrolyzers (ALK), proton exchange membrane electrolyzers (PEM), and solid oxide electrolyzer cells (SOEC). Among these, alkaline electrolyzers feature simple structures, ease of manufacturing, low costs, and high technological maturity, making them the optimal choice for large-scale hydrogen production. Therefore, storing energy in hydrogen form through water electrolysis powered by wind and photovoltaic systems represents the most promising solution to energy challenges, aligning with future energy trends. Furthermore, off-grid hydrogen production using renewable energy avoids impacts on large power grids, justifying the adoption of decentralized production systems.
However, the inherent volatility and intermittency of wind and solar resources pose threats to the safe and stable operation of electrolyzers, as excessively low power input to electrolyzers may trigger explosion risks [13]. Consequently, energy storage systems are typically integrated into off-grid hydrogen production setups to balance the mismatch between renewable power generation and hydrogen production demands. The resulting wind–solar-storage-hydrogen integrated system, which combines wind, solar, electrical, and hydrogen energy, constitutes a complex multi-energy system with intricate power allocation challenges among components. This complexity makes it difficult to simultaneously optimize multiple performance indicators, including system stability, renewable energy utilization rates, economic costs, and energy storage supply capacity [14], ultimately severely hindering the advancement of renewable energy-based off-grid hydrogen production. Therefore, conducting research on power coordination optimization among devices in renewable off-grid hydrogen production systems to balance economic feasibility, operational stability, energy storage reliability, and wind–solar curtailment rates holds profound significance.
Extensive research has focused on the collaborative optimization of hydrogen-integrated multi-energy system (HIMES), primarily through three approaches: intelligent algorithms, data-driven machine learning, and rule-based power allocation. Intelligent algorithms construct multi-objective functions to seek global optima under constraints. Reference [15] balanced power fluctuations, battery degradation, and energy losses in wind farms, while reference [16] proposed a real-time energy management system using multidimensional piecewise linear function-based approximate dynamic programming (MPLF-ADP) to minimize operational costs under renewable uncertainties. However, these methods face high computational complexity and hardware dependence due to the multi-objective, multi-constrained nature of HIMES. Machine learning approaches, such as data-driven robust scheduling for hydrogen microgrids (H2-DCMG) [17] and adaptive dynamic programming reinforcement learning [18], offer data-driven solutions but require massive training datasets and GPU-accelerated hardware, limiting practical deployment. Rule-based methods excel in computational efficiency and interpretability. Reference [19] maintained electrolyzer power above 40% of rated capacity to enhance efficiency, and reference [20] combined fixed rules with improved particle swarm optimization for capacity configuration. However, existing rules oversimplify interactions between electrolyzer power limits and ESS state-of-charge (SOC) boundaries [21,22,23], neglecting reserved energy allocation to counteract future extreme operating conditions, thereby compromising system-wide stability. A comprehensive comparison revealed that the commonly used power dispatch strategies for HIMES each exhibit distinct advantages and limitations across different operational aspects. However, since HIMES optimization inherently involves multi-objective trade-offs and aims for balanced performance across multiple criteria, integrating complementary methodologies can synergize their strengths. This approach enables more robust handling of diverse operational requirements while enhancing overall system efficiency and flexibility.
The multi-stage optimization of HIMES is currently being explored by scholars. To address the multi-factor uncertainties in rural multi-energy microgrids, Reference [24] proposed a two-stage stochastic energy scheduling method. In the first stage, operational states of energy storage systems and power units are optimized to mitigate the negative impacts of uncertainties, while the second stage focuses on the real-time adjustment of output power from units and storage to rapidly adapt to fluctuating uncertainty factors. The two-stage optimization framework employs a progressive hedging algorithm to solve stochastic optimization problems, thereby enhancing computational efficiency. Reference [25] proposed a two-stage robust optimization method: the first stage determines the battery charge/discharge states and electrolyzer on/off statuses, while the second stage enhances small-disturbance stability by incorporating output power constraints. References [26,27,28] adopted a two-stage strategy for HIMES energy dispatch, with the first stage performing day-ahead deterministic scheduling and the second stage executing intraday rolling scheduling. Reference [29] introduced a two-stage adaptive robust optimization framework for integrated energy and natural gas systems, where the first stage optimizes equipment configurations, and the second stage maximizes output while minimizing operational costs. Reference [30] developed a solution algorithm based on Lyapunov optimization theory (LOT) and multi-agent deep reinforcement learning. It simplifies the cost minimization problem via LOT and subsequently solves it using the multi-agent advantage actor-aritic deep deterministic policy gradient (MAADDPG), combining the strengths of two power optimization methods. However, this approach exhibits high dependency on data and stringent hardware requirements. Reference [31] proposed a bilayer energy management strategy: the first layer achieves optimal power allocation, and the second layer balances the SOC of energy storage to prolong battery lifespan.
A systematic review of studies related to two-stage optimization in HES systems was conducted, with the findings summarized in Table 1. The table reveals that most two-stage power optimization frameworks decompose distinct tasks into sequential stages, whereas few integrate complementary power dispatch methodologies for the same objective. Only reference [30] synergized intelligent algorithm-based power optimization with AI-driven machine learning to enhance adaptability across varying operating conditions. Reference [24] implemented the optimization of equipment operational states across both stages, yet relied solely on intelligent optimization algorithms for problem-solving in both phases without leveraging the complementary strengths of different methodologies. Beyond the aforementioned literature on two-stage optimization for HESs systems, Reference [32] investigated triggering mechanisms for secondary control in DC microgrids. By integrating distributed self-triggered (TED) and distributed event-triggered (STED) mechanisms, the authors proposed a novel hybrid distributed triggering mechanism (HTED). This approach eliminates the high demands for continuous sampling and state monitoring inherent in TED while overcoming the conservativeness of STED, offering valuable insights for integrating diverse optimization methods in HESS systems. Furthermore, for renewable energy off-grid hydrogen production systems, the power supply capability of energy storage is crucial. Optimizing energy storage states and reserving partial energy storage capacity can enhance the full-cycle charge–discharge capability of energy storage systems, thereby improving hydrogen production system stability and reducing wind and solar curtailment rates. However, a literature review revealed that while numerous studies have considered the lifespan degradation caused by energy storage charge–discharge cycles, none have addressed the allocation of reserved energy storage capacity during normal electrolyzer operations to mitigate potential adverse operating conditions in future scenarios.
To address the aforementioned limitations, this study develops a deterministic power dispatch framework that prioritizes reserving differentiated energy storage buffer capacities tailored to the electrolyzer’s real-time operating conditions. This approach proactively mitigates adverse electrolyzer operating scenarios, thereby enhancing global hydrogen production stability. A refined power dispatch protocol is formulated by deeply coupling the electrolyzer’s dynamic states with the energy storage’s SOC, improving the system’s adaptability to fluctuating renewable generation. Furthermore, the proposed two-stage collaborative power optimization synergizes rule-based dispatch with intelligent algorithms, achieving rapid power allocation while ensuring globally balanced performance. The specific contributions are as follows:
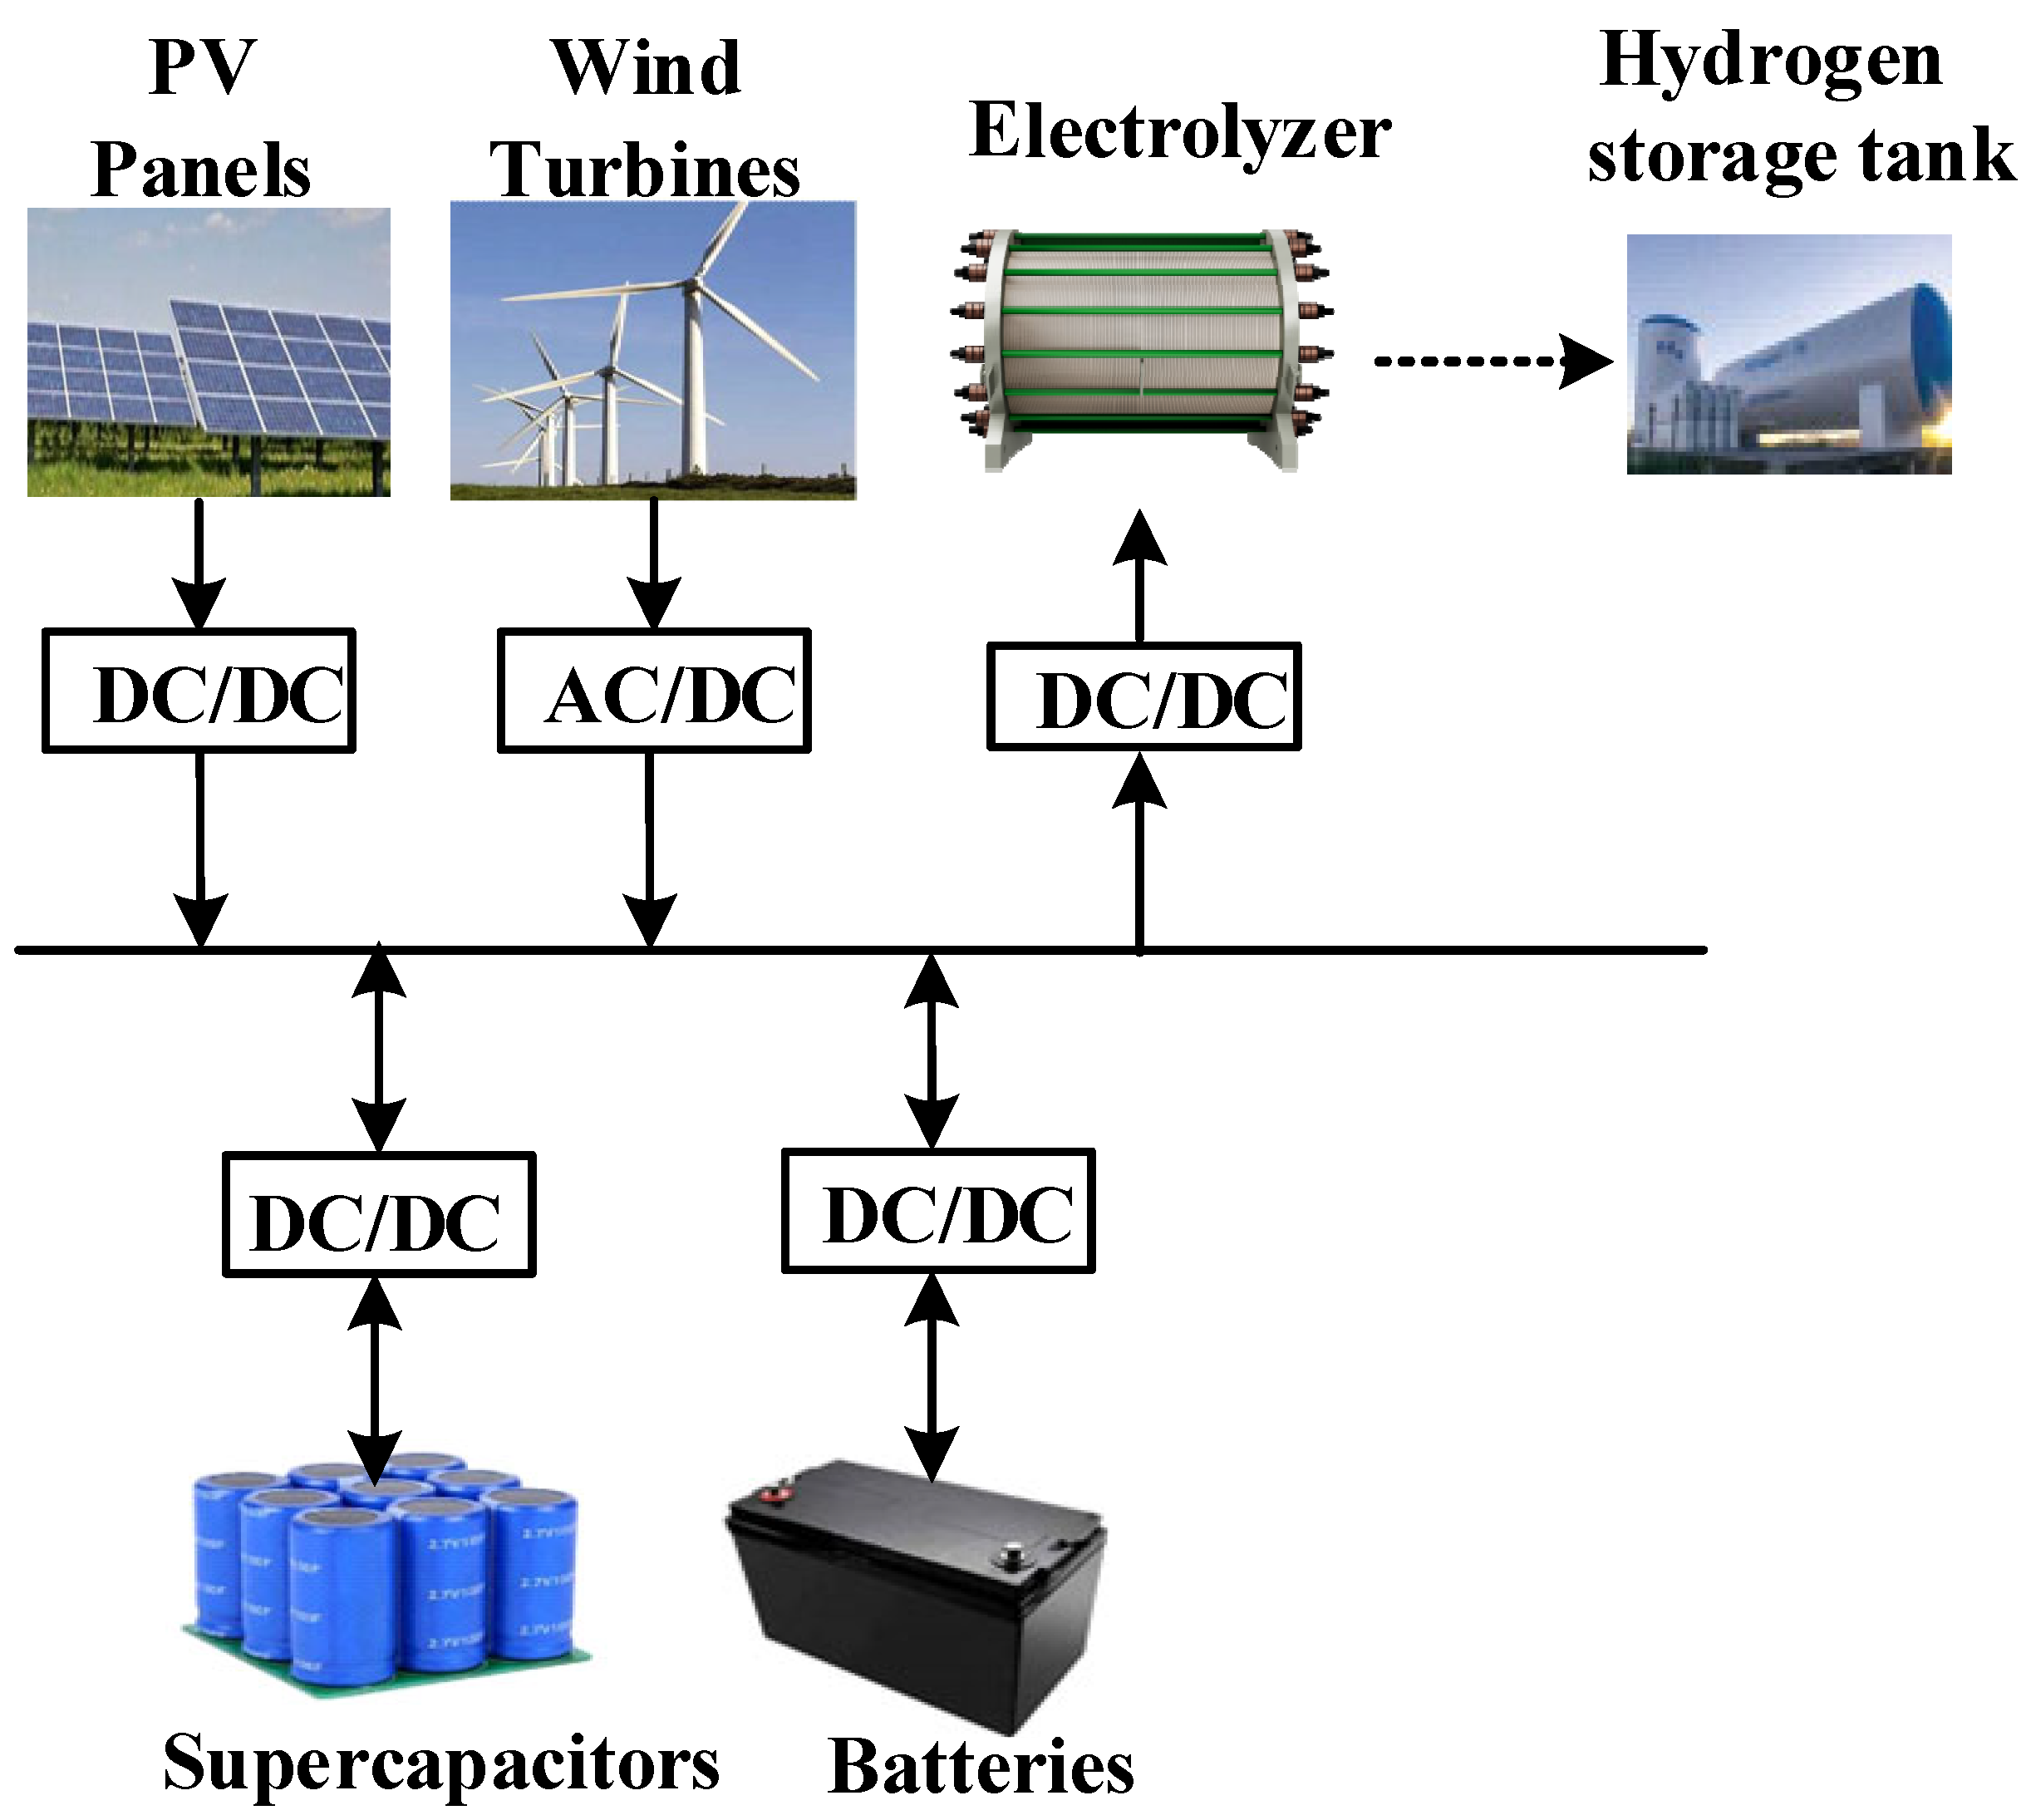
(1) An off-grid wind-PV-storage hydrogen production system model is established, where a HESS (comprising batteries and supercapacitors) mitigates long-term and transient power imbalances.
(2) Conventional power dispatch rules solely consider simplistic interactions between electrolyzer power boundaries and storage SOC limits, leading to suboptimal storage dispatchability and unstable electrolyzer operation. This work introduces a refined rule library that incorporates multi-condition electrolyzer–storage interactions and adaptive buffer energy reservation, significantly enhancing dispatch granularity and robustness.
(3) To overcome the poor adaptability and global optimality limitations of deterministic rules under renewable variability, a two-stage collaborative optimization strategy is proposed:
  • Stage I: Rapidly allocates electrolyzer power and preliminary HESS power via buffer-energy-aware refined rules, reducing nonlinear optimization complexity.
  • Stage II: Optimizes inter-storage (battery–supercapacitor) power distribution using an improved multi-objective particle swarm optimization (IMOPSO) algorithm, minimizing unit hydrogen production cost and battery depth of discharge (DOD). This achieves globally balanced optimality for both electrolyzer and storage operations.
(4) Comparative analyses using three conventional rule-based methods demonstrate that the proposed approach reduces the system power shortage rate, wind/solar curtailment rate, and storage cycling losses while balancing economic efficiency, hydrogen production stability, and battery longevity.
Section 2 details the off-grid wind-PV-storage hydrogen system architecture and mathematical modeling. Section 3 elaborates on the two-stage collaborative power optimization strategy. Section 4 validates the proposed method against three benchmark strategies through case simulations, with results analyzed. The concluding section summarizes key findings.

2. System Modeling

The proposed off-grid wind–solar hydrogen production system, as depicted in Figure 1, integrates the following functional units: a renewable generation unit composed of wind turbines and photovoltaic panels, a hydrogen production and storage unit containing alkaline electrolyzers and hydrogen storage tanks, and a hybrid energy storage system (HESS) combining batteries and a supercapacitor. The renewable generation unit directly supplies electricity to the electrolyzers for hydrogen synthesis, while the HESS dynamically compensates for power deficits and absorbs surplus energy caused by intermittent wind–solar generation through adaptive charging–discharging operations.

2.1. Wind Power Output Model

The output power of wind turbines exhibits intermittency and volatility due to wind speed variations. The wind turbine power output model can be expressed as [33]:
P wt ( t ) = 0 , v ( t ) < v in or v ( t ) > v out P r v ( t ) v in v r v in , v in v ( t ) v r P r , v r v ( t ) v out
where P wt ( t ) , P r , v ( t ) , v in , v out , and v r represent the current power of the wind turbine, the rated power of the wind turbine, the real-time wind speed at the hub height, the cut-in wind speed of the wind turbine, the cut-out wind speed, and the rated wind speed of the wind turbine.

2.2. PV Power Output Model

The output power model of the photovoltaic panel is [34]:
P pv ( t ) = P sta f pv G ( t ) G sta 1 + α T T a ( t ) T a , sta
where P pv ( t ) , P sta , f pv , G ( t ) , G sta , α T , T a ( t ) , and T a , sta represent the current power of the photovoltaic panel, the rated power of the photovoltaic panel under standard parameters, the power degradation coefficient, the current light intensity, the standard light intensity, the power temperature coefficient, the current temperature of the photovoltaic panel, and the standard ambient temperature.

2.3. Electrolyzer-Hydrogen Storage System Model

Alkaline electrolyzers, characterized by simple manufacturing, mature technology, and high reliability, are well-suited for large-scale hydrogen production scenarios. These devices decompose water molecules into hydrogen and oxygen via direct current. To enhance electrolyte conductivity (as pure water exhibits poor electrical conductivity), a 30% KOH solution is added. The anode is constructed from nickel (Ni), cobalt (Co), and iron (Fe), while the cathode employs nickel, with platinum-activated carbon catalysts replacing conventional catalytic materials. Low-resistance nickel oxide (NiO) serves as the diaphragm component. The chemical equations governing alkaline electrolyzer hydrogen production are as follows:
Anode reaction:
2 O H 1 2 O 2 + H 2 O + 2 e
Cathode reaction:
2 H 2 O + 2 e H 2 + 2 O H
Overall water electrolysis reaction:
H 2 O H 2 + 1 2 O 2
Electrolyzer temperature critically influences both efficiency and hydrogen output. A thermal model simulates temperature variations by treating the electrolyzer as an overall thermal capacitance system, with total energy balance expressed as:
C ec d T ec d t = Q gen Q loss Q cool
where
Q gen = N ec I ( U ec U th ) = N ec I U ec ( 1 η ec )
Q loss = 1 R ec ( T ec T α )
Q cool = C cw ( T cwi T cwo ) = V A HX L M T D
where C ec denotes the total thermal capacitance, Q gen is the internal heat generation, Q loss is natural thermal dissipation, Q cool is the auxiliary cooling loss, T ec is the electrolyzer temperature, N ec is the number of electrolyzer units, I is the operating current, U ec is the operating voltage, U tn is the thermoneutral voltage, η ec is the hydrogen production efficiency, R ec is the total thermal resistance, T α , T cwi , T cwo , and T cwo represent ambient temperature, cooling water inlet temperature, and outlet temperature respectively, C cw is the cooling water heat capacity, V A HX is the heat exchanger coefficient, and L M T D is the logarithmic mean temperature difference.
The logarithmic mean temperature difference correlates electrolyzer temperature with cooling water inlet/outlet temperatures:
L M T D = T ec T cwi T ec T cwo ln T ec T cwi / T ec T cwo
where
T cwo = T cwi + T ec T cwi 1 exp V A HX C cw
Combining Equations (7)–(9), and (11), Equation (6) can be reformulated as:
d T ec d t + A T ec B = 0
Solving this yields the electrolyzer temperature expression:
T ec ( t ) = ( T ini B A ) exp ( A × O T ) B A
where T ini is the initial temperature, O T is the operation time, and A , B are arbitrary constants defined as:
A = 1 C ec R ec + C cw C ec 1 exp ( V A HX C cw )
B = U ec I ( 1 η ec ) C ec + T α C ec R ec + C cw T cwi C ec 1 exp ( V A HX C cw )
The alkaline electrolyzer electrochemical model comprises: [35]:
Q ec ( t ) = P ecr ( t ) η ec ( t )
where Q ec ( t ) represents the hydrogen production rate of the electrolyzer, while P ecr ( t ) denote its operating power.
The calculation formula for the electrolyzer operating power is:
P ecr ( t ) = P N P bre ( t )
where P N is the rated power of the electrolyzer, and P bre ( t ) is the power deficit of the electrolyzer at time t . The calculation formula for the hydrogen production efficiency of the electrolyzer is:
η ec ( t ) = η F ( t ) U tn U ec ( t )
where η F ( t ) is the Faraday efficiency of the electrolyzer. The calculation formula for the electrolyzer cell voltage is:
U ec ( t ) = U cell ( t ) N ec
where U cell ( t ) is the voltage of a single electrolyzer cell. The calculation formula for the voltage of a single electrolyzer cell is:
U cell ( t ) = U rev + U ohm ( t ) + U con ( t )
where U rev is the reversible voltage (a constant, 12 V), and U ohm ( t ) and U con ( t ) are the ohmic polarization voltage and concentration polarization voltage of the electrolyzer at time t , respectively. The expression for the ohmic polarization voltage is:
U ohm ( t ) = r 1 + r 2 T ec A ec I ( t )
where r 1 and r 2 are electrochemical correlation coefficients of the electrolyzer, and A ec is the electrode area. The expression for the concentration polarization voltage is:
U con ( t ) = S lg ( t 1 + t 2 / T ec + t 3 / T ec 2 A ec I ( t ) + 1 )
where S , t 1 , t 2 , and t 3 are the electrochemical correlation parameters of the electrolyzer. The calculation formula for the Faraday efficiency of the electrolyzer is:
η F ( t ) = 96.5 e ( 0.09 / I ( t ) 75.5 / I 2 ( t ) )
The calculation formula for the hydrogen production rate of the electrolyzer is:
V H 2 ( t ) = η F ( t ) I ( t ) 2 F N ec
where V H 2 ( t ) is the hydrogen production rate of the electrolyzer at time t , and F is the Faraday constant.
Based on the aforementioned electrolyzer model, the relationship curves between alkaline electrolyzer hydrogen production efficiency, hydrogen production rate, and operating power are illustrated in Figure 2. As shown in the figure, the hydrogen production efficiency initially increases rapidly with rising input power, then gradually decreases, where P N denotes the electrolyzer’s rated power. When the input power reaches 0.28 P N , the hydrogen production efficiency peaks at 0.751. In contrast, the hydrogen production rate continuously increases with higher input power. This demonstrates that hydrogen production efficiency and rate are not positively correlated. During electrolyzer operation, both energy utilization efficiency (to maximize efficiency) and economic benefits (to enhance production rate) must be balanced.
Through comprehensive consideration of hydrogen production efficiency and rate, this study categorizes electrolyzer operational power ranges as follows:
  • [100% P N , 120% P N ]: Overload hydrogen production mode. The hydrogen production rate is the highest, which can increase hydrogen output. However, to avoid damaging the stack materials, this mode can only operate briefly.
  • [70% P N , 100% P N ]: High-efficiency high-speed hydrogen production mode. The hydrogen production efficiency exceeds 70%, and the hydrogen production rate is above 7.28 mol/s, making it the most ideal.
  • [50% P N , 70% P N ]: High-efficiency medium-speed hydrogen production mode. The hydrogen production efficiency exceeds 70%, and the hydrogen production rate is moderate, which is relatively ideal.
  • [20% P N , 50% P N ]: High-efficiency low-speed hydrogen production mode. The hydrogen production efficiency exceeds 70%, but the hydrogen production rate is low, and the power deficit rate is high, adversely affecting revenue.
  • [0, 20% P N ]: Prohibited operating mode. Although it includes partial high-efficiency hydrogen production ranges, the hydrogen production rate is below 2 mol/s, posing explosion risks; thus, operation is prohibited.
The mathematical model of the hydrogen storage tank is:
S HS , t + Δ t = S HS , t + M EL , t Δ t S H , t
where S HS , t and S HS , t + Δ t are the hydrogen storage levels of the tank at times t and t + Δ t , respectively. M EL , t is the hydrogen storage rate, and S H , t is the hydrogen sold (hydrogen is sold at fixed daily times).

2.4. Hybrid Energy Storage System (HESS) Model

The hybrid energy storage system consists of a battery and a supercapacitor. Supercapacitors exhibit high power density and instantaneous energy release capability but limited charge–discharge duration, whereas batteries possess lower power density yet higher energy density with extended charge–discharge cycles. The battery’s rated capacity and minimum capacity are calculated respectively as:
E b = N b C b U b / 10 3
E bmin = N b C b U b ( 1 D depth ) / 10 3
The maximum output power of a single supercapacitor with peak current Iscmax is expressed as:
P b = N b C b U b / 10 4
where E b and P b represent the total rated capacity and total rated power of the battery system, N b denotes the number of battery units, C b and U b indicate the rated capacity and rated voltage of a single battery unit, and D depth signifies the maximum depth of discharge.
For supercapacitors, assuming each unit has capacitance C c with voltage U c fluctuating between U cmin and U cmax , the maximum and minimum capacities E cmax and E cmin are defined as:
E cmax = 0.5 N c C c U cmax 2 / ( 3.6 × 10 6 )
E cmin = 0.5 N c C c U cmin 2 / ( 3.6 × 10 6 )
The maximum output power of a single supercapacitor P cmax with peak current I cmax is expressed as:
P cmax = N c U cmax I cmax / 10 3
where N c represents the number of supercapacitor units.
The state of charge (SOC) mathematical models for both batteries and supercapacitors can be uniformly described as [36]:
S SOE , t + Δ t = S SOE , t + η t t + Δ t P t ch d t / E ( charge ) S SOE , t t t + Δ t P t dis d t / η / E ( discharge )
where S SOE , t and S SOE , t + Δ t are the SOC of the energy storage device at times t and t + Δ t , respectively; P t ch and P t dis are the charging power and discharging power of the energy storage device; η is the charging/discharging efficiency of the energy storage device; Δ t is the time step; and E is the rated capacity of the energy storage device.

3. Two-Stage Collaborative Power Optimization Strategy

3.1. Stage I: System Power Dispatch Rules

Traditional deterministic rule-based power allocation methods are often confined to simple interactions between the upper/lower limits of electrolyzer power and energy storage constraints, neglecting the critical consideration of how much reserved energy storage should be allocated under specific electrolyzer operating conditions during power shortages to mitigate future adverse scenarios. This oversight leads to inadequate global energy supply capacity and unstable hydrogen production in electrolyzers. To address this, this paper proposes a power allocation rule for the first operational stage that deeply integrates renewable generation, electrolyzer operating conditions, and reserved storage energy. This rule establishes energy storage supply priorities for different electrolyzer operating conditions under varying renewable generation levels, retaining appropriate reserved energy during permissible electrolyzer conditions to enhance comprehensive storage supply capability and ensure stable electrolyzer operation.
When renewable generation exceeds the electrolyzer’s rated power, the electrolyzer operates in high-efficiency, high-speed hydrogen production mode at rated power P N . For sustained power surplus, the electrolyzer temporarily operates in an overload condition at 1.2 P N to increase hydrogen output. During this phase, the hybrid energy storage system charges, with batteries and supercapacitors jointly absorbing the surplus power. The initial power allocation rules for hybrid storage charging are detailed in Table 2, where Δ P ( t ) represents the difference between renewable generation and the electrolyzer’s rated power, P bmax and P cmax denote the maximum charge/discharge power of batteries and supercapacitors respectively, and P bc ( t ) and P cc ( t ) indicate the respective charging powers. The specific rules are as follows:
(1) When P bmax + P cmax Δ P ( t ) , both storage units charge at maximum capacity, with excess power beyond their maximum charging limits being curtailed as renewable energy waste.
(2) For P bmax < Δ P ( t ) P bmax + P cmax , the battery charges at P bmax while the supercapacitor supplements the remaining Δ P ( t ) P bmax . No curtailment occurs unless the combined charging exceeds the hybrid storage capacity limits.
(3) When Δ P ( t ) P bmax , only the supercapacitor charges. If Δ P ( t ) > P cmax , the supercapacitor charges at P cmax with surplus power curtailed. Otherwise, the supercapacitor charges at Δ P ( t ) without curtailment.
When renewable generation falls below the electrolyzer’s rated power, hybrid storage discharges. The electrolyzer power command and storage supply priority are determined based on the electrolyzer’s hydrogen production conditions during power shortages while preserving appropriate reserved energy for future adverse scenarios. This process involves three key steps:
(1) Reserved Energy Assessment: Evaluate battery and supercapacitor reserved energy using the initial state of charge (SOC) threshold of 0.5. SOC values above 0.5 indicate sufficient reserved energy to withstand potential adverse conditions.
(2) Adaptive Power Command Allocation: Develop storage supply priorities for various electrolyzer conditions through the integrated consideration of reserved energy. As illustrated in Figure 3, where P fg ( t ) represents total renewable power, S O C ( t 1 ) , S O C C ( t 1 ) denote previous SOC values, and P ec ( t ) is the electrolyzer power command, the rule is as follows: With sufficient reserved energy, the electrolyzer operates at P N regardless of current conditions. With insufficient reserved energy, four operational scenarios are addressed:
(1) When the electrolyzer experiences a power shortage and operates under prohibited operating conditions, the power command for the electrolyzer is set to 0.5 P N . The priority is to prevent electrolyzer shutdown, followed by transitioning it to the more favorable medium-speed hydrogen production condition with high efficiency.
(2) When the electrolyzer operates in the low-speed hydrogen production condition with high efficiency during power shortage, its power command is adjusted to 0.5 P N to elevate it to the medium-speed hydrogen production condition with high efficiency.
(3) For electrolyzers already operating in the medium-speed hydrogen production condition with high efficiency during power shortage, the power command is increased to 0.7 P N to upgrade it to the optimal high-speed hydrogen production condition with high efficiency.
(4) When the electrolyzer operates in the optimal high-speed hydrogen production condition with high efficiency during power shortage, the power command is maintained at the total wind–solar power generation P fg ( t ) to preserve this ideal operating mode while reserving energy storage capacity without discharge.
This strategy ensures that when energy storage reserves are insufficient, priority power supply demands under each electrolyzer operating condition are satisfied while retaining appropriate stored energy. This approach enhances the system’s capability to address severe electrolyzer operating conditions throughout the year.
(3) Integrating the reserved energy status of batteries and supercapacitors, i.e., perform preliminary power allocation for hybrid energy storage. To reduce the complexity of the second-stage optimization problem, the preliminary allocation of hybrid energy storage power is required. During hybrid energy storage discharge, energy storage components with sufficient reserved energy assume the discharge responsibility. If both components have sufficient reserved energy, the battery handles small power fluctuations while the supercapacitor addresses large power fluctuations. When both lack sufficient reserved energy, both storage units discharge within their respective minimum capacity constraints to supplement the electrolyzer’s power deficit. The initial power allocation rules for battery and supercapacitor discharge are shown in Table 3, where P bd ( t ) and P cd ( t ) represent the battery and supercapacitor discharge power, respectively, and Δ P ( t ) denotes the difference between the electrolyzer power command and renewable generation. Specific cases are as follows:
(1) When S O C > 0.5 and S O C C > 0.5 , both the battery and supercapacitor have sufficient reserved energy; when S O C 0.5 and S O C C 0.5 , both lack sufficient reserved energy. Under these two conditions, both the battery and supercapacitor discharge jointly to achieve the electrolyzer power command. Specific rules include:
  • When P bmax + P cmax Δ P ( t ) , both the battery and supercapacitor discharge at maximum power to supplement the electrolyzer deficit.
  • When P bmax < Δ P ( t ) P bmax + P cmax , the battery discharges at rated power P bmax , while the supercapacitor supplements the remaining power deficit at Δ P ( t ) P bmax .
  • When Δ P ( t ) P bmax , to reduce charge–discharge losses, the battery reserves energy and does not discharge, with only the supercapacitor discharging. If Δ P ( t ) > P cmax , the supercapacitor discharges at maximum power P cmax ; otherwise, it discharges at Δ P ( t ) .
(2) When S O C > 0.5 and S O C C 0.5 , the battery has sufficient reserved energy while the supercapacitor does not. In this case, the battery alone discharges to address the electrolyzer power deficit. If Δ P ( t ) P bmax , the battery discharge power is Δ P ( t ) ; otherwise, it is P bmax .
(3) When S O C 0.5 and S O C C > 0.5 , the supercapacitor has sufficient reserved energy while the battery does not. Here, the supercapacitor alone discharges to address the electrolyzer power deficit. If Δ P ( t ) P cmax , the supercapacitor discharge power is Δ P ( t ) ; otherwise, it is P cmax .
As shown in Table 3, when the reserved energy of both the battery and supercapacitor is insufficient, appropriate energy reserves must be maintained. The magnitude of reserved energy is determined based on the electrolyzer’s power deficit conditions: When the electrolyzer operates in non-ideal hydrogen production modes, energy storage reserves partial energy, with discharged energy only being sufficient to elevate the electrolyzer to relatively favorable hydrogen production modes; Meanwhile, when the electrolyzer operates under optimal conditions, more energy is reserved with complete discharge prohibition. Consequently, the proposed power allocation rules for this hybrid energy storage-based, off-grid hydrogen production system not only ensure real-time operational improvements for the electrolyzer but also establish 0.5 SOC as the threshold for assessing energy storage reserve adequacy. This strategy retains appropriate energy reserves in storage devices, enhances the system’s ability to withstand future harsh operating conditions of the electrolyzer, and ultimately improves the stability of hydrogen production.

3.2. Stage II: HESS Power Optimization Strategy

The rules design in Stage I primarily aims to enhance electrolyzer stability and improve energy storage power supply capability but neglects the charging–discharging health status of the energy storage. Consequently, the derived electrolyzer power commands are already near-optimal, while the hybrid energy storage (battery and supercapacitor) power allocation fails to achieve global optimality. Therefore, it is necessary to optimize the hybrid energy storage power based on the electrolyzer power commands and preliminary storage power allocation from Stage I, thereby improving the storage’s charging–discharging capability. Additionally, it is worth noting that the preliminary power allocation in Stage I significantly reduces the solving complexity of Stage II.

3.2.1. Objective Function

To enhance the system’s economic performance, the first objective is to minimize the unit hydrogen production cost of the wind-PV off-grid hydrogen production system. Meanwhile, since energy storage degradation is related to the DOD, and the supercapacitor’s cycle life can cover the entire operational period, only battery degradation is considered. Therefore, the second objective is to minimize the deviation between the battery’s actual DoD and its initial DoD. The overall objective function is formulated as:
f = min ( f 1 , f 2 ) = λ 1 f 1 max f 1 + λ 2 f 2 max f 2
where f is the total objective function, f 1 and f 2 are the first and second objective functions, respectively, and λ 1 and λ 2 are the weights of the first and second objectives. Here, enhancing economic performance and reducing battery degradation are considered equally important, and the weights are set as:
λ 1 = 0.5 λ 2 = 0.5
The expression for the first objective function is:
f 1 = min C H 2 = min C inv + C op + C rep m H 2
where C H 2 is the unit hydrogen production cost, C inv is the annualized investment cost, C op is the annualized operational and maintenance cost, C rep is the annualized replacement cost, and m H 2 is the annual hydrogen production mass.
The expression for the second objective function is:
f 2 = min D ave = min t = 1 T D ( t ) 0.5 T
where D ave is the deviation between the battery’s integrated depth of discharge and the initial depth of discharge, D ( t ) is the battery’s depth of discharge at time t , 0.5 is the initial depth of discharge, and T is the number of sampling points.

3.2.2. Constraints

(1) Power Balance Constraint:
To ensure stable operation of the wind-PV off-grid hydrogen production system, the following constraint must be satisfied:
P ec ( t ) + P bc ( t ) + P cc ( t ) = P pv ( t ) + P wt ( t ) + P bd ( t ) + P cd ( t ) P was ( t ) P ec ( t ) = P ecmax P bre ( t )
where P ec ( t ) , P was ( t ) , and P bre ( t ) represent the electrolyzer input power, renewable power curtailment, and load shedding power at time t, respectively.
(2) Battery Power Constraint:
According to the hybrid energy storage system operation strategy, the battery charging and discharging power is constrained as:
P bc ( t ) = P b   or   P bc ( t ) = 0 P bd ( t ) = P b   or   P bd ( t ) = 0 P bc ( t ) P bd ( t ) = 0
(3) Supercapacitor Power Constraint:
The supercapacitor charging and discharging power is constrained as:
P cc ( t ) P cmax P cd ( t ) P cmax
(4) Energy Storage State Constraint:
To prevent accelerated degradation due to the overcharging or over-discharging of the battery and supercapacitor, their states of charge are constrained as:
0.1 S SOE , t 0.9

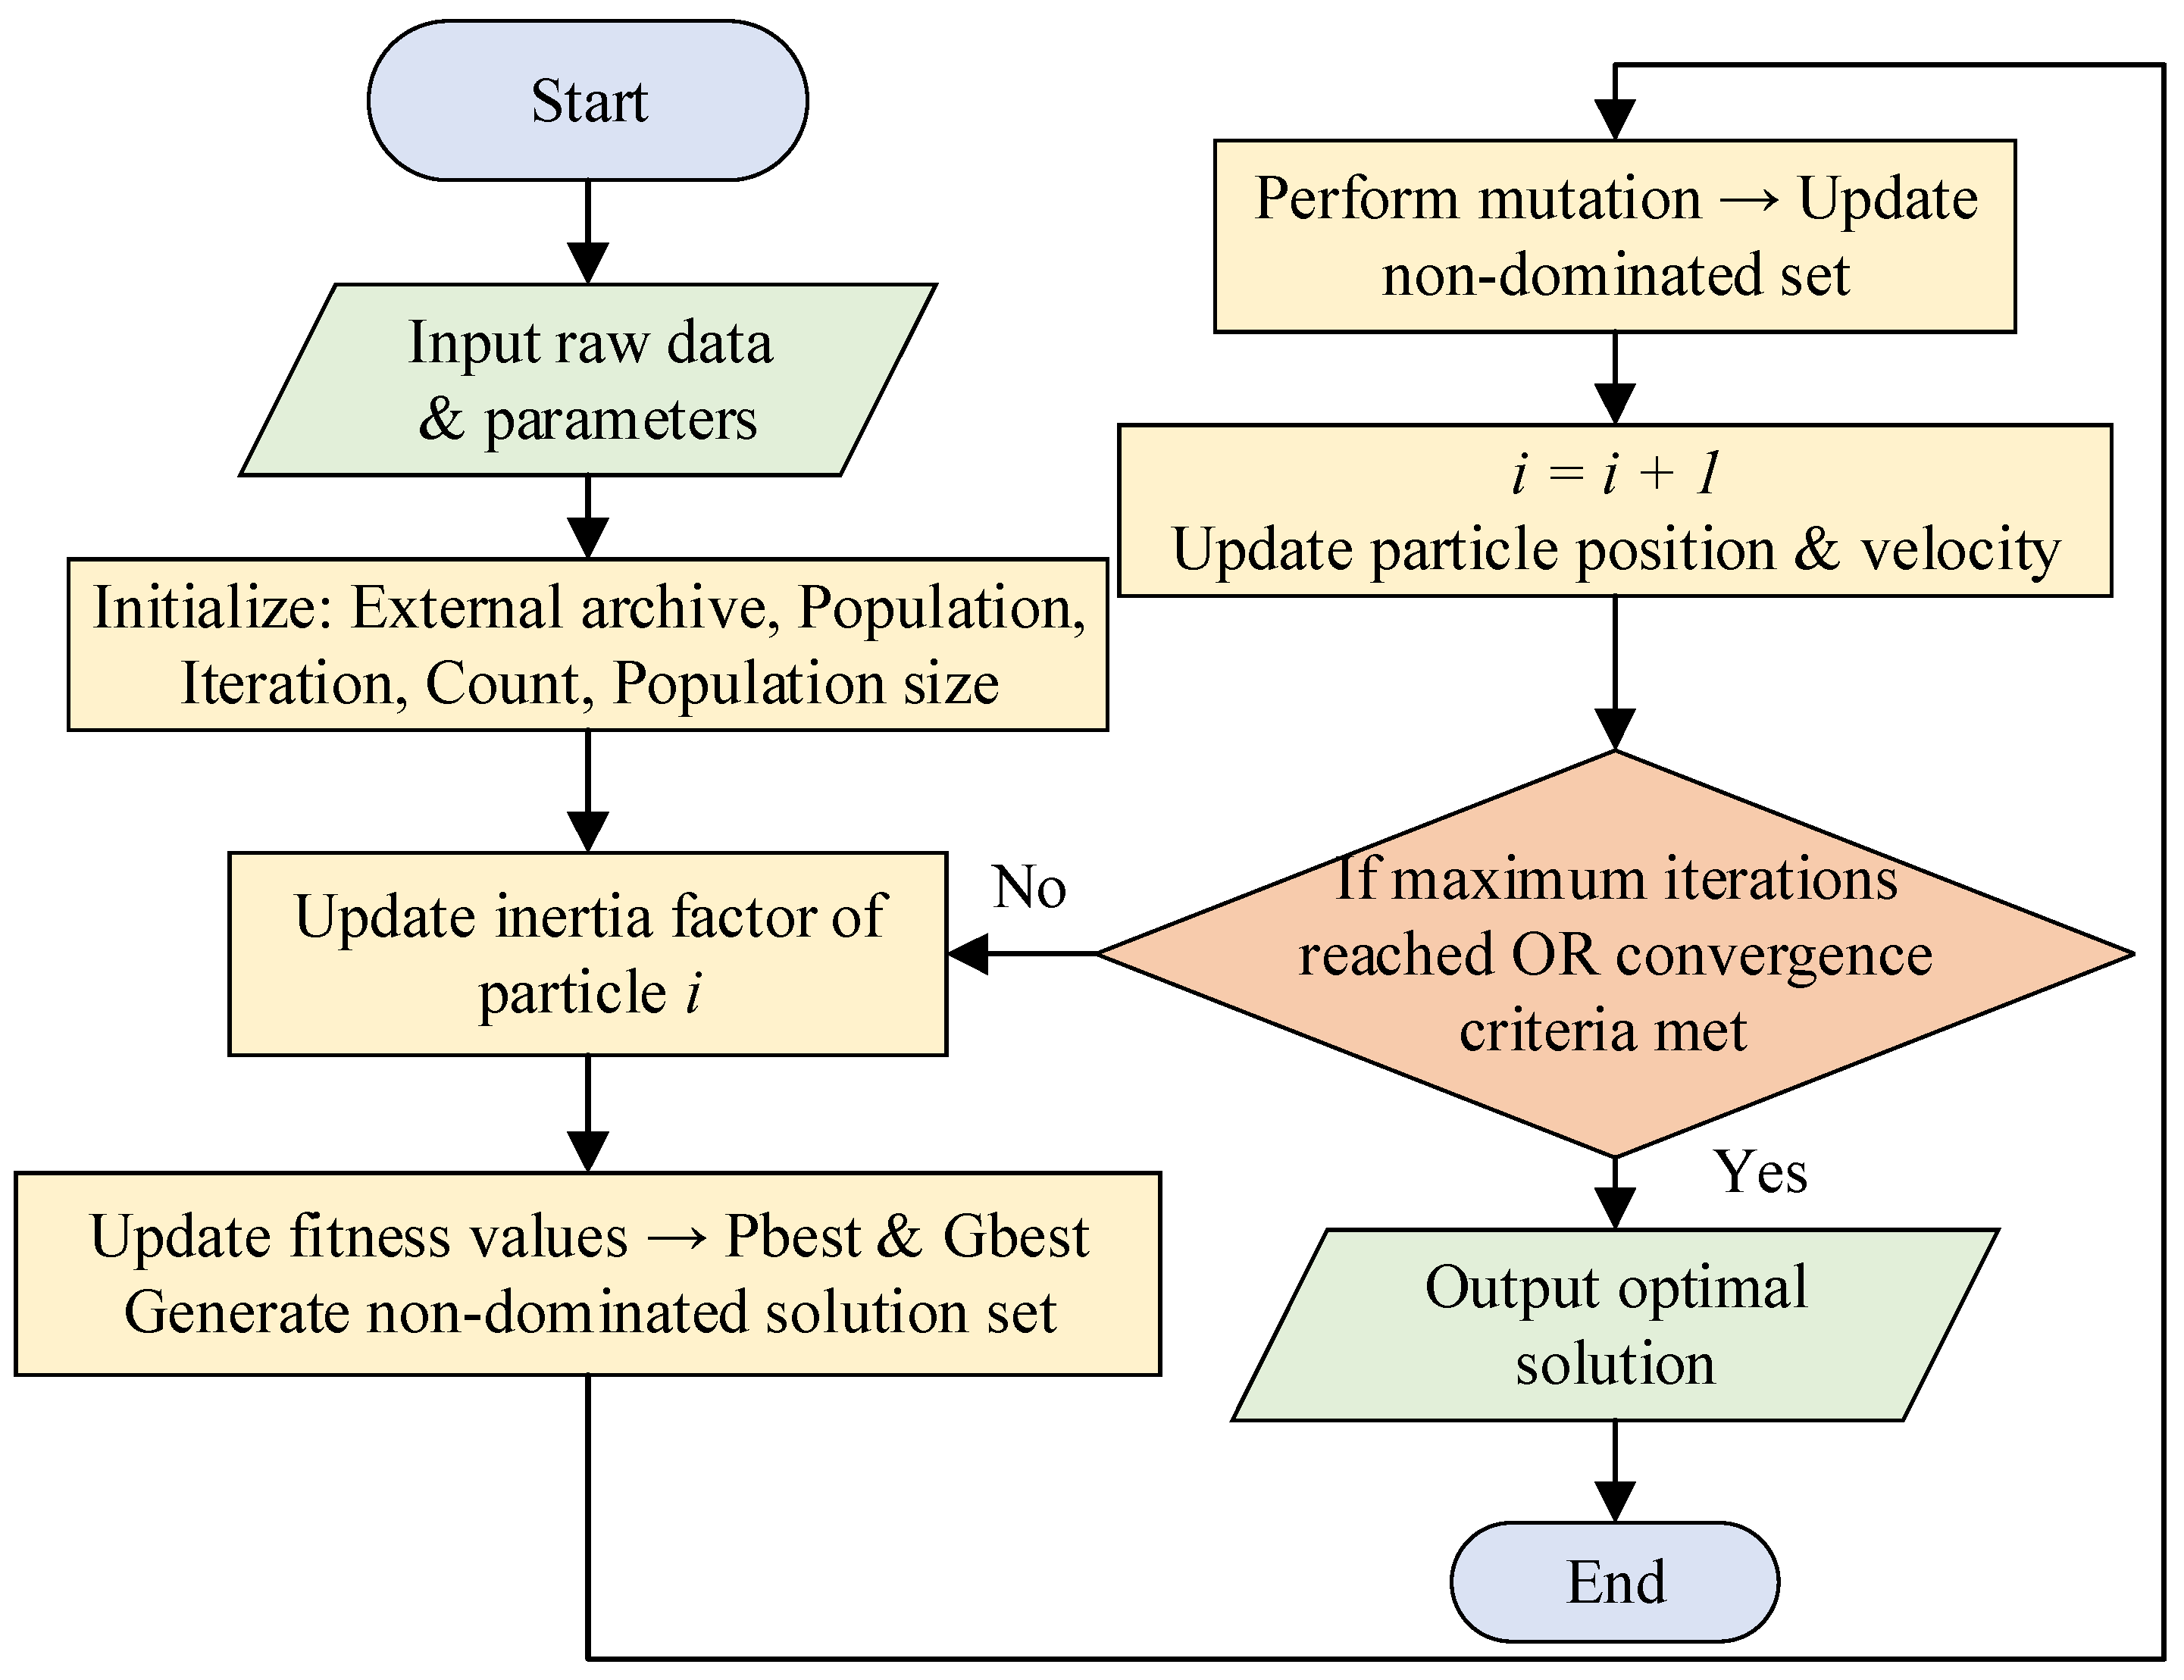
3.2.3. Improved Multi-Objective Particle Swarm Optimization Algorithm(IMOPSO)

To prevent the optimization results from falling into local optima, an adaptive inertia factor and adaptive mutation factor are introduced to improve the multi-objective particle swarm optimization algorithm. The algorithm flowchart is shown in Figure 4. The algorithm solving steps are as follows [37]:
(1) Establish the operation and optimization objective models for the wind-PV off-grid hydrogen production system equipment and set the system-related parameters.
(2) Initialize the population and external archive, set the initial equilibrium point, initial particle positions, and flight velocities, and define their upper and lower bounds; and set the maximum iteration count to 50 and the population size to 100.
(3) Calculate inertia factor i . To avoid local optima, adaptive inertia factor ω self is introduced, expressed as:
ω self = ( M A X i i ) * ( ω max ω min ) M A X i + ω min
where ω max and ω min are the upper and lower bounds of the inertia factor, i is the current iteration number, and MAX i is the maximum iteration count.
(4) Calculate the fitness of each particle, compare to obtain the local and global optimal solutions, and form a non-dominated solution set.
(5) To expand the shrinking search space, an adaptive mutation factor is introduced to mutate the non-dominated solutions. The mutation factor p i is defined as:
p i = ( 1 i 1 MAX i 1 ) 1 v
where v is the mutation rate.
(6) Update and maintain the non-dominated solution set.
(7) Update the particle velocities and positions.
(8) Repeat Steps (3)–(7) until the maximum iteration count is reached, then output the non-dominated solution set.

4. Results and Analysis

4.1. Data Processing

Based on a wind–PV hydrogen production integrated park, the 2019 wind and solar power data from Xinjiang Province, China, were used for a case simulation in the MATLAB software. The specific parameters of each device are listed in Table 4. It is worth noting that the battery employs the Leoch Battery Co., Ltd.-manufactured lead-acid battery from Huaian, China, with the model designation DJM12100S (12 V 100Ah), while the supercapacitor is produced by Shenzhen Jinzhao Times Co., Ltd. in China, with the model number TCPR002R73000W3/S5 (2.7 V 3000F).
To reduce the computational complexity of case simulations, the K-means clustering algorithm was first employed to cluster wind and solar data, representing annual conditions through six typical scenarios multiplied by their respective occurrence days. The corresponding days and probabilities of the six clustered typical days are listed in Table 5, while minute-level wind speed, solar irradiance, and temperature profiles under these scenarios are depicted in Figure 5. Notably, typical days 3, 4, and 5 exhibited lower wind and solar resource levels, enabling validation of the proposed method’s effectiveness under diverse renewable energy conditions and its ability to withstand consecutive resource shortages. Furthermore, it should be emphasized that since both the batteries and supercapacitors operated effectively at minute-level time scales, a data resolution of 1 min was selected. Simultaneously, considering the disturbance effects of second-level wind and solar fluctuations, minute-level data were averaged as baselines, with random noise introduced to generate second-level variations, enabling multi-timescale power optimization for the hybrid energy storage wind–solar off-grid hydrogen production system.
To verify the superior effectiveness of the proposed method compared to traditional fixed-rule power allocation approaches, four schemes were set up for comparison:
Scheme 1: a traditional strategy requiring the electrolyzer to operate above 0 . 2 P N ;
Scheme 2: the strategy described in Reference [16], which requires the electrolyzer to operate above 0 . 4 P N ;
Scheme 3: the strategy described in Reference [18], which requires the electrolyzer to operate at P N ;
Scheme 4: the two-stage coordinated power optimization strategy proposed in this paper.
Among these four schemes, the first three were traditional power allocation rules that only considered simple interactions between the upper/lower limits of the electrolyzer and energy storage constraints, while the fourth scheme incorporated deep interactions between the electrolyzer’s multiple operational modes and the energy storage’s preparatory energy status, along with intelligent algorithms for power optimization. The performance indicators of the four schemes are listed in Table 6.

4.2. Simulation Results and Analysis

As shown in Table 6, Scheme 1 had the fewest annual shutdowns and the highest average hydrogen production efficiency, but it also exhibited the highest average hydrogen production power fluctuations, power shortage rate, wind and solar curtailment rate, as well as the highest unit hydrogen production cost. This was because in Scheme 1, energy storage discharged only when wind–solar generation could not meet the lower power limit of the electrolyzer and did not supply power to the electrolyzer at other times. While this allowed the energy storage to retain sufficient energy to avoid electrolyzer shutdowns, it also led to significant power shortages, low hydrogen output, poor hydrogen production stability, and, consequently, high unit hydrogen production costs. Additionally, the inability to store surplus power resulted in high wind and solar curtailment rates. Similarly, in Scheme 2, energy storage discharged only when wind–solar generation could not meet the optimal hydrogen production power of the electrolyzer, resulting in a high power shortage rate, relatively few shutdowns, and a high unit hydrogen production cost. Scheme 3 treated the electrolyzer as a constant-power load; when wind–solar generation could not meet the rated hydrogen demand, energy storage discharged to supplement the electrolyzer’s power. This achieved the lowest power shortage rate as we as a higher hydrogen output and lower unit hydrogen production cost. However, since it did not reserve energy for storage, the energy storage frequently failed to discharge due to insufficient energy, leading to the lowest average SOC of the battery and the worst ability to handle annual extreme operating conditions, with the highest shutdown count. When the reserved energy of hybrid energy storage in Scheme 4 became insufficient, power allocation was executed based on electrolyzer operating conditions during power deficits, achieving both operational improvement and differentiated energy reservation strategies: during non-ideal hydrogen production modes, storage discharged minimally to elevate electrolyzers to better operational states while retaining limited reserves, whereas under ideal hydrogen production conditions with power deficits, storage preserved maximal energy by abstaining from discharge to address potential future extreme conditions. Consequently, Scheme 4 demonstrated superior capability in mitigating adverse operational scenarios. This explains why Scheme 4 reduced annual system shutdown incidents by 70.14% compared with Scheme 3. Furthermore, the second-stage optimization targeting battery SOC health maintenance ensured that the average battery SOC most closely approximated its initial value of 0.5.
The results also indicate that Scheme 4 achieved 52.41% and 43.51% lower power deficit rates than Schemes 1 and 2, respectively. This stemmed from Scheme 4’s dynamic electrolyzer power command determination mechanism that considered both storage reserve adequacy and deficit severity—permitting full-rated power operation when reserves sufficed while progressively improving suboptimal modes through power adjustments within the 0 . 5 P N to P N range when reserves became depleted. In contrast, Schemes 1 and 2 employed fixed electrolyzer power thresholds ( 0 . 2 P N and 0 . 4 P N respectively) during deficits, resulting in chronically elevated deficit rates. By maintaining electrolyzer operation predominantly within high-efficiency zones (high-rate and medium-rate hydrogen production intervals), Scheme 4 achieved 7.94% higher average hydrogen production efficiency than Scheme 3. The combined advantages of reduced power deficits and enhanced efficiency enabled Scheme 4 to produce 22.67%, 14.09%, and 0.71% more hydrogen than the three benchmark schemes respectively. With unchanged total system costs, this translated to 17.98%, 11.63%, and 0.74% reductions in unit hydrogen production costs compared to previous schemes. Moreover, Scheme 4 exhibited minimal hydrogen power fluctuation (59.22%, 48.72%, and 8.17% lower than comparative schemes), demonstrating optimal stability. This stability originated from adaptive energy reservation strategies where superior operational conditions (lower deficits) triggered increased storage reservation and reduced discharge, thereby narrowing inter-temporal power variations. Figure 6 illustrates these operational characteristics through minute-level and localized second-level power profiles of a single 10 kW-rated electrolyzer across schemes. While Schemes 1 and 2 maintained electrolyzer operation between 0 . 2 P N 1 . 2 P N and 0 . 4 P N 1 . 2 P N , respectively (ensuring reliability but suffering excessive fluctuations), Scheme 3’s 0– 1 . 2 P N operation incurred frequent shutdowns with compromised stability. Scheme 4’s predominant 0 . 5 P N 1 . 2 P N operation combined minimal shutdowns, low deficit rates, and optimal stability-reliability balance. Notably, this methodology demonstrated consistent temporal scalability, with identical variation patterns observed across minute-level and second-level electrolyzer operations.
The SOC profiles of batteries and supercapacitors under four schemes across six typical days are illustrated in Figure 7 and Figure 8, respectively. As shown in the figures, Schemes 1 and 2 maintained relatively stable battery SOC during the initial operational periods, but the SOC approached the lower limit of 0.1 in later periods under sustained power deficits, resulting in complete loss of discharge capability. The supercapacitor SOC in both schemes frequently reached the upper limit of 0.9, indicating poor charging flexibility. Scheme 3 demonstrated the worst energy storage performance, with battery SOC persistently near 0.1 throughout the operational period and supercapacitor SOC repeatedly hitting the lower limit. This occurred because continuous discharge during renewable generation shortages forced deep discharge cycles, compromising resilience to harsh electrolyzer conditions despite maintaining charging capability. In contrast, Scheme 4 exhibited optimal performance: battery SOC remained well above the 0.1 lower limit, while supercapacitor SOC fluctuated healthily between 0.1 and 0.9, ensuring full-range charge–discharge capability. This superiority stemmed from Scheme 4’s adaptive energy reservation strategy—when storage reserves were insufficient (SOC ≤ 0.5), discharge quantities were strictly controlled to prevent electrolyzer operation from degrading into high-efficiency low-speed or prohibited modes, thereby maintaining SOC near the optimal 0.5 baseline.
Furthermore, typical days 3, 4, and 5 with low renewable resource levels validated the proposed strategy’s effectiveness in terms of handling prolonged extreme weather conditions. Renewable energy curtailment profiles under four schemes across six typical days are shown in Figure 9. Schemes 1 and 2 exhibited persistently high curtailment due to fixed electrolyzer power commands ( 0 . 2 P N and 0 . 4 P N respectively) during deficits, which restricted energy storage discharge capacity and prevented surplus renewable absorption. In contrast, Schemes 3 and 4 achieved significant curtailment reduction, with near-zero curtailment during most periods. Scheme 3’s improved performance originated from its higher fixed power command ( P N ), enabling timely energy release and surplus absorption. Scheme 4 further optimized this through dynamic power command adjustments between 0.5 P N and P N based on storage reserve levels: abundant reserves permitted greater discharge capacity during deficits while maintaining sufficient charging headroom for surplus renewable utilization.

4.3. Stability Verification of Case Study Results

Utilizing wind and solar historical data from a northwestern Chinese province in 2019, 365 daily experiments were conducted under four schemes, with a confidence level set at 95%. The confidence intervals for performance metrics across all four schemes are detailed in Table 7. The results demonstrate robust stability of all metrics across the four schemes, which validated the reliability of the six typical day-based outcomes presented in Section 4.2.

5. Discussion

The two-stage collaborative power optimization method proposed in this paper, which combines rule-based power allocation with intelligent algorithm optimization, enhances both the interpretability and global optimality of power distribution. This method is applicable to renewable energy off-grid hydrogen production systems employing hybrid energy storage, where the first stage determines electrolyzer power commands and initial hybrid storage power allocation, while the second stage further optimizes hybrid storage power distribution. However, the method still exhibits the following limitations:
(1) The case study simulations utilized wind and solar historical data from a northwestern Chinese province in 2019, without accounting for potential changes in renewable data patterns in recent years. Practical engineering applications of this method must incorporate multi-factor forecasting of wind and solar data.
(2) While addressing deficiencies in fixed-rule power allocation through intelligent optimization algorithms, the case study simulations only validated the proposed method’s improvements over traditional rule-based approaches, lacking comparative analyses with other methodologies such as machine learning-based or integer programming-based power optimization techniques. Future research will investigate the effectiveness of alternative power optimization approaches.

6. Conclusions

This paper proposes a two-stage collaborative power optimization method for wind–solar off-grid hydrogen production systems considering energy storage reserve capacity, demonstrating superior performance compared to traditional rule-based allocation approaches. The key conclusions are as follows:
(1) The proposed method enhanced hydrogen production stability. The first-stage power allocation rules enabled flexible adjustment of electrolyzer power commands between 0.5 P N and P N based on storage reserve adequacy and power-deficit operating conditions. Compared to fixed power command strategies at 0.2 P N , 0.4 P N , and P N , this approach reduced average hydrogen power fluctuations by 59.22%, 48.72%, and 0.08% respectively.
(2) The first-stage rules, allowing electrolyzer power commands to fluctuate between 0.5 P N and P N , increased hydrogen yield while reducing unit production costs. Compared to fixed hydrogen production commands at 0.2 P N and 0.4 P N , the proposed method decreased power deficit rates by 52.41% and 43.51%, thereby boosting hydrogen output by 22.67% and 14.09% respectively. With constant construction costs, unit hydrogen production costs were reduced by 17.98% and 11.63%.
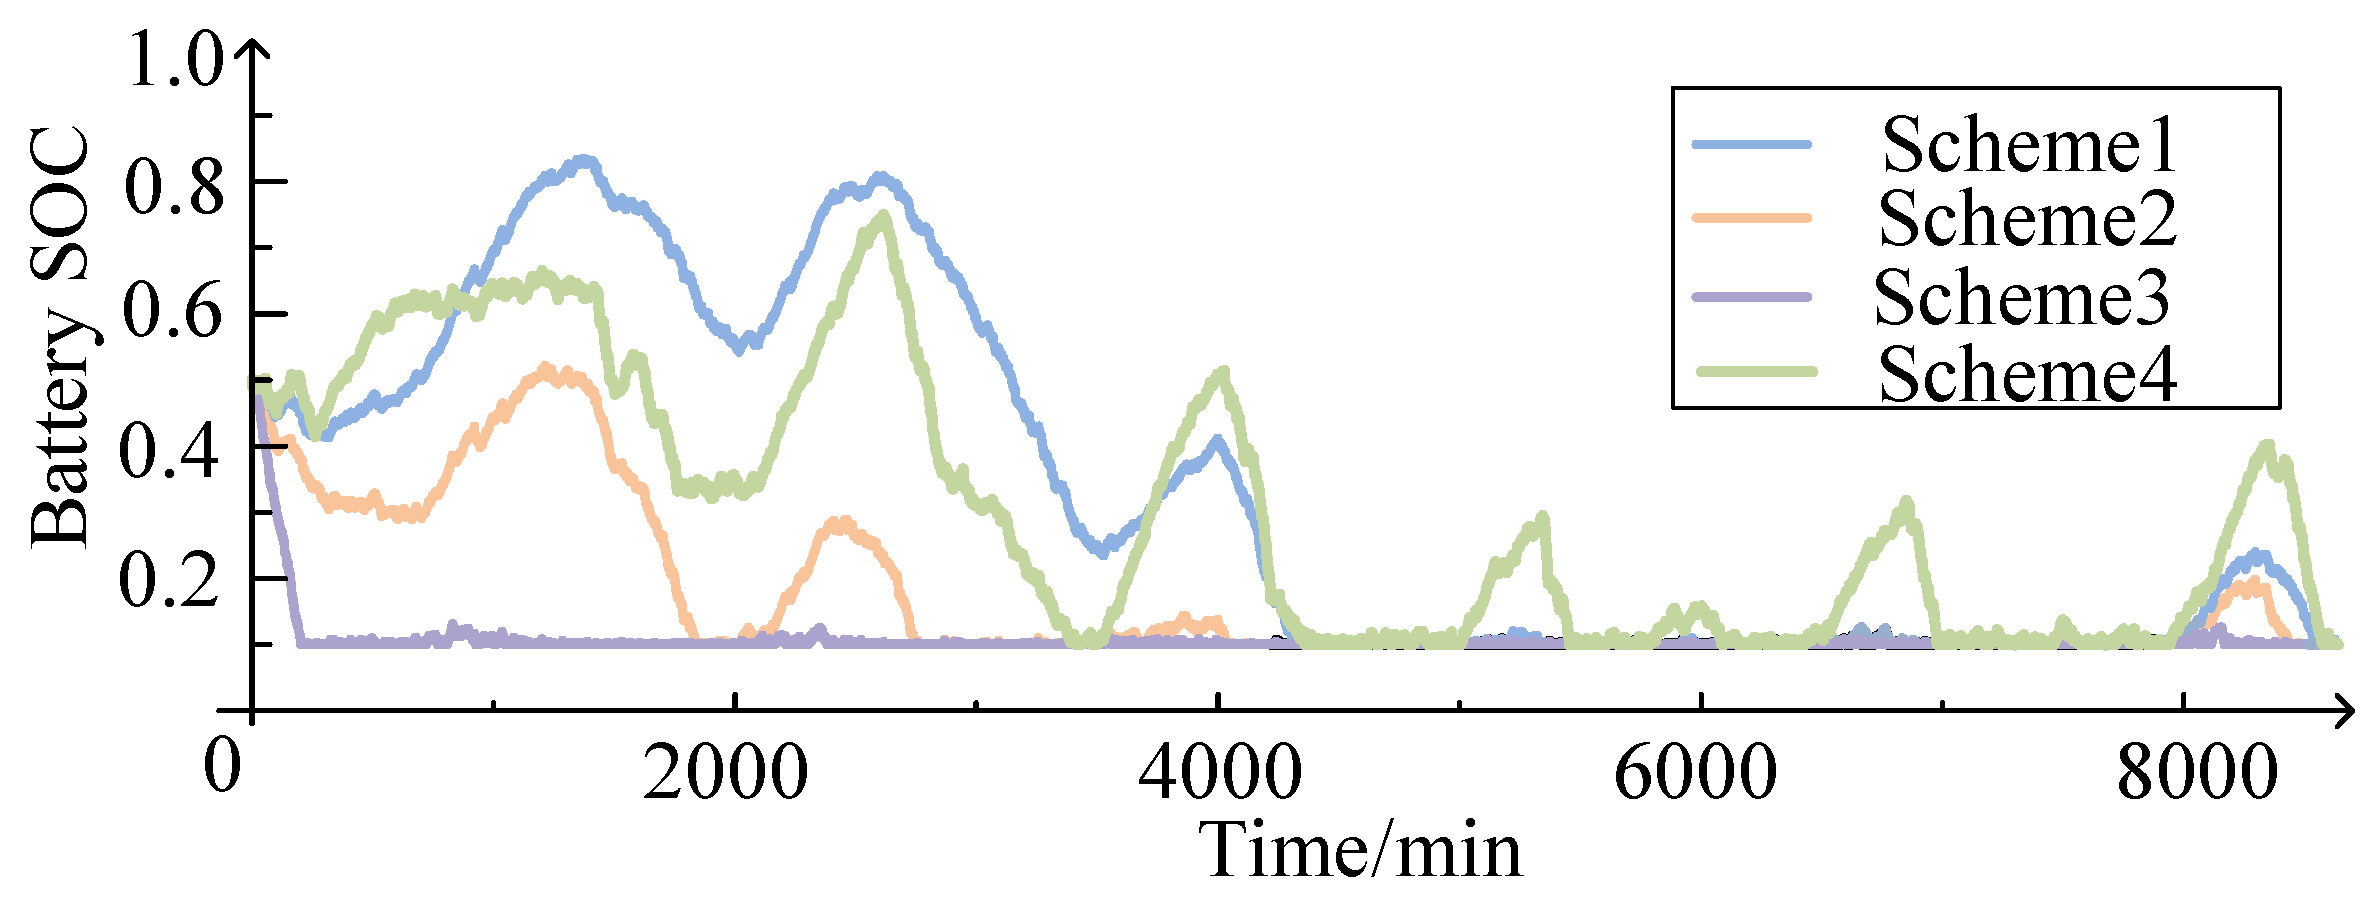
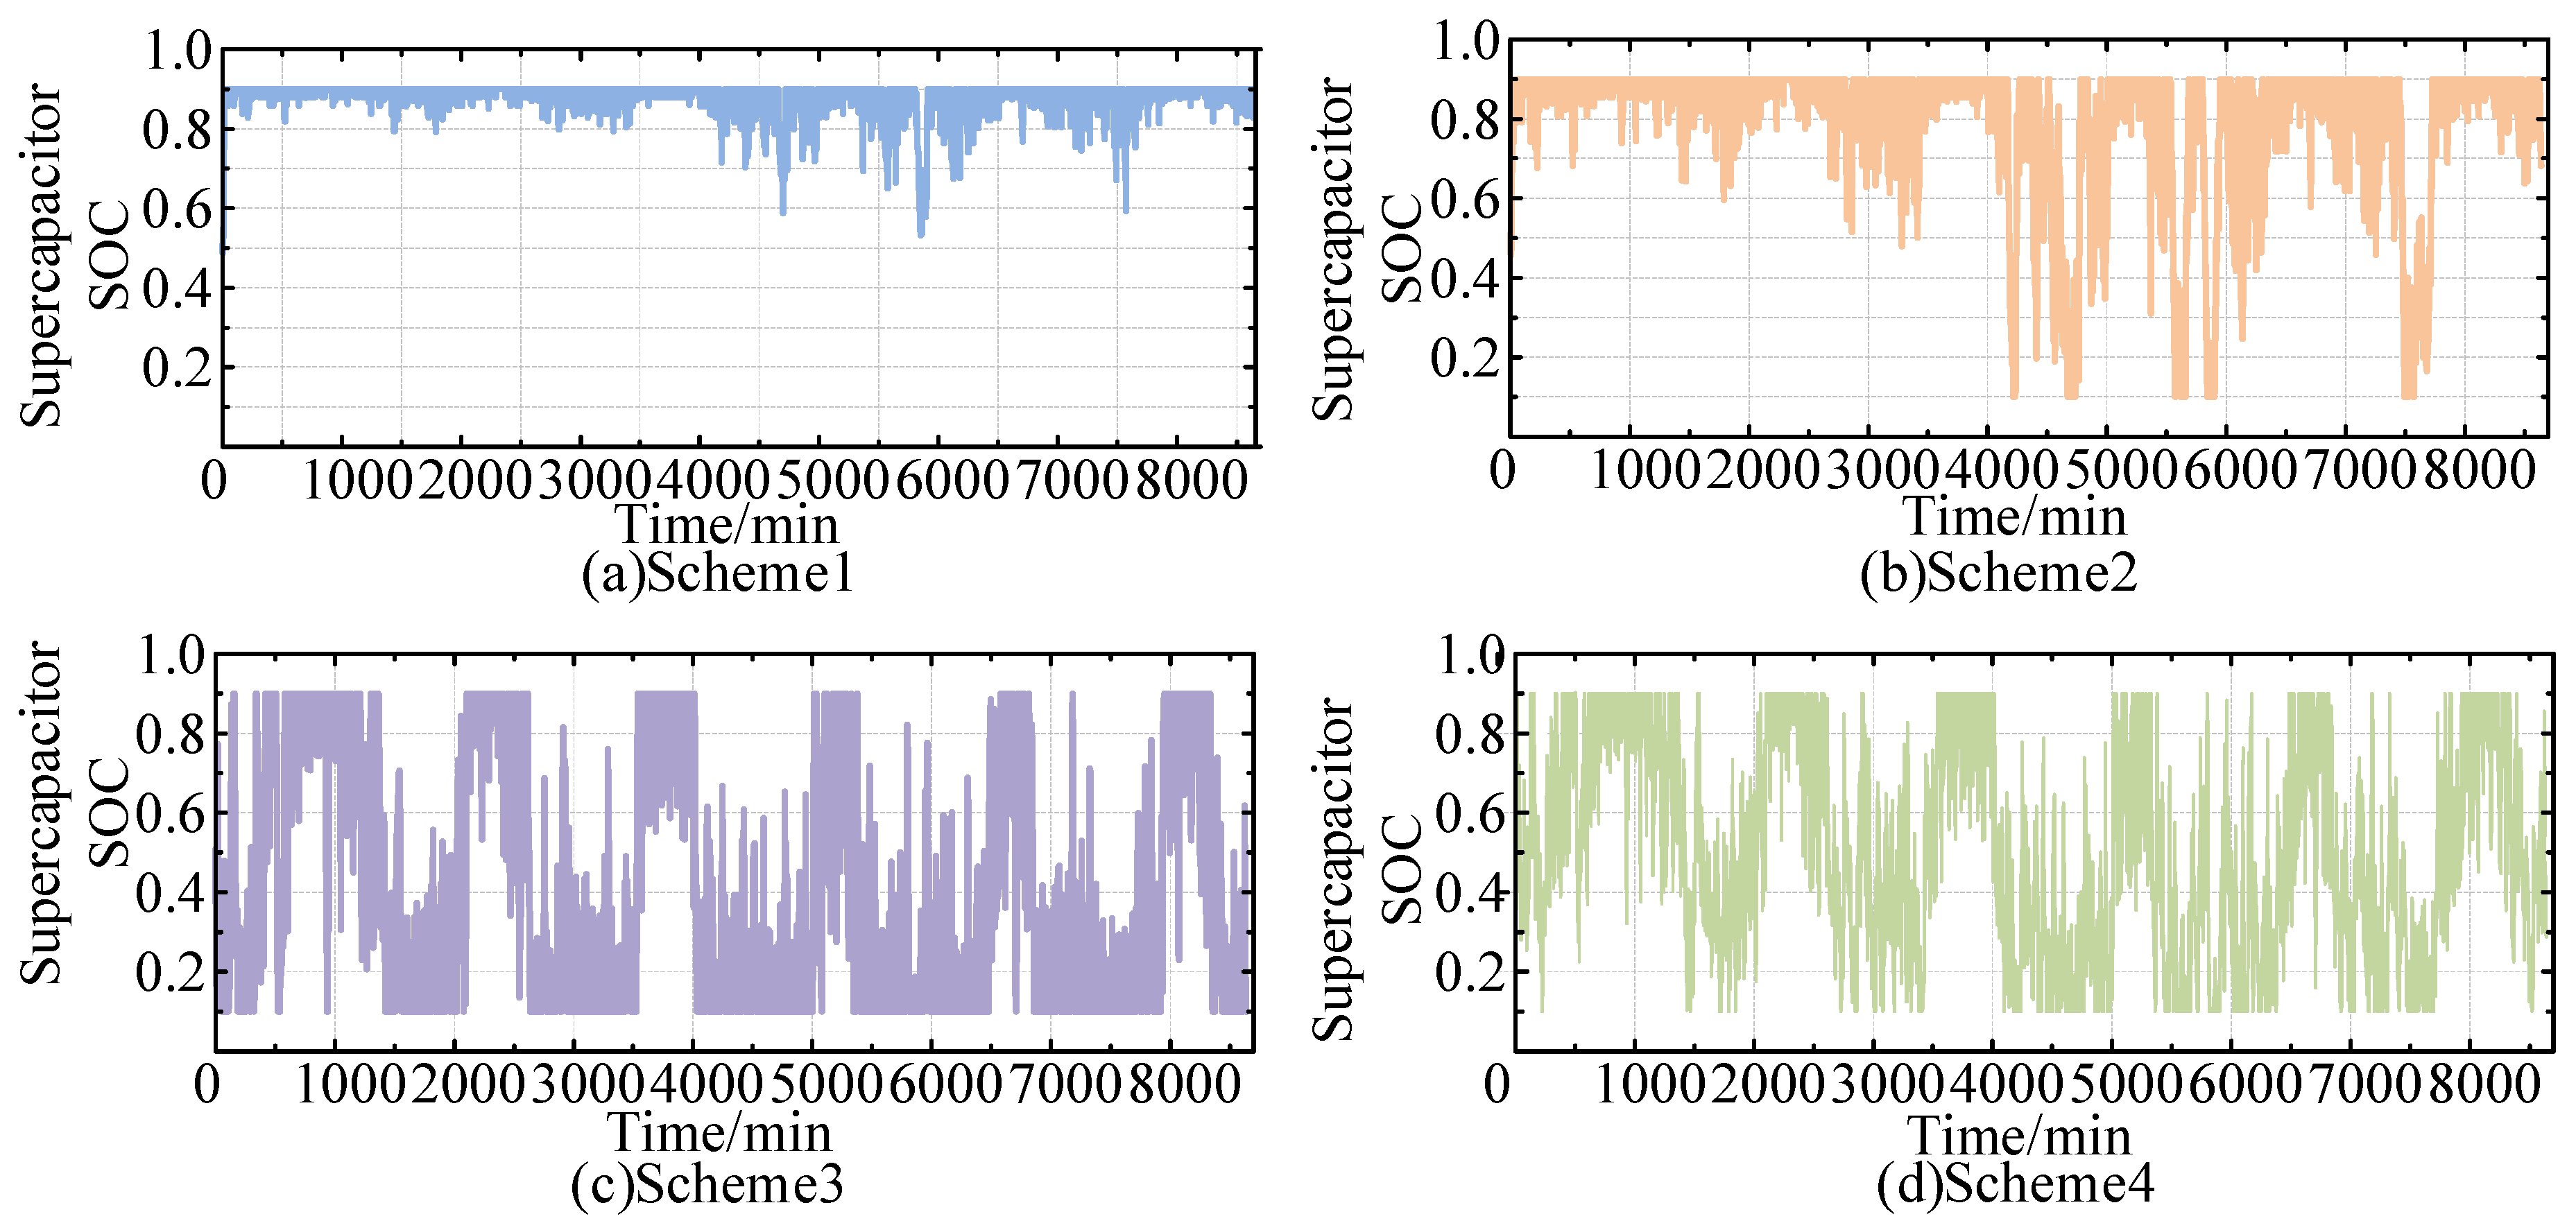
(3) The method improved energy storage charging/discharge capabilities, thereby enhancing hydrogen production safety and reducing renewable energy curtailment. The first-stage rules for reserve storage energy were as follows: When SOC fell below 0.5, additional reserves were maintained for future adverse conditions; above 0.5, no reserves were preserved. The second stage employed an enhanced multi-objective particle swarm optimization algorithm to optimize battery SOC, resulting in smaller deviations from the initial 0.5 SOC and enhanced charge–discharge flexibility compared to conventional methods. Improved discharge capability reduced annual system shutdowns by 70.14% compared to fixed power command P N , while enhanced charging capacity decreased renewable curtailment rates by 62.10% and 53.40% versus fixed commands 0.2 P N and 0.4 P N .
In conclusion, this work presents an innovative solution to power allocation challenges in renewable-powered off-grid hydrogen systems, providing theoretical foundations for engineering high-volatility renewable hydrogen systems. Future research will explore machine learning-based power optimization methods and integrate probabilistic renewable power forecasting to enhance optimization foresight, advancing renewable hydrogen technology toward commercial viability.

Author Contributions

Conceptualization, Q.L.; methodology, Q.L.; software, H.Z.; validation, S.Y., Q.L. and H.Z.; supervision, Y.G.; funding acquisition, Y.G. All authors have read and agreed to the published version of the manuscript.

Funding

This research was funded the Graduate Innovation Program of China University of Mining and Technology (2025WLJCRCZL327) and Jiangsu Province Postgraduate Practice and Innovation Program (SJCX25_1441).

Data Availability Statement

The original data presented in the study are openly available in GitHub at URL: https:github.com/liuqiTS23230124P31/4strategies (accessed on 28 May 2025).

Conflicts of Interest

The authors declare no conflicts of interest.

Abbreviations

The following abbreviations are used in this manuscript:
ESSEnergy Storage Systems
HESSHybrid Energy Storage Systems
HIMESHydrogen-integrated Multi-energy System
SOCState of Charge
IMOPSOImproved Multi-Objective Particle Swarm Optimization
DODDepth of Discharge
PVPhotovoltaic

References

  1. Pan, G.; Gu, W.; Lu, Y.; Qiu, H.; Lu, S.; Yao, S. Optimal Planning for Electricity-Hydrogen Integrated Energy System Considering Power to Hydrogen and Heat and Seasonal Storage. IEEE Trans. Sustain. Energy 2020, 11, 2662–2676. [Google Scholar] [CrossRef]
  2. Niu, M.; Li, X.; Sun, C.; Xiu, X.; Wang, Y.; Hu, M.; Dong, H. Operation Optimization of Wind/Battery Storage/Alkaline Electrolyzer System Considering Dynamic Hydrogen Production Efficiency. Energies 2023, 16, 6132. [Google Scholar] [CrossRef]
  3. Zhao, H.; Xu, J.; Xu, K.; Sun, J.; Wang, Y. Optimal Allocation Method of Source and Storage Capacity of PV-Hydrogen Zero Carbon Emission Microgrid Considering the Usage Cost of Energy Storage Equipment. Energies 2022, 15, 4916. [Google Scholar] [CrossRef]
  4. Khalilnejad, A.; Sundararajan, A.; Sarwat, A.I. Optimal design of hybrid wind/photovoltaic electrolyzer for maximum hydrogen production using imperialist competitive algorithm. J. Mod. Power Syst. Clean Energy 2018, 6, 40–49. [Google Scholar] [CrossRef]
  5. Naseri, N.; El Hani, S.; Machmoum, M.; Elbouchikhi, E.; Daghouri, A. Energy Management Strategy for a Net Zero Emission Islanded Photovoltaic Microgrid-Based Green Hydrogen System. Energies 2024, 17, 2111. [Google Scholar] [CrossRef]
  6. Li, D.; Qian, K.; Gao, C.; Xu, Y.; Xing, Q.; Wang, Z. Research on Electric Hydrogen Hybrid Storage Operation Strategy for Wind Power Fluctuation Suppression. Energies 2024, 17, 5019. [Google Scholar] [CrossRef]
  7. Li, J.; Lin, J.; Zhang, H.; Song, Y.; Chen, G.; Ding, L.; Liang, D. Optimal Investment of Electrolyzers and Seasonal Storages in Hydrogen Supply Chains Incorporated with Renewable Electric Networks. IEEE Trans. Sustain. Energy 2020, 11, 1773–1784. [Google Scholar] [CrossRef]
  8. Zhou, Y.; Zhai, Q.; Xu, Z.; Wu, L.; Guan, X. Multi-Stage Adaptive Stochastic-Robust Scheduling Method with Affine Decision Policies for Hydrogen-Based Multi-Energy Microgrid. IEEE Trans. Smart Grid 2024, 15, 2738–2750. [Google Scholar] [CrossRef]
  9. Cao, X.; Cao, T.; Xu, Z.; Zeng, B.; Gao, F.; Guan, X. Resilience Constrained Scheduling of Mobile Emergency Resources in Electricity-Hydrogen Distribution Network. IEEE Trans. Sustain. Energy 2023, 14, 1269–1284. [Google Scholar] [CrossRef]
  10. Shchegolkov, A.V.; Zemtsova, N.V.; Stanishevskiy, Y.M.; Stanishevskiy, Y.M.; Vetcher, A.A. Recent Advantages on Waste Management in Hydrogen Industry. Polymers 2022, 14, 4992. [Google Scholar] [CrossRef]
  11. Li, T.; Gao, F.; Huangfu, Y. Biological Hydrogen Production: A Comprehensive Review for Converting Wastes into Wealth. Chin. J. Electr. Eng. 2024, 10, 110–134. [Google Scholar] [CrossRef]
  12. Meng, X.; Chen, M.; He, M.; Wang, X.; Liu, J. A Novel High Power Hybrid Rectifier with Low Cost and High Grid Current Quality for Improved Efficiency of Electrolytic Hydrogen Production. IEEE Trans. Power Electron. 2022, 37, 3763–3768. [Google Scholar] [CrossRef]
  13. Guo, Y.; Liu, J.; Xie, P.; Qin, G.; Zhang, Q.; Sun, H. Research on Coordinated Control of Power Distribution in Hydrogen-Containing Energy Storage Microgrids. Energies 2025, 18, 831. [Google Scholar] [CrossRef]
  14. Yu, L.; Yue, D.; Chen, Z.; Zhang, S.; Xu, Z.; Guan, X. Online Operation Optimization for Hydrogen-Based Building Energy Systems Under Uncertainties. IEEE Trans. Smart Grid 2024, 15, 4589–4601. [Google Scholar] [CrossRef]
  15. Wen, T.; Zhang, Z.; Lin, X.; Li, Z.; Chen, C.; Wang, Z. Research on Modeling and the Operation Strategy of a Hydrogen-Battery Hybrid Energy Storage System for Flexible Wind Farm Grid-Connection. IEEE Access 2020, 8, 79347–79356. [Google Scholar] [CrossRef]
  16. Zhu, M.; Fang, J.; Ai, X.; Cui, S.; Zhong, Z.; Wen, J. Real-Time Energy Management of Hydrogen Energy Hub-Based Industrial Integrated Energy Distribution System. IEEE Trans. Ind. Appl. 2025, 61, 1779–1789. [Google Scholar] [CrossRef]
  17. Duan, J.; Li, Y.; Li, Y.; Yang, P.; Zeng, Z. Statistical Feasibility Robust Optimization with Polyhedron Uncertainty Set for Hydrogen-Data Center Microgrid Operations. IEEE Trans. Autom. Sci. Eng. 2025, 22, 9884–9902. [Google Scholar] [CrossRef]
  18. Zhang, X. Optimisation strategy of off-grid wind and solar hydrogen production system based on reinforcement learning. In Proceedings of the 2024 6th International Conference on Energy, Power and Grid (ICEPG), Guangzhou, China, 27–29 September 2024. [Google Scholar] [CrossRef]
  19. Wu, Z.; Li, Y.; He, J.; Li, B. Modelling and Start-up Coordinated Control Strategy for an Off-grid Photovoltaic/Hydrogen/Battery Hybrid System. In Proceedings of the 2024 IEEE 2nd International Conference on Power Science and Technology (ICPST), Dali, China, 9–11 May 2024. [Google Scholar] [CrossRef]
  20. Cui, K.; Yang, S.; Gong, J.; Sun, T.; Shi, G.; Yu, Z. Capacity optimization configuration and economic analysis of off-grid type wind-photovoltaic-hydropower-hydrogen energy coupling system. In Proceedings of the 2024 6th International Conference on Energy, Power and Grid (ICEPG), Guangzhou, China, 27–29 September 2024. [Google Scholar] [CrossRef]
  21. Tang, Y.; Yang, H. A Hierarchical Energy Management Framework for Power and Hydrogen Flows in Photovoltaic Microgrids with Hybrid Energy Storage Systems. In Proceedings of the 2023 IEEE 14th International Symposium on Power Electronics for Distributed Generation Systems (PEDG), Shanghai, China, 9–12 June 2023. [Google Scholar] [CrossRef]
  22. Jia, D.; Li, H.; Li, Y.; Zhang, H.; Yuan, T. Capacity Aptimization Allocation of Hydrogen Production System for Wind-Solar Complementary Power Generation. In Proceedings of the 2023 International Conference on Smart Electrical Grid and Renewable Energy (SEGRE), Changsha, China, 16–19 June 2023. [Google Scholar] [CrossRef]
  23. Li, S.; Kang, Z. Capacity Optimization of Clean Renewable Energy in Power Grid Considering Low Temperature Environment Constraint. IEEE Access 2022, 10, 2740–2752. [Google Scholar] [CrossRef]
  24. Li, W.; Zou, Y.; Yang, H.; Fu, X.; Li, Z. Two-Stage Stochastic Energy Scheduling for Multi-Energy Rural Microgrids with Irrigation Systems and Biomass Fermentation. IEEE Trans. 2025, 16, 1075–1087. [Google Scholar] [CrossRef]
  25. Li, Q.; Qiu, Y.; Yang, H.; Xu, Y.; Chen, W.; Wang, P. Stability-constrained two-stage robust optimization for integrated hydrogen hybrid energy system. CSEE J. Power Energy Syst. 2020, 7, 162–171. [Google Scholar] [CrossRef]
  26. Fan, F.; Zhang, R.; Xu, Y.; Ren, S. Robustly coordinated operation of an emission-free microgrid with hybrid hydrogen-battery energy storage. CSEE J. Power Energy Syst. 2021, 8, 369–379. [Google Scholar] [CrossRef]
  27. Qiu, Y.; Li, Q.; Ai, Y.; Chen, W.; Benbouzid, M.; Liu, S.; Gao, F. Two-stage distributionally robust optimization-based coordinated scheduling of integrated energy system with electricity-hydrogen hybrid energy storage. Prot. Control Mod. Power Syst. 2023, 8, 1–14. [Google Scholar] [CrossRef]
  28. Kong, W.; Sun, K.; Zhao, J. Two-stage Optimal Scheduling of Community Integrated Energy System Considering Operation Sequences of Hydrogen Energy Storage Systems. J. Mod. Power Syst. Clean Energy 2024, 13, 276–288. [Google Scholar] [CrossRef]
  29. Ahmad, S.S.; Almehizia, A.A.; Khalid, M.; Al-Ismail, F.S. Planning and Operation of an Interconnected Energy and Gas System: A Robust Optimization Approach. IEEE Access 2024, 12, 168517–168530. [Google Scholar] [CrossRef]
  30. Yu, L.; Xu, Z.; Guan, X.; Zhao, Q.; Dou, C.; Yue, D. Joint Optimization and Learning Approach for Smart Operation of Hydrogen-Based Building Energy Systems. IEEE Trans. Smart Grid 2023, 14, 199–216. [Google Scholar] [CrossRef]
  31. Zeng, Y.; Zhang, Q.; You, S.; Liu, Y.; Iu, H.H.C.; Guo, H.; Liu, S. Bilayered Real-Time Energy Management Strategy for Hybrid Power Systems in Hydrogen Fuel Cell Vessels. IEEE Trans. Transp. Electrif. 2024, 10, 7954–7970. [Google Scholar] [CrossRef]
  32. Li, X.; Hu, C.; Luo, S.; Lu, H.; Piao, Z.; Jing, L. Distributed Hybrid-Triggered Observer-Based Secondary Control of Multi-Bus DC Microgrids Over Directed Networks. IEEE Trans. Circuits Syst. I Regul. Pap. 2025, 72, 2467–2480. [Google Scholar] [CrossRef]
  33. Liao, X.; Lei, R.; Ouyang, S.; Huang, W. Capacity Optimization Allocation of Multi-Energy-Coupled Integrated Energy System Based on Energy Storage Priority Strategy. Energies 2024, 17, 5261. [Google Scholar] [CrossRef]
  34. Son, Y.G.; Kim, S.Y.; Bae, I.S. Optimal Coordination of Energy Coupling System Considering Uncertainty of Renewable Energy Sources. Energies 2024, 17, 931. [Google Scholar] [CrossRef]
  35. Winkler, L.M.; Kabza, A.; Danzer, M.A.; Palm, H. Framework for the Multi-Objective Optimization of Hybrid Fuel Cell System Design and Operation. IEEE Access 2024, 12, 191773–191789. [Google Scholar] [CrossRef]
  36. Li, B.; Li, J.; Han, M. Deep Reinforcement Learning-Based Charging Price Determination Considering the Coordinated Operation of Hydrogen Fuel Cell Electric Vehicle, Power Network and Transportation Network. IEEE Access 2023, 11, 75508–75521. [Google Scholar] [CrossRef]
  37. Xu, S.; Ouyang, Z.; Feng, J. An Improved Multi-objective Particle Swarm Optimization. In Proceedings of the 2020 5th International Conference on Computational Intelligence and Applications (ICCIA), Beijing, China, 19–21 June 2020. [Google Scholar] [CrossRef]
Figure 1. Structure diagram of the off-grid hydrogen production system with photovoltaic power generation and wind power generation.
Energies 18 02970 g001
Figure 2. Characteristics diagram of electrolyzer hydrogen production efficiency/rate.
Energies 18 02970 g002
Figure 3. Stage I power allocation rules for wind–solar off-grid hydrogen production system.
Energies 18 02970 g003
Figure 4. Flowchart of the improved multi-objective particle swarm optimization algorithm.
Energies 18 02970 g004
Figure 5. Wind and solar data with one–min resolution under typical scenarios.
Energies 18 02970 g005
Figure 6. Hydrogen production power of a single electrolyzer under four schemes.
Energies 18 02970 g006
Figure 7. SOC of battery under four schemes.
Energies 18 02970 g007
Figure 8. SOC of supercapacitor under four schemes.
Energies 18 02970 g008
Figure 9. Wind and solar curtailment power under four schemes.
Energies 18 02970 g009
Table 1. Comparative analysis of existing literature.
ReferenceTwo-Stage OptimizationMulti-Method IntegrationStage Task ConsistencyStorage Degradation ConsideredReserved Energy
Allocation
[T]12/ 3/
[21]
[22]
[23]
[24]
[25]
[26]
[27]
1 “✔” indicates that it conforms to the description in the header. 2 “✘” indicates that it does not conform. 3/” indicates that it does not fall under the header category.
Table 2. Initial power allocation rules for hybrid storage charging.
Magnitude of Δ P ( t ) Battery Charging PowerSupercapacitor Charging Power
P bmax + P cmax Δ P ( t ) P bmax P cmax
P bmax < Δ P ( t ) P bmax + P cmax P bmax Δ P ( t ) P bmax
Δ P ( t ) P bmax , Δ P ( t ) P cmax 0 Δ P ( t )
Δ P ( t ) P bmax , Δ P ( t ) > P cmax 0 P cmax
Table 3. Initial power allocation rules for hybrid storage discharging.
SOC ConditionsSOCC ConditionsElectrolyzer Power-Deficiency Operating ConditionElectrolyzer Power CommandParameter Range of Δ P ( t ) Interval Partitioning of Parameter Δ P ( t ) Battery Discharge Power P bd ( t ) Supercapacitator Discharge Power P cd ( t )
>0.5>0.5Any P N Δ P ( t ) P N P bmax + P cmax Δ P ( t ) P bmax P cmax
P bmax < Δ P ( t ) P bmax + P cmax P bmax Δ P ( t ) P bmax
Δ P ( t ) P bmax , Δ P ( t ) P cmax 0 Δ P ( t )
Δ P ( t ) P bmax , Δ P ( t ) P cmax 0 P cmax
>0.5≤0.5Any P N Δ P ( t ) P N Δ P ( t ) P bmax Δ P ( t ) 0
Δ P ( t ) > P bmax P bmax 0
≤0.5>0.5Any P N Δ P ( t ) P N Δ P ( t ) P cmax 0 Δ P ( t )
Δ P ( t ) > P cmax 0 P cmax
≤0.5≤0.5High-efficiency high-speed P fg ( t ) Δ P ( t ) 0.5 P N P bmax + P cmax Δ P ( t ) P bmax P cmax
High-efficiency medium-speed 0.7 P N P bmax < Δ P ( t ) P bmax + P cmax P bmax Δ P ( t ) P bmax
High-efficiency low-speed 0.5 P N Δ P ( t ) P bmax , Δ P ( t ) P cmax 0 Δ P ( t )
Prohibited operating 0.5 P N Δ P ( t ) P bmax , Δ P ( t ) P cmax 0 P cmax
Table 4. Parameters of each device in the system.
ParameterValue
PV Installed Capacity (MW)180
Wind Power Installed Capacity (MW)200
Electrolyzer Capacity (MW)180
Hydrogen Storage Tank Capacity (ton)72
Battery Capacity (MWh)66.28
Battery Rated Power (MW)6.63
Supercapacitor Annual O&M Cost Coefficient0.09
PV Investment Cost (10,000 CNY/MW)500
Wind Power Investment Cost (10,000 CNY/MW)400
Electrolyzer Unit Investment Cost (10,000 CNY/MW)250
Hydrogen Storage Tank Unit Investment Cost (10,000 CNY/ton)313.5
Battery Unit Investment Cost (10,000 CNY/MWh)33.33
Supercapacitor Capacity (MWh)23.79
Supercapacitor Rated Power (MW)27,217.37
PV Annual O&M Cost Coefficient0.02
Wind Power Annual O&M Cost Coefficient0.02
Electrolyzer Annual O&M Cost Coefficient0.01
Hydrogen Storage Tank Annual O&M Cost Coefficient0.01
Battery Annual O&M Cost Coefficient0.2
Supercapacitor Unit Investment Cost (10,000 CNY/MWh)8474.58
Project Lifetime (years)20
Table 5. Distribution of different typical scenarios.
Scenario123456
Days13222675472
Probability0.0360.6080.1840.1480.0190.005
Table 6. Comparison of the four schemes.
ParameterScheme1Scheme2Scheme3Scheme4
Unit Hydrogen Production Cost (CNY/kg)30.9328.7125.5625.37
Average SOC of Battery0.270.180.110.33
Average Hydrogen Production Power Fluctuation (%)34.4527.4015.3014.05
Annual Shutdown Count060797238
Average Hydrogen Production Efficiency0.710.700.630.68
Annual Hydrogen Production (ton)18,817.3820,232.9922,920.6223,083.41
Power Shortage Rate (%)31.5626.5914.7815.02
Wind and Solar Curtailment Rate (%)28.3923.0910.4910.76
Table 7. Confidence intervals of performance metrics across four schemes.
ParameterScheme 1Scheme 2Scheme 3Scheme 4
Unit Hydrogen Production Cost (CNY/kg)[28.12, 32.85][25.73, 30.36][22.84, 27.92][21.48, 27.25]
Average Hydrogen Production Power Fluctuation (%)[33.36, 35.86][26.54, 28.17][14.03, 16.82][12.62, 15.39]
Annual Shutdown Count[0, 15][5, 76][17, 928][16, 304]
Average Hydrogen Production Efficiency[0.63, 0.73][0.65, 0.74][0.56, 0.74][0.62, 0.74]
Annual Hydrogen Production (ton)[16,943, 22,025][17,051, 23,232.93][17,464, 25,946][18,246, 259,452]
Power Shortage Rate (%)[23.03, 41.85][19.27, 35.13][4.24, 38.65][3.61, 18.26]
Wind and Solar Curtailment Rate (%)[24.01, 33.83][22.58, 31.64][5.29, 13.85][7.32, 12.49]
Disclaimer/Publisher’s Note: The statements, opinions and data contained in all publications are solely those of the individual author(s) and contributor(s) and not of MDPI and/or the editor(s). MDPI and/or the editor(s) disclaim responsibility for any injury to people or property resulting from any ideas, methods, instructions or products referred to in the content.

