Abstract
AC power cables play an important role in power systems, in the transmission and distribution of electrical energy. For this reason, to ensure high operational reliability, voltage withstand tests and diagnostic tests are performed at every stage of their technical life to determine the condition of cable insulation. Due to the large electrical capacitances of cable systems, modern testing methods use very low frequency (VLF) and damped oscillating (DAC) voltages. The research presented in the article analyzed the effect of the test voltage waveform parameters on the partial discharge (PD) inception conditions in spherical gaseous voids present in the XLPE insulation of AC cable model. Using COMSOL 6.1 and MATLAB R2021b, a coupled electro-thermal model of a 110 kV AC cable was implemented, for which the critical gaseous void dimensions were estimated and phase-resolved PD patterns were generated for the rated voltage and the VLF and DAC test voltages specified in the relevant standards. In the analyses for the rated voltage, the influence of internal temperature distribution, which causes modification of XLPE permittivity, was taken into account in the numerical cable model.
1. Introduction
The high quality of electric power and a reliable, uninterrupted supply of electricity to its industrial, agricultural, municipal, or individual consumers are the main requirements that modern power systems must meet [1,2,3,4,5,6,7]. The structure of these systems includes segments of generation, transmission, and distribution of electricity in which power cables play an important role. Together with overhead lines, they constitute the basic components of electric power transmission and distribution networks operating at different voltage levels. In long-distance transmission systems, Extra High Voltage (EHV) and Ultra High Voltage (UHV) overhead lines are primarily used, both for alternating current (AC) or direct current (DC), but HVDC cable lines are also used in many systems [8,9]. Power cables and cable systems are of great importance and have numerous applications when it is necessary to ensure the following:
- Submarine power transmission and distribution, including long-distance interconnection and reliable transfer of electrical power from offshore wind farms to onshore substations;
- Transmission of high power to city centers;
- Reliable power supply in areas where overhead lines are permanently or periodically exposed to high environmental stresses;
- Distribution of electricity in urban areas, etc.
With the ever-increasing importance of HVDC cable systems [10,11], AC systems still constitute the majority of designed, installed, and operated electric power transmission and distribution systems. AC power cables are used in electrical networks at all voltage levels: from low voltage (LV) through medium and high voltage (MV and HV) to extra high voltage (EHV) networks [12]. The history of AC power cable development, which began in the late 19th century, has led to modern paper- or extruded polymer-insulated cable designs that can be considered technologically mature [13,14]. This results in high operational reliability and a satisfactory long life of cable systems. Modern AC power cable designs, especially those intended for HV and EHV systems, are determined by the current stage of development of insulating materials and technologies used for cable production. Despite their high technical quality, real problems still include various types of contaminants, protrusions, and voids in insulation, as well as different external factors causing the occurrence of combined electro-thermal stresses that determine the activity of extrinsic aging processes [15,16,17,18,19]. As a result of the destructive action of these processes, the electrical strength of the cable insulation gradually decreases and, as a result, its expected lifetime is noticeably reduced [15,20,21]. The most frequently reported causes of faults in power cable systems are cable accessory defects (mainly cable joints and terminations), but different defects of cable main insulation also contribute to the total number of faults [22,23,24,25]. Defects in the insulation of power cables can occur at different stages of their life [26], such as the following:
- During cable manufacturing technological processes;
- During their storage phase;
- During transport and logistic operations accompanying it;
- During technological operations related to cable laying (installation);
- During the operation of the cable, in rated conditions and at stresses exceeding them (e.g., during overheating or transient overvoltages).
For this reason, to ensure the high reliability of cables and cable systems, it is necessary to perform diagnostic tests, in accordance with appropriately established schedules and procedures [27,28]. AC voltage tests of cables, measurements of their dielectric loss factor tgδ, and detection of partial discharge (PD) pulses in off-line conditions, at test voltages of nominal frequency (50 Hz or 60 Hz), require voltage sources with very high apparent power. This results from the fact that power cables are objects with insulation characterized by high electric capacitance (approx. 0.3 μF/km, depending on the type of insulation, rated voltage, and cross-section of the cable core), which results in a large, dominant capacitive component of the current. Due to the power limitations of the mobile test equipment, DC voltage was used for in situ HV voltage tests (Hi-pot tests) of paper-insulated power cables, but in the case of AC cables with extruded XLPE insulation, its use is not recommended. The reason is the undesirable phenomena of space charge accumulation in the volume of the XLPE dielectric occurring at DC voltage, the presence of which dangerously increases the electric field stress after switching on the AC operating voltage [29,30,31]. As a result, this can lead to exceeding the critical stress and breakdown of the cable insulation or initiating the process of its accelerated aging. To eliminate this problem during off-line tests of AC XLPE cables, in modern cable test systems, alternating voltages of different waveform with reduced frequency VLF (Very Low Frequency, usually 0.1 Hz to 0.01 Hz) and damped oscillating voltages DAC (Damped AC) are used [31,32,33,34,35,36,37,38,39,40,41,42,43,44,45,46].
Defects located in the structures of the insulating systems of power cables can have different forms and shapes that directly or indirectly affect the conditions for the initiation and development of dielectric degradation processes. One of the types of defects are gaseous voids present inside a solid dielectric material, which under certain conditions can become sources of PD. Operational experience and laboratory experiment results have shown that both frequency and voltage waveform have an influence on the generation and parameters of PD pulses. This effect has been observed in many studies of various types of electrical insulation and in various dielectric materials [47,48,49,50,51,52,53,54,55,56,57]. The results of numerical simulation analyses of the effect of test voltage and its frequency on selected parameters of PD pulses generated in geometrically well-defined model insulation systems with gaseous defects have also been published [58,59,60].
The paper presents the results of analyses of the PD formation in spherical gaseous voids in cable insulation, taking into account the electric field in the XLPE insulation of an AC cable, subjected to the rated AC voltage and the AC, VLF, and DAC testing voltages. The test voltage parameters were in accordance with the requirements of the relevant standards [31,32,33,34,35]. An 2D electro-thermal model implemented in COMSOL 6.1 and MATLAB R2021b software, developed and verified in previous works [26,61], was used to analyze the phenomena conditioning the inception of PD in cable insulation defects. During the analyses of the XLPE insulation of the selected HVAC cable, the critical dimensions of voids were determined for the rated AC voltage and for each type of test voltage. Numerically generated phase-resolved PD patterns are also presented, created as a response of voids of a specified dimension (500 μm) for each type of the analyzed test voltage. Temperature has an effect on the resistivity and permittivity of XLPE, with the relative changes in resistivity being significantly greater. For the analysis of PD formation conditions at rated voltage, the numerical model of the AC cable took into account the temperature distribution modifying the permittivity of the insulation. The influence of resistivity was verified and finally neglected due to the range of the analyzed test voltage frequencies [44].
2. Testing Voltages Used for PD Simulation in the AC Cable Model
The PD analysis in defects of a 110 kV AC cable model was performed for the rated voltage at different cable core temperatures and for selected test voltages for the unloaded (“cold”) cable. The following four types of test voltage waveforms (Table 1) were considered [31,32,33,34,35]:
- AC 50 Hz;
- VLF 0.1 Hz True-sine;
- VLF 0.1 Hz CR (Cosine-Rectangular);
- DAC 50 Hz.
The VLF 0.1 Hz CR test voltage [31,32,35] was modeled as a near-rectangular bipolar voltage waveform with polarity reversal using a rising or falling half-wave cosine transient (with a base frequency of 50 Hz). For the analysis of PDs generated during the 50 Hz DAC test, the AC cable model was charged to the maximum test voltage specified in accordance with IEEE standards, after which a 50 Hz voltage waveform was initiated, exponentially damped with a time constant of approx. 70 ms. The damping factor Df defined in the IEC and IEEE standards [34,35] is 0.25 in this case.

Table 1.
Parameters of test voltage used for PD tests [31,32,33,34,35].
Table 1.
Parameters of test voltage used for PD tests [31,32,33,34,35].
| Test | AC 50 Hz | VLF 0.1 Hz True-Sine | VLF 0.1 Hz CR | DAC 50 Hz | |
|---|---|---|---|---|---|
| Voltage waveform | 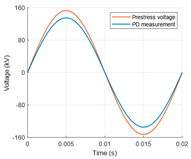 | 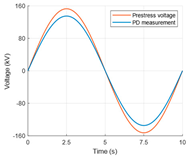 | 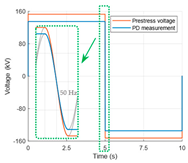 | 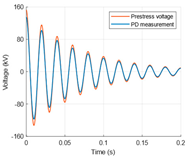 | |
| Pre-stress voltage | Voltage | 1.7 U0 | 1.7 U0 | 1.7 U0 | 1.7 U0 |
| Time | 30/5 min | 30/5 min | 30/5 min | 50/10 excitations | |
| PDEV LL test | Voltage | 1.5 U0 | 1.5 U0 | 1.5 U0 | 1.5 U0 |
| Time | 1 min | 2 min | 2 min | 10 excitations | |
The PD numerical simulations were performed in accordance with the test procedures recommended in the IEEE 400.3 standard [33], used in the acceptance tests of new cable system and for cable accessories. In the first test, the conditions for the occurrence of PD pulses during pre-stressing of the AC cable insulation, i.e., for a higher magnitude of the test voltage, were analyzed. In the second test, the PD pulse simulation procedure was repeated at voltages recommended for the PDEV (PD extinction voltage) lower limit test. In all analyzed cases, the pre-stress voltage was set to 1.7 U0, and the PDEV lower limit test voltage (PDEV LL) was 1.5 U0 (U0—the rms phase-to-ground voltage for tested cable). Due to the high computational complexity of the analyzed cable model with a gaseous void, all analyses were performed for the reduced test duration defined in the standard (duration times in bold in Table 1).
3. Description of the Single-Core AC Cable Model
The subject of the presented analyses was the numerical model of an AC power cable with XLPE insulation, a cable core with a cross-section of 400 mm2 and a rated voltage of 110 kV [62]. Figure 1 shows a proportionally scaled cable cross-section, with individual layers of the modeled cable highlighted in different colors. These numbered layers are named and dimensioned in Table 2. Additionally, Figure 1 shows the radii of the insulating layer, internal (xmin), and external (xmax), as well as the position of two modeled 500 μm gaseous voids, i.e., PD sources intentionally located in the cable insulation)—1st near the cable core and the 2nd near the outer insulation layer radii, close to the semiconducting screen. This study investigates the possibility of PD inception in voids under rated and test voltage conditions and analyzes the PD pulse sequences for both 500 μm voids.
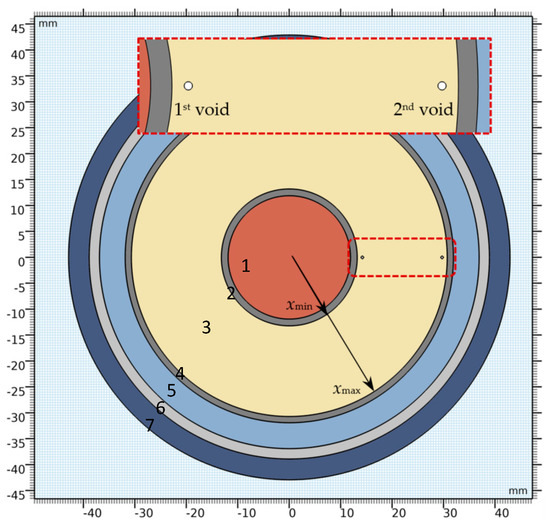
Figure 1.
Geometry of 110 kV AC cable model with two gaseous voids in XLPE insulation.

The thermal parameters for materials of the cable layers used in the simulation are presented in Table 3, while other simulation parameters, including other basic physical properties of materials, are listed in Table 4. The influence of the cable core temperature was analyzed within a range of 10 °C (“cold”, unloaded cable) to 90 °C (“hot”, loaded cable), assuming that the cable is buried in the ground at a temperature of 10 °C.

Table 3.
Basic physical parameters of materials for 110 kV AC cable model [26,61].

Table 4.
Basic simulation parameters for 110 kV AC cable model.
In general, the distribution of the E field strength in the cable insulation system depends on the electric permittivity and resistivity of the dielectrics that compose it. During the preliminary test simulations, it was verified that in the analyzed case of the XLPE insulation of the AC cable, the influence of resistivity on the E field strength distribution is negligible, and it is significant only at lower test voltage frequencies than the analyzed ones. For this reason, only the influence of permittivity on the field distributions was taken into account. The XLPE permittivity varies with temperature, slightly decreasing as the material temperature increases. Values for the relative permittivity of XLPE at a frequency of 50/60 Hz range from approximately 2.1 to 2.45 at 25 °C, decreasing to around 1.85 to 2.2 at the cable maximum operating temperature of 90 °C, as reported in the literature [63,64,65]. Based on our own laboratory measurements of 5 flat XLPE samples of 1 mm thickness, using the Novocontrol Dielectric Parameter Measurement System, the εr(T) characteristic at 50 Hz was determined, then approximated by a linear function and finally used to determine the εr value in the simulation model of the AC cable (Table 4). These data were used to determine the conditions for the formation of PDs in a loaded AC cable with a heated cable core, at a steady thermal state of the insulation.
4. Description and Discussion of Numerical Modeling Results
As indicated, a 2D model of the AC cable was used during the PD simulation to reduce the computational complexity of the numerical procedure and to shorten the total simulation time of the PD pulse sequence. To assess the impact of this model simplification on the numerically estimated values of the E field intensity in the gaseous defects, a comparison of the results for this 2D model with the results for the full 3D model was made for two dimensions of spherical voids, 5 μm and 500 μm, located at the positions defined in Figure 1 and Table 4. In each case, the E field strength in the gaseous void estimated by the 2D model was about 12.7% higher than that estimated by the 3D model. This value is similar (slightly lower) to the comparison results presented in [66], for 2D and 3D models of the HVDC cable. This difference does not have a significant impact on the observed effects of the presence of the temperature field and the changes in permittivity, which modify the PD inception conditions in AC cable.
4.1. Simulation Results for Cable at Rated AC Voltage
Figure 2, Figure 3, Figure 4 and Figure 5 present the results of numerical simulations at different stages of analysis for a cable at rated AC voltage and varying cable core temperature. The cable was analyzed in thermal steady state at core temperatures of 10 °C, 30 °C, 50 °C, 70 °C, and 90 °C.
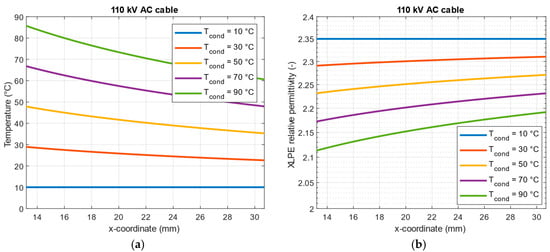
Figure 2.
Distribution of (a) temperature T(x); (b) XLPE relative permittivity ε(x), across the 110 kV AC cable insulation at 10 °C, 30 °C, 50 °C, 70 °C and 90 °C of cable core temperature.
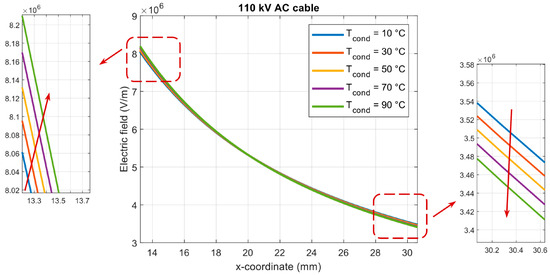
Figure 3.
Distributions of electric field strength E(x) in XLPE insulation along the radius of the 110 kV AC cable model, for cable core temperatures from 10 °C to 90 °C.
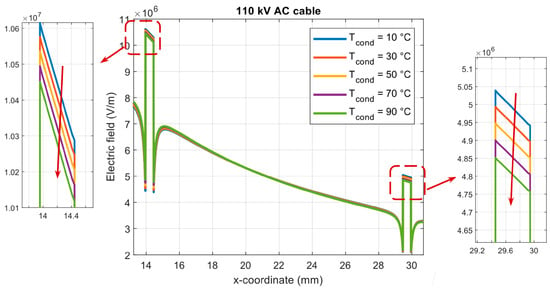
Figure 4.
Distributions of electric field strength E(x) in XLPE insulation along the radius of the 110 kV AC cable model with two 500 μm voids, for cable core temperatures from 10 °C to 90 °C.

Figure 5.
Two-dimensional visualization of electric field strength E [V/m] in XLPE insulation of the 110 kV AC cable model with two 500 μm voids at 90 °C cable core temperature.
An increase in the cable load leads to a rise in core conductor temperature, which in turn causes an increase in insulation temperature (Figure 2a). In the case of a “cold” (unloaded) cable, all cable layers maintain a uniform temperature of 10 °C, equal to the ground temperature. However, a temperature field with a specific gradient is created in a loaded XLPE insulated cable. Since the cable core is the heat source, the insulation areas closer to the cable core have higher temperatures than those closer to the outer shield. As expected, the highest insulation temperature (85.7 °C) and the steepest temperature gradient across the insulation radius (25.1 °C) are observed in the loaded cable with a core temperature of 90 °C (Table 5).

Table 5.
Boundary values of temperature T, relative permittivity εr, and electric field E in insulation of 110 kV AC cable model.
The change in the temperature distribution in the XLPE cable insulation modifies the distribution of the dielectric constant of XLPE along the cable radius (Figure 2a) according to the assumed linear εr(T) characteristic (Table 4), with an increase in temperature causing a decrease in XLPE permittivity. This decrease is most significant in areas with the highest temperature near the cable conductor and drops to approximately 2.11 at a conductor temperature of 90 °C (green curve in Figure 2b).
The distributions of the electric field strength E in the insulation along the cable radius (Figure 3) are typical for AC cables. The highest value, exceeding 8 kV/mm, occurs at the semiconducting screen on the cable core, while the lowest E field value (around 3.4 kV/mm) is observed in the outer insulation areas, at the semiconducting screen on the insulation. The changes in the cable temperature distribution cause a small but noticeable modification of the E-field distribution in the cable insulation. An increase in the E-field strength near the cable core and a slight decrease in the field strength in the outer areas of the XLPE insulation are observed for the heated cable.
In the next stage of analysis, simulations were performed to determine the electric field enhancement in two model defects, 500 μm spherical gaseous voids located in the XLPE insulation of the cable. The electric field E inside the voids is related to the E field in the surrounding XLPE insulation (Figure 4 and Figure 5, Table 5). In static conditions (without PD activity), the highest field, reaching 10.45 kV/mm, occurs in the first gaseous void (closer to the cable core), while in the second void the field is lower, around 5 kV/mm. The increase in cable temperature causes a slight decrease in the electric field intensity inside both voids, and thus a decrease in the field enhancement factor FEF (Table 6), defined here as the ratio of the E field strength in a void to the E field strength in the solid dielectric when there is no void at that location. It is worth noting that the temperature-induced changes in XLPE permittivity modify the FEF value inside the voids in this way.

Table 6.
Electric field E in void and XLPE insulation—simulation results for 110 kV AC cable model.
The influence of temperature on the conditions of PD inception in gaseous defects located in a solid dielectric is multifaceted. The basic physical condition dependent on temperature is related to the modification of the value of the PD inception electric field Einc, according to the relationship resulting from Paschen’s law. Achieving this value of the E-field in the gaseous void is a commonly accepted, fundamental condition, necessary for the potential development of a PD pulse, used in the numerical simulations of this phenomenon [65,66,67,68,69]. The increase in the temperature of the gas closed inside the constant volume of the void leads to a proportional increase in its pressure (p/T = const.). In the analyzed case of the 110 kV AC cable, this causes an increase of Einc in the first void (close to the cable core) from about 5.5 kV/mm in the “cold” cable to over 6.5 kV/mm in the cable with a core temperature of 90 °C (green curve in Figure 6a).
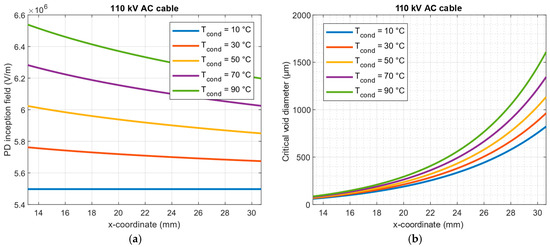
Figure 6.
The PD inception field Einc in the gaseous void of the 500 μm diameter located in XLPE insulation of 110 kV AC cable (a) and critical diameter of void dcr vs. x-coordinate in cable (b), at 10 °C, 30 °C, 50 °C, 70 °C, and 90 °C of cable core temperature.
By considering the two described pathways of temperature influence on the partial discharge initiation process in the XLPE insulation of a 110 kV cable, it is possible to determine the critical size of a gaseous void dcr (Figure 6b). It is defined as the minimum size of a gaseous void in the cable insulation for which the fundamental field condition Einc for PD initiation is fulfilled under specified temperature and at a specified position on the cable radius.
For a “cold” cable, the dcr size is smallest for voids near the cable conductor (approximately 5 µm) and increases as the inclusion position moves outward along the cable radius, reaching a maximum size of about 800 µm. Heating the cable in all cases leads to an increase in the critical size of the void. The largest growth is observed for voids located in the outer areas of the insulation at a conductor temperature of 90 °C—in this case the dcr size reaches 1.6 mm. Below the curves presented in Figure 6b, there is a “safe region” (marked in green area), where voids of such dimensions should not cause PD under the specified conditions.
Based on a complex electro-thermal, time-domain simulating model of partial discharges, Phase-Resolved Partial Discharge (PRPD) patterns were collected for the 1st and 2nd gaseous voids in a “cold” cable at 10 °C under rated voltage, as shown in Figure 7. For the first void, significant PD activity was observed, with a total number of pulses of N = 13,643 and an average PD charge of approximately 28.4 pC. In contrast, the size and position of the second void were within the safe region (void diameter dvoid = 500 μm is smaller than the critical size dcr = 1.5 mm), which was confirmed by the absence of PD pulses recorded in the PRPD pattern.
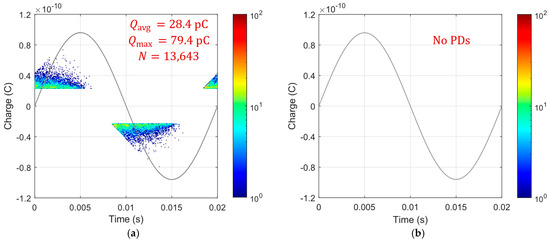
Figure 7.
Simulated 60 s PRPD patterns at 10 °C and rated AC voltage 50 Hz for two 500 μm gaseous voids: (a) first void (near cable core); (b) second void (near external semiconducting layer. The color represents the number of accumulated PD pulses (see color-bar), and the sine curve represents the applied test voltage waveform.
4.2. Simulation Results for AC Cable Under Test Voltage Conditions
The test voltage waveforms for each PD test were parameterized based on the data in Table 1 and then implemented in a time-dependent PD simulation model implemented in COMSOL and MATLAB software [26,61]. Selected PD parameters for the analyzed test voltage cases, for AC cable with “cold” cable core, i.e., total number of pulses N, number of pulses per half-period of the test voltage, average charge Qavg, maximum charge Qmax, and total charge Qtotal, are summarized in Table 7.

Table 7.
Selected parameters of PDs for “cold” cable calculated for results of numerical simulations for different test voltage waveforms.
Figure 8 shows the results of the numerical estimation of the critical dimension dcr of the gaseous void for the modeled 110 kV AC cable with a “cold” cable core. This parameter was determined for the rated voltage of the cable and for three levels of test voltage used in voltage tests to detect the presence of PD sources, both for new cables (acceptance tests) and old cables (maintenance tests) [33].
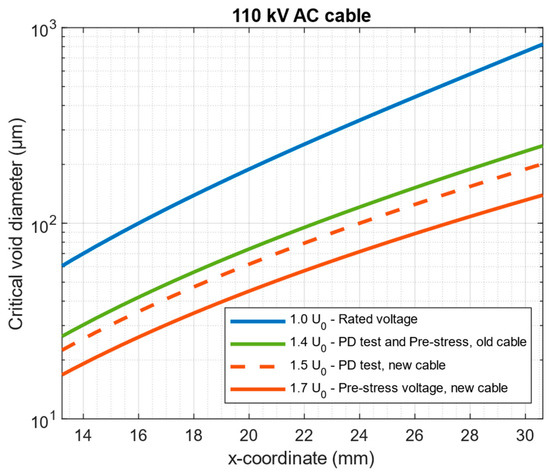
Figure 8.
Critical dimension of gaseous void dcr vs. x-coordinate in “cold” cable for U0 AC voltage and three test voltages: 1.4 U0, 1.5 U0, and 1.7 U0.
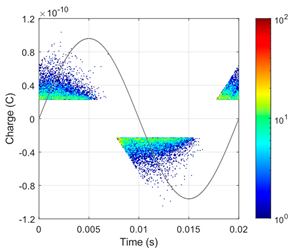
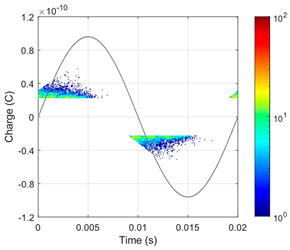
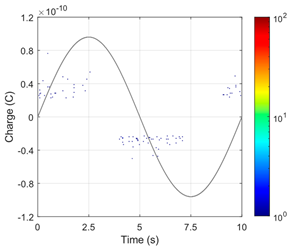
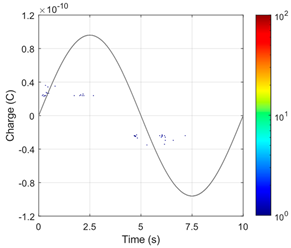
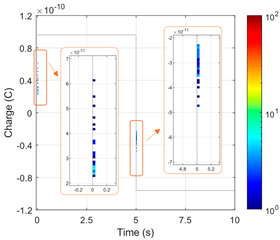
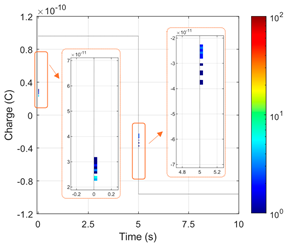
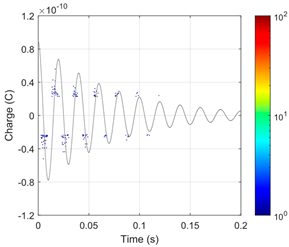
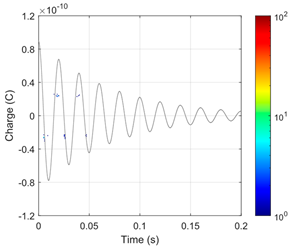
The numerically simulated PRPD patterns collected for the tests of the analyzed AC cable with selected types of test voltages (described in Section 2), for the first and second voids located in the XLPE insulation, at the pre-stress and PDEV lower limit voltages, are presented in Table 8 and Table 9, respectively.

Table 8.
Simulated PRPD patterns for 1st and 2nd void, for “cold” cable during pre-stress voltage test, for different test voltage waveforms.

Table 9.
Simulated PRPD patterns for 1st and 2nd void, for “cold” cable during PDEV lower limit voltage test, for different test voltage waveforms.
4.3. Influence of Cable Core Temperature on PD Inception in AC Cable Insulation
The inception of partial discharges in gaseous defects located in the cable insulation is determined by many factors (waveform and magnitude of voltage, cable geometry, dielectric parameters of the insulating material, shape and location of the defect, temperature of cable core, etc.). In the case of single-core cable insulation, both AC and DC cables, the size and location of the defect on the cable radius are of significant importance. This is related to the radial distribution of the E field strength and the temperature field. The influence of the location of the void on the value of the electric field inside the defect is clearly visible in the E field strength distributions presented in Figure 3 and Figure 4. The monotonically decreasing E field strength distribution in the insulation without voids (Figure 3) makes the formation of PD in voids located closer to the AC cable core more probable. This is the basic reason why the critical dimension dcr of the gaseous void in the insulation is the smallest near the semiconducting screen on the cable core and the largest near the external screen on the insulation (Figure 6b and Figure 8).
It is obvious that the increase in the temperature of the cable core results in a change in the conditions for the formation of PDs in gaseous defects located in the cable insulation. However, the effect of temperature is complex and is realized by influencing several factors that determine the conditions for the generation of PD pulses.
The increase in the temperature of the air closed in the gaseous void causes a corresponding increase in the Einc value, resulting from Paschen’s law [65,66,67,68,69]. This factor has a significant impact on the change in the PD pulse inception conditions, which is confirmed by the simulation results for the 110 kV AC cable model (Figure 6a). For an unloaded cable (constant temperature in the cable insulation volume), Einc in the gaseous void does not depend on its location on the cable radius. The increase in cable core temperature due to load causes an overall increase in insulation temperature with a monotonically decreasing distribution along the cable radius, from the cable core to the external semiconductive screen on the insulation (Figure 2a). As a result, the Einc value, determined for a gas (air) enclosed in a void, also increases (Figure 6a).
Typically, in AC models of homogeneous insulation systems with defects in the form of gaseous voids, a constant value of permittivity is assumed. The analyses show that in the case of XLPE insulation of a loaded AC cable, the temperature distribution present in the insulation (Figure 2a) modifies the value of the dielectric permittivity along the cable radius in such a way that the distribution of the E field in the cable insulation changes slightly but noticeably. As a result, the value of the E field strength in the insulation near the core increases slightly and decreases near the external screen (Figure 3). The second effect of temperature on permittivity is the modification of the field enhancement factor FEF, which decreases with increasing XLPE temperature. This slightly reduces the increase in the field strength in the gaseous voids, in the entire insulation, both near the cable core and near the external screen (Figure 4).
The sum of the above effects, caused by the increase in the cable core temperature, leads to a change in the critical dimension dcr of the gaseous void, which can be a source of PD in the loaded AC cable. This temperature-dependent change is the greater the farther the void is from the cable core (Figure 6b). In practice, this means that for a loaded cable with a higher core and cable insulation temperature, some PD sources that can be identified during voltage tests of an unloaded (“cold”) AC cable may not be active.
4.4. Influence of Test Voltage Magnitude and Waveform on PD Inception in AC Cable Insulation
The results of numerical simulations performed for the model of a 110 kV AC cable with two voids of 500 μm each, for the rated AC voltage and for test voltages 1.7 U0 and 1.5 U0, recommended in the standard [33] for testing new cables (acceptance tests), show the differences in the basic statistical parameters of PD, as well as PRPD patterns resulting from the magnitude and waveform of the test voltages (Table 7, Table 8 and Table 9). Each of the acceptance test voltages and the 1.4 U0 voltage (recommended in the maintenance test of old cables [33]) causes electrical field stress in the AC cable insulation, which creates conditions for the detection of gaseous voids (PD sources) with dimensions smaller than the critical dimensions for the rated voltage (Figure 8).
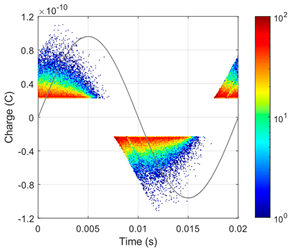
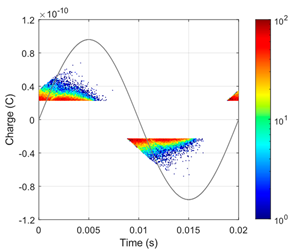
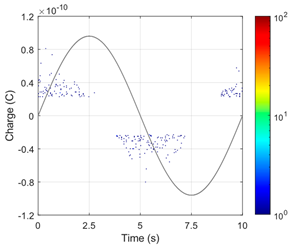
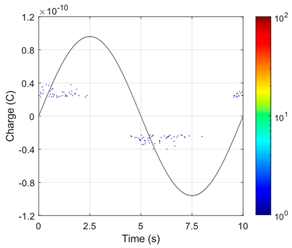
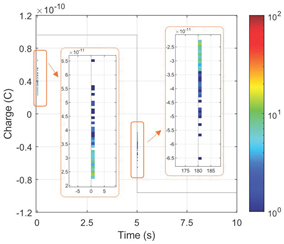
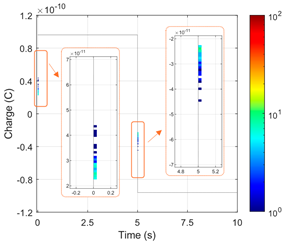
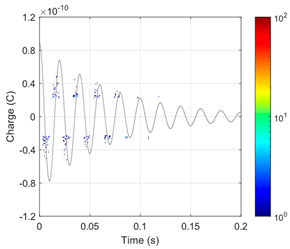
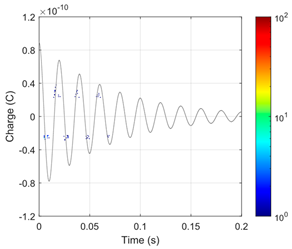
Both types of VLF test voltages (True-sine and CR) and the DAC test voltage cause PDs in the considered model defects of the AC cable insulation (two 500 μm gaseous voids). The intensity of these discharges, represented by the number (N and N/half-period) and charges (Qavg, Qmax and Qtotal) of PD pulses, is significantly lower than for the 50 Hz AC voltage of the same magnitude (Table 9). This is also visible in the PRPD patterns for VLF and DAC voltages, for which there are groups with only a very small number of PD pulses (Table 7 and Table 8). Due to the narrow time ranges, in which the derivative of the VLF CR test voltage is non-zero, the PD pulses for this type of voltage are concentrated in two very narrow time ranges, in relation to the full voltage period (Table 7 and Table 8). For the VLF True-sine and DAC test voltages, the PD pulses are stochastically located in significantly wider phase ranges of the test voltage.
5. Conclusions
Analysis of numerical simulation results allows us to determine the conditions of PD inception in spherical gaseous voids located in the XLPE insulation of an AC power cable. These simulations were carried out using a complex electrothermal numerical model of a real 110 kV AC cable with a specified geometry, implemented in the COMSOL program. The results of these analyses, concerning various problems related to PD inception in the above-mentioned defects of the cable insulation, confirmed and showed that this is a process influenced by various factors, the most important of which are listed below.
- The location of the gaseous void in the XLPE insulation of a single-core AC power cable is the main factor determining the value of the E field in the void. This results directly from the radial distribution of the E field in the cable insulation.
- For a loaded cable, the increased core temperature and the resulting temperature field in the cable insulation have a complex effect on the conditions of PD inception in gaseous voids. This influence is partly direct, by increasing the Einc value (resulting from Paschen’s law), and partly indirect, by decreasing the XLPE permittivity, modifying the E field distribution in the AC cable insulation and the field enhancement factor (FEF) value for each gaseous void.
- The waveforms, frequencies and magnitudes of AC, VLF, and DAC voltages, used during withstand voltage tests of AC cable insulation, have a significant influence on the PD inception conditions and statistical parameters of PD pulse sets collected in PRPD patterns.
Author Contributions
Conceptualization, P.Z.; methodology, P.Z. and P.M.; validation, P.M. and P.Z.; formal analysis, P.M. and P.Z.; investigation, P.M. and P.Z.; resources, P.M. and P.Z.; writing—original draft preparation, P.Z. and P.M.; writing—review and editing, P.Z. and P.M.; visualization, P.M.; supervision, P.Z. All authors have read and agreed to the published version of the manuscript.
Funding
The research was financed by a general subsidy of the Polish Ministry of Science and Higher Education for AGH University of Krakow, Poland.
Data Availability Statement
Data are contained within the article.
Conflicts of Interest
The authors declare no conflicts of interest.
References
- Baggini, A. (Ed.) Handbook of Power Quality; John Wiley & Sons: Chichester, UK, 2008. [Google Scholar]
- Heydt, G.T. The next generation of power distribution systems. IEEE Trans. Smart Grid 2010, 1, 225–235. [Google Scholar] [CrossRef]
- Sun, Y.; Cheng, L.; Ye, X.; He, J.; Wang, P. Overview of power system operational reliability. In Proceedings of the 2010 IEEE 11th International Conference on Probabilistic Methods Applied to Power Systems (PMAPS), Singapore, 14–17 June 2010; pp. 166–171. [Google Scholar] [CrossRef]
- Tuinema, B.W.; Rueda, J.L.; van der Sluis, L.; van der Meijden, M.A.M.M. Reliability of transmission links consisting of overhead lines and underground cables. IEEE Trans. Power Deliv. 2016, 31, 1251–1260. [Google Scholar] [CrossRef]
- Hanzelka, Z.; Baggini, A.; Firlit, A.; Moskwa, S.; Rodziewicz, T. Handbook of Electrical Power Reliability; AGH Press: Krakow, Poland, 2021. [Google Scholar]
- Gulski, E.; Anders, G.J.; Jongen, R.A.; Parciak, J.; Siemiński, J.; Piesowicz, E.; Paszkiewicz, S.; Irska, I. Discussion of electrical and thermal aspects of offshore wind farms’ power cables reliability. Renew. Sustain. Energy Rev. 2021, 151, 111580. [Google Scholar] [CrossRef]
- Zhang, J.; Wang, B.; Ma, H.; He, Y.; Wang, H.; Zhang, H. Reliability evaluation method for underground cables based on double sequence Monte Carlo simulation. Processes 2025, 13, 505. [Google Scholar] [CrossRef]
- Hammons, T.J.; Lescale, V.F.; Uecker, K.; Haeusler, M.; Retzmann, D.; Staschus, K.; Lepy, S. State of the art in ultra-high-voltage transmission. Proc. IEEE 2012, 100, 360–390. [Google Scholar] [CrossRef]
- Zhou, H.; Qiu, W.; Sun, K.; Chen, J.; Deng, X.; Qian, F.; Wang, D.; Zhao, B.; Li, J.; Li, S.; et al. (Eds.) Ultra-High Voltage AC/DC Power Transmission; Springer: Berlin/Heidelberg, Germany, 2019. [Google Scholar]
- Mazzanti, G.; Marzinotto, M. Extruded Cables for High-Voltage Direct-Current Transmission: Advances in Research and Development; Wiley-IEEE Press: Milwaukee, WI, USA, 2013. [Google Scholar]
- Mazzanti, G. Issues and challenges for HVDC extruded cable systems. Energies 2021, 14, 4504. [Google Scholar] [CrossRef]
- CIGRÉ Working Group B1.47. CIGRÉ Technical Brochure 680—Implementation of long AC HV and EHV Cable Systems; CIGRÉ: Paris, France, 2017. [Google Scholar]
- Orton, H. History of underground power cables. IEEE Electr. Insul. Mag. 2013, 29, 52–57. [Google Scholar] [CrossRef]
- Moore, G.F. Electric Cables Handbook; Blackwell Science Ltd.: Oxford, UK, 1997. [Google Scholar]
- Densley, J. Ageing mechanisms and diagnostics for power cables—An overview. IEEE Electr. Insul. Mag. 2001, 17, 14–22. [Google Scholar] [CrossRef]
- Tanaka, T. Aging of polymeric and composite insulating materials. Aspects of interfacial performance in aging. IEEE Trans. Dielectr. Electr. Insul. 2002, 9, 704–716. [Google Scholar] [CrossRef]
- Fothergill, J.C.; Montanari, G.C.; Stevens, G.C.; Laurent, C.; Teyssedre, G.; Dissado, L.A.; Nilsson, U.H.; Platbrood, G. Electrical, microstructural, physical and chemical characterization of HV XLPE cable peelings for an electrical aging diagnostic data base. IEEE Trans. Dielectr. Electr. Insul. 2003, 10, 514–527. [Google Scholar] [CrossRef]
- Mazzanti, G. The combination of electro-thermal stress, load cycling and thermal transients and its effects on the life of high voltage ac cables. IEEE Trans. Dielectr. Electr. Insul. 2009, 16, 16–1168. [Google Scholar] [CrossRef]
- Choudhary, M.; Shafiq, M.; Kiitam, I.; Hussain, A.; Palu, I.; Taklaja, P. A review of aging models for electrical insulation in power cables. Energies 2022, 15, 3408. [Google Scholar] [CrossRef]
- Montanari, G.C.; Laurent, C.; Teyssedre, G.; Campus, A.; Nilsson, U.H. From LDPE to XLPE: Investigating the change of electrical properties. Part I. space charge, conduction and lifetime. IEEE Trans. Dielectr. Electr. Insul. 2005, 12, 438–446. [Google Scholar] [CrossRef]
- Dang, C.; Parpal, J.-L.; Crine, J.-P. Electrical aging of extruded dielectric cables: Review of existing theories and data. IEEE Trans. Dielectr. Electr. Insul. 1996, 3, 237–247. [Google Scholar] [CrossRef]
- Fenger, M. Experiences with commissioning testing of HV & EHV cable systems: The influence of voltage level and duration for identifying life limiting defects. In Proceedings of the 2012 IEEE International Symposium on Electrical Insulation, San Juan, PR, USA, 10–13 June 2012; pp. 242–249. [Google Scholar] [CrossRef]
- Fynes-Clinton, D.; Nyamupangedengu, C. Partial discharge characterization of cross-linked polyethylene medium voltage power cable termination defects at very low frequency (0.1 Hz) and power frequency test voltages. IEEE Electr. Insul. Mag. 2016, 32, 15–23. [Google Scholar] [CrossRef]
- Wang, W.; Yan, X.; Li, S.; Zhang, L.; Ouyang, J.; Ni, X. Failure of submarine cables used in high-voltage power transmission: Characteristics, mechanisms, key issues and prospects. IET Gener. Transm. Distrib. 2021, 15, 1387–1402. [Google Scholar] [CrossRef]
- Li, S.; Cao, B.; Li, J.; Cui, Y.; Kang, Y.; Wu, G. Review of condition monitoring and defect inspection methods for composited cable terminals. High Volt. 2023, 8, 431–444. [Google Scholar] [CrossRef]
- Mikrut, P.; Zydron, P. The influence of temperature on the formation of partial discharges in gas inclusions in the insulation of AC voltage cables. Prz. Elektrotechniczny 2024, 100, 221–224. [Google Scholar] [CrossRef]
- Gulski, E.; Jongen, R. Condition based maintenance of transmission power cables. IEEE Trans. Power Deliv. 2022, 37, 1588–1597. [Google Scholar] [CrossRef]
- Petzold, F.; Schlapp, H.; Gulski, E.; Seitz, P.; Quak, B. Advanced solution for on-site diagnosis of distribution power cables. IEEE Trans. Dielectr. Elect. Insul. 2008, 15, 1584–1589. [Google Scholar]
- Finke, B.H. Recommendations in HV DC testing of MV cable insulation. IEEE Industry Appl. Mag. 1997, 3, 85–87. [Google Scholar] [CrossRef]
- Mercier, C.D.; Ticker, S. DC field test for medium-voltage cables: Why can no one agree? IEEE Trans. Ind. Appl. 1998, 34, 1366–1370. [Google Scholar] [CrossRef]
- IEEE Std 400-2023; IEEE Guide for Field Testing and Evaluation of the Insulation of Shielded Power Cable Systems Rated 5 kV and Above. The Institute of Electrical and Electronics Engineers, Inc.: New York, NY, USA, 2023.
- IEEE Std 400.2-2024; IEEE Guide for Field Testing of Shielded Power Cable Systems Using Very Low Frequency (VLF) (Less Than 1 Hz). The Institute of Electrical and Electronics Engineers, Inc.: New York, NY, USA, 2024.
- IEEE Std 400.3-2022; IEEE Guide for Partial Discharge Field Diagnostic Testing of Shielded Power Cable Systems. The Institute of Electrical and Electronics Engineers, Inc.: New York, NY, USA, 2022.
- IEEE Std 400.4-2015; IEEE Guide for Field Testing of Shielded Power Cable Systems Rated 5 kV and Above with Damped Alternating Current (DAC) Voltage. The Institute of Electrical and Electronics Engineers, Inc.: New York, NY, USA, 2015.
- IEC 60060-3:2006; High-Voltage Test Techniques—Part 3: Definitions and Requirements for On-Site Testing. International Electrotechnical Commission: Geneva, Switzerland, 2006.
- Eager, G.S.; Katz, C.; Fryszczyn, B.; Densley, J.; Bernstein, B. High voltage VLF testing of power cables. IEEE Trans. Power Deliv. 1997, 12, 565–569. [Google Scholar] [CrossRef]
- Gulski, E.; Wester, F.J.; Smit, J.J.; Seitz, P.; Turner, M. Advanced partial discharge diagnostic of MV power cable system using oscillating wave test system. IEEE Electr. Insul. Mag. 2000, 16, 17–25. [Google Scholar] [CrossRef]
- Muhr, M.; Sumereder, C.; Woschitz, R. The use of the 0.1 Hz cable testing method as substitution to 50 Hz measurement and the application for PD measuring and cable fault location. In Proceedings of the 12th International Symposium on High Voltage Engineering ISH-2001, Bangalore, India, 20–24 August 2001; pp. 6–38. [Google Scholar]
- Oyegoke, B.; Hyvonen, P.; Aro, M.; Gao, N. Selectivity of damped AC (DAC) and VLF voltages in after-laying tests of extruded MV cable systems. IEEE Trans. Dielectr. Electr. Insul. 2003, 10, 874–882. [Google Scholar] [CrossRef]
- Gulski, E.; Cichecki, P.; Wester, F.; Smit, J.J.; Bodega, R.; Hermans, T.J.; Seitz, P.P.; Quak, B.; De Vries, F. On-site testing and PD diagnosis of high voltage power cables. IEEE Trans. Dielectr. Electr. Insul. 2008, 15, 1691–1700. [Google Scholar] [CrossRef]
- Probst, R.; Putter, H.; Petzold, F.; Legler, P. Excitation voltages for partial discharge diagnostics on medium voltage distribution cables. In Proceedings of the 2018 IEEE/PES Trans. & Distrib. Conference and Exposition (T&D), Denver, CO, USA, 1–5 April 2018. [Google Scholar] [CrossRef]
- Gulski, E.; Jongen, R.; Rakowska, A.; Siodla, K. Offshore wind farms on-site submarine cable testing and diagnosis with damped AC. Energies 2019, 12, 3703. [Google Scholar] [CrossRef]
- Cejka, G.; Gulski, E.; Jongen, R.; Quak, B.; Parciak, J. Integrated testing and diagnosis of distribution cables using damped AC and very low frequency voltages. In Proceedings of the 10th International Conference Insulated Power Cables—Jicable’18, Versailles, Paris, France, 23–27 June 2019. [Google Scholar]
- Niasar, M.G.; Wang, X.; Kiiza, R.C. Review of partial discharge activity considering very-low frequency and damped applied voltage. Energies 2021, 14, 440. [Google Scholar] [CrossRef]
- CIGRÉ Working Group B1.38. After Laying Tests on AC and DC Cable Systems with New Technologies, CIGRÉ Technical Brochure 841; CIGRE: Paris, France, 2021. [Google Scholar]
- Gulski, E.; Jongen, R.; Parciak, J.; Götz, H.P.D. Testing and diagnosis of power cables using damped AC voltages. CIGRE Sci. Eng. 2024, 29, 1–26. [Google Scholar]
- Edin, H. Partial Discharges Studied with Variable Frequency of the Applied Voltage. Ph.D. Thesis, KTH, Stockholm, Sweden, 2001. [Google Scholar]
- Bodega, R.; Cavallini, A.; Morshuis, P.H.F.; Wester, F.J. The effect of voltage frequency on partial discharge activity. In Proceedings of the Annual Report Conference on Electrical Insulation and Dielectric Phenomena, Cancun, Mexico, 20–24 October 2002; pp. 685–689. [Google Scholar] [CrossRef]
- Florkowska, B.; Zydron, P.; Florkowski, M. Influence of testing voltage frequency on partial discharge phase-resolved images. In Proceedings of the 13th International Symposium on High Voltage Engineering, ISH-2003, paper 309, Delft, The Netherlands, 25–29 August 2003. [Google Scholar]
- Florkowska, B.; Zydron, P.; Florkowski, M. Analysis of PD phase-resolved images at low frequency of testing voltage. In Proceedings of the Conference Record of the 2004 IEEE International Symposium on Electrical Insulation, Indianapolis, IN, USA, 19–22 September 2004; pp. 143–146. [Google Scholar] [CrossRef]
- Bodega, R.; Morshuis, P.H.F.; Lazzaroni, M.; Wester, F.J. PD recurrence in cavities at different energizing methods. IEEE Trans. Instrum. Meas. 2004, 53, 251–258. [Google Scholar] [CrossRef]
- Cavallini, A.; Montanari, G.C. Effect of supply voltage frequency on testing of insulation system. IEEE Trans. Dielectr. Electr. Insul. 2006, 13, 111–121. [Google Scholar] [CrossRef]
- Forssen, C.; Edin, H. Partial discharges in a cavity at variable applied frequency part 1: Measurements. IEEE Trans. Dielectr. Electr. Insul. 2008, 15, 1601–1609. [Google Scholar] [CrossRef]
- Illias, H.A.; Chen, G.; Lewin, P.L. Partial discharge measurements for spherical cavities within solid dielectric materials under different stress and cavity conditions. In Proceedings of the 2009 IEEE Conference on Electrical Insulation and Dielectric Phenomena, Virginia Beach, VA, USA, 18–21 October 2009; pp. 388–391. [Google Scholar] [CrossRef]
- Feng, X.; Xiong, Q.; Gattozzi, A.; Montanari, G.C.; Seri, P.; Hebner, R. Cable commissioning and diagnostic tests: The effect of voltage supply frequency on partial discharge behavior. In Proceedings of the 2018 12th International Conference on the Properties and Applications of Dielectric Materials (ICPADM), Xi’an, China, 20–24 May 2018; pp. 373–376. [Google Scholar] [CrossRef]
- Jahromi, A.N.; Ketharam Pattabi, P.; Lo, S.; Densley, J. Comparison of different voltage waveforms for partial discharge measurement in medium voltage cables and accessories. In Proceedings of the 2022 IEEE Electrical Insulation Conference (EIC), Knoxville, TN, USA, 19–23 June 2022; pp. 5–8. [Google Scholar] [CrossRef]
- Chen, Y.; Hao, Y.; Huang, T.; Xiao, J.; Hui, B.; Chen, Y.; Yang, L.; Li, L. Voltage equivalence of partial discharge tests for XLPE insulation defects. IEEE Trans. Dielectr. Electr. Insul. 2022, 29, 683–692. [Google Scholar] [CrossRef]
- Forssen, C.; Edin, H. Partial discharges in a cavity at variable applied frequency Part 2: Measurements and modeling. IEEE Trans. Dielectr. Electr. Insul. 2008, 15, 1610–1616. [Google Scholar] [CrossRef]
- Illias, H.A.; Chen, G.; Lewin, P.L. Comparison of partial discharge measurement and simulation results for spherical cavities within solid dielectric materials as a function of frequency using finite element analysis method. In Proceedings of the 2010 IEEE International Symposium on Electrical Insulation, San Diego, CA, USA, 6–9 June 2010; pp. 1–5. [Google Scholar] [CrossRef]
- Illias, H.; Chen, G.; Lewin, P.L. Partial discharge behavior within a spherical cavity in a solid dielectric material as a function of frequency and amplitude of the applied voltage. IEEE Trans. Dielectr. Electr. Insul. 2011, 18, 432–443. [Google Scholar] [CrossRef]
- Mikrut, P.; Zydroń, P. Numerical modeling of PD pulses formation in a gaseous void located in XLPE insulation of a loaded HVDC cable. Energies 2023, 16, 6374. [Google Scholar] [CrossRef]
- Huang, F.; Li, J. Optimization Research on Ampacity of Underground High Voltage Cable Based on Interior Point Method. IOP Conf. Ser. Mater. Sci. Eng. 2017, 274, 012123. [Google Scholar] [CrossRef]
- Li, G.; Liu, M.; Hao, C.; Lei, Q.; Wei, Y. Conductivity and interface charge accumulation between XLPE and SIR for HVDC cable accessory. J. Mater. Sci. Mater. Electron. 2019, 30, 1450–1457. [Google Scholar] [CrossRef]
- Gouda, O.E.; Matter, Z. Effect of the temperature rise on the XLPE dielectric properties. In Proceedings of the 35th Midwest Symposium on Circuits and Systems, Washington, DC, USA, 9–12 August 1992; Volume 1, pp. 95–98. [Google Scholar] [CrossRef]
- Wouters, P.; Deursen, A.; Li, Y. Analysis and verification of signal propagation as method for temperature monitoring of underground power cables. Electr. Power Syst. Res. 2022, 213, 108739. [Google Scholar] [CrossRef]
- He, M.; Chen, G.; Lewin, P.L. Field distortion by a single cavity in HVDC XLPE cable under steady state. High Volt. 2016, 1, 107–114. [Google Scholar] [CrossRef]
- Niemeyer, L. A generalized approach to partial discharge modeling. IEEE Trans. Dielectr. Electr. Insul. 1995, 2, 510–528. [Google Scholar] [CrossRef]
- Gutfleisch, F.; Niemeyer, L. Measurement and simulation of PD in epoxy voids. IEEE Trans. Dielectr. Electr. Insul. 1995, 2, 729–743. [Google Scholar] [CrossRef]
- Pan, C.; Chen, G.; Tang, J.; Wu, K. Numerical modeling of partial discharges in a solid dielectric-bounded cavity: A review. IEEE Trans. Dielectr. Electr. Insul. 2019, 26, 981–1000. [Google Scholar] [CrossRef]
Disclaimer/Publisher’s Note: The statements, opinions and data contained in all publications are solely those of the individual author(s) and contributor(s) and not of MDPI and/or the editor(s). MDPI and/or the editor(s) disclaim responsibility for any injury to people or property resulting from any ideas, methods, instructions or products referred to in the content. |
© 2025 by the authors. Licensee MDPI, Basel, Switzerland. This article is an open access article distributed under the terms and conditions of the Creative Commons Attribution (CC BY) license (https://creativecommons.org/licenses/by/4.0/).
