Article

Numerical Investigation and Optimization of Transpiration Cooling Plate Structures with Combined Particle Diameter

1
School of Mechanical and Power Engineering, Zhengzhou University, Zhengzhou 450001, China
2
Key Laboratory of Process Heat Transfer and Energy Saving of Henan Province, Zhengzhou University, Zhengzhou 450001, China
*
Author to whom correspondence should be addressed.
Energies 2025, 18(11), 2950; https://doi.org/10.3390/en18112950
Submission received: 25 April 2025 / Revised: 22 May 2025 / Accepted: 2 June 2025 / Published: 4 June 2025

Abstract

:
Transpiration cooling is an efficient thermal protection technology used for scramjet combustors and other components. However, a conventional transpiration cooling plate structure with uniform porous media distribution suffers from a large temperature difference between the upstream and downstream surfaces and high coolant injection pressure (p). To enhance the overall cooling effect and reduce the maximum surface temperature and coolant injection pressure, the combined particle diameter plate structure (CPD−PS) is proposed. Numerical simulations show that compared with the single-particle diameter plate structure (SPD−PS), the CPD−PS with a larger upstream particle diameter (dp) than that of the downstream (dpA > dpB) can effectively reduce the upstream temperature and improve average cooling efficiency (ηave). Meanwhile, gradually increasing dp will increase the permeability of porous media, reduce coolant flow resistance, and thus lower coolant injection pressure. An optimization analysis of CPD−PS is conducted using response surface methodology (RSM), and the influence of design variables on the objective function (ηave and p) is analyzed. Further optimization with the multi-objective genetic algorithm (MOGA) determines the optimal structural parameters. The results suggest that porosity (ε) and dp are the most crucial parameters affecting ηave and p of CPD−PS. After optimization, the maximum temperature of the porous plate is significantly reduced by 8.40%, and the average temperature of the hot end surface is also reduced. The overall cooling performance is effectively improved, ηave is increased by 6.02%, and p is significantly reduced. Additionally, the upstream surface velocity of the optimized structure changes and the boundary layer thickens, which enhances the thermal insulation effect.

1. Introduction

As the demands for thermal management technology in the aerospace field keep increasing, thermal protection technology significantly contributes to ensuring the efficient and safe operation of equipment [1,2,3]. As an efficient thermal protection method, transpiration cooling has drawn extensive attention recently due to its unique cooling mechanism and is considered to be one of the active cooling technologies used to solve the thermal protection of key parts, such as scramjet and rocket engines. In the transpiration cooling system, the coolant permeates through a porous medium to the hot surface, interacts with high-temperature main stream gas, and forms a cooling film on the hot end surface, effectively reducing component surface temperature and ensuring equipment performance in extreme thermal environments [4,5].
In recent years, a large number of scholars have used transpiration cooling technology from multiple perspectives [6,7,8,9]. Among them, the structural characteristics of porous media are the key factors determining the transpiration cooling performance. The pore morphology significantly regulates the overall heat transfer efficiency of the system by affecting the pressure drop and heat transfer coefficient [10]. Porous media possess micrometer-scale pore structures, and their permeability characteristics are affected by factors such as particle diameter and porosity. The variations in these parameters directly affect the transport performance of the coolant and subsequently affect the cooling effect. Therefore, an in-depth understanding of the porous media parameter characteristics is crucial for optimizing the transpiration cooling effect. Wang et al. [11] analyzed the influence of the porosity and pore size of porous media on the flow and heat transfer characteristics based on the pore scale model. The study demonstrated that as the porosity and pore size increase, the thermal protection layer formed after the injection of the coolant becomes thicker, while the pressure drop in the porous media decreases. Liu et al. [12] conducted an experimental study on transpiration cooling using sintered bronze/stainless steel porous plates and discovered that reducing the particle diameter can effectively increase the contact area between the coolant and the porous skeleton, thus enhancing the heat transfer effect and improving transpiration cooling efficiency. In addition, the changes in particle diameter also have a significant impact on the coolant injection pressure. Huang [13] conducted research on transpiration cooling using porous plates with different particle diameters in a high-temperature main stream environment. The results indicated that reducing the particle diameter is conducive to enhancing the internal convective heat transfer, improving the cooling efficiency, and making the solid and cooling fluid temperatures at the outlet of the porous media surface closer to each other. Meng et al. [14] found that reducing the particle diameter could enhance the cooling effect but would increase the pressure drop through experimental research on the transpiration cooling of porous plates, and in the non-uniform particle diameter porous plate, because more fluid passed through the plate with a larger particle diameter, the wall temperature decreased more and the pressure drop was smaller.
To further improve the economy and reduce the cost of the transpiration cooling system, the current research focus is on how to improve cooling efficiency and temperature distribution uniformity under the premise of ensuring a stable cooling effect while reducing coolant consumption and the cost of auxiliary equipment such as injection pumps. Many scholars have optimized the transpiration cooling system structure according to porous media characteristics. Wu et al. [15] applied a layer of impermeable Teflon coating with a low melting point on a porous plate surface, so that the Teflon material at the front end was preferentially transformed and sublimated, leading to coolant preferentially flowing out from the front end with high heat flux density, achieving rational coolant distribution and better surface temperature distribution uniformity. Zhao et al. [16,17], Jiang et al. [18], Wu et al. [19], and Rong et al. [20] aimed to study the problem of low cooling efficiency at the front end of transpiration cooling structures and, respectively, carried out a nonequal thickness design, stagnation point thickness reduction design, gradient porosity design, and opening small holes design on porous material to reduce coolant flow resistance at the stagnation point and then increase its local flow. Shen et al. [21] and Dong et al. [22] proposed that adjusting the porosity distribution can achieve enhanced cooling in the local high-temperature heat flow region and improve the overall cooling effect of the transpiration cooling structure.
As optimal design methods gradually develop, more research begins to use advanced optimization technology and methods to improve cooling system performance. Through systematic analysis and the adjustment of structural parameters, these optimization methods can greatly improve cooling performance, reduce experiment times, and improve computational efficiency. Wang et al. [23] conducted numerical research and optimization on the transpiration cooling of C3X turbine blades and used the Kriging model and genetic algorithm to build an agent optimization framework to optimize porosity distribution in the porous media so as to optimize coolant mass flow distribution. Liu et al. [24] studied the transpiration cooling characteristics of a gradient porous matrix under supersonic conditions, analyzed the influence of many factors, and proposed an optimization method combining computational fluid dynamics (CFD), an artificial neural network (ANN), and the multi-objective genetic algorithm (MOGA); taking the number of segments, porosity, length, and particle diameter of porous media as design variables, the gradient porous matrix structure was optimized. The influence mechanism of various factors on the cooling effect was clarified. After optimization, the stagnation point efficiency was improved, and the dimensionless injection pressure was reduced. Xu et al. [25] established a numerical model of the transpiration cooling of ceramic matrix composites through holes in a scramjet combustor environment, analyzed the influence of multiple factors on the cooling effect, and established a mathematical model of multiple factors and temperature gradients and average temperatures using response surface methodology (RSM). Through the second-order model and variance verification, the optimal hole size combination was determined. After optimizing the hole size, both the temperature gradient and the average temperature were improved. Chen et al. [26] proposed a gradient porosity transpiration cooling plate structure to alleviate the deterioration of heat transfer at the front end. CFD and RSM were used to analyze the flow and heat transfer characteristics and optimize structural parameters.
Previous investigations have shown that optimal design based on the characteristics of porous media can effectively improve the performance of transpiration cooling systems. Chen et al. [27] pointed out that although a uniform porous structure still has the problem of uneven local temperature distribution leading to heat transfer deterioration, porous media with gradually changed porosity (or particle diameter) can delay heat transfer deterioration, which provides theoretical support for the optimal design of transpiration cooling systems.
In this paper, the combined particle diameter plate structure (CPD−PS) is proposed, which adjusts permeability by changing the distribution of the particle diameter (dp) of the porous media. The goal is to reduce the maximum temperature upstream of the hot end surface of the porous plate, improve the overall cooling performance, and reduce the coolant injection pressure (p). In order to verify the effect of the design, we used CFD, RSM, and MOGA methods to study and optimize the key parameters of CPD−PS. By optimizing parameter combinations, the goal is to achieve the optimal balance of cooling system performance, thereby further improving cooling efficiency and reducing energy consumption.

2. Numerical Modeling and Validation

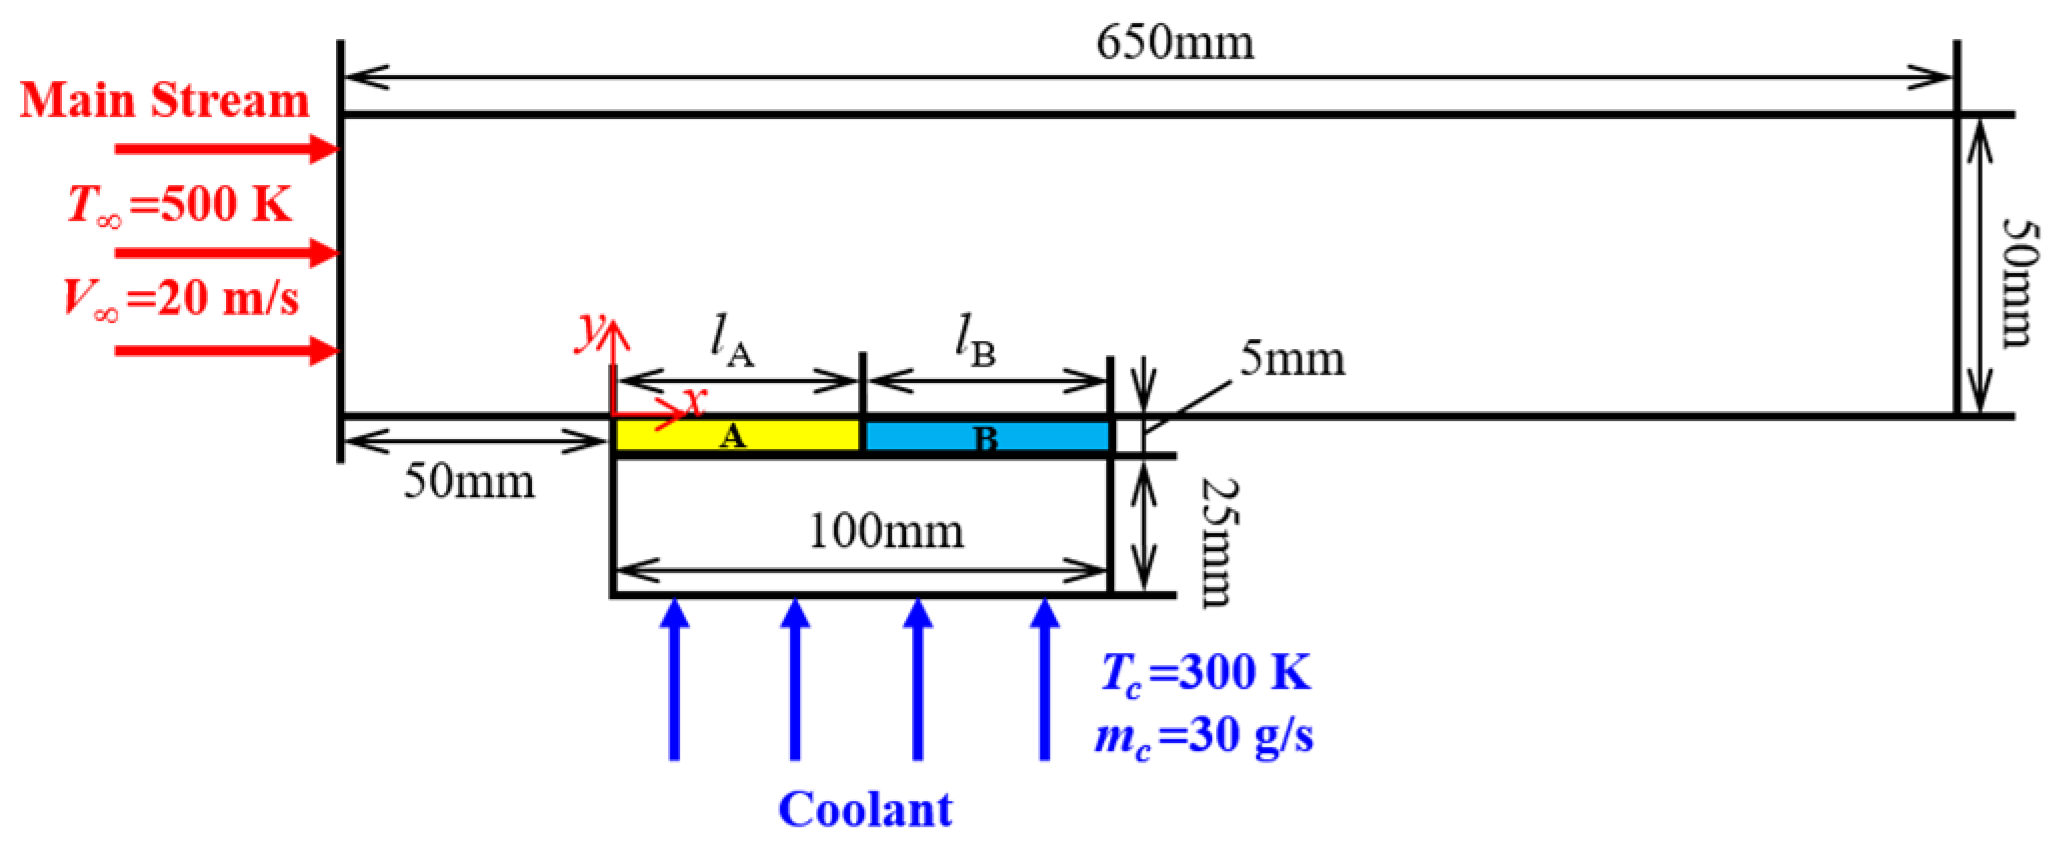
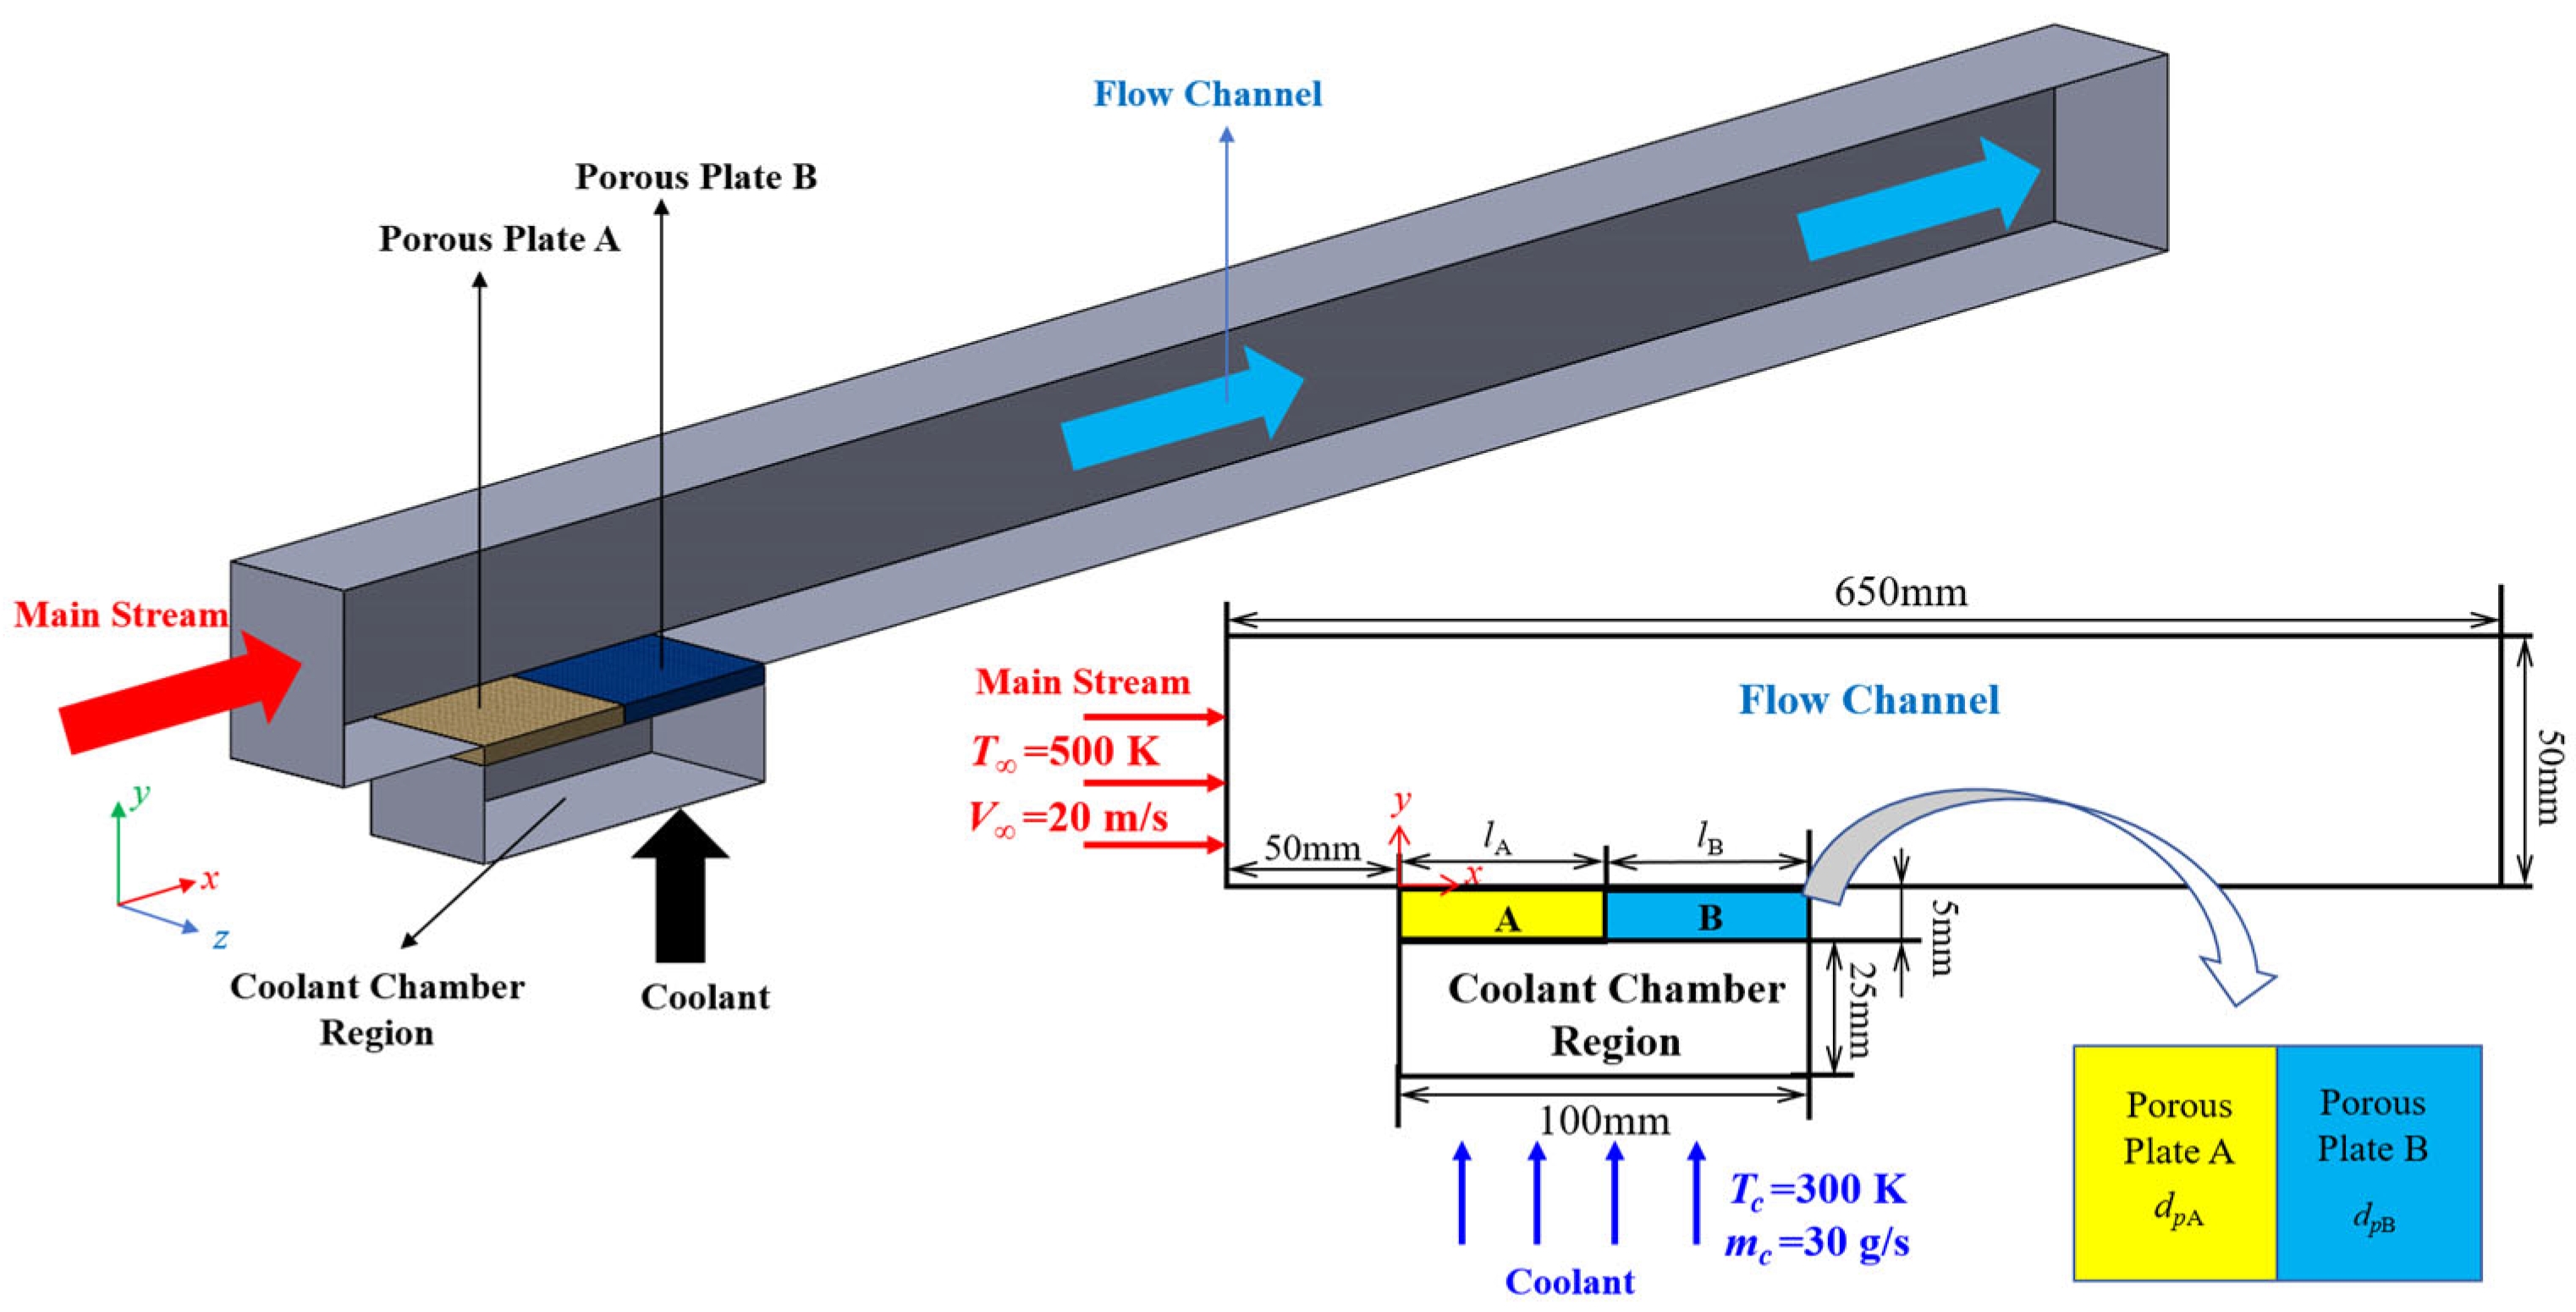
2.1. Geometric Models and Mathematical Models

The porous plate transpiration cooling structure was studied. The geometric model of the single-particle diameter plate structure (SPD−PS) transpiration cooling system is shown in Figure 1. In numerical simulations, it is assumed that the porous medium is isotropic and homogeneous, with air as the main flow and nitrogen as the coolant, which can ignore the change in the gravity direction. Therefore, the dimension reduction analysis of the porous plate structure was carried out. It is assumed that the entire calculation model is two-dimensional [12,26]. The two-dimensional model can effectively capture the basic flow characteristics and heat transfer laws of the system, and simplifying it to a two-dimensional model helps to improve the calculation efficiency, thereby better solving the fluid flow and temperature field distribution in the porous plate transpiration cooling structure.
In the SPD−PS with uniform distribution porous media, the calculation domain included the main stream region, porous plate, and cooling chamber. The main stream region was 650 mm in length and 50 mm in height. The length of the plate (l) was 100 mm, and the thickness (h) was 5 mm. The length of the cooling chamber was consistent with that of the plate, and the height was 25 mm. The porous media material was sintered high-temperature nickel-based alloy (Inconel-600) [28], with a density of 8420 kg/m3, thermal conductivity of 20.615 W/(m·K), and a specific heat capacity of 460 J/(kg·K), and the porous plate was made from spherical particles that were sintered and made [12] with dp of 40 μm and a porosity (ε) of 0.3. The specific surface area α is calculated by Formula (1):
α = 6 ( 1 ε ) d p
where ε represents the porosity and dp represents the particle diameter, μm.
ANSYS FLUENT 2021 R2 software was used for numerical simulation, and the boundary conditions are shown in Table 1. The high-temperature main stream air was set as the velocity inlet, the velocity was 20 m/s, and the static temperature was 500 K. The outlet was set as the pressure outlet at 101,325 Pa. The upper and lower surfaces of porous media adopted internal boundary conditions, and other walls were set as non-slip insulation walls [29]. The coolant was N2 with a mass flow rate of 30 g/s, and the static temperature was 300 K. The properties of the coolant and the main stream air were different. In order to accurately simulate the mixed flow of the coolant and main stream, the Species Transport Model was adopted in ANSYS FLUENT software. The main stream and coolant were defined as Mixture Material so as to better simulate the flow and heat exchange process. In the solution method, the pressure-based solver was used, the coupled algorithm was used to couple pressure and velocity fields to improve convergence efficiency, and the second-order upwind difference scheme was used to discretize momentum and energy equations to reduce numerical dissipation. Based on flow characteristics near the wall, the enhanced wall function was introduced to capture flow details near the wall. The calculation is considered convergent when the energy residual is below 10−7 and the residual value of other equations is below 10−4.
In the SPD−PS, after the coolant flows out from the hot end surface, due to the cumulative effect, the coolant gradually increases along the main stream direction on the hot end surface of the porous media, resulting in an uneven distribution of the coolant and further causing a non-uniform temperature distribution on the hot end surface. Although reducing the particle diameter can improve the cooling effect under the same conditions, it can also lead to an increase in the required coolant injection pressure [5,12,14,30]. To improve the temperature distribution and enhance the overall cooling performance, the CPD−PS was proposed. Figure 2 shows the geometric model of the CPD−PS transpiration cooling system. On the basis of SPD−PS, keeping the total length of the plate unchanged at 100 mm, the plate was divided into two plates, A and B, and different dp values were adopted for them. The lengths of the A plate and B plate were set as lA and lB, respectively.
Air flow in the main flow channel and coolant flow in the cooling chamber are regarded as turbulent flow and described using RANS equations and the k-ε turbulence model [12]. Due to the extremely small pore size and complex structure within porous media, the fluid flow characteristics are significantly different from those in main stream channels. The coolant flowing through porous media usually has a lower flow velocity and smaller flow channels, resulting in a lower Reynolds number in these areas. Considering the working conditions of this article, the Reynolds number in porous media is much smaller than the critical value for the laminar-to-turbulent transition. Therefore, in order to describe the flow in the porous media region reasonably, the flow in the porous media region was regarded as laminar, employing the Darcy–Brinkman–Forchheimer model, which takes the effects of viscous and inertial forces on the flow of porous media into account [31]. Inconel-600 was used as the material of the porous medium. In this paper, the ε of the porous media was set to 0.3, and the selected dp range was from 40 to 200 μm. When the dp is 40 μm, the specific surface area was 105,000 m−1, and when the dp is 200 μm, the specific surface area was the smallest, which was 21,000 m−1. The specific surface area of the porous media was large enough to ensure sufficient heat transfer between the coolant and the porous skeleton, and the temperatures of the solid and coolant inside the porous media were almost the same. Therefore, the heat transfer model in porous media can adopt the local thermal equilibrium model [26,32,33]. The governing equations for different computational domains are shown in Table 2.
In the equations, ρ is the density, kg/m3; U is the velocity, m/s; p is the pressure, Pa; τ is the viscous shear force, N/m2; E is the total energy, J/kg; keff is the effective thermal conductivity, W/(m·K); kf and ks are the thermal conductivities of the cooling fluid and porous medium solid skeleton, W/(m·K), respectively; and ε is the porosity of the porous medium. K and C are the permeability and inertia coefficients of the porous medium, respectively; and dp is the particle diameter in m.

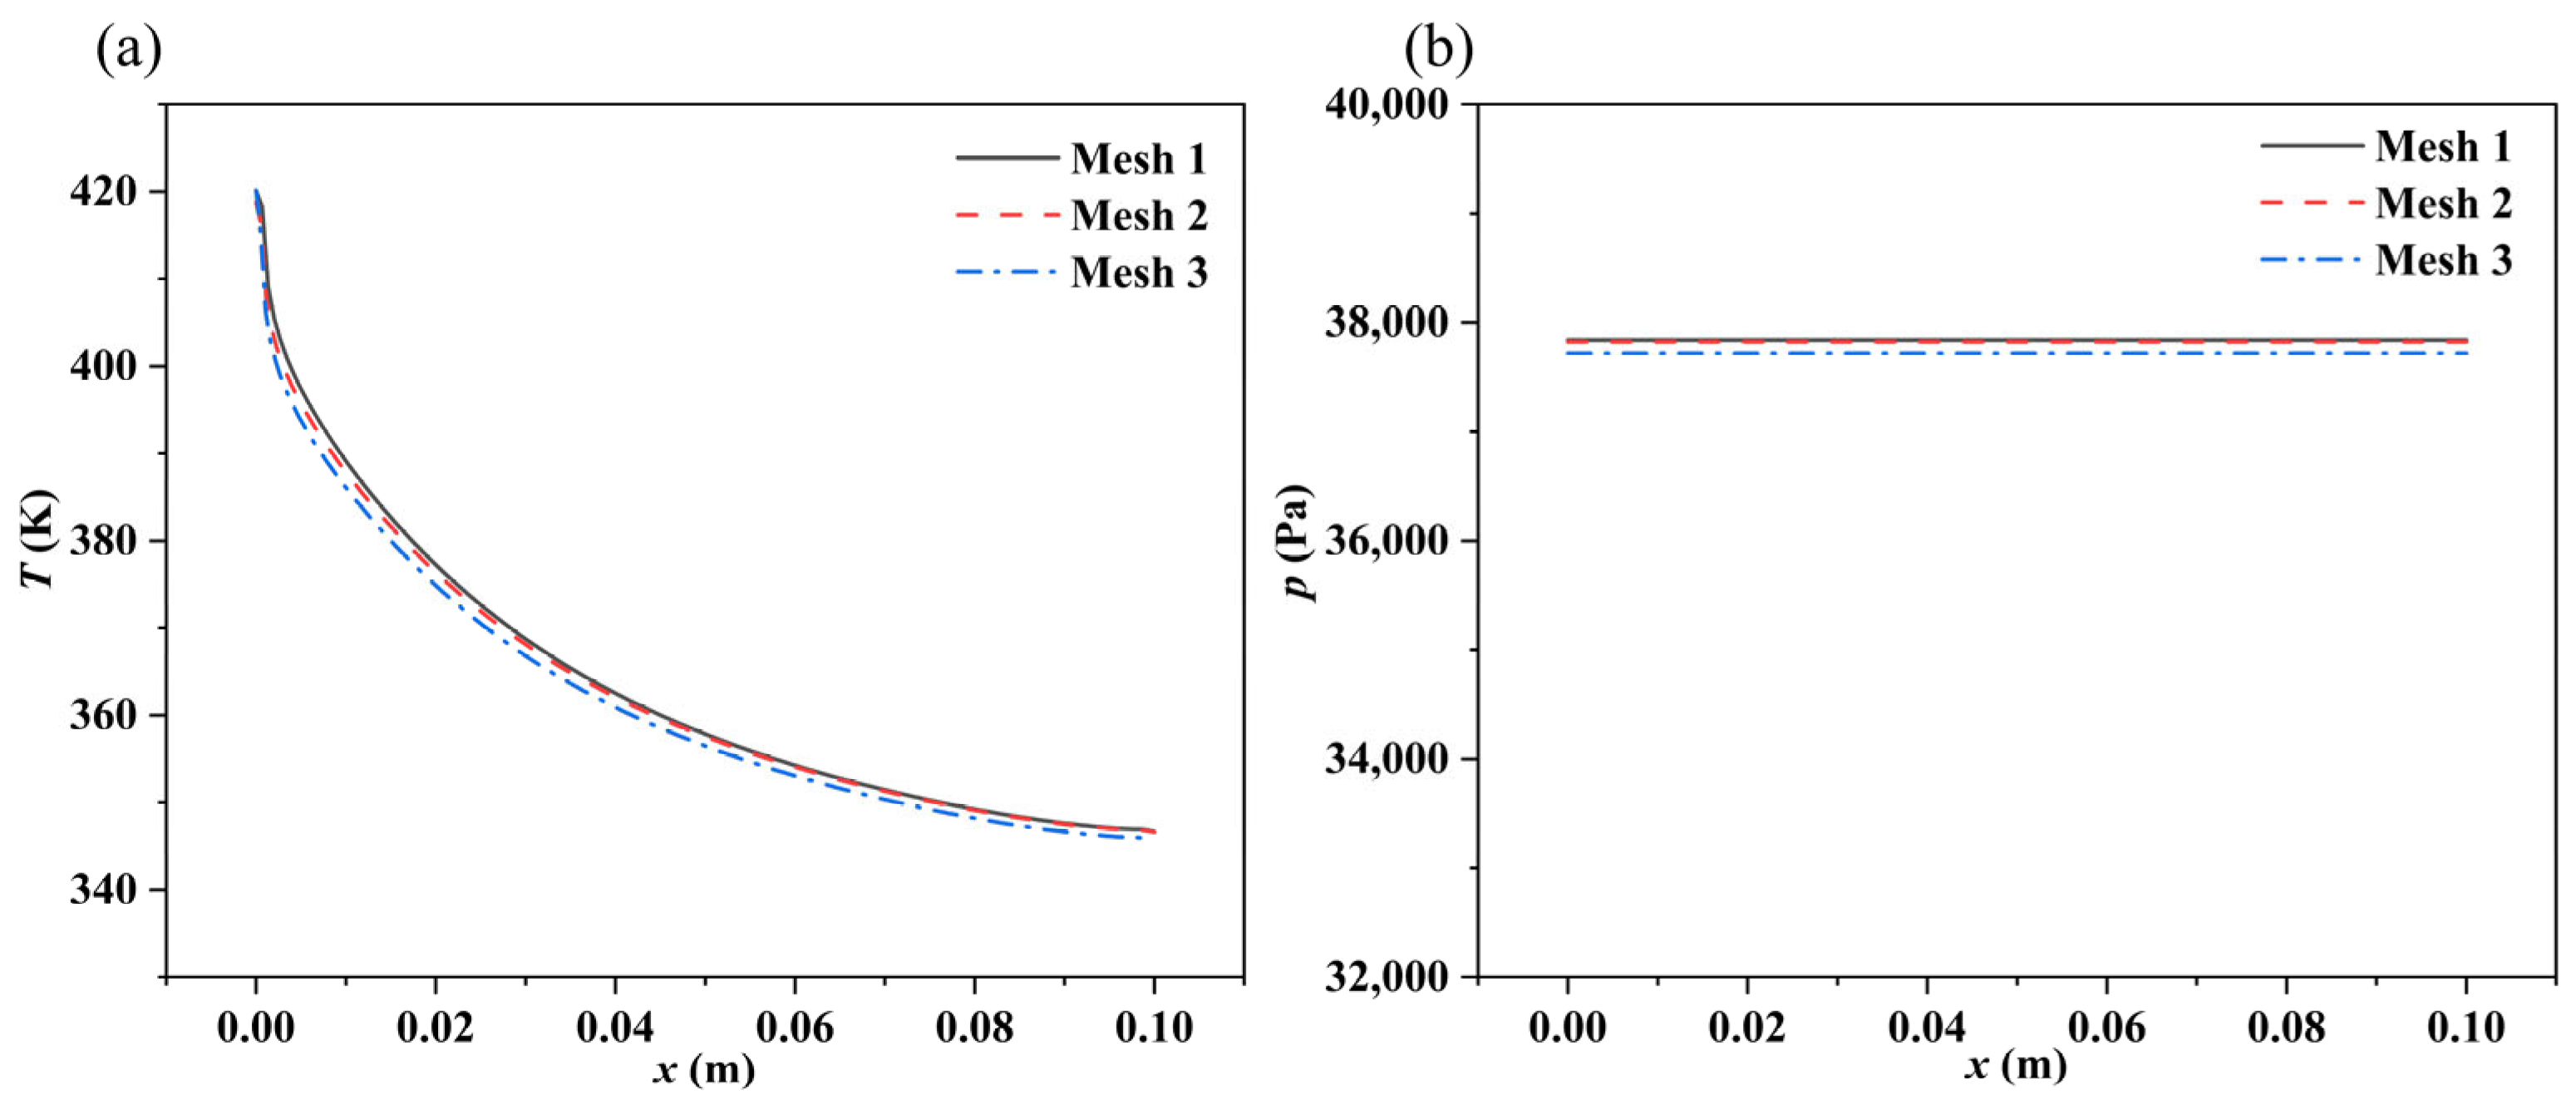
2.2. Mesh Independence Verification

ICEM CFD 2021 R2 commercial software was used to carry out structured meshing of the geometric model, as displayed in Figure 3. To accurately obtain temperature distribution on the porous plate surface, local mesh refinement was applied to the upper and lower surfaces of the porous medium and the wall of the main flow channel. The mesh independence of the model with a dp of 40 μm was verified under the same boundary conditions, and three mesh numbers with mesh 1 (75,025), mesh 2 (110,000), and mesh 3 (145,740) were used for calculations.
The temperature at the hot end surface of the porous plate and the pressure distribution at the inlet of the cooling chamber are shown in Figure 4, respectively. The results show that the distinction between the calculation results under the three mesh numbers is very small. To guarantee the accuracy of results and reduce the computational burden, mesh 2 (110,000) was selected as the final mesh node number.

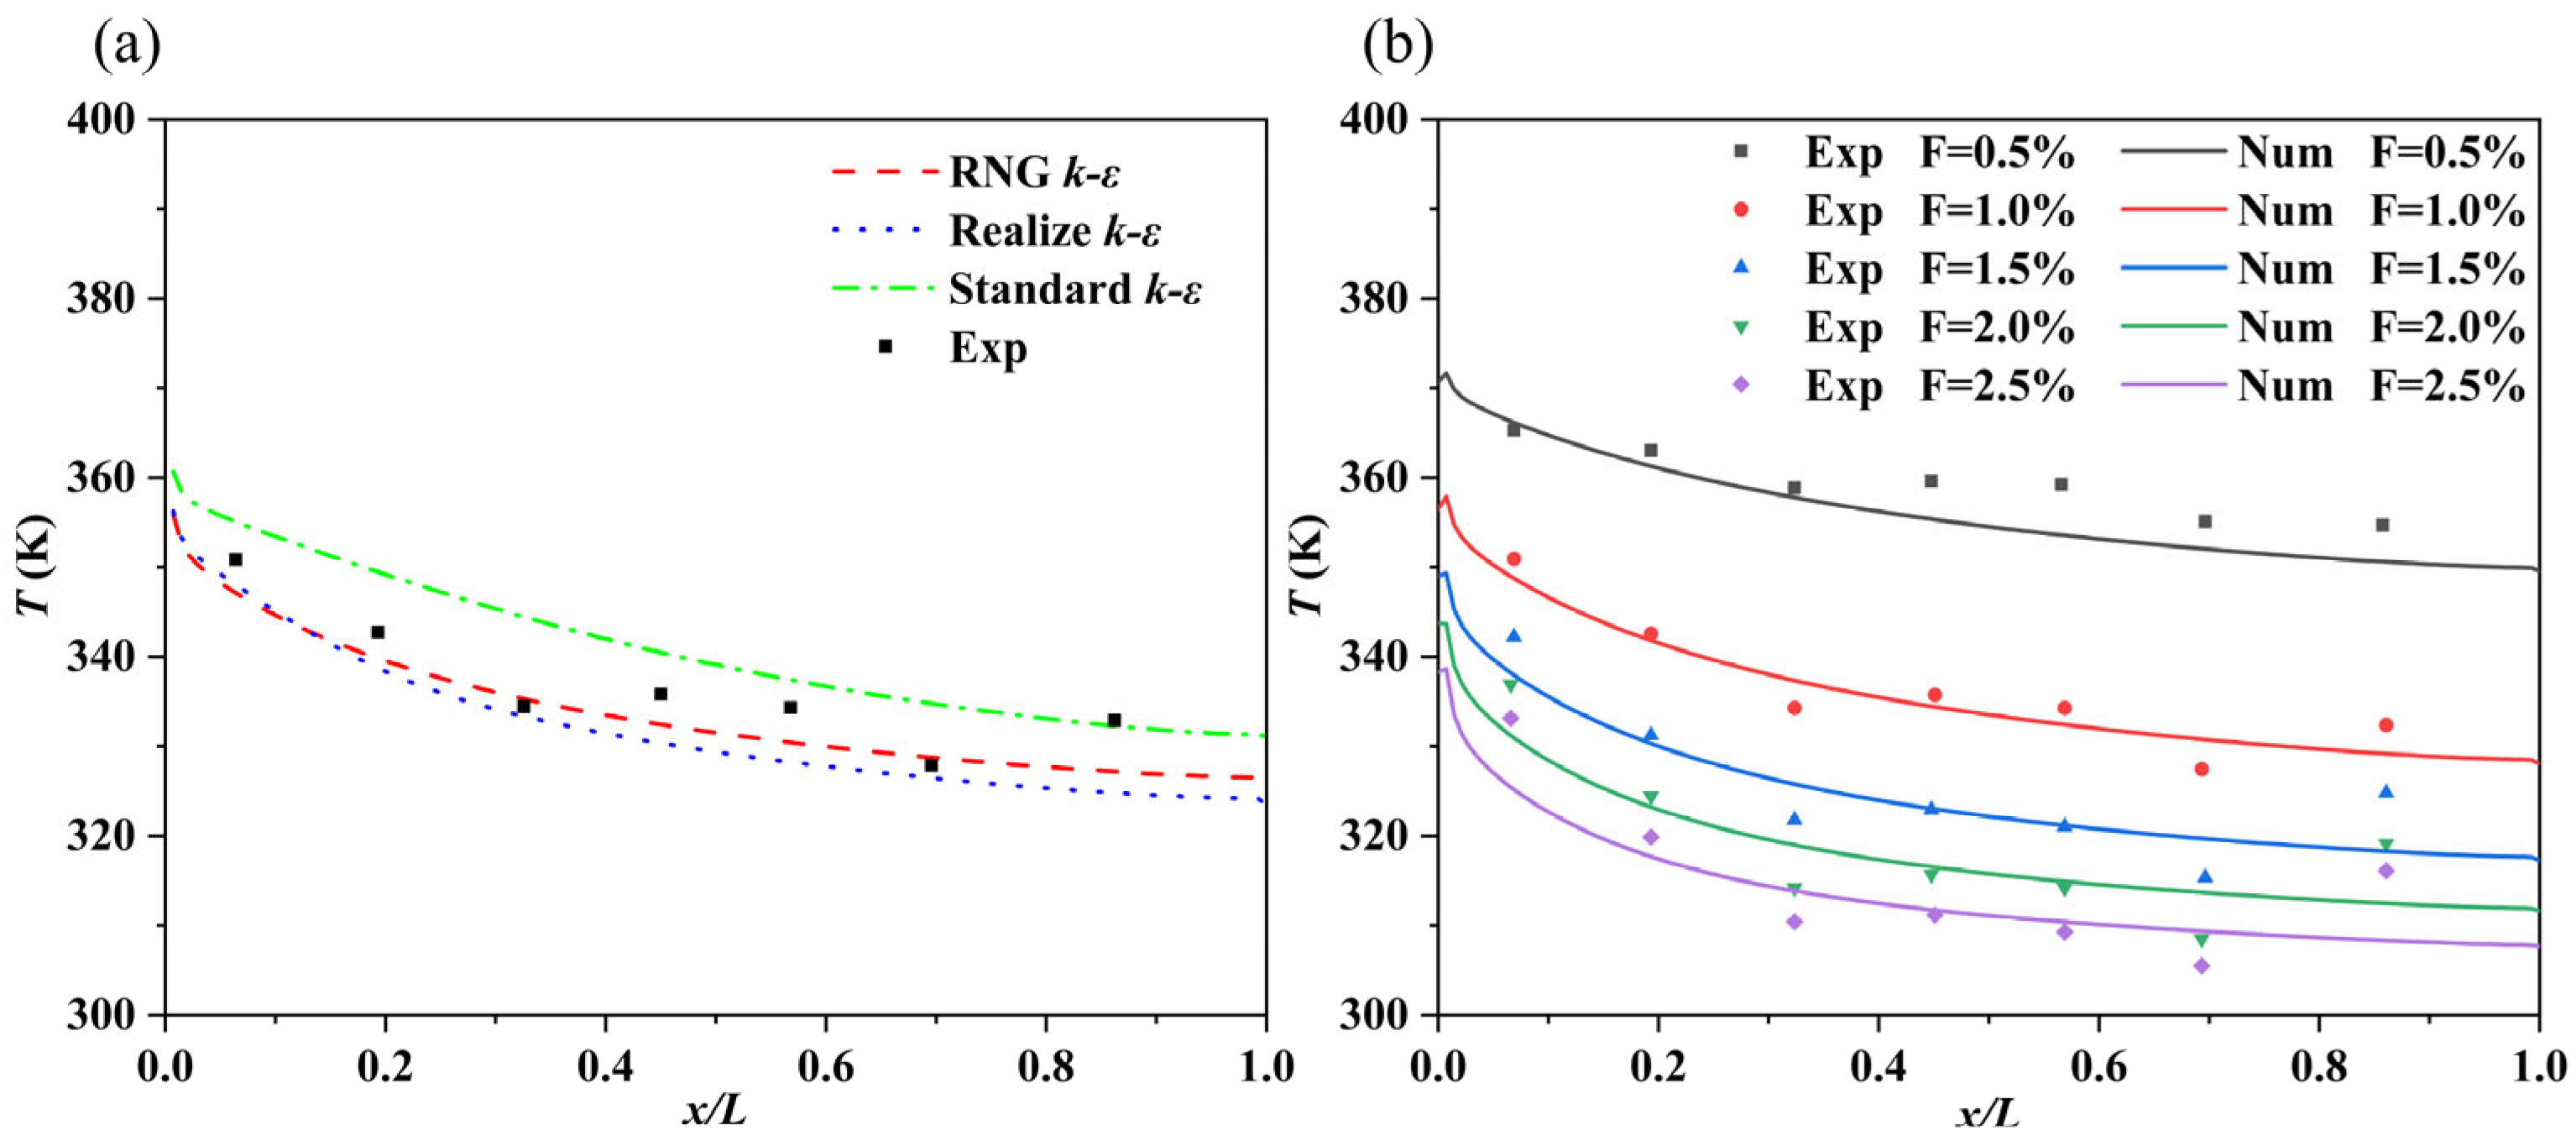
2.3. Numerical Method Validation

Liu et al. [12] conducted transpiration cooling experiments on porous plate test pieces sintered with 90 μm stainless steel metal particles to study their flow and heat transfer characteristics. The static temperature of main stream air was 373.15 K, the velocity was 30 m/s, the coolant was air, the static temperature was 293.15 K, and the temperature distribution of the hot end surface of the porous plate was measured under different coolant injection rates. The injection rate is calculated as follows:
F = ρ c u c ρ u
where ρc and uc are the density and velocity of the coolant and ρ and u are the density and velocity of the main stream air, respectively.
Under the same working conditions as the experiment, RNG k-ε, Realize k-ε, and Standard k-ε turbulence models were used for numerical simulation calculations, and the results were compared with the experimental data of Liu et al. [12]. Figure 5 shows the comparison between the numerical simulation results and experimental data.
As can be seen from Figure 5a, when the RNG k-ε turbulence model is adopted, the numerical calculation results are closer to the experimental results, and the maximum relative deviation is 1.72%. The RNG k-ε turbulence model is used to calculate transpiration cooling under different injection rates, and the results are shown in Figure 5b. It can be seen from Figure 5b that when the RNG k-ε turbulence model is used, there is a slight difference between the numerical calculation results and the experimental results, but the maximum error is less than 5%. Therefore, the RNG k-ε turbulence model can be used for calculations. The studies of related scholars [34] also prove that the RNG k-ε turbulence model has high applicability to plate transpiration cooling.

3. Analysis of Results and Discussion

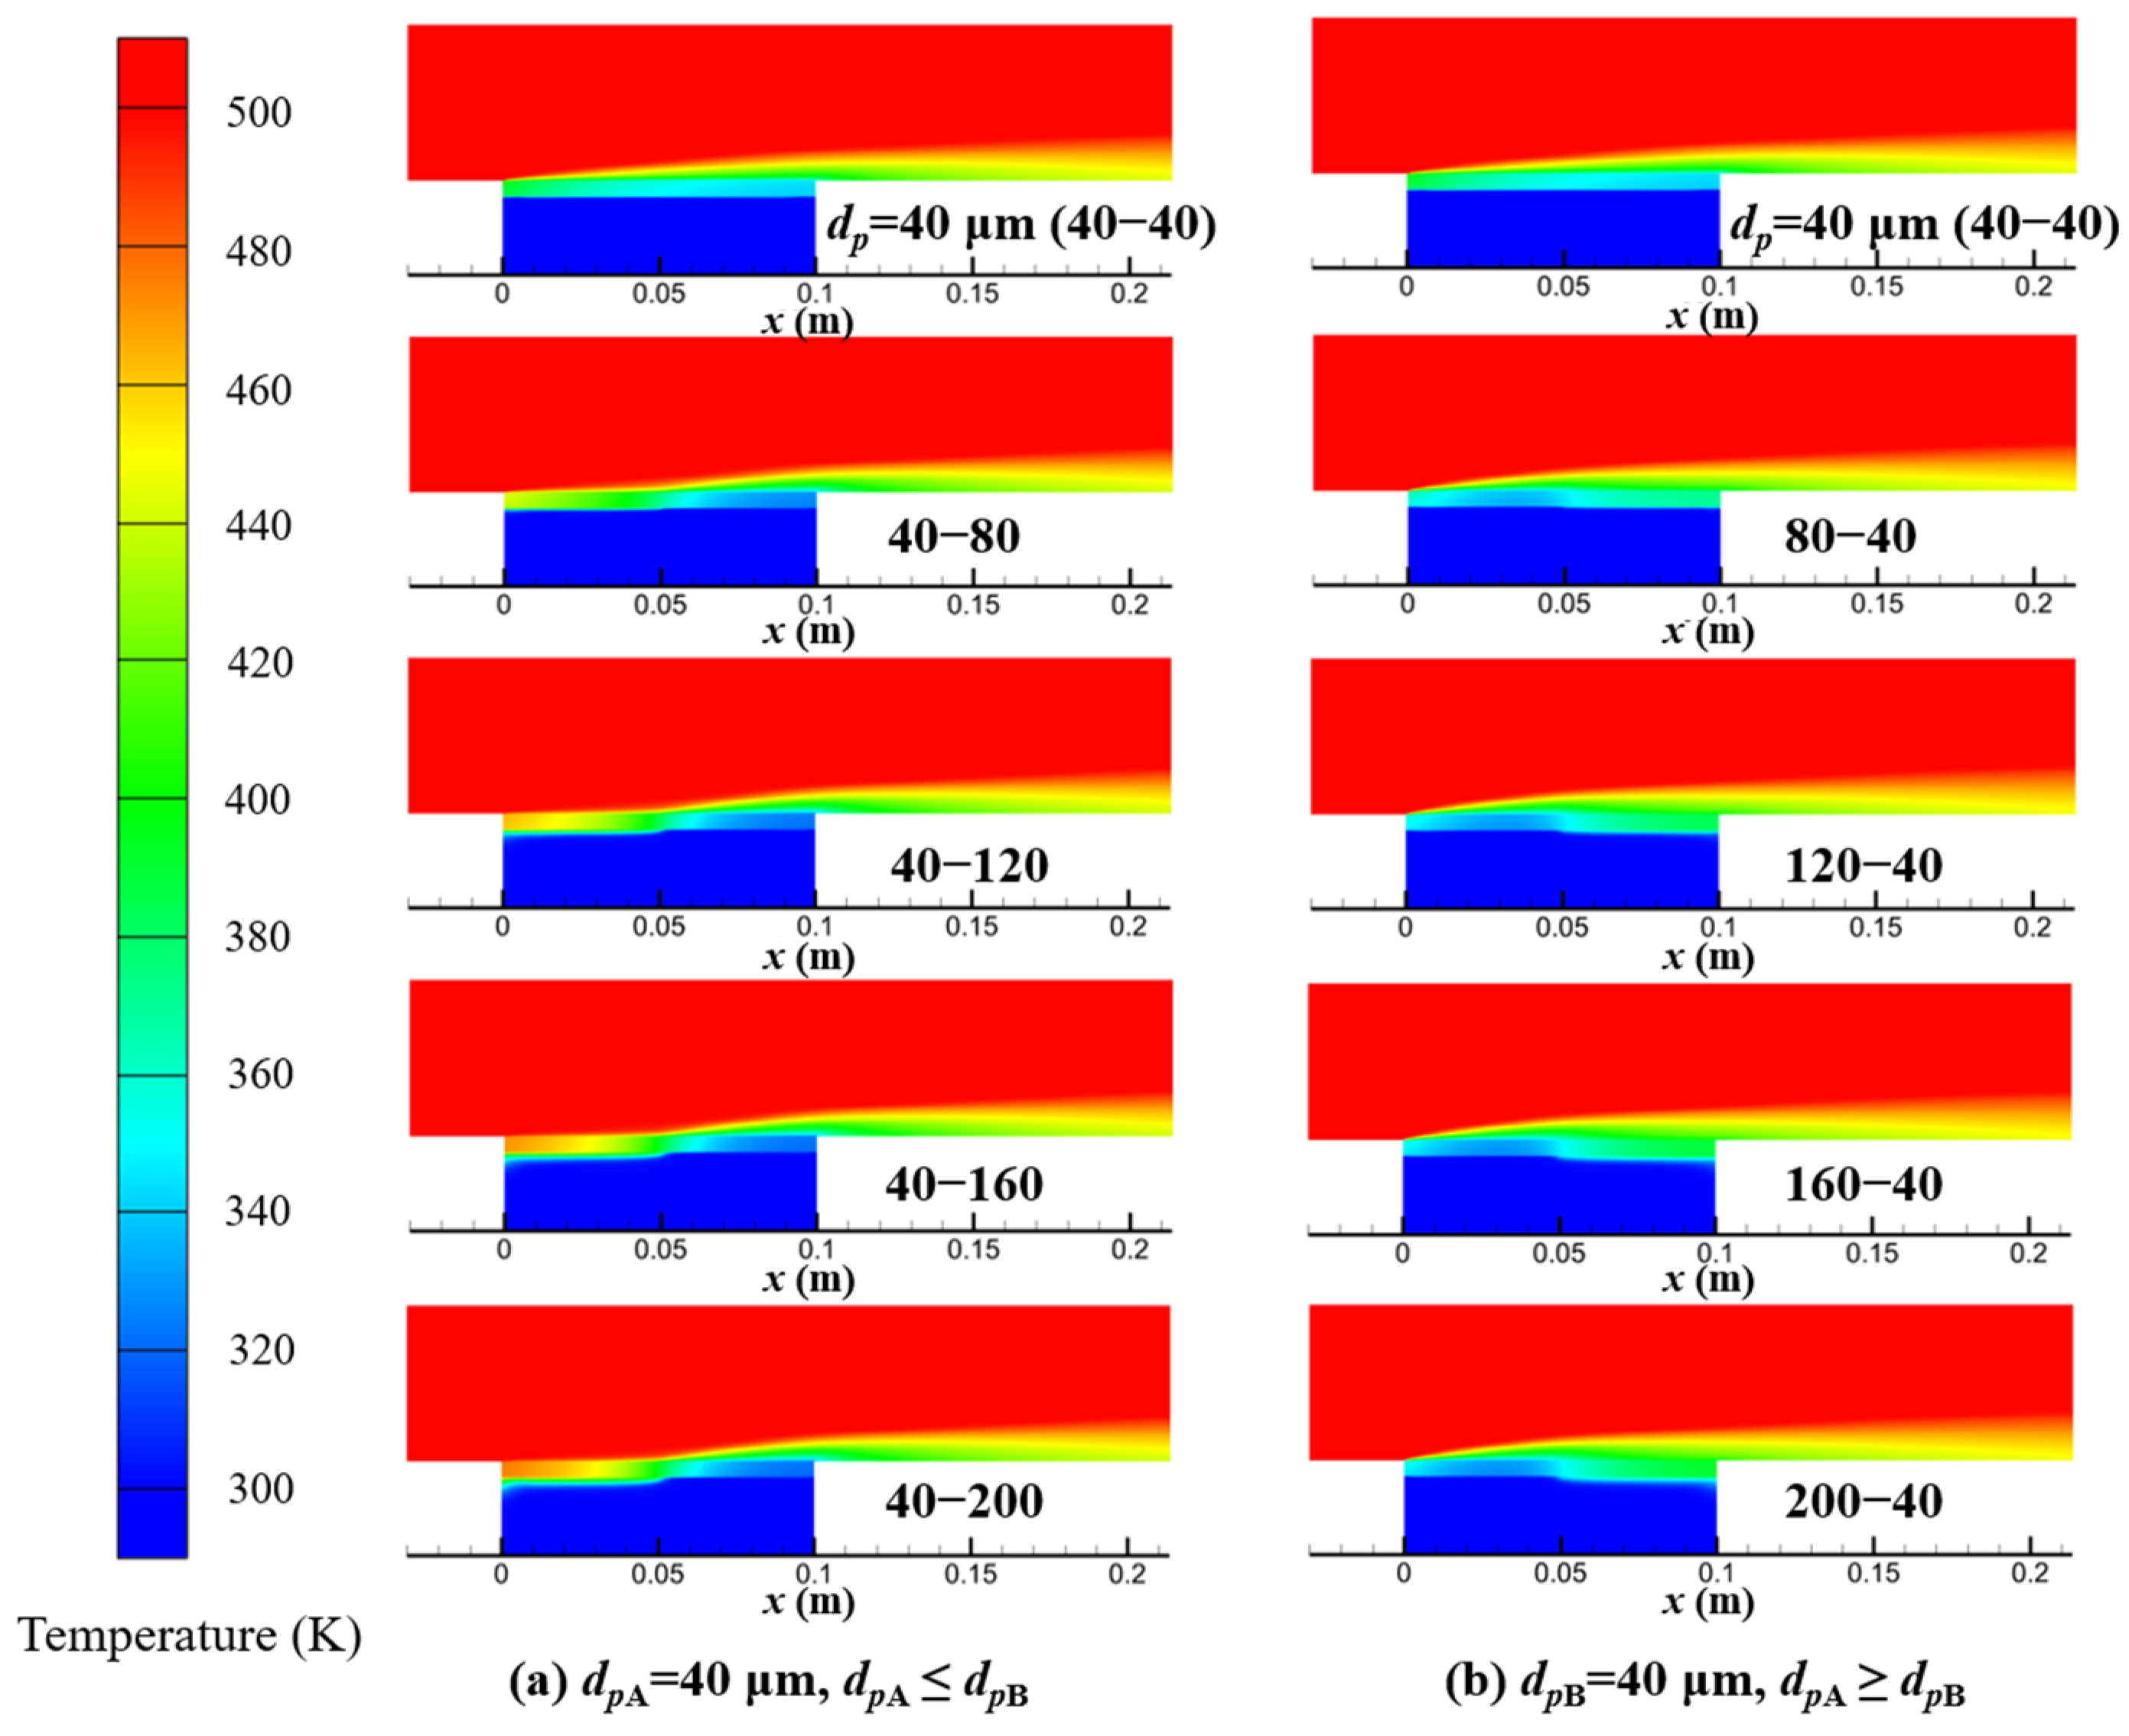
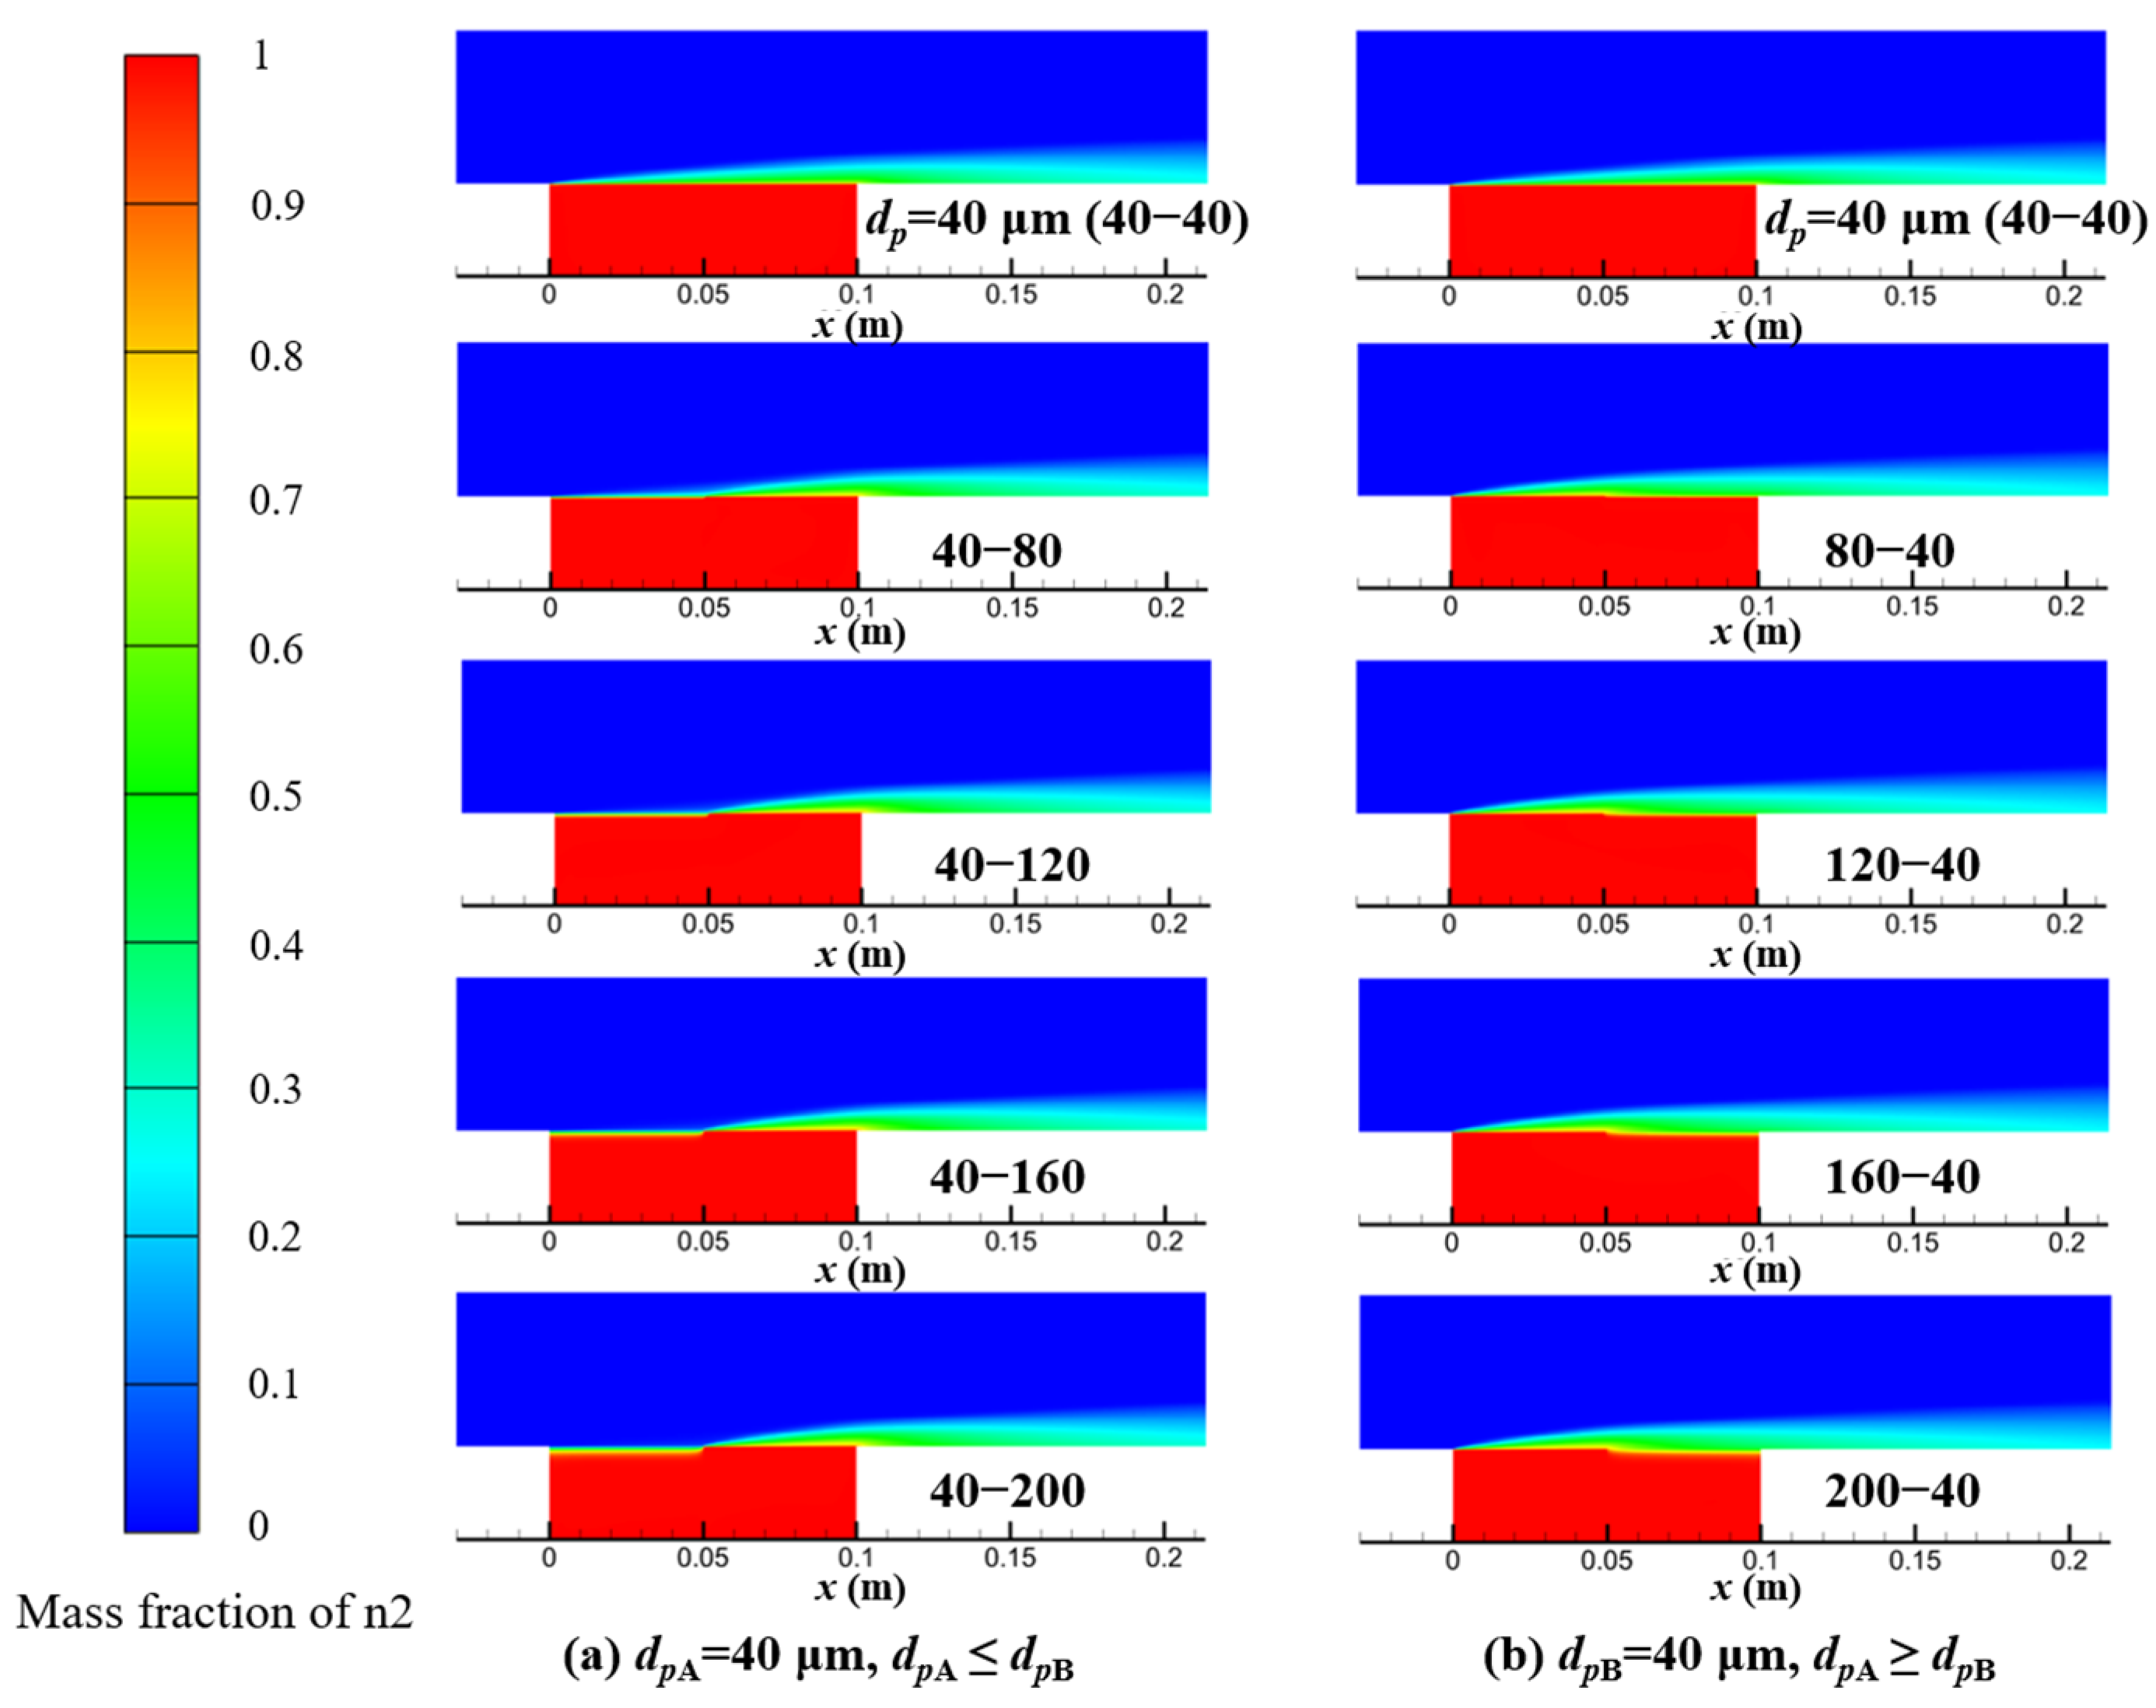
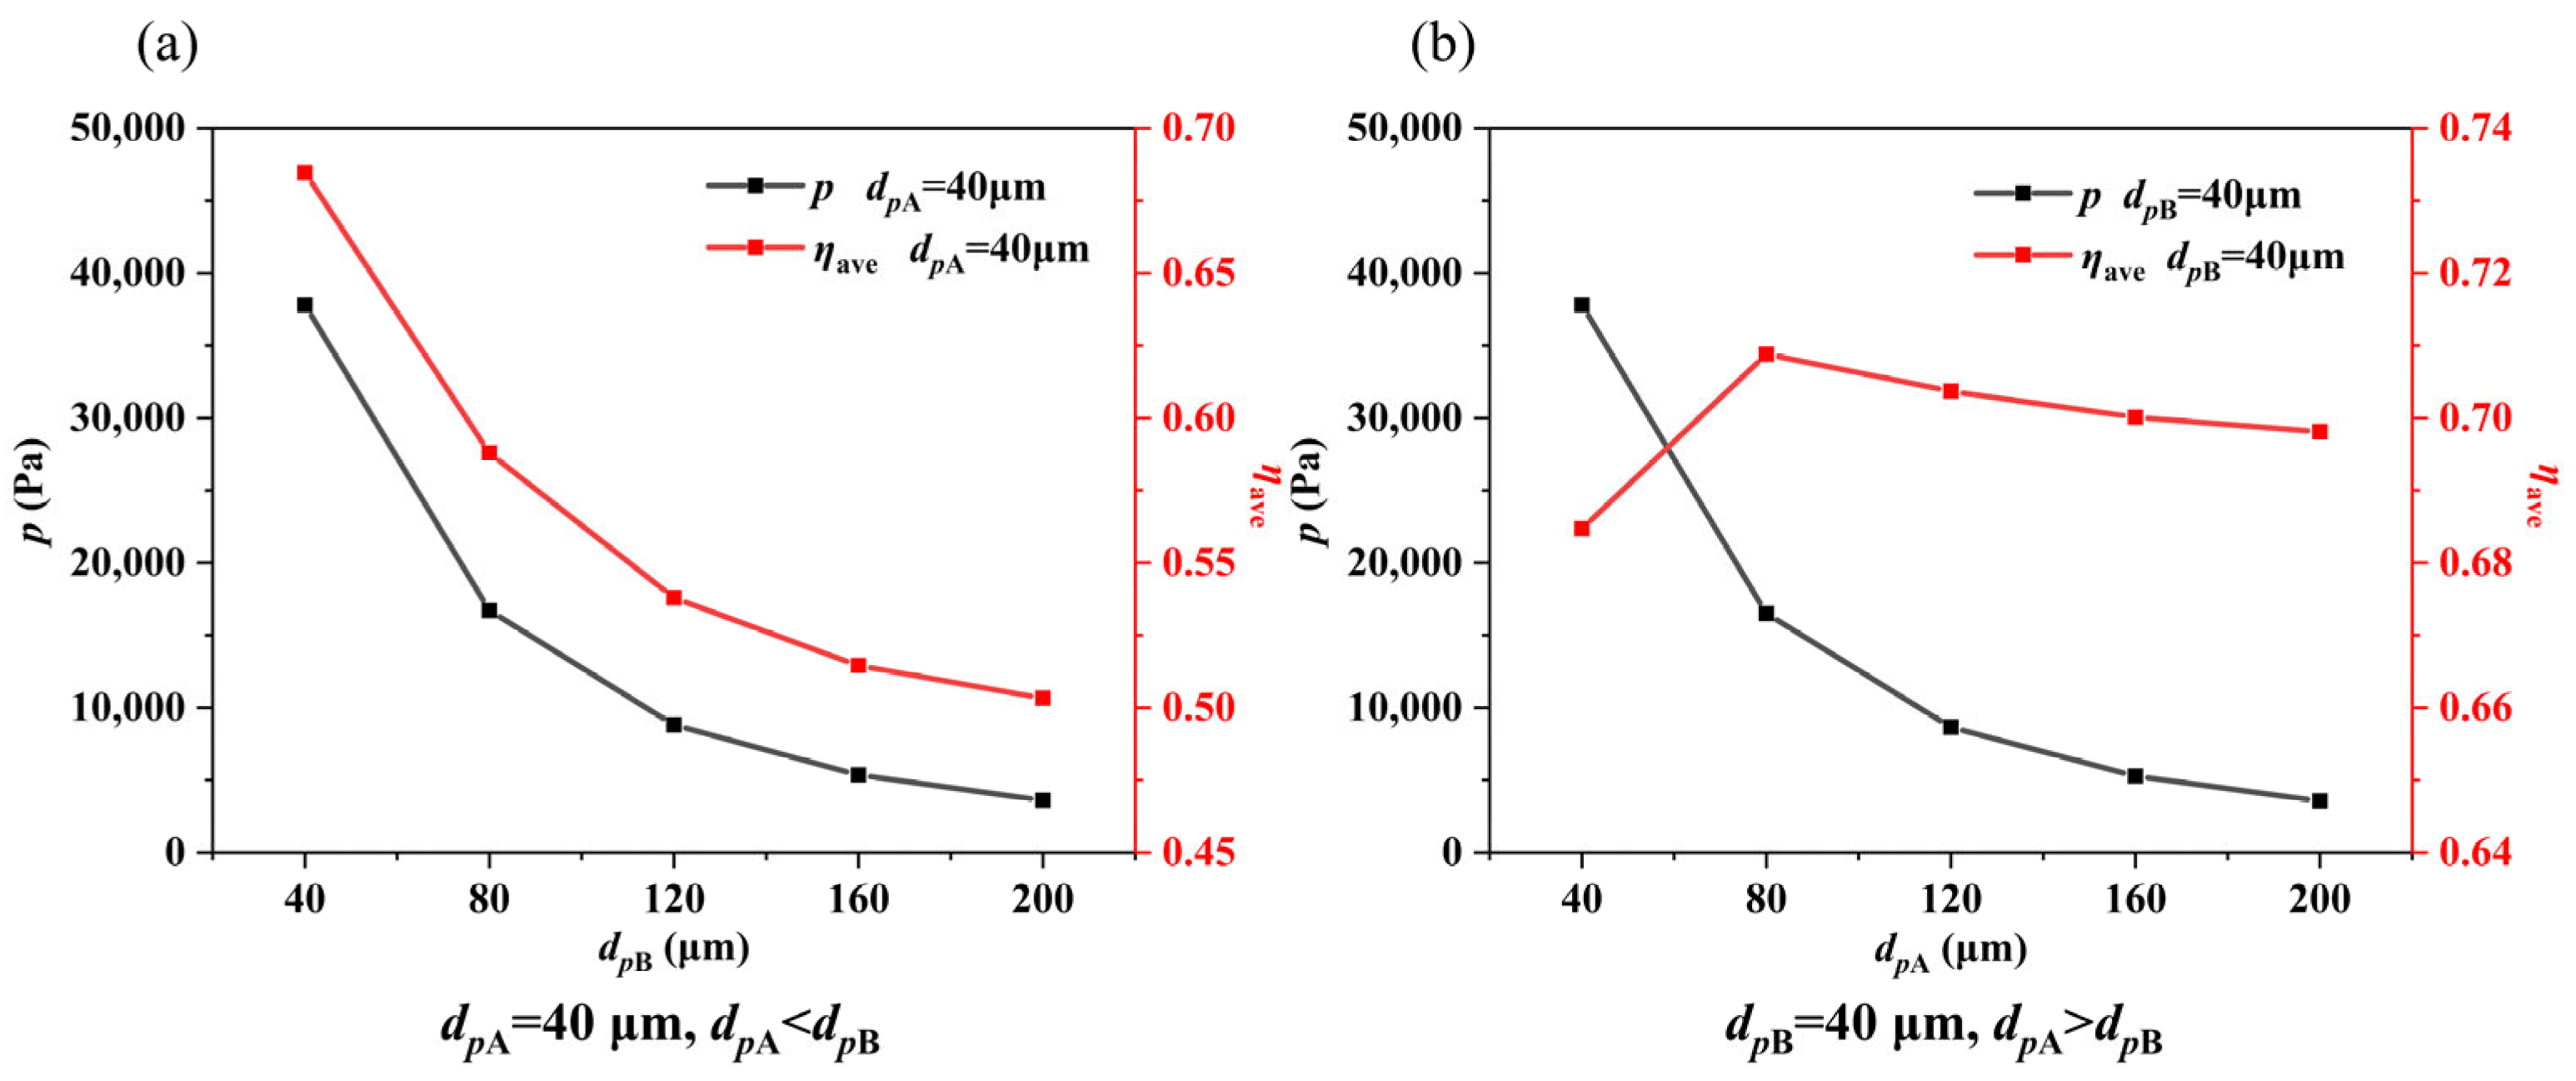
3.1. Cooling Performance of Porous Plate Structure

In order to further improve the overall cooling performance of the transpiration cooling plate structure, CPD−PS is proposed. The total length of the porous plate is kept at 100 mm, and the porous plate is divided into two plates, A and B. Different dp combination designs are adopted for plates A and B (dpAdpB). The cooling performance of CPD−PS is compared with that of SPD−PS with dp of 40 μm (dpAdpB of 40 μm–40 μm) under the conditions that the static temperature of the main stream is 500 K, velocity is 20 m/s, and the coolant is N2 at 300 K with a mass flow rate of 30 g/s. Figure 6 and Figure 7 are temperature and coolant mass fraction contours of the porous plate structure, respectively. Figure 6 presents the temperature distribution in various regions of the system, which intuitively reflects the uniformity of the cooling effect through the color gradients. In this figure, lower temperature regions usually indicate that the coolant has effectively taken away the heat, while the higher temperature regions may indicate an insufficient cooling effect. Figure 7 presents the distribution of the coolant (N2) in the system through the color gradients, revealing the flow and diffusion characteristics of the coolant. By observing Figure 6 and Figure 7, the overall cooling performance of the system can be evaluated.
As can be seen from Figure 6, when dpA is 40 μm, dpB gradually increases, dpA < dpB, the surface temperature of plate A increases significantly, and that of plate B decreases; additionally, the temperature difference between upstream and downstream increases significantly. When dpB is 40 μm, dpA gradually increases, dpA > dpB, the surface temperature of plate A decreases, and that of plate B increases, which effectively reduces the maximum temperature on the porous plate surface, and the temperature distribution uniformity of the whole plate is enhanced. As shown in Figure 7, the coolant mass flow from the porous plate surface changes with the change in dp. When dpB is 40 μm, the coolant mass flow from the plate A surface gradually increases with dpA, that is, dpA > dpB, while that from the plate B surface gradually decreases, the coolant distributed upstream of the porous plate increases, the upstream cooling effect is enhanced and the surface temperature decreases, the downstream temperature slightly increases, and the temperature difference between the upstream and downstream decreases.
Figure 8 shows the temperature distribution and mass fraction distribution on the hot end surface of the porous plate structure. Taking the results of SPD−PS with a dp of 40 μm (40 μm–40 μm) as a reference, the upstream maximum temperature reaches 418.82 K, and the maximum temperature difference between upstream and downstream reaches 72.50 K. As shown in Figure 8a, when dpA is fixed at 40 μm, that is, dpA < dpB, as dpB gradually increases, the upstream maximum temperature of the porous plate increases, the downstream surface temperature decreases, and the upstream and downstream temperature difference increases significantly. When dpAdpB is 40 μm–200 μm, the maximum temperature increases to 481.78 K and the temperature difference in the hot end surface also increases to 156.27 K. When dpB is fixed at 40 μm, that is, dpA > dpB, as dpA increases, the upstream maximum temperature of the porous plate decreases significantly, the downstream surface temperature increases slightly, and the upstream and downstream temperature difference decreases. When dpAdpB is 200 μm–40 μm, the maximum temperature decreases to 385.93 K and the temperature difference also decreases to 60.39 K. From Figure 8b, when dpB is fixed at 40 μm, that is, dpA > dpB, with the gradual increase in dpA, the coolant distributed upstream of the plate increases, the content of coolant in the downstream decreases, the cooling effect is enhanced, the downstream temperature increases slightly, and the temperature difference between the upstream and downstream decreases.
According to the permeability formula of porous media from Table 1, as dp increases, the permeability of the porous plate increases and the flow resistance of the cooling fluid in porous media decreases. When the coolant mass flow is constant, the coolant will preferentially flow from the surface of the porous plate with greater permeability. Therefore, the porous plate is divided into two plates, A and B, with different dp, which can regulate coolant distribution. When dpA > dpB, it can effectively increase the coolant mass flow from upstream of the porous plate, effectively reduce the maximum temperature upstream of the porous plate, and reduce the surface temperature difference.
Figure 9 shows the pressure at the inlet of the cooling chamber and the average cooling efficiency (ηave) of CPD−PS. The calculation formulas of cooling efficiency η and average cooling efficiency ηave are Equations (3) and (4), respectively [18]:
η = T w T T c T
η ave = 0 l η ( x ) d x l
Among them, Tw is the temperature of the hot end surface of the porous media in contact with the main stream, K; T is the total temperature of the main stream, K; Tc is the coolant temperature, K; and l is the total length of the porous plate, m.
It can be seen from Figure 9 that in CPD−PS, when the dp of one plate is constant and the dp of the other plate is gradually increased, the inlet pressure of the cooling chamber is gradually reduced. According to the analysis of the permeability formula of porous media, with the increase in dp, the permeability of porous media gradually increases and the flow resistance of coolant in porous media gradually decreases. Under the same mass flow condition, the coolant injection pressure to flow out of the porous medium is smaller, which reduces the inlet pressure of the cooling chamber. From the average cooling efficiency curve, it can be seen that when dpA is fixed at 40 μm, that is, dpA < dpB, ηave gradually decreases with the increase in dpB. When dpB is fixed at 40 μm, that is, dpA > dpB, ηave increases first and then decreases slightly with the increase in dpA, but they are all larger than that of the single porous plate with dp of 40 μm. This shows that the ηave of the transpiration cooling system can be effectively improved when the CPD−PS is used and the dp of the upstream plate is larger than that of the downstream plate.

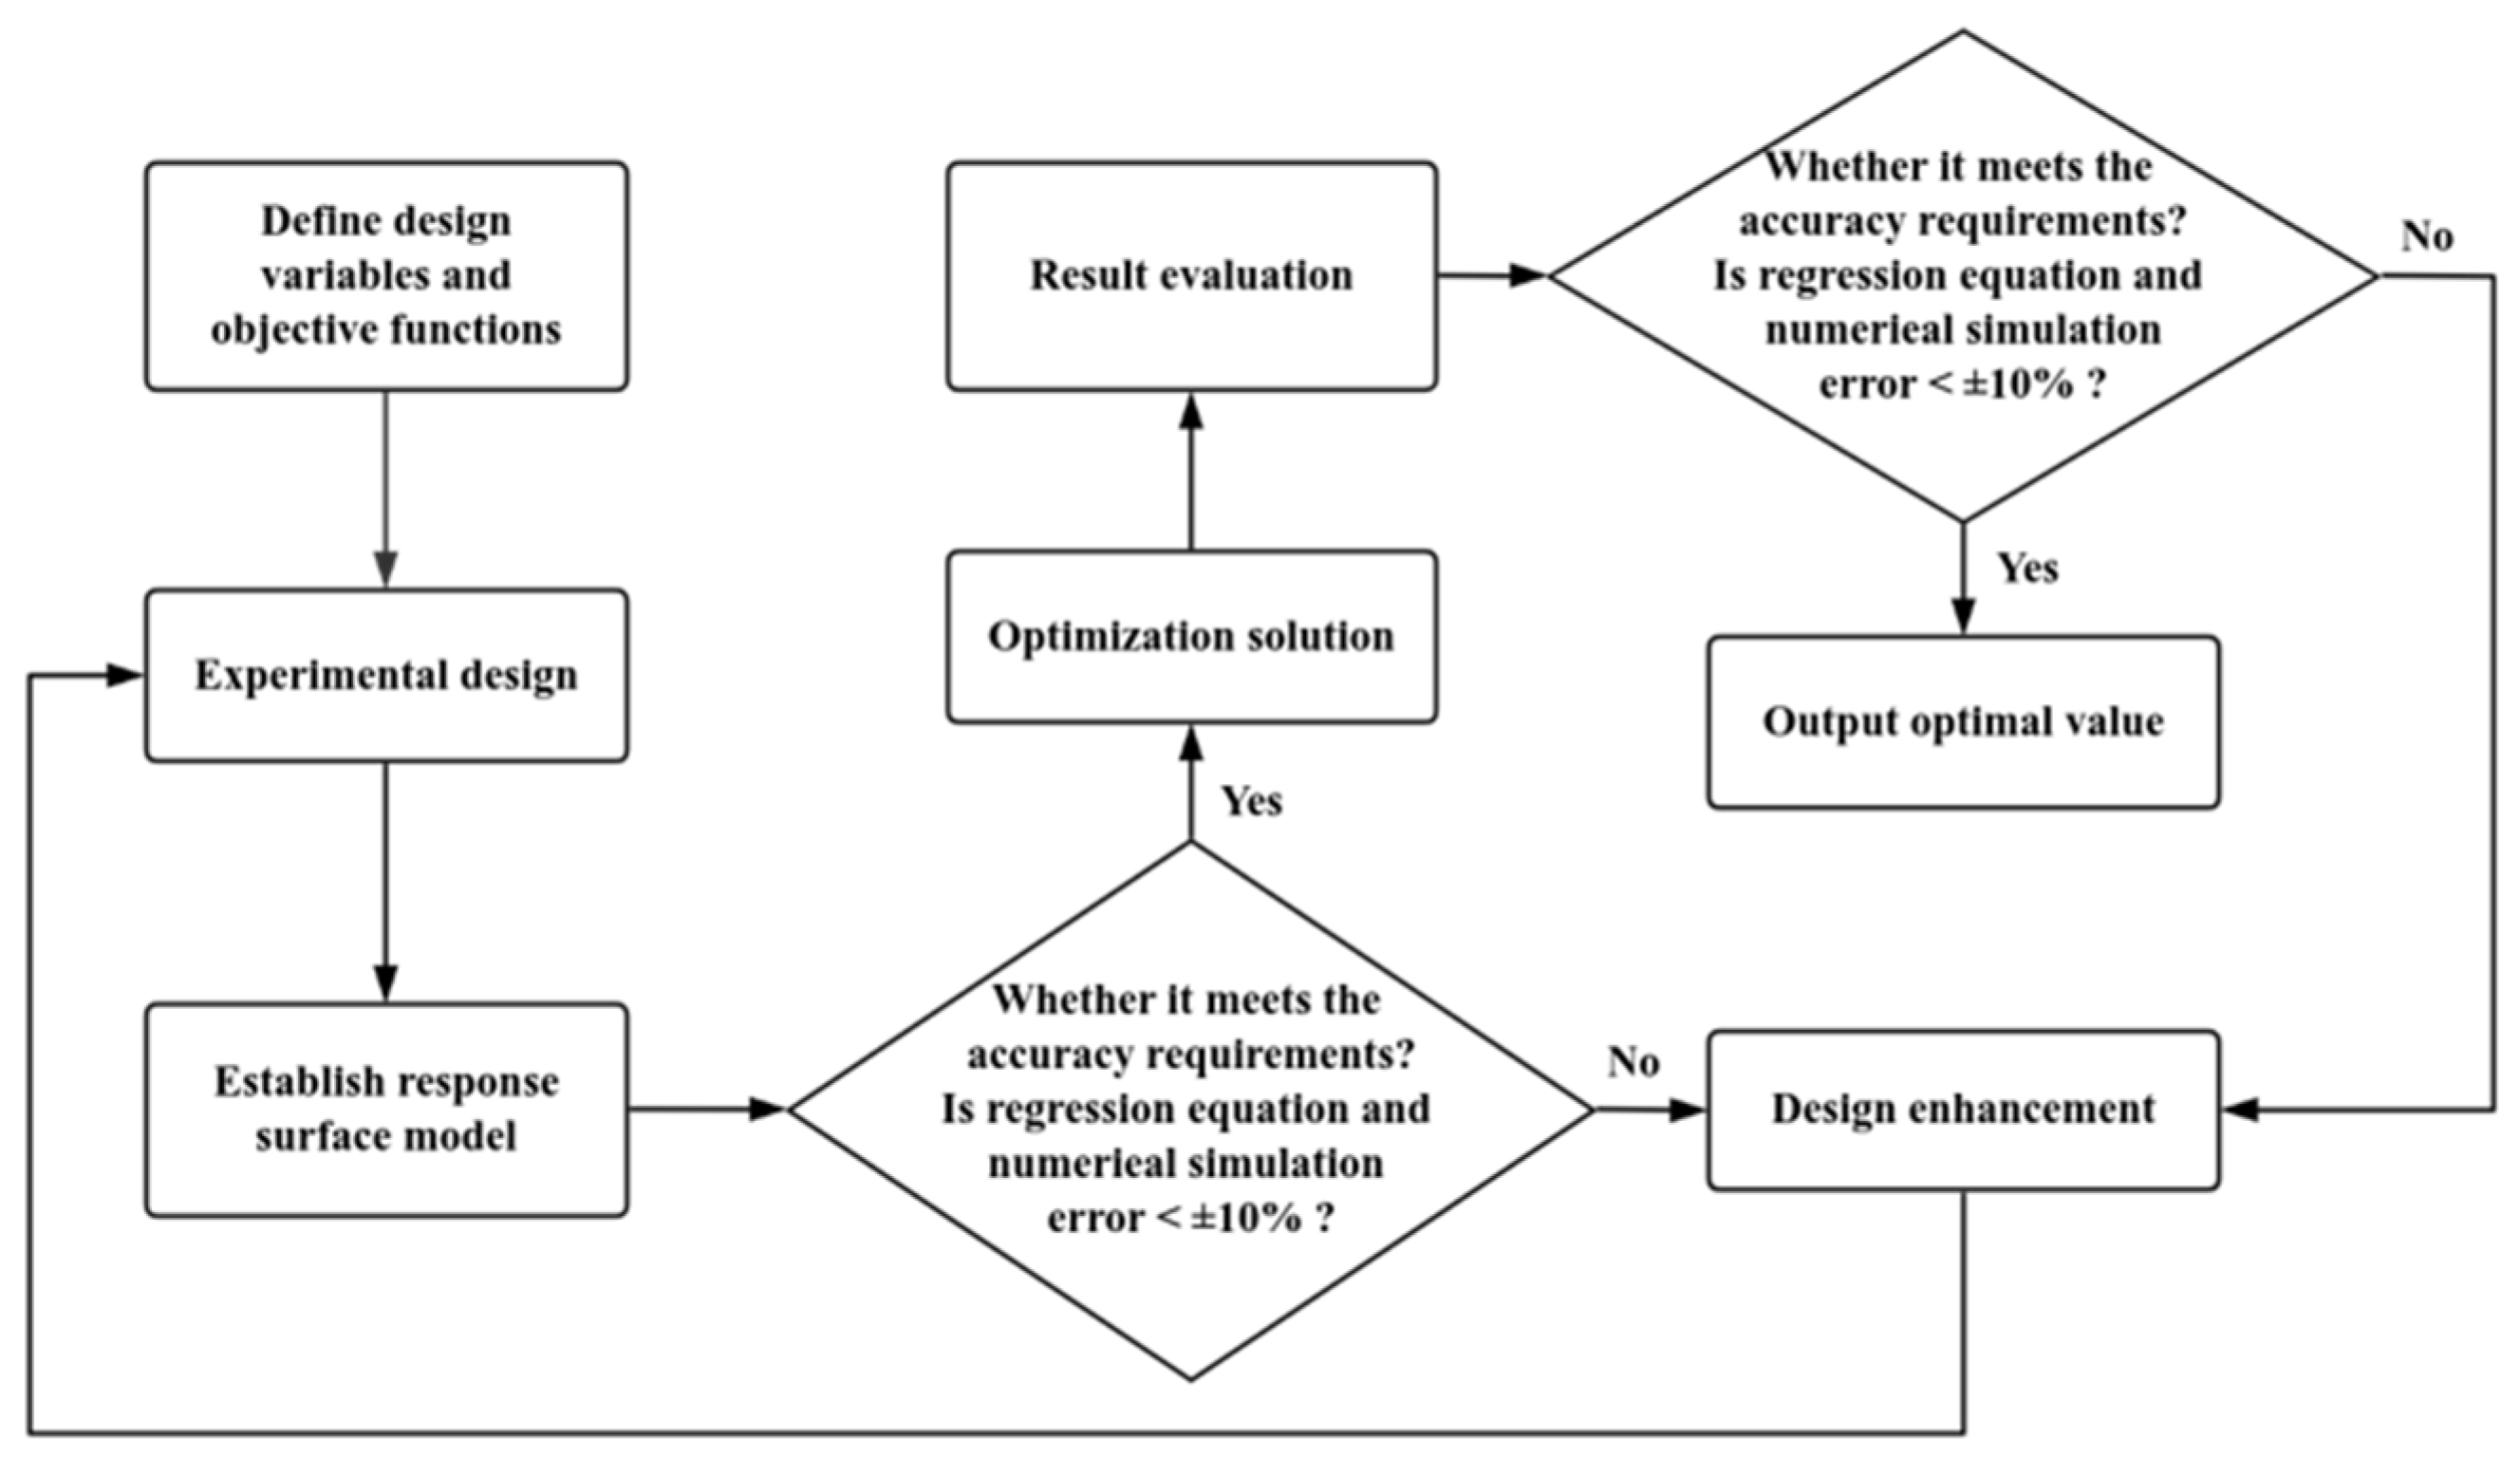
3.2. Response Surface Methodology for Optimal Design

RSM is a mathematical and statistical method used to optimize experimental conditions and establish relationships between input variables and output responses. It can estimate complex non-linear models in less time through effective experimental design methods. Compared with traditional test methods, it can save more time and costs. Based on the idea of multivariate function approximation, RSM assumes that there is an approximate functional relationship between the output variable and multiple input variables in a specific experimental area, which is described by a polynomial regression equation. The general expression is Formula (5):
y = β 0 + i = 1 k β i x i + i = 1 k β i i x i 2 + i < j β i j x i x j + a
where β0, βi, βii, and βij are the regression coefficients, respectively, a is the error, xi and xj are the design variables, y is the objective function, and k is the number of design variables.
After fitting the model based on the experimental data, the regression equation is used to analyze the variable influence law and optimize it. The prediction accuracy is verified by comparing the CFD results. The polynomial fitting process for objective functions based on response surface methodology is shown in Figure 10.

3.2.1. Parameter Setting

As an important parameter of porous media, dp affects coolant flow resistance, heat exchange efficiency, and the cooling effect. Different dp will change the pore structure and permeability of porous media and then affect the coolant flow characteristics and heat transfer. Although small dp can increase the specific surface area and promote heat exchange, it will increase flow resistance. Large dp can reduce flow resistance, but it will reduce the heat exchange area. Therefore, the reasonable design of dp and other porous media parameters is very important to optimize transpiration cooling performance. Previous studies [5,12,24,35] have proven that other porous media parameters are also important for the transpiration cooling effect. The CPD−PS can improve the cooling effect to a certain extent. In order to further improve the average cooling efficiency and balance the relationship between the cooling effect and energy consumption, it is also necessary to optimize the parameters of porous media.
In this section, under identical main stream and coolant working conditions, the influence of porous media parameters on the transpiration cooling performance of CPD−PS is investigated. Five structural parameters, namely dpA, A plate porosity (εA), thickness (h), A plate length (lA), and B plate porosity (εB), are taken as influencing factors, dpB is fixed at 40 μm, and ηave and p are taken as objective functions P6 and P7, respectively. The experimental design method uses the optimal space-filling design, which can fill the design space with the minimum number of design points, generate sample points evenly in the space, and provide relatively complete sample coverage, which can make more effective use of the design space. Table 3 shows the values of each factor.

3.2.2. Response Surface Model Construction

In the process of parameter optimization, by determining parameters closely related to optimization results, the calculation amount can be reduced and calculation efficiency can be improved, which is of great value in practical application scenarios. Figure 11 shows the response curve and local sensitivity distribution of each structural parameter. Through chart analysis, it can be seen the specific impact and influence degree of different structural parameters on performance, and then we can formulate a more targeted optimization scheme.
From Figure 11a–e, it can be seen that p is negatively correlated with dpA, εA, lA, and εB and positively correlated with h. It can be seen from Figure 11f that the degree of influence on p in descending order is εB, εA, dpA, lA, and h. ηave is positively correlated with h and negatively correlated with εB. When dpA increases, ηave first increases and then decreases. When εA increases, ηave first increases and then slightly decreases. When lA increases, ηave first decreases and then increases. It can be seen from Figure 11f that the degree of influence on ηave is in descending order as follows: εB, εA, dpA, h, and lA. Through the comparison results, it is found that h has little effect on the objective function P6−ηave and lA has little effect on the objective function P7−p, which can be ignored. The response surface regression equations for the objective functions ηave and p are established as follows:
y 1 = 0 . 683518 + 0.000686 x 1 + 0.401034 x 2 0.001534 x 4 0.407082 x 5 0.001918 x 1 x 2 + 0.00000231 x 1 x 4 + 0.002011 x 1 x 5 + 0.000872 x 2 x 4 + 1.09887 x 2 x 5 0.001053 x 4 x 5 0.00000239 x 1 2 0.663293 x 2 2 + 0.000016 x 4 2 0.411976 x 5 2
y 2 = 249228 659 . 68547 x 1 440326 x 2 9508 . 0117 x 3 325061 x 5 + 360 . 30605 x 1 x 2 + 529 . 08156 x 1 x 5 + 954 . 23598 x 2 x 3 + 394740 x 2 x 5 + 0 . 882481 x 1 2 + 220128 x 2 2 + 698 . 37374 x 3 2 + 86191 . 34093 x 5 2
where x1, x2, x3, x4, and x5, respectively, represent dpA, εA, h, lA, and εB. y1 and y2, respectively, represent ηave and p.
According to the response surface regression equation, the response surface graph of the interaction term on the objective function is drawn. The response surface graph can directly reflect the impact of multi-factor interaction on the objective functions ηave and p. The response surface graphs are shown in Figure 12 and Figure 13, respectively.
From Figure 12, for CPD−PS, ηave first increases and then decreases as dpA and εA increase. This is because when dpB is fixed at 40 μm, the increase in dpA and εA boosts the permeability of the A plate, increasing coolant mass flow from the A plate surface and reducing the upstream temperature of the porous plate. Meanwhile, the increase in dpA and εA also increases the specific surface area, enhances heat exchange, reduces the maximum temperature of the hot end surface, and improves ηave. However, with the continuous increase in dpA and εA, the coolant mass flow from the surface of the A plate increases, reducing that from the B plate surface, which is not enough to effectively cool the B plate surface. The B plate surface temperature increases, which slightly reduces ηave. Therefore, in CPD−PS, the continuous increase in dpA and εA does not necessarily have a positive effect on the improvement of ηave. As lA increases, ηave first decreases and then increases, because in CPD−PS, dpA > dpB, the shorter lA makes the coolant flow out of the A plate surface preferentially with much more coolant flow out of the A plate than the B plate surface. The high temperature upstream of the porous plate decreases significantly. As lA increases, the coolant mass flow from the A plate surface decreases, resulting in the relative increase in the maximum temperature on the A plate surface and the decrease in ηave. When lA increases to a certain extent, the coolant distribution from the porous plate becomes more uniform, which effectively cools the hot end surface as a whole, thus slightly improving ηave. In addition, the ηave of CPD−PS decreases as εB increases. As ε increases, the coolant flow resistance in porous media decreases, the flow becomes smoother, the fluid flow speed is accelerated, and the heat is not fully exchanged and transferred, which reduces the overall cooling efficiency.
As can be seen from Figure 13, when dpA, εA, and εB increase, the flow resistance of the coolant decreases, making the coolant flow more smoothly in the porous medium and the coolant injection pressure p decreases. However, when h increases, the flow path of coolant in the porous medium becomes longer, the pressure loss of the fluid in the porous medium increases, and the flow resistance of the coolant further increases. Therefore, in order to ensure that the coolant can flow out of the porous medium smoothly, it is necessary to increase the injection pressure so that the coolant can have sufficient power to overcome the flow resistance and achieve effective cooling.

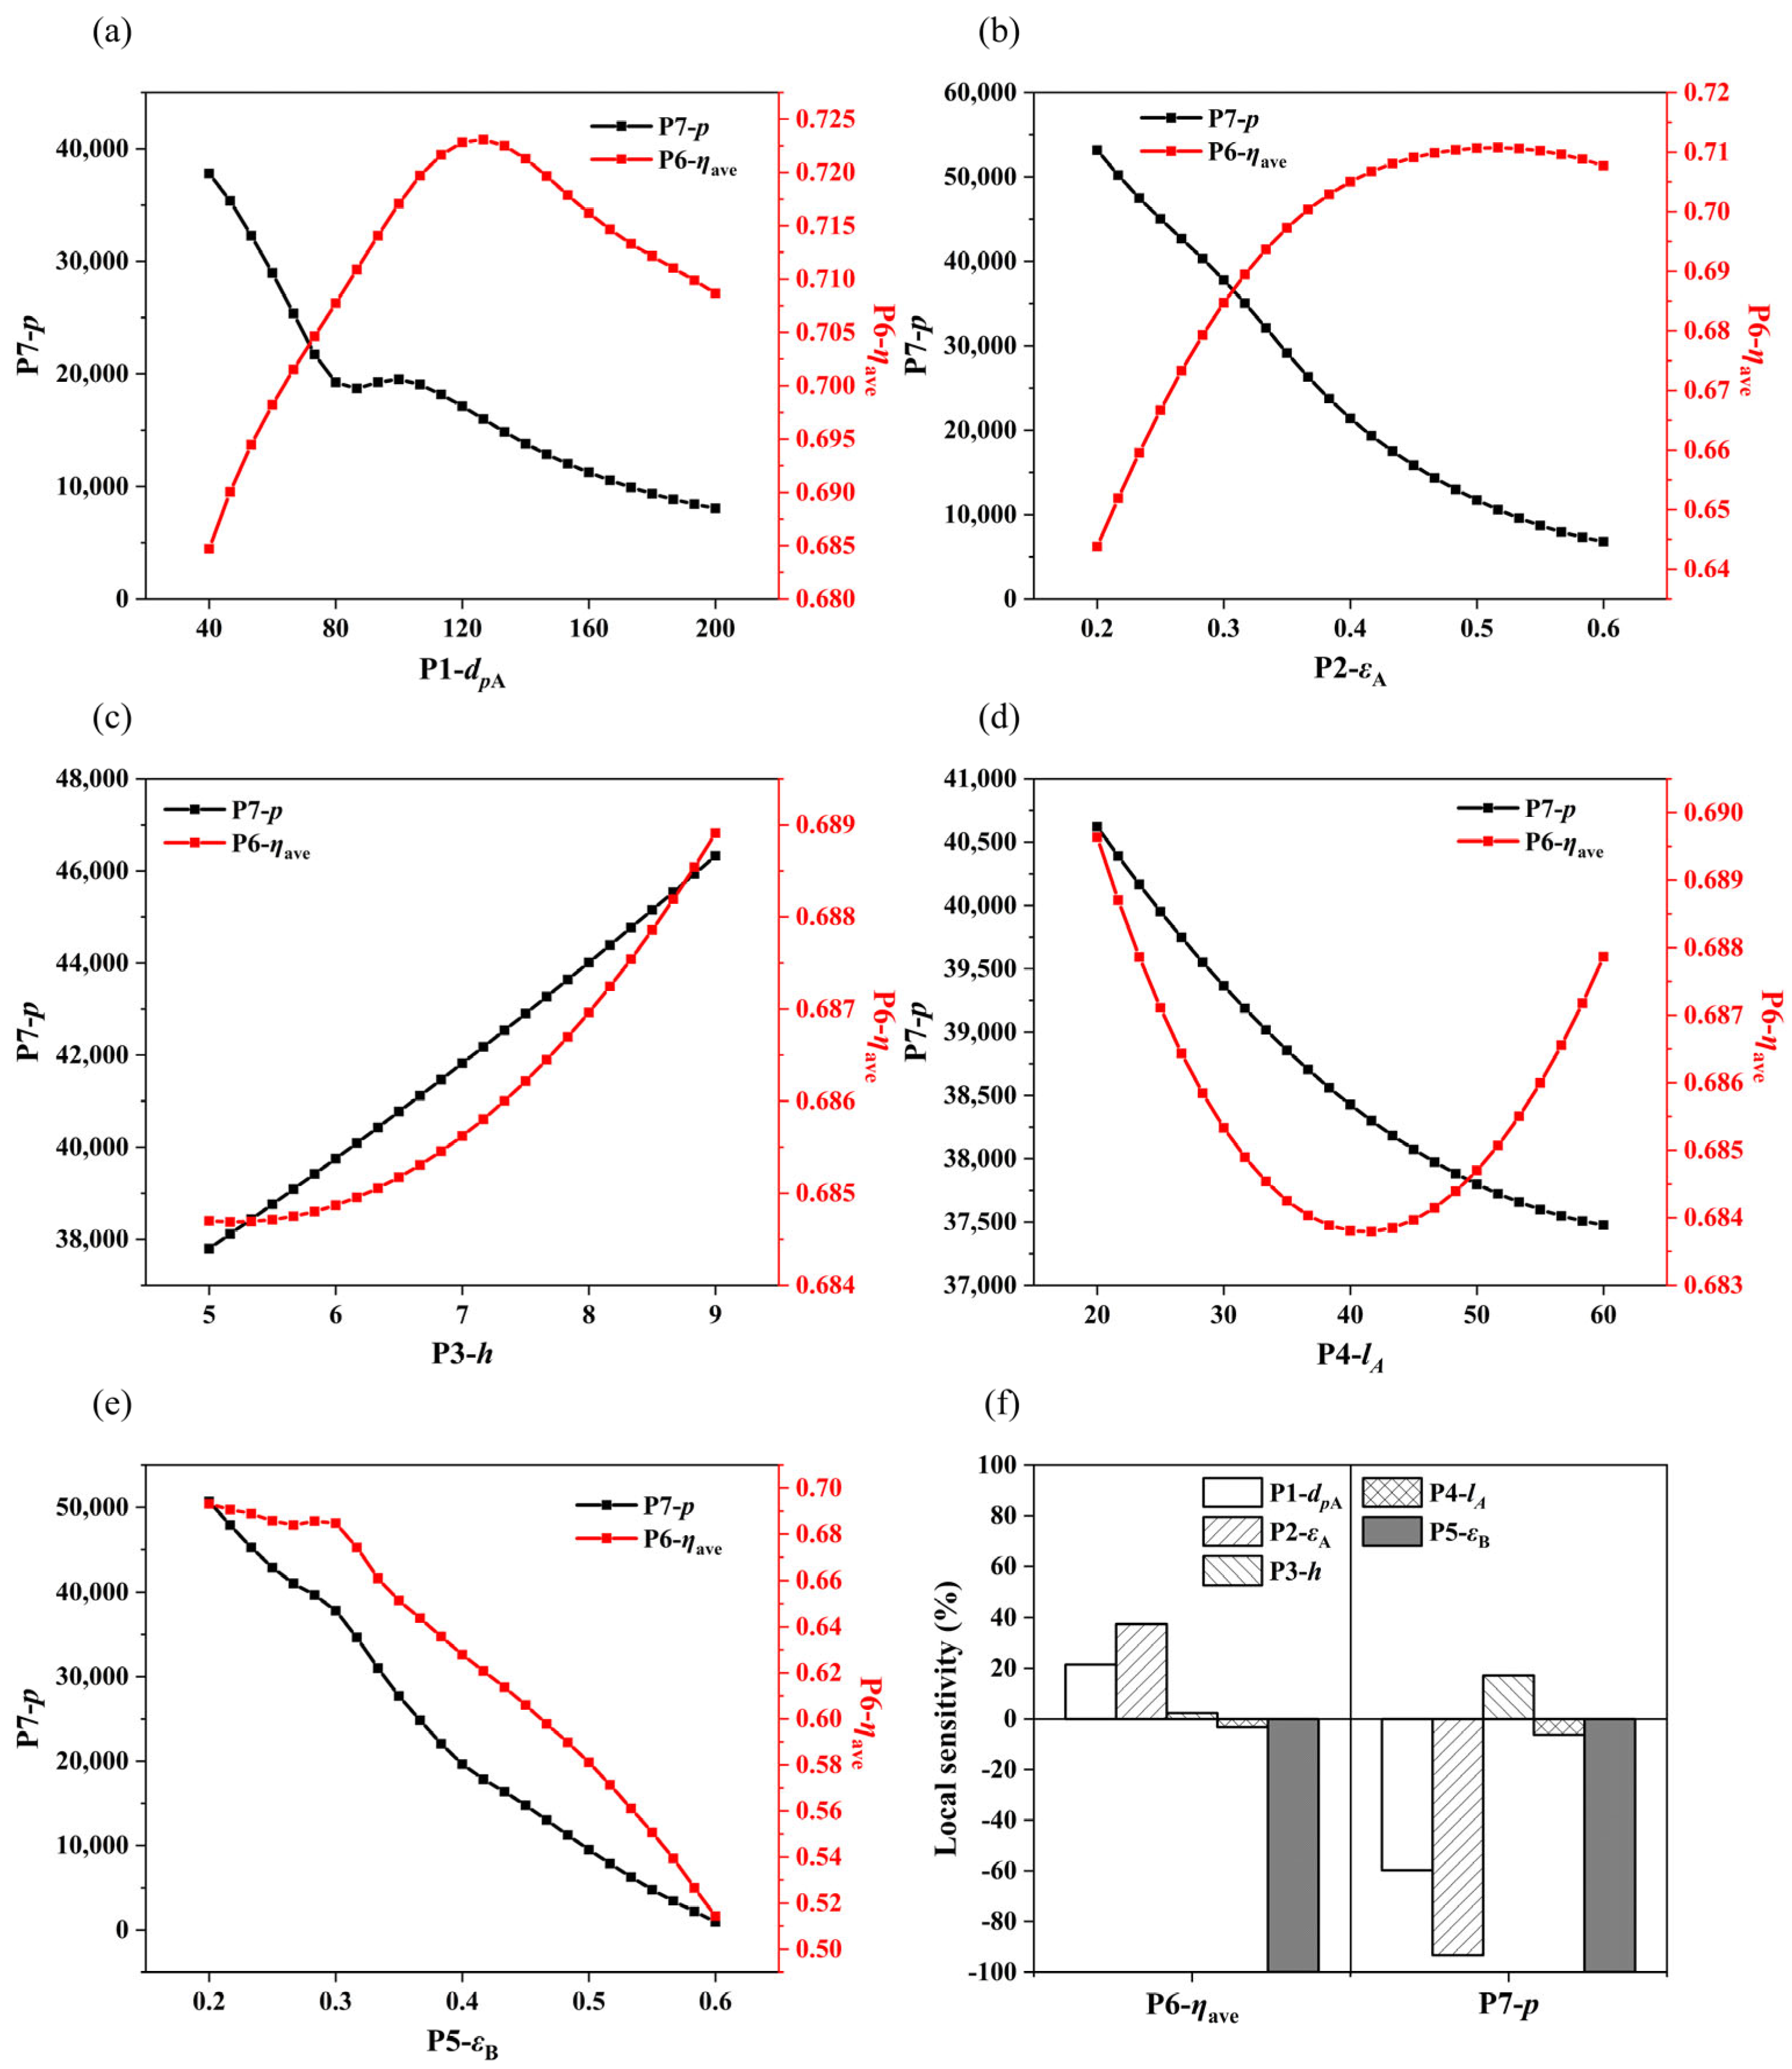
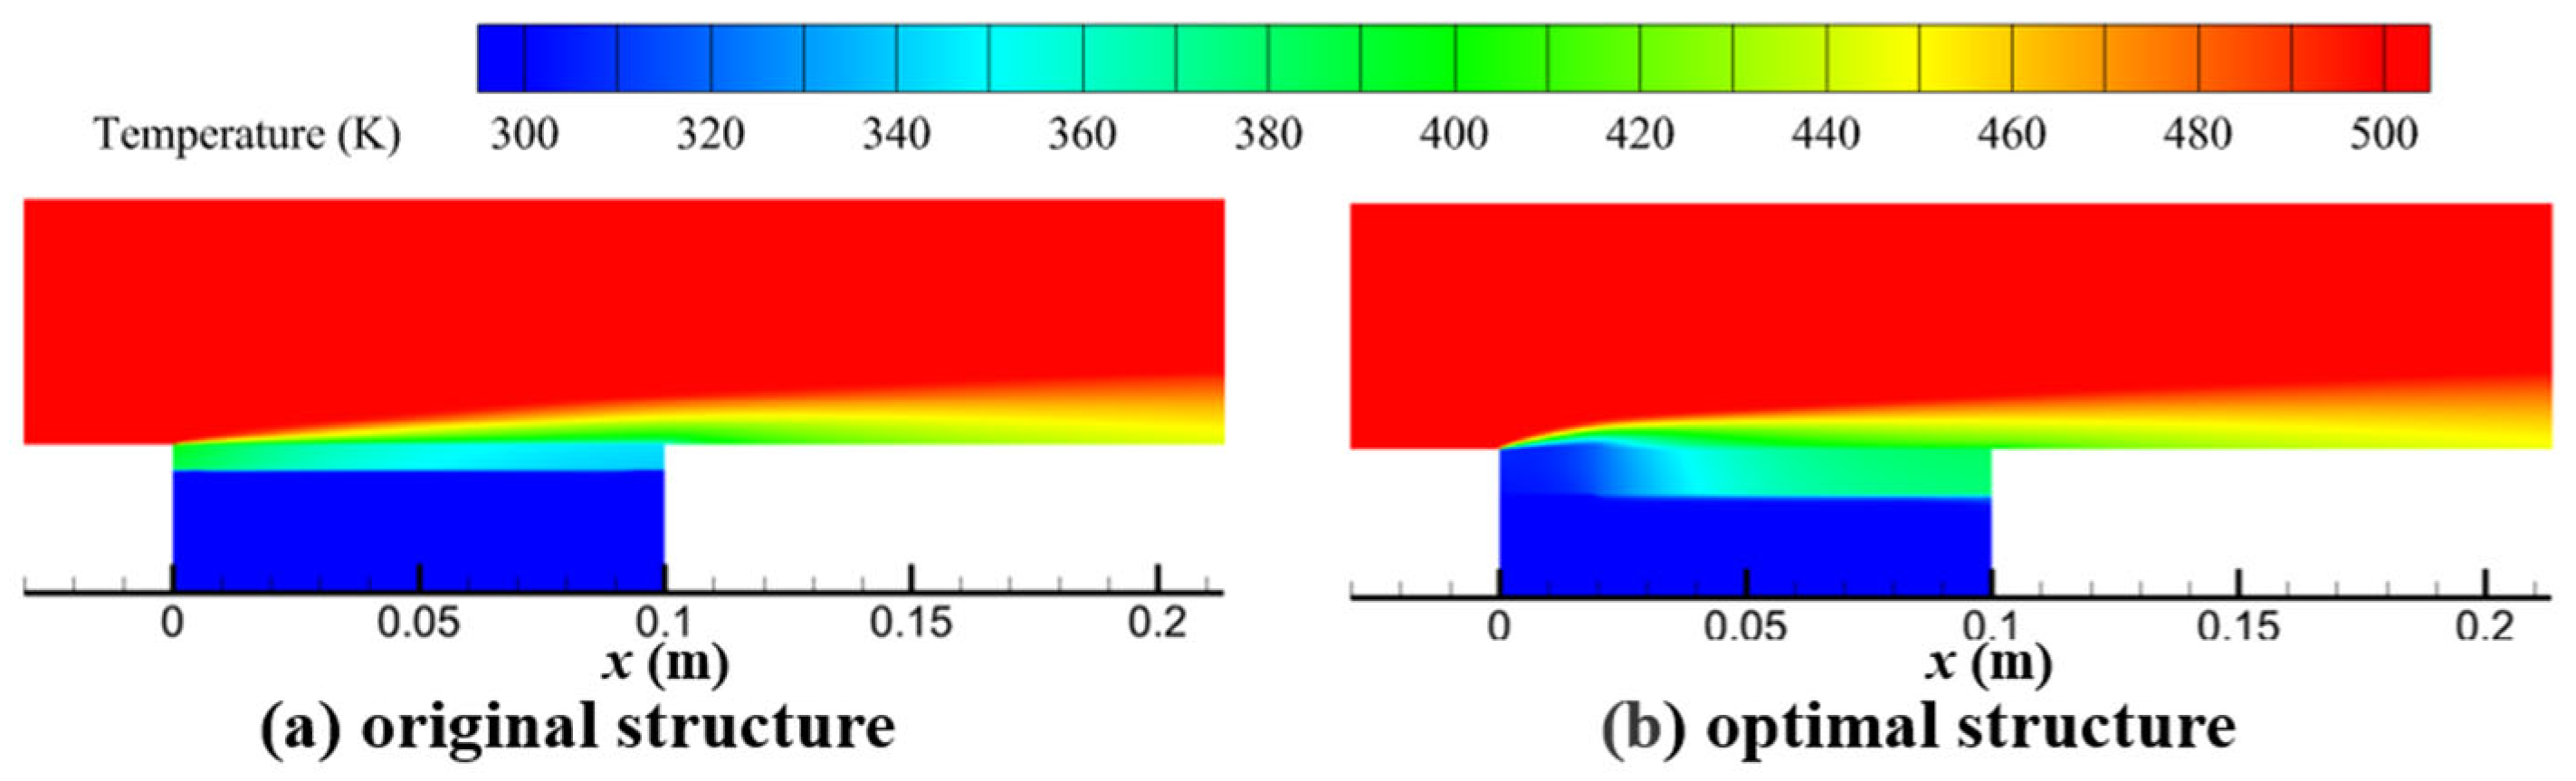
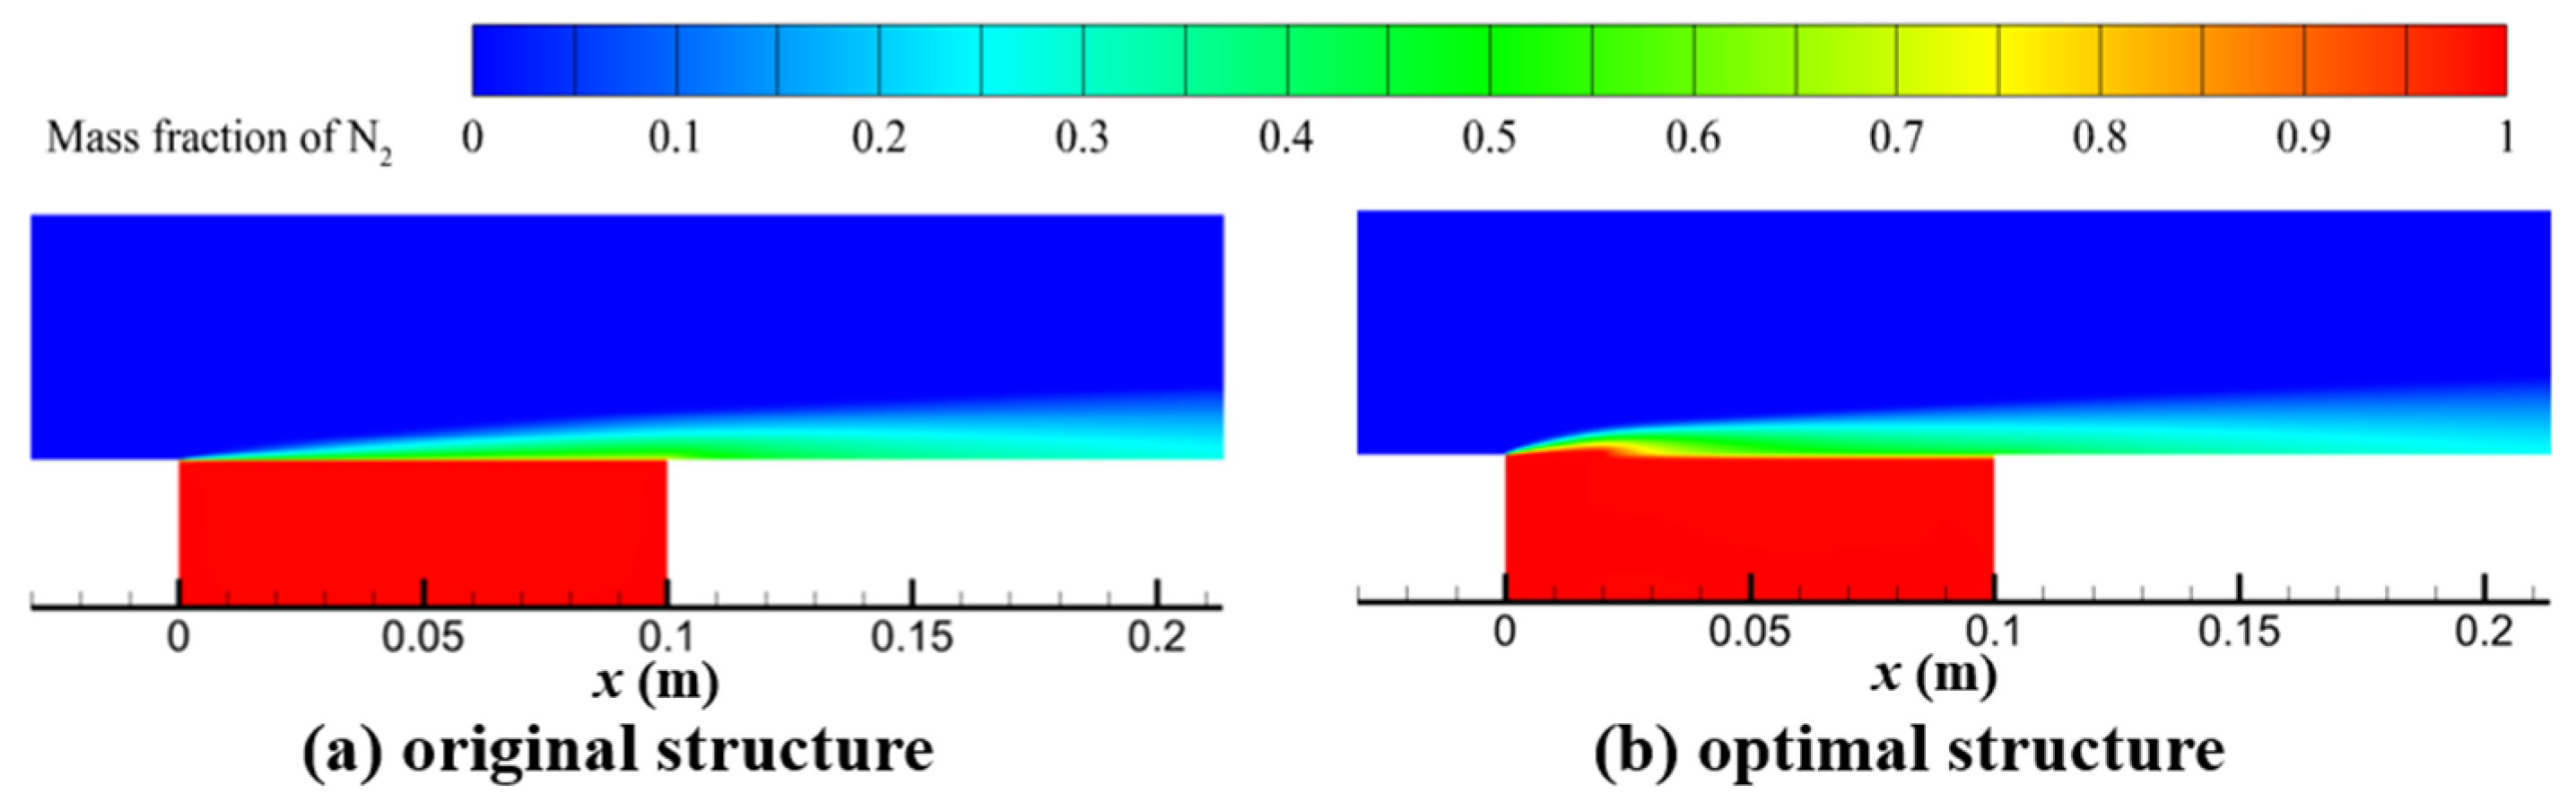
3.3. Analysis of Optimization Results

In this section, for CPD−PS, ηave and p are taken as the objective functions to increase ηave and reduce p. To achieve this goal, the MOGA is used to find the optimal result and verify the calculation. As an effective optimization tool, the MOGA can simultaneously process multiple objectives. By generating a Pareto optimal solution set, it compensates for the shortcomings of traditional single-objective optimization methods, thereby achieving multi-objective optimization.
In this paper, the parameters in the MOGA are set as follows: the initial sample size is 5000 and the maximum allowed Pareto percentage is 70%, which means that 70% of the optimal solutions are retained during the optimization process to ensure the breadth of the search. The convergence stability percentage is 2%. When the improvement amplitude of the objective function is less than this value, it is considered that the algorithm has converged. In each generation, the MOGA iteratively updates the design variables through operations such as crossover and mutation, gradually approaching the optimal solution. During the algorithm execution, if the termination conditions are met, the optimization process is stopped and the optimal design variable combination is output. The optimization results are further verified through numerical simulation calculations. By comparing the objective function values calculated by a numerical simulation and Equations (6) and (7), the accuracy and reliability of the response surface model are evaluated. The optimization reliability is high if the error is small. The results of the optimization scheme obtained by the MOGA are compared with the initial SPD−PS, and comparison results are shown in Table 4.
Compared with the results predicted by the regression equation, the maximum error of ηave and p is 1.30% and 5.11%, respectively, which also shows that the regression equation model established by the response surface method can well reflect the relationship between the parameters of porous media and ηave and p. Compared with the original structure, the ηave of the optimized structure is increased by 6.02%, and p is also significantly reduced.
The temperature and coolant mass fraction contours of the original structure and optimal structure are shown in Figure 14 and Figure 15. It can be seen from Figure 14 that the temperature distribution at the hot end surface of the optimized CPD−PS has changed significantly. Compared with SPD−PS with the initial dp of 40 μm, the upstream temperature of the plate with the optimized structure has decreased significantly, the maximum temperature has decreased from 418.82 K to 383.63 K, a decrease of 8.40%, and the average temperature at the hot end surface has decreased. Further analysis of the coolant mass flow distribution curve in Figure 15 shows that compared with the original structure, the optimized structure has a larger dp and ε in the upstream area of the plate, and the permeability of porous media is higher than that in the downstream area, which significantly increases the coolant content from the upstream. Therefore, the front end of the plate is more fully cooled, the cooling effect is significantly improved, and the temperature in this area is significantly reduced. This shows that the optimized CPD−PS can realize the regulation of coolant flow and optimize the cooling effect and temperature distribution.
Figure 16 shows the velocity vector diagrams near the porous wall of the original structure and the optimal structure, from which we can intuitively see the influence of the coolant on the velocity boundary layer before and after the optimization.
In Figure 16a, for the original SPD−PS, in the area near the wall where the hot end surface of the porous plate is 0 < x < 0.1, the coolant is injected in a direction perpendicular to the wall. After flowing out of the porous medium, the coolant flows along the x direction with the main stream, starting from the front end of the porous plate, and as the fluid flows to the end of the plate, the velocity gradient decreases and the boundary layer gradually thickens. In Figure 16b, it is obvious that the velocity distribution at the front end of the upstream plate in the red box has changed significantly, the velocity gradient has decreased, and the boundary layer has thickened. Because dp and ε in the upstream of the optimal structural plate are greater than those in the downstream, the upstream permeability is relatively large, and the resistance of the cooling fluid is relatively small. As a result, the vertical velocity component of the coolant at the wall increases, which pushes main stream fluid farther away from the surface. Consequently, the thickness of the boundary layer in upstream regions of the porous medium increases, the heat insulation effect is enhanced, and ηave is improved.

4. Conclusions

As an important component of the transpiration cooling system, the structural parameters of porous media significantly affect cooling performance. In order to further improve the overall cooling effect of the transpiration cooling plate structure and reduce the coolant injection pressure, CPD−PS is proposed, and the structure is analyzed and optimized by the RSM and MOGA. The following conclusions are obtained:
(1) Compared with SPD−PS, when dpA > dpB in CPD−PS, the upstream maximum temperature of the porous plate increases, the downstream surface temperature decreases, and the temperature difference between upstream and downstream increases significantly. When keeping dpA > dpB, the A plate has higher permeability than the B plate, which increases coolant mass flow on the surface of the A plate, effectively reducing the maximum temperature on the hot end surface, reducing the temperature difference, and making the temperature distribution on the surface of the porous plate more uniform.
(2) In CPD−PS, keeping dpA > dpB can improve the ηave of the transpiration cooling system and improve the overall cooling effect. Meanwhile, when the dp of one plate is fixed, the permeability of porous media increases as the dp of the other plate increases, the flow resistance of the coolant in porous media decreases, and the coolant injection pressure is smaller.
(3) Through response surface analysis, the degree of influence on the ηave of CPD−PS from large to small is as follows: εB, εA, dpA, h, and lA. The degree of influence on p from large to small is as follows: εB, εA, dpA, lA, and h.
(4) Compared with SPD−PS with dp of 40 μm, the maximum temperature of the optimized CPD−PS is reduced by 8.40%, the average temperature of the hot end surface is reduced, and the overall cooling effect is improved. The ηave of the optimized CPD−PS is increased by 6.02%, and p is also significantly reduced. Meanwhile, the velocity distribution in the upstream plate changes obviously, the velocity gradient decreases, the boundary layer thickens, and the thermal insulation effect is enhanced.

Author Contributions

Conceptualization, Y.L.; methodology, D.W.; software, Y.L.; validation, Y.L.; investigation, X.Z., M.K. and H.L.; resources, D.W.; writing—original draft preparation, Y.L.; writing—review and editing, D.W.; supervision, X.Z., M.K. and H.L. All authors have read and agreed to the published version of the manuscript.

Funding

The work is supported by the Key Science and Technology Research Projects of Henan Province (no. 222102320230).

Data Availability Statement

The original contributions presented in this study are included in the article. Further inquiries can be directed to the corresponding author.

Conflicts of Interest

The authors declare no conflicts of interest.

Abbreviations

Nomenclature
Latin symbolsGreek symbols
Cinertial coefficientρdensity, kg/m3
dpparticle diameter, mεporosity
Etotal energy, Jμdynamic viscosity, Pa·s
Fcoolant injection rateτstress, N
hheight of hot end wall, mηcooling effectiveness
Jmass diffusion flux, kg/(s·m2)Subscript
kthermal conductivity, W/(m·K)aveaverage
Kpermeability of porous media, m2ccoolant
ltotal length of hot end wall, meffeffective
ppressure, Paffluid
Ttemperature, Kssolid
Uvelocity, m/swwall
Yspecies mass fractionmain stream

References

  1. Wang, L. Development trend analysis of thermal protection technology for hypersonic vehicles. Aerodyn. Missile J. 2014, 2, 68–75+80. [Google Scholar]
  2. Wang, L.; Wang, Y. Research progress and trend analysis of thermal protection technology for hypersonic vehicles. Aerosp. Mater. Technol. 2016, 46, 1–6. [Google Scholar]
  3. Uyanna, O.; Najafi, H. Thermal protection systems for space vehicles: A review on technology development, current challenges and future prospects. Acta Astronaut. 2020, 176, 341–356. [Google Scholar] [CrossRef]
  4. Langener, T.; von Wolfersdorf, J.; Selzer, M.; Hald, H. Experimental investigations of transpiration cooling applied to C/C material. Int. J. Therm. Sci. 2012, 54, 70–81. [Google Scholar] [CrossRef]
  5. Liu, Y.-Q.; Xiong, Y.-B.; Jiang, P.-X.; Wang, Y.-P.; Sun, J.-G. Effects of local geometry and boundary condition variations on transpiration cooling. Int. J. Heat Mass Transf. 2013, 62, 362–372. [Google Scholar] [CrossRef]
  6. Strauss, F.T.; Witte, J.; General, S.; Manfletti, C.; Schlechtriem, S. Experiments on nitrogen and hydrogen transpiration cooling in a model scramjet combustor. In Proceedings of the 2018 Joint Propulsion Conference, Cincinnati, UH, USA, 9–11 July 2018. [Google Scholar]
  7. Zhang, B.; Huang, H.; Huang, J.; Chen, J. An experimental investigation on performance of transpiration cooling with liquid water through C/SiC porous ceramic. Appl. Therm. Eng. 2020, 178, 115526. [Google Scholar] [CrossRef]
  8. Jiang, P.-X.; Huang, G.; Zhu, Y.; Xu, R.; Liao, Z.; Lu, T. Experimental investigation of biomimetic self-pumping and self-adaptive transpiration cooling. Bioinspir. Biomimetics 2017, 12, 056002. [Google Scholar] [CrossRef] [PubMed]
  9. Huang, G.; Zhu, Y.; Liao, Z.; Jiang, P.-X. Experimental investigation of self-pumping internal transpiration cooling. Int. J. Heat Mass Transf. 2018, 123, 514–522. [Google Scholar] [CrossRef]
  10. Zhao, J.; Sun, M.; Zhang, L.; Hu, C.; Tang, D.; Yang, L.; Song, Y. Forced Convection Heat Transfer in Porous Structure: Effect of Morphology on Pressure Drop and Heat Transfer Coefficient. J. Therm. Sci. 2021, 30, 363–393. [Google Scholar] [CrossRef]
  11. Wang, Y.; Wu, J.; Yang, G. Numerical Simulation of Heat and Momentum Transport at the Coupled Interface between a Rectangular Channel and Porous Media. J. Therm. Sci. 2022, 31, 332–343. [Google Scholar] [CrossRef]
  12. Liu, Y.-Q.; Jiang, P.-X.; Xiong, Y.-B.; Wang, Y.-P. Experimental and numerical investigation of transpiration cooling for sintered porous flat plates. Appl. Therm. Eng. 2013, 50, 997–1007. [Google Scholar] [CrossRef]
  13. Huang, Z. Research on the Transpiration Cooling Supersonic and High Temperature Flow. Ph.D. Thesis, Tsinghua University, Beijing, China, 2015. [Google Scholar]
  14. Meng, L.; Jiang, P.; Jiang, F.; Yu, L.; Ren, Z. Experimental investigation of the heat transfer for transpiration cooling through a sintered porous plate. J. Tsinghua Univ. (Sci. Technol.) 2005, 45, 1537–1539. [Google Scholar]
  15. Wu, N.; Wang, J.; Dong, W.; Ding, R. An experimental investigation on combined sublimation and transpiration cooling for sintered porous plates. Int. J. Heat Mass Transf. 2018, 116, 685–693. [Google Scholar] [CrossRef]
  16. Zhao, L.; Wang, J.; Ma, J.; Lin, J.; Peng, J.; Qu, D.; Chen, L. An experimental investigation on transpiration cooling under supersonic condition using a nose cone model. Int. J. Therm. Sci. 2014, 84, 207–213. [Google Scholar] [CrossRef]
  17. Wang, J.; Zhao, L.; Wang, X.; Ma, J.; Lin, J. An experimental investigation on transpiration cooling of wedge shaped nose cone with liquid coolant. Int. J. Heat Mass Transf. 2014, 75, 442–449. [Google Scholar] [CrossRef]
  18. Jiang, P.-X.; Huang, G.; Zhu, Y.; Liao, Z.; Huang, Z. Experimental investigation of combined transpiration and film cooling for sintered metal porous struts. Int. J. Heat Mass Transf. 2017, 108, 232–243. [Google Scholar] [CrossRef]
  19. Wu, N.; Wang, J.; He, F.; Chen, L.; Ai, B. Optimization transpiration cooling of nose cone with non-uniform permeability. Int. J. Heat Mass Transf. 2018, 127, 882–891. [Google Scholar] [CrossRef]
  20. Rong, Y.; Wei, Y.; Zhan, R. Research on thermal protection by opposing jet and transpiration for high speed vehicle. Aerosp. Sci. Technol. 2016, 48, 322–327. [Google Scholar] [CrossRef]
  21. Shen, L.; Wang, J. Numerical investigation on the optimization of local transpiration cooling effectiveness. Appl. Therm. Eng. 2017, 127, 58–69. [Google Scholar] [CrossRef]
  22. Dong, W.; Wang, J.; Chen, S.; Ai, B.; Luo, X. Modelling and investigation on heat transfer deterioration during transpiration cooling with liquid coolant phase-change. Appl. Therm. Eng. 2018, 128, 381–392. [Google Scholar] [CrossRef]
  23. Wang, W.; Tao, G.; Ke, D.; Luo, J.; Cui, J. Transpiration cooling of high pressure turbine vane with optimized porosity distribution. Appl. Therm. Eng. 2022, 223, 119831. [Google Scholar] [CrossRef]
  24. Liu, T.; Liu, Y.; Ding, R.; Zhu, J.; He, F.; Wang, J. Numerical simulation and structural optimization of transpiration cooling with gradient porous matrix in supersonic condition. Int. J. Therm. Sci. 2024, 198, 108871. [Google Scholar] [CrossRef]
  25. Xu, J.-C.; Du, S.; Zhou, Y.-P.; Li, Z.-Y. Research on the heat transfer characteristics of through-hole transpiration cooling based on ceramic matrix composites. Appl. Therm. Eng. 2024, 257, 124360. [Google Scholar] [CrossRef]
  26. Chen, W.; Wang, K.; Wang, Y.; Tu, S.; Liu, Z.; Su, H. Numerical investigation and optimal design of transpiration cooling plate structure for gradient porosity. Int. J. Therm. Sci. 2023, 197, 108755. [Google Scholar] [CrossRef]
  27. He, Y.; Chen, Y.; Du, S.; Li, D.; Gao, Y. Optimization studies of transpiration cooling using porous medium with gradually-changed structure. Front. Heat Mass Transf. 2020, 15, 1–13. [Google Scholar] [CrossRef]
  28. He, F.; Wu, N.; Ran, F.; Wang, J. Numerical investigation on the transpiration cooling of three-dimensional hypersonic inlet. Aerosp. Sci. Technol. 2020, 106, 106152. [Google Scholar] [CrossRef]
  29. Ding, R. Feasibility Study on the Application of Transpiration Cooling on Hypersonic Vehicle. Ph.D. Thesis, University of Science and Technology of China, Anhui, China, 2021. [Google Scholar]
  30. Liu, Y.; Wang, Y.; Jiang, P. The effects of boundary condition variations on transpiration cooling. J. Eng. Thermophys. 2010, 31, 667–670. [Google Scholar]
  31. Vafai, K.; Kim, S.J. On the limitations of the brinkman-forchheimer extended darcy equation. Int. J. Heat Fluid Flow 1995, 16, 11–15. [Google Scholar] [CrossRef]
  32. Wang, J.H.; Wang, H.N. A Discussion of Transpiration Cooling Problems through an Analytical Solution of Local Thermal Nonequilibrium Model. J. Heat Transf. 2006, 128, 1093–1098. [Google Scholar] [CrossRef]
  33. He, F.; Wang, J.; Xu, L.; Wang, X. Modeling and simulation of transpiration cooling with phase change. Appl. Therm. Eng. 2013, 58, 173–180. [Google Scholar] [CrossRef]
  34. Liu, Y.-Q.; Jiang, P.-X.; Jin, S.-S.; Sun, J.-G. Transpiration cooling of a nose cone by various foreign gases. Int. J. Heat Mass Transf. 2010, 53, 5364–5372. [Google Scholar] [CrossRef]
  35. Su, H.; He, F.; Wang, J.; Luo, X.; Ai, B. Numerical investigation on the effects of porous cone parameters on liquid transpiration cooling performance. Int. J. Therm. Sci. 2021, 161, 106743. [Google Scholar] [CrossRef]
Figure 1. Geometric model of SPD−PS transpiration cooling system.
Energies 18 02950 g001
Figure 2. Geometric model of CPD−PS transpiration cooling system.
Energies 18 02950 g002
Figure 3. Diagram of mesh division.
Energies 18 02950 g003
Figure 4. Mesh independence verification. (a) Temperature distribution at the hot end surface; (b) pressure distribution at the inlet of the cooling chamber.
Energies 18 02950 g004
Figure 5. Comparison of numerical simulation results with experimental data, with (a) different turbulence models and (b) different injection rates.
Energies 18 02950 g005
Figure 6. Temperature distribution contours of the porous plate structure.
Energies 18 02950 g006
Figure 7. Contours of coolant mass fraction distribution of the porous plate structure.
Energies 18 02950 g007
Figure 8. The distribution on the hot end surface of the porous plate structure (a) temperature; (b) coolant mass fraction.
Energies 18 02950 g008
Figure 9. Pressure at the inlet of the cooling chamber and ηave of CPD−PS; (a) dpA = 40 μm; (b) dpB = 40 μm.
Energies 18 02950 g009
Figure 10. Polynomial fitting process for objective functions based on response surface methodology.
Energies 18 02950 g010
Figure 11. Response curves of structural parameters and local sensitivities. (ae) Response curves of structural parameters; (f) local sensitivities.
Energies 18 02950 g011
Figure 12. Response surface diagrams of P6−ηave.
Energies 18 02950 g012
Figure 13. Response surface diagrams of P7−p.
Energies 18 02950 g013
Figure 14. Temperature contours of the original structure and optimal structure.
Energies 18 02950 g014
Figure 15. Coolant mass fraction contours of the original structure and optimal structure.
Energies 18 02950 g015
Figure 16. Velocity vector diagrams near the porous wall of the original structure and the optimal structure.
Energies 18 02950 g016
Table 1. Boundary conditions.
Boundary ConditionsValue
Main Stream (air)Temperature (T)500 K
Velocity (V)20 m/s
Coolant (N2)Temperature (Tc)300 K
Mass Flow Rate (mc)30 g/s
Porous Media (Inconel-600)Density 8420 kg/m3
Thermal Conductivity20.615 W/(m·K)
Specific Heat460 J/(kg·K)
Table 2. Governing equations for different computational domains.
Computational DomainGoverning Equations
Main Stream Channel and Cooling ChamberContinuity equation: ( ρ U ) = 0
Momentum equation: ( ρ U U ) = p + τ ¯ ¯
Energy equation: ( U ( ρ E + p ) ) = ( k e f f T + τ ¯ ¯ U )
Component equation: ( ρ U Y i ) = J i
Porous Media RegionContinuity equation: ( ε ρ U ) = 0
Momentum equation: ( ε ρ U U ) = p + ( ε τ ¯ ¯ ) ( ε 2 μ K U + ε 3 C K ρ U U )
K = d p 2 ε 3 150 1 ε 2 , C = 1.75 ε 1.5 150
Energy equation: ( U ( ρ f E f + p ) ) = ( k e f f T + τ ¯ ¯ U )
k e f f = ε k f + ( 1 ε ) k s
Table 3. Value of each factor.
FactorVariableInitial ValueLower LimitUpper Limit
dpA/μmP14040200
εAP20.30.20.6
h/mmP3559
lA/mmP4502060
εBP50.30.20.6
Table 4. The comparison results between the initial value and the optimization scheme.
Initial ValueOptimal Value
P1−dpA/μm40163.67
P2−εA0.30.4671
P3−h/mm59
P4−lA/mm5020
P5−εB0.30.4627
P6−ηavePredictive value0.67380.7226
Simulated value0.68270.7238
Error1.30%0.17%
P7−p/PaPredictive value39,7553230
Simulated value37,8243191
Error5.11%1.22%
Disclaimer/Publisher’s Note: The statements, opinions and data contained in all publications are solely those of the individual author(s) and contributor(s) and not of MDPI and/or the editor(s). MDPI and/or the editor(s) disclaim responsibility for any injury to people or property resulting from any ideas, methods, instructions or products referred to in the content.

