4.2. Hydrogenation Process
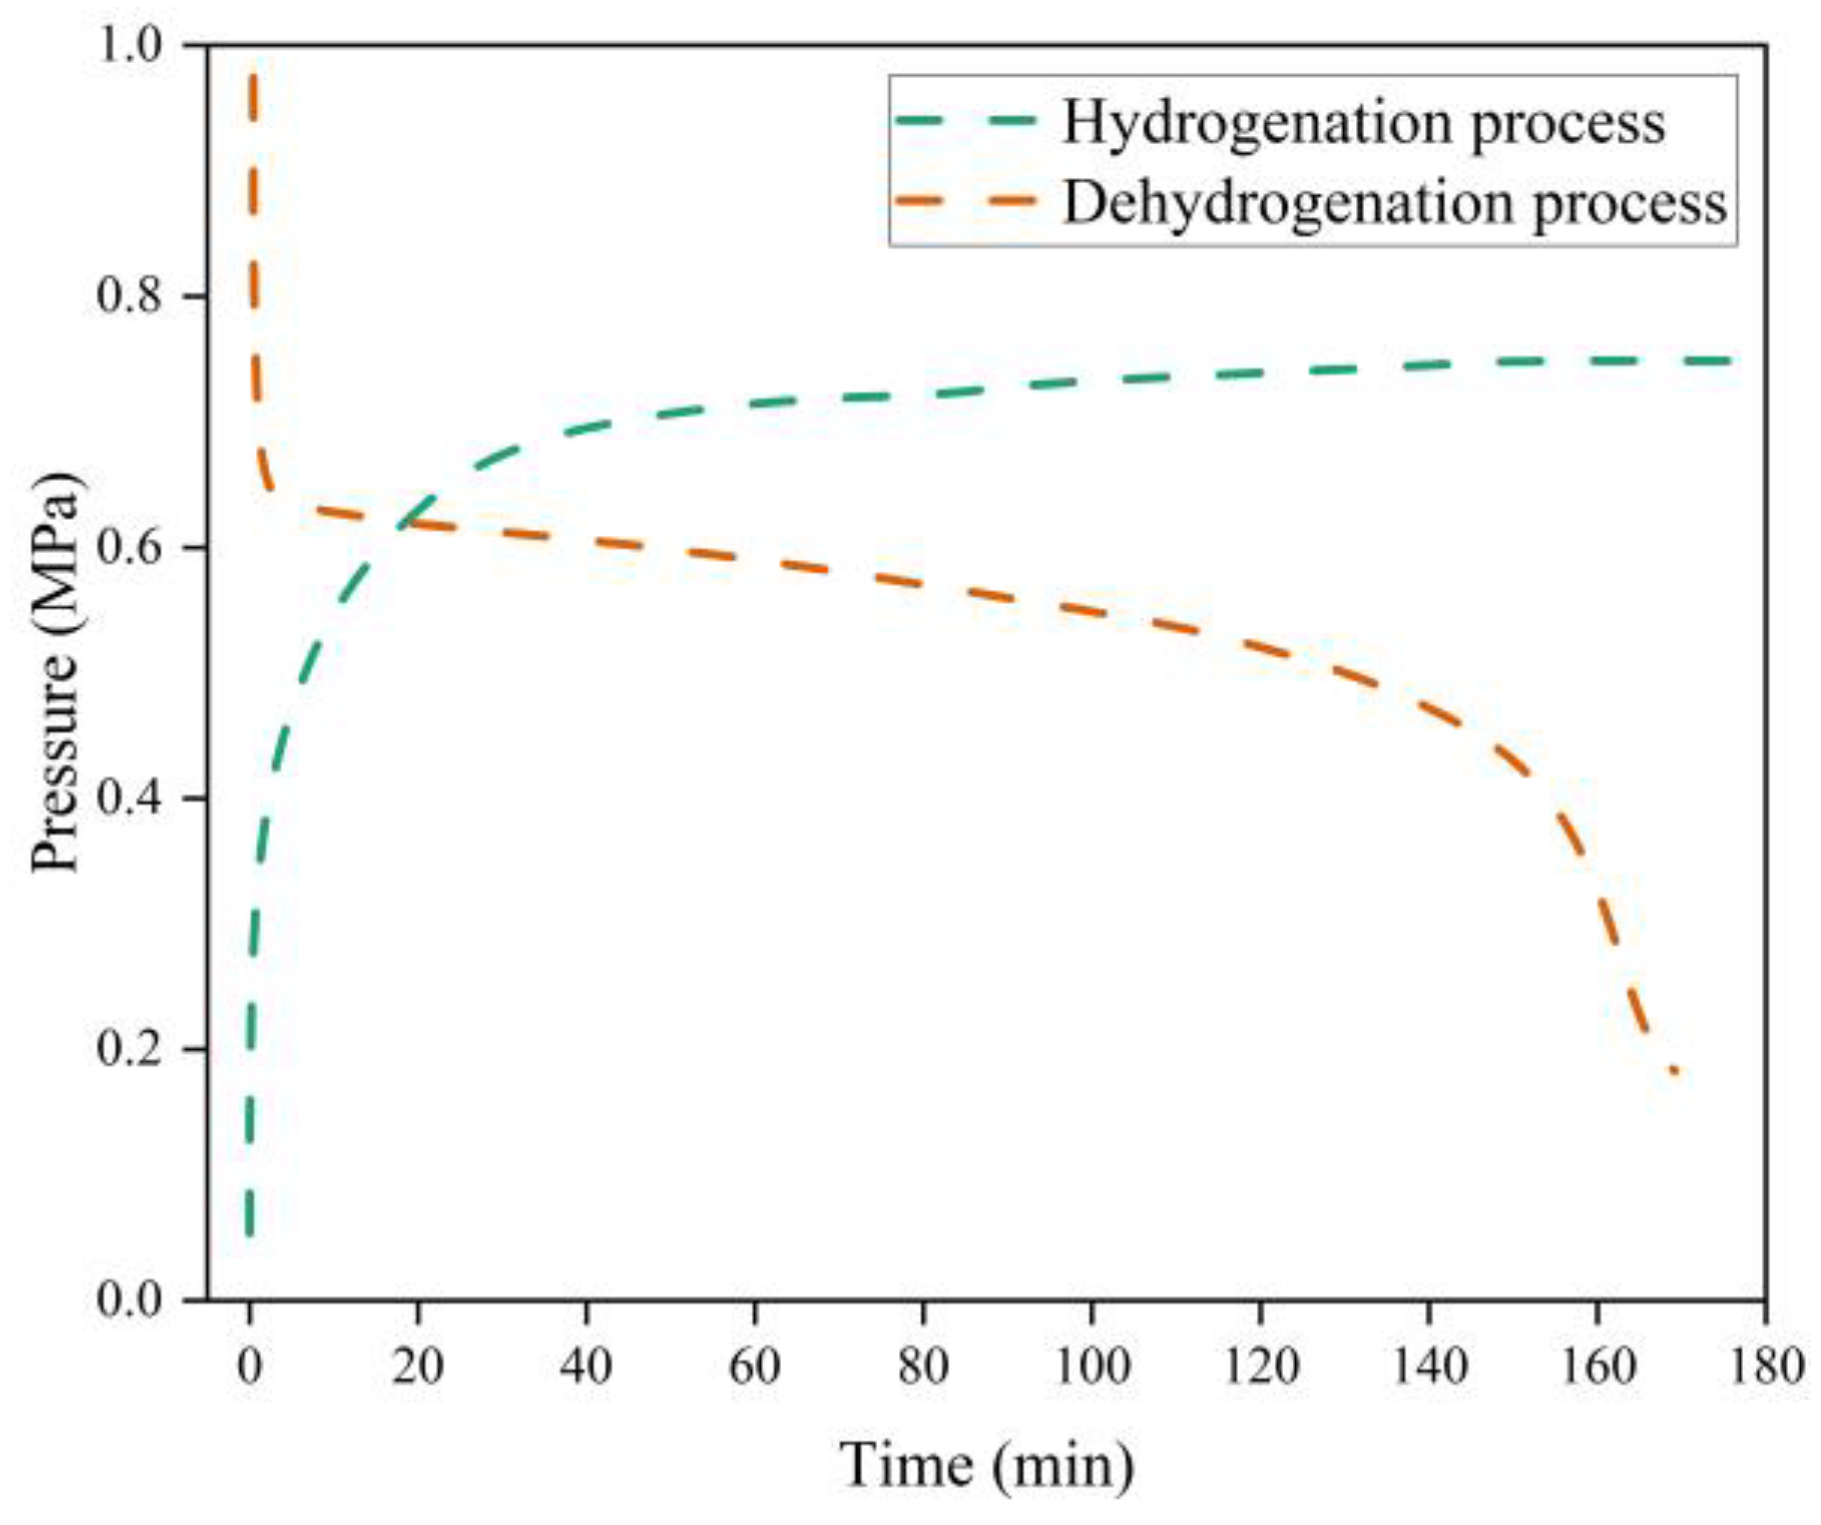
The hydrogenation process in a conventional metal hydride hydrogen storage reactor was simulated and analyzed. The metal hydride reactor bed was heated to 300 °C by an external heat source and charged with hydrogen at a pressure of 0.77 MPa. Hydrogen enters the reactor, undergoes hydrogenation with magnesium, and releases the reaction heat.
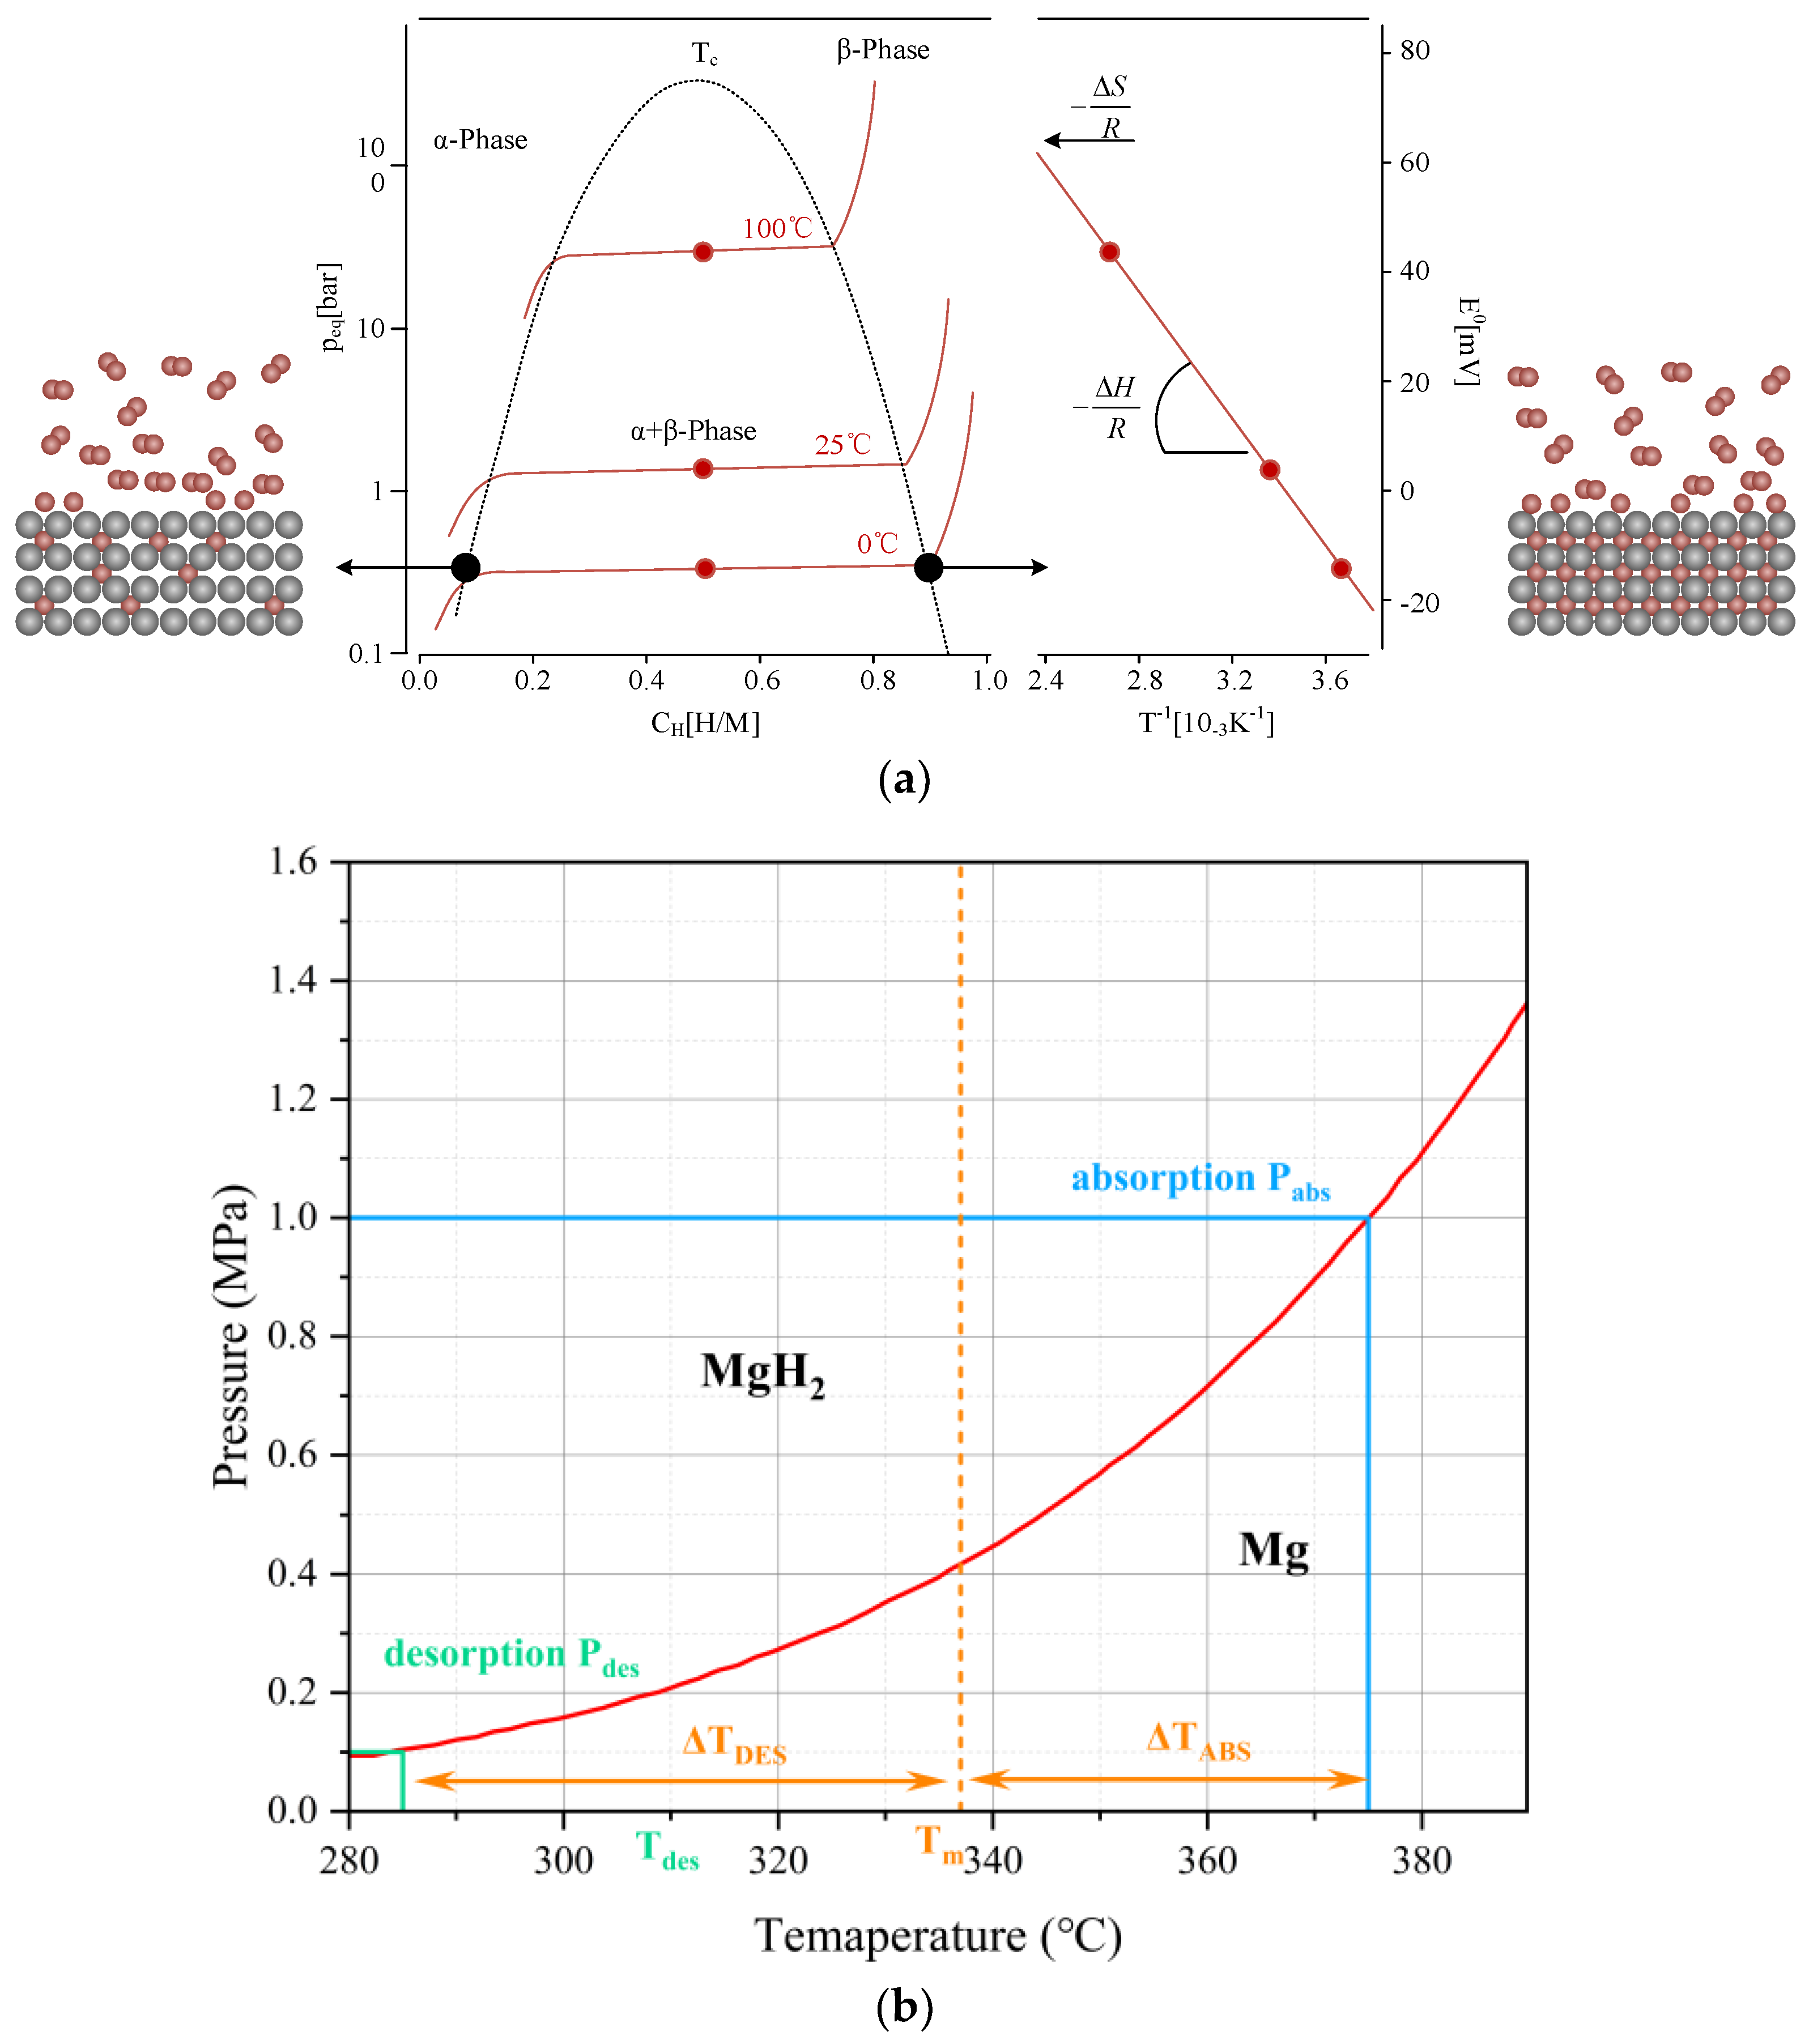
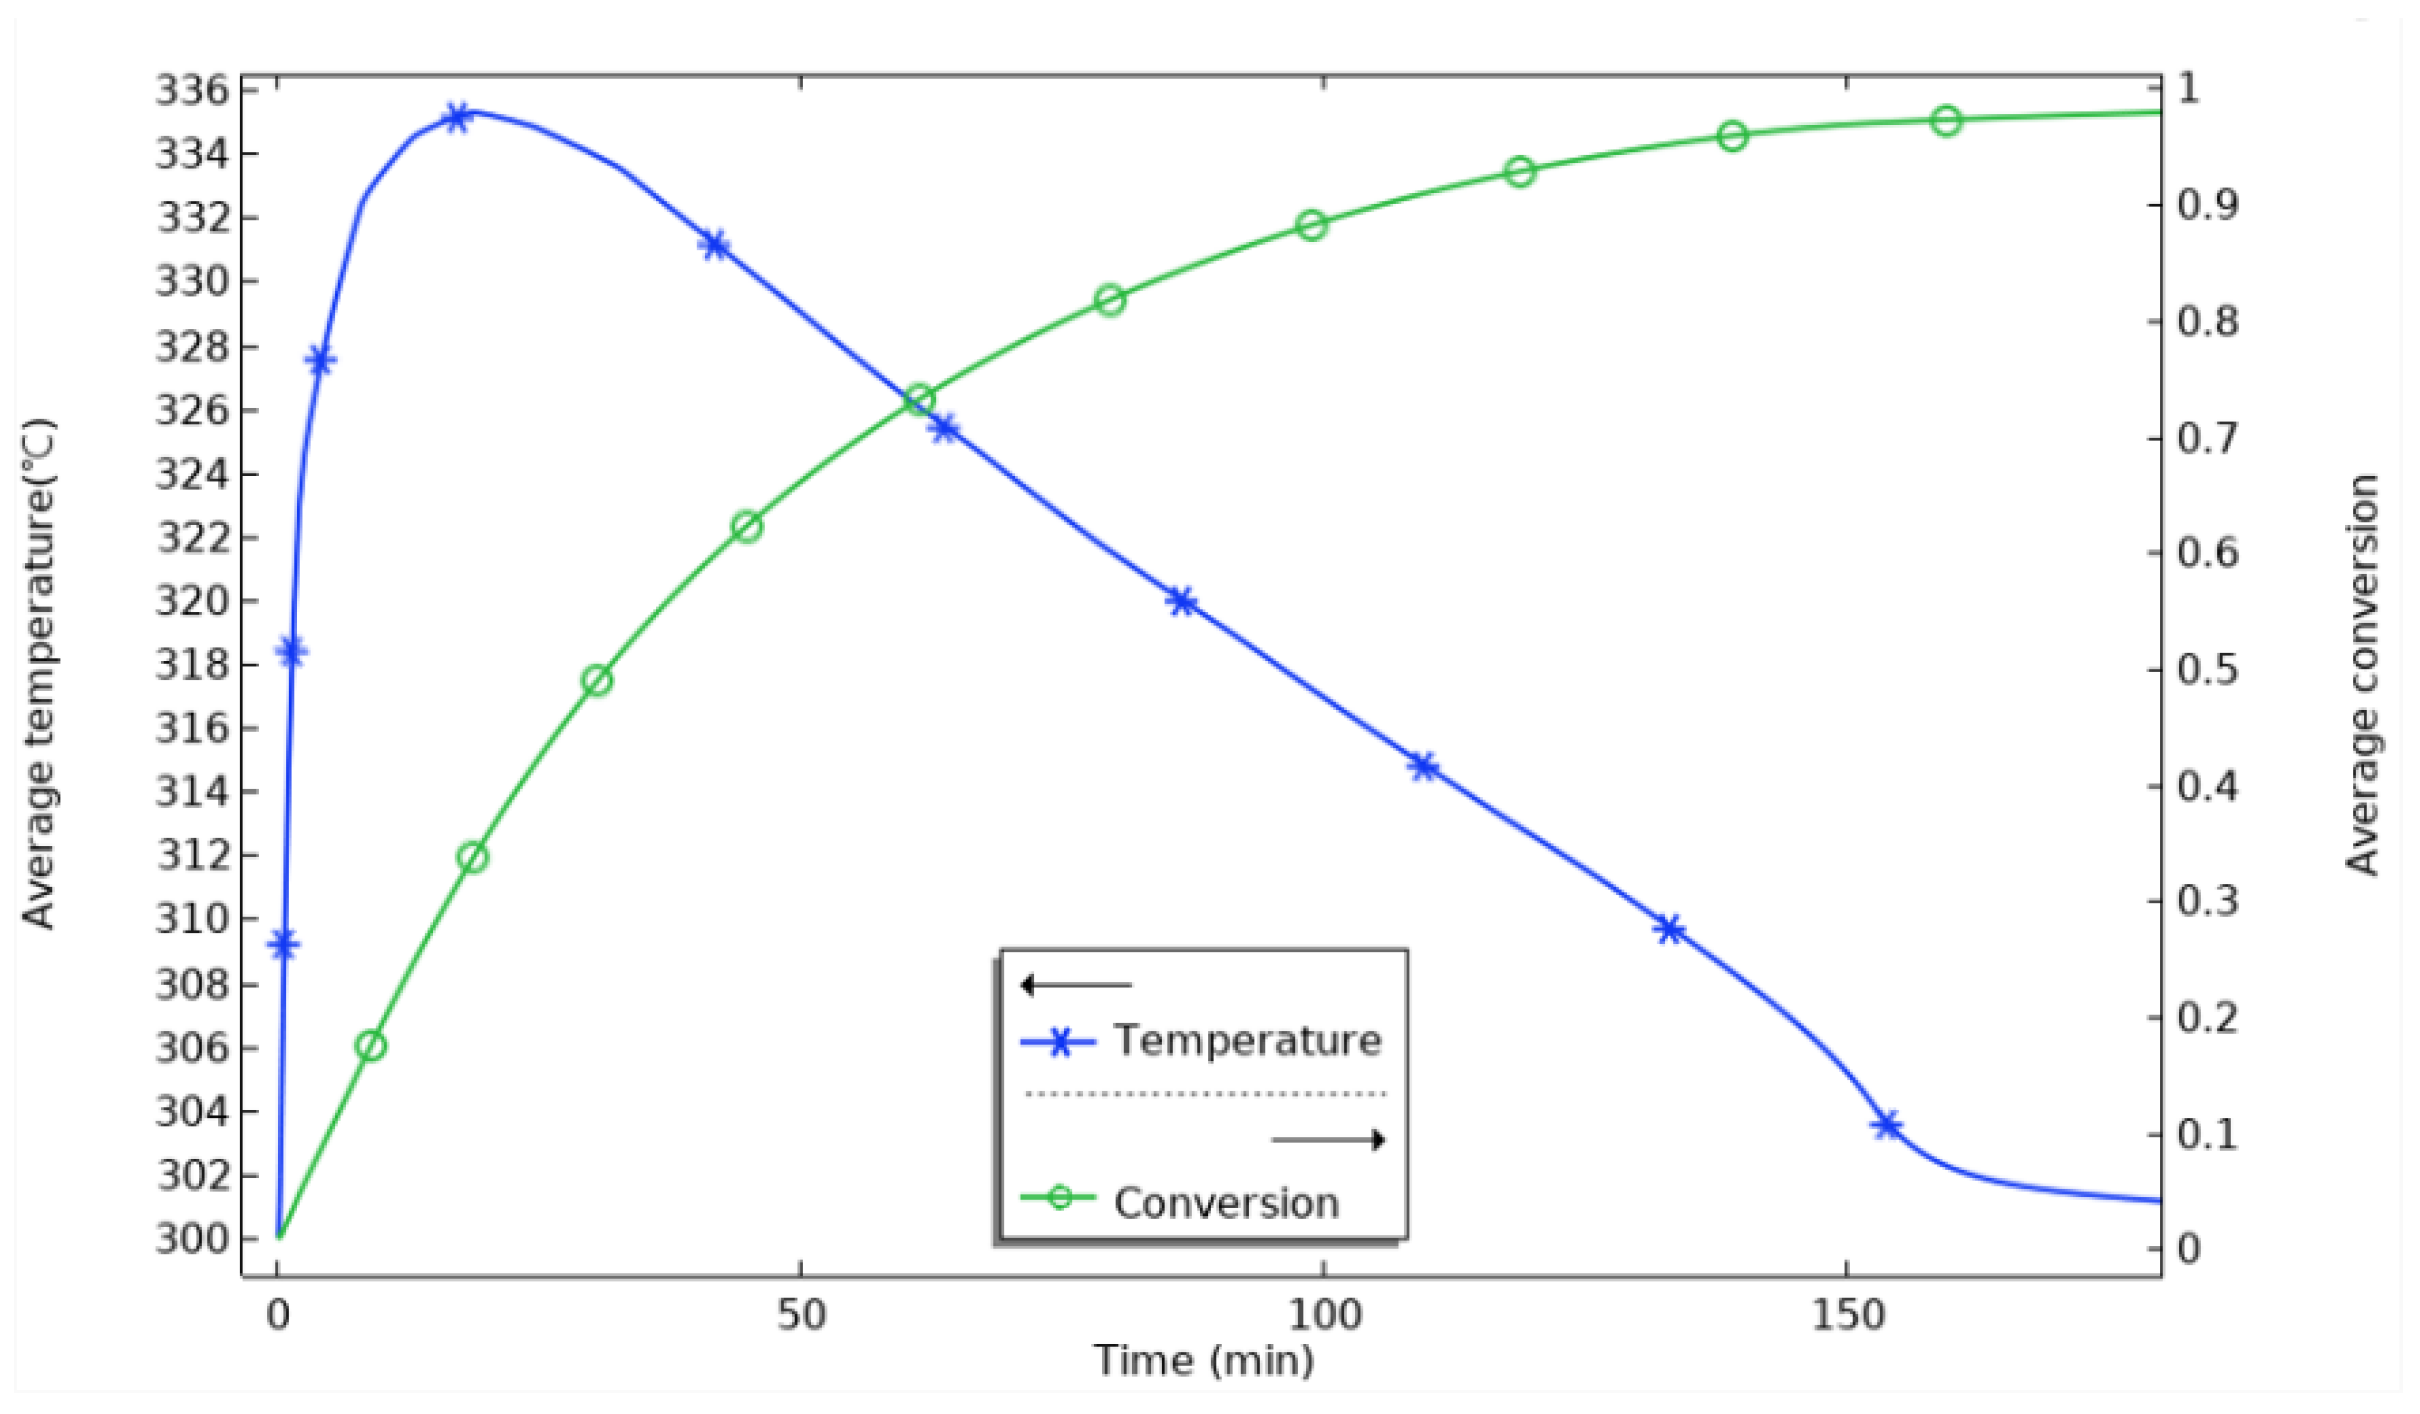
Figure 6 shows the variation in the average temperature inside the reactor with time and the average reaction process during hydrogenation. At the beginning of the reaction, the average temperature inside the reactor rises sharply and reaches the highest value at 18 min, which is about 335 °C. The equilibrium temperature of the magnesium-based metal hydride reaction can be obtained according to the equilibrium temperature and equilibrium pressure relationship graph at 0.77 MPa, and the equilibrium temperature at this time is about 350 °C. The average temperature inside the reactor increases sharply and reaches the highest value at 18 min. It can be seen that after loading hydrogen, the reaction occurs violently. The average temperature of the whole reactor rapidly approaches the equilibrium temperature at this pressure in a relatively short time. The maximum average temperature of the reactor is lower than the equilibrium temperature at that pressure, with the difference in the range of 15 °C~20 °C. This indicates that the average temperature of the reactor is lower than the equilibrium temperature at that pressure for a particular reaction time, and the average temperature of the reactor is lower than the equilibrium temperature at that pressure. This indicates a smaller region of simultaneous equilibrium temperature across the reactor for a given reaction time. At 20 min, the heat generated by the reaction is conducted outward through the vessel’s inner wall, from the stainless steel inner wall to the aluminum shell, the heat diffuses outward through the aluminum shell, and the average temperature in the reactor begins to decrease. The rate of rise of the average reaction process of the reactants gradually decreases, and at 100 min, the average reaction process reaches 0.88. The rise of the reaction process is flat; at 155 min, it reaches 0.969, and the hydrogenation process in the reactor is finished. The change in the reaction process is even tinier. At this time, the average temperature falls back to 300 °C. The average temperature of the reaction process is 0.969 at 155 min, and the average temperature is even smaller.
The temperature and reaction rate inside the reactor are not uniform, so it is necessary to explore the spatial distribution of temperature and reaction rate inside the reactor further and then analyze the reaction characteristics of the hydrogenation process. As shown in
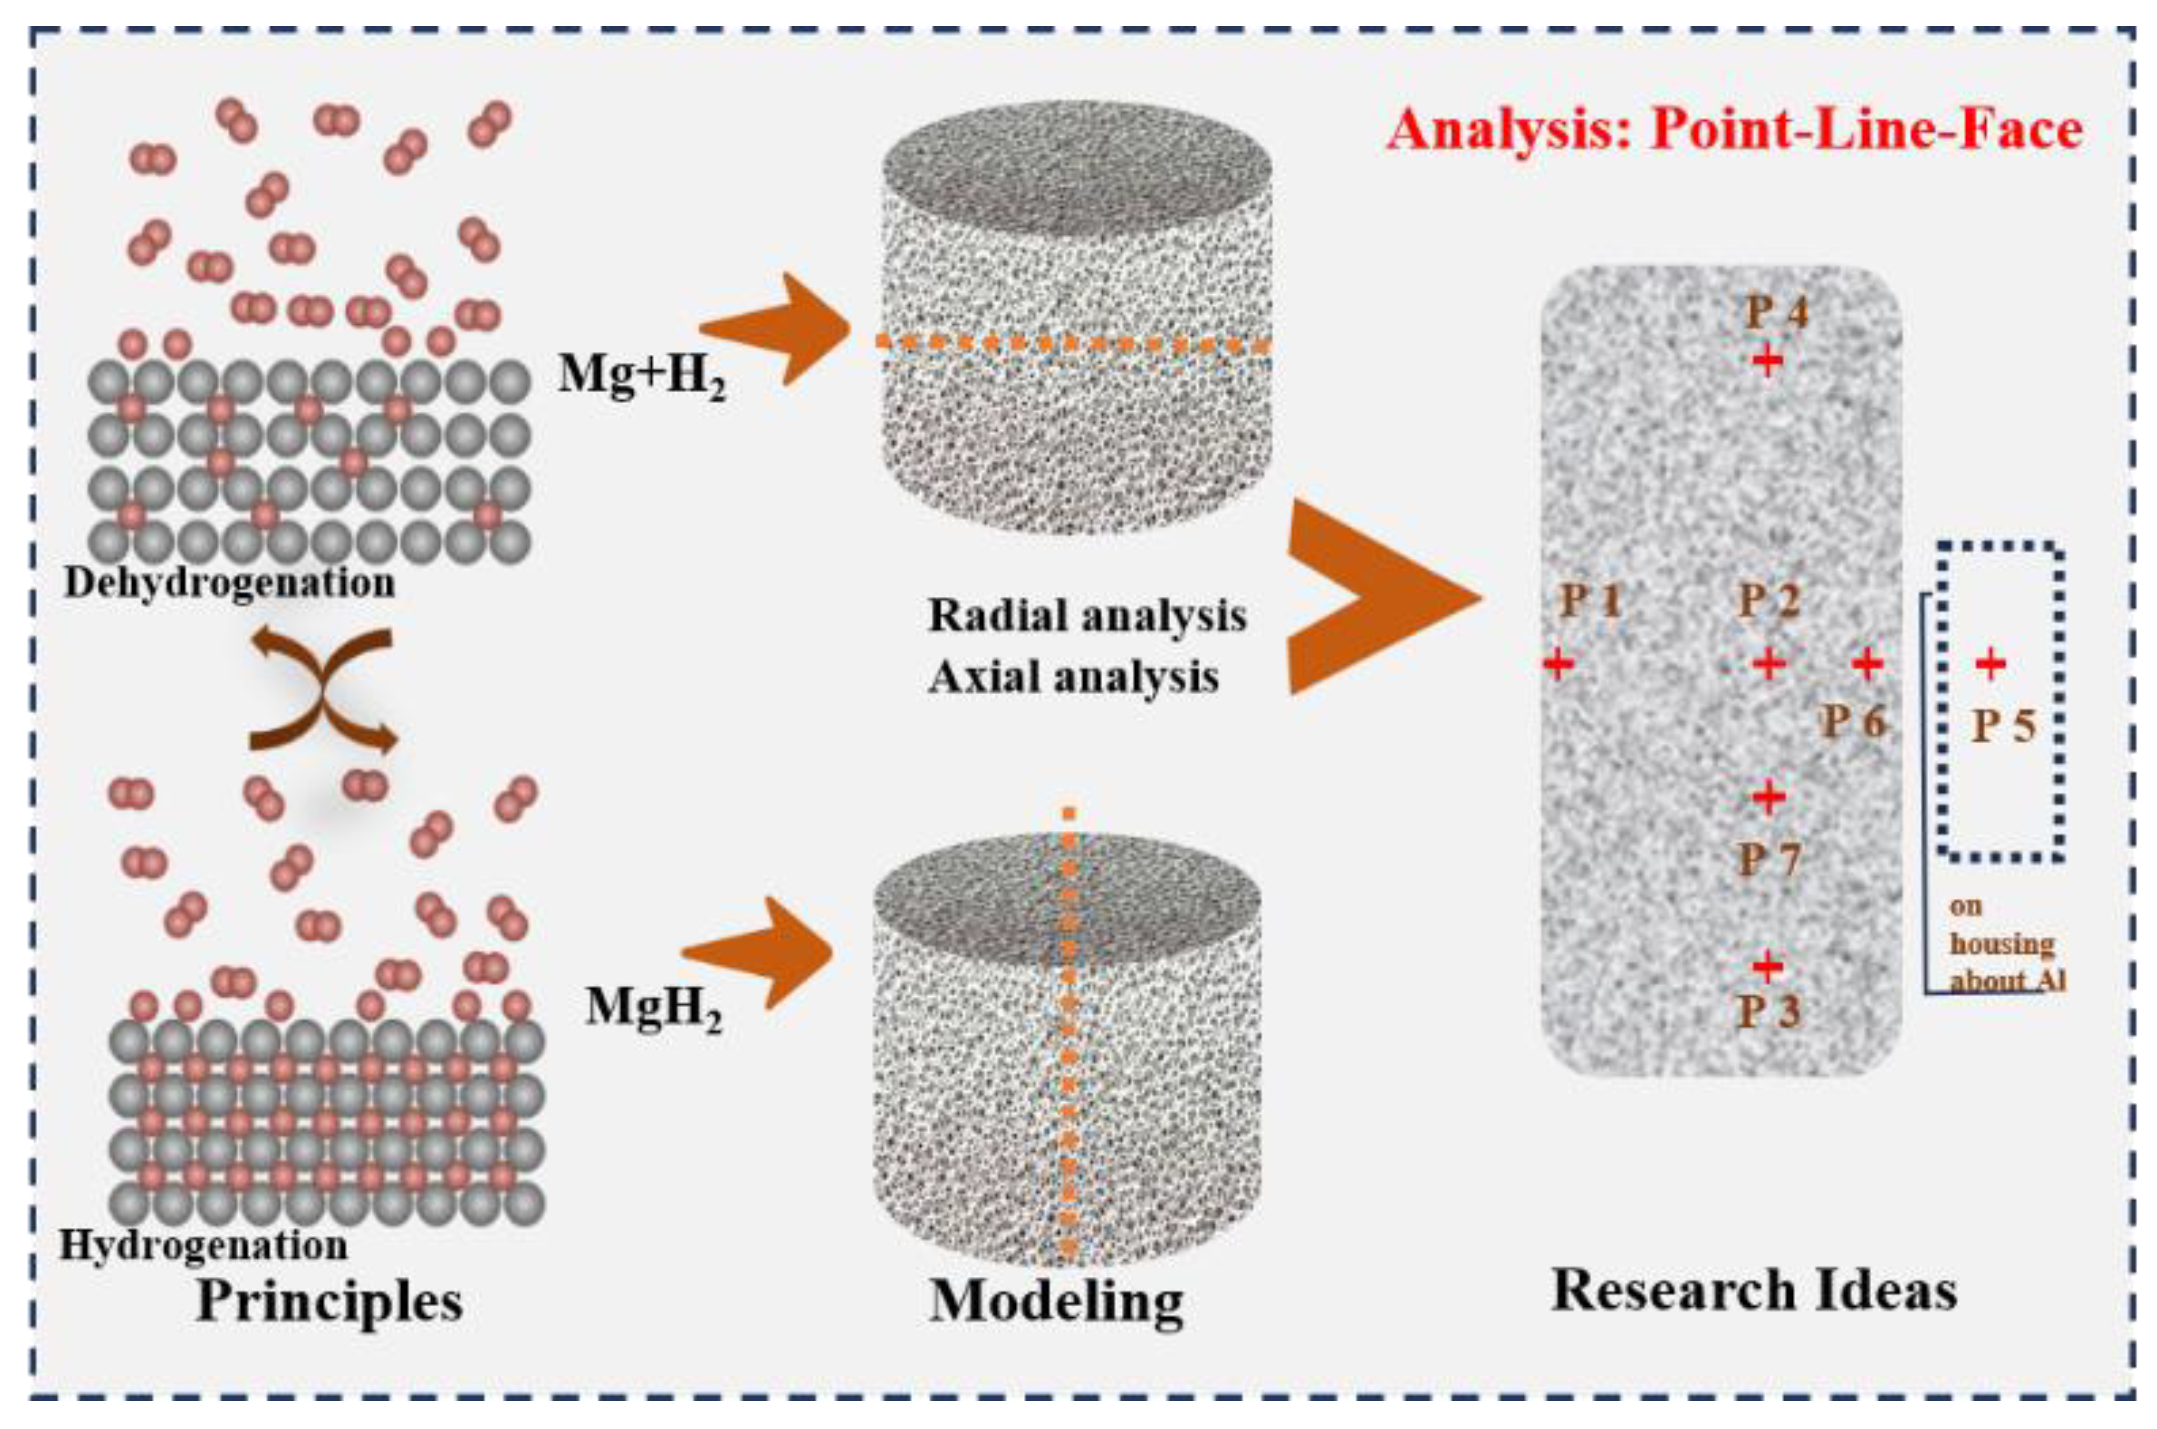
Figure 7, six monitoring points and two intercept lines were selected in the reactor. The coordinates of the monitoring points are P1 (0, 3.5), P2 (2.5, 3.5), P3 (2.5, 1), P4 (2.5, 6), P5 (5, 3.5), P6 (3.4, 3.5), and P7 (2.5, 1.7), respectively. The radial and axial intercepts are the extensions of the midpoints of the height and width of the reaction bed, respectively.
As shown in
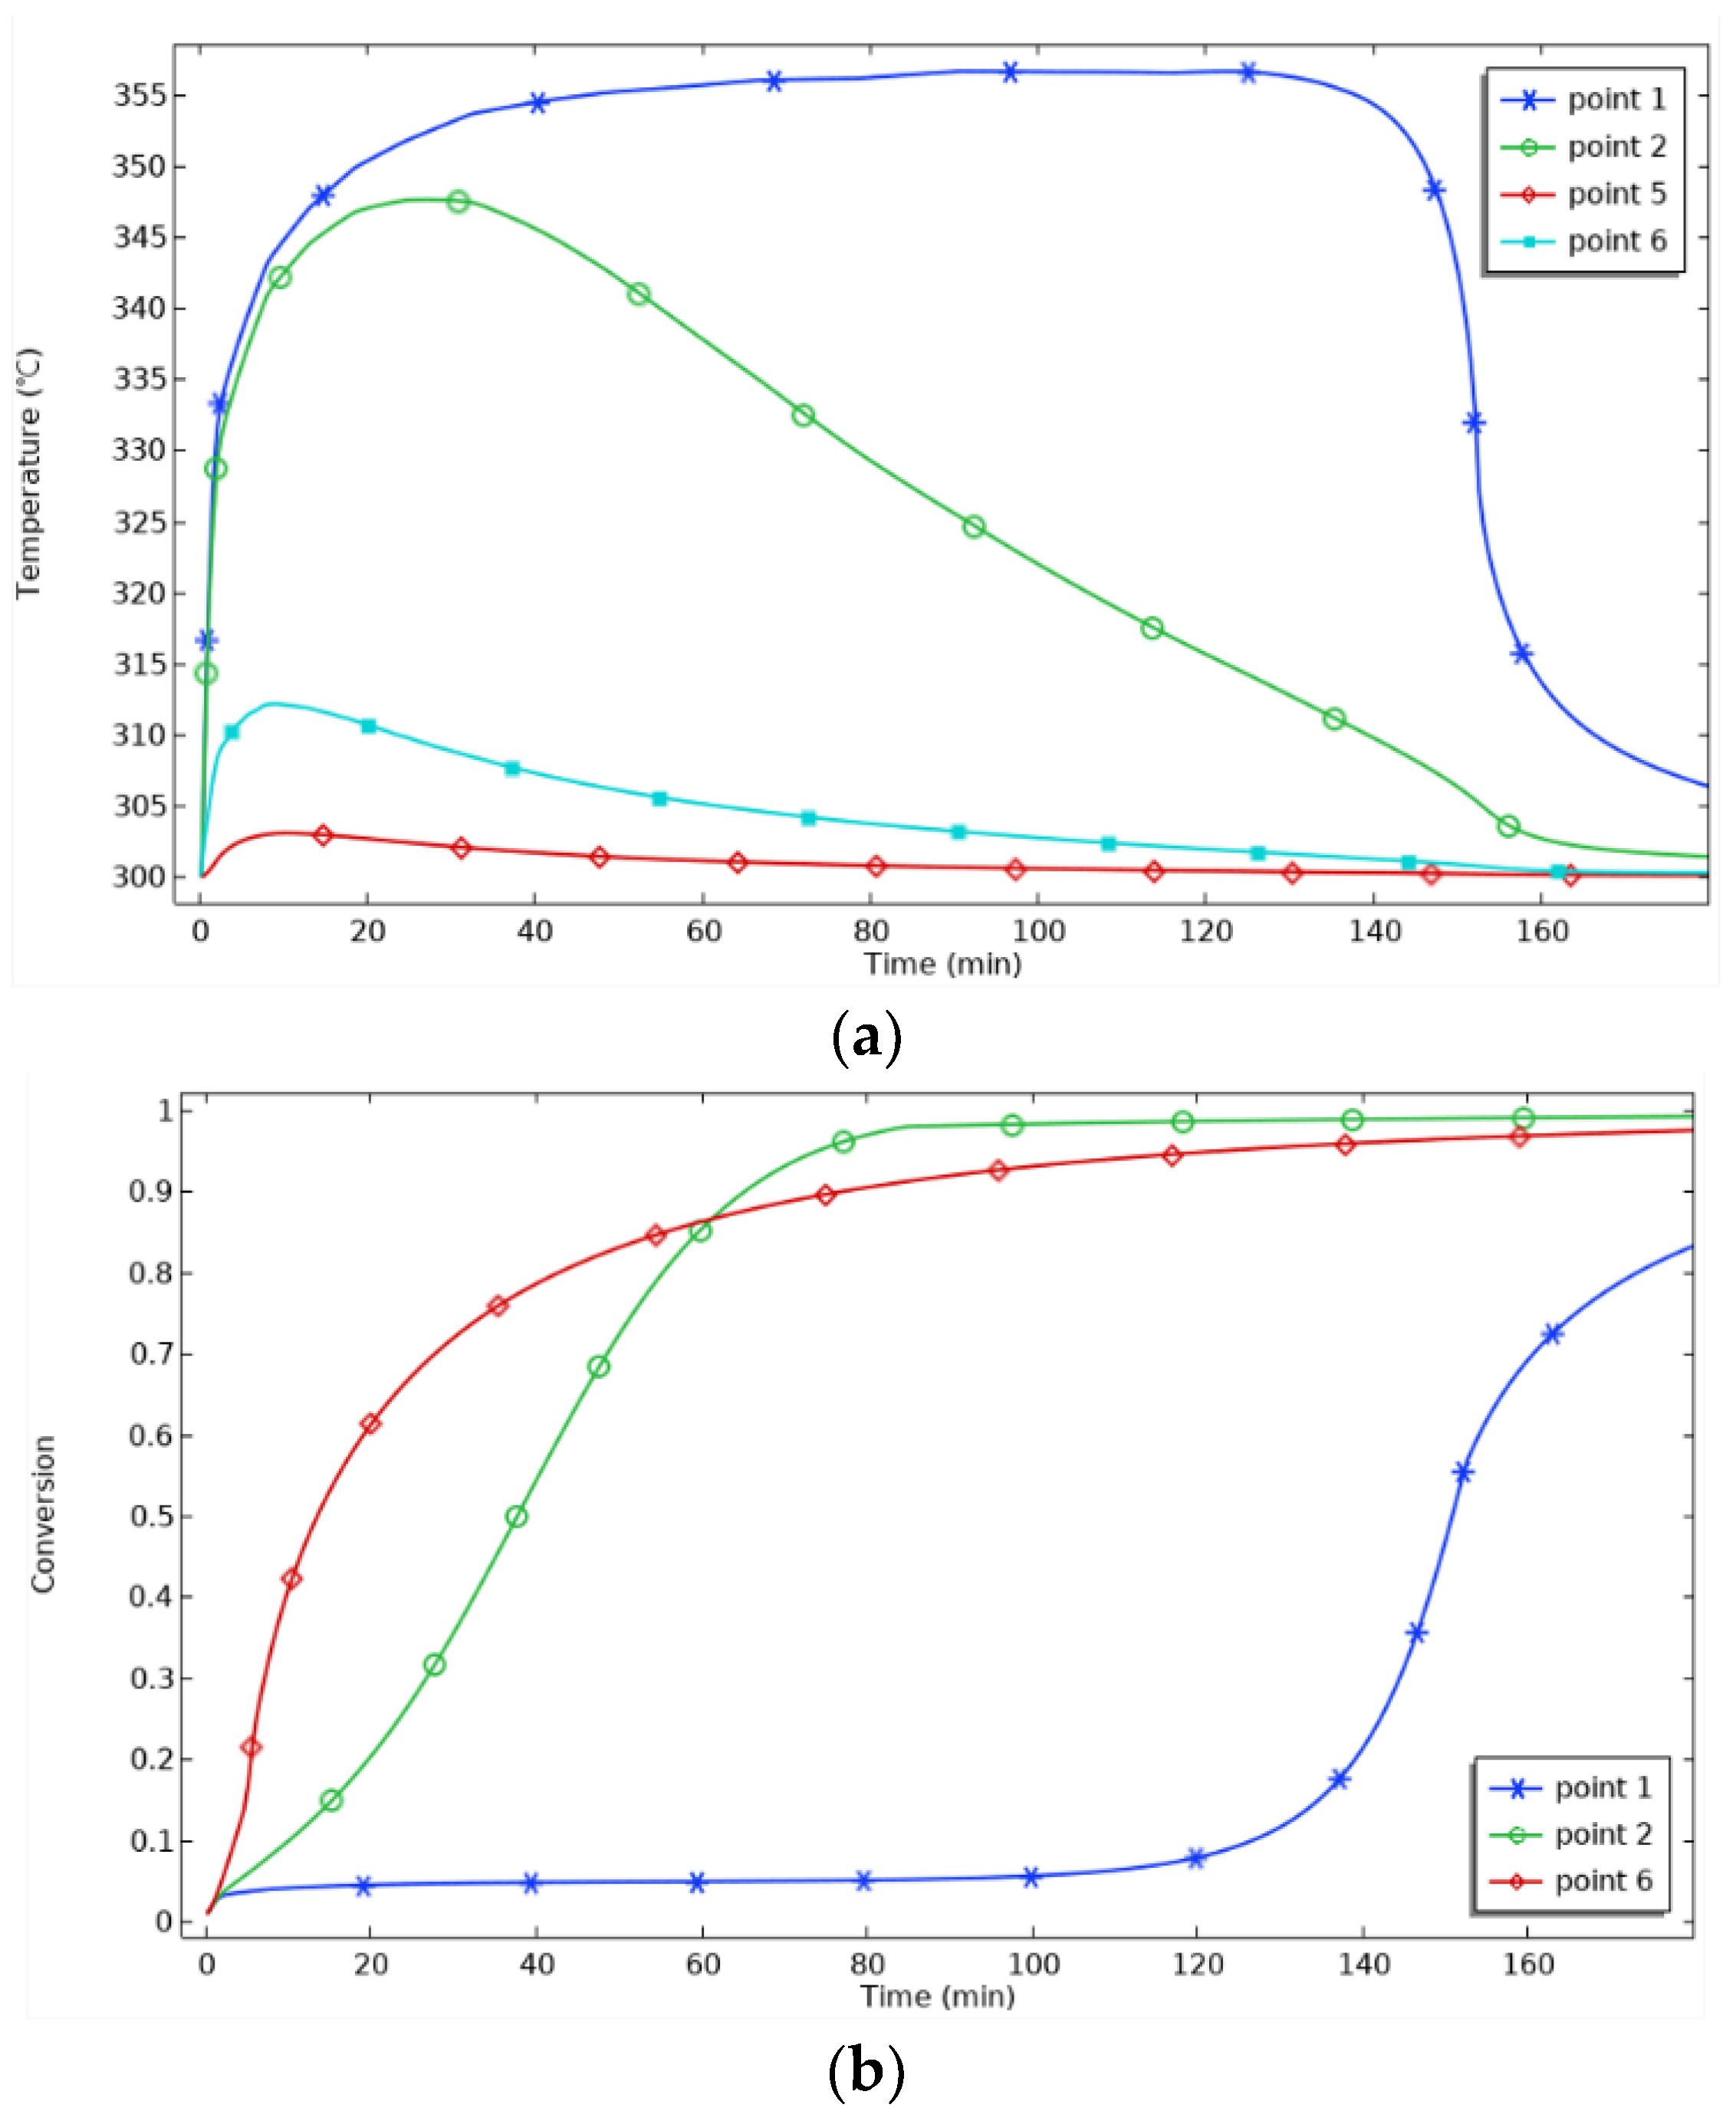
Figure 8, the temperature increase in the center area of P1 is the most significant, and the temperature at P1 rises sharply in 0~20 min, indicating that the hydrogenation reaction in the reaction bed is the main driving force for the temperature increase. After 40 min, the temperature at P1 enters a stable period. When the hydrogenation reaction reaches saturation, the exothermic rate of the reaction slows down, and the temperature increase decreases. At 130 min, the temperature increase at P1 is only 0.08%, and the progress of the reaction is only 0.08%. From the Van’t Hoff equation, it can be seen that when the equilibrium temperature increases, the equilibrium pressure also increases. Since P1 is far away from the heat sink, it is difficult to dissipate heat in time, and the higher temperature corresponds to the higher equilibrium pressure, which is close to the hydrogen charging pressure, resulting in a slow reaction rate, which is manifested as the slow progress of the reaction. Then, 130 min later, the temperature at P1 begins to decrease, representing that the hydrogenation reaction in the reaction bed is about to be completed, and P1 begins to cool down and dissipate heat. The progress of the reaction at P1 begins to rise.
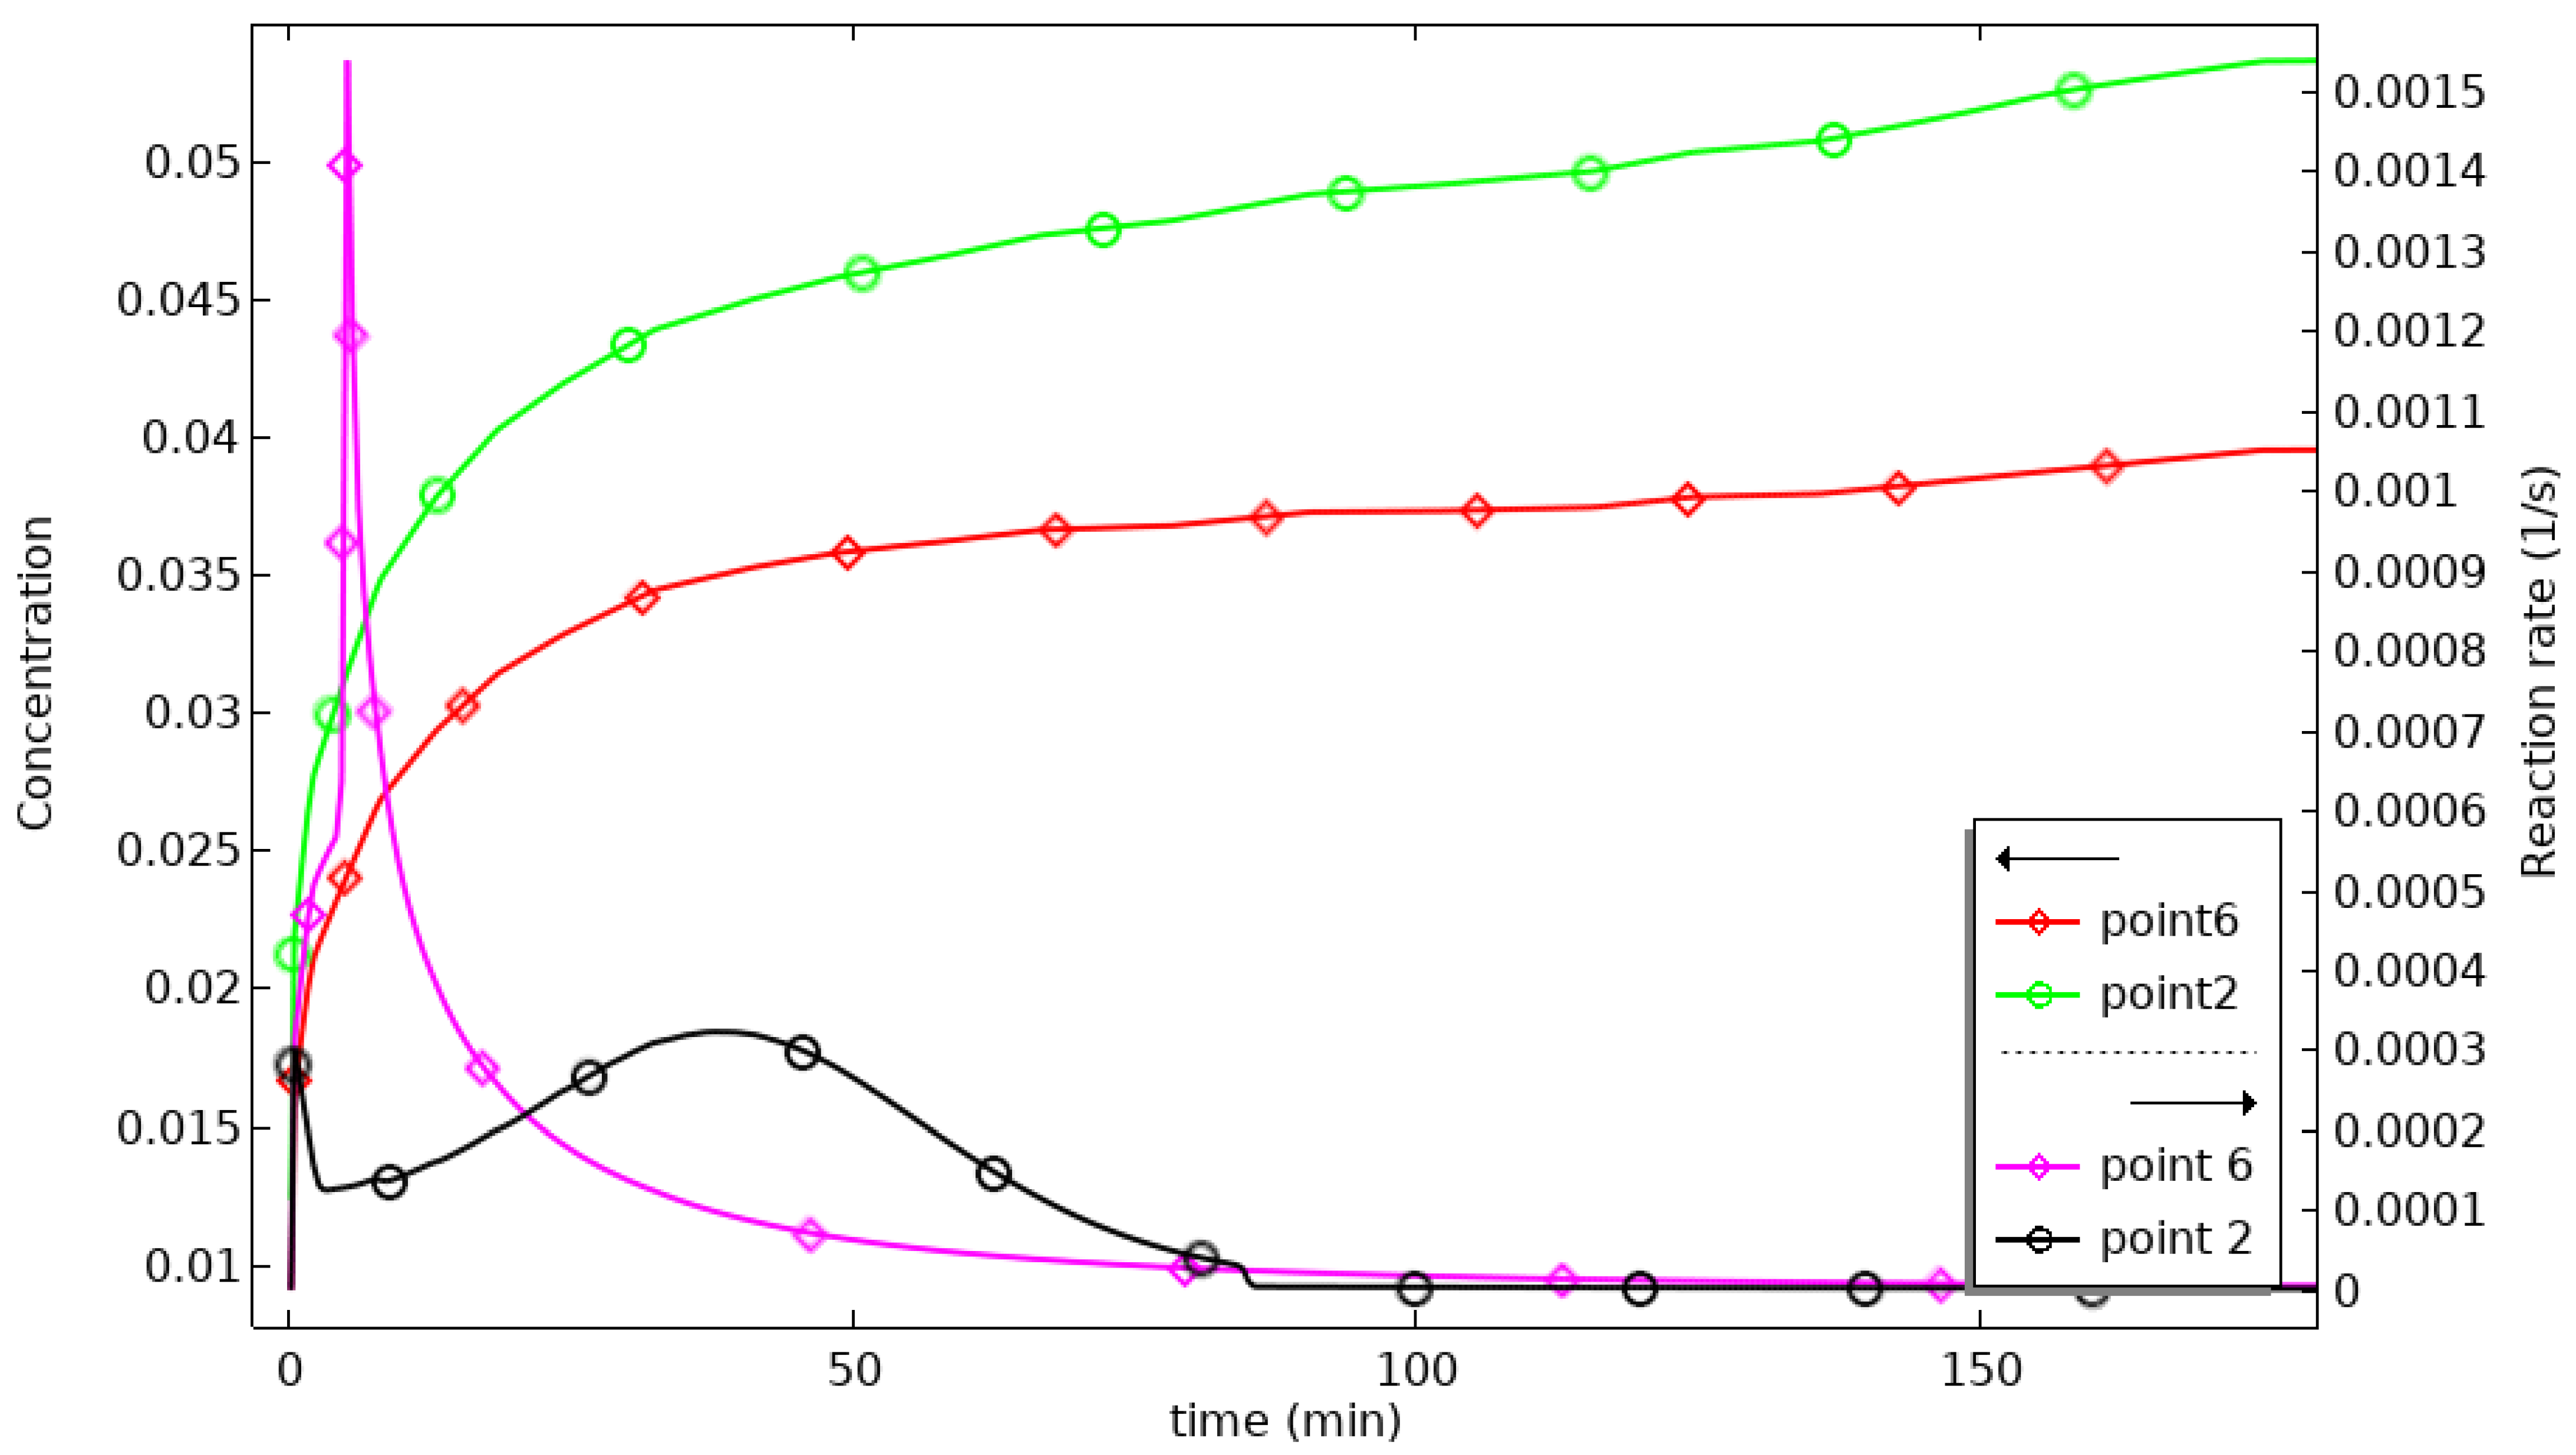
The distance between P2 and P6 and the heat sink decreases, so the cooling rate increases, and the reaction progresses. P2 starts cooling at 25 min, 105 min earlier than P1, and the maximum temperature at P6 is only 312 °C, which is better. P5 is located in the external area of the reactor, and the aluminum shell has good thermal conductivity, so the heat dissipation is fast. The temperature fluctuation in this area is slight, 3.03 °C, and the temperature curve is close to the constant temperature curve of 300 °C. The temperature profile is close to the 300 °C thermostatic profile. At 60 min, the progress curves for P2 and P6 cross. Before 60 min, the progress at P6 is higher than that at P2 because of the better heat transfer at P6. After 60 min, the progress at P2 is higher than that at P6, which indicates that temperature is not the only factor affecting the progress of the reaction. The combined effects of temperature, hydrogen concentration, pressure, and reaction rate determine the progress of the reaction. To further analyze this, the hydrogen concentrations and reaction rates for P2 and P6 are plotted in
Figure 9. As can be seen in
Figure 9, the concentration at P2 is consistently greater than that at P6, and the reaction rate at P6 reaches a maximum at 5 min and then decreases sharply, being exceeded by P2 at 22 min. Between 20 and 60 min, the difference between the reaction rates at P2 and P6 gradually decreases, and under the influence of the cumulative effect, the reaction process at P2 exceeds that at P6 at 60 min.
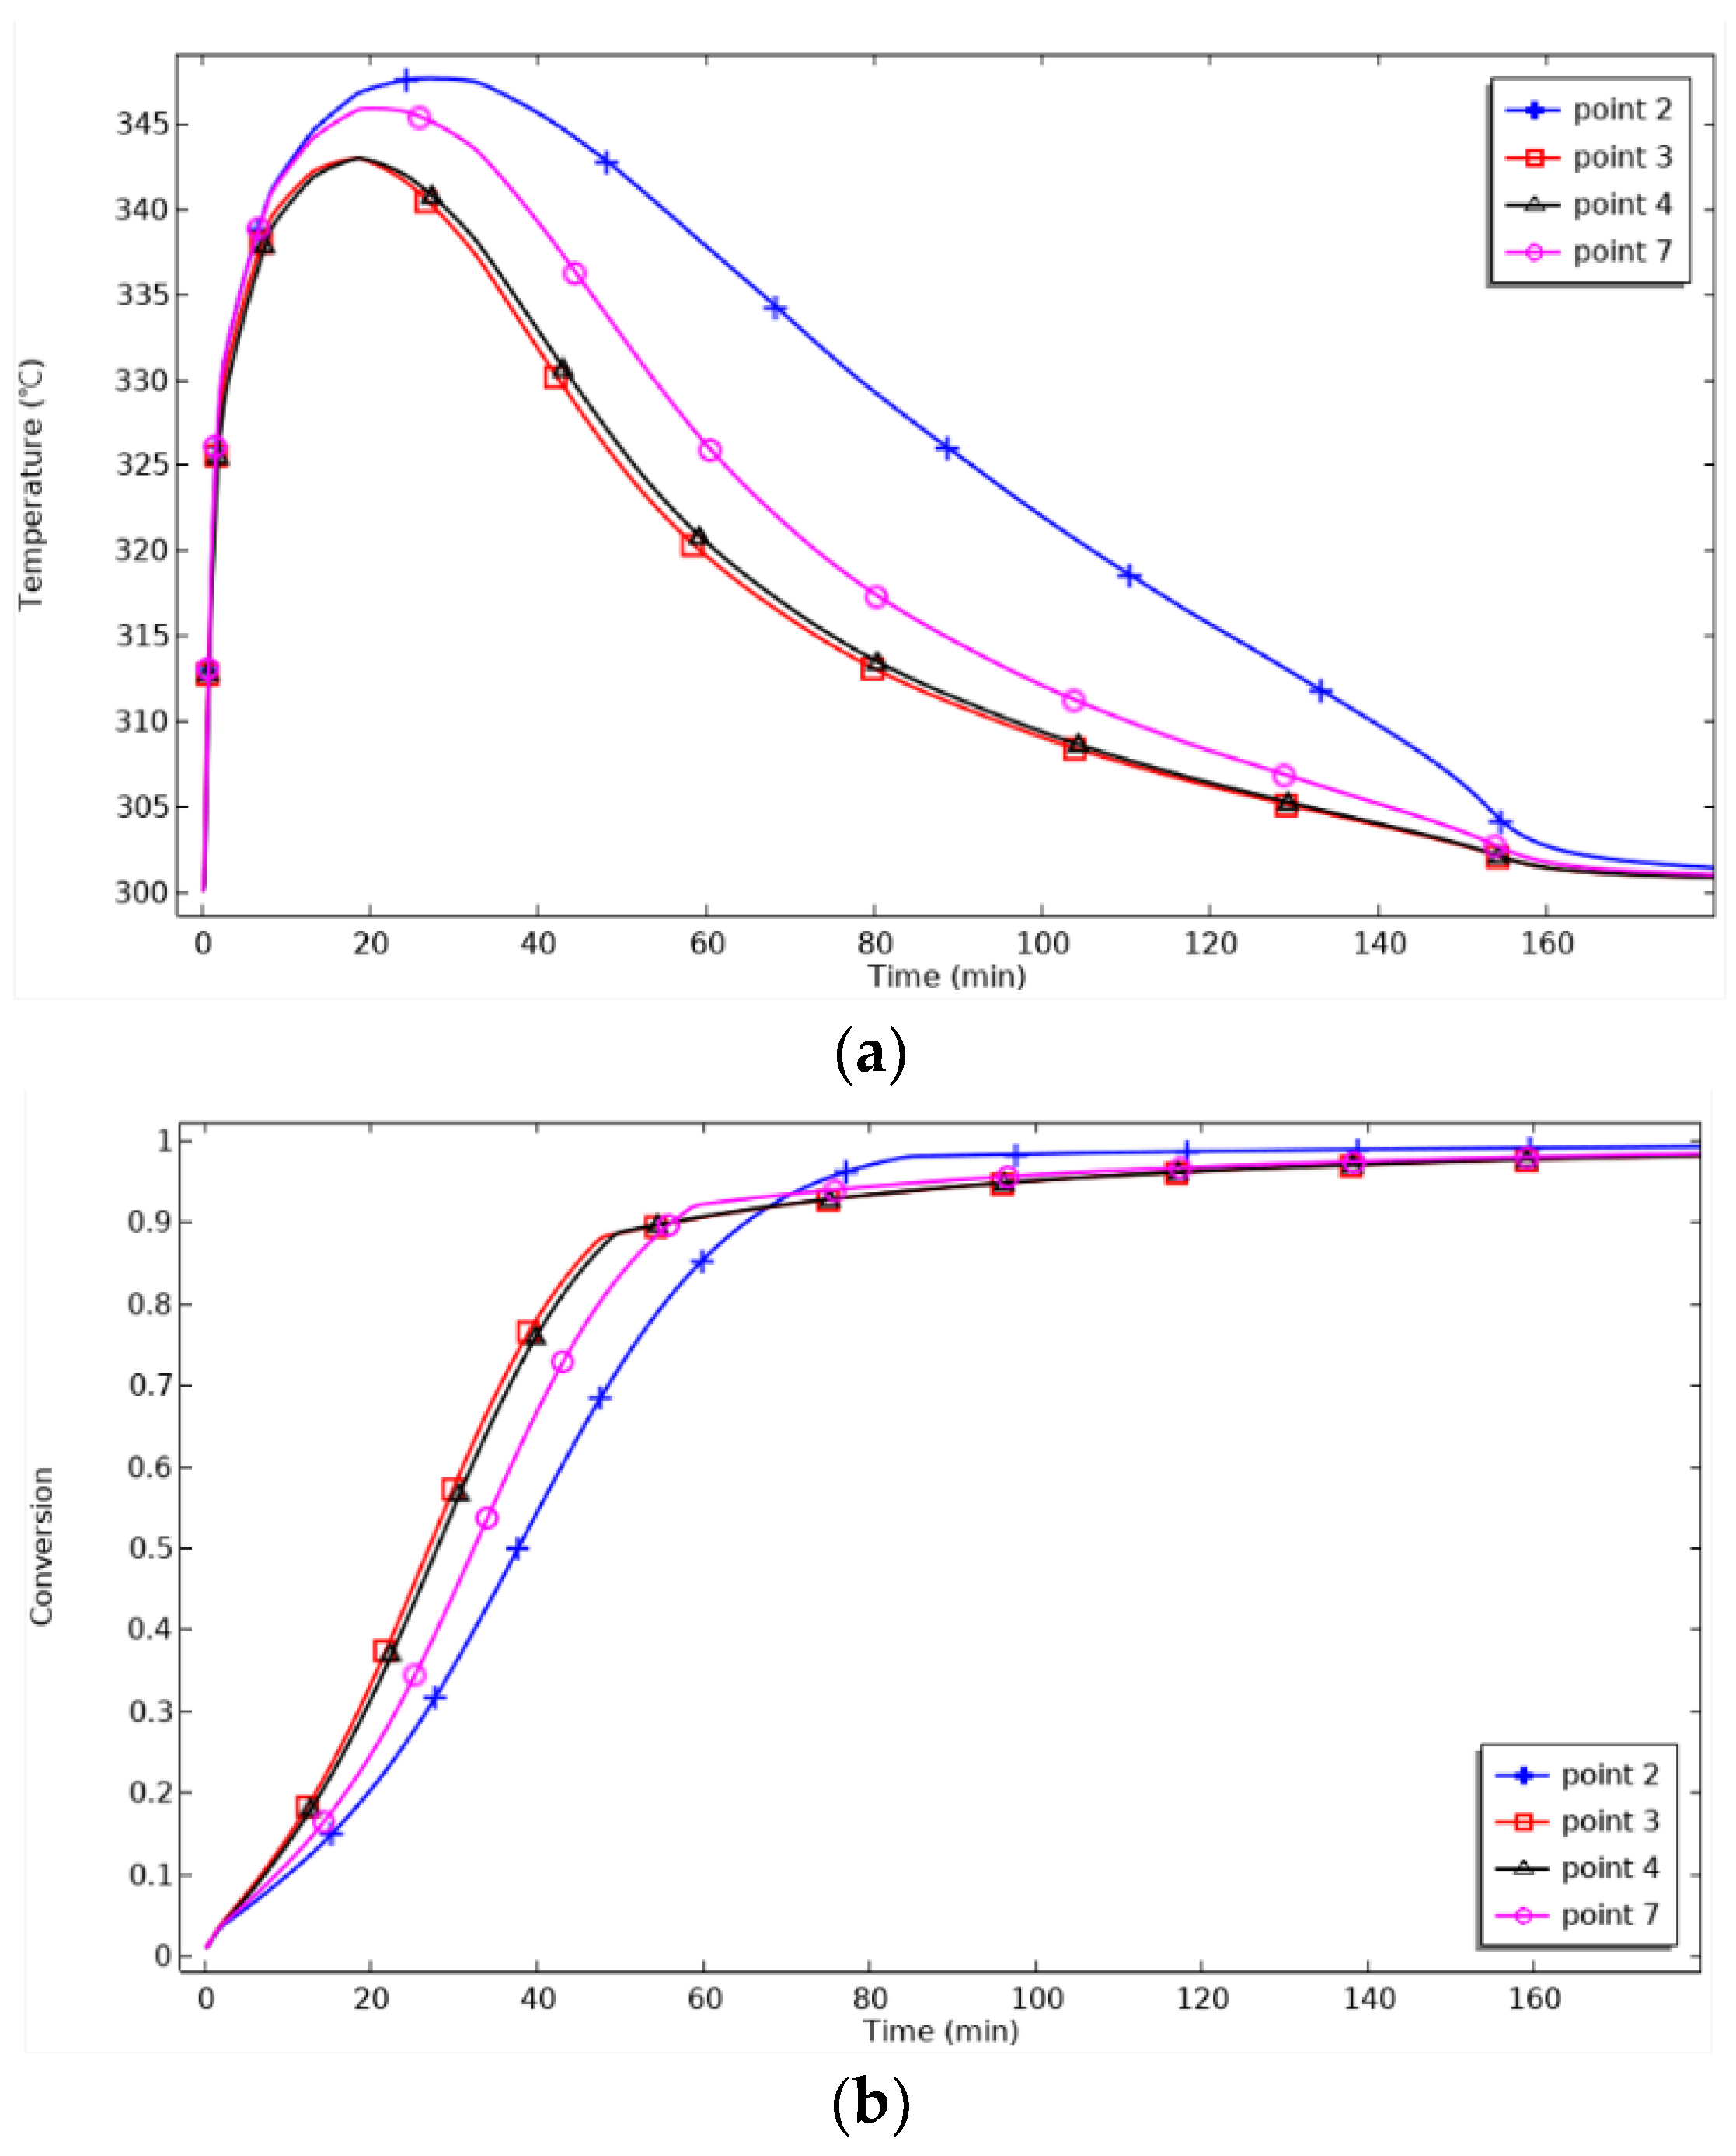
Figure 10 shows the axial monitoring points’ temperature and reaction process changes. For P2, the maximum temperature is reached at 30 min, and cooling begins. For P7, the maximum temperature is reached at 25 min. P3 and P4 are close to the heat transfer surface and, therefore, reach the lowest maximum temperature and start cooling 10 min before P2 and 5 min before P7. As the relative distance to the heat transfer surface decreases, the maximum achievable temperature decreases, and the cooling starts earlier. When the reaction progress is 90%, the reaction time for P3 and P4 is 51 min, for P7 is 56 min, and for P7 is 65 min. P3 and P4 are symmetrically distributed on both sides of the metal hydride reaction bed, and their temperature and reaction progress curves in the graphs coincide, verifying the symmetry and rationality of the spatial distribution of the model. Meanwhile, the reaction time from P3 to P7 changes by 5 min, while that from P7 to P2 changes by 9 min, which indicates that the reaction progress slows down with the increase in the height of the discrete thermal surface.
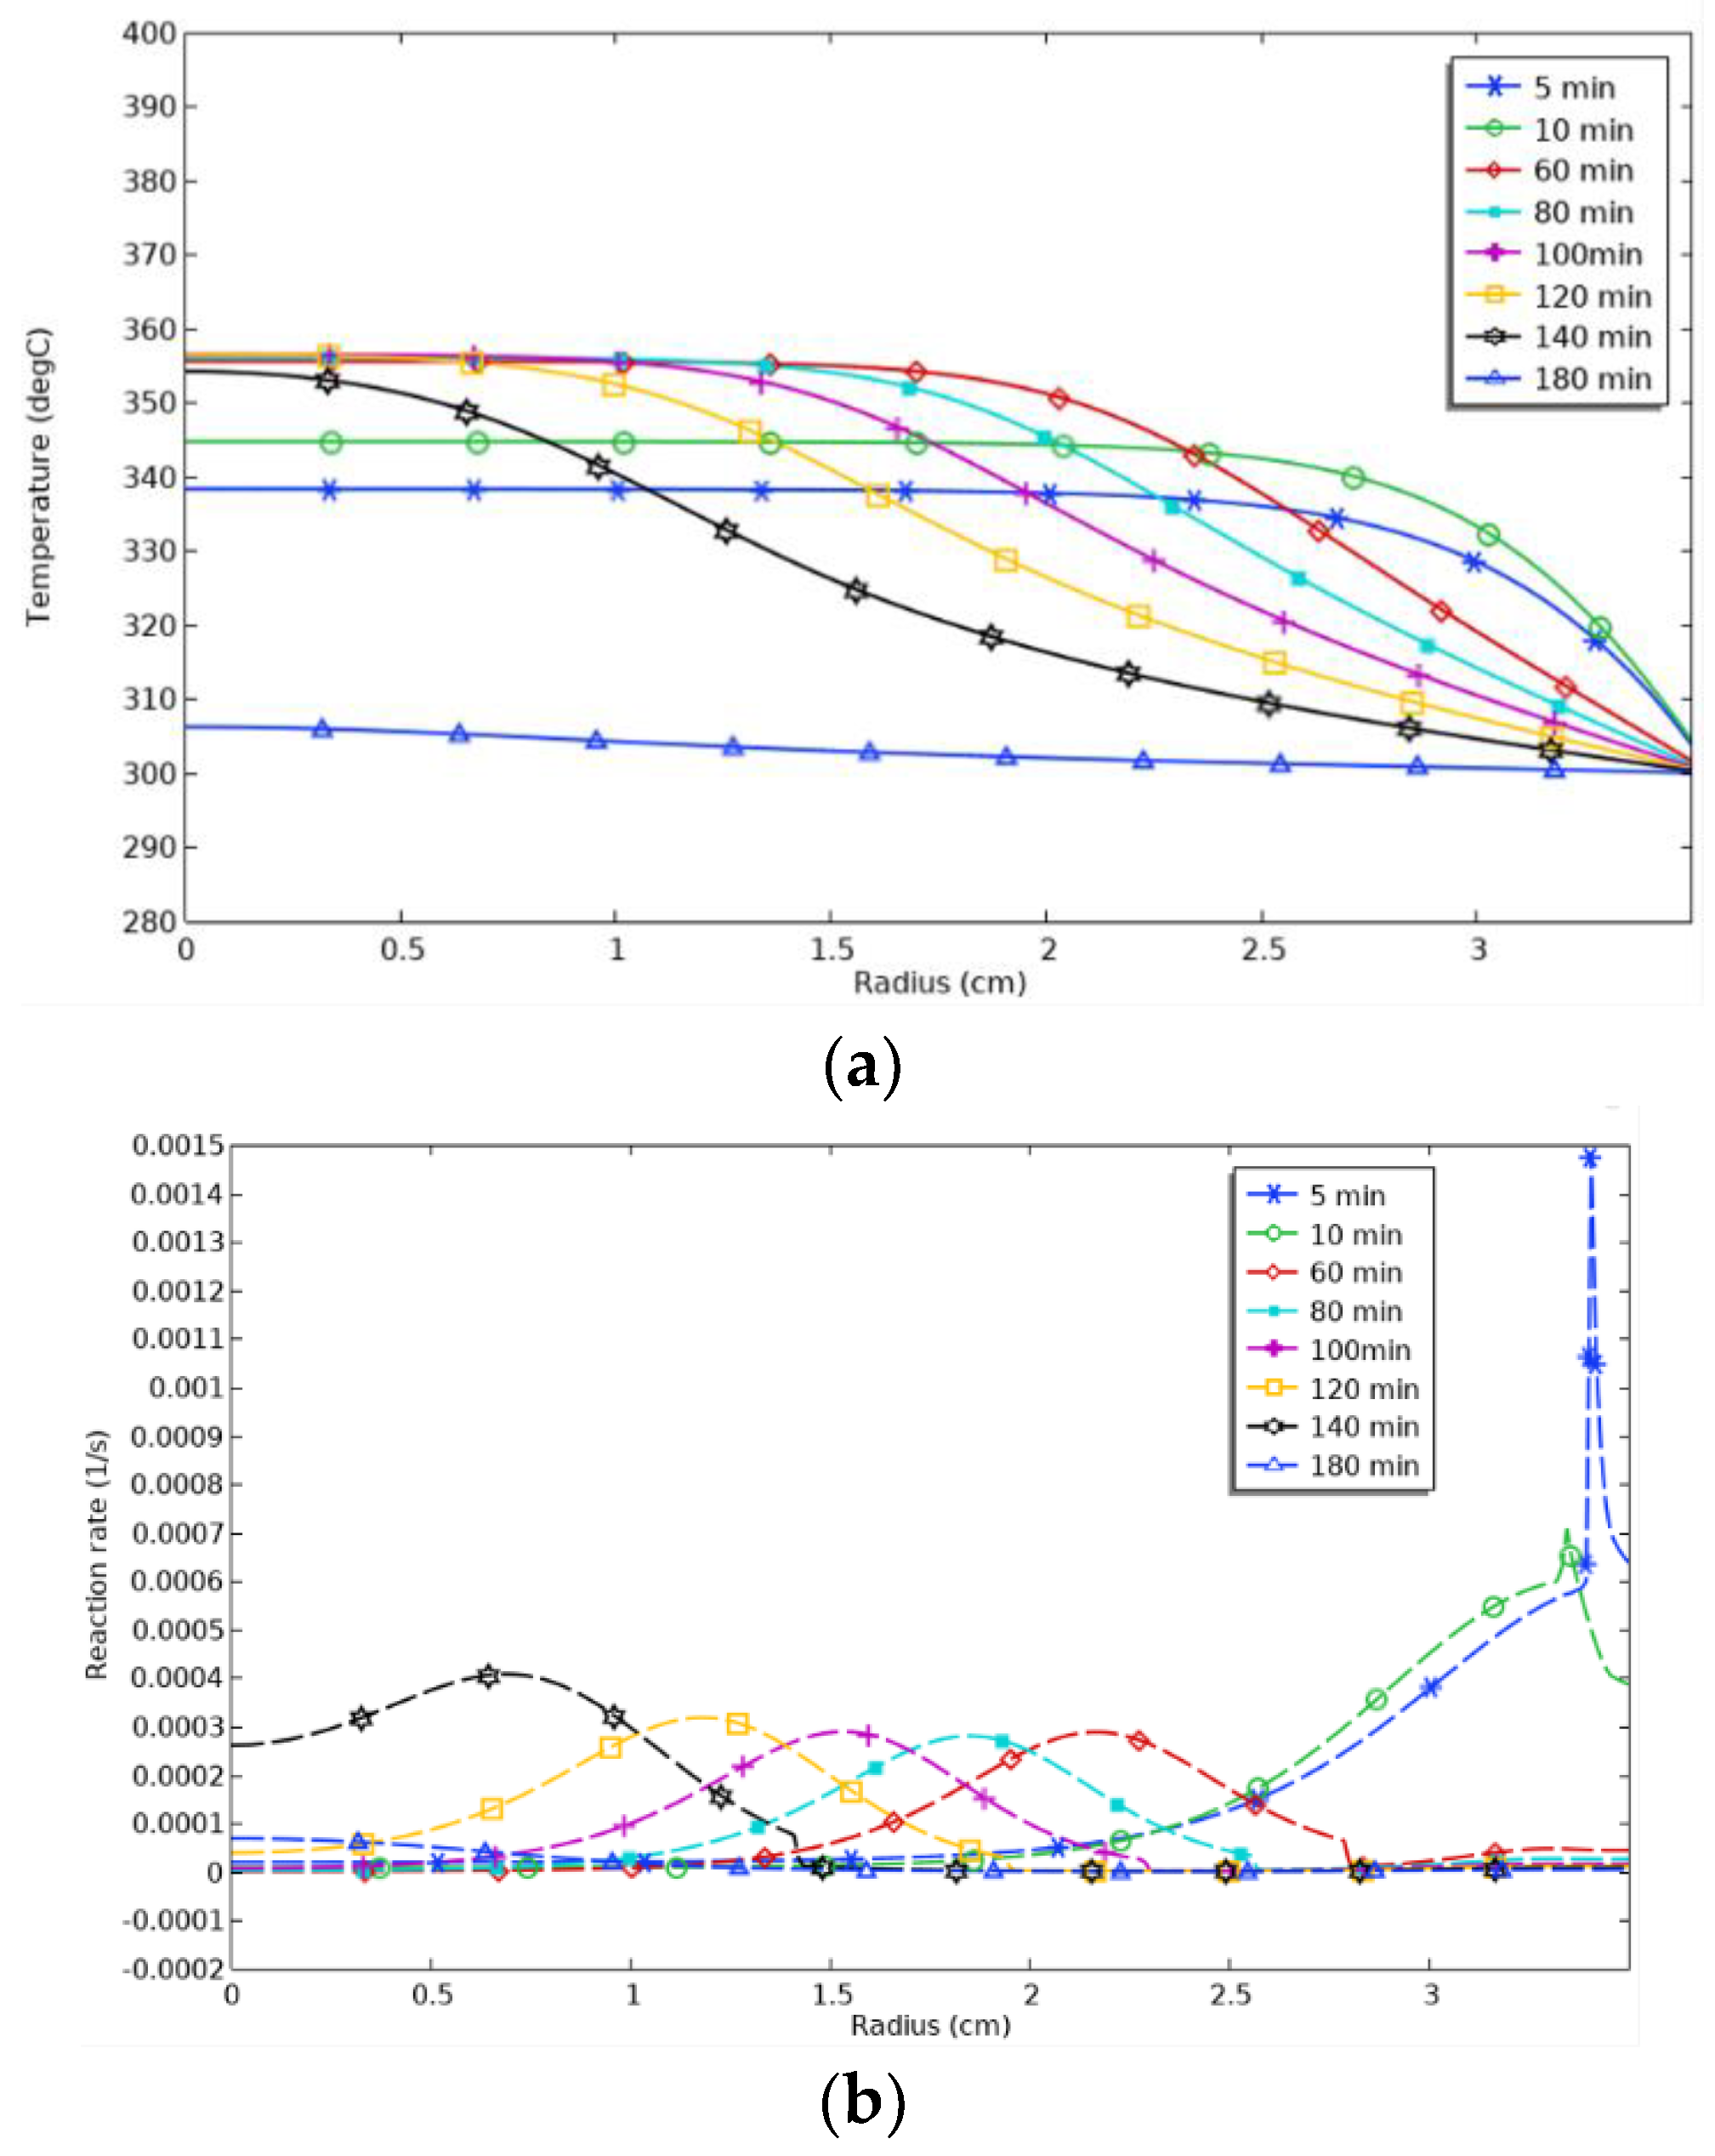
In order to further understand the reaction characteristics of the hydrogenation process, we analyzed the spatial distribution of temperature and reaction rate on the radial and axial intercept. For the radial section, the temperature changes at different radius locations gradually showed obvious spatial and temporal characteristics, as shown in
Figure 11. In the initial stage (5 min∼10 min), the temperature in the center region continued to rise, the temperature change was more uniform, the plateau period was more extended, and the temperature decreased slowly. With time (10 min to 80 min), the temperature in the center region reached the highest value and then stabilized. The temperature began to decline significantly along the radius. The onset of temperature decline extended from 2.5 cm to 1.7 cm to 80 min to 120 min, and the onset of temperature decline in the edge region gradually converged to the center. The plateau period of the temperature was gradually shortened. At 140 min, the temperature stabilization period almost disappeared. At 140 min, the temperature plateau period disappeared. At 180 min, the temperature distribution was stabilized, the reaction was completed, the temperature gradient disappeared, and the reaction reached thermal equilibrium. From the distribution of the reaction rate, it can be seen that the hydrogenation reaction does not occur at the same time, and the hydrogenation reaction will reach the peak in a particular region at the same time. In the initial stage, the reaction rate is higher at the edge, which coincides with the temperature distribution results. As time passes, the peak of the reaction rate moves closer to the center, a phenomenon referred to as peak shifting, which also indicates that heat transfer is an important factor in controlling the accuracy of the reaction. At 140 min, the reaction rate in the center region increased significantly, which is related to the disappearance of the temperature plateau at 140 min. From 5 min to 60 min, the peak of the reaction rate decreased significantly, which indicates that the heat transfer capacity at the edges decreased significantly at the beginning of the reaction. From
Figure 11a, it can be seen that the change in temperature gradient decreased with time. Fourier’s law of thermal conductivity shows that when the temperature gradient decreases, the amount of heat transfer decreases, which in turn affects the cooling process and leads to a decrease in the peak reaction rate. The peak wave values in the reactor were essentially the same between 60 and 120 min, indicating no significant change in the heat transfer capacity.
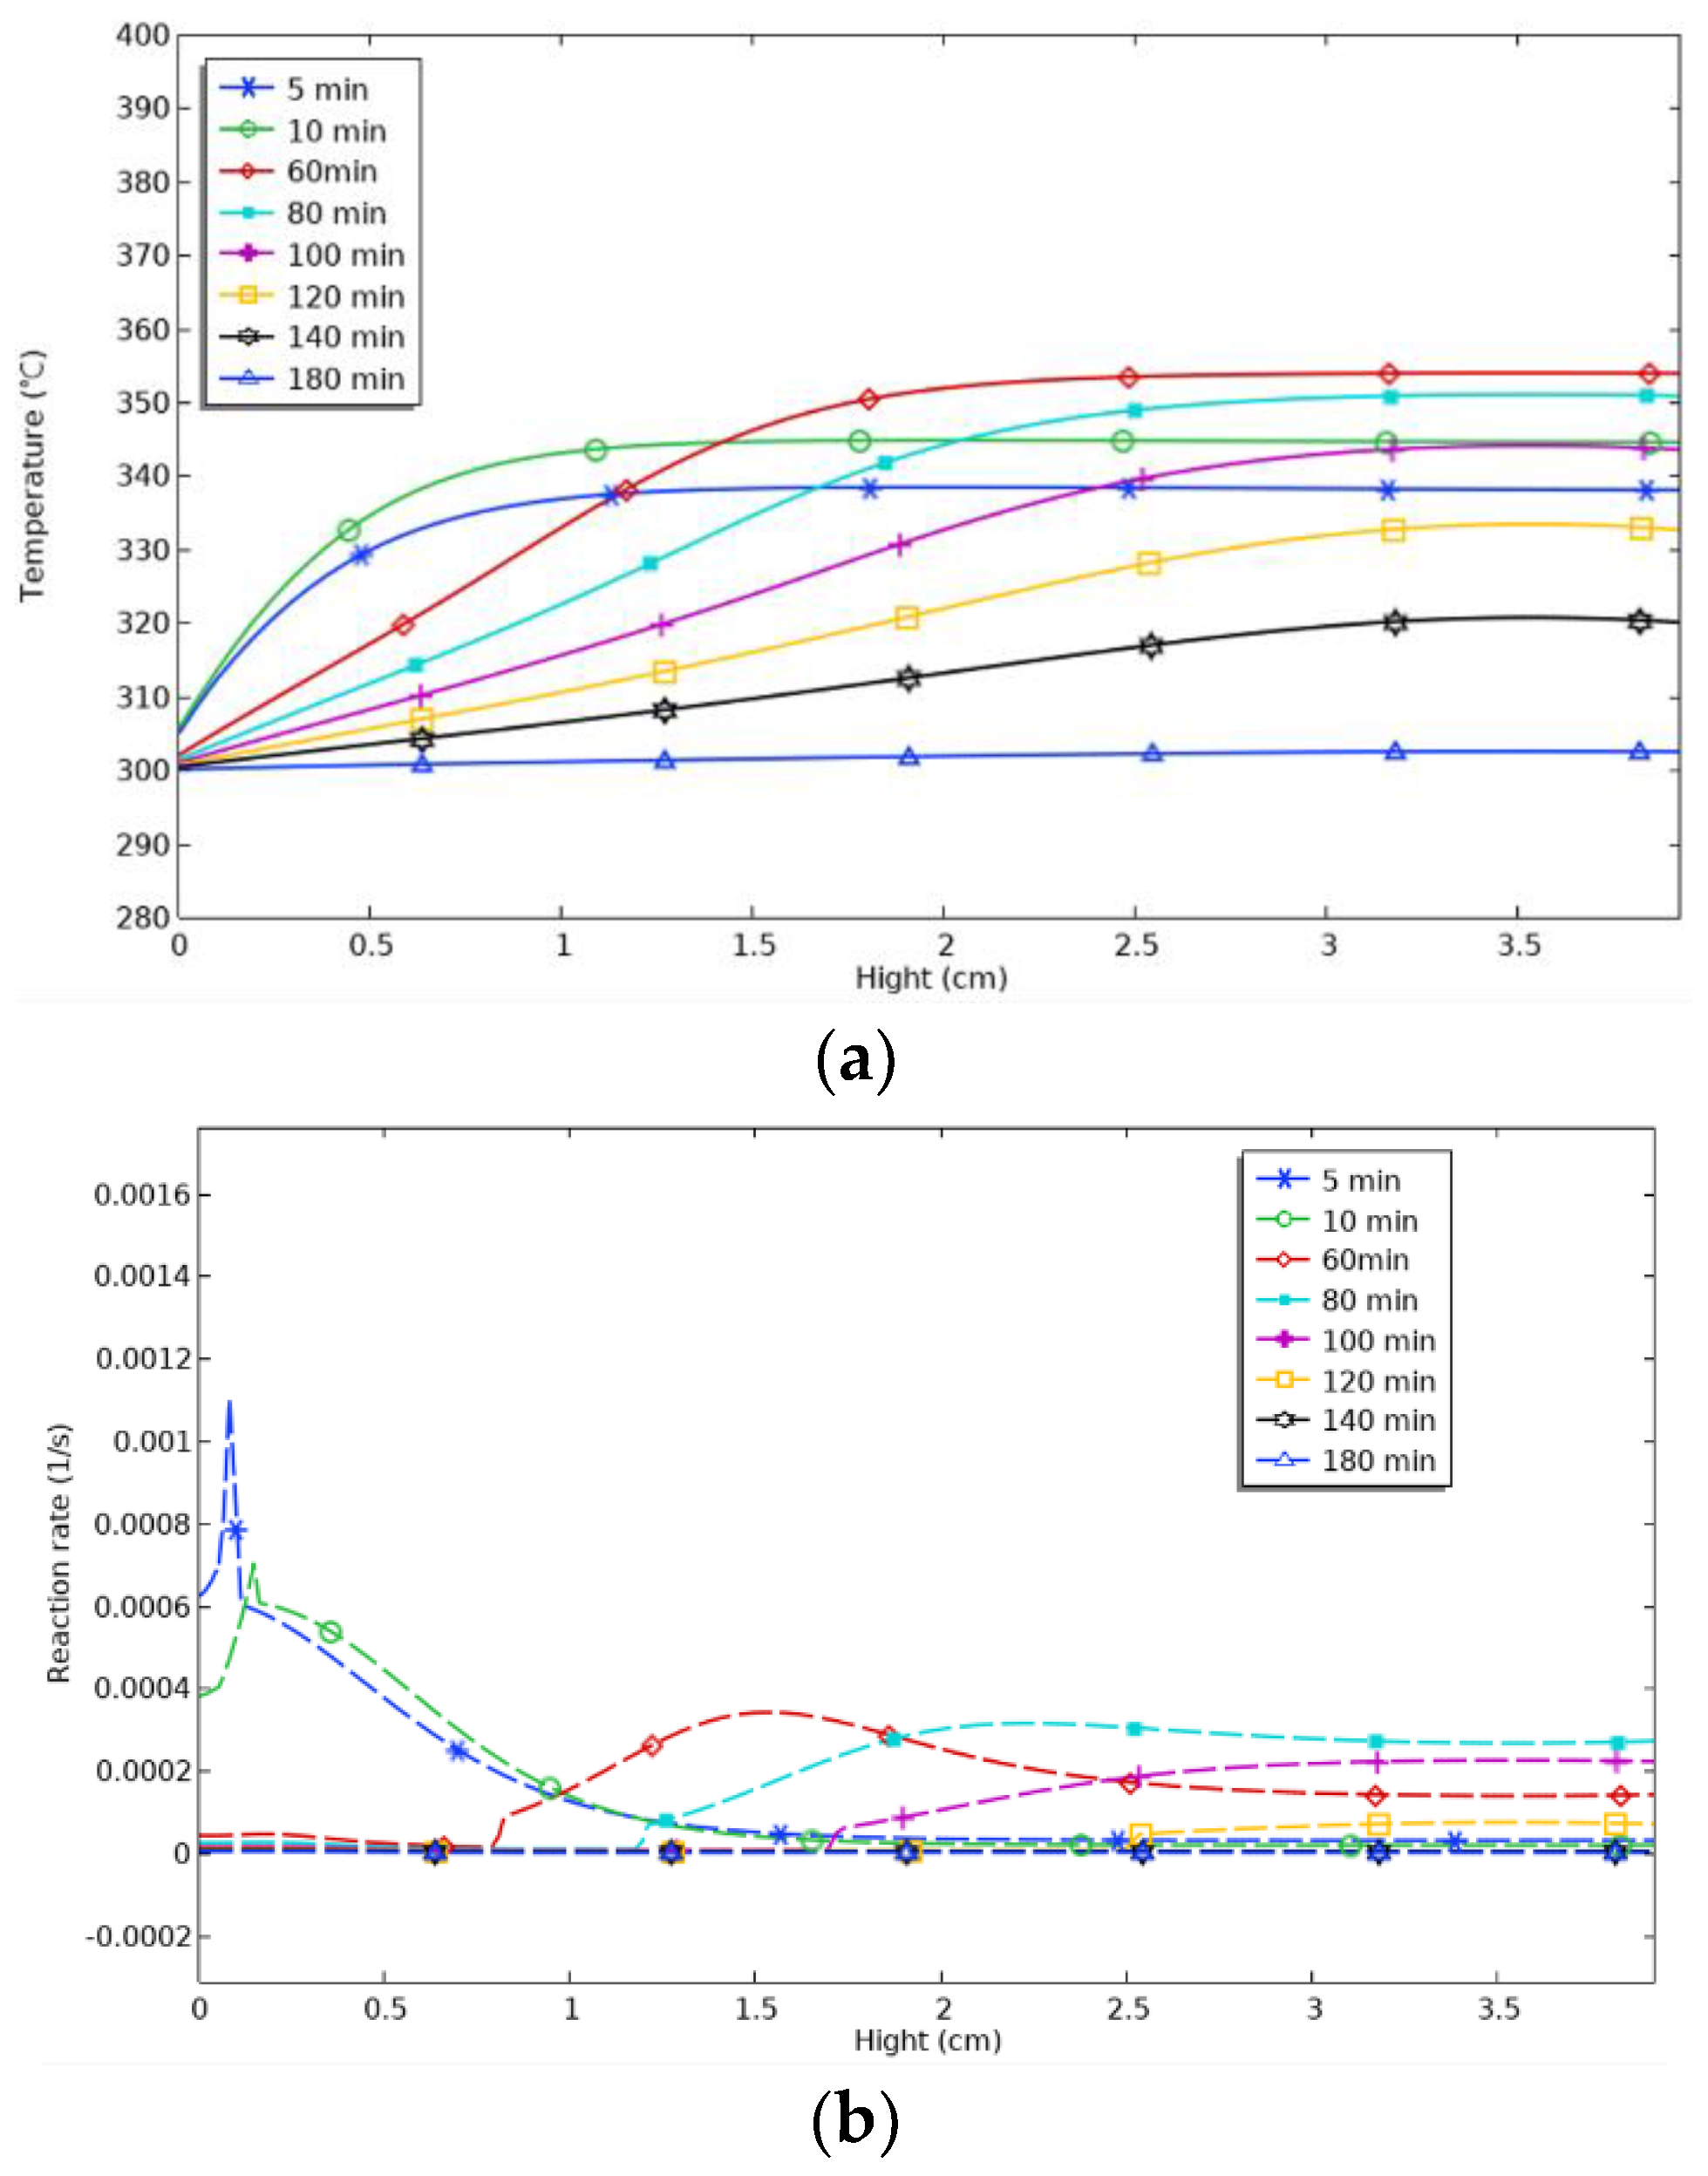
As shown in
Figure 12, the temperature inside the reactor remained relatively uniform over almost the entire height range from 5 to 10 min on the axis, with a temperature interval of about 328 °C to 345 °C. After 60 min, the temperature gradually changed at different heights, increasing in the height interval from 0 to 2 cm, up to a maximum of 354 °C. The height interval of the increase in temperature increased gradually with time. The temperature increase was gradual. Over time, the height interval of the temperature increase gradually widened, the temperature gradient gradually slowed down, and the maximum temperature reached at the top gradually decreased. In general, however, the temperature in the top region was always higher than the bottom region each time, indicating that the heat was concentrated at the top of the reactor. Time monitoring points were set at 20 min intervals between 60 and 120 min. From 60 to 80 min, the maximum temperature reached at the top decreased from 353 °C to 351 °C, a decrease of 2 °C. From 80 to 100 min, the maximum temperature reached at the top decreased from 351 °C to 343 °C, a decrease of 8 °C. From 100 to 120 min, the maximum temperature reached at the top decreased from 351 °C to 343 °C, a decrease of 8 °C. From 100 to 120 min, the maximum temperature reached at the top decreased from 351 °C to 343 °C, a decrease of 8 °C. From 100 to 120 min, the maximum temperature reached at the top decreased from 351 °C to 343 °C, a decrease of 8 °C. From 100 to 120 min, the maximum temperature reached at the top decreased by 8 °C from 351 °C to 343 °C. After 120 min, the maximum temperature reached at the top decreased by 11 °C from 343 °C to 332 °C. It can be seen that the rate of decrease in the maximum temperature at the top of the furnace increased as the isochronous time interval increased. Until 180 min, when the reaction was essentially over, the temperature in the axial line remained essentially constant, falling back to the initial temperature.
In contrast to the radial line, the reaction rate on the axial line did not significantly peak. At the beginning of the reaction, the reaction rate reached a high level at the bottom. As the reaction proceeded, the peak of the reaction rate gradually approached the top and showed a slowly increasing trend, with no significant change after the height reached 3 cm.
In order to more intuitively understand the distribution of and changes in temperature, reaction process, and reaction rate in the whole reactor during the hydrogen loading process, 5 min, 40 min, 90 min, 120 min, 150 min, and 180 min were selected as the time nodes. Cloud diagrams at different time nodes were plotted, as shown in
Figure 13. The temperature variation is shown in
Figure 13a. When the time reaches 5 min, the temperature distribution is uniform, with lower temperatures near the reactor wall, a slight overall temperature gradient, and cooler areas at the edges. At 40 min, the temperature distribution starts to change, with a higher temperature in the center and a transparent temperature gradient. At 90–120 min, the center temperature zone is more concentrated, the outer zone is cooled better, and the whole zone shows a curve around the form and gradually cools to the middle. The conversion rate is observed in
Figure 13b, which is mainly affected by temperature. Hence, the overall form of change is similar to the form of temperature change, and the reaction process gradually increases from the outside to the inside.
Figure 13c shows the reaction rate, the derivative of the conversion rate concerning time. The reaction rate exhibits a more pronounced boundary effect than the conversion rate, and the gradient of the rate change is larger. Combining these three graphs provides a more visual understanding of the relationship between temperature, reaction progress, and reaction rate. The rapid dissipation of heat pushes the reaction process faster. As the reaction proceeds, the heat gradually spreads to the center region when the reaction in the edge region is completed, and the reaction rate decreases. When the reaction in the center region proceeds, the reaction rate in the center region reaches a peak due to the enhanced cooling effect, the reaction process accelerates, and the reaction rate decreases rapidly after the reaction is completed.
4.3. Dehydrogenation Process
The hydrogen release process was studied using the same methodology as the hydrogenation process. For the hydrogen release process in a conventional metal hydride hydrogen storage reactor, the initial temperature of the metal hydride reaction bed remains at 300 °C, but the initial pressure is 0.2 MPa. According to the Van’t Hoff equation, it can be seen that at this time, ln(P/P0) is close to 0, the magnesium hydride undergoes dehydrogenation, and hydrogen is released from the reactor and absorbs the reaction heat.
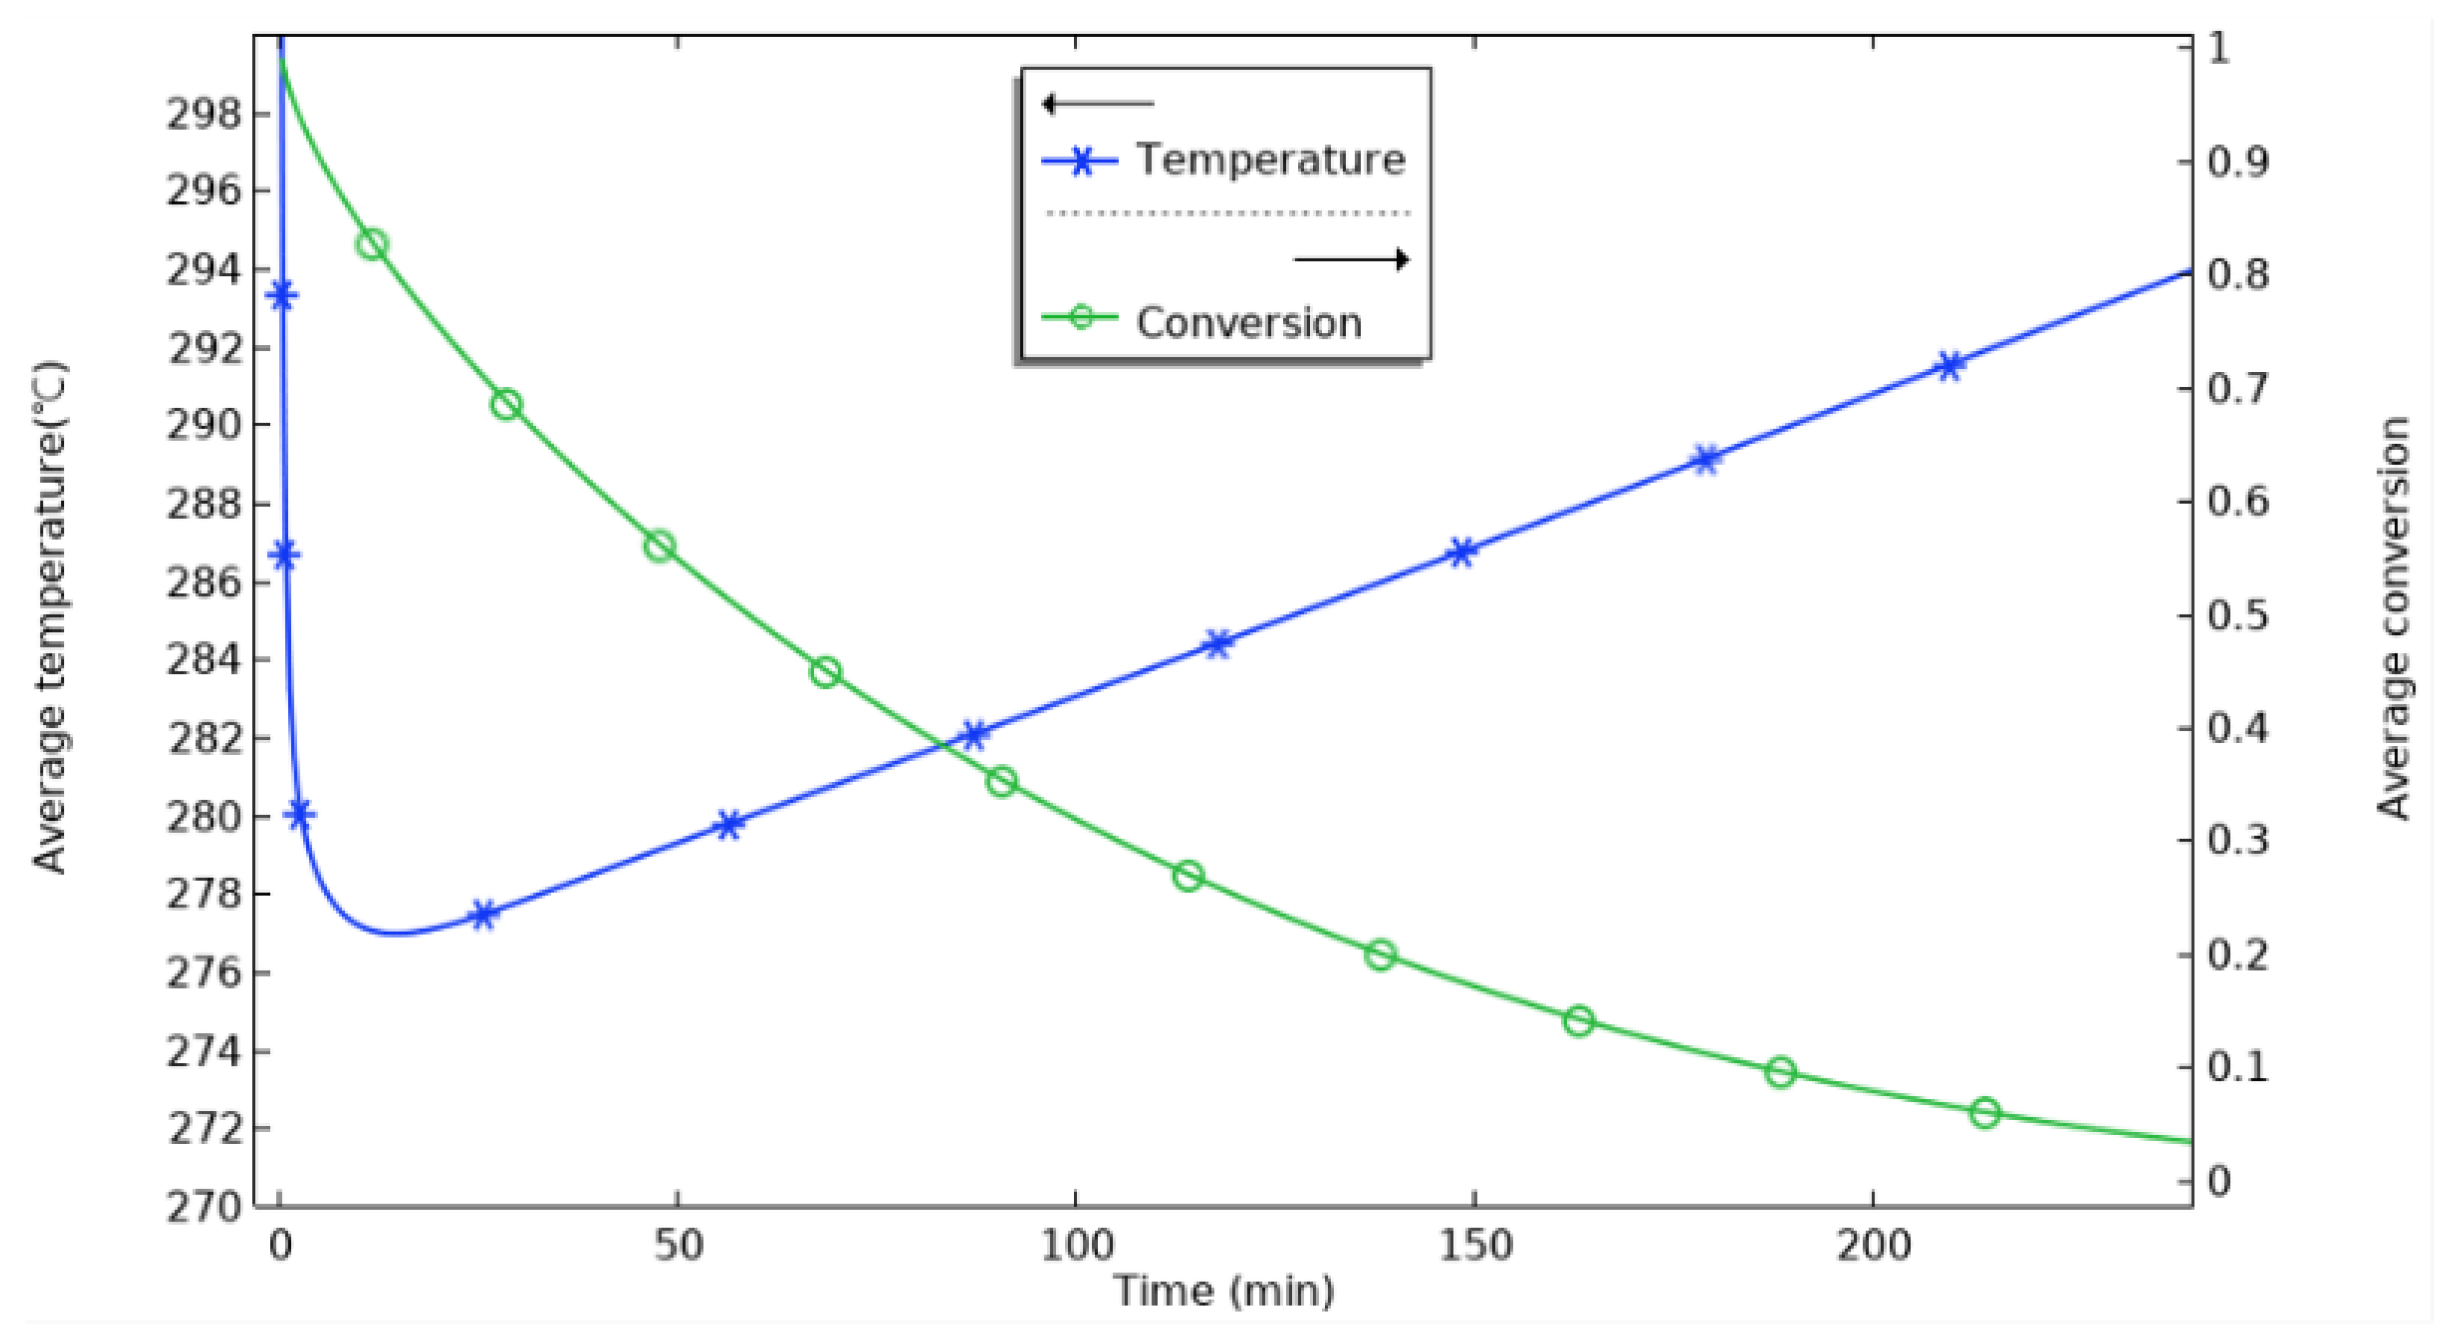
Figure 14 investigates the evolution of the average temperature in the reactor versus the average reaction process with time during the hydrogen release.
During the initial phase of hydrogen release, the average temperature inside the reactor decreases dramatically. This phenomenon is because during the initial phase, the heat transfer inside the reactor is slow, a large amount of heat is absorbed at the beginning of the hydrogen release reaction, and the system fails to replenish enough heat in time, leading to a rapid drop in temperature. Specifically, the temperature dropped to 277 °C at 13.5 min and then gradually recovered to reach 293 °C at the end of the reaction. Observation of the average reaction progress curve reveals that the hydrogen release rate gradually decreased as the reaction progressed. This is mainly due to the gradual completion of the reaction process and the gradual consumption of the hydride material. In the initial stage, the hydrogen desorption reaction rate of the metal hydride is faster because, initially, the hydrogen content of the hydride is higher, and the heat source more strongly drives the reaction rate. However, as the reaction proceeds, the desorption of the hydride gradually slows down because as the hydrogen is released, the amount of hydride in the reactor gradually decreases, and the rate of hydrogen release from the remaining hydride is limited.
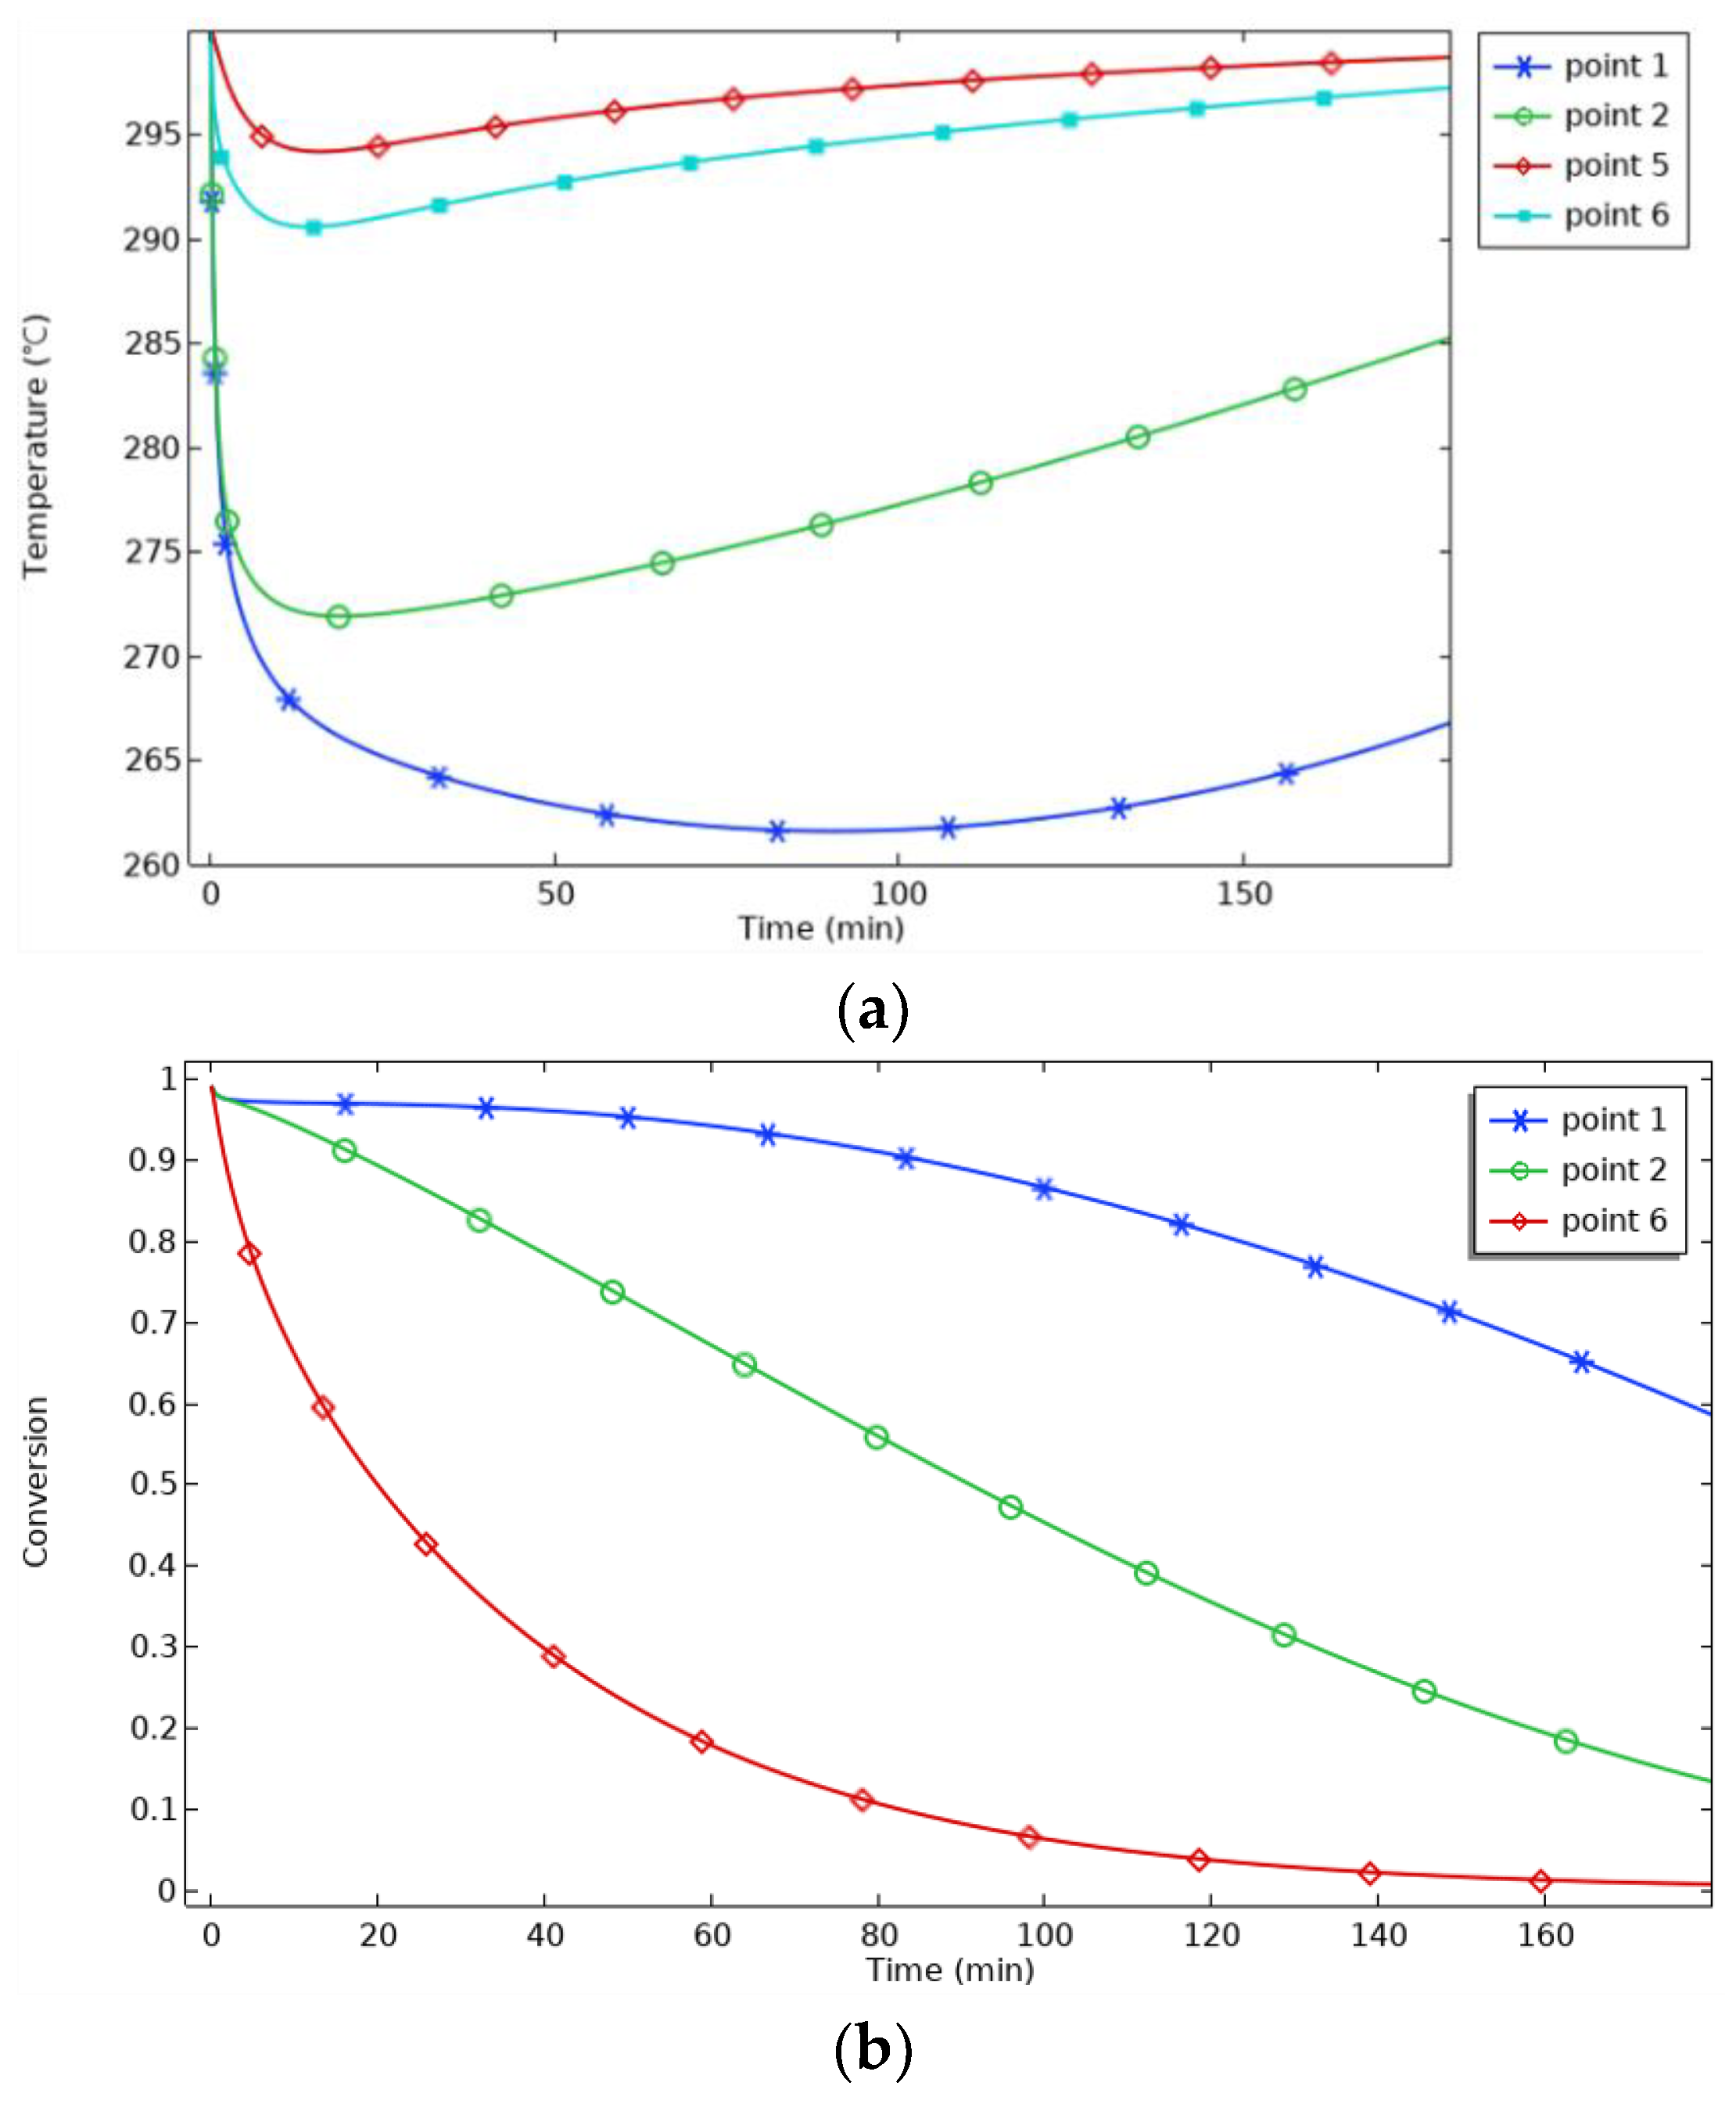
Further observation of the temperature and progress of the reaction at the radial monitoring point is shown in
Figure 15. P5 is located in the outer region of the reactor, where heat is transferred to the metal reaction bed due to the good thermal conductivity of the aluminum shell. Since the transferred heat is lower than the heat absorbed by the hydrogen release process, this area cools down in the initial moments. Afterwards, the temperature rises gradually and remains essentially above 295 °C. The temperature of the reaction bed is then increased to 295 °C, the highest in the world. Due to the high thermal conductivity of the aluminum shell, the temperature in the central area of P1 increases. The temperature is lower in the central area of P1 because it is farther away from the heat source, while P2 and P6 are further and further away from the heat source, so the temperature level gradually increases. Within 13 min of the start of the reaction, the temperature at P6 drops to 290 °C and the temperature at P2 to 272 °C. This is somewhat coupled to the average temperature in the reactor, and the lowest temperature at P2 is only 5 °C different from the average temperature in the reactor, suggesting that the change in the temperature at P2 is essentially representative of the change in the average temperature in the reactor. The temperature at P1 decreased rapidly at the beginning of the reaction and then slowed down after 15 min due to heat transfer. However, there is less heat transfer to the very center. Hence, the temperature at P1 continues to drop at a lower rate until after 95 min, when the temperature begins to rise, and the average progress of the reaction reaches 0.34, compared to 0.06 for P6 and 0.46 for P2. This suggests that the release of hydrogen from the edge region of the metal bed is over and that most of the release of hydrogen from the center region is completed. Because most hydrogen release in the center region is completed, less heat is required in the center region, so more heat is transferred to the center region and hydrogen release begins in the center region.
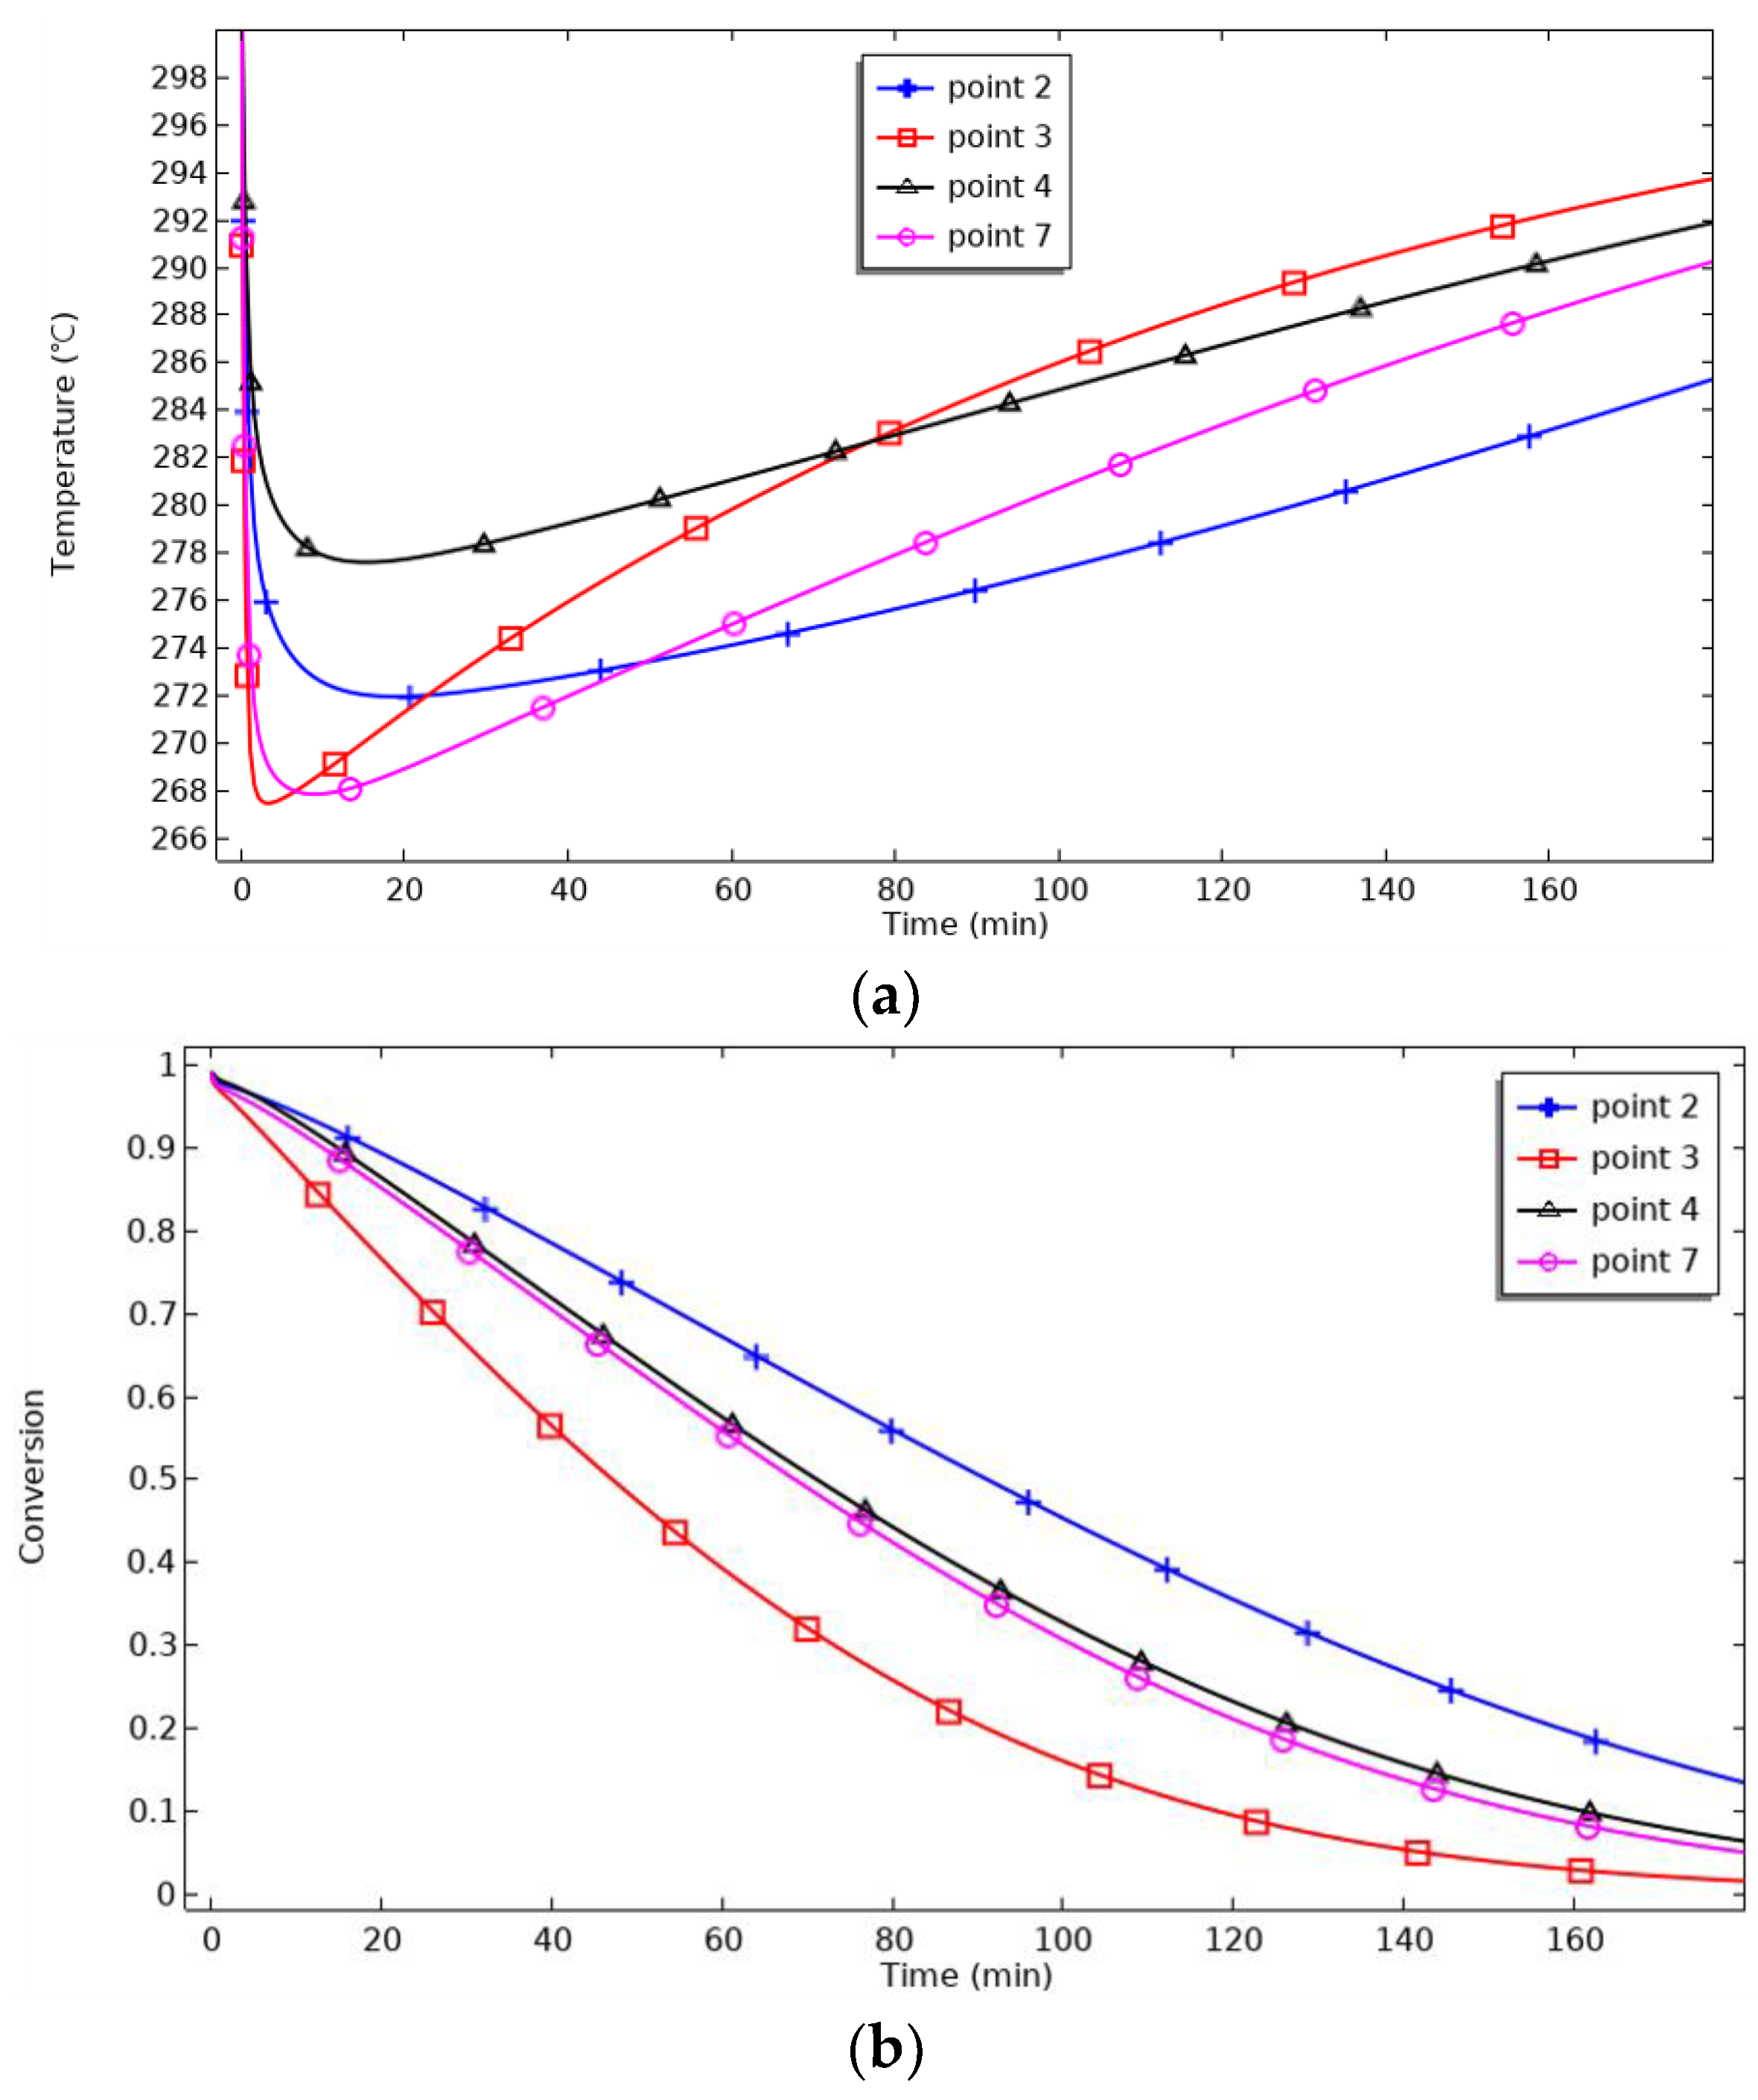
Figure 16 shows the temperature and reaction processes at the axial monitoring points. The trend of temperature change at the axial monitoring points is the same, with a sharp decrease followed by a gradual increase, but it is more complex than the trend at the radial monitoring points. Taking P2 as a reference, the trend of the upper P4 equidistant from P2 is entirely different from that of the lower P3. This is probably because the hydrogen outlet is located below the reaction bed. In the early stage of the reaction, the temperature at P3 rises the fastest, and the conversion rate changes the fastest because P3 is close to the hydrogen outlet. The hydrogen released from the reaction can be transferred quickly, which promotes the hydrogen release reaction. Although P4 is far from the hydrogen outlet and the hydrogen transfer rate is slower than that at P3, P4 is close to the boundary, and the heat transfer effect is better, so the reaction progress is faster than that at P2 and slower than that at P3. P7 is selected between P3 and P2, and the conversion rate at P7 is close to that at P4, but there is a big difference in the trend of the temperature change from that at P4. P7, due to its proximity to the hydrogen outlet, promotes the hydrogen release reaction, but it is limited by heat transfer. To a certain extent, the temperature change of the reaction is not as fast as that at P3. Heat transfer limitation inhibits the hydrogen release reaction to some extent. As a result, at the beginning of the reaction, the temperature decreases faster and is close to P3, but as the reaction proceeds, the temperature increase is not as effective as that at P3. It is worth noting that the lowest temperature of the axial monitoring point shows a trough shift phenomenon.
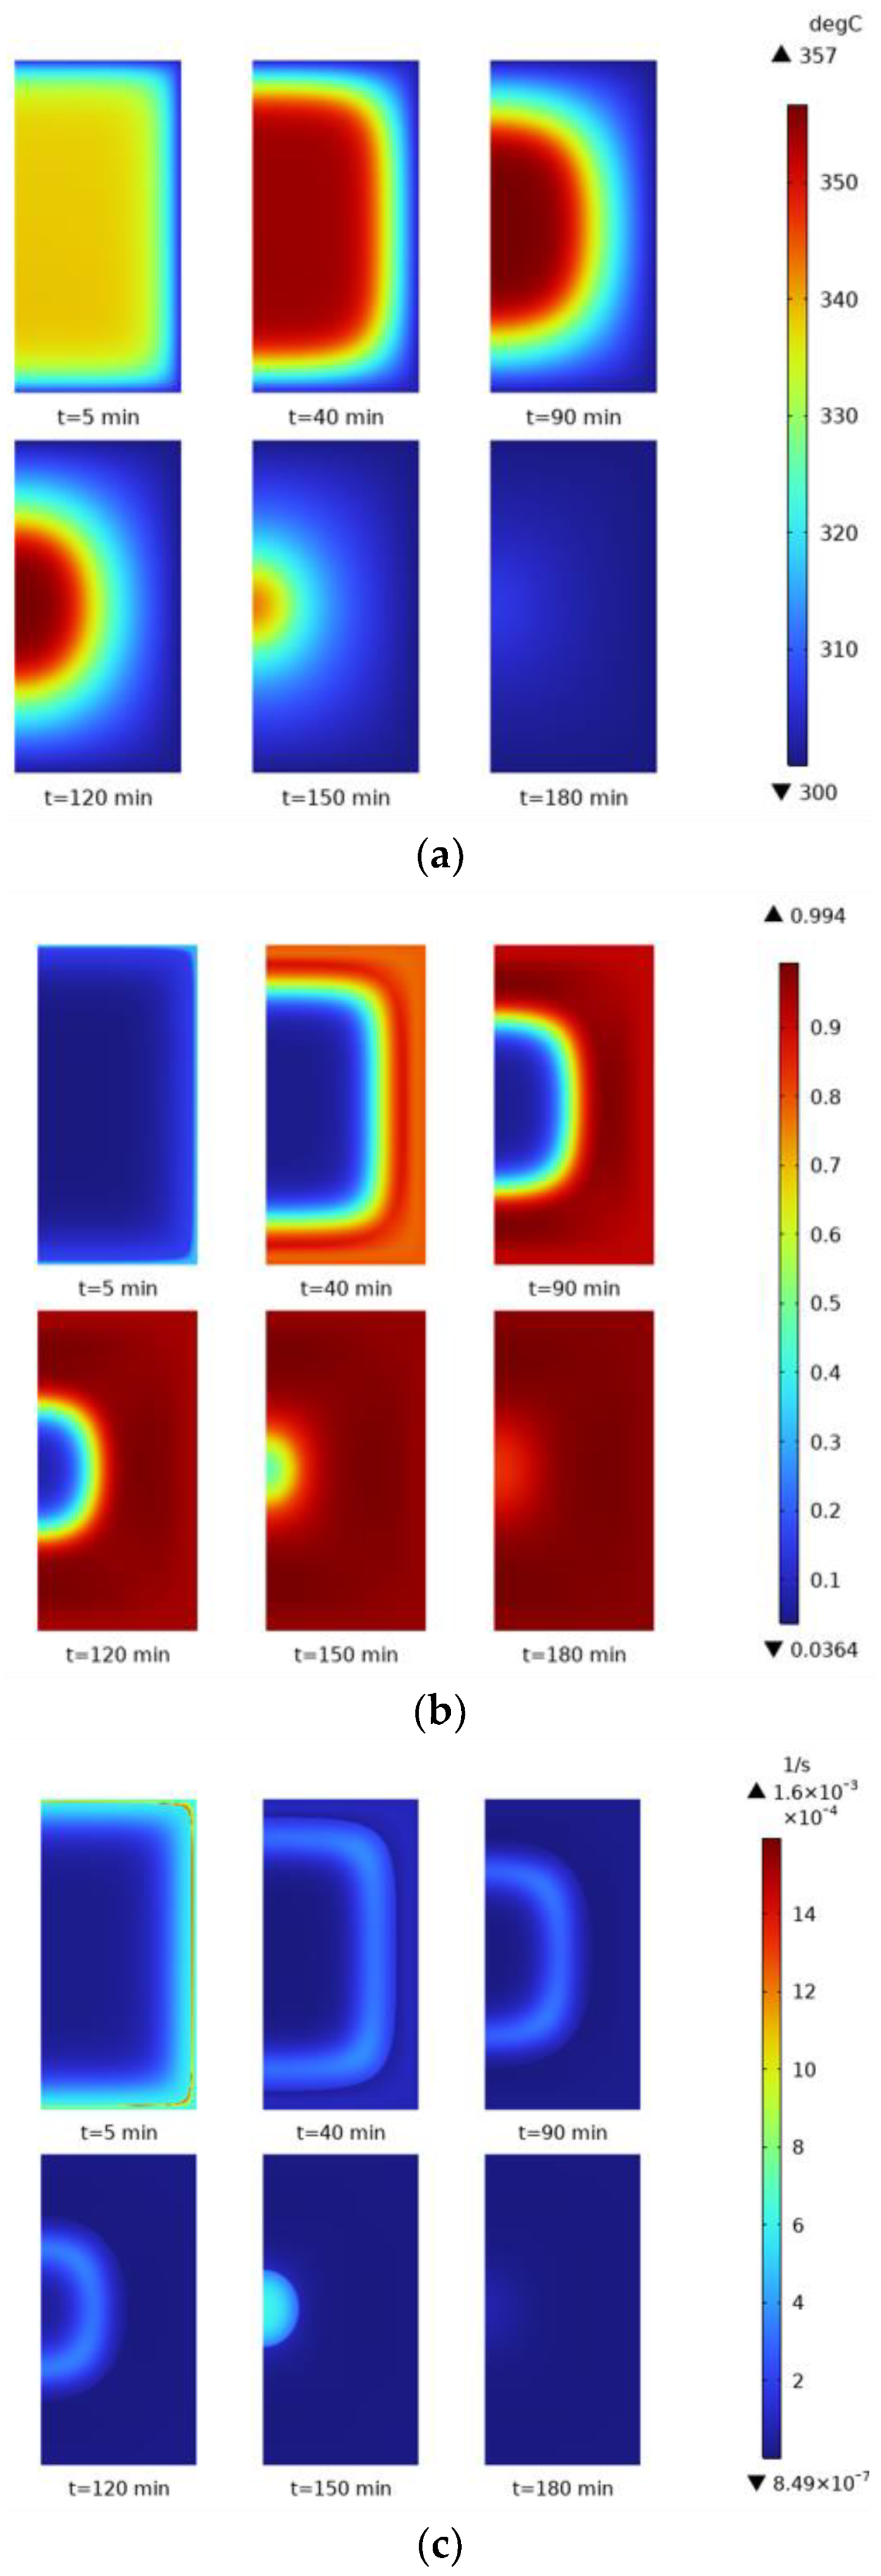
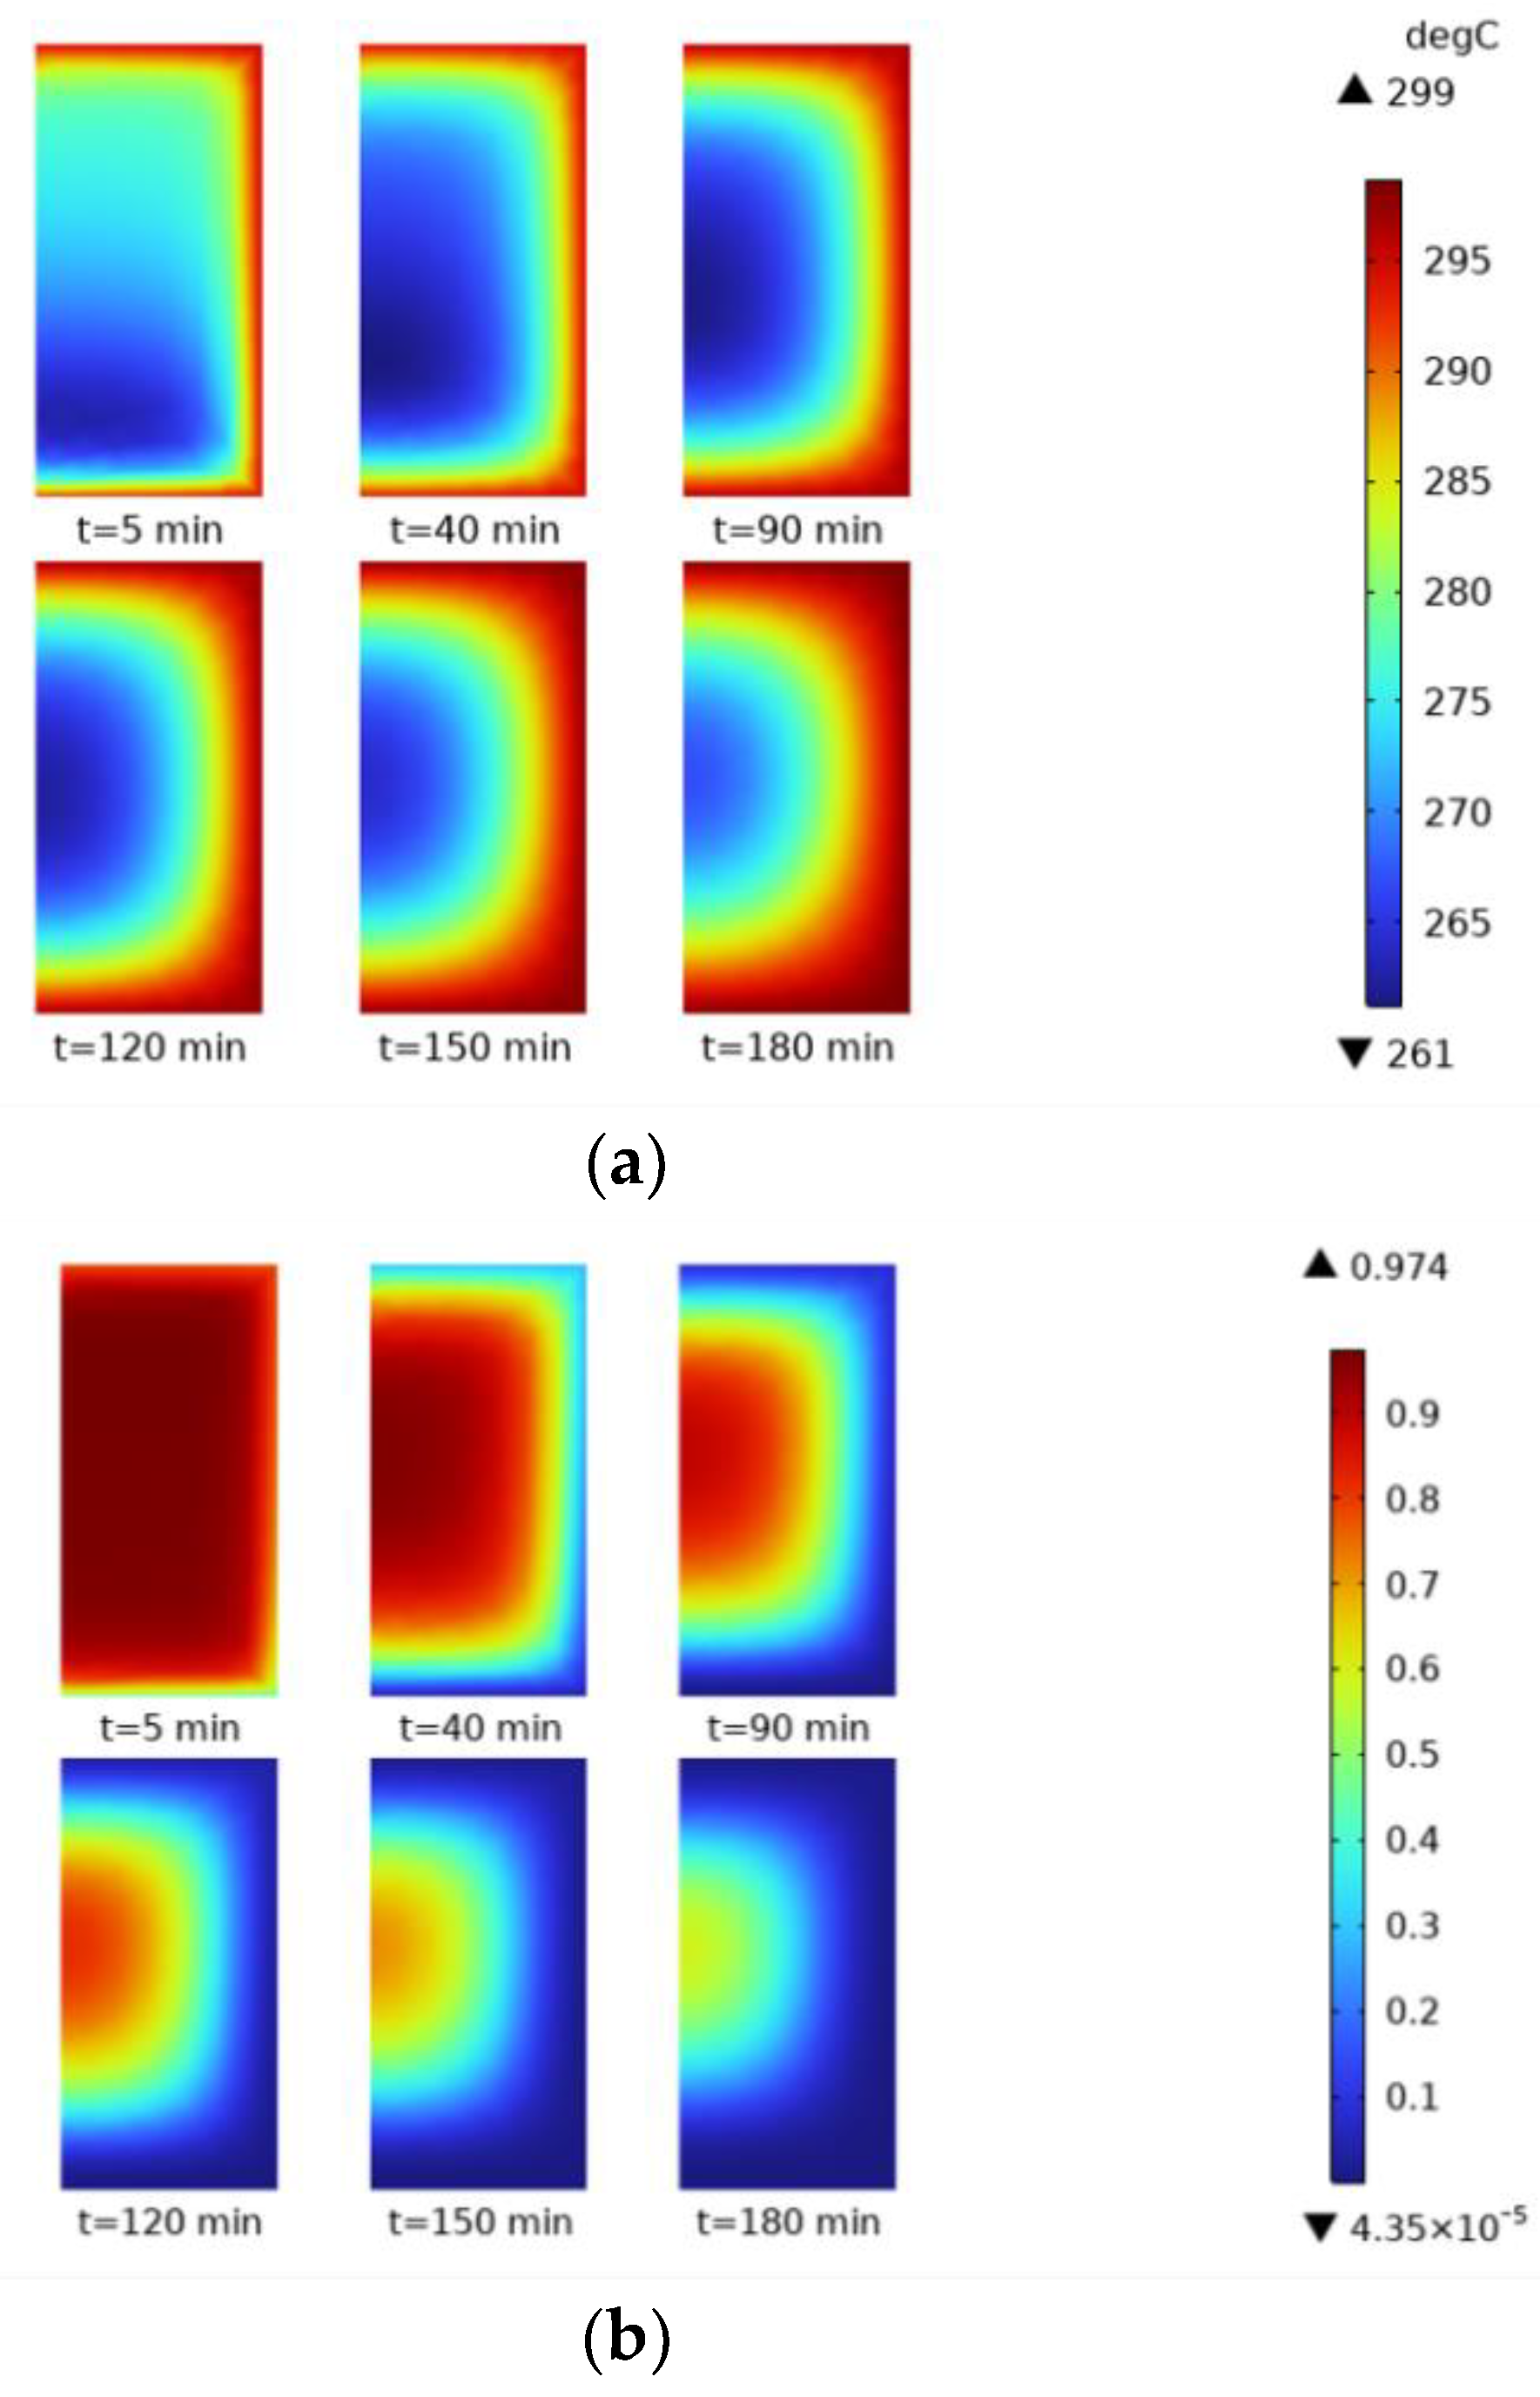
In order to understand more intuitively the distribution and changes in the temperature and reaction process in the whole reactor during the hydrogenation process, 5 min, 40 min, 90 min, 120 min, 150 min, and 180 min were selected as time nodes. Cloud diagrams were plotted under different time nodes, as shown in
Figure 17. Compared with the hydrogenation process, the temperature cloud plot is opposite to the conversion cloud plot.
Figure 17a shows the temperature variation of the dehydrogenation process, while
Figure 17b shows the variation in the conversion rate. At 5 min, the temperature close to the reactor wall was higher, the temperature gradient appeared in a smaller area, and the axial temperature gradient also appeared in a more obvious temperature gradient, which was related to the setting of the hydrogen outlet at the bottom of the reactor. The, 40 min later, the temperature distribution began to change significantly, the reactor formed a pronounced temperature gradient in the reactor, and the axial temperature gradient disappeared. The overall curved surround gradually heated up towards the center, influenced by the hydrogen outlet, between 90 and 120 min. The temperature mainly influences the reaction process, so the overall change form is similar to that of the temperature, and the reaction process gradually tends to zero from the inside to the outside, i.e., the sequence of the hydrogen release process is from the outside to the inside. Taken together, the heat absorption promotes the hydrogen release reaction, and as the hydrogen release process advances, the region where the value of the reaction process is 0 gradually spreads to the center. At this time, the hydrogen release reaction at the edge is completed. From the above analysis, it can be seen that the temperature change and the reaction process in the hydrogen release process are affected by many factors, including heat transfer, the hydrogen outlet’s location, and the reactor’s internal structure. Together, these factors determine the speed and efficiency of the hydrogen release reaction.
4.4. Influence of Initial Conditions
Hydrogen charging pressure is an important factor affecting the hydrogenation reaction. When the charging pressure in the reactor reaches a specific value, the reaction temperature quickly reaches the equilibrium temperature corresponding to that pressure because MgH2 has a high thermodynamic equilibrium response. When the equilibrium temperature is reached, the exothermic reaction corresponding to the hydrogen charging process also reaches equilibrium, the reaction stops macroscopically, and the hydrogen charging process stops. Therefore, the hydrogen charging pressure determines the maximum temperature the exothermic reaction can reach. From the kinetic reaction equation for the metal hydride bed (Equation (16)), it can be seen that at the beginning of the reaction, the initial equilibrium pressure of the metal hydride bed is lower than the hydrogen pressure, and the equilibrium pressure increases with increasing temperature. When the equilibrium pressure is the same as the hydrogen pressure, the reaction rate is 0, and the reaction stops. In order to induce the hydrogen charging process, the equilibrium needs to be broken, and the most effective and direct way to achieve this is through heat transfer, i.e., cooling the metal hydride bed. The higher the charging pressure, the higher the equilibrium temperature that can be reached, the greater the temperature difference from the initial temperature, and the more efficient the heat transfer.
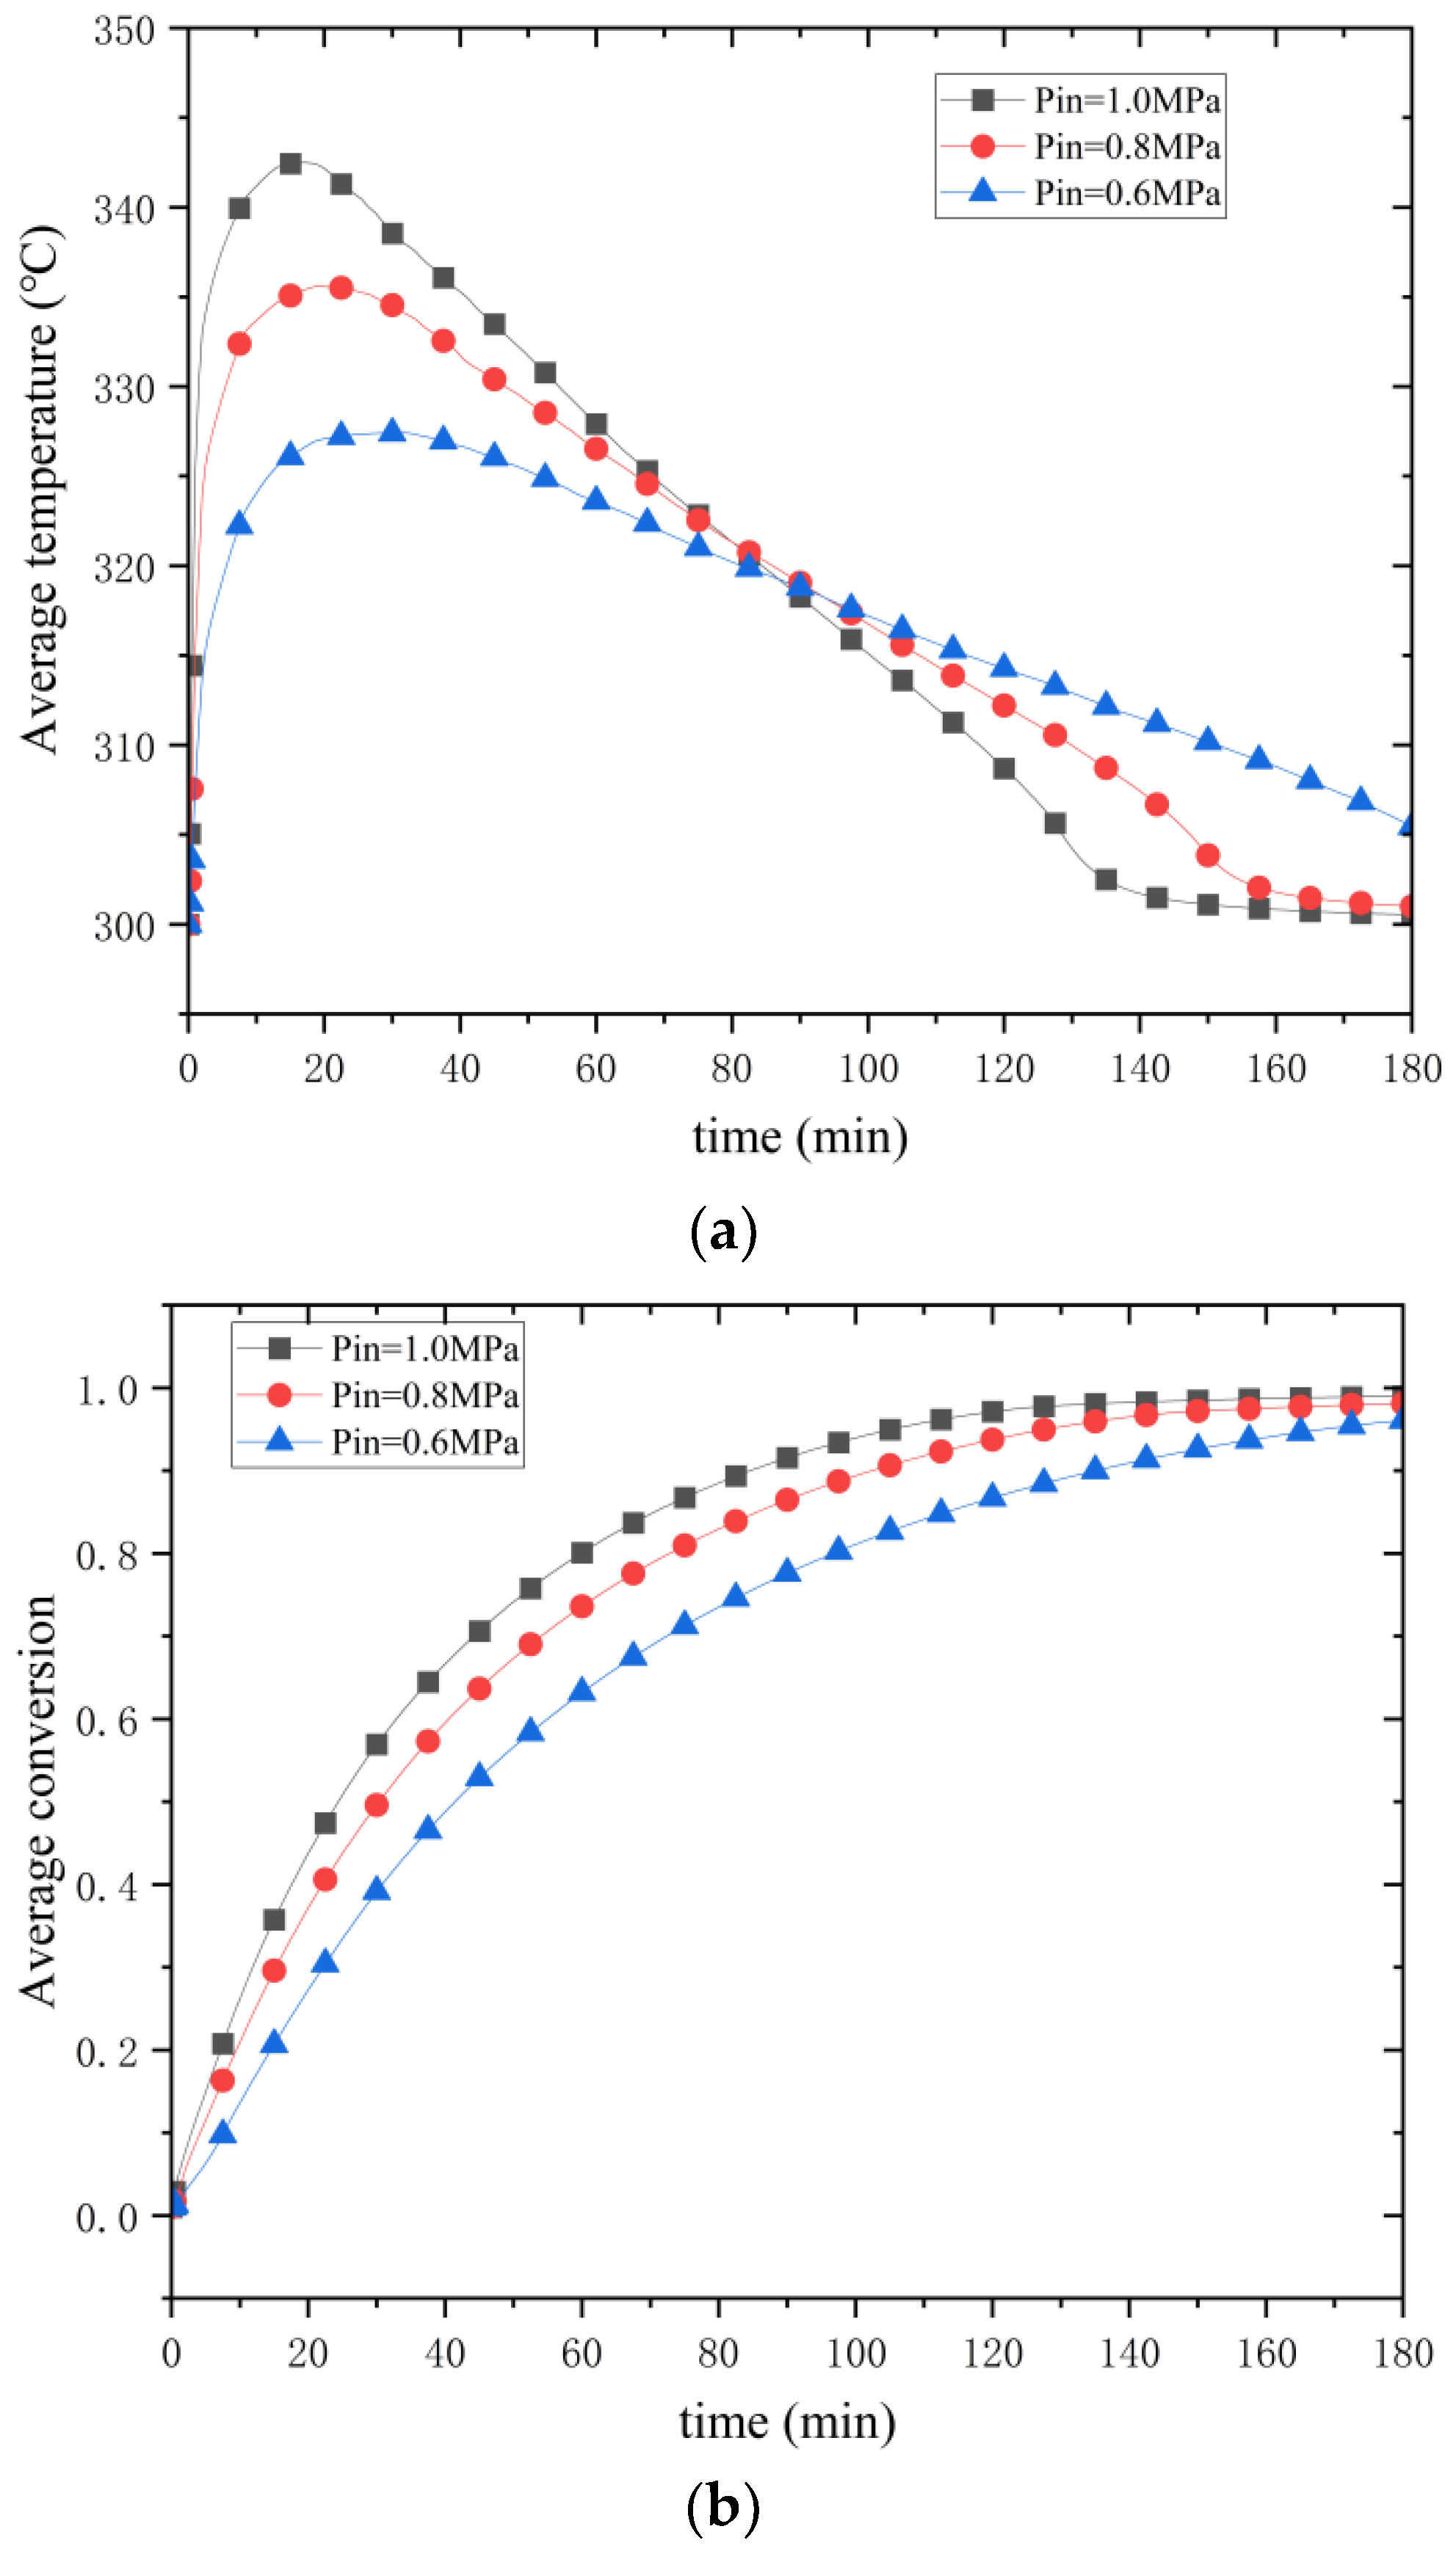
Figure 18 illustrates the effect of hydrogen charging pressure on the hydrogenation process. As can be seen in
Figure 18a, the maximum average temperature is 327 °C for a hydrogen charging pressure of 0.6 MPa, 336 °C for a hydrogen charging pressure of 0.8 MPa, and 342 °C for a hydrogen charging pressure of 1.0 MPa. The increase in average temperature decreases when the pressure increases by 0.2 MPa. At 1.0 MPa, the maximum average bed temperature of 342 °C is reached. The maximum temperature reached by the mean temperature of the reaction bed is increasing, the time of the maximum temperature is getting shorter, and the curvature is getting bigger. At 1.0 MPa, the reaction is over in 134 min; at 0.8 MPa, the reaction lasts 165 min; and at 0.6 MPa, the reaction takes longer. It can be seen that increasing the filling pressure can effectively shorten the filling time, and more hydrogen can be filled in at a given time.
Figure 18b shows the curve of the effect of hydrogen filling pressure change on the conversion rate, and it can be seen that the higher the pressure, the faster the reaction proceeds. However, at higher pressures, the effect of increasing pressure on the increase in reaction progress is also limited. Thus, increasing the hydrogen loading pressure is a means of increasing the progress of the reaction, but it is not without limitations.
Thermodynamically, according to the Van’t Hoff equation, the pressure increase from 0.6 MPa to 1.0 MPa increases the equilibrium temperature nonlinearly. At higher pressures, the increased collision frequency of hydrogen molecules induces more energy to overcome the activation energy instead of being converted into a temperature increase, resulting in a gradual decrease in the increase in the equilibrium temperature with the increase in pressure. Kinetically, at low pressure (0.6 MPa), the reaction rate is slower, and thermal diffusion dominates the temperature distribution with a gentle curve slope. At high pressure (1.0 MPa), the initial driving force is increased by about 67%. The rate of heat production at the beginning of the reaction is much higher than the rate of thermal diffusion, resulting in a steep temperature profile. When the equilibrium temperature is reached in the center region, the heat dissipation is gradually dominated, and the slope of the profile tends to slow down. Under high pressure, a more significant thermal plateau is formed in the center region, and the temperature in the edge region falls back rapidly due to the efficient heat dissipation from the aluminum shell, exacerbating the nonlinear characteristics of the curve. It is worth noting that elevated pressure directly enhances the collision frequency and accelerates the surface adsorption and chemical bond formation, but too high pressure may lead to the expansion of MgH2 particles and a decrease in porosity, which hinders hydrogen diffusion, resulting in the late reaction rate being limited by internal diffusion rather than pressure-driven force.
Before the hydrogenation process, a furnace heated the metal hydride bed to a specific temperature, i.e., the initial temperature. The initial temperatures were 260 °C, 280 °C, and 300 °C.
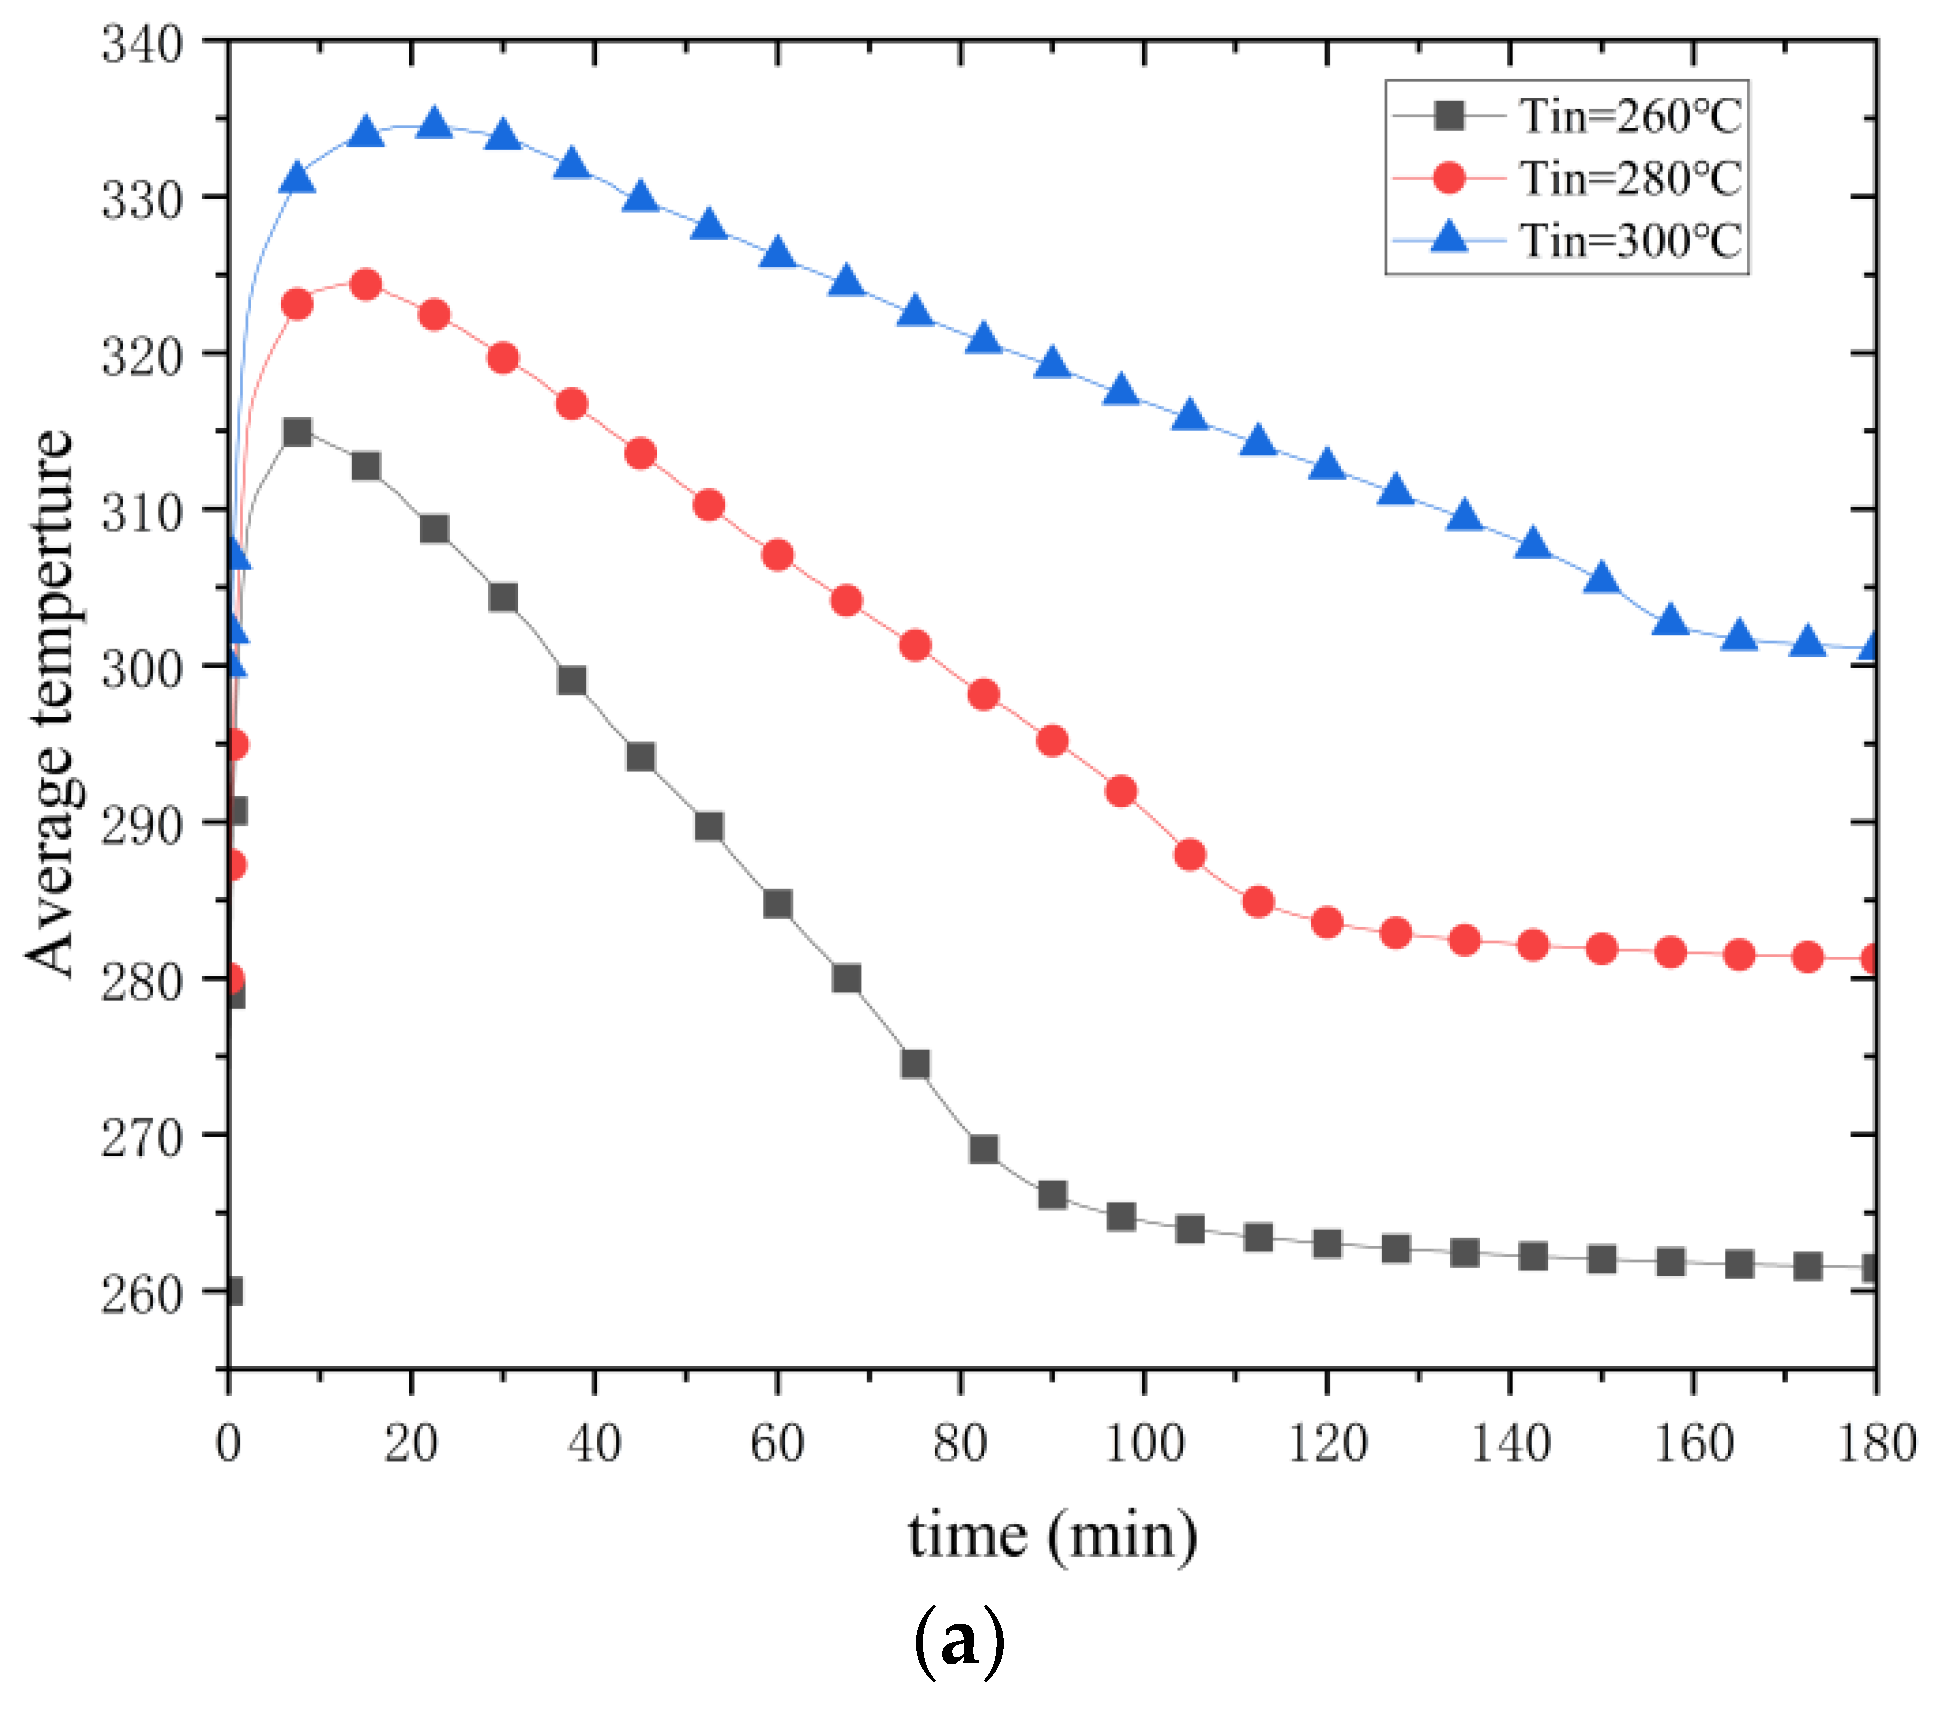
Figure 19 shows the variations in the average temperature and the average reaction process in the metal hydride bed for different initial temperatures. At a hydrogen charging pressure of 0.8 MPa, the corresponding equilibrium temperature is about 350 °C according to the Van’t Hoff equation. As the initial temperature decreases from 300 °C to 260 °C, the maximum value that can be reached for the average temperature in the reactor decreases. This does not mean the maximum temperature reached in the reactor bed is also reduced. Temperature monitoring was performed for P1. As shown in
Figure 19a, the initial temperature does not affect the maximum temperature reached within the metal hydride bed. However, the temperature plateau at P1 is shortened by a decrease in the initial temperature. The decrease in the maximum value of the average temperature is due to an increase in the temperature difference between the equilibrium temperature and the initial temperature, which enhances heat transfer and cooling so that the entire high-temperature region of the reactor can be cooled more quickly, which in turn affects the maximum value of the average temperature. As the reaction progresses, when the temperature in the reactor falls back to the initial temperature, the hydrogen loading process is essentially over. At an initial temperature of 300 °C, it takes 178 min to fall back to the initial temperature. At an initial temperature of 280 °C, it takes 142 min to fall back to the initial temperature. At an initial temperature of 280 °C, it takes 142 min to return to the initial temperature, and at an initial temperature of 260 °C, it takes 105 min. This shows that lowering the initial temperature reduces the time required for the hydrogen loading process.
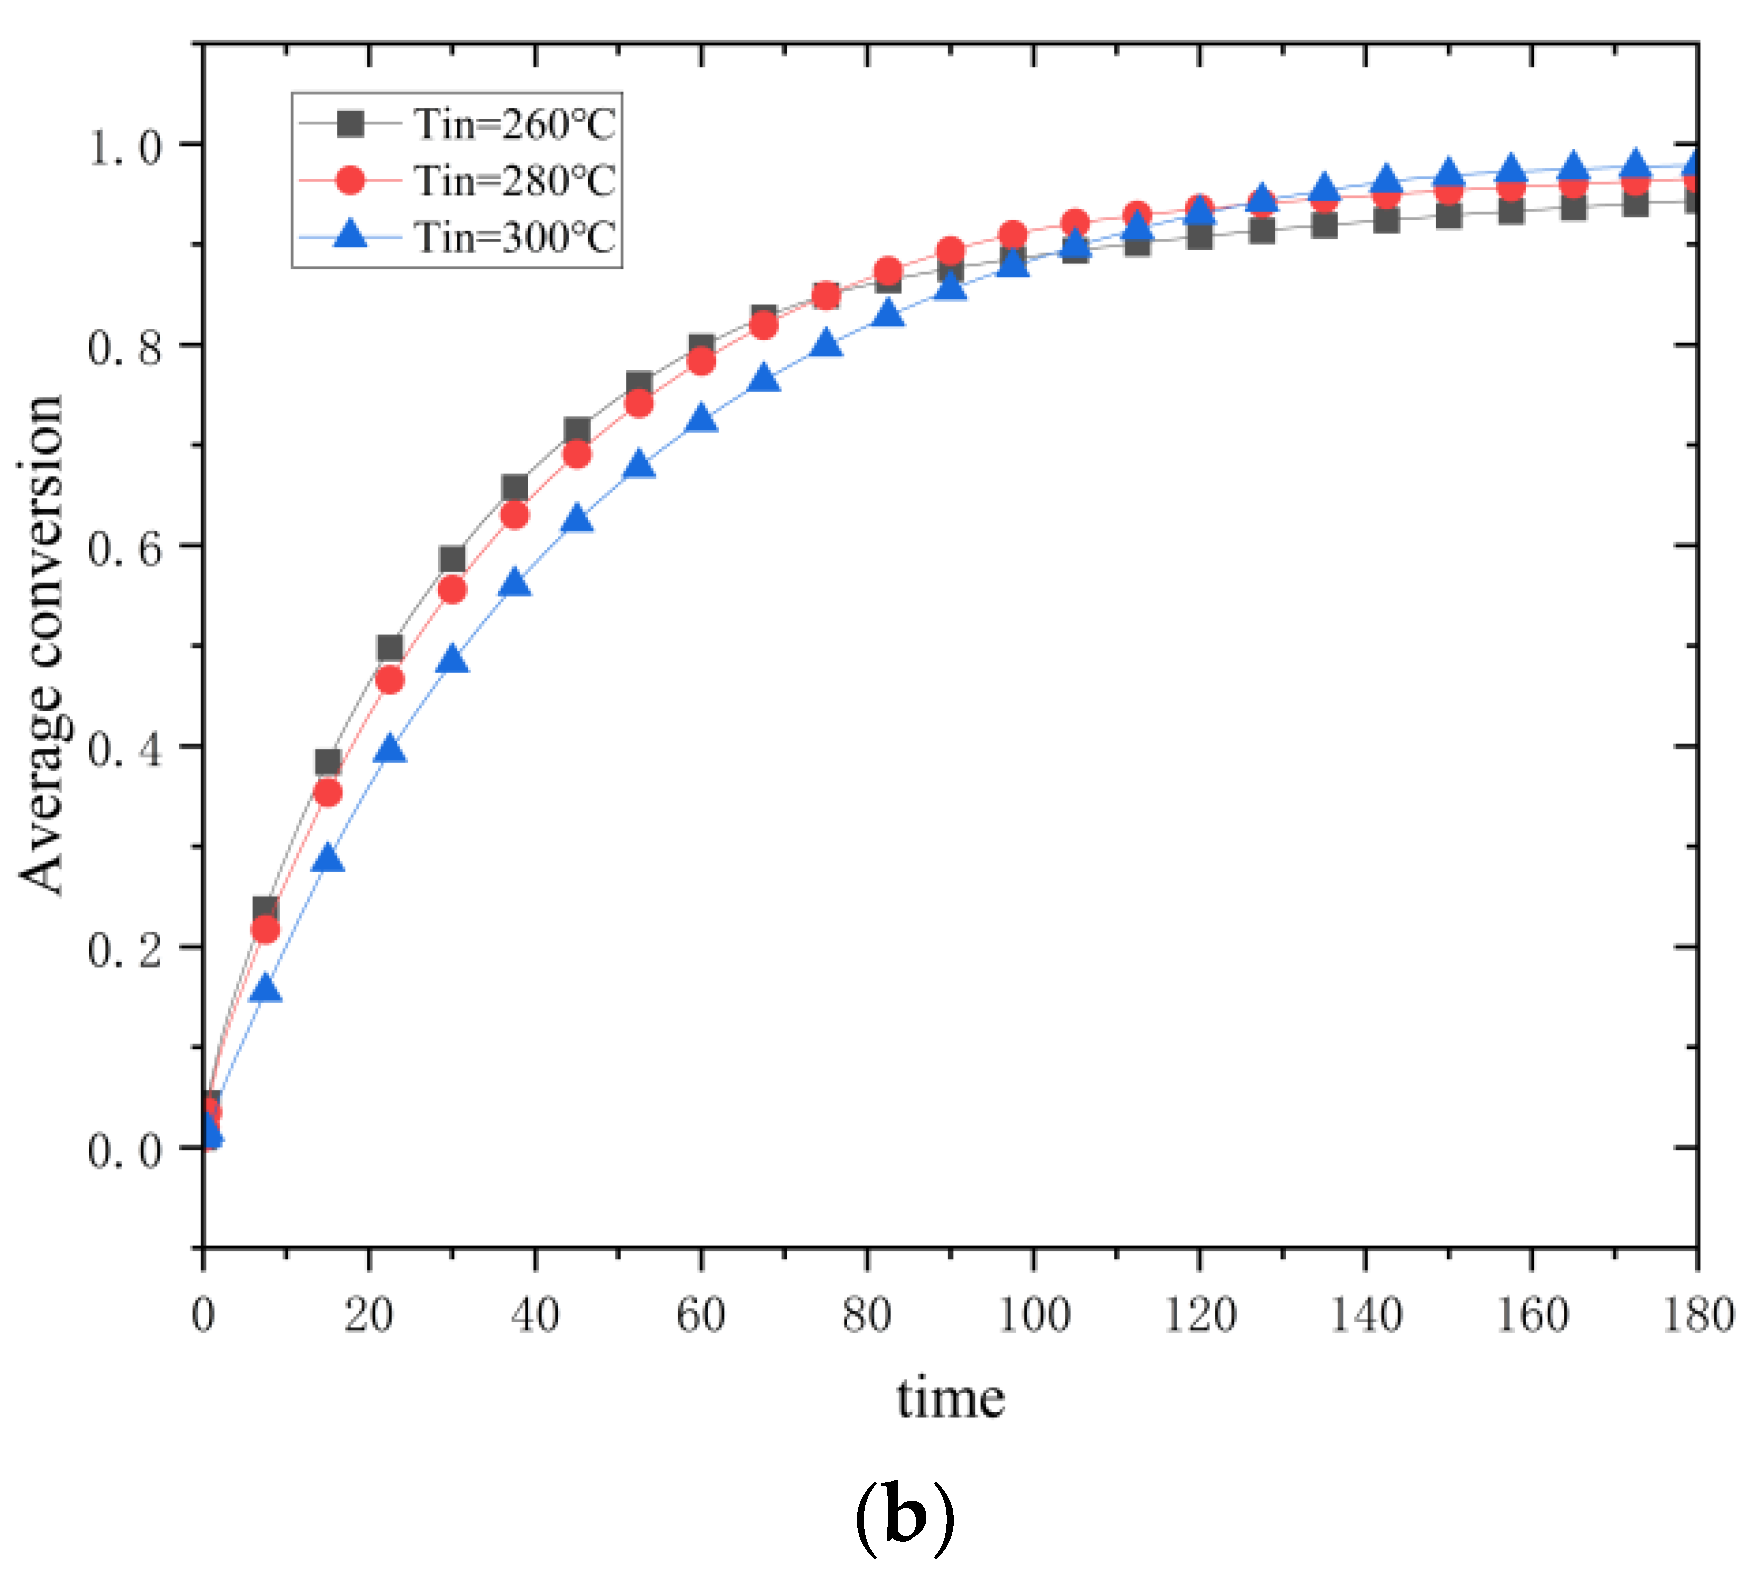
Figure 19b shows the change in conversion rate, and it can be noticed that the reaction process speeds up, and the reaction rate increases as the initial temperature is lowered. However, lowering the initial temperature from 300 °C to 280 °C decreases the increase in reaction rate as compared to lowering it from 280 °C to 260 °C. Therefore, lowering the initial temperature also helps to optimize the hydrogen loading process, but lowering the temperature to a specific value and then continuing to lower the temperature has little effect on increasing the reaction rate.
The reduction of the initial temperature significantly impacts the reaction process through the synergistic effect of thermodynamics and kinetics. Fourier’s law shows that the widening temperature difference between the system and the environment enhances the thermal conduction drive. It increases the heat dissipation efficiency by 41% (cooling time from 178 to 105 min), which leads to the rapid export of reaction heat and shortens the high-temperature plateau period. Despite the increase in apparent activation energy by the low temperature, the enhanced thermal gradient instead promotes hydrogen diffusion, resulting in the peak reaction rate occurring 20 min earlier and a 15% increase in the average rate, suggesting that the promotion of kinetics by heat transfer outweighs the suppression of activation energy by the cooling down. The initial temperature reduction caused the temperature in the edge region of the reactor to drop closer to ambient temperature more quickly, resulting in a significant radial thermal gradient. The gradient drives the reaction interface from the edge to the center, similar to a “heat wave” propagation, with the edge region completing the reaction first due to rapid heat dissipation and the center region lagging due to heat accumulation. Under low-temperature conditions, the exothermic heat at the beginning of the reaction is rapidly exported by the high thermal conductivity gradient, thus avoiding the reaction rate decay due to overheating in the center region. This “heat dissipation while reacting” mode maintains a continuous pressure difference, keeping the reaction rate high at low temperatures. Conversely, the mid-term rate slowdown is caused by diffusion limitation and activation energy effects, which highlights the nonlinear coupling of thermodynamics and kinetics. The strong radial thermal gradient drives the reaction interface from the edge to the center as a “heat wave”—the edge region is the first to complete the reaction due to rapid heat dissipation. In contrast, the center region lags due to heat accumulation. This “heat dissipation while reacting” mode avoids rate decay due to overheating in the center and keeps the overall reaction rate high by maintaining a constant pressure difference. Notably, the rate decline in the middle and late stages of the reaction results from diffusion limitation and competing activation energy effects. The current model does not consider the thermal conductivity changes caused by the low-temperature phase transition (MgH2) and the interfacial hindrance of the magnesium oxide impurity layer, which may lead to a deviation of the actual working conditions from the theoretical predictions.
4.5. Engineering Practical Applications
Magnesium hydride serves as an effective hydrogen storage medium with significant potential applications, and McPhy Energy has commercialized the ball mill production process. Future advancements in larger reactors must prioritize the improvement of thermal management, namely, through the creation of integrated thermal storage devices to effectively harness the precious heat generated during the absorption of magnesium hydride. To improve the applicability of this research in actual engineering, the effects of reactor structural characteristics (such as wall thickness), material qualities, and control systems on hydrogen storage performance are particularly significant. The mechanism of performance evolution in materials and systems after prolonged recycling should be investigated.
The thickness of the reactor wall influences the heat transfer efficiency and structural integrity of the hydrogen storage system. From the perspective of heat transfer, an increase in wall thickness markedly diminishes heat transfer efficiency. Fourier’s law states that the heat flow density is reduced by half as the wall thickness increases from 5 mm to 10 mm, leading to a corresponding reduction in the heat flow density of the aluminum shell at a temperature differential of 300 °C. The thermal reaction time constant of the hydrogen storage system escalates with temperature. The thermal response time constant exhibits a square relationship with wall thickness; thus, when wall thickness is doubled, the thermal response time increases by a factor of four. For instance, a 5 mm aluminum shell has a response time of 100 s, which extends to 400 s at 10 mm thickness, leading to considerable temperature response hysteresis. Thick walls further intensify the radial temperature gradient, resulting in a smaller temperature differential between the edge and the center at a 5 mm wall thickness compared to 10 mm. This phenomenon increases response inhomogeneity, evident in the reaction completing at the edge of the center with a lower conversion rate. Moreover, augmented wall thickness reduces the effective hydrogen storage capacity, which diminishes by 9.5% when the wall thickness of the 100 mm OD reactor is elevated from 5 mm to 10 mm. The wall thickness directly influences the pressure-bearing capability in mechanical design. The aluminum shell, with a wall thickness of 5 mm, can withstand a pressure of 10 MPa at 300 °C, satisfying the safety criterion of a 1.0 MPa operating condition. However, as the temperature escalates to 350 °C, the tank, due to thermal expansion and contraction resulting from a rapid increase, may approach the aluminum’s bearing limit. A significant concern is that the MgH
2 phase transition will undergo expansion and contraction, generating mechanical loads that induce radial stresses potentially exceeding the aluminum shell’s capacity. To address this issue, engineers incorporated a layer of “cushioning pads” within the tank’s inner wall, specifically a porous flexible liner. Another factor to consider is fatigue damage to the tank material; routine inspections of stress-prone locations can enhance operational safety. The engineering implementation of the control method mostly relies on thermal management technology. This article’s background section succinctly outlines current research initiatives in thermal management, highlighting the coupled thermal storage system as a promising approach. This includes the hydrochloric acid thermal storage system, metal hydroxide thermal storage system, metal oxide thermal storage system, and phase change material (PCM) thermal storage system. These thermal storage technologies are thermochemical, which offer the benefits of high thermal density and minimal energy loss [
42]. Li et al. [
43] examined the impact of incorporating Y
2O
3 as a metallic framework into CaO, revealing that the composites could sustain a high thermal density of up to 1956 kJ/kg after 100 cycles with an Y
2O
3 content of 35 wt%. The team additionally pelletized the composites. Despite the granulation process compromising a portion of the material’s structure and diminishing thermal storage efficacy, the mechanical strength of the material was markedly enhanced. Experiments demonstrated that the pelletized material experienced a mass loss of merely 4.28 wt% after 7000 rotations in a brittleness tester.
This paper presents a model that effectively characterizes the thermal phenomena and temperature variation patterns of the magnesium hydride hydrogen storage system during hydrogen absorption and discharge, with its innovation evident in the integrated analysis of thermodynamic equilibrium and kinetic processes. To accurately simulate the system’s performance evolution over extended use, influenced by material degradation and structural fatigue, the current model, with simplistic assumptions and static parameters, is inadequate. It is essential to incorporate a time-dependent physical mechanism and develop a multi-field coupled model. Future research must focus on creating new models that concurrently consider the following critical factors: the decline in reactivity with the number of cycles, resulting in a progressive rise in activation energy and a steady reduction in the frequency factor; the deterioration of the material’s thermophysical properties, such as the decrease in thermal conductivity due to reduced porosity; and the cumulative impact of structural stresses caused by volume expansion. The simulation of these dynamic changes enables a more precise forecast of the system’s performance evolution. This paper presents a foundational paradigm for thermodynamic and kinetic analysis for future research. Subsequent study must integrate novel physical models, including material degradation mechanisms and multiphysics field dynamic coupling, into the current system to furnish more comprehensive theoretical support for the optimal design and life evaluation of hydrogen storage reactors.


