Article

A Multi-Objective Optimization Approach for Generating Energy from Palm Oil Wastes

by
Hendri Cahya Aprilianto
1,2 and
Hsin Rau
1,*
1
Department of Industrial and Systems Engineering, Chung Yuan Christian University, Taoyuan City 32023, Taiwan
2
Department of Agroindustrial Technology, Faculty of Agricultural Technology, Universitas Brawijaya, Malang 64145, Indonesia
*
Author to whom correspondence should be addressed.
Energies 2025, 18(11), 2947; https://doi.org/10.3390/en18112947
Submission received: 26 April 2025 / Revised: 26 May 2025 / Accepted: 30 May 2025 / Published: 3 June 2025
(This article belongs to the Section A4: Bio-Energy)

Abstract

:
Palm oil production generates substantial underutilized biomass wastes, including empty fruit bunches, fiber, palm kernel shells, and palm oil mill effluent (POME). Waste-to-energy systems offer a viable pathway to convert these residues into electricity and fertilizer, supporting circular economy goals and sustainability targets. This study takes an example of palm oil waste from the Indragiri Hulu region in Riau Province in Indonesia. It develops a multi-objective optimization framework to evaluate palm oil mill WtE systems from economic, environmental, and energy output. Three scenarios are analyzed: maximal profit (MP), maximal profit with carbon tax (MPCT), and all waste processing (AWP). The MP scenario favors high-return technologies such as gasification and incineration, leading to significant greenhouse gas emissions. The MPCT scenario favors lower-emission technologies like composting and excludes high-emission, low-profit options such as POME digestion. In contrast, the AWP scenario mandates the processing of all wastes, leading to the lowest profits and the highest emissions among all scenarios. The sensitivity analysis reveals that POME processing is not feasible when electricity prices are below the government-set rate, but becomes viable once prices exceed this threshold. These findings offer valuable insights for companies and policymakers seeking to develop and implement effective strategies for optimal waste utilization.

1. Introduction

The palm oil industry (POI) is crucial to Indonesia’s economy, accounting for around 57% of the global palm oil market. As demand escalates, driven by applications from food production to biofuel, the volume of related waste increases [1]. Palm oil in Indonesia serves critical functions across food, oleochemical, and bioenergy sectors, particularly within the national B40 biodiesel program. Recent estimates indicate that around 34 million tons of solid and liquid waste are produced annually, comprising empty fruit bunches (EFB), fiber, palm kernel shell (PKS), and palm oil mill effluent (POME). This significant waste stream raises environmental issues and offers enormous sustainable resource recovery opportunities. Even though the sector is important for the economy, a lot of its waste is not used well, causing more pollution and greenhouse gas (GHG) emissions. Traditional waste disposal methods, such as open burning and landfilling, intensify pollution and risk to local biodiversity [2]. Thus, transforming palm oil waste into valuable products such as electricity and fertilizers has become crucial for environmental sustainability and economic viability. Inadequate waste management generates negative economic impacts by contaminating air and soil resources, disrupting agricultural productivity, and increasing healthcare and water purification costs in surrounding communities. Environmentally, improper disposal contributes to ecosystem deterioration, GHG emissions, and accelerated deforestation. In addition, without sustainable management frameworks, these waste streams risk intensifying climate instability and biodiversity loss within Indonesia’s sensitive tropical ecosystems. Addressing these challenges requires adopting sustainable waste-to-energy (WtE) strategies that simultaneously reduce emissions and support resource recovery.
Several technological pathways offer promising solutions for converting palm oil waste into valuable products. Anaerobic digestion (AD) is particularly suitable for treating liquid waste such as POME, enabling biogas generation for electricity and heat [3]. Meanwhile, solid residues like EFB, fiber, and PKS can be processed through combustion or co-firing in combined heat and power (CHP) systems to produce steam and electricity. Composting is another viable approach, especially for EFB and fiber, yielding organic fertilizer as a substitute for synthetic alternatives. These technologies offer multiple economic and social benefits. Palm oil mills can reduce operational costs by utilizing generated energy for internal use and potentially selling excess electricity to the national grid [4,5]. Producing fertilizer from waste into by-products reduces production expenses and enhances soil fertility [6]. At the societal level, localized energy generation supports regional development, particularly in underserved areas with limited grid access. It also creates employment opportunities along the waste processing value chain. Furthermore, integrated waste valorization reduces GHG emissions and environmental pollution, aligning the palm oil sector with broader sustainability goals.
Budianta and Gozan [7] emphasize that only approximately 10% of the solid waste generated in the palm oil industry, predominantly PKS, is utilized as boiler fuel or fertilizer, leaving a considerable proportion untapped. This observation resonates with the zero-waste paradigm advanced by Januari and Agustina [8], which advocates for transforming EFB into value-added products such as organic soil amendments and renewable energy sources. Although EFB reduces the overall waste burden, its application introduces complications, including risks of soil contamination and pest proliferation, thereby highlighting the complexities in optimizing biomass conversion processes [8]. The challenge of balancing environmental mitigation with economic viability is further addressed by Umar et al. [9], who propose a policy framework to harmonize production practices across the palm oil supply chain. Their framework underscores the importance of integrated approaches that support sustainable biomass-based energy production, aligning environmental objectives with economic imperatives. In parallel, advancements in optimization models offer promising opportunities to enhance resource utilization. For instance, Nair et al. [10] introduce a mixed-integer linear programming (MILP) model designed to optimize electricity generation from biomass while satisfying technical and economic constraints across multiple power plants. Such methodological rigor complements broader efforts to promote waste-to-energy solutions, including the AD of POME for biogas production. However, the economic feasibility of these technologies remains a critical concern. Empirical evidence from research by Irawan et al. [11] indicates that biogas initiatives often require substantial capital investment and may yield low profitability, limiting their large-scale adoption. Ultimately, the intersection of technological innovation, policy integration, and sustainable practice is pivotal in steering the palm oil industry toward a circular economy that valorizes waste streams into energy and by-products and minimizes the sector’s environmental footprint [12,13].
In response to these circumstances, this study proposes a multi-objective optimization approach to optimize WtE pathways from palm oil wastes by balancing energy output, emissions, and economic viability. This method offers practical measures to improve resource efficiency and profitability while preserving ecological integrity by systematically evaluating trade-offs between energy output, carbon emissions, and economic performance. Riau Province, the largest palm oil-producing region in Indonesia, is employed as a case study. Due to its high residue availability, Indragiri Hulu Regency is an in-depth case study. The contribution of this study is the development of an integrated multi-objective optimization framework that simultaneously addresses economic profitability, greenhouse gas emissions, and energy recovery while incorporating all major waste types to provide a holistic and realistic solution for palm oil industry waste management. Additionally, by conducting a scenario-based analysis aligned with government regulations covering (MP), (MPCT), and (AWP) scenarios, this study generates comprehensive and policy-relevant insights to support sustainable decision-making. These contributions advance the theoretical discourse and provide actionable insights for policymakers, industry stakeholders, and researchers committed to fostering sustainability.
The structure of this article is as follows: Section 2 presents a literature review relevant to WtE in the POI. Section 3 outlines the methodology. Section 4 and Section 5 present the results and discussion, respectively. Section 6 provides the conclusions. Acronyms are defined in the Abbreviations section.

2. Literature Review

2.1. Palm Oil Production

The palm oil industry is a key sector in Indonesia, generating USD 25.61 billion in exports and employing around 16.2 million people. In 2021, Indonesia produced 44.5 million tons of palm oil from 14.59 million hectares of plantations [14]. While economically vital, the industry also generates significant solid and liquid waste, contributing to environmental pollution [15,16]. Despite initiatives like the B35 biodiesel mandate, waste utilization remains limited, with only about 25% of processed palm fruit converted to oil and the rest treated as waste [9,17,18,19]. Circular economy (CE) practices in the palm oil industry focus on reducing waste and maximizing resource use, such as turning biomass into energy and biofuels [4,20,21]. Initiatives like eco-industrial parks support industrial symbiosis, while innovations like POME to biofuel show progress toward circularity [19,22].
The CE concept in the POI shares key similarities with other agriculture-based sectors such as sugarcane, rice, and cocoa, particularly in managing large volumes of residues and improving resource efficiency while reducing environmental impact [23]. Similar strategies are seen in the use of bagasse for cogeneration in sugarcane, husks, and straw for energy in rice, and cocoa pods for composting and bioenergy [24]. Common circular approaches include WtE, organic fertilizer, and value-added products like biochar and animal feed. These sectors also promote loop-closing practices such as water reuse and nutrient cycling. However, CE in the POI stands out due to its diverse and complex waste streams (EFB, fiber, PKS, and POME), each requiring specific technologies. Unlike the more homogeneous waste in other sectors, POI is tightly linked to downstream industries, enabling a fully integrated circular system. Furthermore, it faces significant global scrutiny, making CE essential for improving its sustainability and legitimacy [25].

2.2. Status of Electricity Production in Riau Province

Electricity in Riau Province is crucial in meeting the region’s energy demands and supporting industrial activities. Currently, the electricity sector contributes approximately 10–12% of the province’s total final energy consumption. However, access to electricity remains uneven; it is estimated that only around 55–60% of the population in rural and remote areas has full access to the power grid, with an average per capita electricity consumption of approximately 400–450 kWh per year. Electricity in Riau is generated from both fossil-based and renewable sources. Several coal-fired power plants use coal or natural gas as their primary fuel sources, contributing significantly to greenhouse gas emissions. In addition, diesel-powered plants are commonly used to serve remote areas, though these come with high operational costs and low efficiency. With growing energy demands and tariffs for end users in Riau, the region still faces frequent challenges in electricity distribution and supply, particularly during the dry season, when hydropower generation capacity decreases due to limited water supply and fossil fuel price fluctuations affecting the performance of gas and diesel generators. Renewable energy in Riau, such as solar, biomass, and biogas, remains limited. Renewable energy accounts for less than 2% of the province’s energy mix despite the abundance of biomass potential from the POI waste, including EFB, fibers, PKS, and POME. These resources can be converted into electricity using direct combustion, gasification, and anaerobic digestion technologies. For example, biogas from POME has been utilized by some palm oil mills on a small scale to meet internal energy needs, but it has not yet been widely integrated into the national grid. Riau’s installed capacity of biogas systems remains limited, with total off-grid PV capacity estimated at less than 5 MW. Electricity access gaps persist, especially in rural and island regions of Riau. More than 80% of electricity consumption is concentrated in major cities such as Pekanbaru, Dumai, and Bengkalis, while areas such as the Meranti Islands and Indragiri Hilir face limited access. Electricity demand in Riau is projected to grow by 8–12% annually in line with economic expansion and industrial development, particularly in the palm oil and petroleum sectors. However, this growth continues to be constrained by limited infrastructure and low generation efficiency, resulting in frequent rolling blackouts and voltage fluctuations.

2.3. Research Gaps and Contributions

Table 1 consolidates findings from recent research on optimizing palm oil waste management, detailing the precise categories of wastes analyzed, the conversion technologies utilized, the resultant energy products, and the modeling methodologies applied. A notable observation is that numerous studies primarily concentrate on a singular or restricted group of residues, predominantly EFB or PKS, while neglecting other significant waste streams such as fiber and POME. Focusing solely on one or two waste categories may lead researchers to overlook valuable resources and unknowingly forfeit significant environmental and economic prospects. A discernible trend in the data is the restricted incorporation of various conversion technologies. Although incineration and anaerobic digestion (Ad) are regularly addressed, composting (Cm) and alternative methods, such as biomass gasification, are often analyzed independently. Furthermore, the limited research incorporating composting generally neglects to assess it in conjunction with alternative approaches, diminishing the opportunity for thorough assessments of synergistic or complementary processes. This fragmented approach highlights the need for more cohesive frameworks that simultaneously evaluate numerous pathways, facilitating a more precise long-term sustainability assessment.
Additionally, the research exhibits a spatial concentration in countries such as Malaysia and Colombia. While these contexts share similarities with Indonesia, they differ in regulatory frameworks, infrastructure, and market conditions, limiting the generalizability of findings to the Indonesian setting. Although key elements such as by-product utilization, emission reduction, and supply chain efficiency are frequently discussed, most studies address only a single aspect of the circular economy, such as energy efficiency or specific waste streams, without holistically integrating economic, environmental, and energy considerations. This creates a research gap, emphasizing the need for comprehensive multi-criteria analyses that combine various technical approaches to develop more structured and effective waste management strategies. To address this gap, the present study proposes a multi-objective optimization framework that simultaneously considers profit, greenhouse gas emissions, and energy recovery. The contribution of this study is as follows:
  • This study develops an integrated multi-objective optimization framework that simultaneously addresses economic profitability, greenhouse gas emissions, and energy recovery, bridging the gap between isolated single-objective approaches in previous research.
  • This study incorporates all major waste types (EFB, Fiber, PKS, POME) into the model, resulting in a more holistic and realistic waste management solution for the palm oil industry.
  • A scenario-based analysis is conducted by considering three strategic policy-driven cases: MP, MPCT, and AWP, aligning with government regulations to generate comprehensive and policy-relevant results.

3. Materials and Methods

Figure 1 shows the research framework of this study. This research outlines a structured approach to designing an optimal palm oil waste management system in Indonesia, focusing on economic, environmental, and energy output. It begins by identifying the study’s problems and scope (Phase 1) and then by building a comprehensive system superstructure that includes various types of palm oil waste, treatment technologies, constraints, and utilization pathways. In Phase 3, data collection is conducted on waste characteristics, technology costs, and impacts. Phase 4 involves formulating a mathematical model with three main objectives: maximizing profit, maximizing energy output, and minimizing emissions. MILP was selected due to its capability to handle mixed decision variables (binary and continuous), which accurately represent the real-world structure of palm oil waste-to-energy systems, including technology selection and waste allocation. Furthermore, MILP facilitates a structured multi-objective formulation encompassing energy production, emission reduction, and profit maximization while ensuring computational efficiency through the use of advanced techniques. This model incorporates constraints such as mass and energy balances and technology capacities, and Phase 5 analyzes the optimal solution for each scenario’s utilization of palm oil waste.

3.1. Problem Statement

The primary challenge is to devise an optimal waste management system by identifying the most effective allocation and integration of available waste processing technologies, efficiently managing the flow of materials and energy from waste to final products, and selecting a processing and land use strategy that maximizes system performance in economic, environmental, and energy terms. A systematic planning model is required to concurrently maximize profitability from the sale of by-products through electricity and fertilizer. Table 2 illustrates the relationship between various types of palm oil mill waste, namely EFB, fiber, PKS, and POME, and applicable WtE technologies and their respective by-products. AD is exclusively applied to liquid waste, particularly POME, for electricity generation. In contrast, composting utilizes solid waste such as EFB and fiber to produce fertilizers. Gasification appears more selective, relying solely on EFB to generate electricity. Incineration and pyrolysis demonstrate greater versatility by processing multiple types of solid wastes (EFB, fiber, and PKS), resulting primarily in electricity output. This indicates that incineration and pyrolysis offer broader applicability in multi-waste energy conversion, while AD and composting are more specialized in input materials and output products.

3.2. Assumptions

In this study, the assumptions are made as follows:
  • All wastes generated by each palm oil mill (POM) are assumed to be fully processed into by-products.
  • Each POM treats its waste directly on-site.
  • The system boundary excludes inter-mill waste transportation, omitting associated emissions and transport costs.
  • All relevant treatment technologies are assumed to have sufficient capacity to process all generated waste.
  • Market demand and unit selling prices for by-products (electricity and organic fertilizer) are assumed to remain constant.
  • Waste-to-product conversion is modeled using fixed linear efficiency coefficients.
  • All technologies are assumed to operate continuously and reliably during the analysis period.
  • The quality and composition of each waste type are assumed to be homogeneous across all POMs, allowing for uniform application of emission factors and conversion efficiencies.
  • Operating costs and emissions are calculated per ton of waste processed and are assumed to remain constant.
  • Electricity generation facilities are assumed to be co-located or close to the POM.

3.3. Optimization Model

This section develops an optimization model for palm oil waste management from the perspective of a WtE relationship. The optimization model can realize the synergistic development of energy, economy, and environment with high resource utilization efficiency and waste recycling. Thus, the objectives are to maximize profit, minimize emissions, and maximize energy output. The optimization model notation is presented in Table 3 to show the model clearly.

Objective Function

This objective captures the system’s economic performance by considering the revenues derived from selling value-added products and the costs incurred from waste processing. The total revenue is calculated as the sum of all products generated multiplied by their respective market prices. On the other hand, the total cost comprises operational and investment costs associated with treating each type of waste using the available technologies. These costs are computed per ton of waste processed and vary depending on the type of waste and the selected treatment pathway. By maximizing the difference between total revenues and total processing costs, this objective ensures that the system is not only environmentally sustainable but also financially viable.
M a x i m i z e   Z 1 = p P z Z t T v p · y p t i I j J c i j · x i j t
The second objective function seeks to minimize the total GHG from treating palm oil mill waste. Emissions are primarily generated during conversion technologies, each with a distinct environmental footprint depending on the type of waste and technology employed. In this model, emissions are quantified as the product of the amount of waste processed and the specific emission factor associated with each waste–technology pair. These factors represent the average emissions released per ton of waste treated. By minimizing this objective, the model encourages the selection of technologies and processing pathways that are less carbon-intensive, promoting a low-emission development strategy for POI.
M i n i m i z e   Z 2 = t T i I j J e i j · x i j t
The third objective function maximizes the total energy output from converting waste into valuable products like electricity and fertilizer. In the model, energy output is quantified by multiplying the quantity of each product generated by its corresponding energy. This objective captures the potential of WtE systems to contribute to local energy self-sufficiency and support renewable energy transitions within the POI. The model promotes the efficient use of biomass resources by maximizing energy recovery.
M a x i m i z e   Z 3 = t T p P α p · y p t
Subject to
The total amount of waste type i processed by all technologies must not exceed its available supply in time period t.
j J x i j t A i
The total amount of product p generated is determined by the amount of waste processed, the efficiency of the technology, and the output ratio of that product.
y p t = i I j J x i j t · n i j · r j p
The total quantity of product p transported to all zones must not exceed the amount produced.
z Z z p z t y p t
The quantity of product p sent to zone z must not exceed the local demand or market capacity.
z p z t d p z t
Due to physical or operational limits, each technology j has a maximum processing capacity for waste type i.
x i j t c a p i j
x i j t ,   y p t ,   z p z t 0

4. Results

4.1. Case Study Description

Indragiri Hulu region in Riau Province, a prominent palm oil-producing region in Indonesia, possesses significant potential for developing a supply chain network for energy (electricity) and palm oil biomass by-products. Adopting the mandatory B40 policy in 2025 is a strategic measure to bolster national energy sovereignty and attain the net-zero emission objective, including a renewable energy mix target of 23% by 2030, as outlined in the current national energy policy. Indragiri Hulu can adopt analogous measures by leveraging its substantial palm oil-derived biomass resources. In this region, there are 10 palm oil mills operating palm oil biomass, which accounts for about 50% of the total solid biomass gathered each year, highlighting the significance of this sector in renewable energy. Implementing this in Indragiri Hulu can convert EFB, fiber, and PKS into power or fertilizer. This will assist in determining profitability and energy output. Incorporating electricity from palm oil waste will augment the region’s preparedness for distributed renewable energy, aligning with Indonesia’s comprehensive green energy strategy. Table 4 shows the available biomass in the Indragiri Hulu region. Table 5 presents the conversion factors and associated emissions for various palm oil waste treatment technologies. Complementing this, Figure 2 illustrates the block flow diagram of palm oil processing, highlighting the interactions between waste streams, treatment technologies, and by-product pathways.

4.2. Scenario Analysis

This study explores three key scenarios to evaluate trade-offs in WtE in POM: the MP scenario, the MPCT scenario, and the AWP scenario. The MP scenario prioritizes economic returns by selecting technology combinations that yield the highest profit, regardless of environmental consequences. The MPCT scenario integrates a carbon pricing policy (USD 2/tCO2e) into the optimization model to internalize environmental costs and promote lower-emission technologies. Lastly, the AWP scenario simulates a regulatory condition in which all types of palm oil waste must be processed, reflecting strict government mandates without regard to economic feasibility. These scenarios provide a comprehensive lens to assess the performance of WtE systems under varying policy and market conditions, highlighting the implications of different sustainability pathways.

4.2.1. MP Scenario

This scenario refers to a modeling configuration that prioritizes selecting WtE technologies based solely on economic profitability. The main objective of this scenario is to identify the combination of waste and treatment technologies that yields the highest total profit, calculated as the difference between revenues from by-products (e.g., electricity and fertilizer) and the associated capital and operational expenditures (CAPEX and OPEX). This approach does not account for environmental impacts like GHG emissions. Instead, it reflects a business-as-usual decision-making perspective in which economic return is the dominant criterion. This scenario aligns with the investment logic commonly employed in private-sector decision-making, where financial viability is often the primary concern. As such, it offers insights into the feasibility and attractiveness of adopting waste-to-energy technologies without external policy interventions.
Table 6 shows the intricate dynamics of palm oil waste management through an MP scenario. POME is the most prevalent waste type regarding volume and cost per ton, with over 700,000 tons available and the lowest processing cost of approximately USD 50 per ton, indicating significant economic potential for large-scale operations. Nonetheless, the optimization outcomes presented in Table 6 indicate that despite the utilization of AD technology in POME processing, the resultant profit is comparatively modest (USD 28,467 k) and is associated with the highest emission level (22,084.56 tCO2e), suggesting that substantial volume and minimal cost do not inherently yield optimal profit. However, EFB, despite incurring the highest processing cost (USD 85/ton), yields the most profit (USD 125,590 k) when subjected to gasification, albeit with considerable emissions (12,214.44 tCO2e). Fiber and PKS, employing incineration technology, exhibit comparatively moderate profit and emission levels. Notably, PKS is the sole waste category exhibiting the lowest emission-to-profit ratio. It is characterized by minimal emissions (4484.4 tCO2e) and positive profits (USD 18,502.07 k), making it an exemplary choice for a low-carbon processing strategy. This discovery indicates a compromise between economic efficiency and environmental consequences. Profit-driven decisions will promote the accumulation of EFB and fiber while neglecting the associated emissions burden. Conversely, a low-emission strategy may prioritize PKS processing but with restricted profitability.

4.2.2. MPCT Scenario

The MPCT scenario in this study is a simulation approach to spread the impact of implementing a carbon tax policy on palm oil waste processing strategies. GHG emissions generated from each technology are subject to an additional charge per ton of CO2e. In Indonesia, the carbon cost is set at USD 2 per ton of CO2e, aligning with the nationally applicable reference value. This scenario aims to promote the adoption of economically viable technologies and low emissions while also evaluating the resilience of the profitability framework in response to progressively stricter environmental regulations. This implementation scenario facilitates the concurrent integration of economic and environmental factors in model optimization, thereby aiding the transition to a circular economy and promoting industrial decarbonization.
Table 7 presents the results of waste allocation, profit, and total emissions in a carbon tax scenario with a tariff of USD 2/tCO2e, which aims to internalize the cost of carbon emissions into palm oil waste processing decisions. From a total waste volume of 373,848 tons, the system generates a profit of USD 59,349 k with total emissions of 39,386 tCO2e. EFB → Gasification technology is the primary contributor to profit (USD 27,493.38 k) with relatively low emissions (4560 tCO2e), while Fiber → Incineration is still allocated in significant amounts even though its emissions are the highest (22,928 tCO2e) because its profitability is still quite high (USD 19,321.27 k). The EFB → Composting option also appears as a balancing strategy. Although its profit is smaller (USD 5468.85 k), it is very low in emissions (450 tCO2e).
On the other hand, the volume of EFB allocated to incineration is drastically reduced because its profit is low and its emissions are inefficient. POME is not included in this scenario, which is most likely due to the high emission factor of the anaerobic digestion process, which has a significant impact on the carbon cost burden, as well as its low contribution to profits, making it overall uncompetitive in the carbon tax-based optimization model. This suggests that when environmental policies such as carbon taxes are implemented, technologies and waste types with high emission intensity but low profit margins will be automatically eliminated from the system, and the model will prefer economically and ecologically efficient combinations.

4.2.3. AWP Scenario

In this phase, the AWP scenario refers to an approach where all types of waste, such as EFB, fiber, PKS, and POME, must be fully processed without exception, regardless of their economic value or emission levels. This scenario simulates the impact of a mandatory waste processing policy that the government can implement to enforce the principle of extended producer responsibility and a commitment to sustainable waste management. In other words, this scenario reflects a situation where companies must be responsible for all the waste they produce, regardless of whether it is economically profitable. The application of this scenario is crucial because it provides a realistic picture of the technical, economic, and environmental consequences if the government policy requires the processing of all waste. This scenario shows that processing all waste can still provide profit or significantly reduce emissions, which can strengthen the scientific argument to support the mandatory waste processing policy. On the other hand, if the results show high-cost burdens or significant emissions from certain types of waste (e.g., high-emitting POME), the government may consider providing incentives, subsidies for low-emission technologies, or carbon offset mechanisms to encourage industry compliance.
Table 8 shows the results of the AWP scenario where the total waste selected reaches 1,110,000 tons, generating a profit of USD 48,217 k, but with the consequence of very high emissions of 99,014 tCO2e. In this scenario, POME → AD is the most significant contributor to emissions in absolute terms (59,628 tCO2e) and results in an economic loss of USD 11,212 k, with the note that even though it is mandatory to be processed, POME is a burden from the side of neutralizing the economy in the context of carbon tax. The POME processing by anaerobic digestion incurs losses due to its low electricity yield (133 kWh/ton), and the revenue from energy sales does not offset the carbon tax liability. With the current electricity selling price (USD 0.095/kWh), the income from POME is still too low, making it a negative contributor to overall profits despite its large volume. To make POME processing economically positive, a higher feed-in tariff policy, carbon incentive support, and collaboration between palm oil mills, the government, and the private sector are needed in developing renewable energy technologies and markets based on liquid waste.
In contrast, the EFB → Gasification technology shows superior performance with high profits (USD 27,503 k) and relatively controlled emissions (4560 tCO2e). Fiber and PKS processed through incineration also still generate profits (USD 19,367 k and 6169 k) but with high emissions (22,928 and 8969 tCO2e), highlighting the need for emissions mitigation policies if these technologies are to be maintained. This scenario accumulates efficiency gains for full compliance with the zero-waste debit principle. Total profits decrease compared to the previous scenario, and emissions increase sharply because all waste, including uneconomic and high-emission waste such as POME, is processed. This reflects the classic dilemma between strict environmental regulations and the economic competitiveness of the industry. Therefore, implementing policies like this in the real world requires further policy support, such as fiscal incentives, subsidies for low-carbon technologies, or applying carbon offsets to offset the burden of losses arising from high-risk waste. Strategically, this table shows the importance of adaptive design policies where waste processing capabilities still consider financial and environmental poverty simultaneously.
Figure 3 compares the output (electricity and fertilizer) of three scenarios: MP, MPCT, and AWP. A key finding from this graph is that the MP scenario produces the highest electricity (around 800 GWh) but produces no fertilizer at all, reflecting a focus on energy conversion without considering the added value of by-products. In contrast, both the MPCT and AWP scenarios produce lower electricity (around 550–700 GWh) but provide the same large fertilizer output (around 15,000 tons), indicating that when emissions are charged or all waste is required to be treated, systems tend to divert some waste to technologies such as composting to minimize emissions or meet regulations. This finding confirms the trade-off between energy output and product diversification and suggests that environmental policies can significantly influence the direction and outcomes of energy-based waste management systems.
Figure 4 presents a comparative analysis of three scenarios based on total profit, waste allocation, and total emissions. The MP scenario demonstrates the highest economic performance, generating over USD 200,000 k in profit while processing a large volume of waste. However, it results in moderate emissions. In contrast, the MPCT scenario shows the lowest profit and waste allocation. However, it achieves the lowest total emissions, indicating a more environmentally conscious approach by limiting high-emission waste and technology usage. While processing nearly the same amount of waste as MP, the AWP scenario results in the highest emissions and generates the lowest profit. This suggests that processing all available waste, including low-value and high-emission types such as POME, may not be economically or environmentally sustainable without external support. In this scenario, pyrolysis was not selected due to its relatively low economic performance and minimal emission reduction benefits compared to alternative technologies. Overall, the figure highlights the importance of strategic waste selection and technology deployment to balance profitability and environmental performance in palm oil waste-to-energy systems.

5. Discussion

The comparative analysis of the three core scenarios reveals a fundamental trade-off between economic returns and environmental performance in palm oil waste-to-energy systems. The MP scenario demonstrates that prioritizing profitability without considering emissions favors high-yield technologies such as EFB gasification and fiber incineration, generating the highest profit (USD 125.59 M and USD 51.90 M, respectively). However, this comes at the cost of considerable GHG emissions. Interestingly, although POME offers the highest waste volume and lowest processing cost per ton, its contribution to profit is limited, and it incurs the highest emissions, highlighting that volume alone does not guarantee economic or environmental efficiency. These findings align with [33,34], who emphasize that integrating environmental metrics is essential for sustainable bioresource utilization. Notably, PKS incineration, despite the lower volume, exhibits the most favorable emission-to-profit ratio, suggesting that a low-carbon and economically viable strategy must consider both scale and emission intensity simultaneously [35,36].
When a carbon tax is introduced into the system (USD 2/tCO2e, adopted nationally in Indonesia), the optimization model shifts preferences by penalizing high-emission processes. This excludes POME → AD, which previously contributed high emissions with poor profitability. Technologies such as EFB → Gasification and EFB → Composting emerge as optimal solutions, offering a balance between profit and environmental performance (USD 27.49 M with 4560 tCO2e and USD 5.47 M with only 450 tCO2e, respectively). Emissions are significantly reduced (39,386 tCO2e vs. 99,014 tCO2e in the all-inclusive case), highlighting how even low carbon prices can drive substantial sustainability gains. This is consistent with Lo et al. [37], who observed that carbon pricing reshapes the waste valorization landscape by embedding environmental externalities into economic frameworks. The findings support the argument that market-based environmental instruments such as carbon taxes or cap-and-trade systems can be powerful levers for accelerating the adoption of circular economy practices in agro-industrial systems [38,39,40,41,42]. A similar study by Stichnothe and Schuchardt [43] shows that while POME treatment via AD in Malaysia can reduce methane emissions, its economic feasibility remains limited unless biogas capture technologies and energy market incentives are supported. This mirrors the results of the current study, where POME → AD contributes the highest emissions and offers minimal profitability unless penalized by carbon pricing. Similarly, EFB gasification and incineration have been highlighted in Malaysian contexts as efficient pathways for energy recovery with moderate emissions, consistent with this study’s conclusion that EFB → Gasification offers the best trade-off between profit and emissions, especially when carbon taxes are applied.
Based on the sensitivity analysis, waste management strategies in the POI are recommended to incorporate flexibility in output allocation to adapt to fluctuations in electricity prices. When electricity prices are low to moderate, fertilizer production through composting should be optimized to balance profitability and environmental sustainability. In contrast, when electricity prices are high, maximizing electricity generation becomes favorable, while additional incentives for nutrient recycling practices should still be considered. Therefore, policy support in the form of sustainability-based electricity tariffs, composting subsidies, or carbon credits for fertilizer production could serve as key instruments to promote the integration of economic and environmental objectives within palm oil industry waste-to-energy systems. This aligns with the findings of González et al. [4], who demonstrated that optimizing the palm oil supply chain in Colombia by integrating biomass-based electricity generation significantly enhances economic profitability, particularly when surplus electricity can be sold to the grid. Their findings also underscore the importance of regional planning that accounts for biomass availability, the types of by-products produced (fertilizer or electricity), and the implementation of adaptive strategies capable of responding effectively to fluctuations in electricity prices, supported by appropriate renewable energy policy incentives.
In addition, the sensitivity analysis of electricity selling prices reveals that even under a carbon pricing regime, the primary driver of technology adoption remains the revenue signal from the electricity market itself, highlighting the need to integrate environmental costs with sufficiently attractive renewable tariffs. This behavior confirms the findings of Duc, Meejaroen, and Nananukul [21], who note that biomass-to-energy projects become economically attractive only when energy prices surpass a defined threshold. Consequently, FiT policies and long-term power purchase agreements play a pivotal role in ensuring the bankability of renewable energy projects in developing nations, where pricing volatility is common [44,45]. These insights emphasize the importance of designing robust and adaptive policy frameworks that harmonize profit generation, emission control, and market responsiveness in the palm oil industry.
Despite providing valuable insights, the proposed optimization model has several limitations. It assumes uniform waste composition across all palm oil mills, ignoring variability that may affect energy output and emissions. Market demand for electricity and fertilizer is treated as constant, overlooking fluctuations. Additionally, the model does not account for future policy uncertainties, such as shifts in renewable energy incentives or subsidies, that could alter the economic viability of treatment options.

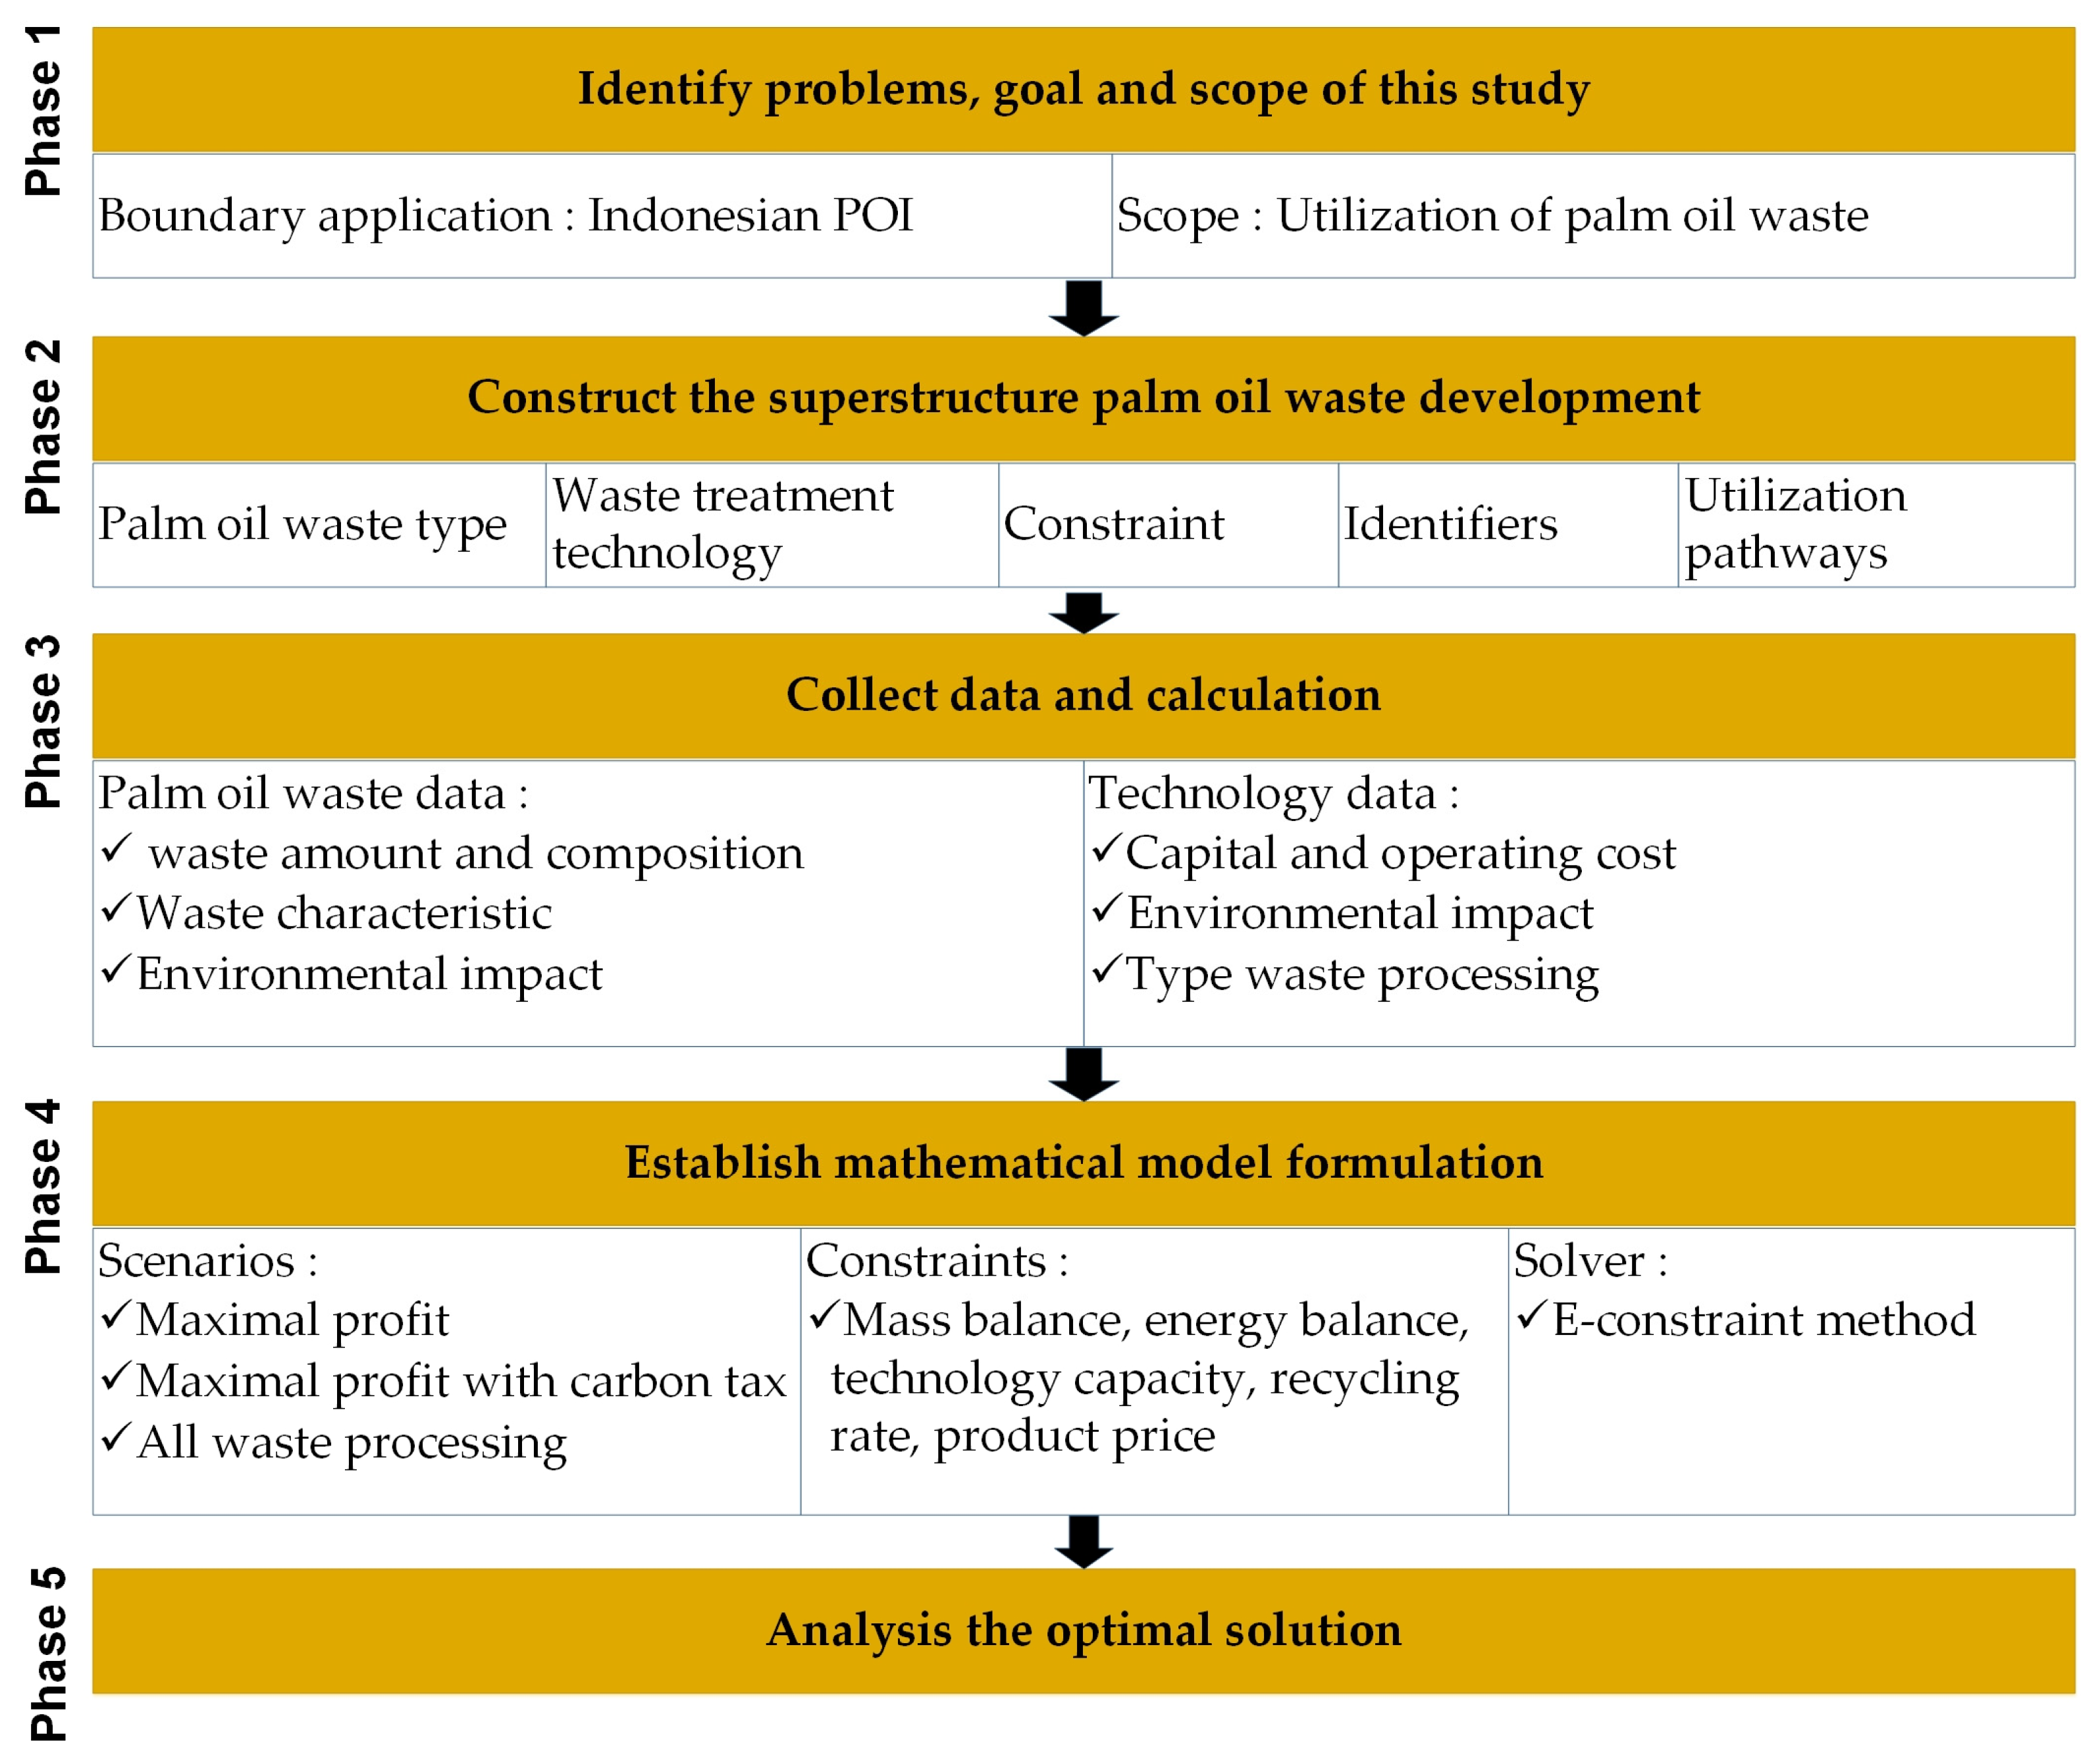
5.1. Sensitivity Analysis

In this study, sensitivity analysis is used to evaluate the sensitivity of a palm oil waste treatment system to changes in external parameters, especially the electricity selling price. This approach aims to understand how changes in the economic value, such as electricity price, fertilizer price, carbon tax rate, and technological efficiency, can affect strategic decisions in technology selection, waste allocation, and the economic and environmental outcomes of the system. Uncertainty in this variable is common in renewable energy projects, especially in developing countries, where it is influenced by government policies, feed-in tariff (FiT) regulations, and global energy market dynamics. The sensitivity analysis is detailed as follows:
(1)
Sensitivity analysis of electricity price
In the steps, the parameter that changed is the electricity selling price, with values varying from USD 0.005/kWh to USD 0.115/kWh. The baseline price of electricity is USD 0.085/kWh. The main reason for choosing electricity price as an uncertainty variable is that electricity is the system’s dominant product and has a much higher economic value than by-products such as fertilizers. In addition, key technologies such as gasification, incineration, and anaerobic digestion directly depend on the electricity selling price to determine their financial viability. Therefore, variations in electricity prices become the leading indicator in assessing the system’s response to external changes. Table 9 shows the impact of changes in electricity prices on emissions, profits, and the energy output produced.
The results indicate that increasing electricity selling prices significantly enhances profitability, rising from approximately USD 43 million at USD 0.05/kWh to nearly USD 387 million at USD 0.115/kWh. A critical transition occurs between USD 0.075/kWh and USD 0.085/kWh. At lower prices (USD 0.05–0.075/kWh), most waste is processed through gasification for EFB, composting for fiber, and incineration for PKS, resulting in fertilizer production of 35,825 tons. When electricity prices exceed USD 0.085/kWh, all waste types, including POME, are utilized to maximize electricity generation, eliminating fertilizer production and a sharp increase in carbon emissions (from approximately 22,000 to over 51,000 tCO2e). These findings reveal a clear trade-off between economic and environmental objectives. At lower electricity prices, allocating a portion of waste for fertilizer production via composting is recommended, as it offers additional benefits such as emission reductions and enhanced product value, independent of electricity market volatility. Conversely, at higher electricity prices, economic incentives drive the prioritization of electricity production at the expense of nutrient recycling. Therefore, prioritizing fertilizer production through organic waste treatment offers a more sustainable and resilient approach to energy market uncertainty in markets with low or unstable electricity prices.
(2)
Sensitivity analysis of fertilizer price
The sensitivity analysis of fertilizer price was conducted to evaluate the economic responsiveness of the palm oil waste-to-product system under varying market conditions. Given the volatility of fertilizer prices in agricultural markets and their significant impact on profitability, this analysis aims to understand how fluctuations in fertilizer revenue affect the optimal allocation of waste and overall system performance. The primary objective is to identify threshold values at which composting becomes more or less favorable compared to energy-focused technologies such as gasification or incineration. The impact of fertilizer price on profit and emissions is shown in Table 10.
Table 10 presents the outcomes of a sensitivity analysis on fertilizer selling price, highlighting its influence on profit, emissions, electricity generation, and fertilizer output. It consistently allocates all waste streams to electricity-producing technologies at lower fertilizer prices (USD 400–535/ton), resulting in zero fertilizer production and high electricity output (812 GWh). Correspondingly, emissions remain at 51,680 tCO2e and profit stabilizes at approximately USD 224.5 million, indicating that composting is economically unattractive under low fertilizer price scenarios. As the fertilizer price increases beyond USD 535/ton, a notable shift in waste allocation occurs. At USD 1070/ton, the system begins to divert a portion of biomass to composting, yielding 11,250 tons of fertilizer and reducing electricity output to 757 GWh. This trade-off reflects a rebalancing between energy and material recovery in response to improved market incentives. At USD 1605/ton and USD 2140/ton, fertilizer production reaches 35,825 tons, while electricity output declines further to 637 GWh. Importantly, these shifts are accompanied by substantial reductions in emissions, falling to 44,515 tCO2e—a 13.8% decrease compared to the baseline case.
Profitability also increases with higher fertilizer prices, peaking at USD 244.9 million at USD 2140/ton. This suggests that, beyond a critical price threshold, composting not only becomes economically viable but also preferable in terms of emissions performance. These results underscore the dual benefits of high fertilizer pricing: enhanced economic return and lower environmental impact, thereby supporting policy mechanisms such as compost subsidies or green fertilizer pricing to encourage sustainable waste treatment practices.
(3)
Sensitivity analysis of carbon tax rate
The sensitivity analysis of the carbon tax rate was performed to examine the impact of environmental regulatory instruments on the economic and environmental performance of palm oil waste treatment strategies. As carbon taxation becomes an increasingly adopted policy to reduce greenhouse gas emissions, it is critical to assess how varying carbon tax levels influence technology selection and system profitability. This analysis aims to identify cost-emission trade-offs and evaluate the feasibility of low-emission technologies, such as anaerobic digestion and composting, under different carbon pricing scenarios. Table 11 shows the relationship between the carbon tax rate and profit and emissions.
Table 11 reports the effects of increasing carbon tax rates on profitability, emission levels, electricity generation, and fertilizer production in a palm oil waste treatment system. The carbon tax rate varies from USD 0 to USD 10 per ton of CO2-equivalent, while fertilizer prices are constant. The results demonstrate a clear trade-off between economic performance and environmental benefits as the carbon tax increases. At the baseline (USD 0/tCO2e), the system achieves its highest profit of USD 59.43 million, with total emissions at 39,386 tCO2e and 512 GWh of electricity generated. However, the imposition of even a modest carbon tax (USD 2/tCO2e) leads to a slight decline in both profit (USD 59.35 million) and electricity output (508 GWh), with emissions remaining unchanged—suggesting limited system reconfiguration at low tax levels.
As the tax rate increases further, the system begins to internalize the cost of carbon emissions more aggressively. At USD 4/tCO2e, emissions drop to 36,629 tCO2e (a 7% reduction from baseline), accompanied by a moderate decrease in profit and electricity generation. At the highest tax level of USD 10/tCO2e, the system achieves a 28% reduction in emissions (28,358 tCO2e), but profits decline to USD 54.5 million—approximately 8% below the no-tax scenario. This indicates that while carbon taxation effectively incentivizes emission reductions, it does so at the expense of economic return. The analysis reveals that fertilizer production demonstrates remarkable consistency across all examined scenarios, with output values ranging between 34,853 and 35,825 tons. This consistency suggests that composting operations maintain their economic viability as an optimal waste allocation strategy even under carbon pricing mechanisms. This stability indicates a shift in the system, which reduces reliance on high-emission electricity pathways (e.g., incineration or gasification) while maintaining material recovery through composting, which is less emission-intensive. These results highlight the efficacy of carbon taxation as a policy instrument for directing palm oil waste management systems toward adopting cleaner technologies and achieving reduced emission profiles. Nevertheless, the findings simultaneously illuminate the critical importance of establishing an equilibrium between fiscal penalties and complementary incentive structures to prevent adverse effects on economic profitability within the sector.
(4)
Sensitivity analysis of technological efficiency
The sensitivity analysis of technological efficiency was conducted to assess how changes in the performance of waste-to-energy and waste-to-product technologies affect the overall outcomes of the palm oil waste management system. Since technological parameters such as conversion rates of waste to electricity or fertilizer are important, it is essential to understand their influence on profitability, emissions, and product output. This analysis aims to evaluate the robustness of optimal waste allocation strategies under different efficiency levels and to identify which technologies are most sensitive to performance variations. We systematically adjusted the conversion efficiency rates of each technology by ±20% around baseline values. By comparing the resulting system outputs across scenarios, we were able to determine critical thresholds where small changes in efficiency could significantly alter the economic or environmental viability of the system.
Table 12 presents a sensitivity analysis examining technological efficiency impacts on palm oil waste-to-energy system performance across efficiency variations ranging from −20% to +20% relative to baseline conditions. This analysis evaluates system robustness under operational and technological variability by assessing total profit, emissions, electricity generation, and fertilizer production. The baseline scenario (0% efficiency) generates USD 224.47 million profit, 812 GWh electricity output, and 51,680 tCO2e emissions. Enhanced efficiency demonstrates a strong positive correlation with economic performance: +10% efficiency increases profit to USD 252.90 million (12.7% improvement) and electricity output to 894 GWh, while +20% efficiency achieves maximum performance with USD 281.33 million profit and 975 GWh generation. Conversely, reduced efficiency scenarios exhibit substantial performance degradation, with −10% and −20% efficiency yielding profits of USD 196.03 million and USD 167.60 million, respectively, alongside decreased electricity output reaching 650 GWh at minimum efficiency. Notably, emissions decrease under reduced efficiency conditions due to lower overall system activity, with −20% efficiency producing 45,541 tCO2e (11.9% reduction) despite a 25% profit decline. Fertilizer production remains consistently zero across all scenarios, indicating optimization model preference for energy recovery over composting under current economic assumptions, reinforcing electricity generation technology dominance absent favorable fertilizer pricing or policy incentives.
The analysis reveals technological efficiency as a critical determinant of economic and energy performance in palm oil waste management systems. However, the observed efficiency–emissions trade-off necessitates balanced consideration, supporting the integration of emission control technologies or carbon mitigation strategies alongside efficiency improvements to achieve sustainable outcomes.

5.2. Managerial Implications

The findings of this study offer critical insights for palm oil mill operators and decision-makers in the bioenergy sector. The consistent superiority of EFB gasification across multiple scenarios, both in terms of profitability and emissions, suggests that managers should prioritize investments in scalable, energy-efficient technologies that balance economic and environmental objectives. Conversely, the underperformance of POME AD, particularly under MPCT and AWP scenarios, highlights the financial risks of processing high-emission, low-profit waste streams without supportive policy frameworks. Current electricity prices are insufficient to incentivize the utilization of POME for energy generation, leading to its underutilization. To address this, targeted government subsidies or the introduction of low-level carbon pricing should be considered to promote the processing of high-moisture, low-value waste. Investments should focus on technologies that remain viable under low electricity price conditions. Scenario-based planning is essential to align technology choices with evolving policy and market dynamics, while multi-stakeholder collaboration can facilitate investment, knowledge sharing, and policy responsiveness. These instruments collectively support the economic feasibility of sustainable waste management while contributing to broader climate targets and circular economy goals.

5.3. Practical Implications

Based on the result, several key practical insights can guide palm oil mill operators and policymakers. EFB gasification is the most profitable and moderately emitting option, making it the core technology for WtE systems. In contrast, POME processing via AD leads to financial losses and high emissions and should only be pursued with supportive policies such as feed-in tariffs, subsidies, or carbon credits. A hybrid strategy combining gasification for energy and composting for fertilizer is recommended to balance profitability and emissions, especially when fertilizer prices are high. Operators should monitor electricity and fertilizer prices to adjust waste allocation dynamically. High electricity prices (>USD 0.085/kWh) favor energy production, while fertilizer prices above USD 1000/ton justify composting.
Even at modest levels, carbon taxes encourage a shift toward low-emission technologies like composting with minimal profit loss. Maintaining high technological efficiency is also critical, as performance fluctuations directly impact profitability and emissions. However, key barriers to WtE adoption in Indonesia include high initial capital costs, limited financing access, lack of technical capacity, and regulatory uncertainty. To overcome these challenges, it is essential to promote government-backed incentives, technical training programs, and public–private partnerships. These enabling strategies can improve investment attractiveness and ensure the scalable and sustainable implementation of WtE systems in the palm oil sector.

6. Conclusions

This study has developed and evaluated a multi-scenario optimization framework for palm oil mill WtE systems. Through MP, MPCT, and AWP scenarios, the research reveals the trade-offs between maximizing economic return and minimizing environmental impact. The MP model favors technologies such as EFB gasification and fiber incineration, which yield high profits but with considerable emissions. The MPCT scenario favors lower-emission technologies like composting and excludes high-emission, low-profit options such as POME digestion. Meanwhile, the AWP scenario, simulating government-mandated waste treatment, confirms that full compliance without supporting incentives can reduce profits and increase emissions, particularly due to the high-emission burden of POME. These scenarios directly correspond to sustainability targets. The MP scenario supports economic viability (Goal 8: Decent Work and Economic Growth), while the MPCT and AWP scenarios align more closely with climate action (Goal 13) and responsible production and consumption (Goal 12) by emphasizing emissions reduction and waste valorization. The sensitivity analysis reveals that a modest feed-in tariff slightly above the USD 0.085 kWh−1 activation threshold can unlock complete waste utilization, including POME processing via anaerobic digestion. However, closing the circular economy gap and sustaining profitability under carbon pricing will require complementary incentives that reward nutrient-recycling technologies and adjust carbon charges to reflect emission plateaus once full utilization is achieved. These insights reinforce the critical role of energy pricing mechanisms, such as FiT and long-term power purchase agreements, in influencing the success of renewable energy projects. Furthermore, the findings support integrating environmental costs through carbon taxation into optimization models to promote sustainable technology adoption, aligning with national and international climate goals.
Future research could extend this model by integrating spatial analysis using GIS to optimize the geographical siting of waste treatment facilities, considering transport emissions, land availability, and regional energy demand. Moreover, the model can be enhanced by incorporating multi-stakeholder decision-making approaches, such as the Analytic Network Process or Fuzzy-AHP, to capture broader government, industry, and community perspectives. Finally, exploring dynamic policy simulations such as escalating carbon prices or renewable energy quotas would offer valuable insights into the long-term resilience of palm oil WtE systems under evolving regulatory landscapes.

Author Contributions

Conceptualization: H.C.A. and H.R.; Methodology: H.C.A.; Visualization: H.C.A.; Writing—review and editing: H.C.A. and H.R.; Writing—original draft: H.C.A.; Supervision: H.R.; Funding acquisition: H.R. All authors have read and agreed to the published version of the manuscript.

Funding

This work was partly supported by the National Science and Technology Council of the Republic of China under grants NSTC 113-2221-E-033-001 and NSTC 113-2221-E-033-051.

Data Availability Statement

The original contributions presented in the study are included in the article; further inquiries can be directed to the corresponding author.

Conflicts of Interest

The authors declare no conflicts of interest.

Abbreviations

AcronymDescription
POIPalm oil industry
EFBEmpty fruit bunch
PKSPalm kernel shell
POMEPalm oil mill effluent
ADAnaerobic digestion
CHPCombined heat and power
CECircular economy
GHGGreenhouse gas
CO2-eqCarbon dioxide equivalent
LCALife cycle assessment
MILPMixed-integer linear programming
WtEWaste-to-energy
AHPAnalytical hierarchy process
GISGeographic information system
MPmaximal profit
MPCTmaximal profit with a carbon tax
AWPall waste processing
CAPEXCapital expenditure
OPEXOperating expenditure
tTons

References

  1. Xin, Y.; Sun, L.; Hansen, M.C. Oil palm reconciliation in Indonesia: Balancing rising demand and environmental conservation towards 2050. J. Clean. Prod. 2022, 380, 135087. [Google Scholar] [CrossRef]
  2. Wang, C.; Zhang, W.; Qiu, X.; Xu, C. Hydrothermal treatment of lignocellulosic biomass towards low-carbon development: Production of high-value-added bioproducts. EnergyChem 2024, 6, 100133. [Google Scholar] [CrossRef]
  3. Kristanti, R.A.; Hadibarata, T.; Yuniarto, A.; Muslim, A. Palm Oil Industries in Malaysia and Possible Treatment Technologies for Palm Oil Mill Effluent: A Review. Environ. Res. Eng. Manag. 2021, 77, 50–65. [Google Scholar] [CrossRef]
  4. Peña González, D.; Cortés Borda, D.; Mele, F.D.; Barrios Sarmiento, A.; Domínguez Santiago, M. An optimization approach for the design and planning of the oil palm supply chain in Colombia. Comput. Chem. Eng. 2021, 146, 107208. [Google Scholar] [CrossRef]
  5. Ling, W.C.; Verasingham, A.B.; Andiappan, V.; Wan, Y.K.; Chew, I.M.L.; Ng, D.K.S. An integrated mathematical optimisation approach to synthesise and analyse a bioelectricity supply chain network. Energy 2019, 178, 554–571. [Google Scholar] [CrossRef]
  6. Subramaniam, V.; Loh, S.K.; Aziz, A.A. GHG analysis of the production of crude palm oil considering the conversion of agricultural wastes to by-products. Sustain. Prod. Consum. 2021, 28, 1552–1564. [Google Scholar] [CrossRef]
  7. Budianta, I.A.; Gozan, M. What Should We Do with the Oil Palm Solid Waste? IOP Conf. Ser. Earth Environ. Sci. 2022, 1111, 012015. [Google Scholar] [CrossRef]
  8. Januari, A.D.; Agustina, H. Palm Oil Empty Fruit Bunches and The Implementation of Zero Waste and Renewable Energy Technologies. IOP Conf. Ser. Earth Environ. Sci. 2022, 1034, 012004. [Google Scholar] [CrossRef]
  9. Umar, M.S.; Urmee, T.; Jennings, P. A policy framework and industry roadmap model for sustainable oil palm biomass electricity generation in Malaysia. Renew. Energy 2018, 128, 275–284. [Google Scholar] [CrossRef]
  10. Nair, P.N.S.B.; Andiappan, V.; Foo, D.C.Y.; Chemmangattuvalappil, N.G. Disjunctive fuzzy optimisation of electricity generation by biomass power producers in a feed-in tariff programme. Asia-Pac. J. Chem. Eng. 2022, 17, e2830. [Google Scholar] [CrossRef]
  11. Irawan, I.; Purnomo, E.P.; Prabawa, W.g.; Hung, C.F. Renewable Energy Development Through the Utilization of Palm Oil Mill Effluent (POME) in Indonesia. IOP Conf. Ser. Earth Environ. Sci. 2024, 1404, 012002. [Google Scholar] [CrossRef]
  12. Foong, S.Z.Y.; Andiappan, V.; Tan, R.; Ng, D.K.S. Optimization and analysis for palm oil mill operations via input-output optimization model. In Proceedings of the the 25th Regional Symposium on Chemical Engineering (RSCE 2018), Makati City, Philippines, 21–22 November 2019; Volume 268. [Google Scholar] [CrossRef]
  13. Ng, D.K.S.; Wong, S.L.X.; Andiappan, V.; Ng, L.Y. Mathematical optimisation for sustainable bio-methane (Bio-CH4) production from palm oil mill effluent (POME). Energy 2023, 265, 126211. [Google Scholar] [CrossRef]
  14. Arista, N.I.D. The Potential of Circular Economy in the Oil Palm Plantation to Industry. Jssew 2024, 1. [Google Scholar] [CrossRef]
  15. Mohammad, S.; Baidurah, S.; Kobayashi, T.; Ismail, N.; Leh, C.P. Palm Oil Mill Effluent Treatment Processes—A Review. Processes 2021, 9, 739. [Google Scholar] [CrossRef]
  16. Suzuki, K.; Tsuji, N.; Shirai, Y.; Hassan, M.A.; Osaki, M. Evaluation of biomass energy potential towards achieving sustainability in biomass energy utilization in Sabah, Malaysia. Biomass Bioenergy 2017, 97, 149–154. [Google Scholar] [CrossRef]
  17. Hartini, S.; Saptadi, S.; Nurmilatina; Sari, D.P.; Wicaksono, P.A. Improving Eco-efficiency of crude palm oil production process using life cycle assessment. IOP Conf. Ser. Earth Environ. Sci. 2024, 1414, 012058. [Google Scholar] [CrossRef]
  18. James Rubinsin, N.; Daud, W.R.W.; Kamarudin, S.K.; Masdar, M.S.; Rosli, M.I.; Samsatli, S.; Tapia, J.F.; Wan Ab Karim Ghani, W.A.; Lim, K.L. Optimization of oil palm empty fruit bunches value chain in Peninsular Malaysia. Food Bioprod. Process. 2020, 119, 179–194. [Google Scholar] [CrossRef]
  19. Ng, R.T.L.; Hassim, M.H.; Ng, D.K.S.; Tan, R.R.; El-Halwagi, M.M. Multi-objective Design of Industrial Symbiosis in Palm Oil Industry. In Computer Aided Chemical Engineering; Eden, M.R., Siirola, J.D., Towler, G.P., Eds.; Elsevier: Amsterdam, The Netherlands, 2014; Volume 34, pp. 579–584. [Google Scholar]
  20. Siagian, U.W.R. Circular Economy Approaches in the Palm Oil Industry: Enhancing Profitability Through Waste Reduction and Product Diversification. J. Eng. Technol. Sci. 2024, 56, 25–49. [Google Scholar] [CrossRef]
  21. Duc, D.N.; Meejaroen, P.; Nananukul, N. Multi-objective models for biomass supply chain planning with economic and carbon footprint consideration. Energy Rep. 2021, 7, 6833–6843. [Google Scholar] [CrossRef]
  22. Andiappan, V.; Tan, R.R.; Ng, D.K.S. An optimization-based negotiation framework for energy systems in an eco-industrial park. J. Clean. Prod. 2016, 129, 496–507. [Google Scholar] [CrossRef]
  23. Mai, N.P.; Xuan, T.D. A review on the utility potential of rice derived products in weed management. Weed Res. 2025, 65, e12678. [Google Scholar] [CrossRef]
  24. Anyaoha, K.E.; Zhang, L. Renewable energy for environmental protection: Life cycle inventory of Nigeria’s palm oil production. Resour. Conserv. Recycl. 2021, 174, 105797. [Google Scholar] [CrossRef]
  25. Jurgilevich, A.; Birge, T.; Kentala-Lehtonen, J.; Korhonen-Kurki, K.; Pietikäinen, J.; Saikku, L.; Schösler, H. Transition towards Circular Economy in the Food System. Sustainability 2016, 8, 69. [Google Scholar] [CrossRef]
  26. Rincón, L.E.; Valencia, M.J.; Hernández, V.; Matallana, L.G.; Cardona, C.A. Optimization of the Colombian biodiesel supply chain from oil palm crop based on techno-economical and environmental criteria. Energy Econ. 2015, 47, 154–167. [Google Scholar] [CrossRef]
  27. Abdulrazik, A.; Elsholkami, M.; Elkamel, A.; Simon, L. Multi-products productions from Malaysian oil palm empty fruit bunch (EFB): Analyzing economic potentials from the optimal biomass supply chain. J. Clean. Prod. 2017, 168, 131–148. [Google Scholar] [CrossRef]
  28. Harahap, F.; Leduc, S.; Mesfun, S.; Khatiwada, D.; Kraxner, F.; Silveira, S. Opportunities to Optimize the Palm Oil Supply Chain in Sumatra, Indonesia. Energies 2019, 12, 420. [Google Scholar] [CrossRef]
  29. Memari, A.; Ahmad, R.; Abdul Rahim, A.R.; Akbari Jokar, M.R. An optimization study of a palm oil-based regional bio-energy supply chain under carbon pricing and trading policies. Clean Technol. Environ. Policy 2018, 20, 113–125. [Google Scholar] [CrossRef]
  30. Tapia, J.F.D.; Samsatli, S. Integrating fuzzy analytic hierarchy process into a multi-objective optimisation model for planning sustainable oil palm value chains. Food Bioprod. Process. 2020, 119, 48–74. [Google Scholar] [CrossRef]
  31. Yeo, J.Y.; How, B.S.; Teng, S.Y.; Leong, W.D.; Ng, W.P.; Lim, C.H.; Ngan, S.L.; Sunarso, J.; Lam, H.L. Synthesis of Sustainable Circular Economy in Palm Oil Industry Using Graph-Theoretic Method. Sustainability 2020, 12, 8081. [Google Scholar] [CrossRef]
  32. Indonesian Bureau Statistics of Riau Province. Riau Province in Figures 2024; BPS Riau Province: Pekanbaru, Indonesia, 2024. Available online: https://riau.bps.go.id/publication/2024/02/28/b7f5ed69ddf689a2e23f46207/provinsi-riau-dalam-angka-2024.html (accessed on 15 March 2025).
  33. Phuang, Z.X.; Lin, Z.; Liew, P.Y.; Hanafiah, M.M.; Woon, K.S. The dilemma in energy transition in Malaysia: A comparative life cycle assessment of large scale solar and biodiesel production from palm oil. J. Clean. Prod. 2022, 350, 131475. [Google Scholar] [CrossRef]
  34. Wahyono, Y.; Hadiyanto, H.; Budihardjo, M.A.; Adiansyah, J.S. Assessing the Environmental Performance of Palm Oil Biodiesel Production in Indonesia: A Life Cycle Assessment Approach. Energies 2020, 13, 3248. [Google Scholar] [CrossRef]
  35. Tshikovhi, A.; Motaung, T.E. Technologies and Innovations for Biomass Energy Production. Sustainability 2023, 15, 12121. [Google Scholar] [CrossRef]
  36. Shahbaz, M.; AlNouss, A.; Ghiat, I.; McKay, G.; Mackey, H.; Elkhalifa, S.; Al-Ansari, T. A comprehensive review of biomass based thermochemical conversion technologies integrated with CO2 capture and utilisation within BECCS networks. Resour. Conserv. Recycl. 2021, 173, 105734. [Google Scholar] [CrossRef]
  37. Lo, S.L.Y.; How, B.S.; Teng, S.Y.; Lam, H.L.; Lim, C.H.; Rhamdhani, M.A.; Sunarso, J. Stochastic techno-economic evaluation model for biomass supply chain: A biomass gasification case study with supply chain uncertainties. Renew. Sustain. Energy Rev. 2021, 152, 111644. [Google Scholar] [CrossRef]
  38. Yang, Y.; Yuan, G.; Zhuang, Q.; Tian, G. Multi-objective low-carbon disassembly line balancing for agricultural machinery using MDFOA and fuzzy AHP. J. Clean. Prod. 2019, 233, 1465–1474. [Google Scholar] [CrossRef]
  39. Bui, T.-D.; Tseng, J.-W.; Tsai, F.M.; Ali, M.H.; Lim, M.K.; Tseng, M.-L. Energy security challenges and opportunities in the carbon neutrality context: A hierarchical model through systematic data-driven analysis. Renew. Sustain. Energy Rev. 2023, 187, 113710. [Google Scholar] [CrossRef]
  40. Wang, Y.; Lou, R.; Qi, Z.; Madramootoo, C.A.; He, Y.; Jiang, Q. Optimization strategies for carbon neutrality in a maize-soybean rotation production system from farm to gate. Sustain. Prod. Consum. 2024, 50, 302–313. [Google Scholar] [CrossRef]
  41. Bui, T.-D.; Ha, H.M.; Tran, T.P.T.; Lim, M.K.; Chiu, A.S.F.; Tseng, M.-L. Total resource management model towards carbon neutrality in Vietnam construction industry: A hierarchical framework. Resour. Conserv. Recycl. 2024, 201, 107338. [Google Scholar] [CrossRef]
  42. Stichnothe, H.; Schuchardt, F. Life cycle assessment of two palm oil production systems. Biomass Bioenergy 2011, 35, 3976–3984. [Google Scholar] [CrossRef]
  43. Ibrahim, H.A.; Zaidan, A.A.; Qahtan, S.; Zaidan, B.B. Sustainability assessment of palm oil industry 4.0 technologies in a circular economy applications based on interval-valued Pythagorean fuzzy rough set-FWZIC and EDAS methods. Appl. Soft Comput. 2023, 136, 110073. [Google Scholar] [CrossRef]
  44. Anyaoha, K.E.; Zhang, D.L. Transition from fossil-fuel to renewable-energy-based smallholder bioeconomy: Techno-economic analyses of two oil palm production systems. Chem. Eng. J. Adv. 2022, 10, 100270. [Google Scholar] [CrossRef]
  45. Abdul-Hamid, A.-Q.; Ali, M.H.; Tseng, M.L.; Lan, S.; Kumar, M. Impeding Challenges on Industry 4.0 in Circular Economy: Palm Oil Industry in Malaysia. Comput. Oper. Res. 2020, 123, 105052. [Google Scholar] [CrossRef]
Figure 1. Research framework.
Energies 18 02947 g001
Figure 2. Block flow diagram of palm oil processing.
Energies 18 02947 g002
Figure 3. Output generation for scenarios.
Energies 18 02947 g003
Figure 4. Comparison of profit and emissions across scenarios.
Energies 18 02947 g004
Table 1. Previous studies related to WtE in the palm oil industry.
AuthorsWaste TypeTechnology Consideration *OutputOptimization ModelMathematical ModelingCountry
EFBFiberPKSPOMEAdInCmPyGsElFtSingleMultiple
Rincón, et al. [26]------- ---MNLPColombia
James, et al. [18]---- --LPMalaysia
Abdulrazik, et al. [27]----- --LPMalaysia
Harahap, et al. [28]- -LPIndonesia
Memari, et al. [29]----- -MILPMalaysia
González, et al. [4]------ --LPColombia
Tapia and Samsatli [30]---- --MILPMalaysia
Andiappan, Tan and Ng [22]-- ---LPMalaysia
Foong, et al. [12]- --LPMalaysia
Yeo, et al. [31] ---Malaysia
This study-MILPIndonesia
Notes: Ad: anaerobic digestion, In: incineration, Cm: composting, Py: pyrolysis, Gs: Gasification, El: electricity, Ft: fertilizer, *: technology considered for processing palm oil waste into by-products.
Table 2. The input of technology.
TechnologyEFBFiberPKSPOMEBy-Products
Anaerobic Digestion---Electricity
Composting--Fertilizer
Gasification---Electricity
Incineration-Electricity
Pyrolysis-Electricity
Table 3. Definitions and data location of symbols in the optimization model.
IndicesDefinitions
Sets
Itype of waste i
Jprocessing technologies j
Poutput by-products p
Zdemand zones
Ttime period t
Parameters
A i availability of waste i
n i j the conversion efficiency of waste i into product via technology j
c i j operational and investment cost for processing waste i using technology j
e i j emissions (tons CO2) per ton of waste i processed using technology j
r j p ratio of output product p generated by technology j
v p economic value of product p (in USD/unit)
α p energy output of product p (in kWh/unit)
d p z t maximum demand for product p in zone z
Decision variables
x i j amount of waste i processed by technology j (in tons)
y p t quantity of product p generated
Table 4. The biomass waste available for each POM in the Indragiri Hulu region [32].
EFB (t/year)Fiber (t/year)PKS (t/year)POME (m3/year)
Total174,492143,30156,055736,152
Table 5. Conversion factor for all feed to products on an output-to-input basis [20,21,24].
WasteTechnologyProductConversion Ratio
(Product/Waste)
Emission
(tCO2-eq/t)
EFBCompostingFertilizer0.33 t/t0.29
EFBGasificationElectricity2995 kWh/t0.25
EFBIncinerationElectricity70 kWh/t0.15
EFBPyrolysisElectricity150 kWh/t0.2
FiberCompostingFertilizer0.33 t/t0.26
FiberIncinerationElectricity70 kWh/t0.12
FiberPyrolysisElectricity150 kWh/t0.17
PKSIncinerationElectricity90 kWh/t0.05
PKSPyrolysisElectricity150 kWh/t0.08
POMEADElectricity133 kWh/t0.755
Table 6. Total profit and emissions for the MP scenario.
Waste → TechnologyWaste Allocation (t)Profit (USD k)Emissions (tCO2e/t)
EFB → Gasification174,492125,59112,214
Fiber → Incineration143,30151,90512,897
PKS → Incineration56,05518,5024484
POME → AD736,15228,46722,085
Total1,110,000224,46551,680
Table 7. Total profit and waste allocation for the MPCT scenario.
Waste → TechnologyWaste Allocation (t)Profit (USD k)Emissions (tCO2e/t)
Fiber → Incineration143,30119,32122,928
EFB → Incineration15,4929152479
EFB → Composting45,0005469450
EFB → Gasification114,00027,4934560
PKS → Incineration56,05561518969
Total373,84859,34939,386
Table 8. Total profit and waste allocation for the AWP scenario.
Waste → TechnologyWaste Allocation (t)Profit (USD k)Emissions (tCO2e/t)
Fiber → Incineration143,30119,36722,928
EFB → Incineration15,4929202479
EFB → Composting45,0005470450
EFB → Gasification114,00027,5034560
POME → AD736,152(11,212)59,628
PKS → Incineration56,05561698969
Total1,110,00048,21799,014
Table 9. Impact of electricity selling price on profit and emissions outcomes.
Electricity Price (USD/kWh)Profit (USD k)Emissions (tCO2e)Electricity (GWh)Fertilizer (t)
0.05043,58329,16046135,825
0.07568,71456,8496360
0.085143,22551,6808120
0.095224,46546,5128120
0.105305,70641,3448120
0.115386,94629,1608120
Table 10. Impact of fertilizer selling price on profit and emissions outcomes.
Fertilizer Price (USD/ton)Profit (USD k)Emissions (tCO2e)Electricity (GWh)Fertilizer (t)
400224,46551,6808120
500224,46551,6808120
535224,46551,6808120
1070218,85449,43075711,250
1605225,76144,51563735,825
2140244,92744,51563735,825
Table 11. Impact of carbon tax rate on profit and emissions outcomes.
Carbon Tax (USD/t)Profit (USD k)Emissions (tCO2e)Electricity (GWh)Fertilizer (t)
059,42839,38651235,825
259,34939,38650835,728
458,33036,62949635,436
657,23133,87247435,242
856,14431,11545135,047
1054,50628,35843134,853
Table 12. Impact of technological efficiency on profit and emissions outcomes.
Efficiency (%)Profit (USD k)Emissions (tCO2e)Electricity (GWh)Fertilizer (t)
−20%167,59745,5416500
−10%196,03148,6237310
0%224,46551,6808120
10%252,90054,9288940
20%281,33458,3219750
Disclaimer/Publisher’s Note: The statements, opinions and data contained in all publications are solely those of the individual author(s) and contributor(s) and not of MDPI and/or the editor(s). MDPI and/or the editor(s) disclaim responsibility for any injury to people or property resulting from any ideas, methods, instructions or products referred to in the content.

